Quantcast
Channel: Newgeography.com - Economic, demographic, and political commentary about places
Viewing all 3792 articles
Browse latest View live

All Houston Does (Economically) is Win

$
0
0

Like most big cities that get the nod, Houston has spruced itself up for the Super Bowl, planting flowers and concentrating in particular on the rough stretches between Hobby Airport and NRG Stadium. Yet it’s unlikely the city’s reputation will be much enhanced by the traveling media circus that accompanies these games.

The last time the city hosted the Super Bowl, in 2004, the Washington Post called it “super ugly.” The website Thrillist recently named Houston “the worst designed city” in America, with the usual kind comments about porn shops near offices, lack of walking districts, fat people and awful traffic. For good measure, 24/7 Wall Street named it among the 25 worst cities in America.

Casting shade on Houston is nothing new. In his best-selling 1946 travelogue Inside U.S.A., the journalist John Gunther described Houston as having “a residential section mostly ugly and barren, without a single good restaurant and hotels with cockroaches.” The only reasons to live in Houston, he claimed, were economic ones; it was a city “where few people think about anything but money.”

Gunther clearly did not see a great future for the place, predicting that it would have only a million people by now. In fact, the Houston metropolitan area’s population now stands at 6.6 million with the city itself a shade under 2.3 million. At its current rate of growth, Houston could replace Chicago as the nation’s third-largest city by 2030.

Why would anyone move to Houston? Start with the economic record.

Since 2000, no major metro region in America except for archrival Dallas-Fort Worth has created more jobs and attracted more people. Houston’s job base has expanded 36.5%; in comparison, New York employment is up 16.6%, the Bay Area 11.8%, and Chicago a measly 5.1%. Since 2010 alone, a half million jobs have been added.

Some like Paul Krugman have dismissed Texas’ economic expansion, much of it concentrated in its largest cities, as primarily involving low-wage jobs, but employment in the Houston area’s professional and service sector, the largest source of high-wage jobs, has grown 48% since 2000, a rate almost twice that of the San Francisco region, two and half times that of New York or Chicago, and more than four times Los Angeles. In terms of STEM jobs the Bay Area has done slightly better, but Houston, with 22% job growth in STEM fields since 2001, has easily surpassed New York (2%), Los Angeles (flat) and Chicago (-3%).

More important still, Houston, like other Texas cities, has done well in creating middle-class jobs, those paying between 80% and 200% of the median wage. Since 2001 Houston has boosted its middle-class employment by 26% compared to a 6% expansion nationally, according to the forecasting firm EMSI. This easily surpasses the record for all the cities preferred by our media and financial hegemons, including Washington (11%) and San Francisco (6%), and it’s far ahead of Los Angeles (4%), New York (3%) and Chicago, which lost 3% of its middle-class employment.

Voting With Their Feet

Urbanistas may revile Houston but the metro area’s population has grown more than any other U.S. metropolis in the new millennium, up by 1.2 million between 2000 and 2010. The most recent figures show Houston’s population expanded 159,000 between 2014 and 2015, the most of any U.S. metro area.

Much of this is a result of people moving from elsewhere, roughly 500,000 net since 2000. In comparison, New York, Los Angeles, Chicago and even the Bay Area have suffered considerable migration losses.

It may be popular to suppose the new Texans are just a bunch of losers looking for cheap rent and low taxes. But the recent rate of increase in the population of educated 25- to 34-year-old educated people in Houston tops that of the San Jose area, and easily exceeds that of competitors like New York, Los Angeles and Boston. Houston has been getting not only bigger but also smarter.

Like domestic migrants, foreigners like the idea of jobs, particularly decent paying ones. Since 2000 Houston’s foreign-born population has grown 60%, roughly three times the expansion in New York, San Jose and San Francisco, and more than five times that of Los Angeles or Chicago. In the last decennial Census, Houston ranked second, just behind New York, in total numbers of new foreign-born residents.

So, what’s the appeal? Even the most civically minded Houstonians will admit it’s not the weather — particularly the humid, brutal summers — or the topography, which makes a plate seem mountainous. More critical is housing prices. Per demographer Wendell Cox, housing prices in Houston, adjusted for income, are roughly one-third those of coastal California and half those in places like metropolitan New York, Boston and Seattle.

Houston simply offers a more congenial setting for upward mobility than its more celebrated rivals. The National Association of Home Builders/Wells Fargo Bank Housing Affordability Index finds more than 60% of homes in the Houston metro area are affordable for median-income families, compared with only 15% in Los Angeles, once ground zero for the dream of aspirational homeownership. Overall, when incomes and costs are weighed, Houston ranks at or near the top of places where paychecks stretch the farthest.

Life After Oil

Some have predicted that with the fall in oil prices, Houston would experience a sharp decline, repeating the disastrous experience of the early 1980s. The energy sector has lost some 67,000 jobs but the economy has not collapsed. Patrick Jankowski, chief economist for the Greater Houston Partnership, notes that, unlike the early 1980s, overall employment has not declined. To be sure last year’s gains — some 15,000 net jobs — are meager compared to the remarkable 120,000 increase experienced in 2014. This year Jankowski predicts better, but hardly robust growth of nearly 30,000 jobs.

Though some sectors of the real estate market are clearly overbuilt, notably luxury housing and high end office space, construction remains buoyant, particularly in the lower end of the single family market. David Wolff, one of the area’s largest land developers and former head of the transit agency, Metro, lived through the 1980s crash and frankly expected a harder landing this time. “It’s like being in the middle of a gun battle, and picking yourself up from the floor and being amazed you don’t have a bullet hole,” Wolff says.

The change in administrations has also boosted confidence. “It is nice to have a president who doesn’t hate your major industry, “Wolff quips. He and others also point to the port, which is booming, the massive and expanding Texas Medical Center and anti-business practices in blue states, such as New York and California, as contributing to the region’s increasing economic diversity.

Andrew Segal, head of Boxer Properties, one of the city’s leading owners of Class B real estate, sees little decline in either rents or demand for his buildings. Energy may never regain the prominence it once had, he argues, but other sectors have emerged, and the city itself has greatly enhanced its urban amenities, parks, and educational offerings. “It’s getting more diversified like Dallas and cooler like Austin. The ’80s simply did not come back.”

The Secret Sauce

My Center for Opportunity Urbanism colleague Anne Snyder suggests Houston’s resiliency stems largely from its culture of openness. One of the most diverse metro areas in the country, Houston long has been accessible for newcomers of all kinds. In contrast to more hierarchical, the planning-oriented regimes elsewhere, she writes, “ creative friction – unchaperoned and prescribed – is Houston’s secret sauce."

Low prices and vast landscapes, she notes, allow space for minorities to set up businesses, buy houses, open a dizzying array of shops and restaurants. Houston’s much-maligned strip malls, notes architect Tim Cisneros, are the “immigrant’s friend,” allowing for small businesses to start with lower rents and easy parking.
Not all Houstonians like the way the place works. Local intellectuals and some in the media have been pushing for the Bayou City to renounce its no-zoning policies and embrace the top-down “smart growth” approach that dominate places like California, Oregon and many areas of the Northeast.

And to be certain, there are trade-offs. Although there are some promising walkable districts — both in the city and in some of the planned developments on the periphery — most Houstonians rely on their cars to get around, shop and eat at strip malls. And to be sure, entrenched poverty, inequality and inadequate schools remain all too common, but minorities, at least, are far more likely to own a house there than in more regulated places like New York, Los Angeles or Boston.

Houstonians also show their optimism by making the ultimate bet on the future: children. Per the American Community Survey’s Houston ranks in the top five cities for elementary-age school children per family among the 53 major metropolitan areas, well ahead of places like Chicago, Los Angeles, New York, and San Francisco, which placed 45th.

Jobs, housing, diversity, and the movement of families have driven Houston’s success. An upbeat attitude, and openness to outsiders, has made Houston a super city, Super Bowl or not.

Joel Kotkin is executive editor of NewGeography.com. He is the Roger Hobbs Distinguished Fellow in Urban Studies at Chapman University and executive director of the Houston-based Center for Opportunity Urbanism. His newest book, The Human City: Urbanism for the rest of us, was published in April by Agate. He is also author of The New Class ConflictThe City: A Global History, and The Next Hundred Million: America in 2050. He lives in Orange County, CA.

Photo: Hequals2henry [CC BY-SA 3.0], via Wikimedia Commons

The High Cost of a Home Is Turning American Millennials Into the New Serfs

$
0
0

American greatness was long premised on the common assumption that each generation would do better than the previous one. That is being undermined for the emerging millennial generation.

The problems facing millennials include an economy where job growthhas been largely in service and part-time employment, producing lower incomes; the Census bureau estimates they earn, even with a full-time job, $2,000 less in real dollars than the same age group made in 1980. More millennials, notes a recent White House report, face far longer periods of unemployment and suffer low rates of labor participation. More than 20 percent of people 18 to 34 live in poverty, up from 14 percent in 1980.

They are also saddled with ever more college debt, with around half of students borrowing for their education during the 2013-14 school year, up from around 30 percent in the mid-1990s. All this at a time when the returns on education seem to be dropping: A millennial with both a college degree and college debt, according to a recent analysis of Federal Reserve data, earns about the same as a boomer without a degree did at the same age.

Downward mobility, for now at least, is increasingly rife. Stanford economist Raj Chatty finds that someone born in 1940 had a 92 percent chance of earning more than their parents; a boomer born in 1950 had a 79 percent chance of earning more than their parents. Those born in 1980, in contrast, have just a 46 percent chance.

Since 2004, homeownership rates for people under 35 have dropped by 21 percent, easily outpacing the 15 percent fall among those 35 to 44; the boomers’ rate remained largely unchanged.

In some markets, high rents and weak millennial incomesmake it all but impossible to raise a down payment (PDF). According to Zillow, for workers between 22 and 34, rent costs now claim upward of 45 percent of income in Los Angeles, San Francisco, New York, and Miami, compared to less than 30 percent of income in metropolitan areas like Dallas-Fort Worth and Houston. The costs of purchasing a house are even more lopsided: In Los Angeles and the Bay Area, a monthly mortgage takes, on average, close to 40 percent of income, compared to 15 percent nationally.

Like medieval serfs in pre-industrial Europe, America’s new generation, particularly in its alpha cities, seems increasingly destined to spend their lives paying off their overlords, and having little to show for it.

Rather than strike out on their own, many millennials are simply failing to launch, with record numbers hunkering down in their parents’ homes. Since 2000, the numbers of people aged 18 to 34 living at home has shot up by over 5 million.

One common meme, particularly in the mainstream media, has been that millennials don’t want to buy homes. The new generation, as Fast Companybreathlessly reported, is part of “an evolution of consciousness.” Other suggest the young have embraced “the sharing economy,” so that owning a home is simply not to their taste. The well-named site Elite Dailyasserts that the vast majority of millennials are headed to “frenetic metropolis” rather than becalmed suburbs.

And it’s not just ideologues claiming millennials have evolved out of home ownership. Wall Street speculators like Blackstone are betting that the young are committed to some new “rentership society,” with that firm investing $10 billion to scoop up existing small homes to rent, and even building tracks of homes exclusively for rent.

It’s not a lifestyle choice, but economics—high prices and low incomesthat are keeping millennials from buying homes. In survey after survey the clear majority of millennials—roughly 80 percent, including the vast majority of renters—express interest in acquiring a home of their own. Nor are they allergic, as many suggest, to the idea of raising a family, albeit often at a later age, long a major motivation for home ownership. Roughly 80 percent of millennials say they plan to get married, and most of them are planning to have children.

Overall, more than 80 percent of millennials already live in suburbs and exurbs, and they are, if anything, moving away from the dense, expensive cities. Since 2010 millennial population trends rank New York, Chicago, Washington, and Portland in the bottom half of major metropolitan areas while the young head out to less expensive, highly suburbanized areas such as Orlando, Austin, and San Antonio.

Age will accelerate this process. Economist Jed Kolko notes as people enter their thirties they tend to head out of core cities to suburban locations; roughly one in four people in their mid to late twenties lives in an urban location but by the time those people are in their early thirties, that number drops precipitously and continues dropping into their eighties. In fact, younger millennials, notes the website FiveThirtyEight, are moving to the ’burbs at at a faster clip than previous generations. What’s slowing that trend is economics. Many can’t afford to move or transition to a traditional adulthood.

The millennial housing crisis is reshaping the geography of opportunity. Although millennial rates of homeownership have dropped nationwide, the most precipitous declines have been in such metropolitan areas as New York, Miami, San Francisco, Portland, Seattle, and Los Angeles. In all these areas, public policy has regulatory barriers in the way of suburban and exurban affordability. It is in these markets where such things as “tiny houses” and “micro-apartments”—not exactly a boon to people looking to start families—are being touted as solutions to housing shortages.

Nowhere is this dynamic more evident than in California, where the state government has all but declared war on single-family homes by banning new peripheral development, driving up house prices throughout metropolitan areas. Regulatory fees typically add upward of $50,000, two-and-a-half times the national average; new demands for “zero emissions” homes promise to boost this by an additional $25,000.

Due largely to such regulatory restraints, overall California housing construction over the past 10 years has been less than half of that it averaged from 195 to 1989, forcing prices up, particularly on single-family houses. The state ranks second to the last in middle-income housing affordability, trailing only Hawaii. It also accounts for 14 of the nation’s 25 least affordable metropolitan areas.

Home ownership rates in California are among the nation’s lowest, with Los Angeles-Orange having the lowest rate of the nation’s 75 large metropolitan areas. For every two homebuyers who come to the state, five families leave, notes the research firm Core Logic.

The irony is that the state’s progressive policies are contributing to a less mobile society and a potential demographic crisis. For one thing, fewer young people can form families—Los Angeles-Orange had one of the biggest drops in the child population of any of the 53 largest metros from 2010 to 2015.

This also has a racial component, as homeownership rates African American and Latino households—which often lack access to family wealth—have dropped far more precipitously than those of non-Hispanic Whites or Asians. Hispanics, accounting for 42 percent of all California millennials, endure homeownership roughly half that seen in other parts of the country.

This is not the planners’ happy future of density dwelling, transit-riding millennials but a present of overcrowding, the nation’s highest level of poverty and, inevitably, a continued drop in fertility in comparison to less regulated, and less costly, states such as Utah, Texas, and Tennessee that have been among those with the biggest surges in millennial migration.

Once identified with youth, California’s urban areas are now experiencing a significant decline in both their millennial and Xer populations. By the 2030s, large swaths of the state—particularly along the coast—could become geriatric belts, with an affluent older boomer population served by a largely minority servant class. How feudal!

Ownership of land has always  been a critical component of middle-class wealth and power. Those celebrating the retreat from homeownership among millennials are embracing the long-term decline of that middle class, two thirds of whose wealth is in their homes.

The potential decline in ownership also represents a direct assault on future American prosperity. Jason Furman, who served as chairman of President Obama’s Council of Economic Advisors, calculated that a single-family home contributes 2.5 times as much to the national GDP as an apartment unit. Investment in residential properties has dropped to its lowest share of overall spending since World War II; by some estimates reviving that would be enough to return America to 4 percent growth.

With so many millenials unable to afford homes, or even to see a path to future ownership, household formation has been far slower than in the recent past. Rather than a surge of middle-class buyers, we are seeing the rise of a largely property-less generation whose members will remain economically marginal into their thirties or forties. Indeed by 2030, according to a recent Deloitte study, millennials will account for barely 16 percent of the nation’s wealth while home-owning boomers, then entering their eighties and nineties, will still control a remarkable 45 percent of the nation’s wealth.

If this continues, we may have to all but abandon the notion of the United States as a middle-class nation. Instead of having a new generation that strikes out on their own, we may be incubating a culture that focuses on such things as the latest iPhone, binge watching on Netflix, something they do far more than even their Xer counterparts.

Progressives who embrace these developments are abandoning one of the central tenets of mainstream liberalism. In the past, many traditional liberals embraced the old American ideal of dispersed land ownership. “A nation of homeowners,” President Franklin D. Roosevelt believed, “of people who own a real share in their land, is unconquerable.” Homeownership is not only critical to the economy but provides a critical element of our already fraying civic society; homeowners not only tend to vote more than renters, but they also volunteer more and, as Habitat for Humanity suggests, provide a better environment for raising children.

On the flip side, high housing prices tend to suppress birthrates. Many of the places with the highest house costs—from Hong Kong to New York, Los Angeles, Boston, and San Francisco—also have very low birthrates. The four U.S. areas ranked among the bottom 10 in birthrates among the 53 major metropolitan areas in 2015. Over time these can have a dampening impact on economic growth, as is clearly seen today in places like Japan and much of Europe, and increasingly here in the U.S.

It’s time for millennials to demand politicians abandon the policies that have enriched the wealthy and stolen their future. That means removing barriers to lots of new housing in cities and, crucially, embracing Frank Lloyd Wright’s notion of Broadacre Cities, with expansive development along the periphery.

These new suburbs, like the Levittowns of the past, could improve people’s lives, while using new technology and home-based work  to make them more environmentally sustainable. They could, as some suggest, develop the kind of urban amenities, notably town centers, that may be more important to millennials than earlier generations. One thing that hasn’t changed is the demand for affordable single-family homes and townhomes. But the supply is diminishing—those under $200,000 make up barely one out of five new homes.

There are some reasons for hope. The soon-to-develop tsunami of redundant retail space will open up millions of square feet for new homes. A move to prefabricated homes, already common in Europe and Japan, could help reduce costs. Certainly there’s potential demand at the right price—ones that young people can reasonably aspire to and then build lives in.

The alternative is to travel back to serfdom and a society sharply divided between a small owner class and many more permanent rent payers. By then, the American dream will be reduced to a nostalgic throwback in an increasingly feudalized country.

This piece first appeared in The Daily Beast.

Joel Kotkin is executive editor of NewGeography.com. He is the Roger Hobbs Distinguished Fellow in Urban Studies at Chapman University and executive director of the Houston-based Center for Opportunity Urbanism. His newest book, The Human City: Urbanism for the rest of us, was published in April by Agate. He is also author of The New Class ConflictThe City: A Global History, and The Next Hundred Million: America in 2050. He lives in Orange County, CA.

What the U.S. Thinks About Immigration - and Why it Should Matter When We Attempt Reform

$
0
0

Americans agree that the country’s policies on handling immigration have long needed reform. However, what kinds of reform and the impact immigration itself has on the United States are matters of great controversy. For both former Presidents Barack Obama and George W. Bush, promising efforts at comprehensive immigration reform were blocked by the unrelenting opposition.

As Obama's second term began it seemed that the time for successful comprehensive immigration reform had arrived, especially when the Senate passed its major reform bill in June 2013. However, with the Republican-controlled House refusing to give it consideration, the bill died when the congressional session ended the next year. With both chambers in Republican hands after the November 2014 elections, any executive reforms needing congressional approval were doomed.

Consequently, President Obama acted unilaterally on immigration, contending that he had the requisite authority to do so. He announced a new policy, the Deferred Action of for Parents of Americans, which deferred deportation of individuals who met the new guidelines. Although this executive action was very popular with Democrats and Hispanics, it was opposed by a slight national majority in the first surveys after its announcement.

When asked the question of whether they approve or disapprove of the way Obama is handling immigration, 51% of the total population and 85% of Republicans disapproved. The question was asked at more than three dozen points between April 2015 and October 2016.

More so than any of the other Republican candidates, Donald Trump seized on the issue of immigration with his strong, restrictionist positions which resonated with primary voters. For example, in the crucial South Carolina primary, the Trump vote was 14 percent higher among those who agreed that all illegal immigrants should be deported than his overall vote in the state (which was 33 percent). For the 27 states with exit polls (and a few entrance polls for caucus states), Trump's advantage among voters agreeing with the deportation of illegal immigrants was 13 percent; for a ban on all Muslim immigration it was 9 percent. By comparison, on his best performing economic question his advantage was only 4 percent.

One of President Trump’s most defining issues has been his promise to build a wall across the entire U.S. Mexican border. This position proved very popular with his supporters, 87 percent of those who voted for him in the Republican primaries were in agreement. This was 31% higher than the average for Republicans supporting other candidates.

However, when we turn to the overall population, support for Trump’s position drops substantially. Looking at numerous surveys going back to September 2015, general popular support for the wall has been consistently below 50%, often substantially so, and with that support falling as the country moved into the general election period.

Until recently, the two major political parties have been evenly matched when it comes to which is more trusted to handle the immigration issue. However, last year, a small advantage opened for the Democrats. When asked on seven different occasions between March and September 2016 which candidate they most trusted to handle immigration issues, Hillary Clinton was preferred over Donald Trump each time by a median margin of 8%. In 2012, in contrast, Mitt Romney had a slim median advantage of 1% over Barack Obama.

Nonetheless, since Republicans retained control of Congress in the 2016 elections, President Trump should find a strong base of legislative support for his immigration initiatives. This should be especially true in the House of Representatives for restrictionist sentiment prevails in the states with the largest Republican delegations.

However, when we move from Republicans to the overall population a different story emerges which may complicate action in the Senate where the filibuster gives Democrats important leverage. For some years, the public has been moving toward the expansionist position on immigration-related issues (although notably still preferring a decrease in overall immigration levels). Support for a path to citizenship for illegal immigrants already in the country has been growing and for the past four years it has commanded a slight majority. Despite his best efforts, President Trump has failed in moving the majority of Americans towards his position on this issue.

President Trump should be able to redirect national immigration policy where he can take unilateral executive action, but not without substantial opposition. The executive order he issued at the end of his first week, banning travel from seven Muslim-majority countries, has sparked protests around the country, raised many legal questions, and prompted international outcry. Trump could very well be stymied, just as his successors were, when it comes to major changes requiring congressional approval.

Personally, I favor a comprehensive package of reforms that lean in the permissive direction. However, I have some sympathy for those who favor greater immigration restrictions. In my years of studying immigration policy I have taken notice of the gap between what the public says it wants concerning immigration and what it has received instead from public policy. This has been especially true on questions related to illegal immigration, which there has been long-standing, deep, and wide opposition.

This is not healthy in a democracy. Immigration expansionists have failed to meaningfully address the concerns of pluralities and even majorities of citizens consistently registered in surveys of public opinion. When there is an unwillingness to listen, a restrictionist grassroots backlash should not be a surprise.

Regardless of one’s preferences on this issue, I believe that we all need to do a better job of paying attention to what the American public says and wants. Until we do, it is likely we will continue to be frustrated by policy stalemate.

Charles D. Brockett has a PhD in political science and several decades' experience teaching about immigration in courses both on U.S. and Latin American politics. A professor emeritus at Sewanee: The University of the South, he has written What the U.S. Public Thinks about Immigration—and Why It Should Matter When We Attempt Reform: The Trump Years (Kindle edition) as well as two well-received books on Central America and is the co-editor of two collections concerning immigration and citizenship in the United States—Complex Allegiances: Constellations of Immigration, Citizenship & Belonging and Shifting Balance Sheets: Women's Stories of Naturalized Citizenship & Cultural Attachment, both published by Wising Up Press.

Photo: lcars via Flickr Creative Commons

Focusing on Mobility Not Travel Mode for Better Economic Growth

$
0
0

The last article outlined research on job access by cars, transit and walking by the University of Minnesota Accessibility Observatory that assesses mobility by car, transit and walking in 49 of the nation’s largest metropolitan areas. Of course, it is to be expected that the metropolitan areas will have the largest number of jobs accessible to the average employee simply by virtue of their larger labor markets.

Indeed, smaller, but important major labor markets, from Grand Rapids and Buffalo to Philadelphia and Washington seem unlikely to ever rival the job numbers in metropolitan areas like New York and Los Angeles.

Researchers such as Remy Prud’homme and Chang-Woon Lee of the University of Paris, David Hartgen and M. Gregory Fields of the University of North Carolina, Charlotte have shown that a city (metropolitan area( is likely to experience better economic results if its transportation system provides better mobility. This includes greater job creation, greater economic growth and poverty reduction.

Virtually any metropolitan area will do well to focus on maximizing mobility. This article describes the percentage of jobs in each of the 49 metropolitan areas that can be reached by the average employee in 30 minutes, a time slightly longer than the US one-way work trip average travel time of 26.4 minutes.

Accessibility by Auto

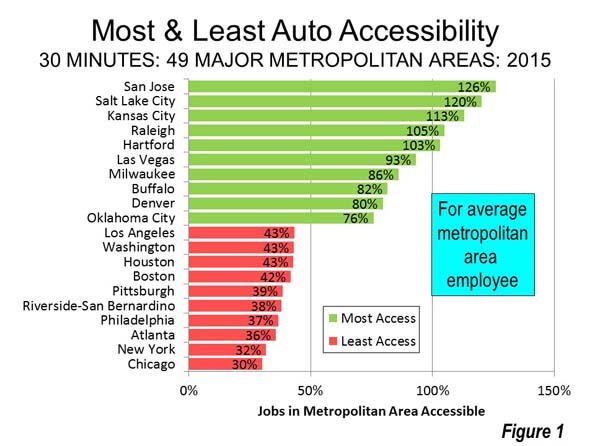
The leading metropolitan area in auto accessibility include is San Jose . Despite its reputation as an ultra-green area, 90 percent of San Jose commuters who do not work at home use cars to get to work. San Jose does warrant accolades for its 4.7 percent work at home share, the most environmentally friendly mode of work access. Transit has a 4.1 percent share. More than 100 percent of the metropolitan area’s jobs can be reached in 30 minutes, largely because the San Francisco metropolitan area is virtually across the street, providing additional employment opportunities.

The balance of the top 10 is smaller, metropolitan areas, Salt Lake City, Kansas City, Raleigh and Hartford, where the average employee can reach jobs equaling more than 100 percent of the metropolitan total in 30 minutes. The second five include Las Vegas, Milwaukee, Buffalo, Denver and Oklahoma City. All but three of the 10 cities with best access has urban densities that are lower than the major metropolitan average.

The least automobile accessibility is in larger metropolitan areas, where there is generally much greater traffic congestion. New York and Chicago have the lowest levels of 30 minute accessibility, followed by Atlanta, higher than would be expected, in large measure because of its sub-standard arterial street system, which in other cities provides effective alternatives to freeways (Figure 1).

Transit

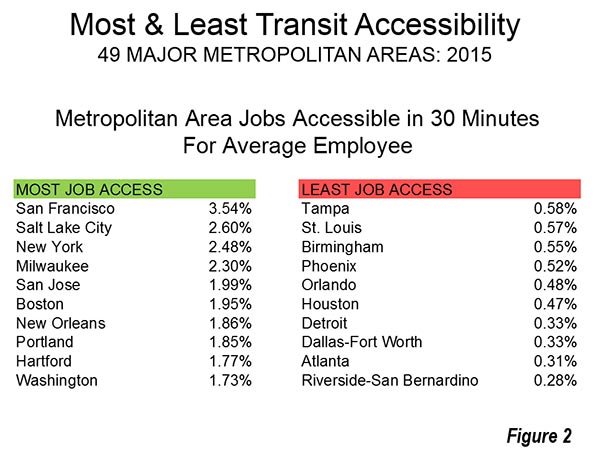
Employees can reach the greatest share of metropolitan area jobs by transit in San Francisco (3.54 percent), Salt Lake City (2.60 percent), New York (2.48 percent), Milwaukee (2.30 percent) and San Jose (1.99 percent). The second five includes three cities with strong legacies of transit such as Boston, Portland and Washington, along with New Orleans and Hartford.

The least transit access is in Orlando, Houston, Detroit, Dallas-Fort Worth, Atlanta and Riverside-San Bernardino, all below 0.50 percent (Figure 2).

Walking

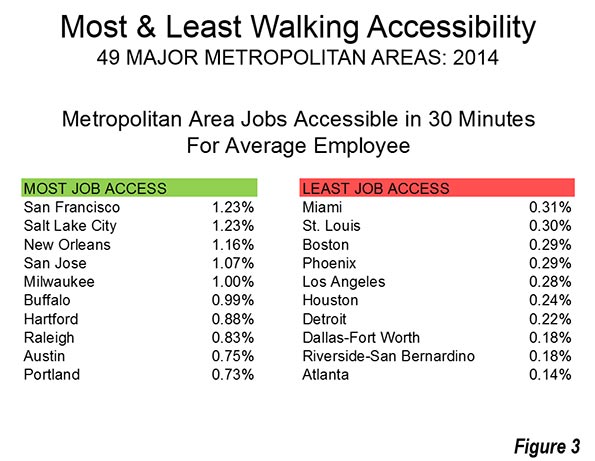
Walking can get the average employee to the greatest share of metropolitan jobs in 30 minutes in San Francisco (1.23 percent), Salt Lake City (1.23 percent), New Orleans (1.16 percent), San Jose (1.07 percent) and Milwaukee (1.00 percent).

Among the 10 cities with the least walking access, none reaches one-third of one-percent. These include one Northeastern city, Boston, St. Louis and Detroit in the Midwest and an expected array of western and southern cities, such as Los Angeles, Houston, Dallas-Fort Worth, Phoenix, Riverside-San Bernardino, Miami and ,in last place, Atlanta (Figure 3).

The Automobile Access Advantage

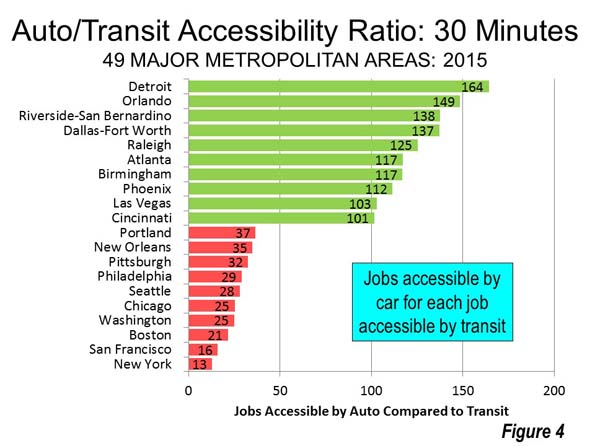
The data indicates that automobiles have far superior access to employment in every major metropolitan area. The cities that have the smallest automobile advantage are generally credited with having the best transit systems. But there is relatively little practical opportunity for commuting by transit to metropolitan jobs.   In the worst case, the average New York auto commuter can reach 13 times as many jobs as by transit in 30 minutes, 16 times in San Francisco, 21 times in Boston, 25 times in Chicago and Washington. In Seattle, Philadelphia, Pittsburgh, New Orleans and Portland the average employee can reach from 28 to 37 times as many jobs by car as by transit.

The auto advantage is much greater in other cities. In Detroit the average commuter can reach 164 times as many jobs by car is by transit, 149 times as many in Orlando, 138 times and Riverside San Bernardino, 137 times in Dallas-Fort Worth and 125 times in Raleigh. Atlanta, Birmingham, Phoenix, Las Vegas and Cincinnati commuters can reach more than 100 times as many jobs by car in 30 minutes as by transit (Figure 4).

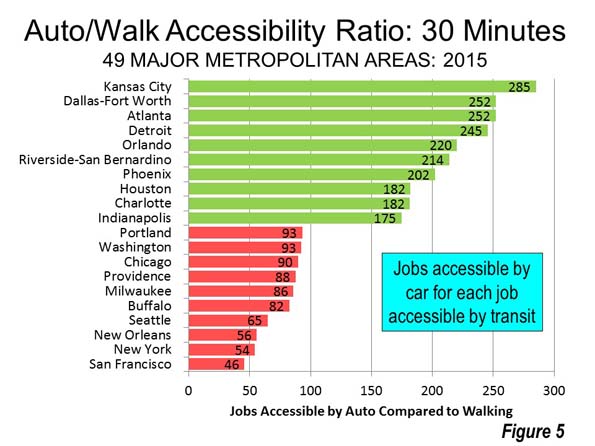
Not surprisingly, the disparities are even greater between autos and walking. Walking does best compared to cars in San Francisco, where auto commuters can reach 46 times as many jobs by car as by walking. The least advantaged pedestrians are in Kansas City, where the average automobile commuter can reach 285 times as many jobs by car as by walking (Figure 5).

New York in Context

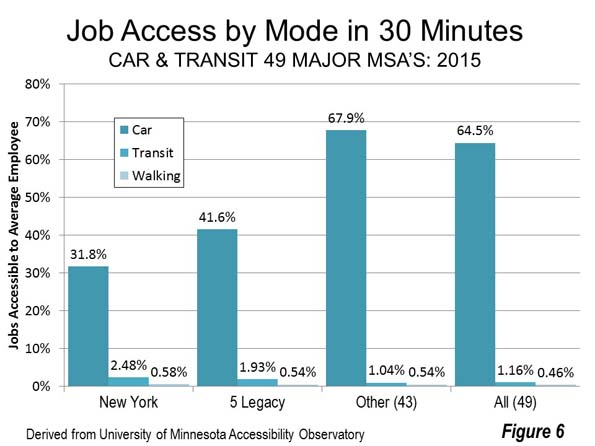
A colleague pointed out that the domination of transit statistics by New York would justify looking at how the nation’s largest metropolitan area compares to others. New York commuter access in 30 minutes of 2.48 percent of jobs by transit is about 1/5 higher than the 1.93 percent in the other five metropolitan areas with transit legacy core cities. New York’s commuters can reach nearly 2.5 times the percentage of metropolitan jobs accessible within 30 minutes as in the other 43 metropolitan areas (Figure 6). Transit is a lot more comprehensive in the New York metropolitan area, but cannot compete with automobile access by a long shot.

Improving Mobility and the Economy

For decades there has been an assumption that transit is an alternative to the automobile throughout the metropolitan area. The University of Minnesota Accessibility Observatory shows any such conception to be at best an exaggeration. Indeed, transit and walking provide only a small fraction of the access available by automobile. This is not likely to change at any practical level of public funding. As Professor Jean-Claude Ziv and I estimated that it could take all of an urban area’s gross domestic product each year just to provide the point to point access available by cars.

There are places that transit is competitive with the automobile, notably the nation’s largest downtown areas (central business districts or CBDs), which are in the six transit legacy cities. However, travel times are far slower than the national average, due to higher levels of traffic congestion and greater reliance on transit, which tends to be slower than cars overall. For example, commuters to Manhattan---by far the nation’s largest CBD --- have transit travel times of 52 minutes, while the travel time by car is 51 minutes, according to the American Community Survey. Either way, the average one-way travel time is about twice the national average. However, even in New York, there are far more jobs outside the CBD, traffic congestion is far less and the speedier access by car makes transit generally uncompetitive to these dispersed locations.

In the past, it was not unreasonable to believe that transit could materially improve mobility in metropolitan areas. The new research undermines any such conception. Maximizing metropolitan mobility --- minimizing work trip travel times --- is an important strategy for jump-starting the economy, creating jobs and restoring economic growth to historic levels. Urban transportations strategies need to be selected based upon the outcome of superior access, without regard to mode.

Photograph: Interstate 10, Houston by Socrate76 (Own work) [CC BY-SA 3.0 or GFDL], via Wikimedia Commons

Wendell Cox is principal of Demographia, an international public policy and demographics firm. He is a Senior Fellow of the Center for Opportunity Urbanism (US), Senior Fellow for Housing Affordability and Municipal Policy for the Frontier Centre for Public Policy (Canada), and a member of the Board of Advisors of the Center for Demographics and Policy at Chapman University (California). He is co-author of the "Demographia International Housing Affordability Survey" and author of "Demographia World Urban Areas" and "War on the Dream: How Anti-Sprawl Policy Threatens the Quality of Life." He was appointed to three terms on the Los Angeles County Transportation Commission, where he served with the leading city and county leadership as the only non-elected member. He served as a visiting professor at the Conservatoire National des Arts et Metiers, a national university in Paris.

Trump and the End of the World Order

$
0
0

In comparison with Barack Obama, who was well regarded in the foreign media, Donald Trump does not come off as a good guy. He is also clearly redefining the country’s identity and global focus. The first American president since the 1920s to walk away from a role as global pooh-bah, Trump instead defines his job as helping the people who elected him.

Trump’s new nationalism, spelled out in his inauguration speech, effectively rejects both the progressive globalism of the Obama years and the conservative idealism associated with George W. Bush. In the process, Trump has managed to outrage virtually the entire foreign policy establishment, including the CIA “deep state,” and more than a few foreigners as well. Everywhere in the mainstream media, here and around the world, Trump is portrayed as a destroyer of ideals, institutions and alliances bringing, in the words of the Atlantic, “the end of the American century.”

Failure of the globalists

Yet, as Larry Summers has pointed out, there’s a reason for the rise of “populist authoritarianism.” What he calls “global elites” have been more focused on working with their foreign counterparts than helping their own middle- and working-class populations.

The old order is not working out all that well. The foreign policy establishments of both parties have ended up producing an America that is perhaps the weakest it has been since the end of the Vietnam debacle. George W. Bush launched a disastrous war in Iraq, which drained the country’s riches, bled its military and, in the end, left Iraq as a de facto Iranian vassal. For good measure, he pushed the expansion of trade in ways that accelerated the decline of many American industries, particularly in the Midwest, while helping boost China as our most formidable rival since the fall of the Soviet Union.

If, as Council on Foreign Relations President Richard N. Haass has suggested, Bush did too much, Obama’s response was to do too little. By his prevarications and refusal to acknowledge the world as it is, Obama has left behind a disastrous reality. Despite engaging in several armed conflicts and increasingly lethal drone attacks, U.S. influence in the Middle East has weakened while that of Iran and Russia has soared. To be in second place to Russia — with an economy about the size of that great economic superpower, Italy — in the Middle East owed little to hacking, but much to greater skill at outmaneuvering the Obama administration’s diplomacy.

The real challenge: China

Despite the progressive hyperventilation about Russia, the real policy challenge lies with China, the only country that presents a serious economic and, ultimately, military threat. Despite Obama’s “pivot to Asia,” the U.S. position has demonstrably weakened there as well. China has shifted the rules of trade in its favor, built islands to gain control of the South China Sea, upgraded its military and won over old allies such as the Philippines. It is making huge inroads in Africa, and even in Latin America.

Now Trump’s often unfocused belligerence opens the door for Chinese President Xi Jinping to posture himself as the new enlightened global hegemon. Here’s the man who heads up the world’s biggest emitter of greenhouse gases — a country committed to building more coal plants and not halting emissions growth before 2030 — preening as the enlightened son of science. A dictator who increasingly adopts an authoritarian Maoist ideology while bolstering a crony capitalist empire, Xi has convinced some progressives that he is a great advocate of free trade, something he and his country have not embraced in the real world.

Read the entire piece at The Orange County Register.

Joel Kotkin is executive editor of NewGeography.com. He is the Roger Hobbs Distinguished Fellow in Urban Studies at Chapman University and executive director of the Houston-based Center for Opportunity Urbanism. His newest book The Human City: Urbanism for the rest of us, was published in April by Agate. He is also author of The New Class ConflictThe City: A Global History, and The Next Hundred Million: America in 2050. He lives in Orange County, CA.

Photo: Matt A.J., Creative Commons

How the Visa Ban Will Hurt US Innovation

$
0
0

A key reason for the prosperity found in the United States is the ability of universities and companies to attract the best and brightest people from abroad. Shutting out skilled individuals from entire countries could have grave consequences for America’s intellectual institutions as well as knowledge-intensive businesses. The obstacles put in place following the 2001 terrorist attack did reduce the position of the US in the global competition for talent, yet the regulations were about increasing security and allowed those that had been screened to enter. The new visa ban sends a message to talent from majority-Muslim countries: you are not wanted here, even individuals posing no threat. It is hard to imagine that this will not hurt America’s goodwill significantly, particularly in the European tech-sector where people from countries such as Iran play an important role.

To illustrate the importance of talent attraction one only needs to look at Silicon Valley, the world’s greatest hub for new technologies and entrepreneurship. It is no coincidence that Silicon Valley has grown in close connection to Stanford University, one of the leading global institutions for learning and research in engineering and sciences. Without the brains attracted to Stanford and other similar universities, innovative American businesses such as Cisco, eBay and Netflix would not be able to dominate the global marketplace. Top entrepreneurs in Silicon Valley and other tech-hubs are understandably concerned about the visa ban. Facebook CEO Mark Zuckerberg was among the first to address the ban publicly, writing on Facebook: “We need to keep this country safe, but we should do that by focusing on people who actually pose a threat”. Since then numerous other CEOs spanning from the Automotive sector to the Pharma industry have made their voices heard against the travel ban.

Much of the talent that fuels America’s universities and tech hubs comes from abroad. Between 1990 and 2014 for example, the college-educated immigrant population increased 339 per cent from 3.1 to 10.5 million. A group of particular importance is graduate students in fields such as science, engineering and health. It is these individuals whose knowledge and innovative ideas fuel the technologically advanced businesses on which US exports rely. Among the graduate students in these fields, one third are not US citizens or permanent residents, but rather foreign visitors. In some fields, international students make up the majority. An analysis of the latest data shows that 61 per cent of full-time graduate students in computer science are international. In the field of Electrical Engineering the share is even higher, 72 per cent.

Where do these students come from? China and Korea are countries often associated with global talent influx into the US. But, we should not forget that several Muslim-majority countries, such as Pakistan and Iran, are also of importance, along with Muslim groups from India and Bangladesh. An illustrative example is Maryam Mirzakhani, born in Iran in 1977. Showing an early gift for mathematics, she received a degree from Sharif University of Technology in Tehran. After moving to the US, Maryam earned her PhD from Harvard before becoming a young professor at Stanford. In 2014 she was awarded the International Medal for Outstanding Discoveries in Mathematics. Maryam was the first women to win the medal, unofficially referred to as the “Nobel Prize of mathematics”. Since it was established in 1936, all previous winners have been male.

Her story is not unique. In 2003, administrators at Stanford University’s Electrical Engineering Department were reportedly startled when the notoriously difficult entrance exam for PhD studies had been aced by a group of foreign students. The majority originated from one place – the same Sharif University where Maryam had studied. Stanford is not an isolated example. Iranian top students are doing well in the International Science Olympiads and flourishing in foreign universities.

The Trump administration’s visa ban is affecting graduate students from Stanford. The Stanford Daily reported that Mostafa Afkhamizadeh, a Stanford PhD student born in Iran, was visiting his family when the presidential order was unexpectedly announced. The prospects for the fifth-year PhD student remain unclear. Will he be able to travel back to the US to finish his research studies in management science and engineering? Another example is that of Nisrin Omer, a Sudanese Harvard University graduate who is a graduate student in anthropology at Stanford. Although Omer is a legal U.S. resident and has lived in the country since 1993, she was briefly handcuffed and detained at JFK airport. There are more examples to be found amongst Stanford PhD students alone, such as Khashayar Khosravi and his fiancée whose wedding plans have been disrupted by the visa ban simply since they both happened to be born in Iran. We should keep in mind that the next wave of graduate students seeking to apply to foreign universities are taking note of the new risks associated with applying to the US. It helps putting oneself in someone else’s shoes: if you were a talented young Pakistani student, would you apply to a university in the US next year?

Not long ago, the US was the unchallenged destination of choice for global talents. Following the 2001 terrorist attacks, the Bush administration introduced background checks that made it time consuming for international students from certain countries to enter the US. Some of the brightest international students could not gain entry into Stanford and other top US institutions, which led them to universities in Canada, the UK, and Germany. Suddenly, academic institutions outside the US realized that they could better compete. Universities which have attracted some international talent are more likely to attract additional international talent – since top students from abroad follow in the footsteps of previous top students, and because universities that have learned to attract some talents will have an easier time attracting others.

The position of the US as the unchallenged destination of global talent has shifted since the policies of the Bush administration. Today, the best American universities are often but not always the top choice. While the US takes the influx of international brains as a given, governments in other countries are keenly aware that we live in a world where competitiveness is increasingly about knowledge. A study presented for Global Affairs Canada last year estimates that after accounting for Canadian scholarships and bursaries, the total annual expenditure of international students, their families, and friends contributed $9.3 billion in GDP to the Canadian economy. The long-term benefit of attracting this human capital from abroad will likely be many times higher. The Canadian government is actively signaling to global talent: we embrace you. This is, to say the least, not quite the positive message sent out by the US.

The visa ban’s repercussions matter for international exchange between technology firms. Talent from majority-Muslim countries plays a key role in the technology sector not only in the US, but also in a range of other countries. For example, a study found Stockholm, the capital city of Sweden, “is the second most prolific tech hub globally, with 6.3 billion-dollar companies per million people (compared to [Silicon] Valley with 6.9)”. The innovative companies in Stockholm grow in close connection with those in the US, not least in Silicon Valley. In the Stockholm tech sector, people born in Iran and other parts of the Middle East make up a significant share of the engineers, researchers and entrepreneurs. Creating barriers for these individuals to travel to the US - as the visa requirement introduced last year by congressional Republicans did and the Trump ban reinforced - makes it difficult for Silicon Valley to grow along with tech hubs worldwide. The unicorn factory of Stockholm is a single example, many more can be found across Europe. Highly educated people from countries such as Pakistan and Iran play an important role in the European tech sector. They, and their colleagues, are anything but happy with the visa ban.

While the direct effect of the visa ban is bad news for the US in an increasingly talent driven environment, the message it sends to the world is even worse: the Trump administration is willing to shut people out simply due to their place of birth. A comparison to the tighter rules introduced after the terrorist attack in 2001 is useful to illustrate this point. While certainly causing problems for many individuals, those affected then could sympathize with the effort to increase US security. The policy was about increasing security, not excluding those born in the “wrong countries”. The ban says to educated people from majority-Muslim countries, you are not wanted in the US. In a global knowledge economy, where the obstacle for growth is increasingly a lack of talent rather than a lack of financial capital, this form of policy is not wise. It will certainly hurt the promise of the Trump administration to boost US competitiveness. Republicans in favor of sound economic policies should advocate that the ban be replaced with more nuanced measures focused on security, not exclusion based on nationality.

Atta Tarki is the CEO of Ex-Consultants Agency, an executive search firm helping Fortune 500 companies solve their most pressing talent needs across the world.

Dr. Nima Sanandaji is the president of the European Centre for Policy Reform and Entrepreneurship. A number of his books, such as "Debunking Utopia", "The Nordic Gender Equality Paradox", "Renaissance for Reforms" and "SuperEntrepreneurs" have gained widespread international attention.

Photo: Fibonacci Blue from Minnesota, USA (Protest against Donald Trump's Muslim ban) [CC BY 2.0], via Wikimedia Commons

Re-inhabitation of Small Town America

$
0
0

My friend Kirsten Dirksen at faircompanies.com recently posted a new video about Water Valley, Mississippi. It demonstrates that there are plenty of great compact mixed use walkable neighborhoods out there that can be re-inhabited. Building anything of this kind from scratch is theoretically possible, but it almost never happens due to endless zoning regulations, building codes, and cultural inertia. Water Valley is lucky in the sense that it’s just down the road from a prestigious university. That gives the town an advantage over similar places too far afield from money and culture. But it shows what’s possible under the right circumstances.

Video by Kirsten Dirksen at faircompanies.com

John Sanphillippo lives in San Francisco and blogs about urbanism, adaptation, and resilience at granolashotgun.com. He's a member of the Congress for New Urbanism, films videos for faircompanies.com, and is a regular contributor to Strongtowns.org. He earns his living by buying, renovating, and renting undervalued properties in places that have good long term prospects. He is a graduate of Rutgers University.

Decentralize government to resolve country's divisions

$
0
0

America is increasingly a nation haunted by fears of looming dictatorship. Whether under President Barack Obama’s “pen and phone” rule by decree, or its counterpoint, the madcap Twitter rule of our current chief executive, one part of the country, and society, always feels mortally threatened by whoever occupies the Oval Office.

Given this worsening divide, perhaps the only reasonable solution is to move away from elected kings and toward early concepts of the republic, granting far more leeway to states, local areas and families to rule themselves. Democrats, as liberal thinker Ross Baker suggests, may “own” the D.C. “swamp,” but they are beginning to change their tune in the age of Trump. Even dutiful cheerleaders for Barack Obama’s imperial presidency, such as the New Yorker, are now embracing states’ rights.

The founders’ solution

When the founders crafted the Constitution, they confronted a country with deep divisions — rural and urban, slave and free, immigrant and nativist, manufacturing and commodity producing. The solution they came up with had its shortcomings, notably the tolerance of the truly deplorable institution of slavery, but without these built-in restraints the republic likely would not have survived its first decades.

Even after the Civil War settled control of the central government, the country largely followed the founders’ vision of separating and restraining power. Education, zoning, laws and the governing of morality were handled largely at the local level. The federal government focused on things that were its natural purview — interstate transportation, immigration, foreign and defense policy.

Federal intervention remained necessary at times, for example, to assure voting rights. But, overall, maintaining power at the local level has remained broadly popular, with the support of over 70 percent of the adult population. Even in one-party California, most would prefer to see local officials, not those at the national or state level, in control.

Division and the road to alternating dictatorships

As in the antebellum period, American politics sadly reflects two increasingly antagonistic nations. One can be described as a primarily urban, elite-driven, ethnically diverse country that embraces a sense of inevitable triumphalism. The other America, rooted more in the past, thrives in the smaller towns and cities, as well as large swaths of suburbia. Sometimes whiter, the suburbs are both more egalitarian and less reflexively socially liberal.

This division worsened in the Obama era, whose city-centric approach all but ignored the interests of the resource-producing regions of the country, as well as the South. In contrast, under Presidents Bill Clinton and Jimmy Carter, Democrats were joyously competitive in these areas, assuring that the party was truly diverse, rather than simply the lap dog of the littoral constituencies.

With the GOP now in control of Washington, the coastal areas are becoming, to paraphrase President Obama, the new clingers, whether on the environment, racial redress or gender-related issues. Now they fear, with good reason, that the very administrative state they so eagerly embraced could come back to undermine their agenda even at the local level.

Republicans, for their part, are stoking these fears by using statehouse control to slap down efforts by communities in the states they control to embrace progressive policies on minimum wages, transgender bathrooms and fracking bans. By doing this, the GOP could be accused of engaging in its own form of payback, which simply assures that when the Democrats get back in power, they will do the same to them.

Read the entire piece at The Orange County Register.

Joel Kotkin is executive editor of NewGeography.com. He is the Roger Hobbs Distinguished Fellow in Urban Studies at Chapman University and executive director of the Houston-based Center for Opportunity Urbanism. His newest book The Human City: Urbanism for the rest of us, was published in April by Agate. He is also author of The New Class ConflictThe City: A Global History, and The Next Hundred Million: America in 2050. He lives in Orange County, CA.

Photo: Matt H. Wade, [CC BY-SA 3.0], via Wikimedia Commons

The 2016 Census of Canada: All About the Prairies

$
0
0

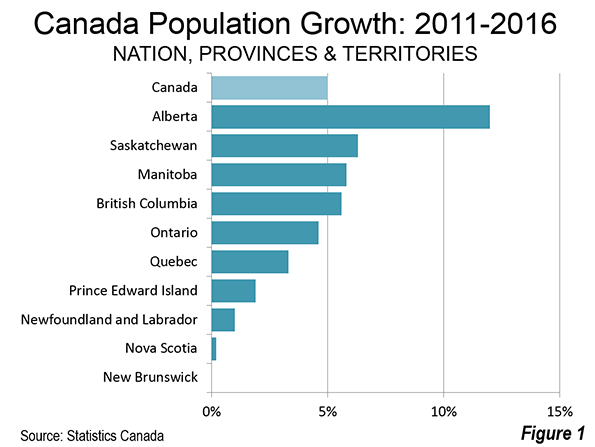
Statistics Canada has just announced population counts from the 2016 census and the narrative is all about the Prairie Provinces. Alberta, Saskatchewan and Manitoba (yes, Manitoba) were the three fastest growing provinces. Metropolitan area growth was dominated by the Prairies, along with metropolitan areas outside the largest in Ontario and British Columbia.

Provincial Results

An analysis in the Globe and Mail indicates that Canada has been the fastest growing among the G7 nations. Since the last census (2011), Canada grew at a rate of 1.0 percent. This is above the 0.8 percent rate of the United States (which fell to 0.7 percent in 2015-2016). Canada’s growth rate was also well above that of the United Kingdom (0.7 percent) and five times the rate of the European Union (0.2 percent) and 10 times that of Germany (0.1 percent).

Perhaps most astoundingly, British Columbia, which had shared growth leadership with Alberta since 1951 was pushed to fourth place in growth (5.6 percent).

Leader Alberta grew 11.6 percent, while perennial slow growers Saskatchewan (6.3 percent) and Manitoba (5.8 percent), took the second and third positions. British Columbia grew only 5.6 percent, down from 7.0 percent between 2006 and 2011. The last time that Manitoba grew faster than British Columbia was in the 10 years before 1911, when Sir Wilfred Laurier was Prime Minister, William Howard Taft was President of the United States and eventual war leader H. H. Asquith was British Prime Minister.

Usually strong growth Ontario, which accounts for nearly 40 percent of the national population, grew slower than Canada (5.0 percent), at 4.6 percent. This repeats the less than stellar performance of 2006 to 2011 and is the first time this has happened since World War II.

Canada has three territories, all in the far north. Two grew rapidly, including Nunavut (12.7 percent) and Yukon (5.8 percent). Their populations, however, are very small, approximately 35,000 each. Nunavut covers a land area three times that of Texas, while Yukon is larger than California.

Growth in Metropolitan Areas

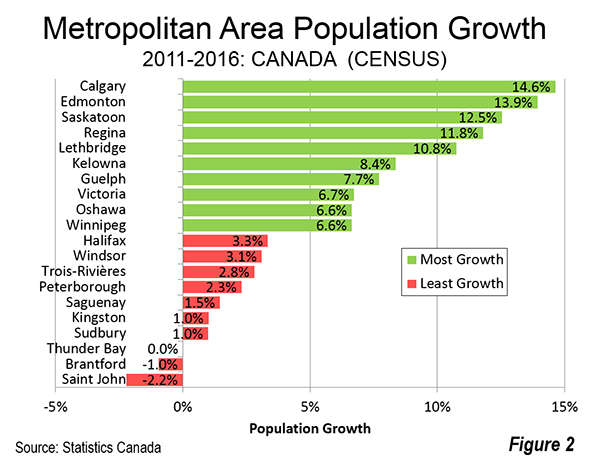
The same pattern can be seen in metropolitan areas (Table). Fastest growth among the 34 census metropolitan areas (CMA) was centered in the Prairie Provinces. Six of the fastest growing 10 metropolitan areas were in Alberta, Saskatchewan and Manitoba. Calgary grew the fastest, adding 14.6 percent to its population. Edmonton, Calgary’s neighbor to the north, and the capital of Alberta was the second fastest growing, at a 13.9 percent rate over the five years. These two metropolitan areas had seen some stalling of their prodigious growth due to oil industry reverses, however with petroleum prospects improving, could well see even greater growth in the years to come.

More surprising has been the growth in the historically slow growing plains provinces just to the east. Saskatchewan’s two metropolitan areas were the next fastest growing. Saskatoon grew 12.5 percent. Regina, the provincial capital, grew 11.8 percent. These are strong growth rates for the Saskatchewan metropolitan areas, which until a decade ago had experienced a long period of slow growth.

Lethbridge, Alberta’s third metropolitan area grew 10.8 percent, rounding out a top five in which all were from the Prairie Provinces.

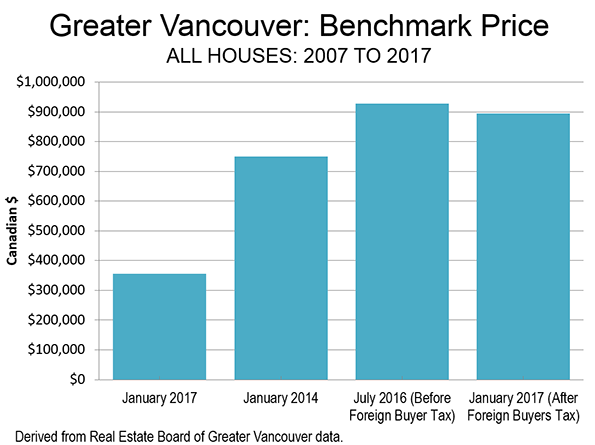
The next four positions were occupied by metropolitan areas near the largest (Toronto) and the third largest (Vancouver). Kelowna and Victoria, in British Columbia grew 8.4 percent and 6.7 percent respectively. In Ontario, Guelph and Oshawa grew 7.7 percent and 6.6 percent, respectively. This represented a shift in growth from the two larger metropolitan areas, which experienced an approximately one-third drop in their growth rates from the previous intercensal period (2006-2011), when they ranked in the top 10 in growth. Part of the reason for the greater growth in the metropolitan areas outside Vancouver and Toronto is their lower house prices. Vancouver’s housing affordability was the third worst out of 92 major metropolitan areas in the 2017 Demographia International Housing Affordability Survey, while Toronto was 14th worst.

Winnipeg, the capital of Manitoba, was the 10th fastest growing, at 6.6 percent, and rounded out the six fast growing Prairie province metropolitan areas. Winnipeg’s growth over the last decade, like that of Saskatoon and Regina, is an important turnaround from its previous slower pace. Winnipeg grew faster than Toronto, Vancouver and Ottawa-Gatineau.

The slowest growing metropolitan area was Saint John, New Brunswick lost 2.0 percent of its population. Six of the slowest growing (and losing) metropolitan areas were in Ontario. Brantford lost 1.0 percent of its population, while Thunder Bay had virtually no change. The other Ontario metropolitan areas in the bottom ten included Sudbury, Kingston, Peterborough and Windsor (just across the Detroit River from Detroit). Two Québec metropolitan areas were among the slowest growing, Saguenay and Trois-Rivières. Halifax, the capital of Nova Scotia was the 10th slowest growing, at 3.3 percent (Figure 2).

As has been the case for the 45 years since it displaced Montréal, Toronto was Canada’s largest metropolitan area according to the 2016 Census, with a population of 5.9 million. Montréal held on to second place, with a population of 4.1 million. Vancouver was third, with a population nearing 2.5 million.

Three metropolitan areas were bunched within a range of little more than 70,000. Calgary had a population of 1,393,000. The federal capital, Ottawa-Gatineau, which stretches across the Ottawa River, located on  the border between Quebec and Ontario, had a population of 1,324,000 and had led Calgary in 2011. Edmonton nearly duplicated the Ottawa-Gatineau number, at 1,321,000. Estimates in 2015 had placed Edmonton higher than Ottawa-Gatineau, but were not confirmed by the new Census numbers.

The remaining four top ten gainers maintained their 2011 positions. Québec ranked 7th, followed by Winnipeg, Hamilton (in the greater Toronto area) and Kitchener-Waterloo, Canada’s Silicon Valley.


Canada Metropolitan Areas: Population
2011 to 2016 Census
RankMetropolitan Area20112016Change%% Rank
1Toronto  5,583,064   5,928,040   344,976 6.2%12
2Montréal  3,934,078   4,098,927   164,849 4.2%20
3Vancouver  2,313,328   2,463,431   150,103 6.5%11
4Calgary  1,214,839   1,392,609   177,770 14.6%1
5Ottawa - Gatineau  1,254,919   1,323,783     68,864 5.5%15
6Edmonton  1,159,869   1,321,426   161,557 13.9%2
7Québec     767,310      800,296     32,986 4.3%19
8Winnipeg     730,018      778,489     48,471 6.6%10
9Hamilton     721,053      747,545     26,492 3.7%23
10Kitchener - Waterloo     496,383      523,894     27,511 5.5%14
11London     474,786      494,069     19,283 4.1%21
12St. Catharines - Niagara     392,184      406,074     13,890 3.5%24
13Halifax     390,328      403,390     13,062 3.3%25
14Oshawa     356,177      379,848     23,671 6.6%9
15Victoria     344,580      367,770     23,190 6.7%8
16Windsor     319,246      329,144       9,898 3.1%26
17Saskatoon     262,215      295,095     32,880 12.5%3
18Regina     211,519      236,481     24,962 11.8%4
19Sherbrooke     202,261      212,105       9,844 4.9%17
20St. John's     196,954      205,955       9,001 4.6%18
21Barrie     187,013      197,059     10,046 5.4%16
22Kelowna     179,839      194,882     15,043 8.4%6
23Abbotsford - Mission     170,191      180,518     10,327 6.1%13
24Sudbury     163,067      164,689       1,622 1.0%31
25Kingston     159,561      161,175       1,614 1.0%30
26Saguenay     158,658      160,980       2,322 1.5%29
27Trois-Rivières     151,773      156,042       4,269 2.8%27
28Guelph     141,097      151,984     10,887 7.7%7
29Moncton     139,287      144,810       5,523 4.0%22
30Brantford     135,501      134,203     (1,298)-1.0%33
31Saint John     129,057      126,202     (2,855)-2.2%34
32Peterborough     118,975      121,721       2,746 2.3%28
33Thunder Bay     121,596      121,621            25 0.0%32
34Lethbridge     105,999      117,394     11,395 10.8%5
Source: Statistics Canada

Photograph: Flag of Canada

Wendell Cox is principal of Demographia, an international public policy and demographics firm. He is a Senior Fellow of the Center for Opportunity Urbanism (US), Senior Fellow for Housing Affordability and Municipal Policy for the Frontier Centre for Public Policy (Canada), and a member of the Board of Advisors of the Center for Demographics and Policy at Chapman University (California). He is co-author of the "Demographia International Housing Affordability Survey" and author of "Demographia World Urban Areas" and "War on the Dream: How Anti-Sprawl Policy Threatens the Quality of Life." He was appointed to three terms on the Los Angeles County Transportation Commission, where he served with the leading city and county leadership as the only non-elected member. He served as a visiting professor at the Conservatoire National des Arts et Metiers, a national university in Paris.

How Richard Longworth Predicted 20 Years Ago That Globalization Would Cause a Social Crisis

$
0
0

Global Squeeze: The Coming Crisis for First-World Nations

Richard C. Longworth

McGraw-Hill 1998

Whenever we see the reality of momentous shifts in society, it’s always good to go back and take a look at the people who saw it coming far away. Generally speaking, there were usually people who understood what was happening in advance. For example, Daniel Bell wrote his book The Coming of Post-Industrial Society in 1976. There were probably even other earlier books touting the same theme.

One person who clearly saw the challenges that globalization would bring to the developed countries was Richard C. Longworth. Longworth was a reporter for most of his career, and a long time foreign correspondent at the Chicago Tribune. Most readers here probably know him from his 2008 book Caught in the Middle: America’s Heartland in the Age of Globalism.

But arguably more important was his 1998 book Global Squeeze: The Coming Crisis for First-World Nations, a book in which Longworth predicted most of the dynamics that would play out in the next two decades, culminating (so far) with Trump’s election. He predicted massive job displacement from China’s entry into the global trading system, describes how developing world countries would move up the value chain, predicts the erosion of middle-class standards of living, the rise of the gig economy, and the deterioration in race relations. He puts his finger on the nationalism vs. globalism debate and anticipated populist revolt. He didn’t predict everything, but he nailed an awful lot of it.

I don’t know how this book performed in the market, but its timing was certainly inauspicious. It came out right as the dot com boom was going nova. Just as one contemporaneous event, on March 30 of that year James Glassman and Kevin Hassett wrote an op-ed in the Wall Street Journal (which no longer appears to be online) that became the basis of their now infamous 1999 book Dow 36,000.

I was then in my late 20s and about to leave Andersen Consulting (now known as Accenture) for a telecom startup. I had no inking of how the future would ultimately play out, but I was incredibly, and naively, optimistic. Since coming out of school at the end of the early 90s recession, the tech industry had been booming beyond belief.  The post-mainframe tech transitions of the 90s, plus the nationalization (and early stage globalization of business) drove fantastic demand for consultants and while collar workers. It was truly the golden age for young people with college degrees. Unlike today’s Millennials, who are experiencing downward economic mobility, our salaries were soaring.

Having a great employer and living in a nascently gentrifying Chicago, I was living in a bubble. I certainly did not see trouble ahead in these boom times. I was aware that manufacturing was in structural decline, but my assumption was that this was transitional and generational. Future generations would enter the exploding white collar workforce as I had and industrial displacement would be as forgotten as agricultural displacement had been.

I didn’t see it coming. But Longworth did, even in those boom times.

A Critique of Free Trade

It’s interesting to see how Longworth, someone you’d certainly place today as in the mainstream of center-left thinking, was at that time sharply critical of what is now considered conventional wisdom by both parties, such as free trade dogmatism. For example, he criticizes the doctrine of comparative advantage:

World trade is based on the idea that each nation should make what it makes best and most cheaply, and then trade those wares to another nation for what that nation makes best and most cheaply. In the process, both nations will prosper and will have access to better goods than if they tried to do it all themselves. This is the principle of ‘comparative advantage.’ It also has very little to do with trade in the real world of the global economy….Trade as it exists today bears little resemblance to the textbook images dear to the heart of free traders, for several reasons. One reason deals with the ability of giant firms to create comparative advantage and move it around the globe. If world trade used to take place between companies in different countries, it goes on as often now between branches of the same company operating in many different countries…These are not cases of countries taking advantage of their natural competitive advantages to make goods and services that can be sold freely to less-favored countries. They are cases of companies using technology to build enclosed and controlled trading systems.

This is part of his general disdain for the economics profession:

[Robert Z.] Lawrence and most of his mainstream colleagues are devoted free traders, literally trained from their undergraduate days to reject the thought that trade can cause more harm than good. Lawrence has even warned against letting such ideas get around, saying, ‘The very perception that a link exists [between trade and labor problems] could put the continuing evolution of trade and investment flows at risk.’ No one actually accuses these economists of faking their evidence to protect the sanctity of free trade. But it’s clear that many economists have carefully limited their research to product the results they wanted. The growing evidence that free trade can indeed cause severe damage, and that this damage may even outweigh the gains is producing nothing less than a religious crisis among the true believers in the economics departments of American universities.

They may possibly have had a momentary crisis of faith in the 1990s, but if so, they quickly repented of their heresy. If anything, the economics profession today is more militant and more hysterical about any impingement on global trade than they used to be, even as they finally start to admit, belatedly, that just maybe trade with China has had some negative effects on American workers.

I’ve been wanting to dig more deeply into trade economics because like Longworth I’m not convinced that the studies that are touted regarding trade’s effect on employment tell us what they are marketed as doing. For example, we frequently hear that research shows that relative few jobs were off shored, and that most job losses have been due to automation and other onshore productivity improvements.

Yet I then read articles saying that just one company, Apple, and its subcontractors employ 700,000 people in China.  And I wonder: were these 700,000 jobs a) lost to trade/off shoring b) lost to automation or c) counted in some third bucket we’re not being told about? If they aren’t in large part doing jobs that would otherwise be done somewhere else, what the heck are all these untold tens of millions of workers in China manufacturing products for export actually doing?

Longworth points out the hypocrisy inherent in some free trade arguments by pointing to China’s extremely state managed economy and highly protectionist legal system. By the standard arguments, this should have torpedoed them. Yet China has had a three decade run of fabulous growth so far. Even if they crash tomorrow, that’s remarkable. Far from chasing away businesses, even companies they’ve banned like Facebook continue to prostrate themselves before Emperor Xi hoping to get back in, all while delivering sanctimonious lectures to governments back home. And speaking of the tech industry, Longworth saw that China was using its trade discrimination rules to move up the value chain too:

[China] has every intention of upgrading its exports from clothing and toys to high-end, high-tech, high-profit goods such as cars, electronics, and pharmaceuticals….and it is using its trade and investment policies to force Western companies to help it achieve this mastery, which it clearly intends to employ to compete with these countries in the future. Western and Japanese companies that want to invest in China are forced to bring in modern technology and teach the Chinese how to use it.

The Primacy of the Nation and Its Social Integrity

In contrast to the pre-Trumpian mainstream thinking of the Clinton-Bush-Obama years, Longworth argued that even if it’s economically inefficient, some type of protectionism was necessary in order for developed country societies to survive China’s entrance into the global trade system intact:

If Japan was a problem, China will be a catastrophe. It seems impossible that the world trade system, with all its benefits, can withstand an assault of this sort….The major nations must now begin planning new rules to limit aggressive exports of this sort and to demand strict reciprocity – equal access to the markets of China…This is of course, both protectionism and managed trade, and will be attacked as such by purists who consider anything less than free trade a sin. But trade is an economic issue, not a theological one. The First World nations have civilizations worth protecting. If the price of that protection is some protectionism aimed at global predators, it seems folly not to pay it.

This was of course rejected, and these civilizations are in fact badly damaged. And the global trade system is in serious jeopardy as a result, as Longworth predicted.

This passage also gets at the core debate at the heart of contemporary politics: nationalism vs. globalism. Longworth tables this as they key issue in the opening passage of the book: “What is the purpose of an economy? If it is not solely for the well-being of the people who live within it, what is an economy for?”

Longworth at this point in time clearly sided with the nationalist perspective, though as we’ll see in part two this review, his personal and political background created cognitive dissonance on this point that caused him to ultimately side with the very people he raked over the coals in this book.

He saw that on the path the country was on, the prognosis for the middle class was grim and threatened our very understanding of a fair society.  Sadly, he was accurate here too:

This is the proletarianization of the middle class, which once considered itself set for life in cushioned cubicle of big corporations but now finds itself pitched onto the pavement, a loser in the global competition for jobs. If there is a focal point of the growing debate on the global economy, it is here, where people work….The global emphasis on profits, the unrelenting pressure of the capital markets, and the search for best practice preclude comforting answers. The truth is that no one at this stage can give answers with assurance. The logic of global markets leads to more pressure on workers, not less. Millions of new workers appear on the world market every year, all hungry and ready to compete. The power of computer-driven automation makes it at least possible that, for the first time, new technology will be a job destroyer, not a job creator….This is the “race to the bottom,” a process that drives incomes ever lower. It is also straightforward supply-and-demand economics at work…This is the dehumanization of labor. No other major country treats its workers as commodities in this way, as raw materials or components that can be bargained to the lowest price.

He also correctly foresaw that race relations would degrade with economic stresses. Not only did this cause the white working class to prioritize its own self-interest (the same as every other group), but if the white working class sneezes, the black working class gets a serious case of Spanish flu. As Longworth says:

Racial progress, if not racial harmony, is real. The past three decades in particular have seen once-closed doors open for the vast majority of blacks. Anyone who can recall the legal segregation of the immediate postwar years must marvel at the changes. But economic problems threaten much of this progress.

The retrogression of the racial fabric that we’ve seen is part of that social unraveling that he saw unfettered globalization imposing on America.

And there’s much more he got right, including seeing the rise of the “gig economy” in a section called “A World of Temps.”

The Moral Bankruptcy of the American Elite

One of the major themes woven throughout the book is the moral bankruptcy of America’s elite and more broadly those who, like me at that time, were living large and loving life thanks to this new economy.

He adopts Robert Reich’s “secession of the successful” thesis:

The upper 20% retreats to its gated communities in the suburbs, withdrawing not only physically but psychologically and socially from the country around it. They are not only the wealthy, the executives and traders, but also the economists, journalists, and others who tout the global economy largely because they are best equipped to cope with it and most insulated from its effects. These fortunate few go by different names. Rohatyn calls them the “technological aristocracy.” Robert Reich, the former secretary of labor, calls them “symbolic analysts”….I prefer to think of them as global citizens, having more in common with the elites of Tokyo and Frankfurt than with the other Americans who live beyond the gates, in the shantytowns on the outskirts of the global village. Any country needs its elites. It needs their money, and more important, it needs their leadership. Now the United States is losing its elites.

He talks about the dismal ethics and reckless behavior of much of the financial class:

American traders usually have more formal schooling than their British counterparts, but they have no less ambition and no more real knowledge of the world. Most know the difference between normal risk and betting the bank. But some don’t. Most are honest. But some aren’t. Barely prepared and innocent of ethics, these traders are pitched into stupendous sums of money.

He describes how major Western corporations came to think of themselves as post-national, and repudiated the social contract:

Once the social contract expressed a deal between the wealthy and the poor, between businesses and their employees. Economic change has always brought both gain and pain. But in the short run, the wealthy were more likely to get the gain, and the poor more likely to feel the pain. The great stabilizer of postwar industrial society was the recognition by government and business that, if change creates both winners and losers, then the winners have an obligation to help and compensate the losers. This was more than simple fairness. It was good politics. It was the price that the winners paid to pacify the losers, who had the vote. If the pain became too great, the losers would stop supporting the system that caused the pain. So the Western nations created the safety net, a social balm that soothed the pain and kept the losers non-mutinous.

This social contract has been broken. Footloose global corporations have stopped paying the taxes that financed it. The slack has been taken up, at least partly, by higher taxes on workers. In other words, workers are financing their own social contract. It’s robbing Peter to pay Peter. The losers are comforting the losers, while the winners pay minimal taxes in Indonesia or buy bonds in cyberspace.

Or set up shell companies in Ireland or Luxembourg. The merits of corporate taxation are debatable. But we’ve all read the stories of how these Silicon Valley firms have racked up gigantic profits while using complex strategies to pay little if any tax.  It’s indisputable these companies have little concept of the social contract as previous generations understood it.

These global companies have even seceded from national legal systems in favor of private justice.

Even the functions that the governments used to do are being taken over by the global market. With no global laws or regulations to discipline these global markets, a sort of privatized form of justice has arisen. Around the globe, private arbitrators and arbitration centers are producing a “transnational legal profession and indeed a transnational private judiciary. These arbitrators, being private, compete for business and so depend on the goodwill of the corporations they judge. These corporations, in turn, use this private judicial system largely to escape the jurisdiction of national courts.

These private courts can even force nominally sovereign nations to submit to them. That’s because these trade treaties set up international arbitration courts that empower businesses to sue countries outside of those countries’ home court systems. This is nothing less than a destruction of sovereignty, and one of the biggest complaints critics have about these “trade” treaties. There’s a reason it takes 5500 pages to print a so-called “free trade pact” – and it’s not free trade.

As you can see, there’s a ton that Longworth got right 20 years ago – and he put his finger on issues that are if anything more relevant to public debates now than they were then. In fact, a few anachronisms aside, Global Squeeze holds up very well and is still eminently worth reading today. If nothing else, doing so will make clear that anyone who claims “we didn’t see it coming” isn’t telling the truth. Some people did see it coming. But they were ignored.

That’s not to say Longworth predicted or got everything right. In the second part of this series I’ll highlight the areas he missed, and also how cognitive dissonance on his part and that of others like him who were sharply critical of globalization back then fatally undermined their efforts at reform and led them to ultimately be perceived as champions of globalization.

Aaron M. Renn is a senior fellow at the Manhattan Institute, a contributing editor of City Journal, and an economic development columnist for Governing magazine. He focuses on ways to help America’s cities thrive in an ever more complex, competitive, globalized, and diverse twenty-first century. During Renn’s 15-year career in management and technology consulting, he was a partner at Accenture and held several technology strategy roles and directed multimillion-dollar global technology implementations. He has contributed to The Guardian, Forbes.com, and numerous other publications. Renn holds a B.S. from Indiana University, where he coauthored an early social-networking platform in 1991.

Trump Country: Where the Immigrants Aren't

$
0
0

Trump did best in the states with the lowest percentages of foreign-born residents.

“I love the poorly-educated”, gushed Donald Trump after winning the Nevada primary in February. But in the end, what happened in the primary, stayed in the primary. Come November, Trump lost the state to Hillary Clinton, a turn that is explained by the fact that there is a higher percentage of foreign-born residents in Nevada than in any state won by Trump, save Florida.

In fact, Trump won the general election because he carried almost all of the states where there are few foreign-born residents. His anti-immigration message resonated most in the parts of the country that have the fewest immigrants. Of course, he also won immigrant-heavy Arizona, Florida and Texas, but mainly by prevailing in rural counties. He lost in the counties that include the major urban centers of Miami, Orlando, Tampa, Dallas, Houston, Austin and San Antonio. He did win in Maricopa county where Phoenix is located but perhaps not in Phoenix itself. (Maricopa county encompasses a lot more than Phoenix as it is larger by itself than the entire state of New Jersey, and larger than Connecticut and Delaware put together.)

If the size of the Trump vote can be used as a proxy for a state’s sentiment towards immigration and concern about terrorism, and it probably can, then it seems that the people who are most worried about immigration and terrorism are those who are the least exposed to it and the least at risk from it. This is counter-intuitive from the point of view of probability: why worry about a low probability event? But it could make sense from the point of view of fear: many people can be prone to fear and to misunderstand what they do not know well. Their opinions of others are formed mainly by what they see or read in the media, rather than by their own first-hand experiences.

Where Trump Won

In the United States overall, there were in 2015 as many as 42 million people who were born in another country, or 13.2% of the US population. But as shown in the chart, every state won by Trump last November, except for Arizona, Texas and Florida, has a smaller percentage of foreign-born than the national average. In fact, the lower the percentage of foreign-born in a given state, the better Trump has done in that state.

In Wyoming and West Virginia (3.6% and 1.5% foreign-born), he carried approximately 70% of the popular vote. But in Georgia (9.8% foreign-born), he carried about 50%. This difference in the vote cannot be totally attributed to the fact that a majority of the foreign-born probably went for Clinton, given that the difference between 70% and 50% is far higher than the difference between 9.8% and 3.6% and that the latter variable includes non-voters such as children and undocumented immigrants.

Meanwhile California, New York, New Jersey, Nevada, Hawaii and Massachusetts all have a higher percentage of foreign-born than the national average and they all voted for Hillary Clinton by wide margins. With Illinois, the District of Columbia, Washington state and a few others, these are the states with the big urban centers that saw the largest protests against the recent executive order banning entry from seven Muslim countries.

In the above chart, the percent of foreign-born (provided by the US Census) includes unauthorized migrants. Pew Hispanic Research estimated their numbers in every state as of 2014. If we strip the unauthorized figure from the foreign-born figure, we end up with an even better correlation. The resulting chart below reinforces the notion that Trump did well in inverse proportion to the foreign-born presence in any state.

Texas and Florida are moderate outliers in the sense that Trump did better than one would have expected from the regression. But conversely, he did far worse in the New England states, in particular Vermont, New Hampshire and Maine all of which have fewer than 5% foreign-born in their populations. Vermont is a big outlier, ostensibly because of the number of former New Yorkers living in the state, or the Bernie Sanders factor. Its total population is also very small at around 630,000.

(click and zoom in to enlarge the table)

screen-shot-2017-02-03-at-10-37-43-am-2

With his current policies, the President is not courting any immigrant-heavy states and his solid base elsewhere allows him to ignore the protests. People who live in the rural South or Midwest may feel just as strongly in favor of the visa ban or of other Trump initiatives but their low-density living makes it harder for them to make their numbers visible through outdoor protests. The same is true of the lower density regions of Arizona, Florida and Texas where support for Trump was rock solid.

Terror Calculus

It is also worth noting that the Trump states (red in the chart) have not been the targets of terrorist activities or threats to the same extent as New York or Washington DC. So here again, the people more often targeted by terrorism seem less worried about newcomers and Muslims than people who live in a small town or rural setting where the odds of terror attacks are close to nil. Terrorists want to inflict as much damage and as many casualties as possible, a more attainable goal in dense urban centers. Even if they targeted smaller localities, the odds that it would be one’s own small town out of thousands of others are probably no greater than the odds of a mass shooting by a citizen born and raised in the United States.

Meanwhile, there is only one New York City and only a few cities of the size of Chicago or Washington DC. Even in these cities, the odds of being a victim of terrorism are very small. An attack may well occur but the likelihood that it will be at the exact time T and place P where a resident R may find himself, out of hundreds of millions of other possible daily T-P-R combinations, is indeed minimal. Of course, a scenario involving a WMD attack throws off this tragic and otherwise reassuring calculus. But then this speaks more to the need for detection and prevention of WMDs, rather than to the extreme vetting of individuals originating from certain countries.

So to sum up, people who have few if any foreign neighbors appear to be more worried about foreigners and terrorism than people who have many foreign neighbors. And from their sparsely populated townships, they could now effect restrictive policies not only for their own localities, but even for the large cities that they rarely visit. This is not so unusual. Historically, decisions made at the center have not always complied with local preferences. However, it should be added that historically, it was more often the preferences of the big cities that were imposed on the great plains.

President Trump says he loves the poorly-educated but he also relies on the support of voters who are less exposed to immigrants. Which then begs the following question: how deep is these voters’ sentiment towards the foreign-born in places where they are scarce, and for how long can the President tap it to maintain his popularity? A lot hinges on the answer.

Sami Karam is the founder and editor of populyst.net and the creator of the populyst index™. populyst is about innovation, demography and society. Before populyst, he was the founder and manager of the Seven Global funds and a fund manager at leading asset managers in Boston and New York. In addition to a finance MBA from the Wharton School, he holds a Master's in Civil Engineering from Cornell and a Bachelor of Architecture from UT Austin.

Photo: Gage Skidmore, CC License

TruMpISSION: Impossible - Border Wall

$
0
0

While running for office, President Trump said the border wall would cost about $8 billion, a figure widely recognized as an unreasonably low estimate". This week, the Department of Homeland Security (DHS) estimated the cost of construction at $21.6 billion. Figuring out what the wall would cost has been a source of debate for longer than the last election cycle. In 2013, the bipartisan "Gang of Eight" senators set aside $1.5 billion for a plan to add 700 miles of wall - also a completely unrealistic budget.

In this edition of TruMpISSION: Impossible we examine the numbers behind building a wall along the U.S.- Mexico border. There are five main reasons why this mission is impossible.

1. It will be hideously expensive. The un-walled portion of the border covers the most difficult terrain, a lot of which could cost $17 million per mile. Historically, building on flat land cost about $4 million per mile. The government spent $2.4 billion between 2006 and 2009 to build a stretch of wall along 670 miles of easy terrain (Secure Fence Act of 2006). A 2009 attempt to build along one rugged stretch of the border was budgeted at $58 million for just 3.5 miles.

Since most of the easier stuff is already built, I calculated that the cost for the next 1.289 miles could easily run $19.3 billion - I think the new DHS estimate is close to the mark. To put the number into perspective, the cost will be about seven times the entire 2016 budget of the U.S. Border Portal. Construction isn't the only expense. Section 10 of the Executive Order basically "deputizes" local law enforcement - at the expense of local taxpayers - to act as immigration officers for carrying out deportations.

2. More than 1,000 of the open border is under water. Building a wall in the water would be wildly expensive and would have to be replaced frequently. In February 2012, construction began to extend began to extend an 18-foot high border fence 300 feet into the Pacific Ocean to seal off the gap that opened at the beach between Tijuana and San Diego during low tide. The private contractor who built it (Granite Construction Company, NYSE:GVA) gave the government a 30-year warranty. The budget for that Surf Fence Project was $4.3 million (I did not find the final cost in any public source). Based on that budget, the cost of building the wall in water could run $75.9 million per mile or about 4.5 times the cost of building on rugged land and nearly 20 times the cost of building the parts on more level ground. Building a fence on the water part of the border would cost close to $9 billion alone.

3. Maybe Trump does not really mean to build on the border that lies underwater. The Executive Order defines the "Southern border" as only the "land border". To avoid the extra expense of building in the ocean, the gulf, and two rivers, we can build on the land outside the flood-plain/tidal-zone. It is likely the Mexican president Enrique Peña Nieto has heard of the "adverse possession". Along the border, state laws transfer rights to abandoned property to the possessor in 5 to 10 years. Building just one half mile from the rivers means the United States could relinquish at least 657 square miles to Mexico. Are we prepared to cede to Mexico an area 1.5 times the size of Los Angeles?

Fox News has noted that "[w]hile 1,254 miles of [the] borders is in Texas, the state has only 100 miles of wall". At least 65 miles of the 100 mile route proposed through Texas in 2008 sat a half mile from the border. In some places, like the McAllen area of Texas, the proposed track separated a water reservoir from the pumping stations that bring water to US citizens. Building up to a mile into the US side has already stranded the property of US citizens on the Mexico side of the wall.

4. The border land that is not under water or already fenced is mostly in private hands. In a January 2016 story Fox News recognized that finishing the wall along the border in Texas could require hundreds of lawsuits by the federal government. The Washington Post also reported going into the 2009 expansion of the wall that much of the planned route would slice through private property. Private property adds an average of $61,491 per mile (based on actual costs in 2012). During the 2009 expansion, 135 private landowners refused to let surveyors onto their property. Seventy percent of the landowners who held out were in Texas. Anybody remember Jade Helm 15 when part of Texas was labeled "hostile territory" during military exercises? The Governor ordered the Texas State Guard to monitor the exercises. What do you think will happen if bulldozers show up uninvited to begin claiming 1,000 miles of Texan's private property? The federal government can use eminent domain, but it is costly, takes a long time and holds an uncertain outcome.

5. There may not be enough brick and mortar to build a wall along the US/Mexico border, especially if Trump keeps talking it up. During the 2009 expansion of the wall, cost estimates ballooned as a Border States construction boom led to labor shortages and rising costs for construction materials (e.g., steel and cement). Try building more than 1,000 miles of border wall while re-building transportation infrastructure, the strain will be beyond the global peak in prices seen when shovel-ready projects were initiated under post-financial-crisis stimulus spending.

The Executive Order gave DHS 180 days (until about the second anniversary of Jade 15) to come up with a plan. DHS also has to figure out how to return deportable aliens “to the territory from which they came” – imagine millions of aliens lined up along the US/Mexico border. DHS has less time (until March 26) to figure out how to pay for the wall by withholding “all bilateral and multilateral development aid, economic assistance, humanitarian aid, and military aid” that the US may be planning to send to Mexico. That sounds like it could actually work to balance the budget outlay. Except that it won’t actually work. Total U.S. foreign aid to Mexico disbursed from all agencies in 2015 was $338.5 million (that’s “million” with an “m”). At that rate, it will take 54 years to recover the cost!

Aid to Mexico includes $215 million for international drug and law enforcement plus $50 million more for in-country drug enforcement. The other hundred million or so was for justice projects, legal reform, crime prevention and military support. According to former Secretary of Homeland Security Jeh Johnson,“…experience teaches that border security alone cannot overcome the powerful push factors of poverty and violence that exist in Central America. Ultimately, the solution is long-term investment in Central America to address the underlying push factors in the region.”

[After I calculate the costs for several more truMpISSIONs, I will calculate the cost of financing with debt. Just because something is impossible, doesn’t mean Trump won’t spend your money on it.]

Susanne Trimbath, Ph.D. is CEO and Chief Economist of STP Advisory Services. Dr. Trimbath’s credits include appearances on national television and radio programs and the Emmy® Award nominated Bloomberg report Phantom Shares. She appears in four documentaries on the financial crisis, including Stock Shock: the Rise of Sirius XM and Collapse of Wall Street Ethics and the newly released Wall Street Conspiracy. Her newest book, Lessons Not Learned: 10 Steps to Stable Financial Markets, was published in November by Spiramus Press (UK). Dr. Trimbath teaches graduate and undergraduate finance and economics.

Photo: ourfunnyfarm, CC License

Vancouverizing Seattle?

$
0
0

A recent Wall Street Journal article (“For Chinese buyers, Seattle is the new Vancouver”) reported that Seattle was replacing Vancouver as the most popular destination for Chinese buyers in North America. For years, there has been considerable concern about foreign investment in the Vancouver housing market, especially Chinese investment. This   demand is widely believed to have driven Vancouver house prices “through the roof.” In response, the British Columbia government recently imposed a 15 percent foreign buyers tax that has had the impact of significantly reducing new foreign investment in Vancouver’s housing market.

Yet the impact of the tax has still been muted. Houses remain just about as unaffordable as before. The Real Estate Board of Greater Vancouver benchmark price has dropped less than four percent from six months ago, before the foreign buyers tax was imposed. This compares to an 80 percent increase over the last 10 years and 47 percent increase over just the last three years (Figure).

Clearly there is something other than Chinese investment driving up Vancouver house prices. Since 2004, Vancouver’s median multiple (median house price divided by median household income) has risen from 5.3 to 11.8. This means that that the median house has increased in price more than six times the annual median household income.

The primary cause of Vancouver’s difficulties is a rigged housing market. For decades, Vancouver has had some of the strongest urban containment policy in the world. Regional land-use authorities have prohibited  housing development from being built on a large agricultural reserve. This land is hardly needed for such use in a nation that has increased its gross agricultural output more than 150 percent since 1961, while reducing its land in farms by three times as many acres as is occupied by all urban settlements combined, according to the 2016 Canadian census. Of course, urban containment restrictions on new housing have driven up house prices, just as Middle East oil supply reductions used to drive up gasoline prices, before the recent supply increases from Canadian and US oil production.

Vancouver has literally become the third most unaffordable city (metropolitan area) in the nine nations covered by the Demographia International Housing Affordability Survey. This makes a mockery of the Vancouver’s frequent citation as one of the most livable cities in the world. The first principle of livability is affordability --- you cannot live where you cannot afford. Most young families of normal economic means cannot hope to ever buy a modest detached house with a yard as their parents or grandparents did decades ago in the Vancouver area. Only Hong Kong and Sydney are less affordable.

In a recent column (“Not much can or will be done to make Vancouver housing more affordable”) by Gordon Clark in The Province (Vancouver newspaper) describes how things have changed, in a story similar to what you will hear in Sydney, San Francisco and others of the world’s most unaffordable cities. In 1941, his postal supervisor grandfather purchased a house on Oak Street (a main central arterial leading toward downtown) for 1.5 years of income. In 1979 his teacher mother purchased a house in the city of Vancouver for 2.5 times her income. Now with houses costing nearly 12 times incomes, Clark regretfully concludes that nothing can be done: “because the solutions are unacceptable to most people.”

This illustrates what is perhaps the most powerful characteristic of urban containment regulation --- that it creates a strong lobby of support among those who have seen their house values irrationally escalate as a result of unwise government policy. In this environment, public officials simply wring their hands, decry the problem and implement nothing of substance to change the essentially flawed policies. 

With this rigged market, it should not be surprising that people with money from outside Vancouver, and abroad, would seek to buy houses in Vancouver. After all, the policies all but guaranteed strong returns to anyone with enough capital to enter the market.   It is as if a “Speculators Welcome” banner has been hung from Lion’s Gate Bridge. Not so welcome are those middle-income households being driven out of the market

Lessons for Seattle

All of this is a cautionary tale for the Seattle metropolitan area, which also has urban containment policy, but of more recent vintage. Just 140 miles or 225 kilometers south of Vancouver, Seattle’s has housing affordability that already as bad as Vancouver’s  only 12 years ago.

Seattle has a severely unaffordable median multiple of 5.5, slightly worse than Vancouver’s 5.3 in 2004. In the late 1980s, before Seattle imposed its metropolitan- urban containment policy, the median multiple was as low as 2.4 (Table). Today, a Seattle household with the median income must pay three additional years of income for the median priced house.

Rising housing demand with severely constricted supply is associated with higher house prices compared to incomes. In this regard, Seattle has multiple risks, from households escaping California to escape from the even higher prices, Seattle is a bargain compared to the “dogs breakfast” of unaffordable housing associated with California where median multiples now exceed 8.0 in all of the major coastal metropolitan areas (Los Angeles, San Francisco, San Diego and San Jose). Prices are so high in California that a seller can buy a comparable house in Seattle for hundreds of thousands less. There may not be as much sun in Seattle, but there’s plenty of money left over for umbrellas and other goods and services.

Now the pressure is likely to increase as foreign investors who shop the world for rigged housing markets promise quick profits now turn their attention to the Puget Sound. In this environment, it would not be surprising for additional serious house price escalation to be in the offing, and Seattle to indeed become the new Vancouver in the next decade or two.

Given these forces, we can expect Seattle housing prices   will continue to increase disproportionately to incomes unless there is land use policy reform. Sufficient supply must be allowed on greenfield land to keep house prices from rising farther. And “building to the sky”--- which is very expensive and not very family friendly ---  is not likely to restore housing affordability in Seattle any more than it has anywhere else. For example, the Manhattanization of central Toronto, with its many new residential towers, has not prevented its median multiple from doubling from 3.9 to 7.7 in the last 12 years. Nor has it prevented a far less obvious (at least to the press) 80 percent share of population growth to be in the suburbs between 2011 and 2016.

Lost in all of this are ordinary middle and working class people, who routinely take a back seat in public policy to planning obsessions over urban form, and a “sense of place.” Middle-income households are far more in need of a “decent place” to live at a reasonable price. Architectural marvels or sleek streetscapes are no substitute. The issue is not ideological, it is rather practical and human. Nor is it about property rights, or free markets. The issue is that people are being denied the housing they desire by urban containment policy and its distorted priorities. As Paul Cheshire, Max Nathan and Henry G. Overman of the London School of Economics have pointed out, “people rather than places” should be the focus of urban policy.

It is ironic that progressive metropolitan areas, like Vancouver, where inclusionary zoning drip feeds housing to lower income households, have become, large exclusionary zones where average income households cannot afford houses. Seattle is headed down the same path.  Soon it may be time to hang a “Speculators Welcome” banner from the Space Needle.

Photograph: Downtown Seattle (by author)            

Wendell Cox is principal of Demographia, an international public policy and demographics firm. He is a Senior Fellow of the Center for Opportunity Urbanism (US), Senior Fellow for Housing Affordability and Municipal Policy for the Frontier Centre for Public Policy (Canada), and a member of the Board of Advisors of the Center for Demographics and Policy at Chapman University (California). He is co-author of the "Demographia International Housing Affordability Survey" and author of "Demographia World Urban Areas" and "War on the Dream: How Anti-Sprawl Policy Threatens the Quality of Life." He was appointed to three terms on the Los Angeles County Transportation Commission, where he served with the leading city and county leadership as the only non-elected member. He served as a visiting professor at the Conservatoire National des Arts et Metiers, a national university in Paris.

The Screwed Generation Turns Socialist

$
0
0

Increasingly American politics are driven by generational change. The election of Donald Trump was not just a triumph of whiter, heartland America. It also confirmed the still considerable voting power of the older generation. Yet over time, as those of us who have lived long enough well know, generations decline, and die off, and new ones ascend.

In this past election, those over 45 strongly favored Trump, while those younger than that cast their ballots for Clinton. Trump’s improbable victory, and the more significant GOP sweep across the country, demonstrated that the much-ballyhooed millennials simply are not yet sufficiently numerous or united enough to overcome the votes of the older generations.

Yet over time, the millennials—arguably the most progressive generation since the ’30s—could drive our politics not only leftward, but towards an increasingly socialist reality, overturning many of the very things that long have defined American life. This could presage a war of generations over everything from social mores to economics and could well define our politics for the next decade. 

To best understand the battle lines, you must know the generations and their differences, and where they will leave this increasingly fractured republic.

The Greatest Generation

The last “civic generation” before the advent of the millennials—a term coined by generational theorists Neil Howe and William Strauss—was forged in the Depression, fought the Second World War, and managed the ensuing cold conflict with the old USSR. Born between 1901 and 1927, members of the much admired ++“greatest generation” were civic minded, embracing the idea that government provided an ideal mechanism to address the nation’s problems.

Like the millennials, who also follow this civic impulse, this generation was decisively Democratic. They are also, sadly, dying out, with the last remnants now in their 80s and 90s. According to generational analysts Morley Winograd and Michael Hais, this group was the only generation, besides the then small cadre of voting age millennials, to support John Kerry in 2004.  

Under two million in 2010, per the Census, their numbers have dwindled to 750,000. Yet even so, as recently as 2014 , the remnants of the “greatest generation,” according to Pew, still favored the Democrats by 7 percentage points. Even fewer will be around in 2020 but those who remain may well remain liberal. It’s no sample, but my 93-year-old mother holds to pattern. Brought up poor in the Brownsville section of Brooklyn, she voted for the oldest and most left leaning major candidate—Bernie Sanders—in the primary and then cast her ballot for Hillary.

The Silent Generation Slow to fade

The “silent generation,” born between 1925 and 1942, mostly came of age in the conservative ’50s. These products of the Eisenhower era have been the prime beneficiaries of the sustained boom that took root between the end of the Second World War and the ’70s. As a result, they continue to hold a big share of America’s wealth—roughly 33 percent –even as they enter their seventies and eighties.

Given their embrace of the normative social values of their era, and their wealth, it’s not surprising that the silents have tended to the right. These older voters went for Trump by a significant margin, and overall, note Winograd and Hais, 53 percent lean to the Republicans, compared to just 40 percent who lean Democratic.

It would be a mistake to dismiss the silents before their time, as Democratic theorists sometimes seem to do. They still number upward of 29 million, and more than forty members of Congress hail from this generation, including, ironically, much of the  Democratic leadership. Given their extended longevity, particularly among those in the upper middle class, they may remain influential well into the next decade.

Boomers: For Now, the Power Generation

The largest generation in American history before the millennials, the Baby Boomers were born between 1943 and 1960 and they remain the power generation. After all, both presidential candidates last year were clearly Boomers, with sufficient evidence of the narcissism that defines this generation. They also predominate in Congress, with 270 members, roughly half the total, in 2016. Hais estimates that they number between 75 and 82 million strong. 

Ever since the turbulence of the ’60s, the Boomers have been sharply divided. Peace protests, psychedelics, and Woodstock defined only a part of that generation. Indeed, rather than tending to the left, the Boomers over time have slowly moved to the right. In 1992, note Winograd and Hais, they leaned 49 to 42 percent Democratic; last year, they leaned 49 to 45 Republican. Overall, Boomers supported Donald Trump by a narrow margin.

In the future, economics more than culture may define Boomer politics. Somewhat more socially liberal than the silent generation before them, they control a dominant share of the nation’s wealth—some 50 percent—and according to a recent Deloitte study will still control about 45 percent well into their seventies and eighties. This may make them naturally suspicious of the redistributionist agenda of the left Democrats, since this would naturally come from their wealth. They will also have to resist attempts by GOP reformers like Paul Ryan to meddle with Medicare, social security, and, for some, pensions. One reason Trump won over these voters—both in the primary and the general election—was by promising not to touch these holy of holies.

Xers: Long-time outsiders but soon the next power generation

Smaller than the boomers, and generally less privileged, the X generation—born between 1965 and 1981—gets short shrift among advertisers as well in the media, but seem poised to take power by the end of the decade. Numbering more than 65 million, they are a smaller generation than the boomers but they are slowly gaining control of politics, with 117 members in Congress compared to just five for millennials. They already dominate the leadership of the GOP. Paul Ryan is their poster boy.

Today, the Xers, many already in their fifties, have only 14 percent of the nation’s wealth, a relative pittance compared to the boomers. But by 2030, as the boomers finally start to fade from the picture, Xers should account for 31 percent of the nation’s wealth, twice the percentage for the millennials. Critically, the heads of most companies backed by venture capital come from this generation, according to the Harvard Business Review. Raised largely during the neo-conservative heyday of Reagan, George H.W. Bush, and Bill Clinton, Xers also dominate the ranks of managers at major companies.

Yet at the same time, they have faced a rockier economic ride than the boomers, suffering particularly in the 2007 housing crash. The percentage of Xers who own their own homes dropped far more precipitously compared to the more entrenched Boomers The impact was particularly tough on younger Xers, who often got into the market around the housing bust.

Millennials: The Red Generation?

The long-term hopes of the American left lie with the millennial generation. The roughly 90 million Americans born between 1984 and 2004 seem susceptible to the quasi socialist ideology of the post-Obama Democratic Party. They are also far more liberal on key social issues—gender and gay rights, immigration, marijuana legalization—than any previous generation. They comprise the most diverse adult generation in American history: some 40 percent of millennials come from minority groups, compared to some 30 percent for boomers and less than 20 percent for the silent and the greatest generations.

Millennials’ defining political trait is their embrace of activist government. Some 54 percent of millennials, notes Pew, favor a larger government, compared to only 39 percent of older generations. One reason: Millennials face the worst economic circumstances of any generation since the Depression, including daunting challenges to home ownership. More than other generations, they have less reason to be enamored with capitalism.

These economic realities, along with the progressive social views, has affected their voting behavior. Millennials have voted decisively Democratic since they started going to the polls, with 60 percent leaning that direction in 2012 and 55 percent last year. They helped push President Obama over the top, and Hillary Clinton got the bulk of their votes last year. But their clear favorite last year was self-described socialist Bernie Sanders, who drew more far millennial votes in the primaries than Clinton and Trump combined.

The West is red, too? Maybe, maybe not.

Roughly half of Millennials  have positive feelings about socialism, twice the rate of the previous generation. Indeed, despite talk about a dictatorial Trump and his deplorables, the Democratic-leaning Millennials are more likely to embrace limits on free speech and are far less committed to constitutional democracy than their elders. Some 40 percent, notes Pew, favor limiting speech deemed offensive to minorities, well above the 27 percent among the Xers, 24 among the boomers, and only 12 percent among silents. They are also far more likely to be dismissive about basic constitutional civil rights, and are even more accepting of a military coup than previous generations.

Millennials clearly have not been well-schooled by the founders’ vision. This could augur a grim prospect, a kind of voluntary 1984 with cellphones and social media. Potential economic conflicts between millennials and boomers and Xers for scarce resources could accelerate support for a federally mandated agenda of redistribution. After all, if they have little money, own even less and have modest prospects for achieving what their parents did, why not socialism, constitutional norms be damned?

Yet this future is not guaranteed. Already white Millennials, still 60 percent of the total youth electorate (less than the 73 Anglo share among older voters but still a large bloc), show signs of moving to the right, particularly outside the coasts. Overall, they backed Trump by 48 to 43 percent and, notes one recent Tufts University survey, they were more enthusiastic about their candidate than were the Clinton backers.

Other factors could slow the lurch to the left. There is a growing interest in third party politics, not so much Green but libertarian; 8 percent of Millennials voted for Third Party candidates, twice the overall rate. Overall, Tufts finds that moderates slightly outpace liberals, although conservatives remain well behind. Millennials, note Winograd and Hais, also dislike “top down” solutions and may favor radical action primarily at the local level and more akin to Scandinavia than Stalinism. 

As Millennials grow up, start families, look to buy houses, and, worst of all, start paying taxes, they may shift to the center, much as the Boomers did before them. Redistribution, notes a recent Reason survey, becomes less attractive as incomes grow to $60,000 annually and beyond. This process could push them somewhat right-ward, particularly as they move from the leftist hothouses of the urban core to the more contestable suburbs.

Yet even given these factors, Republicans have their work cut out for them as the generational wheel turns. Certainly, to be remotely competitive, they must abandon socially conservative ideas that offend most Millennials. The GOP’s best chance lies with making capitalism work for this group, sustaining upward mobility and expanding property ownership. If we see the creation of a vast generation of property serfs with little opportunity for advancement, America’s future is almost certain to be redder, a lot less   market-oriented, and perhaps a lot more authoritarian than previous generations have ever contemplated.

This piece first appeared in The Daily Beast.

Joel Kotkin is executive editor of NewGeography.com. He is the Roger Hobbs Distinguished Fellow in Urban Studies at Chapman University and executive director of the Houston-based Center for Opportunity Urbanism. His newest book The Human City: Urbanism for the rest of us, was published in April by Agate. He is also author of The New Class ConflictThe City: A Global History, and The Next Hundred Million: America in 2050. He lives in Orange County, CA.

Unemployed photo by BigStockPhoto.com.

Neo-Stalinists versus the Sons of Anarchy

$
0
0

In one of the great scenes from the movie “Dr. Zhivago,” based on the novel by Soviet author Boris Pasternak, a young Bolshevik commander explains to the idealistic physician that “the private life is done in Russia. History has killed it.”

In America today, it also seems increasingly impossible to separate personal life from the political. In awards shows, sports broadcasts and fashion runways — which once provided escapes from politics — we find endless passionate anti-Trump protests and denunciations. Even corporations, like Under Armour, have faced opprobrium — and even boycotts — for daring to support Trump. Nordstrom faced a possible boycott for carrying a now-canceled fashion line of his daughter, Ivanka.

In contrast, the GOP, once a smooth-running machine, has become something akin to the motorcycle gang from the TV series “Sons of Anarchy.” Led by a screwball president, its partisans often at odds with each other, they have so far demonstrated some stupefying incompetence, not to mention a lack of policy coherence. If enforced and overwrought unanimity is the disease of today’s Democrats, chaos threatens to be the new GOP curse.

The new cadre party

Joseph Stalin, the dominant figure of the Soviet era, understood keenly the role of culture in politics. He once called writers “the engineers of the soul.” He would find some kindred spirits in today’s progressive cultural warriors who dominate the arts. Most of the media, outside of the Murdoch empire, have been, in the words of the Baltimore Sun’s David Zurawik, “flipping out,” losing any tie to the tradition of impartiality. Attempts to silence pro-Trump, or simply too obstreperously right-wing, supporters are also gaining currency on the progressive-controlled social media.

Conservatives are regularly harassed and prevented from speaking on college campuses. Celebrities and law professors have even praised the idea of a coup, although it’s pretty clear who would have the guns on their side. But what they lack in firepower they have made up for with impressive organization. There has been little “spontaneous” about some of the various demonstrations that, as the Daily Beast recently reported, are produced by well-organized, and well-funded, cadres.

The dominant groupthink of our cultural and intellectual classes increasingly runs through the bloodstream of the Democratic Party. Once a broad coalition of regional, economic and ethnic interests, the Democrats, as Will Rogers once quipped, were not an “organized party,” but rather a motley assemblage of interests.

Enforced by the notion of “intersectionality,” activists are compelled to embrace every permutation of the politically correct ideology. Increasingly, no self-respecting Democrat can dissent on issues ranging from climate change policy to “Black Lives Matter,” an “open borders” immigration policy, transgender rights or income redistribution. The threat to the last remaining moderate Democrats, such as West Virginia Sen. Joe Manchin, seems to be of little concern; orthodoxy, if you will, trumps efficacy.

Read the entire piece at The Orange County Register.

Joel Kotkin is executive editor of NewGeography.com. He is the Roger Hobbs Distinguished Fellow in Urban Studies at Chapman University and executive director of the Houston-based Center for Opportunity Urbanism. His newest book, The Human City: Urbanism for the rest of us, was published in April by Agate. He is also author of The New Class ConflictThe City: A Global History, and The Next Hundred Million: America in 2050. He lives in Orange County, CA.

Photo: James Willamor, Creative Commons


The Midwest, Redefined

$
0
0

What if the region we broadly understand as the Midwest, stretching from the foothills of the Alleghenies to the high plains, and from the chilly northern Great Lakes to the Ohio, Mississippi and Missouri river valleys, had been allowed to develop as organically as its eastern and southern -- and even western -- neighbors?  

If it had, it would be far better understood, have a much stronger cultural clarity, and more recognized for its contributions to American society and economy.

Here's what I mean.  The north central region of the U.S. has been an American paradox since its founding.  Unlike other regions of the country, where a critical mass of settlers established a colony or territory and then pursued legitimacy, the core of the region had its territorial boundaries established long before settlers had a chance to make a major imprint on the land.  That set off a race for control of the region by two already established regions, New England and Appalachia, with vastly different motivations -- and cultural mores.  Because they came from different places, they took different paths to the Midwest.  New Englanders came via the Erie Canal and Great Lakes, while Appalachians traveled northward across the Ohio River.  Rather than intermingle and create a new and blended society, the New Englanders and Appalachians tended to maintain their local strongholds, with New Englanders in larger Great Lakes cities, and Appalachians in the upper regions of the Ohio Valley.  And this happened without any reconsideration or adjustment of political boundaries in the Midwest's early days. 

This has hampered our understanding of the Midwest ever since.

Here's a thought experiment.  Let's say that instead of New York expanding to the shores of Lake Ontario and Lake Erie because it wanted to control development of the Erie Canal, western New Yorkers fought to establish their own state.  Similarly, let's say that early settlers of western Pennsylvania recognized their remoteness from Harrisburg and Philadelphia, and decided local control suited them, too.  And let's further suggest that, instead of becoming part of Ohio, the Connecticut Western Reserve was also allowed to develop as a separate state as well. 

Ultimately, it's conceivable that a new map of the Midwest, one that matches more closely to actual American settlement patterns, might look something like this:

In my mind, as many as six new states could have emerged.  Western New York could've become Niagara, with Buffalo and Rochester as its key metropolises.  Western Pennsylvania could've become Allegheny, centered on Pittsburgh and Erie.  The Connecticut Western Reserve could've become Erie (or Cuyahoga?), greater Chicago could've been recognized as its own state, and the upper parts of Michigan, Wisconsin and Minnesota could've become Superior.  The southern part of Missouri could've become Ozark.

The benefit of this is that the political environment aligns with the settlement patterns and modern-day networks of the region.  I've made similar points before about the cultural geography of the Midwest.  I think that because two different cultural groups inhabited the same space without ever effectively coming together, they've never maximized the development potential within either.  Yes, the Midwest was the nation's manufacturing center for much of the 20th century, but it could be argued that it often did so in spite of rural and agricultural interests that were strong in state capitals like Columbus, Indianapolis and Springfield.  When manufacturing faded, those same interests often promoted the development of cities within their regions that were less tainted by a manufacturing legacy.

Two years ago, I noted that, irrespective of state boundaries, the Midwest was somewhat aligned like this:

And yet, the tension that was evident two centuries ago continues today.  For my "Five Midwests' series, I quoted a passage from James McPherson's book about the Civil War entitled Battle Cry of Freedom, in which he noted the economic, social and cultural differences between the Hoosiers, Buckeyes and Butternuts of the Ohio Valley, and the Yankees of the Great Lakes.  Today, geographers can track and map broad travel and commuting patterns that illustrate how we're connected as a nation, and find those patterns still exist:

"Danville, in central Illinois, is more closely connected to Des Moines, which is hundreds of miles away in Iowa, than it is to Chicago, which is much closer and in the same state.

That’s not necessarily because there are tons of Danville commuters trekking to Des Moines. Rather, Nelson and Rae’s methodology shows they are both more tightly linked to the necklace of cities in between them—Urbana, Bloomington, Peoria, etc.—than they are to the cities that fall outside the entire zone."

Welcome to the characteristic that keeps the Midwest from being well understood as a region.

Pete Saunders is a Detroit native who has worked as a public and private sector urban planner in the Chicago area for more than twenty years.  He is also the author of "The Corner Side Yard," an urban planning blog that focuses on the redevelopment and revitalization of Rust Belt cities.

The Economic Implications of Housing Supply

$
0
0

A new paper with the above title by urban economists Edward Glaeser and Joseph Gyourko provides more evidence to back up the Antiplanner’s recent paper on the New Feudalism. One of the major points of that paper was that the Obama administration’s plan to force suburbs to relax zoning codes to allow higher density housing is not the solution to housing affordability problems.

Glaeser and Gyourko point out that housing is affordable in most of the country despite zoning. In some parts of the country, however, “property rights have essentially been reassigned from existing land owners to wider communities, which have chosen to substantially reduce the amount of new building.” The result is that the supply curve for housing, which is nearly horizontal (meaning changes in demand have little effect on prices) in communities with traditional zoning, becomes very steep in the overly regulated communities (meaning small changes in demand can result in large changes in prices, i.e., prices will be more volatile).

Glaser & Gyourko make one interesting point that I had not raised. One of the impediments to housing production in California is a state environmental quality act that requires developers to assess the local environmental impacts of new housing. The result is that little new housing has been built in California, forcing people to move to places like Arizona and Texas. But California’s temperate climate means that greenhouse gas emissions there are far lower than in interior states. “If California’s restrictions induce more building in Texas and Arizona, which require far more artificial cooling,” says the paper, “then their net environmental [effects] could be negative in aggregate.”

The New York Timesreported on the paper, but I think the writer misstates one of the main points. Instead of viewing homes as an investment, suggested the reporter, Americans should view them as consumer goods and accept that prices will fall. Americans need to “open our eyes to the negatives of the national obsession of owning a home, expecting its value to rise, and using the levers of local government to keep neighborhoods as they are,” says the Times.

Yet homeownership isn’t an “obsession”; it is a natural, worldwide desire to have a predictable, stable home life. Nor does “using the levers of local government to keep neighborhoods as they are” make housing unaffordable: instead, it is using the levers of state or regional government to keep rural areas as they are. While the Antiplanner prefers the Houston model of deed restrictions over zoning, city zoning really isn’t a major problem for affordability so long as there is plenty of unzoned land outside the cities.

In such areas, people don’t buy homes expecting to get rich from rising prices. But they do see the equity they build in their homes as a store of wealth that they can borrow against to start small businesses, put their children through college, or retire on.

The one thing missing from the Glaeser/Gyourko paper and the Times article is a way out of the housing affordability mess. Glaeser/Gyourko suggest a federal program of building large numbers of homes in unaffordable areas, but considering the kind of homes federal bureaucrats are likely to build, this is likely to do more harm than good. The Times falls back on the Obama solution of building higher densities, but that’s not how most Americans want to live, and it seems silly to demand higher densities in states like California and Oregon that are at least 95 percent rural. The best solution to the conundrum, the Antiplanner has suggested, is through the courts, not legislation.

Randal O’Toole is a senior fellow with the Cato Institute specializing in land use and transportation policy. He has written several books demonstrating the futility of government planning. Prior to working for Cato, he taught environmental economics at Yale, UC Berkeley, and Utah State University.

Dallas-Fort Worth & Dayton: World Large City Least Congestion: 2017 Tom Tom Traffic Index

$
0
0

Dallas-Fort Worth and Dayton Ohio have the least t traffic congestion among larger cities (urban areas) in the world, according to the 2017 Tom Tom Traffic Index. Dallas-Fort Worth had the shortest average all day delay, at 18 percent of the 43 cities with more than 5 million population. Dallas-Fort Worth also had the least average peak period traffic delay. This is the second year in a row the Dallas Fort Worth has had the best all day traffic congestion. Dayton had the best all day and average peak hour congestion among the 146 cities with between 800,000 and 5,000,000 population and tied with three others for the best in among all cities the least all-day congestion.

All City Rankings

Among all city sizes, Syracuse (NY), Greensboro (NC), Winston-Salem (NC) and Dayton had the best all day traffic, with a nine percent average delay. Cadiz, Spain had the best average peak hour congestion, with an 11.5 percent delay.

Mexico City had the most intense all day congestion, at 66 percent, followed closely by Bangkok at 61 percent. Other cities with the most congestion include, not surprisingly, Chongqing, Jakarta, Istanbul and Beijing. All have large populations, high densities and millions of cars. A real surprise, however is Lodz, Poland, with a population of less than 750,000, which has the fourth worst congestion (Figure 1)

Bangkok ranked the most congested city, in the AM and PM peak periods, with an average traffic delay of 104.5 percent. This means that it takes twice as long in Bangkok to make a trip as it would if traffic flowed freely. Mexico City had the second largest delay at 98.5 percent, followed by Bucharest (Romania) at 94.0 percent. Bucharest   heavy traffic congestion surprises, since it has, at best, only one-fifth the population of the largest seven most congested cities. Even more surprising is that much smaller Belfast is the sixth most congested, while Dublin, smaller than Bucharest, ranks seventh (Figure 2).

Cities Over 5,000,000 Population

Out of the 43 cities with more than 5 million population, three US cities (Philadelphia, Houston and Chicago) and Madrid join Dallas-Fort Worth in having the least all-day traffic congestion. The five cities with the most traffic congestion are Mexico City, Chongqing, Jakarta and Istanbul (Figure 3).

Three of the cities with the least average peak congestion are in the United States, including Dallas-Fort Worth, second-ranked Philadelphia and fourth-ranked Chicago. Madrid, again makes the top five in third position, while Sao Paulo ranks fifth (Figure 4). The Chinese cities of Quangzhou and Suzhou rank surprisingly well, in view of the national traffic congestion level (Table), at 6th and 9th least congested.


Cities with 800,000 to 5,000,000 Population

All 10 of the least congested cities between 800,000 and 5 million population all day are in the United States. The least congested are Dayton, Knoxville, Richmond, Omaha and Indianapolis, in a fifth-place tie with Kansas City.

Bucharest had the most all day congestion, followed by Tiainan, Changsha, Shijazhuang and Kaohsiung  (Figure 5).

The eight least congested cities between 800,000 and 5 million population during peak periods are located in the United States, led by Dayton, Knoxville, Richmond, Tulsa, Worcester and Kansas City.

The greatest traffic congestion in this population category is in Bucharest, which is followed by Shijiazhuang, Changsha, Auckland and Zhuhai (Figure 6).

Cities with Less than 800,000 Population

The four cities with less than 800,000 population and the least all-day traffic congestion are in the United States, Winston-Salem (NC), Syracuse (NY), Greensboro (NC) and Akron (OH). The fifth best traffic congestion is in Ljubljiana, the capital of Slovenia.

The worst all day traffic congestion in this category is in already cited Lodz and Dublin, as well as Palermo, Belfast, Lublin (Poland) and Edinburgh (Figure 7).

Cadiz, Spain has the least peak period congestion in this population category, followed by four US cities, Syracuse, Greensboro, Akron and Winston-Salem.

The greatest average peak period congestion in the below 800,000 population category was in Belfast, followed by Dublin, Lodz, Wellington (NZ) and Edinburgh.


Traffic Congestion by Country and Geography

Among the nations, the US has the overall least traffic congestion, with a delay rate of 19.3 percent in all day congestion, followed by the Netherlands and Spain. The US leads in two population categories, 800,000 to 5,000,000 and under 800,000. Spain has the least over 5,000,000 congestion, where Madrid exhibits the impacts of its strong motorway system.

East Asian cities have the greatest all-day traffic congestion, at 41.1 percent, though among the largest cities Latin America has have most congestion.

In average peak period congestion, Spain shows the best results, with a delay rate of 29.0 percent, followed by the United States and the Middle-East. Spain leads in the over 5,000,000 category, Turkey in the 800,000 to 5,000,000 category and the United States in the under 800,000 category.

East Asian cities also have the greatest average peak period congestion, at  67.3 percent. Among the largest cities, congestion is greatest in the Eastern European cities outside Poland and Turkey (Table).

The Importance of Traffic Indexes

Cities are more productive if they facilitate greater access throughout their urbanization, especially for work trips, as Remy Prud’homme and Chang-Woon Lee at the University of Paris and David Hartgen and M. Gregory Fields of the University of North Carolina, Charlotte have shown. Traffic indexes provide important metrics to aid city officials in “keeping the traffic moving,” which is essential in the modern metropolitan area. Significantly, worldwide traffic indexes are covering more cities. This year’s Tom Tom Traffic Index added important cities like Jakarta, Hong Kong, Buenos Aires, Santiago de Chile, and Kuala Lumpur, bringing the total to 390. Today’s policy makers have far more information on which to evaluate transport investments than ever before.


Table
Summary of Traffic Congestion by Geography
ALL DAY CONGESTIONAVERAGE AM-PM CONGESTION 
Country/GeographyOver 5 Million800,000-5 MillionUnder 800,000AllOver 5 Million800,000-5 MillionUnder 800,000AllCount by Population Category
ASIA         
China39.7%36.3% 38.5%67.2%66.6% 67.0%15, 8, 0
East Asia: Other43.0%38.8% 41.1%75.5%57.1% 67.3%5, 4, 0
Middle-East\ 26.2% 26.2% 35.6% 35.6%0, 5, 0
EUROPE         
France38.0%30.3%23.5%24.9%67.0%57.0%42.0%44.8%1, 3, 21
Germany 28.3%24.5%25.6% 47.6%39.9%42.0%0, 7, 18
Italy30.0%32.7%23.8%25.1%57.5%56.5%37.7%40.8%1, 3, 21
Netherlands  19.5%19.5%  37.2%37.2%0, 0, 16
Spain25.0%27.0%20.3%21.0%45.5%41.5%27.1%29.0%1, 2, 22
United Kingdom40.0%30.2%29.7%30.2%66.0%55.7%55.8%56.2%1, 6, 18
Western Europe: Other 29.3%24.2%25.1% 52.8%42.1%44.1%0, 9, 38
Poland 27.0%32.7%31.8% 48.3%53.0%52.2%0, 2, 10
Turkey49.0%26.0% 28.3%77.0%34.0% 38.3%1, 9, 0
Eastern Europe: Other42.5%31.6%21.1%27.9%80.0%61.1%43.9%55.3%2, 7, 8
NORTH AMERICA         
Canada30.0%27.2%21.3%24.5%56.0%46.8%38.1%43.2%1, 5, 6
United States28.6%18.5%15.0%19.3%52.7%34.6%24.2%35.5%9, 62, 9
AUSTRALASIA         
Australia  24.2%27.5% 50.7%38.5%44.6%0, 5, 5
New Zealand 38.0%28.2%29.8% 74.5%47.9%52.3%0, 1, 5
OTHER         
Latin America44.6%29.1% 35.6%72.9%51.1% 60.2%5, 7, 0
South Africa30.0%35.0%23.8%26.7%61.0%71.0%44.9%51.9%1, 1, 4

Wendell Cox is principal of Demographia, an international public policy and demographics firm. He is a Senior Fellow of the Center for Opportunity Urbanism (US), Senior Fellow for Housing Affordability and Municipal Policy for the Frontier Centre for Public Policy (Canada), and a member of the Board of Advisors of the Center for Demographics and Policy at Chapman University (California). He is co-author of the "Demographia International Housing Affordability Survey" and author of "Demographia World Urban Areas" and "War on the Dream: How Anti-Sprawl Policy Threatens the Quality of Life." He was appointed to three terms on the Los Angeles County Transportation Commission, where he served with the leading city and county leadership as the only non-elected member. He served as a visiting professor at the Conservatoire National des Arts et Metiers, a national university in Paris.

Photo: A Bangkok freeway, by author

Automation, Artificial Intelligence, and Projectile Wooden Shoes

$
0
0

Sabotage has its root in the French word sabot, which is a kind of wooden shoe. In the early days of the Industrial Revolution craftsmen would throw their shoes into the gears of factory machines. Skilled labor was being replaced with mechanical production, undermining traditional professions, reducing incomes, and removing the social standing of workers. Wealth flowed up to the people who owned the factories and controlled the levers of political power. Sabotage was a form of negotiation. Industrial production was so incredibly efficient and profitable that the craft guilds had no chance of surviving over the long term. And since the cost of manufactured goods dropped like a stone with industrial processes society wasn’t inclined to turn back the clock. What unfolded over the course of a couple of centuries was a series of social, political, and economic convulsions including revolutions, wars, and mass migrations.

screen-shot-2017-02-14-at-8-09-03-am

screen-shot-2017-02-14-at-8-08-49-am

screen-shot-2017-02-14-at-8-09-20-am

I passed a construction site recently and saw this mobile surveillance pod. This is the beginning of the end of the night watchman. It’s part of the ever expanding panopticon of electronic monitors connected 24/7 to the cloud – complete with facial recognition software and the ability to cross reference an endless number of databases including everyone’s e-mails and geotagged cell phone records. Rent-a-cops are on the way out.

screen-shot-2017-02-18-at-8-29-21-pm

screen-shot-2017-02-18-at-8-30-14-pm

screen-shot-2017-02-18-at-8-29-42-pm

screen-shot-2017-02-18-at-8-30-03-pm

Think this is only a big city thing? Try rural Montana. Same same. The squad car parked on the side of the highway with a radar gun is about to fade away. A far more effective and lucrative series of electronic devices will instill discipline in drivers and generate passive municipal revenue instead. Did I mention aerial drones? First they’re used in Afghanistan. Then along the Mexican border. Then poor high crime neighborhoods. Then your quiet little cul-de-sac in Indiana or South Carolina… The code enforcement people are going to love it.

Screen Shot 2016-03-27 at 10.41.15 PM

Screen Shot 2016-03-27 at 10.41.39 PM

How much longer do you think it will be before long haul trucks are fully automated? Autonomous vehicles are cost cutting devices, not the latest upgrade for consumer convenience. What do you think will happen to all the roadside establishments that serve the needs of human truck drivers? Tick tock.

screen-shot-2017-02-07-at-6-24-10-pm

This is Google’s newest gadget. It’s comparable to Amazon’s Alexa and Apple’s Siri. Speak to these machines and they perk up. “Play Bohemian Rhapsody.” Or “Order four AA batteries.” Or “When is my next dentist appointment with Dr. Harris?” These devices search the internet and/or various personal files from your phone or computer and seamlessly give you what you want.

screen-shot-2017-02-18-at-6-20-32-pm

screen-shot-2017-02-18-at-6-20-54-pm

Think you’ll be spared because you’re an educated professional? It’s only a matter of time before more advanced versions of artificial intelligence replace an army of human workers in more skilled positions. Medical centers will swap out administrative staff for a suite of voice activated algorithms. Computer programs will eventually read X-Rays and MRI results and provide preliminary diagnoses. Secure pill dispensing machines are already the norm in many hospital pharmacies. Tech support and customer service jobs will disappear. Accountants and paralegals are on that same list. Think outsourcing overseas was a problem for the former middle class? Think illegal immigrants drove down wages? Wait for what’s coming next.

screen-shot-2017-02-11-at-5-26-33-am

screen-shot-2017-02-11-at-5-24-40-am

screen-shot-2017-02-11-at-5-23-25-am

screen-shot-2017-02-11-at-5-25-55-am

screen-shot-2017-02-11-at-5-25-03-am

Here’s a common sight in Silicon Valley. Colonies of second hand RVs parked between a Burger King and a freeway off ramp are occupied by people who have no better option. The middle class tends to write off such populations as alcoholic schizophrenics. I interact with these folks on a regular basis and most have jobs. Some have two or three. They’re adamant that they did nothing wrong, but the larger society has simply discarded them. The median home price in San Jose is $1,085,000. Median rent for a studio apartment is $2,120. Moving to a “cheaper” place like Oakland is no longer an option. Two bedroom apartments there now rent for $3,500 – assuming you can find a vacancy. The minimum wage in these communities ranges between $10.30 and $15 an hour. The numbers don’t add up. There are an awful lot of these homeless camps everywhere these days. This is what a bifurcated economy looks like.

A friend asked me to write about a possible Minimum Guaranteed Income. The concept is simple enough. If an individual or household earns less than a certain amount of money the government will fill the gap with a cash payment. I remember my social studies teacher talking about a “negative income tax” back in the 1970’s so this isn’t a new idea.

My response was short and to the point. Not going to happen. Americans reject wealth transfers and chafe at any hint of “social engineering.” Anti-poverty programs are so deeply unpopular that a Minimum Guaranteed Income is a non-starter. And resistance is strongest from the people who would most benefit – the marginal declining middle class.

The usual solutions aren’t going to work either. Dramatically raising the minimum wage will only encourage more employers to automate more agressively to squeeze labor out of their business models. Jacking up taxes will drive jobs and people out of the state (a process that is already well under way.) Building subsidized housing won’t scale up and is politically toxic. Rent control keeps some people in artificially affordable housing at the expense of their landlords, but does nothing to create new housing – quite the opposite. Reducing regulations and eliminating onerous bureaucracies is structurally impossible since the agencies that administer existing programs are a lot more powerful than the people they’re meant to serve. Moving to Texas works for people who already have a toehold in the middle class, but for those with less skills and no money life in Houston is merely slightly less miserable. The list goes on…

screen-shot-2017-02-20-at-3-25-18-am

screen-shot-2017-02-20-at-3-25-08-am

screen-shot-2017-02-20-at-3-36-01-am

Screen Shot 2016-02-04 at 7.58.45 PM

My best guess is we’ll see the implementation of policies that achieve similar goals to a Minimum Guaranteed Income by other means. But they’ll need to be in keeping with the dominant cultural narrative: The Puritan Work Ethic. If you don’t work, you don’t eat. And they’ll have to be designed to filter out people who are deemed unworthy of inclusion. That’s been the pattern for centuries. The military is the primary model. Cradle to grave socialism is perfectly acceptable – often eagerly embraced – by American society if the wealth transfer is to people who are believed to be deserving. The militarization of domestic affairs is a distinct possibility.

screen-shot-2016-10-12-at-9-23-39-am

screen-shot-2016-10-12-at-9-49-12-am

Massive infrastructure building projects are another viable option for employing large numbers of low skill workers. The cost, productive capacity, or return on investment of such projects is essentially irrelevant. Project funding will be allocated by a political process that prioritizes select populations in particular locations. This preserves the existing vested interests – a combination of corporations and big government. Republican. Democrat. Conservative. Liberal. It doesn’t matter. The goal is to allow business-as-usual to limp along for a while longer while mollifying the displaced population. This will work until the feds can no longer borrow and print money. The alternative is a Soviet Union style collapse.

John Sanphillippo lives in San Francisco and blogs about urbanism, adaptation, and resilience at granolashotgun.com. He's a member of the Congress for New Urbanism, films videos for faircompanies.com, and is a regular contributor to Strongtowns.org. He earns his living by buying, renovating, and renting undervalued properties in places that have good long term prospects. He is a graduate of Rutgers University.

All photos by Johnny Sanphillippo

The True Legacy of Gov. Jerry Brown

$
0
0

The cracks in the 50-year-old Oroville Dam, and the massive spillage and massive evacuations that followed, shed light on the true legacy of Jerry Brown. The governor, most recently in Newsweek, has cast himself as both the Subcomandante Zero of the anti-Trump resistance and savior of the planet. But when Brown finally departs Sacramento next year, he will be leaving behind a state that is in danger of falling apart both physically and socially.

Jerry Brown’s California suffers the nation’s highest housing prices, largest percentage of people in or near poverty of any state and an exodus of middle-income, middle-aged people. Job growth is increasingly concentrated in low-wage sectors. By contrast, Brown’s father, Pat, notes his biographer, Ethan Rarick, helped make the 20th century “The California Century,” with our state providing “the template of American life.” There was then an “American Dream” across the nation, but here we called it the “California Dream.” His son is driving a stake through the heart of that very California Dream.

California crumbling

Nothing so illustrates the gap between the two Browns than infrastructure spending. Oroville Dam’s delayed maintenance, coupled with a lack of major new water storage facilities to serve a growing population, reflects a pattern of neglect. Just this year alone, the massive water losses at Oroville Dam and other storage overflows have almost certainly offset a significant portion of the hard-won drought water savings achieved by our state’s cities. A sensible state policy would have stored more water from before the drought, and would now be maximizing the current bounty.

Once a national and global leader in infrastructure, according to a report last year by the Center for Budget and Policy Priorities, California now spends the least percentage of its state budget on infrastructure of any state. In the critical Sacramento-San Francisco Delta, an ancient levee and dike system is decaying, and ever more stringent environmental regulations limit key state and federal water facility operations. To be sure, Brown has supported a “water fix” — a dual tunnel through the Delta — to address some of these problems, but his efforts have only produced a mountain of paper, rather than real-world improvements. In terms of preparing for the future, California’s current penchant for endless studies and environmental hand-wringing is fostering pre-Katrina Louisiana conditions, rather than the forward-looking capital investments previously the state’s hallmark.

This piece first appeared in The Orange County Register.

Joel Kotkin is executive editor of NewGeography.com. He is the Roger Hobbs Distinguished Fellow in Urban Studies at Chapman University and executive director of the Houston-based Center for Opportunity Urbanism. His newest book, The Human City: Urbanism for the rest of us, was published in April by Agate. He is also author of The New Class ConflictThe City: A Global History, and The Next Hundred Million: America in 2050. He lives in Orange County, CA.

Photo: Troy Holden

Viewing all 3792 articles
Browse latest View live


Latest Images