10,000 years ago San Francisco Bay was a dry grassy valley populated by elephants, zebras, and camels. The planet was significantly cooler and dryer back then. Sea level was lower since glaciers in the north pulled water out of the oceans. The bay isn’t that deep so a relatively small change in sea level pushed the coastline out by twelve miles from its present location. Further back in pre-history when the earth was warmer than today sea level was higher. The hills of San Francisco were small islands off the coast of ancient California.
 https://granolashotgun.files.wordpress.com/2017/01/screen-shot-2017-01-1... 150w, https://granolashotgun.files.wordpress.com/2017/01/screen-shot-2017-01-1... 300w, https://granolashotgun.files.wordpress.com/2017/01/screen-shot-2017-01-1... 768w, https://granolashotgun.files.wordpress.com/2017/01/screen-shot-2017-01-1... 1716w" sizes="(max-width: 1024px) 100vw, 1024px">
 https://granolashotgun.files.wordpress.com/2017/01/screen-shot-2017-01-1... 150w, https://granolashotgun.files.wordpress.com/2017/01/screen-shot-2017-01-1... 300w, https://granolashotgun.files.wordpress.com/2017/01/screen-shot-2017-01-1... 768w, https://granolashotgun.files.wordpress.com/2017/01/screen-shot-2017-01-1... 1717w" sizes="(max-width: 1024px) 100vw, 1024px">
 https://granolashotgun.files.wordpress.com/2017/01/screen-shot-2017-01-1... 150w, https://granolashotgun.files.wordpress.com/2017/01/screen-shot-2017-01-1... 300w, https://granolashotgun.files.wordpress.com/2017/01/screen-shot-2017-01-1... 768w, https://granolashotgun.files.wordpress.com/2017/01/screen-shot-2017-01-1... 1716w" sizes="(max-width: 1024px) 100vw, 1024px">
10,000 years ago San Francisco Bay was a dry grassy valley populated by elephants, zebras, and camels. The planet was significantly cooler and dryer back then. Sea level was lower since glaciers in the north pulled water out of the oceans. The bay isn’t that deep so a relatively small change in sea level pushed the coastline out by twelve miles from its present location. Further back in pre-history when the earth was warmer than today sea level was higher. The hills of San Francisco were small islands off the coast of ancient California. These cycles play out on a scale we humans can’t perceive in our daily lives. You can think of this process as a larger version of the tides that play out over thousands of years instead of twice a day. There’s absolutely no need to debate human induced climate change. The climate changes all the time with or without us. The real question is how we will adapt over time.
 https://granolashotgun.files.wordpress.com/2017/01/screen-shot-2017-01-1... 150w, https://granolashotgun.files.wordpress.com/2017/01/screen-shot-2017-01-1... 300w, https://granolashotgun.files.wordpress.com/2017/01/screen-shot-2017-01-1... 768w, https://granolashotgun.files.wordpress.com/2017/01/screen-shot-2017-01-1... 1715w" sizes="(max-width: 1024px) 100vw, 1024px">
 https://granolashotgun.files.wordpress.com/2017/01/screen-shot-2017-01-1... 150w, https://granolashotgun.files.wordpress.com/2017/01/screen-shot-2017-01-1... 300w, https://granolashotgun.files.wordpress.com/2017/01/screen-shot-2017-01-1... 768w, https://granolashotgun.files.wordpress.com/2017/01/screen-shot-2017-01-1... 1716w" sizes="(max-width: 1024px) 100vw, 1024px">
 https://granolashotgun.files.wordpress.com/2017/01/screen-shot-2017-01-1... 150w, https://granolashotgun.files.wordpress.com/2017/01/screen-shot-2017-01-1... 300w, https://granolashotgun.files.wordpress.com/2017/01/screen-shot-2017-01-1... 768w, https://granolashotgun.files.wordpress.com/2017/01/screen-shot-2017-01-1... 1713w" sizes="(max-width: 1024px) 100vw, 1024px">
 https://granolashotgun.files.wordpress.com/2017/01/screen-shot-2017-01-1... 150w, https://granolashotgun.files.wordpress.com/2017/01/screen-shot-2017-01-1... 300w, https://granolashotgun.files.wordpress.com/2017/01/screen-shot-2017-01-1... 768w, https://granolashotgun.files.wordpress.com/2017/01/screen-shot-2017-01-1... 1714w" sizes="(max-width: 1024px) 100vw, 1024px">
In the last century the majority of what was once low lying wetlands around the bay were filled and built upon. Airports, shipping terminals, oil refineries, housing developments, and industrial parks are sitting on landfill just slightly above water.
 https://granolashotgun.files.wordpress.com/2017/01/screen-shot-2017-01-1... 150w, https://granolashotgun.files.wordpress.com/2017/01/screen-shot-2017-01-1... 300w, https://granolashotgun.files.wordpress.com/2017/01/screen-shot-2017-01-1... 768w, https://granolashotgun.files.wordpress.com/2017/01/screen-shot-2017-01-1... 1715w" sizes="(max-width: 1024px) 100vw, 1024px">
 https://granolashotgun.files.wordpress.com/2017/01/screen-shot-2017-01-1... 150w, https://granolashotgun.files.wordpress.com/2017/01/screen-shot-2017-01-1... 300w, https://granolashotgun.files.wordpress.com/2017/01/screen-shot-2017-01-1... 768w, https://granolashotgun.files.wordpress.com/2017/01/screen-shot-2017-01-1... 1716w" sizes="(max-width: 1024px) 100vw, 1024px">
 https://granolashotgun.files.wordpress.com/2017/01/screen-shot-2017-01-1... 150w, https://granolashotgun.files.wordpress.com/2017/01/screen-shot-2017-01-1... 300w, https://granolashotgun.files.wordpress.com/2017/01/screen-shot-2017-01-1... 768w, https://granolashotgun.files.wordpress.com/2017/01/screen-shot-2017-01-1... 1720w" sizes="(max-width: 1024px) 100vw, 1024px">
We just experienced a king tide. This is a naturally occurring cyclical event that happens whenever the earth, moon, and sun line up in a particular way to create a tide that’s about seven feet higher than usual. In this part of the world king tides tend to arrive a few times a year alongside heavy winter rains. The result is a submerged landscape that at a normal high tide in summer is actually dry land.
 https://granolashotgun.files.wordpress.com/2017/01/screen-shot-2017-01-1... 150w, https://granolashotgun.files.wordpress.com/2017/01/screen-shot-2017-01-1... 300w, https://granolashotgun.files.wordpress.com/2017/01/screen-shot-2017-01-1... 768w, https://granolashotgun.files.wordpress.com/2017/01/screen-shot-2017-01-1... 1718w" sizes="(max-width: 1024px) 100vw, 1024px">
 https://granolashotgun.files.wordpress.com/2017/01/screen-shot-2017-01-1... 150w, https://granolashotgun.files.wordpress.com/2017/01/screen-shot-2017-01-1... 300w, https://granolashotgun.files.wordpress.com/2017/01/screen-shot-2017-01-1... 768w, https://granolashotgun.files.wordpress.com/2017/01/screen-shot-2017-01-1... 1723w" sizes="(max-width: 1024px) 100vw, 1024px">
A significant amount of territory would be underwater in a king tide if it weren’t for extensive levees, drainage ditches, canals, and pumping stations that actively manage the hydrology of the built environment.
 https://granolashotgun.files.wordpress.com/2017/01/screen-shot-2017-01-1... 150w, https://granolashotgun.files.wordpress.com/2017/01/screen-shot-2017-01-1... 300w, https://granolashotgun.files.wordpress.com/2017/01/screen-shot-2017-01-1... 768w, https://granolashotgun.files.wordpress.com/2017/01/screen-shot-2017-01-1... 1722w" sizes="(max-width: 1024px) 100vw, 1024px">
 https://granolashotgun.files.wordpress.com/2017/01/screen-shot-2017-01-1... 150w, https://granolashotgun.files.wordpress.com/2017/01/screen-shot-2017-01-1... 300w, https://granolashotgun.files.wordpress.com/2017/01/screen-shot-2017-01-1... 768w, https://granolashotgun.files.wordpress.com/2017/01/screen-shot-2017-01-1... 1718w" sizes="(max-width: 1024px) 100vw, 1024px">
 https://granolashotgun.files.wordpress.com/2017/01/screen-shot-2017-01-1... 150w, https://granolashotgun.files.wordpress.com/2017/01/screen-shot-2017-01-1... 300w, https://granolashotgun.files.wordpress.com/2017/01/screen-shot-2017-01-1... 768w, https://granolashotgun.files.wordpress.com/2017/01/screen-shot-2017-01-1... 1721w" sizes="(max-width: 1024px) 100vw, 1024px">
 https://granolashotgun.files.wordpress.com/2017/01/screen-shot-2017-01-1... 150w, https://granolashotgun.files.wordpress.com/2017/01/screen-shot-2017-01-1... 300w, https://granolashotgun.files.wordpress.com/2017/01/screen-shot-2017-01-1... 768w, https://granolashotgun.files.wordpress.com/2017/01/screen-shot-2017-01-1... 1719w" sizes="(max-width: 1024px) 100vw, 1024px">
So far the engineered solutions are working to plan. But this stuff is expensive to build and maintain. If we skimp or take our eyes off the ball there’s a risk of a breach that would do serious damage to the affected areas. This is California’s version of New Orleans with the added feature of seismic activity to complicate matters.
 https://granolashotgun.files.wordpress.com/2017/01/screen-shot-2017-01-1... 150w, https://granolashotgun.files.wordpress.com/2017/01/screen-shot-2017-01-1... 300w, https://granolashotgun.files.wordpress.com/2017/01/screen-shot-2017-01-1... 768w, https://granolashotgun.files.wordpress.com/2017/01/screen-shot-2017-01-1... 1720w" sizes="(max-width: 1024px) 100vw, 1024px">
 https://granolashotgun.files.wordpress.com/2017/01/screen-shot-2017-01-1... 150w, https://granolashotgun.files.wordpress.com/2017/01/screen-shot-2017-01-1... 300w, https://granolashotgun.files.wordpress.com/2017/01/screen-shot-2017-01-1... 768w, https://granolashotgun.files.wordpress.com/2017/01/screen-shot-2017-01-1... 1722w" sizes="(max-width: 1024px) 100vw, 1024px">
 https://granolashotgun.files.wordpress.com/2017/01/screen-shot-2017-01-1... 150w, https://granolashotgun.files.wordpress.com/2017/01/screen-shot-2017-01-1... 300w, https://granolashotgun.files.wordpress.com/2017/01/screen-shot-2017-01-1... 768w, https://granolashotgun.files.wordpress.com/2017/01/screen-shot-2017-01-1... 1717w" sizes="(max-width: 1024px) 100vw, 1024px">
 https://granolashotgun.files.wordpress.com/2017/01/screen-shot-2017-01-1... 150w, https://granolashotgun.files.wordpress.com/2017/01/screen-shot-2017-01-1... 300w, https://granolashotgun.files.wordpress.com/2017/01/screen-shot-2017-01-1... 768w, https://granolashotgun.files.wordpress.com/2017/01/screen-shot-2017-01-1... 1720w" sizes="(max-width: 1024px) 100vw, 1024px">
 https://granolashotgun.files.wordpress.com/2017/01/screen-shot-2017-01-1... 150w, https://granolashotgun.files.wordpress.com/2017/01/screen-shot-2017-01-1... 300w, https://granolashotgun.files.wordpress.com/2017/01/screen-shot-2017-01-1... 768w, https://granolashotgun.files.wordpress.com/2017/01/screen-shot-2017-01-1... 1719w" sizes="(max-width: 1024px) 100vw, 1024px">
Last summer I was exploring the semi industrial neighborhoods around the airport just south of the city and found myself having a conversation with a hotel manager.
 https://granolashotgun.files.wordpress.com/2017/01/screen-shot-2017-01-1... 150w, https://granolashotgun.files.wordpress.com/2017/01/screen-shot-2017-01-1... 300w, https://granolashotgun.files.wordpress.com/2017/01/screen-shot-2017-01-1... 768w, https://granolashotgun.files.wordpress.com/2017/01/screen-shot-2017-01-1... 1720w" sizes="(max-width: 1024px) 100vw, 1024px">
 https://granolashotgun.files.wordpress.com/2017/01/screen-shot-2017-01-1... 150w, https://granolashotgun.files.wordpress.com/2017/01/screen-shot-2017-01-1... 300w, https://granolashotgun.files.wordpress.com/2017/01/screen-shot-2017-01-1... 768w, https://granolashotgun.files.wordpress.com/2017/01/screen-shot-2017-01-1... 1720w" sizes="(max-width: 1024px) 100vw, 1024px">
 https://granolashotgun.files.wordpress.com/2017/01/screen-shot-2017-01-1... 150w, https://granolashotgun.files.wordpress.com/2017/01/screen-shot-2017-01-1... 300w, https://granolashotgun.files.wordpress.com/2017/01/screen-shot-2017-01-1... 768w, https://granolashotgun.files.wordpress.com/2017/01/screen-shot-2017-01-1... 1711w" sizes="(max-width: 1024px) 100vw, 1024px">
 https://granolashotgun.files.wordpress.com/2017/01/screen-shot-2017-01-1... 150w, https://granolashotgun.files.wordpress.com/2017/01/screen-shot-2017-01-1... 300w, https://granolashotgun.files.wordpress.com/2017/01/screen-shot-2017-01-1... 768w, https://granolashotgun.files.wordpress.com/2017/01/screen-shot-2017-01-1... 1720w" sizes="(max-width: 1024px) 100vw, 1024px">
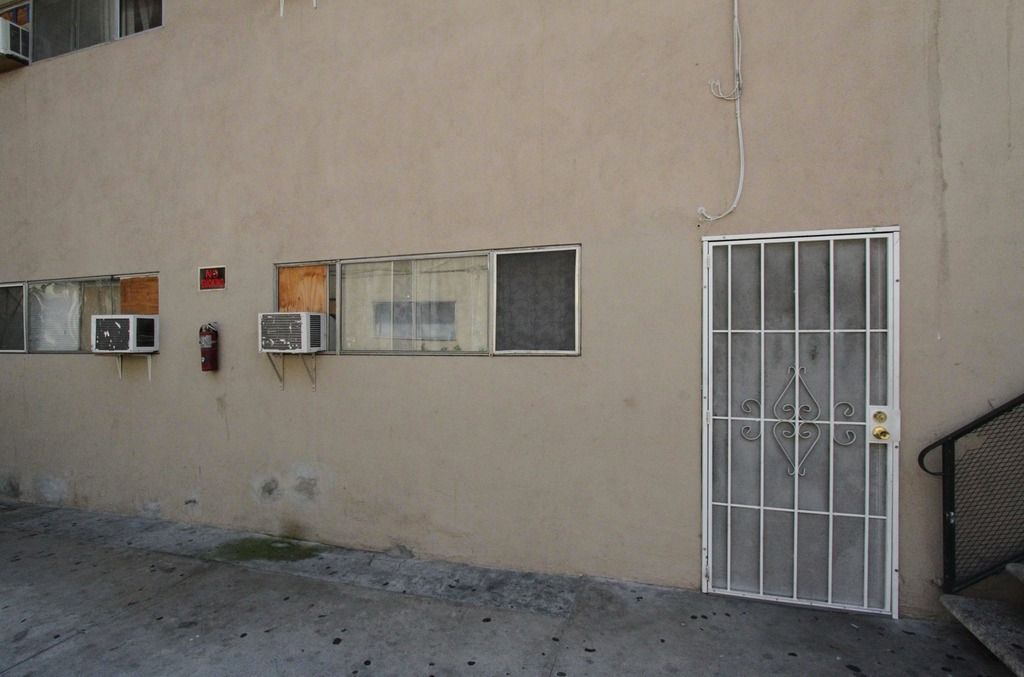
Even during ordinary high tides the water level of the canal is about the same as the parking lot. So whenever it rains the drainage system that normally pulls water away from the land works in reverse and canal water is pushed up onto the surface.
 https://granolashotgun.files.wordpress.com/2017/01/screen-shot-2017-01-1... 150w, https://granolashotgun.files.wordpress.com/2017/01/screen-shot-2017-01-1... 300w, https://granolashotgun.files.wordpress.com/2017/01/screen-shot-2017-01-1... 768w, https://granolashotgun.files.wordpress.com/2017/01/screen-shot-2017-01-1... 1719w" sizes="(max-width: 1024px) 100vw, 1024px">
 https://granolashotgun.files.wordpress.com/2017/01/screen-shot-2017-01-1... 150w, https://granolashotgun.files.wordpress.com/2017/01/screen-shot-2017-01-1... 300w, https://granolashotgun.files.wordpress.com/2017/01/screen-shot-2017-01-1... 768w, https://granolashotgun.files.wordpress.com/2017/01/screen-shot-2017-01-1... 1720w" sizes="(max-width: 1024px) 100vw, 1024px">
 https://granolashotgun.files.wordpress.com/2017/01/screen-shot-2017-01-1... 150w, https://granolashotgun.files.wordpress.com/2017/01/screen-shot-2017-01-1... 300w, https://granolashotgun.files.wordpress.com/2017/01/screen-shot-2017-01-1... 768w, https://granolashotgun.files.wordpress.com/2017/01/screen-shot-2017-01-1... 1715w" sizes="(max-width: 1024px) 100vw, 1024px">
 https://granolashotgun.files.wordpress.com/2017/01/screen-shot-2017-01-1... 150w, https://granolashotgun.files.wordpress.com/2017/01/screen-shot-2017-01-1... 300w, https://granolashotgun.files.wordpress.com/2017/01/screen-shot-2017-01-1... 768w, https://granolashotgun.files.wordpress.com/2017/01/screen-shot-2017-01-1... 1721w" sizes="(max-width: 1024px) 100vw, 1024px">
What’s the difference between a hotel room that remains completely dry vs. a hotel room that has just one inch of standing water on the floor? That’s the difference between $100 a night and $0 per night.
 https://granolashotgun.files.wordpress.com/2017/01/screen-shot-2017-01-1... 150w, https://granolashotgun.files.wordpress.com/2017/01/screen-shot-2017-01-1... 300w, https://granolashotgun.files.wordpress.com/2017/01/screen-shot-2017-01-1... 768w, https://granolashotgun.files.wordpress.com/2017/01/screen-shot-2017-01-1... 1716w" sizes="(max-width: 1024px) 100vw, 1024px">
 https://granolashotgun.files.wordpress.com/2017/01/screen-shot-2017-01-1... 150w, https://granolashotgun.files.wordpress.com/2017/01/screen-shot-2017-01-1... 300w, https://granolashotgun.files.wordpress.com/2017/01/screen-shot-2017-01-1... 768w, https://granolashotgun.files.wordpress.com/2017/01/screen-shot-2017-01-1... 1716w" sizes="(max-width: 1024px) 100vw, 1024px">
 https://granolashotgun.files.wordpress.com/2017/01/screen-shot-2017-01-1... 150w, https://granolashotgun.files.wordpress.com/2017/01/screen-shot-2017-01-1... 300w, https://granolashotgun.files.wordpress.com/2017/01/screen-shot-2017-01-1... 768w, https://granolashotgun.files.wordpress.com/2017/01/screen-shot-2017-01-1... 1716w" sizes="(max-width: 1024px) 100vw, 1024px">
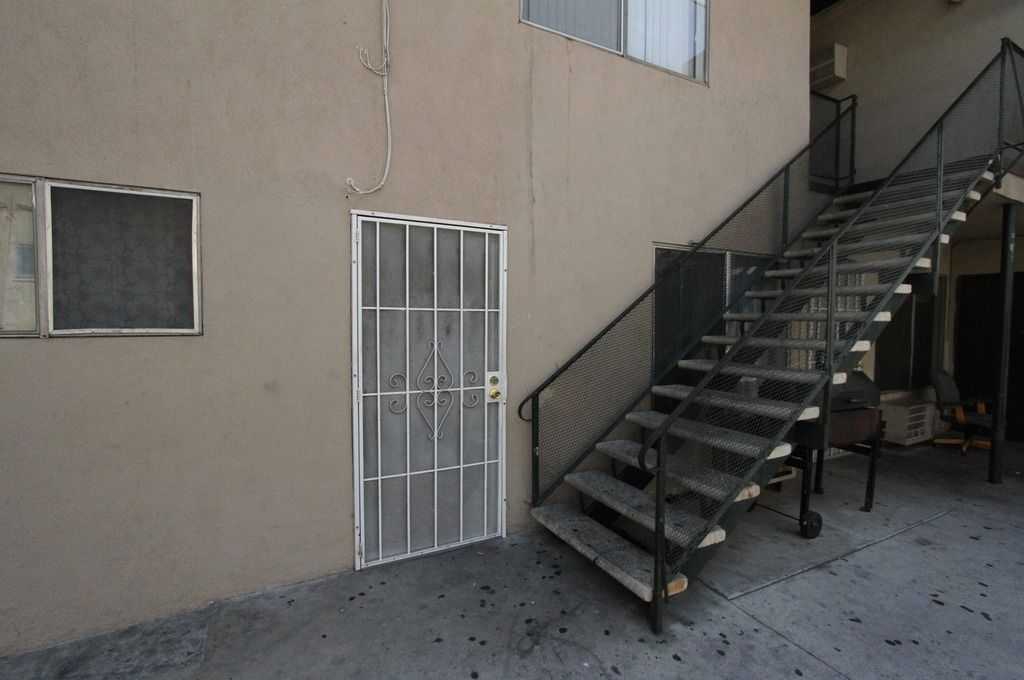
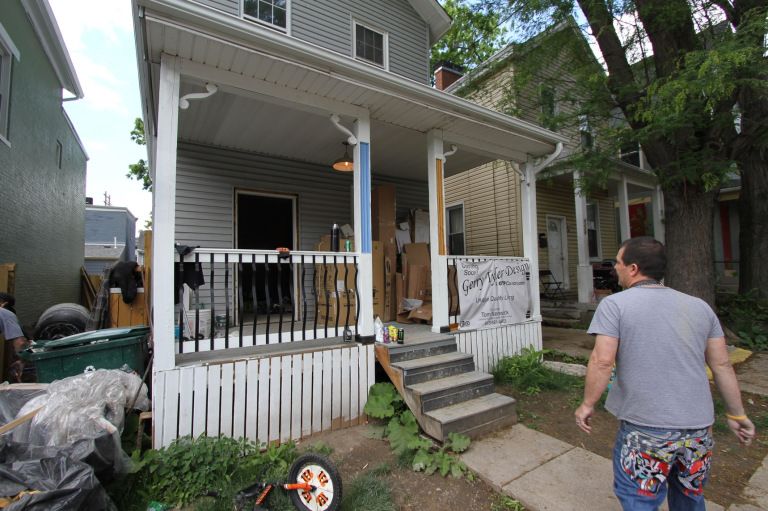
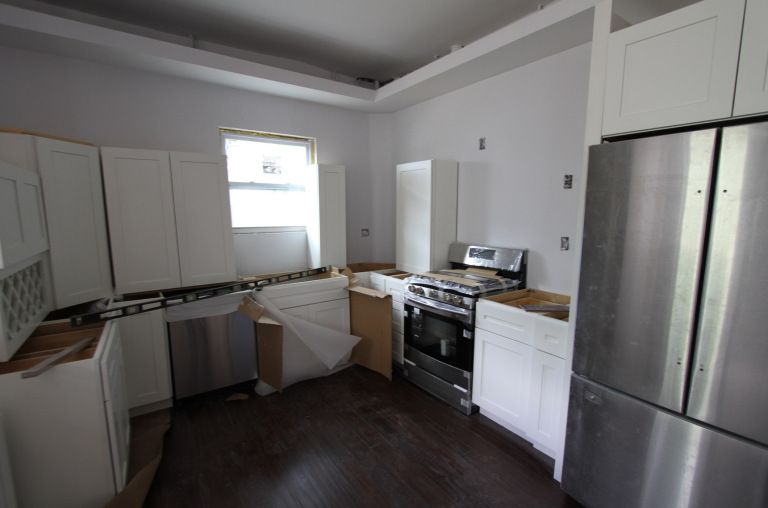
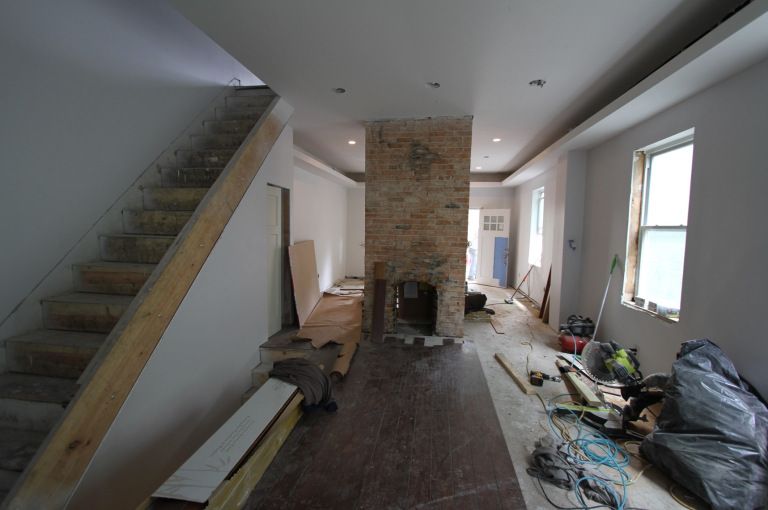
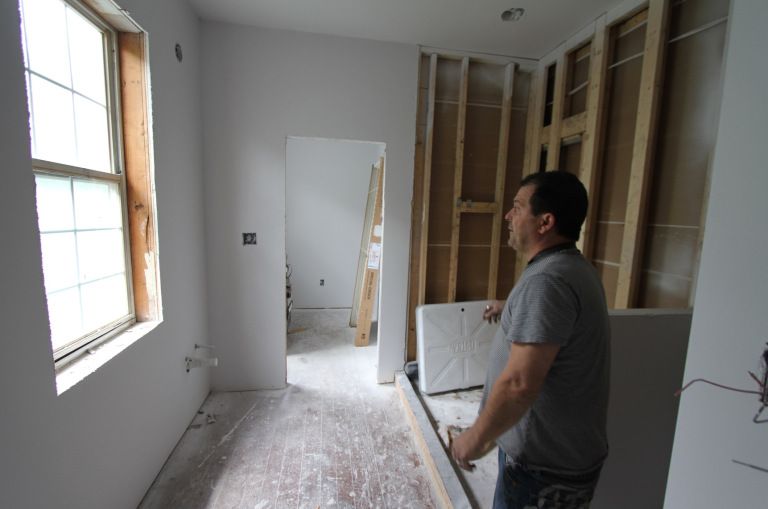
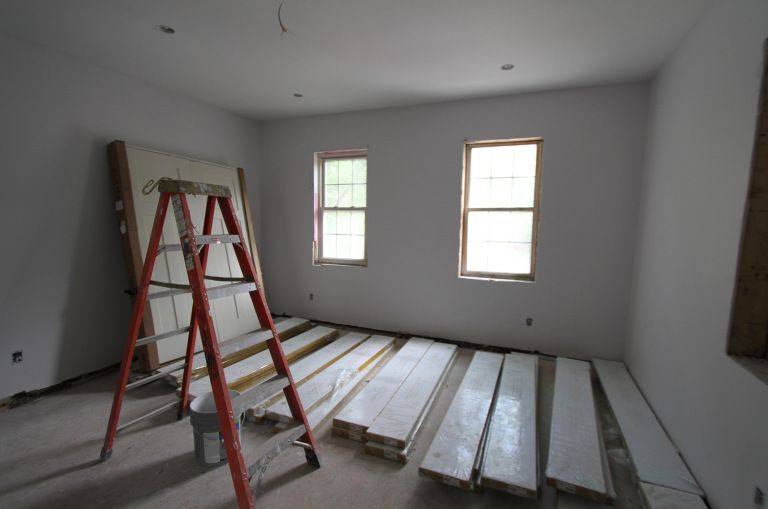
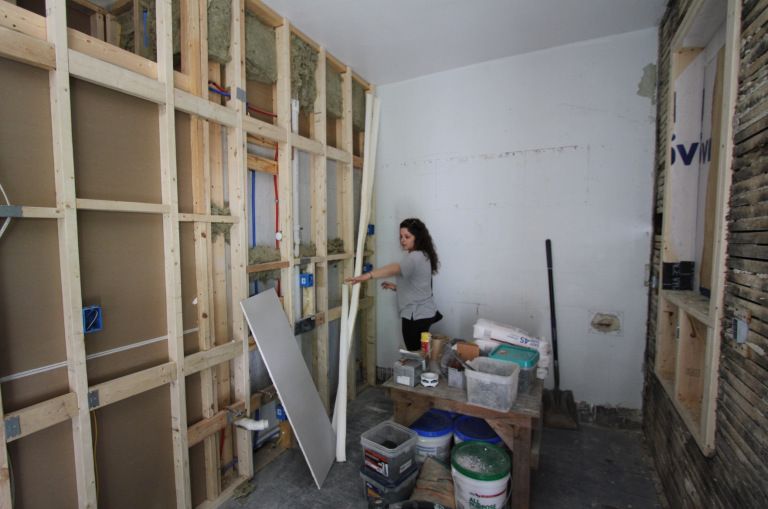
The management has long responded to the situation by not renting ground floor rooms during the rainy season. That constitutes a seasonal operating loss since any hotel that falls below a 60% occupancy rate loses money. But there isn’t much that can be done. The rooms on the lower level are being renovated so that once the weather clears up the hard surfaces can be thoroughly cleaned and aired out and put back on the market without incident.
 https://granolashotgun.files.wordpress.com/2017/01/screen-shot-2017-01-1... 150w, https://granolashotgun.files.wordpress.com/2017/01/screen-shot-2017-01-1... 300w, https://granolashotgun.files.wordpress.com/2017/01/screen-shot-2017-01-1... 768w, https://granolashotgun.files.wordpress.com/2017/01/screen-shot-2017-01-1... 1720w" sizes="(max-width: 1024px) 100vw, 1024px">
 https://granolashotgun.files.wordpress.com/2017/01/screen-shot-2017-01-1... 150w, https://granolashotgun.files.wordpress.com/2017/01/screen-shot-2017-01-1... 300w, https://granolashotgun.files.wordpress.com/2017/01/screen-shot-2017-01-1... 768w, https://granolashotgun.files.wordpress.com/2017/01/screen-shot-2017-01-1... 1715w" sizes="(max-width: 1024px) 100vw, 1024px">
 https://granolashotgun.files.wordpress.com/2017/01/screen-shot-2017-01-1... 150w, https://granolashotgun.files.wordpress.com/2017/01/screen-shot-2017-01-1... 300w, https://granolashotgun.files.wordpress.com/2017/01/screen-shot-2017-01-1... 768w, https://granolashotgun.files.wordpress.com/2017/01/screen-shot-2017-01-1... 1722w" sizes="(max-width: 1024px) 100vw, 1024px">
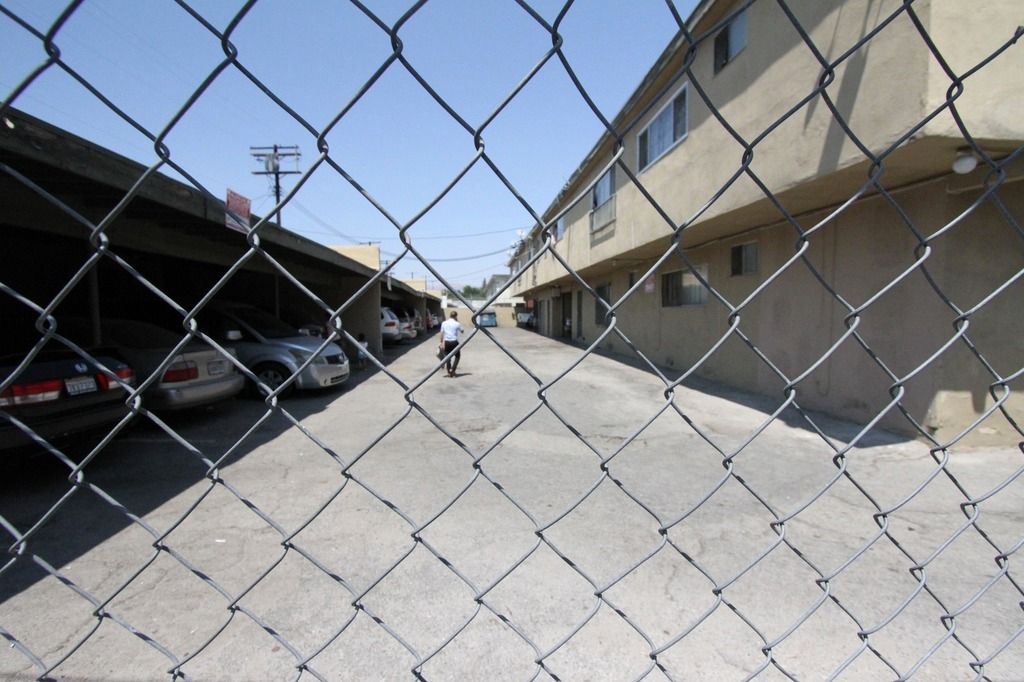
Warehouses and industrial sheds in the area have a similar set of challenges. Who exactly wants to store or manufacture things in a facility that gets wet whenever it rains at high tide?
 https://granolashotgun.files.wordpress.com/2017/01/screen-shot-2017-01-1... 150w, https://granolashotgun.files.wordpress.com/2017/01/screen-shot-2017-01-1... 300w, https://granolashotgun.files.wordpress.com/2017/01/screen-shot-2017-01-1... 768w, https://granolashotgun.files.wordpress.com/2017/01/screen-shot-2017-01-1... 1718w" sizes="(max-width: 1024px) 100vw, 1024px">
 https://granolashotgun.files.wordpress.com/2017/01/screen-shot-2017-01-1... 150w, https://granolashotgun.files.wordpress.com/2017/01/screen-shot-2017-01-1... 300w, https://granolashotgun.files.wordpress.com/2017/01/screen-shot-2017-01-1... 768w, https://granolashotgun.files.wordpress.com/2017/01/screen-shot-2017-01-1... 1712w" sizes="(max-width: 1024px) 100vw, 1024px">
 https://granolashotgun.files.wordpress.com/2017/01/screen-shot-2017-01-1... 150w, https://granolashotgun.files.wordpress.com/2017/01/screen-shot-2017-01-1... 300w, https://granolashotgun.files.wordpress.com/2017/01/screen-shot-2017-01-1... 768w, https://granolashotgun.files.wordpress.com/2017/01/screen-shot-2017-01-1... 1719w" sizes="(max-width: 1024px) 100vw, 1024px">
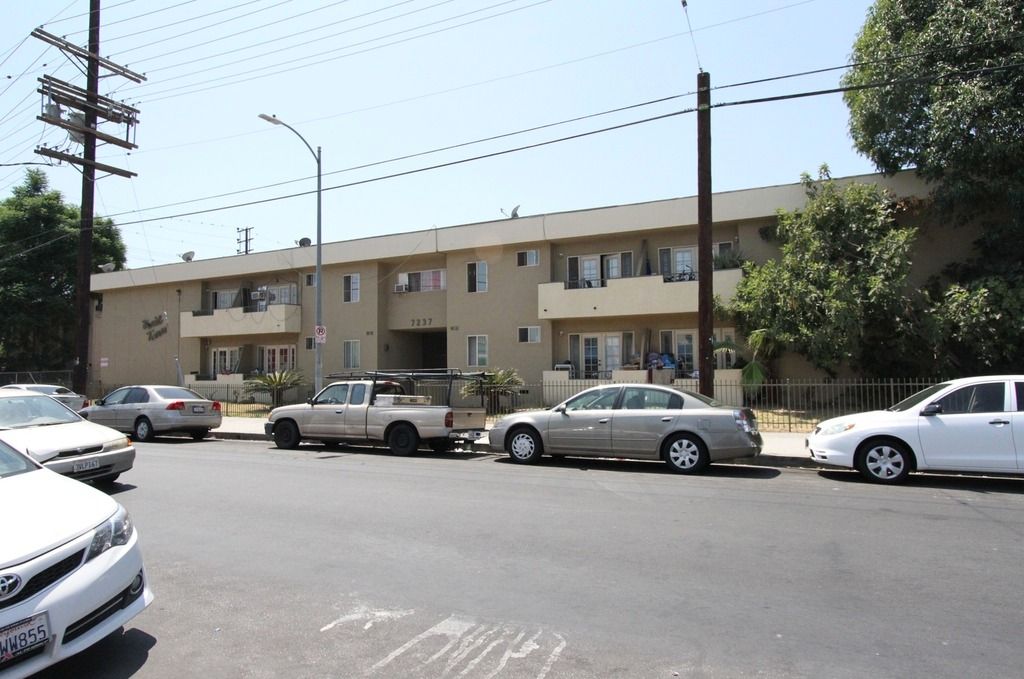
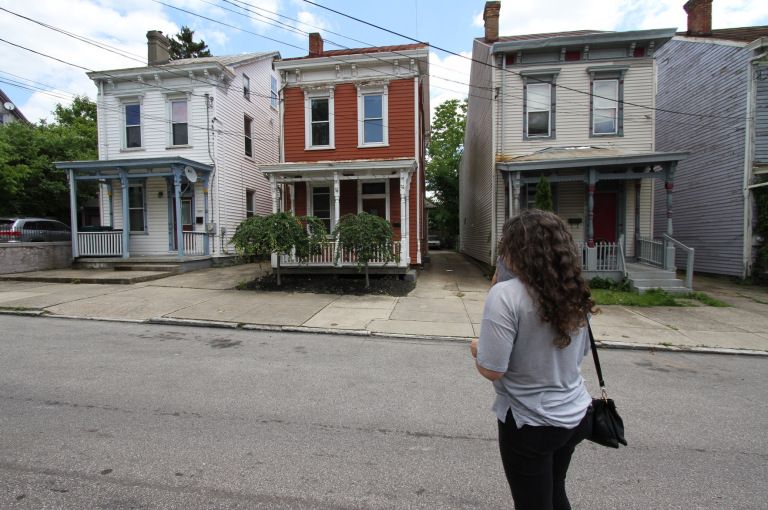
I was curious why such valuable waterfront land wasn’t redeveloped with new construction that was built with rising tides and earthquakes in mind. Wasn’t the canal a natural feature that could be capitalized upon as a major amenity? Wouldn’t people pay extra to stay at a fancy hotel or live along a landscaped promenade with cafes and shops? It could be really nice, and the real estate market would certainly be able to absorb the required price point. I was told the hotel owner had asked for permission to redevelop the site as a retirement village. Local regulators denied the applications. The city insists that the property remain as it is.
Over the years I’ve had more than one mayor or city official in different parts of the country explain that each new resident costs the city money in services and infrastructure. What cities desperately need is tax revenue. That’s why we see a proliferation of casinos, premium outlet malls, entertainment complexes, and technology parks. A half assed soggy hotel is better for the city’s bottom line than anything that will burden the municipality with needy residents.
 https://granolashotgun.files.wordpress.com/2017/01/screen-shot-2017-01-1... 150w, https://granolashotgun.files.wordpress.com/2017/01/screen-shot-2017-01-1... 300w, https://granolashotgun.files.wordpress.com/2017/01/screen-shot-2017-01-1... 768w, https://granolashotgun.files.wordpress.com/2017/01/screen-shot-2017-01-1... 1713w" sizes="(max-width: 1024px) 100vw, 1024px">
 https://granolashotgun.files.wordpress.com/2017/01/screen-shot-2017-01-1... 150w, https://granolashotgun.files.wordpress.com/2017/01/screen-shot-2017-01-1... 300w, https://granolashotgun.files.wordpress.com/2017/01/screen-shot-2017-01-1... 768w, https://granolashotgun.files.wordpress.com/2017/01/screen-shot-2017-01-1... 1715w" sizes="(max-width: 1024px) 100vw, 1024px">
 https://granolashotgun.files.wordpress.com/2017/01/screen-shot-2017-01-1... 150w, https://granolashotgun.files.wordpress.com/2017/01/screen-shot-2017-01-1... 300w, https://granolashotgun.files.wordpress.com/2017/01/screen-shot-2017-01-1... 768w, https://granolashotgun.files.wordpress.com/2017/01/screen-shot-2017-01-1... 1719w" sizes="(max-width: 1024px) 100vw, 1024px">
 https://granolashotgun.files.wordpress.com/2017/01/screen-shot-2017-01-1... 150w, https://granolashotgun.files.wordpress.com/2017/01/screen-shot-2017-01-1... 300w, https://granolashotgun.files.wordpress.com/2017/01/screen-shot-2017-01-1... 768w, https://granolashotgun.files.wordpress.com/2017/01/screen-shot-2017-01-1... 1718w" sizes="(max-width: 1024px) 100vw, 1024px">
 https://granolashotgun.files.wordpress.com/2017/01/screen-shot-2017-01-1... 150w, https://granolashotgun.files.wordpress.com/2017/01/screen-shot-2017-01-1... 300w, https://granolashotgun.files.wordpress.com/2017/01/screen-shot-2017-01-1... 768w, https://granolashotgun.files.wordpress.com/2017/01/screen-shot-2017-01-1... 1720w" sizes="(max-width: 1024px) 100vw, 1024px">
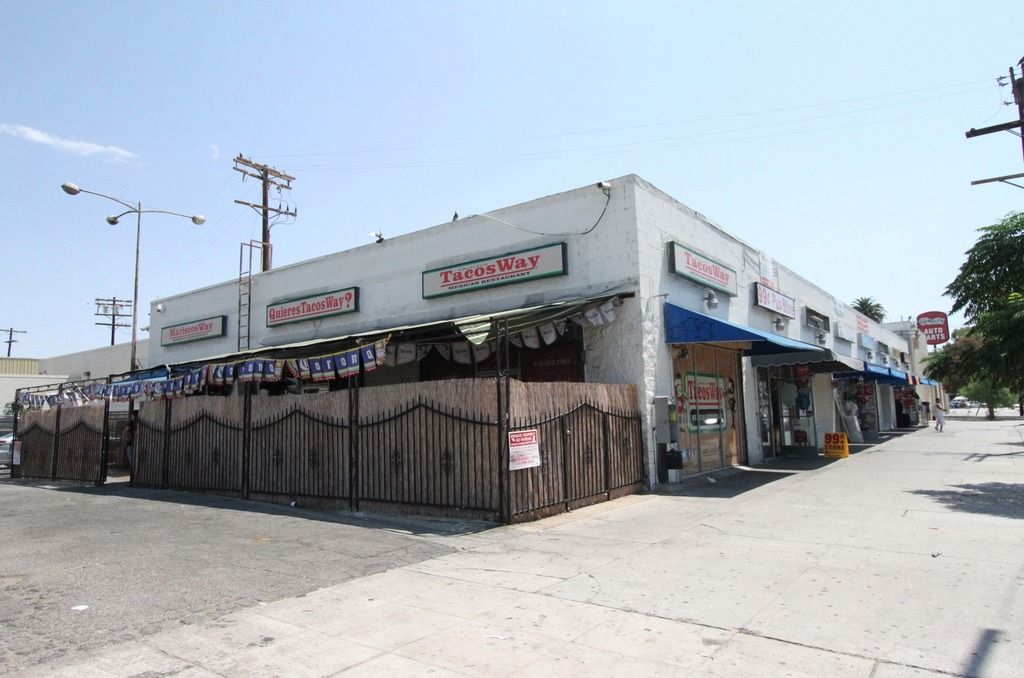
In the short term there are all manner of temporary quick fixes that can keep this system going. But over the long haul there are only two possible trajectories for these places. One is for huge sums of public money to be spent defending private property. The other is that the structures that currently occupy vulnerable positions will lose value, be abandoned, and gradually slip under the tide. Downtown San Francisco is likely to find the funds to keep back the waves. Will taxpayers really be willing to fortify the old Taco Bell and aging suburban big box store? Toss in an earthquake or two and things could get really interesting very fast. Happenstance is the polite politically neutral term for this kind of triage.
John Sanphillippo lives in San Francisco and blogs about urbanism, adaptation, and resilience at granolashotgun.com. He's a member of the Congress for New Urbanism, films videos for faircompanies.com, and is a regular contributor to Strongtowns.org. He earns his living by buying, renovating, and renting undervalued properties in places that have good long term prospects. He is a graduate of Rutgers University.
All photos by Johnny Sanphillippo
![]()
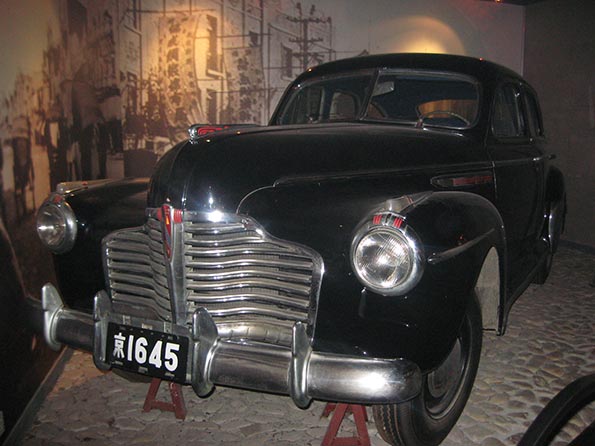 Photo: Zhou En Lai’s Buick, Zhou En Lai Museum, Nanjing
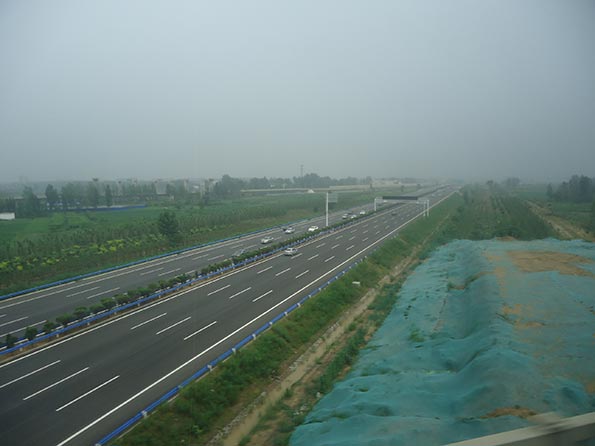 Photo: G4 Expressway between Zhengzhou, Henan and Wuhan, Hubei

 Photo: Ford F-150 (2017 model)
 http://www.urbanophile.com/wp-content/uploads/2017/01/lafayette-la-tax-m... 300w,
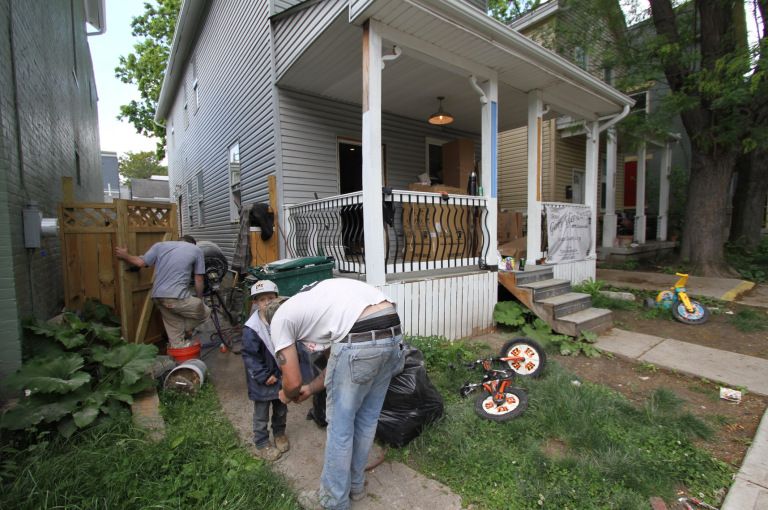


 https://granolashotgun.files.wordpress.com/2017/01/screen-shot-2017-01-1... 150w,
  https://granolashotgun.files.wordpress.com/2017/01/screen-shot-2017-01-1... 150w,
  https://granolashotgun.files.wordpress.com/2017/01/screen-shot-2017-01-1... 150w,
  https://granolashotgun.files.wordpress.com/2017/01/screen-shot-2017-01-1... 150w,
  https://granolashotgun.files.wordpress.com/2017/01/screen-shot-2017-01-1... 150w,
  https://granolashotgun.files.wordpress.com/2017/01/screen-shot-2017-01-1... 150w,
  https://granolashotgun.files.wordpress.com/2017/01/screen-shot-2017-01-1... 150w,
  https://granolashotgun.files.wordpress.com/2017/01/screen-shot-2017-01-1... 150w,
  https://granolashotgun.files.wordpress.com/2017/01/screen-shot-2017-01-1... 150w,
  https://granolashotgun.files.wordpress.com/2017/01/screen-shot-2017-01-1... 150w,
  https://granolashotgun.files.wordpress.com/2017/01/screen-shot-2017-01-1... 150w,
  https://granolashotgun.files.wordpress.com/2017/01/screen-shot-2017-01-1... 150w,
  https://granolashotgun.files.wordpress.com/2017/01/screen-shot-2017-01-1... 150w,
  https://granolashotgun.files.wordpress.com/2017/01/screen-shot-2017-01-1... 150w,
  https://granolashotgun.files.wordpress.com/2017/01/screen-shot-2017-01-1... 150w,
  https://granolashotgun.files.wordpress.com/2017/01/screen-shot-2017-01-1... 150w,
  https://granolashotgun.files.wordpress.com/2017/01/screen-shot-2017-01-1... 150w,
  https://granolashotgun.files.wordpress.com/2017/01/screen-shot-2017-01-1... 150w,
  https://granolashotgun.files.wordpress.com/2017/01/screen-shot-2017-01-1... 150w,
  https://granolashotgun.files.wordpress.com/2017/01/screen-shot-2017-01-1... 150w,
  https://granolashotgun.files.wordpress.com/2017/01/screen-shot-2017-01-1... 150w,
  https://granolashotgun.files.wordpress.com/2017/01/screen-shot-2017-01-1... 150w,
  https://granolashotgun.files.wordpress.com/2017/01/screen-shot-2017-01-1... 150w,
  https://granolashotgun.files.wordpress.com/2017/01/screen-shot-2017-01-1... 150w,
  https://granolashotgun.files.wordpress.com/2017/01/screen-shot-2017-01-1... 150w,
  https://granolashotgun.files.wordpress.com/2017/01/screen-shot-2017-01-1... 150w,
  https://granolashotgun.files.wordpress.com/2017/01/screen-shot-2017-01-1... 150w,
  https://granolashotgun.files.wordpress.com/2017/01/screen-shot-2017-01-1... 150w,
  https://granolashotgun.files.wordpress.com/2017/01/screen-shot-2017-01-1... 150w,
  https://granolashotgun.files.wordpress.com/2017/01/screen-shot-2017-01-1... 150w,
  https://granolashotgun.files.wordpress.com/2017/01/screen-shot-2017-01-1... 150w,
  https://granolashotgun.files.wordpress.com/2017/01/screen-shot-2017-01-1... 150w,
  https://granolashotgun.files.wordpress.com/2017/01/screen-shot-2017-01-1... 150w,
  https://granolashotgun.files.wordpress.com/2017/01/screen-shot-2017-01-1... 150w,
  https://granolashotgun.files.wordpress.com/2017/01/screen-shot-2017-01-1... 150w,
  https://granolashotgun.files.wordpress.com/2017/01/screen-shot-2017-01-1... 150w,
  https://granolashotgun.files.wordpress.com/2017/01/screen-shot-2017-01-1... 150w,
  https://granolashotgun.files.wordpress.com/2017/01/screen-shot-2017-01-1... 150w,
  https://granolashotgun.files.wordpress.com/2017/01/screen-shot-2017-01-1... 150w,
  https://granolashotgun.files.wordpress.com/2017/01/screen-shot-2017-01-1... 150w,
  https://granolashotgun.files.wordpress.com/2017/01/screen-shot-2017-01-1... 150w,
  https://granolashotgun.files.wordpress.com/2017/01/screen-shot-2017-01-1... 150w,
  https://granolashotgun.files.wordpress.com/2017/01/screen-shot-2017-01-1... 150w,


