Quantcast
Channel: Newgeography.com - Economic, demographic, and political commentary about places
Viewing all 3792 articles
Browse latest View live

The Evolving Urban Form: Houston

$
0
0

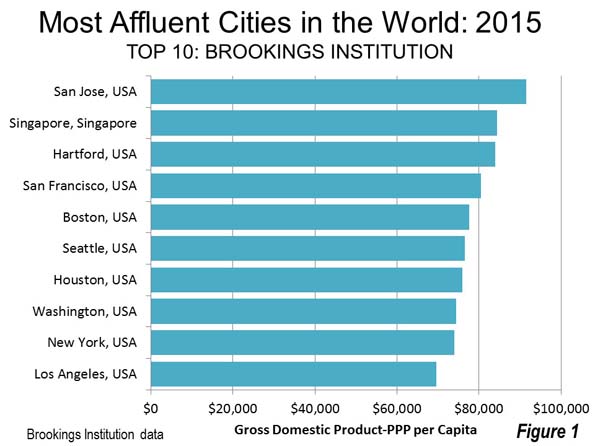
Houston is a city (metropolitan area) of superlatives. The most recent Brookings Institution data shows that Houston has the seventh strongest per capita economy (gross domestic product) in the world (Figure 1). This places Houston above New York and more surprisingly, perhaps, other cities perceived to have strong economies are far below Houston and outside of the top 10, such as London, Tokyo and Chicago.

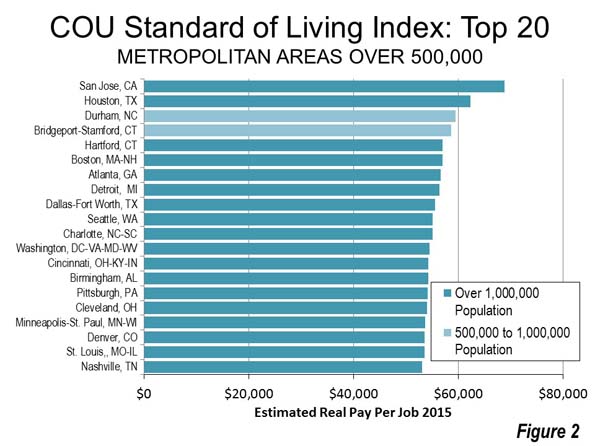
The recently released COU Standard of Living Index also ranked Houston just behind San Jose in real pay per job for households entering the housing market (Figure 2).

Distribution of Population Growth

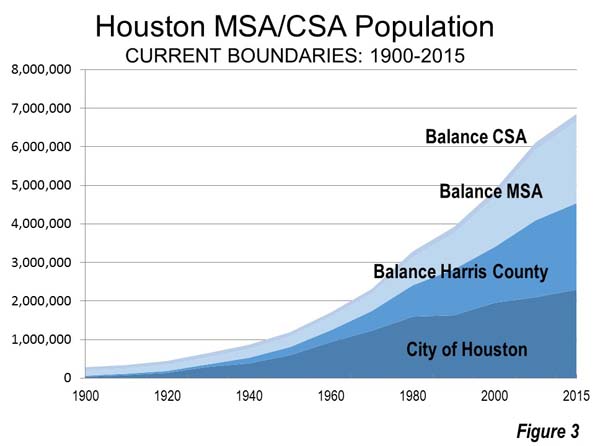
 Houston is among the newer of the world’s great cities. It  has experienced sustained growth in every decade since the turn of the 20th century. The area constituting its metropolitan region (combined statistical area) has grown at more than 1.5 percent in each decade since 1900. In the 1920s and the 1980s, Houston grow at a rate of more than 3.5 percent annually at has grown an average of 2.2 to 2.3 percent annually since 2000. It took until 1950 for Houston to reach 1 million residents. By 1980, the population was 3.3 million and by 2015 had doubled to 6.8 million.

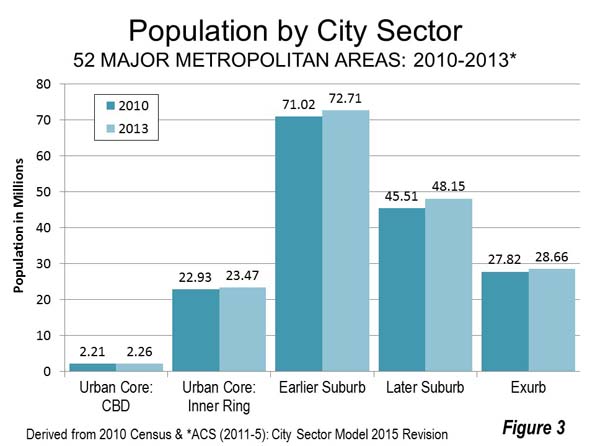
As is typical for a growing city, the strongest early growth was in the core municipality (Houston) and then gradually shifted to the nearby suburbs and outer suburbs (Figure 3)

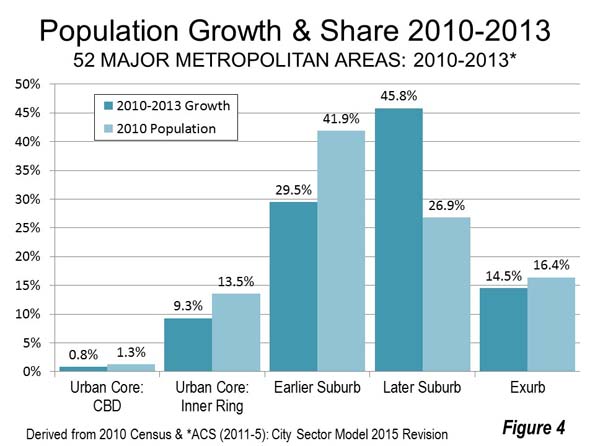
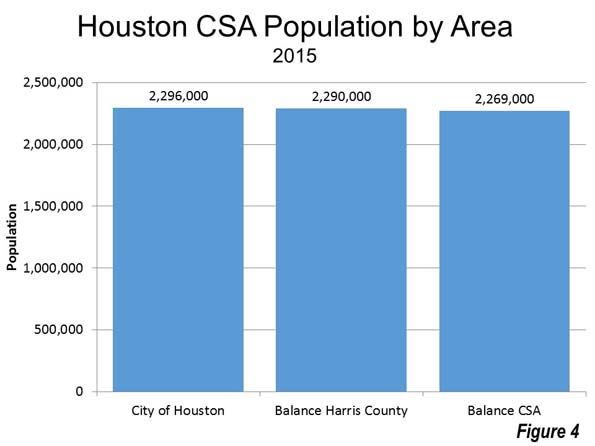
At this point, near parity has been reached. The municipality of Houston, the suburbs within the core Harris County (the county also home to most of the city) and the outer suburbs, beyond Harris County have nearly equal populations, at approximately 2.3 million each (Figure 4).

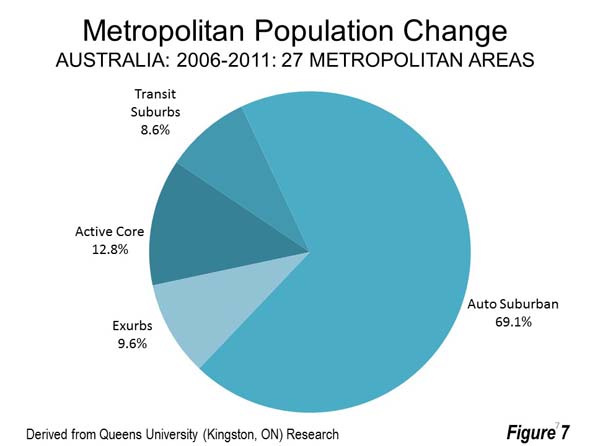
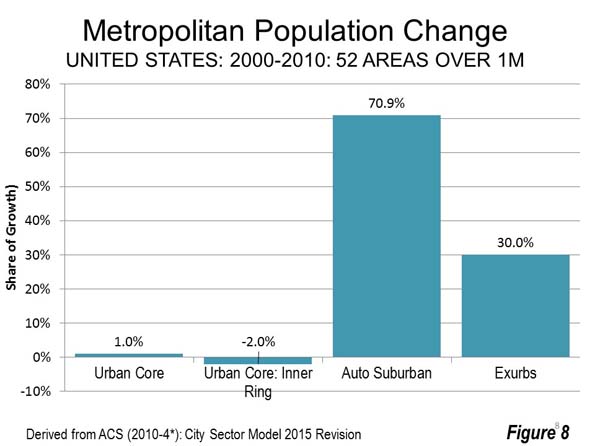
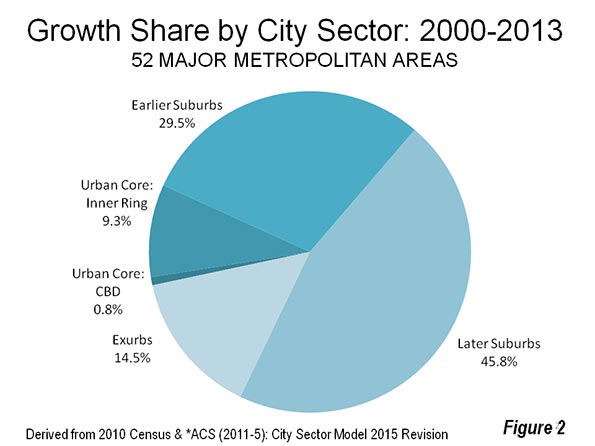
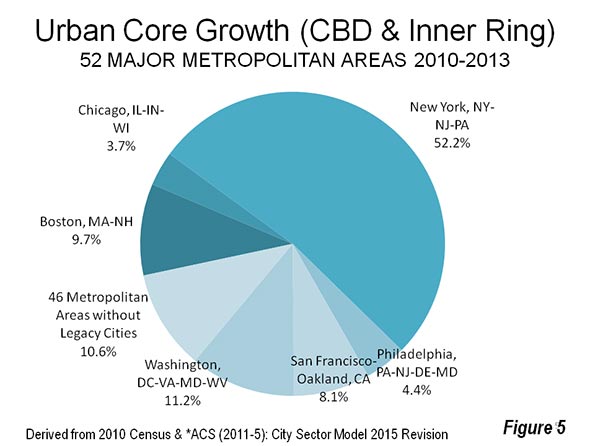
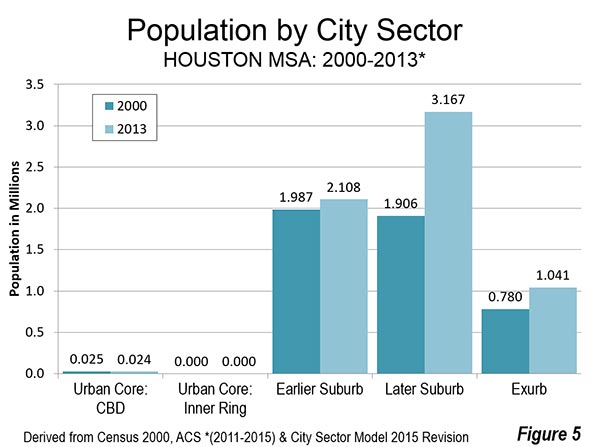
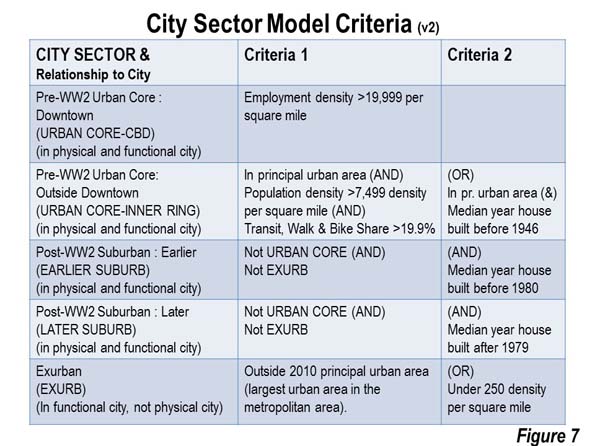
Like other cities that have experienced most of their growth since World War II, most of Houston is suburban. Between 2000 and 2013, the greatest growth was in the Later Suburbs and Exurbs. There was also growth in the Earlier Suburbs (Figures 5 and 7).

Large Centers and Decentralization

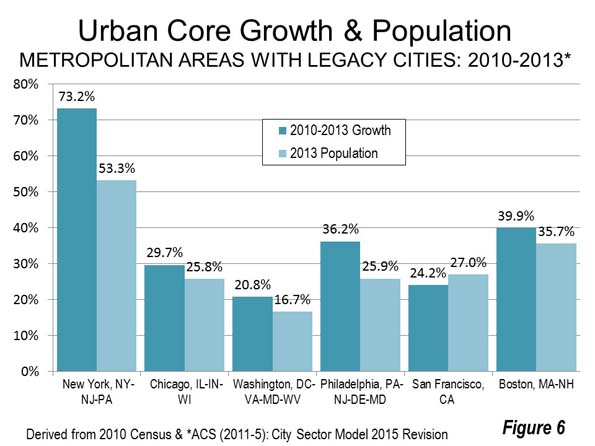
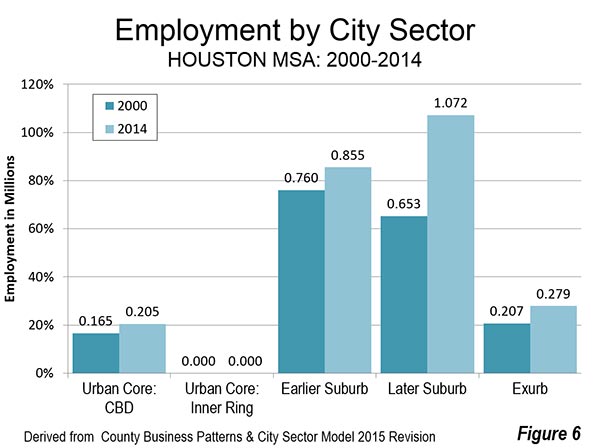
There was a similar pattern of growth in employment. The greatest growth was in the Later Suburbs and there was also strong growth in the Exurbs and the Earlier Suburbs (Figures 6 and 7). The central business district (downtown) ranks eighth in total employment in the nation and also experienced growth. The Texas Medical Center is the largest life sciences center in the world. The center is located south downtown and rivals some of the nation’s largest central business districts, larger than Minneapolis and nearly as large as Denver ,, with more than 100,000 employees (see photograph above). There are other large centers, such as the Port of Houston, the Galleria (Uptown) and the Energy Corridor. Houston is one of the best examples of a decentralized city, with major employment centers throughout.

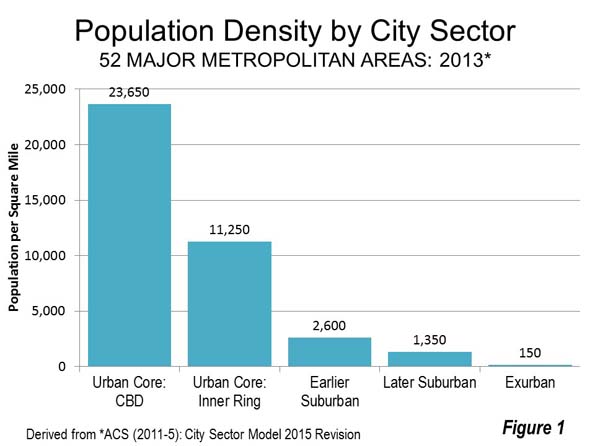
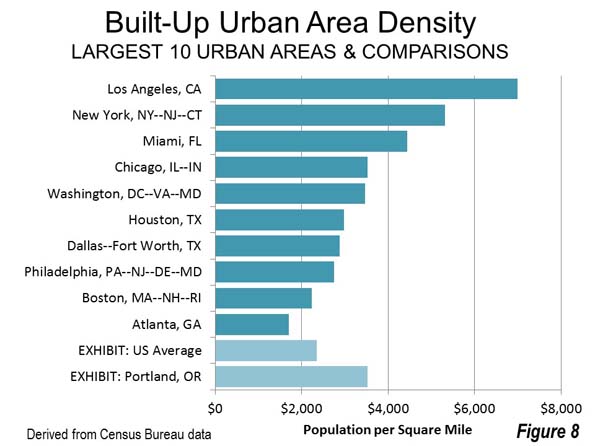
Higher than Average Urban Density

Houston is often characterized as a “sprawling” urban area. In fact, however, Houston has a higher than average urban density for the United States (by eight percent) and an urban density approximately 75 percent higher than Atlanta and Charlotte and denser than Philadelphia and Boston. Even Portland, with its carefully cultivated international reputation for high density is only 18 percent denser than Houston (Figure 8). Of course, all US urban areas are less dense by international standards than their foreign counterparts.

Attracting the Most New Residents

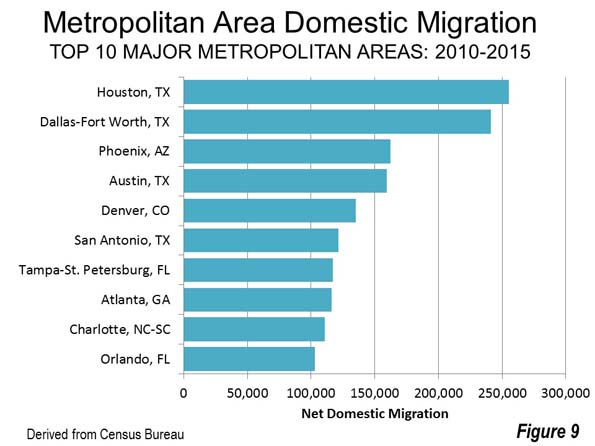
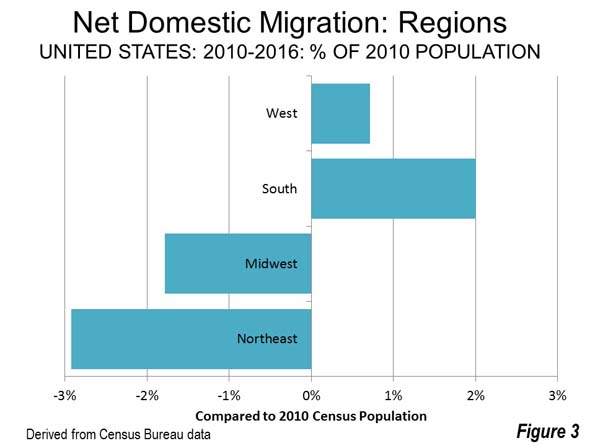
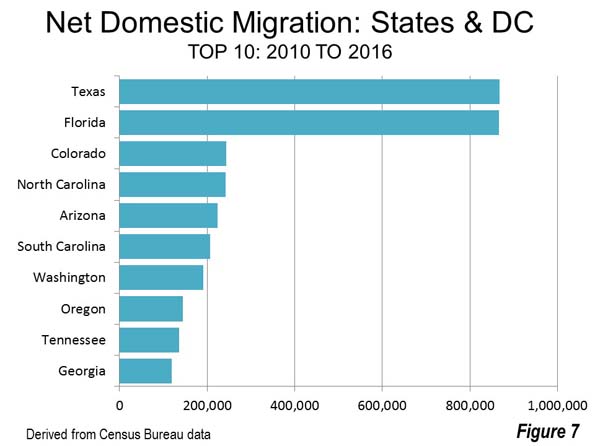
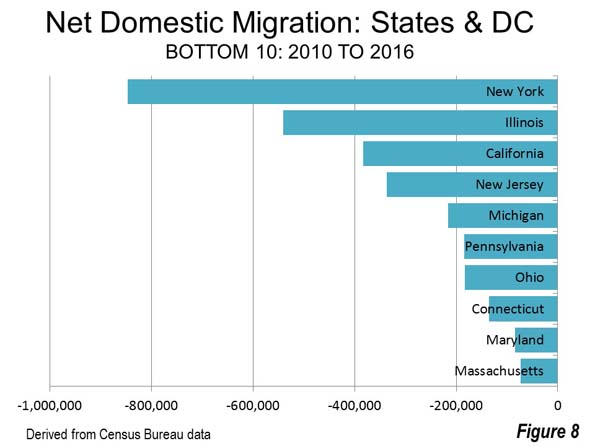
Since 2010Houston has led the 53 metropolitan areas with more than 1,000,000 population in net domestic migration. In that time Houston has attracted 255,000 new residents from elsewhere in the nation, followed closely by in-state rival Dallas-Fort Worth (241,000). The four largest Texas metropolitan areas with more than 1,000,000 population were among the six attracting the largest net domestic migration, with fourth ranked Austin attracting 159,000 and sixth ranked San Antonio adding 122,000. Only third ranked Phoenix and fifth ranked Denver were from outside Texas. Eight of the top ten were from the South (Figure 9).

There are at least two important keys to Houston’s attractiveness. Obviously, its strong job-creating economy has opened career opportunities for people from other parts of the country. In addition, Houston’s favorable housing affordability has been an important factor. Seminal recent academic research has pointed to the importance of housing affordability in attracting domestic migrants (such as Ganong and Shoag).

Enviable Improvement in Relative Traffic Congestion

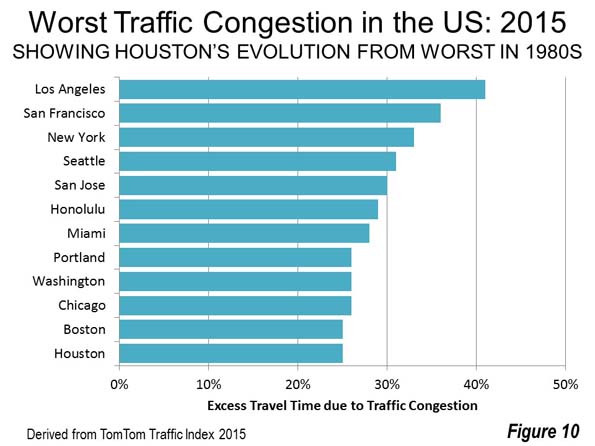
Houston has been more successful in controlling traffic congestion than many other cities. In 2015, Houston tied with Boston for the 11th worst traffic congestion in the United States, according to the TomTom Traffic Index (Figure 10). This is a far better rating than in the middle 1980s, when the Texas Transportation Institute ranked Houston as having the worst traffic congestion in the nation.

Since that time, Houston has managed to have spectacular population growth, yet has kept up with it by expanding its freeway and arterial systems, along with traffic management improvements. Los Angeles, San Francisco, Seattle, San Jose, New York, Honolulu, Miami, Portland, Washington and Chicago have seen their traffic congestion become worse than in Houston over the same period. Houston is larger in population than all but three of these nine metropolitan areas (New York, Los Angeles and Chicago), more than twice the size of San Jose and Portland and nearly seven times that of Honolulu. Further, exhibiting the association between greater traffic congestion and higher population density, all cities ranked worse than Houston have higher urban densities.

World’s Energy Capital Poised for Employment Growth

Houston is widely acclaimed as the energy capital of the world. Urbanscale.com says that “The only other U.S. city that rivals Houston’s domination of a single industry is New York’s preeminence in the financial sector.” Of course, Houston’s energy industry has faced considerable challenges over the past couple of years as Organization of Petroleum Exporting Countries (OPEC) have driven the price of oil down by producing more oil. However, the “good times” could return soon for Houston, as there are indications that OPEC will reduce its production. Further, and perhaps even more importantly, Houston could benefit from the new Trump administration’s commitment to a more consumer oriented energy policy, appearing likely to generate substantial employment and growth in the newly unleashed sectors.

Photo: Texas Medical Center (by author)

Wendell Cox is principal of Demographia, an international public policy and demographics firm. He is a Senior Fellow of the Center for Opportunity Urbanism (US), Senior Fellow for Housing Affordability and Municipal Policy for the Frontier Centre for Public Policy (Canada), and a member of the Board of Advisors of the Center for Demographics and Policy at Chapman University (California). He is co-author of the "Demographia International Housing Affordability Survey" and author of "Demographia World Urban Areas" and "War on the Dream: How Anti-Sprawl Policy Threatens the Quality of Life." He was appointed to three terms on the Los Angeles County Transportation Commission, where he served with the leading city and county leadership as the only non-elected member. He served as a visiting professor at the Conservatoire National des Arts et Metiers, a national university in Paris.


“There Can’t Be a Successful Indianapolis Without a Successful Indiana”

$
0
0

Back in 2008 or 2009 I gave a Pecha Kucha presentation in Indianapolis in which I said:

"Cities can’t survive on gentrification alone. The broad community has to be a participant in its success.That’s why I’m somewhat down on the notion of the creative class. It’s good as far as it goes, but it’s a self-consciously elitist vision. Where’s the working class in that?

Arguing among ourselves [city vs. suburbs] is like beggars fighting over table scraps.We need to build the city up without tearing the suburbs down.

There can’t be a successful Indianapolis without a successful Indiana….While [metro] Indy has 25% of the states’ population, it has 60% of the state’s population growth and 80% of its economic growth. That’s not healthy. Like it or not, we’re dependent on the state for critical infrastructure funds and other things. So our challenge is how to bring the rest of the state along with us."

I’ve long been an advocate for the restoration what I call the commonwealth, the idea that we rise and fall together as a people and all have skin the game. This idea has gone by the wayside to say the least.

It may well be that American society has become irredeemably tribalized. I hope not. At a minimum, there are significant sized groups with fundamentally incompatible ideas of the public good. There’s a lot to unpack in that statement, but not today.

Richard Florida has talked about a “great reset” of the economy. Clearly we need some sort of institutional reset to contain or resolve these differences. We’ve done this before in creating the original Constitution to replace the Articles of Confederation, fighting a Civil War and redefining the federalism of that constitution, the New Deal era changes, and perhaps others.

What that looks like, I don’t know. But if we are to reach it without even more severe upheavals, it’s likely to involve some renewed form of federalism, agree to disagree, live and let live, etc – and on durable basis, not just an opportunistic and self-interested one.

This will involve painful change and difficult decisions. One of them is that we must be willing to give others the freedom to make choices for themselves and their communities that we fundamentally disagree with.

To the extent that we believe all of the big decisions of our society are morally determined, and thus not properly the subject of political debate, this means we are in a winner take all world. If you want that world, you’d better be really sure you are right and sure you are going to win – because you face ruination if you’re wrong on either count.

It also means that we need to figure out how to have both love and accountability towards all of our citizens. Right now that means that rural white Republicans in victory cannot ignore the continued urgent need to integrate urban black America into full participation in middle class success and to address other aspects of what Richard Florida has labeled the “new urban crisis.”

It also means that working class whites must be challenged to change. I have made no secret in these pages that these communities too often have sabotaging traits that really aren’t necessary to cling to – such as the disparagement of ambition for better.

But urban and left leaning populations, including minority groups, need to likewise address travails of the white working class, and be willing to make painful changes of their own.

To be honest, I’m not optimistic. But I am hopeful. The future hold possibilities for ill that we cannot know – but it likewise holds the possibility for good things we can’t yet imagine.

Aaron M. Renn is a senior fellow at the Manhattan Institute, a contributing editor of City Journal, and an economic development columnist for Governing magazine. He focuses on ways to help America’s cities thrive in an ever more complex, competitive, globalized, and diverse twenty-first century. During Renn’s 15-year career in management and technology consulting, he was a partner at Accenture and held several technology strategy roles and directed multimillion-dollar global technology implementations. He has contributed to The Guardian, Forbes.com, and numerous other publications. Renn holds a B.S. from Indiana University, where he coauthored an early social-networking platform in 1991.

Photo: By Daniel Schwen (Own work) [CC BY-SA 4.0], via Wikimedia Commons

Trump and California's Economy

$
0
0

Defenders of California’s status-quo claim to be proud of California’s economic growth and worry about what Trump will do to that growth. If you are so impolite as to mention that this has been California’s slowest recovery in 70 years, as the following chart shows, you will be told that slow growth is good. It avoids the excesses of previous business cycles.

That’s nonsense. Slow growth is anti-poor and anti-minority. Here’s a simple way to analyze economic policy: Ask how the policy changes the probability of a young person finding a job. If the policy increases their chances, it’s good policy. If it decreases the probability, it’s bad policy.

I go farther than that. To me, deliberately enacting a policy that reduces a young person’s prospects is immoral.

California, and the nation, have lots of policies that reduce young people's job prospects. So, there are lots of opportunities to increase economic growth. Certainly, it’s possible to present a set of policy proposals that would increase California’s economic growth.

Evaluating Trump’s economic plan is difficult, though. So far, it’s a mixed bag. It has policies that would increase economic growth. It also has some that would decrease economic growth. I think the best way to evaluate the impact is to look at his major proposals for their growth impact and probability of becoming law.

Trump has promised to reduce American business’s regulatory burden. That would reduce costs, encourage domestic production and jobs, and provide a strong economic boost. Some of that overhead was created by executive action and can be reversed by executive action. The probability of reversing those regulations is high, as are the economic benefits.

He’s also promised to eliminate or “fix” Dodd-Frank and the Affordable Healthcare Act. Exactly what he intends to do, fix or eliminate, depends on the tweet of the day. It’s also not clear what fix means. Still, any real change will face significant hurdles, even with a Republican controlled Congress. To be conservative, we need to assume that he will be unsuccessful in his attempts to significantly change these laws. If he does, and it’s done in a way that reduces costs, it will be a happy plus.

Then there is his immigration policy, if you can figure out what it is. He’s been all over the map, from shipping out all undocumented residents to only shipping out the criminals. Of course, if he is able, as some fear, to move millions of our workers, the economic impact would be seriously negative.

Realistically, the most he is likely to accomplish is exporting criminals and slowing immigration. The numbers of undocumented criminals is small enough to have no measurable impact on the economy. Decreasing immigration tends to slow economic growth, but it may reduce inequality a bit by reducing competition faced by our low-productivity workers. Overall, Trump’s immigration policies will likely have modest negative economic impacts.

As in all things Trump, his trade proposals are inconsistent and vague. One thing has been consistent. Trump wants to reduce trade. We can only hope that he’s unsuccessful. The economic impacts of reducing trade would be large and negative. Presumably, Congress will effectively resist his most egregious proposals.

Reducing trade would particularly hurt California’s economy, as a large percentage of what the United States exports and imports goes through California’s ports, which are a significant portion of the state's limited remaining industrial assets.

Taxes are one area of Trump policy clarity. He wants to reduce corporate taxes and reduce the tax impediments to repatriating foreign corporate earnings. By themselves, these would provide an economic stimulus. Repatriating foreign earnings has no obvious downside. By contrast, without some action somewhere else, reducing corporate taxes could increase the severity of our already severe budget challenges. Eliminating deductions, as proposed, would lessen the budget impacts, as would taxing repatriated earnings at the suggested 10 percent rate. These, combined with increased economic activity, potentially brings the long-run budget impact to near zero. Supply-siders would argue that the package would reduce deficits. That’s probably a stretch, although the combination of regulatory reform and tax reform could very well reduce the deficit.

Trump proposes a stimulus package that appears to be another public capital spending spree. This would add to our budget challenge, but it’s far worse than cutting taxes to businesses. Cutting taxes at least has the benefit of generating new economic activity to offset some of the budget impact. Public capital spending at the national level is non-stimulative and inefficient. Given the budget impacts, zero economic impact is the best we can hope for.

Some California leaders worry that Trump will retaliate economically for California giving Hillary Clinton a popular-vote victory. I don’t believe that the presidency has enough power for a vindictive new president to exact revenge by economically punishing states that voted for his opponent. If he does, the presidency is way too powerful.

Overall, it’s likely that Trump's economic impacts will be a small positive, but with an increase in an already too-large budget deficit. California’s impact could be smaller, or even negative, depending on Trump’s success reducing trade.

Whatever Trump’s impacts on the national economy, they are likely to be far less for California, as his program will be swamped by California’s own unilateral deindustrialization. While the rest of the nation will be enacting a program intended to be pro-business and pro-job, California is firmly embarked on an agenda that promises to be anti-business and anti-job, with increased regulation and costs for businesses and consumers.

Examples of California’s anti-business agenda are easy to come by. Governor Brown has recently asked the Federal Government to ban all offshore oil and gas drilling off of California. In the most recent election, Californians renewed their commitment to environmental purity, embracing carbon emissions targets 40 percent below 1990 levels by 2030. Nothing is beyond the reach of California’s environmentally devout. They’ve already regulated cow flatulence, which could lead to backpacks and plumbing to collect cow gas. More likely, it will lead to fewer cows in California, but more in other places and no change in global bovine emissions.

While it’s entertaining to speculate what California regulates after cow flatulence, there are serious consequences to the state’s regulatory enthusiasm. Unless the rest of the country embraces California’s agenda, very unlikely under a Trump administration, its economy and the nation's will eventually diverge, even with California's location, climate, and tech advantages. This will lead to slower economic growth and increased migration out of the Golden State.

Bill Watkins is a professor at California Lutheran University and runs the Center for Economic Research and Forecasting, which can be found at clucerf.org.

Photo: Wendell, Flickr

The Mainstream Media Will Rise Again

$
0
0

The news media was flattened on November 8th, but its recovery has already started.

One of the striking features in all the commentary on Facebook about Donald Trump's victory is the number of times that the words I, me and my appeared in member posts. For example, "I am proud", "I am optimistic", or "I am fearful", "I am worried", etc. The comments celebrating or lamenting the event were mostly about the way the writer felt about the event, not about the event itself. That looks like a subtle difference but it reveals a demarcating line between an introverted reaction vs. an extroverted one.

None of this is too surprising because even in normal times, Facebook's format and primary raison d’être are to enable people to talk about themselves and to update their friends on their comings and goings. On any given day outside of an election period, the blue bannered webpage seems to be 80% introversion (photos and news of one's own family, or one's own meal, or one's own travels, challenges and accomplishments) and 20% extroversion (posts of articles about third parties).

Anatomy of a Crash

It was surprising however to observe the same I, me, my phenomenon in the columns of major newspapers in the immediate aftermath of the election. Leading columnists were unusually introspective, if not introverted. Writing in the first person, they felt homeless in America, were horrified, struggled to absorb the impossible and vowed to fight back.

Of course, columnists are often media superstars and their extensive use of the first person may come from a deliberate effort by the newspaper editors to render the news commentary more personal. That coloring was certainly in full relief in the angst-ridden I haven't slept in my room since the election and Trump's election stole my desire to look for a partner among others.

Nonetheless, whether deliberate or incidental, the I me my device can be seen as a sign that leading dailies, or at least their op-ed pages, have over the years drifted from extroverted to introverted, from objective analysis to star-studded opinion.

In reality, the op-ed pages need not be so full of personal opinion and subjective thoughts and feelings. Opinion can be objective analysis, and as such can become an arms length discussion of facts without necessarily pointing the reader towards the author's own views. The op in op-ed then becomes an invitation and encouragement to the reader to form his own opinion, instead of a presentation of the writer's opinion. Fairly or unfairly, the value placed on the latter has been in steady decline for many years.

The presentation of facts in support of this new approach requires the inclusion of more soft and hard information and data. As W. Edwards Deming was fond of saying, "without data, you are just another person with an opinion", or, at his more whimsical, "in God we trust; all others must bring data". Data in an op-ed does not have to be numerical, so long as the tone and content are objective and analytical. Of course there is some subjectivity in choosing one set of data or facts vs. another but a writer will not be credible if the scope of his analysis is too narrow. An article is enriched by the addition of more and more data. It should be as full of data as possible and as short as necessary to make it a compact and quick read.

This is painting with a broad brush and we should recognize that the leading dailies still produce outstanding content, including on the op-ed page. But it is fair to say that, in reflecting and understanding the general mood of the country, these papers were blindsided by the more recent upstarts of the internet age and even by savvy Twitter users like Mr. Trump himself and others.

Social media has revalued upwards the opinion of every person with a computer or smartphone and simultaneously devalued professional opinion leaders such as newspaper columnists, academics and others. Remember that Time Magazine's Person of the Year in 2006 was YOU. Perhaps it is the new competition from you and from bloggers and micro-bloggers that has led these columnists to emphasize the first person in their writings as if to remind us that their credentials far outweigh those of the random blogger across town. Indeed they do. But in today's free for all media, opinions are increasingly judged on their own merits, and not as much by the identity of the writer.

Here is the key to understanding the news media's endless travails. Of course, digital and social media have played a big role in the decline of advertising at major newspapers, but so has each paper's own approach to news and commentary. A good first step towards recovery would be to excise or minimize I, me, my from the op-ed page and to shift the whole tenor from introversion to extroversion. With data and facts presented in a rigorous and coherent manner, a columnist becomes much more than "just another person with an opinion".

Scraping the Bottom

At first blush, the current state of play is not that encouraging. In the world of the internet, of blogging, of Facebook and BuzzFeed, it has become more difficult for legacy newspapers to keep up with a changing audience. Millennials may be more interested in short articles that combine news and entertainment than in the type of long form articles and analyses that are the hallmarks of the New York Times and other leading dailies.

To gauge the prevailing mood, consider the table below which shows the results of several Google searches on November 18th, a randomly chosen date. Although cronyism is arguably a real scourge of our time, there were on Google only 348,000 results for "Hillary cronyism" and 423,000 results for "Trump cronyism". What is important in the table is how these numbers compare to other searches. Some serious crises like "Flint Michigan water" log in at less than two million results, but the distracting "Trump Rosie" has over 9 million and the promised "Trump build a wall" nearly 35 million, while itself only one tenth of the ubiquitous mega blockbuster "Trump Twitter".


Clearly, the more important items are under-covered while the ephemeral and insubstantive get a ton of coverage. It is possible however that this trend towards the superficially satisfying has run its course and that traditional news can regain some advantage. As with any downward spiral, recovery seems more plausible after hitting bottom. Strong brands in any sector can be tarnished for a while but in most cases they can adapt and enjoy a lasting rebound under altered circumstances.

Although no one can make this prediction with high confidence, there is a nebulous long-observed propensity for big trends to reverse themselves once they have reached an extreme point, as the devaluation of the media has on November 8th. There is also an increasing desire among news consumers to gravitate back to the great time-tested brands in order to gain some immunization against the so-called post-truth world.

Note for example that since the election, The New York Times has seen a ten-fold increase in daily subscription sign-ups, a signal that many readers are returning to more established brands at a time when fake news is spreading over the internet. Yet this surge may prove short lived if real reforms are not implemented in the wake of the election surprise.

At any rate, a total subscription count of 2.5 million at the Times seems exceedingly low for what is one of the top news brands in the world. Further, the market value of the New York Times company at $2.4 billion, though it has risen 30% since the election, still underestimates the full potential of the brand.

Sami Karam is the founder and editor of populyst.net and the creator of the populyst index™. populyst is about innovation, demography and society. Before populyst, he was the founder and manager of the Seven Global funds and a fund manager at leading asset managers in Boston and New York. In addition to a finance MBA from the Wharton School, he holds a Master's in Civil Engineering from Cornell and a Bachelor of Architecture from UT Austin.

Photo: ‘New York Times’ photo Copyright © 2016 populyst.net.

Back to the Future: Moving Interstate Again, to the South and West

$
0
0

New data from the Census indicates that population growth and domestic migration patterns have continued to move away from the East and the Midwest to the South and West, at accelerated rates. Equally important, pre-Great Recession interstate mobility rates have been restored.

The just released Census Bureau population estimates for the nation, states and the District of Columbia indicate a population increase for the South of 7.7 million between 2010 and 2016. The West gained 4.7 million. By contrast, the Midwest grew 1.1 million, while the East was even lower, at 900,000 (Figure 1). 

Combined, the South and West accounted for 87 percent of the national growth. In 2011, the South and West captured 82 percent of the national growth. By 2016, the South and West had risen to 94 percent of the national population increase. The South, alone had 57 percent of the growth, up from 52 percent in 2011. The West also had a strong gain, from 31 percent in 2011 to 36 percent in 2016.

Domestic Migration

Not surprisingly, the South and West also dominated net domestic migration --- the movement of residents from one state to another (Figure 2). The South attracted 2.3 million people from other regions, more people than live in the cities (municipalities) of Philadelphia and Boston combined. The South dominated domestic migration even more than population growth, attracting more than four times the new residents as the West, which had a net inflow of more than 500,000.  The Northeast lost 1.6 million domestic migrants, nearly as many people as live in Rhode Island and Vermont. The loss in the Midwest was 1.2 million, more people than live in the cities (municipalities) of Minneapolis, Cleveland and St. Louis combined.

The South also led in the percentage of net domestic migrants in relation to the 2010 population, at 2.0 percent, nearly three times that of the West (0.7 percent).  The net loss in the Midwest was 1.8 percent, while the East sustained a loss of 2.9 percent (Figure 3)

Perhaps most surprisingly, the South also led in population gains from immigration. Between 2010 and 2016, the South added 2.2 million foreign migrants. The East added 1.6 million, the West 1.3 million and the Midwest 800,000 (Figure 4).

State Population Trends

Texas has led the nation in total population growth. Total population growth includes the natural change (births minus deaths), international migration and net domestic migration.  Texas added 2.7 million residents, a 10.8 percent increased compared to its 2010 population. This is more than double the national rate of 4.7 percent. California was well behind, with a gain of 2.0 million, despite having started the decade with a 50 percent higher population. California’s growth rate was 5.3 percent.

Florida added the third largest number of new residents, at 1.8 million, for a 9.6 percent growth rate from 2010. After that the gains were much less. Georgia and North Carolina gained somewhat more than 600,000. Washington, Arizona and Colorado added between 500,000 and 600,000 residents. Virginia and New York rounded out the top ten (Figure 5). New York generated large numeric, but small proportional increases early in the decade (1.9 percent), the result of its fourth largest population, after California, Texas, and Florida.

Three states suffered population losses over the period. Illinois lost 30,000 residents and West Virginia lost 20,000. Vermont lost 1,000 and was joined by New England neighbors Maine, New Hampshire, Connecticut and Rhode Island in the bottom 10. However, Maine has begun to gain again (below). The bottom 10 included one southern state, Mississippi and two western states, Wyoming and New Mexico (Figure 6)

State Domestic Migration Trends

Throughout the decade, Texas has led in net domestic migration. But the race is much closer, with the Longhorn state leading second ranked Florida by only 500. Both states have gained between 866,000 and 867,000 net new residents from domestic migration since 2010 (Figure 7). Perhaps due to the energy downturn, domestic migration to Texas dropped by more than one-quarter, while Florida continued led the nation for the second straight year. In 2016, Florida added 207,000 net domestic migrants, compared to the Texas gain of 126,000. With the improving prospects for energy under the Trump administration, the competition could be stiff between the two states in the years to come.

Other net domestic migration leaders added between 200,000 and 250,000, including Colorado, North Carolina, Arizona and South Carolina. Washington, Oregon, Tennessee and Georgia added between 100,000 and 200,000 net domestic migrants, as did Nevada, which ranked 11th, a remarkable turnaround. Nevada as well as Arizona, Georgia suffered serious setbacks during the Great Recession, but now show signs of significant recovery.

The East and Midwest had a near monopoly on the bottom 10 in net domestic migration. New York lost 867,000 net domestic migrants, while Illinois lost 540,000. California’s loss was 383,000. New Jersey lost 336,000 and Michigan 216,000. Pennsylvania, Ohio and Connecticut lost between 100,000 and 200,000, while Maryland and Massachusetts lost between 70,000 and 100,000 (Figure 8).

New York had the largest net domestic migration loss in 2016, at 191,000. Illinois lost 114,000, closely followed by California, at 109,000.

Highlights

The data also indicates significant shifts in growth rates during the decade.

The largest drop was in the East, where the total population gain dropped 90 percent, from 245,000 in 2011 to 24,000 in 2016. In the Midwest, growth dropped from 174,000 to 103,000. Meanwhile, population rose 1,281,000 in the South, up from 1,199,000 in 2011. The West had the largest gain, from 697,000 to 822,000.

New York’s population gain has declined every year, from 117,000 in 2011 to 27,000 in 2015 and a loss of 2,000 in 2016. Pennsylvania lost 8,000 residents in 2016, down from a 32,000 gain in 2011.

Not all states in the West had positive trends. California gained only 256,000 in 2016, down from 344,000 in 2011. California’s gain dropped nearly 20 percent in just the last year. In 2016, California’s percentage growth trailed that of the United States for the first time in the decade (6.6 percent compared to the national rate 7.0 percent).  Between 2011 and 2015, California’s average, at 8.6 percent, was well above that of the nation (7.3 percent).

The states to which Californians migrate in the greatest numbers gained as a result. Nevada’s population gain nearly quadrupled between 2011 and 2016, Idaho, Oregon and Arizona approximately doubled, while strong improvements were registered in Washington, Colorado and Utah.

Florida added 367,000 new residents, a strong gain from the 2011 level of 247,000, while South Carolina’s gain nearly doubled. North Carolina, Georgia, Tennessee and Texas posted healthy increases. However, Maryland’s growth fell by more than one-half (55,000 to 21,000), while Virginia saw its gain drop from 84,000 in 2011 to 44,000 in 2016.

Pervasiveness of Declining Growth

At the national level, the annual growth rate continues to trend downward. In 2011, the United States added 0.75 percent to its population. By 2016, the rate had dropped to 0.70 percent. In 30 states, plus the District of Columbia, the growth rate dropped between 2011 and 2016.

On the other hand, 20 states had stronger growth rates in 2016 than in 2011. Given the utter domination of the trends by the South and West, it is surprising that seven of these states are outside the West.

In the East, the New England states of Maine, New Hampshire and Rhode Island had higher growth rates in 2016. At the same time, Vermont, where similar trends might be anticipated, slipped from modest growth in 2011 to a decline in 2016.

Four Midwestern states also grew faster in 2016 than in 2011. These include Michigan, Missouri, Nebraska and Ohio. Michigan, the only state to reach more than 10 million and then fall below, has gained four years in a row, though remains below 10 million.

Among these seven states, only Nebraska exceeded the national growth rate in 2016.

Natural Increase Down, Mobility Up

The natural population growth rate (births minus deaths) dropped from 4.7 percent in 2011 to 3.8 percent in 2016. At nearly 20 percent (18.8 percent), this is a huge reduction in just five years. At the same time the Great Recession-interrupted interstate mobility seems to have recovered. In 2016, there were 825,000 interstate moves, more than double the post-2000 low of 411,000 in 2011. The 2016 interstate move figure was greater than all but the three largest Housing Bubble years, 2005, 2006 and 2007. The 2016 moves also exceeded the 2001 to 2009 average by more than 10 percent (Figure 9).

Back to the Future

As we get farther from the Housing Bust and the Great Recession, population growth and domestic migration seem to be increasingly restored to prior trends around the nation.

Wendell Cox is principal of Demographia, an international public policy and demographics firm. He is a Senior Fellow of the Center for Opportunity Urbanism (US), Senior Fellow for Housing Affordability and Municipal Policy for the Frontier Centre for Public Policy (Canada), and a member of the Board of Advisors of the Center for Demographics and Policy at Chapman University (California). He is co-author of the "Demographia International Housing Affordability Survey" and author of "Demographia World Urban Areas" and "War on the Dream: How Anti-Sprawl Policy Threatens the Quality of Life." He was appointed to three terms on the Los Angeles County Transportation Commission, where he served with the leading city and county leadership as the only non-elected member. He served as a visiting professor at the Conservatoire National des Arts et Metiers, a national university in Paris.

Photo of Zion National Park in Utah, the nation's fastest growing state by Tobias Alt - Own workGFDLLink

Edward Hopper’s Rockford

$
0
0

I had dinner in Rockford, Illinois recently with Jennifer and Michael Smith of the City Smiths. You will never find a more charming, kind, and industrious couple. Any town would be lucky to have such passionate and engaged citizens.

Rockford has good bones: a diversified economy, a well educated population, a bountiful rural hinterland, and ready access to Chicagoland. I’ll blog about that some other time with selected photos I took yesterday afternoon. But it’s breakfast time here in Chicago and I thought I’d do something a little different for the moment. I’m posting photos of the drive away from the restaurant in downtown Rockford as I made my way toward the Interstate after dinner.

img_3145-1024x683https://granolashotgun.files.wordpress.com/2016/10/img_3145-1024x683.jpg... 150w, https://granolashotgun.files.wordpress.com/2016/10/img_3145-1024x683.jpg... 300w, https://granolashotgun.files.wordpress.com/2016/10/img_3145-1024x683.jpg... 768w" sizes="(max-width: 1024px) 100vw, 1024px">

img_3319-1024x683https://granolashotgun.files.wordpress.com/2016/10/img_3319-1024x683.jpg... 150w, https://granolashotgun.files.wordpress.com/2016/10/img_3319-1024x683.jpg... 300w, https://granolashotgun.files.wordpress.com/2016/10/img_3319-1024x683.jpg... 768w" sizes="(max-width: 1024px) 100vw, 1024px">

img_3324-1024x683https://granolashotgun.files.wordpress.com/2016/10/img_3324-1024x683.jpg... 150w, https://granolashotgun.files.wordpress.com/2016/10/img_3324-1024x683.jpg... 300w, https://granolashotgun.files.wordpress.com/2016/10/img_3324-1024x683.jpg... 768w" sizes="(max-width: 1024px) 100vw, 1024px">

My conversations with people all across the country tend to focus on the quality of the downtown core, the prosperous suburban landscape, the public schools, the dynamics of municipal finance, the palace intrigue of local politics, blah, blah, blah. And then, inevitably, I hop in the car and head out through the reality of what every American town actually is.

img_3369-1024x683https://granolashotgun.files.wordpress.com/2016/10/img_3369-1024x683.jpg... 150w, https://granolashotgun.files.wordpress.com/2016/10/img_3369-1024x683.jpg... 300w, https://granolashotgun.files.wordpress.com/2016/10/img_3369-1024x683.jpg... 768w" sizes="(max-width: 1024px) 100vw, 1024px">

img_3323-1024x683https://granolashotgun.files.wordpress.com/2016/10/img_3323-1024x683.jpg... 150w, https://granolashotgun.files.wordpress.com/2016/10/img_3323-1024x683.jpg... 300w, https://granolashotgun.files.wordpress.com/2016/10/img_3323-1024x683.jpg... 768w" sizes="(max-width: 1024px) 100vw, 1024px">

img_3241-1024x683https://granolashotgun.files.wordpress.com/2016/10/img_3241-1024x683.jpg... 150w, https://granolashotgun.files.wordpress.com/2016/10/img_3241-1024x683.jpg... 300w, https://granolashotgun.files.wordpress.com/2016/10/img_3241-1024x683.jpg... 768w" sizes="(max-width: 1024px) 100vw, 1024px">

img_3325-1024x683https://granolashotgun.files.wordpress.com/2016/10/img_3325-1024x683.jpg... 150w, https://granolashotgun.files.wordpress.com/2016/10/img_3325-1024x683.jpg... 300w, https://granolashotgun.files.wordpress.com/2016/10/img_3325-1024x683.jpg... 768w" sizes="(max-width: 1024px) 100vw, 1024px">

img_3401-1024x683https://granolashotgun.files.wordpress.com/2016/10/img_3401-1024x683.jpg... 150w, https://granolashotgun.files.wordpress.com/2016/10/img_3401-1024x683.jpg... 300w, https://granolashotgun.files.wordpress.com/2016/10/img_3401-1024x683.jpg... 768w" sizes="(max-width: 1024px) 100vw, 1024px">

This drive-thru Edward Hopper dreamscape goes on for miles in every direction. Pound for pound this is what constitutes the bulk of the built environment – or at least what passes for the public realm. This is where we all get our transmissions repaired, take our meals, have our hair done, and buy our groceries. This is where a significant proportion of the population works each day. This is our tax base. This is our infrastructure burden. At the very least this is what we all pass through on our way to other places.

img_3384-1024x683https://granolashotgun.files.wordpress.com/2016/10/img_3384-1024x683.jpg... 150w, https://granolashotgun.files.wordpress.com/2016/10/img_3384-1024x683.jpg... 300w, https://granolashotgun.files.wordpress.com/2016/10/img_3384-1024x683.jpg... 768w" sizes="(max-width: 1024px) 100vw, 1024px">

img_3381-1024x683https://granolashotgun.files.wordpress.com/2016/10/img_3381-1024x683.jpg... 150w, https://granolashotgun.files.wordpress.com/2016/10/img_3381-1024x683.jpg... 300w, https://granolashotgun.files.wordpress.com/2016/10/img_3381-1024x683.jpg... 768w" sizes="(max-width: 1024px) 100vw, 1024px">

img_3391-1024x683https://granolashotgun.files.wordpress.com/2016/10/img_3391-1024x683.jpg... 150w, https://granolashotgun.files.wordpress.com/2016/10/img_3391-1024x683.jpg... 300w, https://granolashotgun.files.wordpress.com/2016/10/img_3391-1024x683.jpg... 768w" sizes="(max-width: 1024px) 100vw, 1024px">

Forget downtown. It’s a tiny speck on the map compared to the endless buffet of strip malls and parking lots that have engulfed it. Let go of the ideaof comfortable homes set in pristine leafy cul-de-sacs. These muffler shops and fast food outlets are the lion’s share of what we’ve created for ourselves. There’s so much of this stuff everywhere that these establishments will continue to define our communities for the next couple of generations. We’ll need to maintain them, reinvent them, or deal with the consequences of letting them decline. I don’t hear people talk much about that process, most likely because no one’s thinking about it. These places aren’t worthy of consideration.

img_3353-1024x683https://granolashotgun.files.wordpress.com/2016/10/img_3353-1024x683.jpg... 150w, https://granolashotgun.files.wordpress.com/2016/10/img_3353-1024x683.jpg... 300w, https://granolashotgun.files.wordpress.com/2016/10/img_3353-1024x683.jpg... 768w" sizes="(max-width: 1024px) 100vw, 1024px">

img_3354-1024x683https://granolashotgun.files.wordpress.com/2016/10/img_3354-1024x683.jpg... 150w, https://granolashotgun.files.wordpress.com/2016/10/img_3354-1024x683.jpg... 300w, https://granolashotgun.files.wordpress.com/2016/10/img_3354-1024x683.jpg... 768w" sizes="(max-width: 1024px) 100vw, 1024px">

img_3335-1024x683https://granolashotgun.files.wordpress.com/2016/10/img_3335-1024x683.jpg... 150w, https://granolashotgun.files.wordpress.com/2016/10/img_3335-1024x683.jpg... 300w, https://granolashotgun.files.wordpress.com/2016/10/img_3335-1024x683.jpg... 768w" sizes="(max-width: 1024px) 100vw, 1024px">

img_3332-1024x683https://granolashotgun.files.wordpress.com/2016/10/img_3332-1024x683.jpg... 150w, https://granolashotgun.files.wordpress.com/2016/10/img_3332-1024x683.jpg... 300w, https://granolashotgun.files.wordpress.com/2016/10/img_3332-1024x683.jpg... 768w" sizes="(max-width: 1024px) 100vw, 1024px">

It’s easy to get excited about restoring a magnificent Beaux-Arts theater and contemplate the economic benefits of a reinvigorated historic downtown. It’s equally tempting to shine up a mid-century residential gem to its original Mad Men condition. But what exactly becomes of a defunct gas station that’s already devolved to a scratch and dent used car lot? How do you polish that turd? Keep in mind, the town just spent a few million bucks improving the road that serves this fine specimen of local commerce. Now multiply this place by thousands of similar properties.

img_3201-1024x683https://granolashotgun.files.wordpress.com/2016/10/img_3201-1024x683.jpg... 150w, https://granolashotgun.files.wordpress.com/2016/10/img_3201-1024x683.jpg... 300w, https://granolashotgun.files.wordpress.com/2016/10/img_3201-1024x683.jpg... 768w" sizes="(max-width: 1024px) 100vw, 1024px">

img_3221-1024x683https://granolashotgun.files.wordpress.com/2016/10/img_3221-1024x683.jpg... 150w, https://granolashotgun.files.wordpress.com/2016/10/img_3221-1024x683.jpg... 300w, https://granolashotgun.files.wordpress.com/2016/10/img_3221-1024x683.jpg... 768w" sizes="(max-width: 1024px) 100vw, 1024px">

A newly resurfaced parking lot, some fresh paint, a green lawn and some flowers… Is that the solution? How much lipstick can you put on a pig?

img_3368-1024x683https://granolashotgun.files.wordpress.com/2016/10/img_3368-1024x683.jpg... 150w, https://granolashotgun.files.wordpress.com/2016/10/img_3368-1024x683.jpg... 300w, https://granolashotgun.files.wordpress.com/2016/10/img_3368-1024x683.jpg... 768w" sizes="(max-width: 1024px) 100vw, 1024px">

img_3422-1024x683https://granolashotgun.files.wordpress.com/2016/10/img_3422-1024x683.jpg... 150w, https://granolashotgun.files.wordpress.com/2016/10/img_3422-1024x683.jpg... 300w, https://granolashotgun.files.wordpress.com/2016/10/img_3422-1024x683.jpg... 768w" sizes="(max-width: 1024px) 100vw, 1024px">

img_3230-1024x683https://granolashotgun.files.wordpress.com/2016/10/img_3230-1024x683.jpg... 150w, https://granolashotgun.files.wordpress.com/2016/10/img_3230-1024x683.jpg... 300w, https://granolashotgun.files.wordpress.com/2016/10/img_3230-1024x683.jpg... 768w" sizes="(max-width: 1024px) 100vw, 1024px">

img_3359-1024x683https://granolashotgun.files.wordpress.com/2016/10/img_3359-1024x683.jpg... 150w, https://granolashotgun.files.wordpress.com/2016/10/img_3359-1024x683.jpg... 300w, https://granolashotgun.files.wordpress.com/2016/10/img_3359-1024x683.jpg... 768w" sizes="(max-width: 1024px) 100vw, 1024px">

img_3340-1024x683https://granolashotgun.files.wordpress.com/2016/10/img_3340-1024x683.jpg... 150w, https://granolashotgun.files.wordpress.com/2016/10/img_3340-1024x683.jpg... 300w, https://granolashotgun.files.wordpress.com/2016/10/img_3340-1024x683.jpg... 768w" sizes="(max-width: 1024px) 100vw, 1024px">

This isn’t the kind of conversation that gets much traction at city council meetings. It’s hard to rally civic spirit around the Family Dollar parking lot. But whether we realize it or not our towns will sink or swim based on how well we manage this banal landscape of disposable schlock.

John Sanphillippo lives in San Francisco and blogs about urbanism, adaptation, and resilience at granolashotgun.com. He's a member of the Congress for New Urbanism, films videos for faircompanies.com, and is a regular contributor to Strongtowns.org. He earns his living by buying, renovating, and renting undervalued properties in places that have good long term prospects. He is a graduate of Rutgers University.

All photos by Johnny Sanphillippo

Progressives Have Let Inner Cities Fail for Decades. President Trump Could Change That.

$
0
0

When Donald Trump described the “devastating” conditions in America’s inner cities, emphasizing poor schools and lack of jobs, he was widely denounced for portraying our urban centers in a demeaning and inaccurate way, much as he had been denounced previously for his supposed appeal to “racial exclusion” when he asked black voters “what the hell do you have to lose” by backing him.

To be sure, Trump was tromped in big cities nationwide, losing by stupendous margins, but he actually did a little better than Mitt Romney among black and Hispanic voters, according to exit polls. Still, some urbanistas embraced the idea that even if Trump had won in the electoral college, “the city is ours,” as New York Magazine put it. And our America, those voices maintained, was doing great and would continue to do great even without a friend in the White House.

But as we saw in November, something isn’t so just because the coastal cocooners say it’s so. In reality, if we go beyond the big-city boosterism that dominates media coverage, poverty, crime, and economic stagnation still characterize many urban core neighborhoods even as many downtown districts have recovered. For all the talk about gentrification, concentrated urban poverty has been a persistent and growing problem, with 75 percent of high-poverty neighborhoods in 1970 still classified that way four decades later.

Racial and class inequality is very much alive even in the most “progressive” cities. In New York, the poster child for urban revitalization, poverty and homelessness have worsened, in large part due to soaring housing costs. Since 2007, median rents in the city have gone up 8.5 percent while median renters’ incomes have gone down by 6.8 percent. Particularly shocking have been rent rises at the edge of gentrification, in places like Brooklyn’s Williamsburg—where rents have risen 80 percent since the 1990s.

In most urban areas, particularly outside New York and a few other cities, the much ballyhooed “back to the city” movement — mindlessly overblown by the national media — impacts basically the downtown cores, which account for roughly 1.3 percent of the national population, a percentage they have held since 2000. Some inner-ring communities — often right next to the urban core — have lost population in those 16 years. Overall, the outer suburbs and exurbs, home to more than 40 percent of the metropolitan population, have added population at more than five times the rate of urban cores.

The same pattern applies to jobs. Though some cores have gained some employment, that’s been offset by big losses in the surrounding urban neighborhoods for an overall decline in the number of jobs in and around most city centers.

Bottom line: The suburbs and exurbs disdained by most urbanists and Democratic politicians continue to add residents and jobs as inner cities continue to languish.

In fact, roughly 80 percent of all job growth since 2010 has been in suburbs and exurbs. And tech, supposedly newly focused on the urban core, still concentrates largely in dispersed, suburban environments from Silicon Valley to Austin to Raleigh.

Rather than clustering downtown, most rapid growth is now in what may be seen as post-suburban cities, places like Irvine, California, Overland Park, Kansas, or Frisco, outside Dallas, where single family neighborhoods and cars co-exist with dense office parks and often expanding town centers. And with millennials now entering their thirties in greater numbers, these communities, generally safe and with good schools, seem to be growing in popularity much faster than the inner cities. These are unfortunate facts for Democrats, who have long celebrated, sometimes garishly, cities’ glaring problems—thus helping make Trump’s campaign comments sound that much more reasonable.

Trump’s pick of Ben Carson to run the Department of Housing and Urban Development has horrified some retro-urbanists who point to his lack of experience with housing issues, let alone running a $50-billion-a-year agency. Yet given the obvious failures of existing policies, an outsider may prove something of a blessing—if he comprehends the nature of the challenge.

During the past decade, urban boosters have hailed “the rise of creative class,” reflected by the migration of educated millennials to “hip and cool” cities including New York, San Francisco, Seattle, and Portland. Yet as Richard Florida, who coined the term “creative class” has since observed, gentrification has not made life better for most urbanities, as the rise in housing costs has outpaced that in wages, making those cities even less affordable. The creative class certainly improved selected parts of urban America, but for the most part urban poverty, including homelessness and hunger, has barely been dented by gentrification and in some cases may have been made worse.

This poor result reflects the failure of urban policies that have been promoted by the very interests—particularly real-estate speculators and big-city politicians who count on them—that most strenuously oppose Trump and his pick of Carson in particular. Those policies include redevelopment that often serves to push inner-city residents from their homes—with HUD in the worst cases trying to lure poorer populations out of their cities altogether.

Those moves happened even as more upwardly mobile minorities headed in huge numbers to the periphery. Since 2000, notes demographer Wendell Cox, more than 95 percent of the minority population growth in the 52 largest metropolitan areas has been in suburban and exurban areas.

In Portland, minority neighborhoods close to downtown have been resettled, with encouragement from the progressive government, by upscale hipsters. Indeed, the largest reductions of African-American populations, and occasionally of Latinos as well, have taken place in precisely the bluest cities such as SeattleBoston, and San Francisco in what becomes a genteel exercise in whitewashing.

Even in more diverse cities such as Chicago, notes urban analyst Pete Saunders, city policies have been designed that force poorer, largely minority areas out of areas that, in essence, are considered too valuable for such populations. The results of dislocation, Saunders notes, has created a kind of progressive apartheid, where blacks and other minorities are driven away from neighborhoods that have been their home for generations. He describes Chicago poignantly as “one third San Francisco and two-thirds Detroit.”

Increasingly, at least in the centers of the greatest hipster infestation, minorities and working class families are being driven into less desirable areas, often further from work locations. This helps create new social tensions and, in many places, notably Chicago, more social unrest, and now the most murders in more than two decades. Overall, the rate of violent crime in urban cores remains almost four times higher than the national average, according to FBI data. The worst violence, and the sharpest upticks over the decade have been in cities with large black populations, including Detroit, Oakland, St. Louis, Memphis, Cleveland, and Atlanta.

Left out of the urban revival, minority and poor communities face diminishing opportunities while others prosper. This is true not only in places like Chicago, notes researcher Daniel Hertz, but also in New York where class and race inequality are much higher than in the rest of the country. Generally speaking, it’s the bluest and largest cities that suffer the worst levels of inequality.

Indeed despite the media spin, in the core cities of the 51 metropolitan areas, 81 percent of the population increase over the past decade was under the poverty line, compared to 32 percent of the suburban population increase. Despite talk about “suburban ghettos,” the poverty rate in the suburbs remains roughly half that of urban centers (20.9 percent in core compared to 11.4 percent in the suburbs as of 2010). Crime rates in core cities, meanwhile, remain over three times higher than in the suburbs.

No surprise that discrete and genteel “ethnic cleansing”—in the form of HUD “affirmative action” or taxpayer funded redevelopment—appeals to many urban boosters. In contrast, the much sought after hipster and wealthy childless adults thrill developers and mayors; they love a population that will pay a premium to live there and that doesn’t need good schools or working-class jobs.

If lack of commitment to pre-existing failure offers some hope to Trump and Carson, the non-existence of a programmatic agenda represents the significant downside. Trump, after all, hardly built his career in fighting poverty; his business of building luxury high-rises hardly made him a natural ally to the diminishing ranks of working- and middle-class urbanites.

Certainly, the new HUD should abandon its agenda of redirecting populations, or forcing high density on reluctant communities, whether in the poorer urban neighborhoods or the more comfortable suburbs. But there needs to more. One hopeful sign—particularly for cities in the heartland—would be attempts to keep industrial jobs in what’s left of the manufacturing economy, the loss of which has devastated cities such as Milwaukee. Similarly Trump’s stand against H-1B visas could help keep some white-collar positions in the hands of citizens residing in our cities, including on the coasts.

Other steps could be taken to reawaken the grassroots economy, particularly in hard-hit poorer neighborhoods. This might include such things deregulating some businesses, like in cosmetology, and making it easier for new restaurants and shops. Yet these things cannot be mandated from Washington; it will take some rise in the level of business savvy of our elected leaders in cities. Perhaps most critical will be addressing the escalating crime rate in many cities, where by far the vast majority of victims are minorities, as Trump himself pointed out.

Other parts of the potential Trumpian urban agenda, such as charter schools and vouchers, long supported by his Education Department nominee Betsy DeVos, could help address poor urban education, arguably the biggest reason why families don’t stay in cities like Chicago with their dysfunctional schools. Federal support for educational reform is vastly preferable to the kind of anti-charter agenda that, for example, Hillary Clinton, with her incestuous ties to the teacher unions, would have promoted.

Similarly, a shift away from “one size fits all” transportation policies might allow communities to build public transit options, ranging from bus rapid transit to innovative dial-a-ride services. Under the old regime, money tended to go into light rail and trolley projects designed to appeal to upscale riders and developers; a better focus on inner city needs might be actually helping working class people actually get to work as quickly and easily as possible, at reasonable cost rather than building dedicated lines that tend to push land prices up, and existing residents out.

Even if Carson can concoct such an agenda, this is unlikely to make Donald Trump popular among the retro-urbanist chattering class who have thrived under the current urban regime. But it is to be hoped that such a new approach, at very least, could finally make progressives, who control America’s big cities as virtual fiefs, reconsider policies that have led to tragic levels of impoverishment, violence, and inequality across our great urban centers.

This article first appeared on The Daily Beast.

Joel Kotkin is executive editor of NewGeography.com. He is the Roger Hobbs Distinguished Fellow in Urban Studies at Chapman University and executive director of the Houston-based Center for Opportunity Urbanism. His newest book, The Human City: Urbanism for the rest of us, was published in April by Agate. He is also author of The New Class ConflictThe City: A Global History, and The Next Hundred Million: America in 2050. He lives in Orange County, CA.

Photo by Gage Skidmore [CC BY-SA 3.0], via Wikimedia Commons

Carrier and the Commonwealth

$
0
0

I was asked by Fortune to contribute a piece about Trump’s Carrier deal. They had gotten a lot of people criticizing it and were looking for someone who would give a different perspective. I think many of the criticisms are valid in a sense, but miss the larger context. So I wrote the piece which is now online. Here’s an excerpt:

Alexis de Tocqueville pointed out that one of the keys to America’s unique success was its sense of enlightened self-interest. Americans worked and competed hard for themselves, their families, and their businesses, but they understood that a purely selfish mindset was self-destructive in the long term. Tocqueville observed inDemocracy in America, “Each American knows when to sacrifice some of his private interests to save the rest; we [the French] want to save everything, and often we lose it all.

Businessmen once understood this link between national, local, and personal success. The men of the Commercial Club of Chicago who commissioned Daniel Burnham to create his famed 1909 plan for that city had personal fortunes deeply tied to Chicago. They needed the city as a whole to succeed for them to succeed. Likewise, General Motors CEO Charles Erwin Wilson once famously said, “For years I thought what was good for our country was good for General Motors, and vice versa.” He understood that his company’s fortune and America’s were intertwined: GM couldn’t make any money if no one could afford to buy its cars.

As these restrictions were lifted, these businesses left enlightened self-interest behind in favor of quarterly profits. They forgot their community in favor of global capital. Their business models evolved to delink profits and executive compensation from broad-based American prosperity. They could take a portfolio view of local communities and even countries. It was all very economically efficient. These firms and their managers could thrive even while much of America fell into ruin. Or so they thought.

Click through to read the whole thing.

Some people were a bit critical, saying, “Why not say this when Obama bailed out the auto industry?” or “Why is it only good when Trump does it?” In fact, I’ve actually written on this theme before.

Back in November 2008, shortly after Obama’s election, I posted a piece in which I criticized the auto companies’ management and came out in favor of a federally backed restructuring of the auto industry. While I am critical of some aspects of how Obama handled this, the idea of bailing out the car companies was something I was on record as supporting before it happened. Here are some excerpts from that:

Even if you assume a lot of this [auto company management behavior] is exaggerated for effect or outright BS, I’ve heard so many similar type things from people who’ve been associated with the auto industry that there must be a kernel of truth in it somewhere. I lead with this because it is so common to blame the UAW and its $73/hour or some such wage packages for the problems facing the Big Three. And indeed in the modern era that is not sustainable. But there has been particularly little focus on the management excesses of the auto industry, and the corporate cultures of those companies, and by analogy that of Detroit.

I’ve seen estimates that 2-3 million jobs could be lost and that chaos would ensue if the auto makers went bankrupt. That’s probably true if GM, Ford, and Chrysler just waltz down to the court house and file. But it is not the case if they have a government sponsored, pre-packaged bankruptcy.

Even so, we can’t lose track of the fact that there are real human beings, labor and management, with real trauma in their lives. Even if they are at least partially to blame for the mess they are in, that doesn’t mean they deserve what they are getting. It’s like a Greek tragedy: the suffering is disproportionate to the crime. And there but for the grace of God go you and I. I also work in a restructuring industry, and may yet join the auto workers in their pain.

The stories you hear in the Detroit papers are heartbreaking. One that really stuck with me was about people losing their life’s possessions when they couldn’t pay the rental fees on storage lockers. People who had already lost their homes to foreclosure put their possessions in storage, only to lose them too as the storage companies auctioned them to pay the bills. I’m not an emotional guy, but this makes me sick to my stomach. I don’t know about you, but I don’t think this should be happening in a country like America. People who made decisions in good faith, who showed up to work every day, who did the right things to care for their families, shouldn’t be left to lose everything because of the action of economic forces they can’t understand or control. Not in America. That’s why we absolutely need a federal safety net program here. Michigan alone can’t fund this.

I probably anticipated more of a bite the bullet approach than actually happened (which is one reason restructuring is still ongoing), and my views have probably changed somewhat in eight years, but clearly the same general themes are present.

Where I would take issue with Trump, is in the idea of “bringing the jobs back” as the theme. This sort of nostalgia for a bygone idyllic era that never really was is powerful in the Midwest. It’s very backwards looking and based on a language of resentment. I can understand why the appeal to this works rhetorically, but as an actual policy goal it’s not realistic. The ship has already sailed too far to return to the harbor. That doesn’t mean we should double down on the status quo, but we’ll have to chart a different path forward to the future, not roll back the clock. (Fortunately, Trump’s working class supporters seem realistic on this point and don’t expect him to literally do every single thing he said).

This perhaps explains why I’m more positive on intervention to save existing jobs than to try to lure new ones. That and the difference in the price tags. It’s one thing to try to preserve actually existing businesses already woven into the fabric of the community, but it’s another to try to speculatively create something new. I’m not under any illusion that we’ll get rid of economic incentives, but it does seem excessive to me to spend, say, $750 million (corruptly, as it appears to have turned out) to lure a solar panel factory to Buffalo. I’m ok with the idea of spending a billion dollars of state money in Buffalo, but there have to be better ways to do it. (Mayor Stephanie Miner of Syracuse said if she had a billion, she’d spend three fourths of it to fix her city’s water pipes – a prescient pledge made prior to the Flint debacle).

It’s also the case that we need to be willing to face the unpleasant reality that many communities are poorly positioned for the future economy. That doesn’t mean abandoning them, but we do have to level with them. And those communities, not just the federal government, also need to be willing to make some changes.

But all that doesn’t mean that simply pushing forward with more of what we’ve already been doing is a viable option. Trump understood that, and beyond the politics of it, the Carrier deal was a symbol that he intends to pursue a new direction.

Update: In line with these themes, a commenter pointed me at this recent blog post by South Bend mayor Pete Buttigieg.

Aaron M. Renn is a senior fellow at the Manhattan Institute, a contributing editor of City Journal, and an economic development columnist for Governing magazine. He focuses on ways to help America’s cities thrive in an ever more complex, competitive, globalized, and diverse twenty-first century. During Renn’s 15-year career in management and technology consulting, he was a partner at Accenture and held several technology strategy roles and directed multimillion-dollar global technology implementations. He has contributed to The Guardian, Forbes.com, and numerous other publications. Renn holds a B.S. from Indiana University, where he coauthored an early social-networking platform in 1991.

Photo: By Carrier Corporation (http://www.teamworkmarinesxm.com/) [Public domain], via Wikimedia Commons


Generation X's Moment Of Power Is Almost Here

$
0
0

It certainly seems as if boomers are in charge in America now, with Donald Trump about to move into the White House and members of the generation in the majority in Congress. Meanwhile, huge attention has been paid over the past few years to the emergence of the boomers’ children, the millennials, on the national scene. But relatively little thought has been accorded to the group sandwiched between the two mega-generations: Generation X.

Referred to by some pundits as a “lost generation,” the Xers, born between the mid-1960s and 1980, may be less numerous than either the boomers or millennials, the latter of whom now slightly outnumber them in the workforce, but Gen X seems likely to dominate the near future. Not only do they now make up the majority of of managers at U.S. companies, they are far more entrepreneurial than millennials, both at early ages and now. Their rate of startup formation is roughly twice that of millennials, and on the way up, while the younger generation’s rate has been on the decline. 

Financially, they are clearly the ascendant generation. According to analysis by the Deloitte Center for Financial Services, they now have 14 percent of the nation’s wealth compared to just 4 percent for millennials and 50 percent for the boomers. But by 2030, as the boomers finally start to fade from the picture, Xers will dominate the nation’s wealth, accounting for 31 percent, twice the projected share of millennials.

Politically they also seem destined to take power next. They are gradually replacing the aging boomers in Congress. Their politics are neither as conservative as the boomers nor as liberal as millennials: younger Xers tilted slightly to Clinton in the last election, older ones favored Trump. Right now there are 117 Xers in Congress compared to five millennials, with the most prominent being House Speaker Paul Ryan; it will likely take a generation or more for the millennials to challenge the Xers.

To be sure, millennials will dominate the future eventually, but the question is when. Boomers are living, and working, longer than ever. Over time, though, millennials’ overlords will come from the smaller but more aggressive X generation. Unlike the millennials, who received participation trophies and “good job” plaudits, notes generational analyst Morley Winograd, the Xers were the original “latch-key” kids who were forced to make their way in a county dominated by Boomers.

Critically, however much millennials may talk about changing the world, as a group they are entrepreneurial laggards, in large part responsible for America's current depressed startup rates, the lowest in a quarter century. It’s the Xers -- less coddled, with less college debt and just enough experience -- who are starting and running more of the economy. In a word, they are tough, used to adversity and their time is coming. 

X-Strong Metropolitan Areas

With all these considerations in mind, we decided to take a close look at which metropolitan areas have been gaining the largest shares of 35 to 49 year olds, currently the Xers. This is critical not only because of their economic influence, but also because they are the ones who have the most children. If a metro area's share of this age group is growing, it is likely to have more young people as well. 

Using Census data from 2000 to 2015, we found that the share of 35 to 49 year olds grew most dramatically in the affordable Sun Belt. This makes sense as this is the age when home ownership is most critical and people are looking for the maximum income relative to costs. Being in your late 30s to 50 does not mean you have lost the ability to dream, but it does make addressing reality far more imperative than when in your 20s.

Many of the metropolitan areas where the 35-49 population has grown the most are precisely those that have topped most of our best city lists. At the apogee is Austin, whose 35 to 49 year old population has expanded a remarkable 44.9% since 2000, compared to a 6.6% national decline in this age range over that period. This suggests that although the bar scene and liberal politics appeal to many, other characteristics -- such as relatively low housing prices, attractive suburbs and good-paying jobs -- seal the deal for 35 to 49 year olds. 

Housing and rent differentials have been particularly determinative for today’s 35 to 49 year olds. They suffered the most from the housing bust of 2007 and are only now entering the market with full force. They may not be able to afford the high prices of houses owned by coastal boomers, but they seem to be entering aggressively less expensive markets. Another reason they may be heading to these areas is to buy bigger houses than the small units now in vogue among millennial-craving builders. 

Virtually all the other places that have experienced the biggest shift in this age group follow this pattern. No. 2 Raleigh-Durham’s population of 35-49s grew 40.1 percent, or 50.1 percent compared to the national rate, for many of the same reasons as Austin. Other places that attract these ages are generally low-priced dynamos, including No. 3 Las Vegas, No. 4 Charlotte, No. 5 Phoenix, and No. 8 Salt Lake City. Texas dominates the list here with four of the top ten, including No. 7 Houston, No. 9 Dallas-Ft. Worth and No. 10 San Antonio. 

If we tighten of measurement to the years 2010 to 2015, the pattern is largely the same except for the emergence in the top 10 of such tech havens as metropolitan Denver and Portland, which have done very well during the tech boom. Yet surprisingly the 35 to 49 year old population share has remained stagnant in the epicenter of the “new economy,” the San Francisco and San Jose areas, although these areas continue to attract people of millennials age. Housing prices may be playing a big role with roughly a third of Bay Area residents considering leaving, largely for this reason. Silicon Valley and San Francisco may remain great places to start, but are far from the easiest places to settle down for the long term.

Gallery: Top 1o Gen X Cities

 Yet Silicon Valley is a veritable 35 to 49 magnet compared to most of the country’s big cities. Los Angeles, New York, Boston, Chicago and Philadelphia areas have all seen declines in their 35 to 49 shares both since 2000 and, more revealingly, since 2010 as well. In terms of 35-49s, these greatly hyped metropolitan areas actually do, however, much better than Rust Belt cities such as Detroit, Cleveland, Hartford, Pittsburgh and Rochester, which experienced a survey worst 9.5 percent decline relative to the national rate in Xers since 2010 and a 19.2 percent decline since the beginning of the new millennium.

Xers: The New Suburban Generation 

In the popular press, youth (stretched liberally as high as 50) are widely associated with the much heralded “return to the city.” Yet in reality, all generations continue to head primarily for the suburbs, with this trend most evident among those aged 35-49. 

Using the “city sector model” to analyze metropolitan areas by such factors as density, age of housing, transit use and housing forms, we have looked at where 35-49s have been moving over the past 11 to 15 years. Peope aged 35-49 have shown little inclination to stay in the urban core, moving out in considerable numbers to suburbs and exurbs. 

Indeed since 2000 the percentage of Xers living in the urban core has dropped by one percentage point, while the percentage living in new suburbs and exurbs has grown by six percentage points. By 2015 over 80 percent of Xers in the 52 largest metropolitan areas lived in suburban areas, although they have in more recent years favored older suburbs (built before 1980) over exurbs.

This reflects one of the basic demographic realities: as people age, and start families, they tend to move further out. Generally speaking, notes economist Jed Kolko, the peak years for urban living take place between ages 18 and 30. After that there’s generally a steep decline as people start families and head to the suburbs. Kolko calculates that while almost a quarter of people under 30 live in urban neighborhoods, by age 40 the urban share drops well below 20 percent, and stays there well into their 70s.

The reasons for this move are not surprising. Suburban real estate tends to be cheaper than in good urban areas, and offers the kind of housing -- single family -- preferred by the vast majority of consumers. They also tend to be much safer (the rate of violent crime  in core municipalities remains almost four times higher), and have much better schools and less poverty than urban areas, things that tend to matter to people starting families and raising children.

What It Means For Other Generations 

The increasing importance of Xers will, of course, impact other generations. Boomers, who have had a very long run in control of just about everything, are likely to see their influence reduced as Xers hit their prime earning years. This will be accelerated by the digital revolution; the average age of venture capital-backed founders, notes the Harvard Business Review, is in their late 30s and early 40s, which puts them deep in X territory. Just as boomers had to adjust to the work culture of the previous generations, the millennials will now have to fit their careers into patterns developed by their Xer overlords. 

For the millennials, the experience of the Xers may also presage their future lifestyle choices. Like the Xers, millennials are beginning to move into the suburbs, contradicting all claims to the contrary. Like the Xers, they too are looking for more space, something not likely to lead them to the city. Similarly they are also increasingly moving to the same lower cost cities, largely in the Southeast and Intermountain West. Since 2010, the biggest gains in millennial share have been Orlando, Austin and San Antonio. 

Ultimately, rather than focus on boomers, the millennials will need to figure out how Xers think -- their independence and entrepreneurialism -- since Xers will be both their bosses and their role models. Generation X may be relatively small, and largely unsung, but what it does, and where it moves, may do more to shape the country in the next decade than the more celebrated groups born before and after them.

Gallery: Top 1o Gen X Cities

This piece first appeared at Forbes.

Joel Kotkin is executive editor of NewGeography.com. He is the Roger Hobbs Distinguished Fellow in Urban Studies at Chapman University and executive director of the Houston-based Center for Opportunity Urbanism. His newest book, The Human City: Urbanism for the rest of us, was published in April by Agate. He is also author of The New Class ConflictThe City: A Global History, and The Next Hundred Million: America in 2050. He lives in Orange County, CA.

Wendell Cox is principal of Demographia, an international public policy and demographics firm. He is a Senior Fellow of the Center for Opportunity Urbanism (US), Senior Fellow for Housing Affordability and Municipal Policy for the Frontier Centre for Public Policy (Canada), and a member of the Board of Advisors of the Center for Demographics and Policy at Chapman University (California). He is co-author of the "Demographia International Housing Affordability Survey" and author of "Demographia World Urban Areas" and "War on the Dream: How Anti-Sprawl Policy Threatens the Quality of Life." He was appointed to three terms on the Los Angeles County Transportation Commission, where he served with the leading city and county leadership as the only non-elected member. He served as a visiting professor at the Conservatoire National des Arts et Metiers, a national university in Paris.

Photo by Caleb Smith; Office of the Speaker of the House [Public domain], via Wikimedia Commons

Looking Forward, With Better Cheer

$
0
0

Among many urbanites, a certain bunker mentality has already surfaced at key locations within the geography of the city.  Here in Orlando, places like the Stardust Video and Coffee where once there was warmth, one feels coolness in the air, a little less eye contact, briefer conversations, a sharper tone. For many who practice tolerance and inclusiveness, and bend our lives towards mutual sustainability, this was a temporary setback.  But this is no time for recriminations or succumbing to the temptation to snip at one another.  It is a time to look forward, with better cheer.

We must expand our tolerance even further, and recognize that true inclusiveness really means everybody.  At the same time, there is a subtle upswing in other places too.  Just around the corner from Stardust lies three convenience stores, ostensibly gas pump backdrops.  It's time to get to know the coffee choices around here, and expand my horizons a bit.

Lotto, beer, and cigarettes figure big in these places; our small weaknesses are also their small profit. The mood in these colorful, brightly lit stores is upbeat, and it shows how the two different streams of society intermingle within very small distances.  

In the 7-Eleven, Rhonda and Lexi posed for the camera, shoulder to shoulder with big grins on their faces. When asked who made the coffee, Rhonda announced "I did!"  Convenience store coffee is surprisingly good here.  Around the corner, Elizabeth briefed me on her complicated coffee system at the National Food Mart. When I asked her for a picture, she shrugged.  "Yeah, sure," and broke into a sweet, disarming smile.  

For the workers in these stores, there's a coming-out, a sense of "yeah, well, we're cool too," a new posture being tried.  Is it the surprise, the swift triumph of the unhip, that has suddenly put a bounce in their step?  The cashiers of our vices are happier, a little more hopeful, these days, a little less grim and underclass.

It is now the formerly hip Stardust which now feels dour and tragic. Avoidance of eye contact was once a game practiced at the convenience store; now it is practiced at this cluttered countertop.  At one time, the scene at Stardust was open, with shouts of greeting and smiles.  A boisterous and diverse crowd kept a gentle, Haight-Asbury vibe going.  It was improvisational, a do-it-yourself kind of culture. John, a retired engineer, mixed with hippie chicks, artists, writers and techies in for a cup and a jam.  DJs and photographers met to plan out a photo shoot.  

Salesmen sat with their laptops, looking at their sales leads for the day.  In the evening, kids did their geometry homework while older couples sat and drank wine.  An ancient, timeless public house feel was rich and was ripe. This openness is what I love about Stardust, it has a sense of shared ownership and a mutual agreeableness that we are all in it together.  It suits me, as I move in a very wide range between laborers, the very wealthy, plumbers and professors.  

In these days of looking backward, a veil of grimness seems to separate the hip and the cool for now.  Stardust is lately tinged just a bit with the atmosphere of all convenience stores.  It is tinted with the grimness of outcasts.

This grimness of outcasts was once the province of convenience store workers, hanging their heads, ringing up gas sales, condoms, smokes.  They knew their place, and it was pretty far down the class system.  Condemned to shapeless, garish uniforms, convenience store workers were the bottom, especially in the chic neighborhood of Audubon Park.  Everyone on Corrine Drive outranked the convenience store worker.  The only caste lower than convenience store clerk was possibly convenience store night clerk.

Life at the bottom of the social pyramid was bad enough, but especially the Audubon Park social pyramid, what with its ultra-cool scene of independent record stores, custom beer taps, movie production guys, East End Market, for Christ's sake--a hipster convenience store in drag--and, naturally, it was all anchored by Stardust Video and Coffee.  For the convenience store clerk in this neighborhood, a special hell was your lot.  High school diploma, if you're lucky, making nine oh five an hour selling stupid stuff to liberal arts school students, techies wearing glasses that cost six months of your wages, bourgeois bohemians. It rankled. You sucked.

Back at Stardust, the post-election mortification has given way to the next phase of outsider-mentality:  recrimination.  Now, for the first time ever, I hear green-shaming: "Where's your cup today?" after a patron asked for a coffee and committed the green sin of not bringing in his own reusable mug. This never used to happen at Stardust, where they are usually happy to sell you a disposable cup.  The barista, however, got a little dig in that morning, fingering me as the Other.

I do not have to prove that I am not the Other.  That charge just won't stick.  It's a symptom of feeling like an outcast, possibly, to accuse someone, label them as Other, and sulk.  During my day, I think about those all around me in a modern, white-collar office, and how good we all have it.  Still, for many, the sense that things just weren’t good enough probably caused people to send a signal in the voting booth.   

Perhaps here’s a lesson to this election, which has unnerved liberals and hipsters to their core. You cannot turn many, if not most, Americans into “the Other.” This is not the road to inclusiveness; perhaps the "in-crowd" at Stardust never was very inclusive to begin with.  If you want to see real people of color, go into the unhip convenience stores all around.  African-American, Asian-American, and Latina-American.  Inclusiveness means a society where all of our people, even the convenience store clerks, are included.

At Stardust, one could easily convince oneself of being in comfortable surroundings of openness and diversity.  This bubble of comfort sadly diverged from reality.  Outside the bubble, the Lexis and Rhondas and Elizabeths have gotten a break.  They were decidedly NOT in this bubble.  It has finally burst.

So what? I'm taking a break from the hip and the cool, and creating my own hip and cool with people in 7-Eleven, National Food Mart, and Shell.  I frequent these places often, for they have things that I need:  gas, air, vacuum, batteries, and aspirin. Stardust offers nothing practical like that anyway.  I've already introduced myself to a few of the other clerks, and found them to be very nice.  I haven't been subjected to green-shaming, and probably won't be.  They're professional, they make it snappy, and they smile.

It is weak and incorrect to circle the wagons and point fingers at The Other and continue this divisiveness that has caused such a big warfare in our hardened, weary society.  This is the sure road to further isolation and loss.  The secret is that there really are no losers and winners, and to act like there are just makes more. Instead, acting like we are all people with our own aspirations and difficulties is a harder, but far more interesting road to travel.  This is not about populist politics or presidents; rather, it is about the need to re-invent the concept of a society where everyone wins.

Richard Reep is an architect with VOA Associates, Inc. who has designed award-winning urban mixed-use and hospitality projects. His work has been featured domestically and internationally for the last thirty years. An Adjunct Professor for the Environmental and Growth Studies Department at Rollins College, he teaches urban design and sustainable development; he is also president of the Orlando Foundation for Architecture. Reep resides in Winter Park, Florida with his family.

Photo by Doxvoom - Own work, CC BY 2.5, Link

Suburban Nations: Canada, Australia and the United States

$
0
0

Professor David L. A. Gordon of Queens University in Kingston Ontario has now shown Australia to be a largely suburban nation. This follows on Professor Gordon’s work with colleagues in 2013 that came to the same conclusion on Canada based upon 2006 census data. By using census tract data, rather than municipality data, Gordon, et al were able to avoid the misleading but readily accessible jurisdictional analysis (central city versus suburbs) that equated large low-density central municipalities like Calgary and Edmonton, with more compact and dense municipalities like Vancouver and Montreal (or New York with Phoenix). The Gordon, et al criteria is illustrated in Figure 1.

Broadly following the Gordon et al research, in the Spring of 2014, I published a similar “City Sector Model” using postal code tabulation areas (zip codes) for the major metropolitan areas of the United States. That criteria is illustrated in Figure 2.

This article compares the Gordon findings in Canada and Australia and contrasts them with my findings in the United States.

The Gordon Research: Canada and Australia

In Australia, as in Canada, Professor Gordon divided metropolitan areas into four classifications at a small area level. The Gordon research called the urban core classification "active core," to note the greater dependence of residents on walking and cycling for commuting to work. They divided suburban areas into transit and auto suburban areas, and designated the more rural areas of metropolitan areas as exurban. In both countries, they used the functional or economic definition of cities, which is metropolitan areas or labor market areas (Note 1).

Gordon’s analysis shows that Australia’s 27 metropolitan areas are 13 percent “active core”, nine percent transit suburbs, 69 percent auto suburbs and 10 percent exurban. This is nearly the same as the previous research on the 2011 Census of Canada which revealed 12 percent active core, 11 percent transit suburbs, 69 percent auto suburbs and eight percent exurban for all 33 metropolitan areas.

The Major Metropolitan Areas (Over 1,000,000 Population) In the smaller number of Australian metropolitan areas with more than 1,000,000 population, the “active cores” are only slightly larger than those in Canada (12.4 percent of the metropolitan population versus 11.8 percent). But Canada’s major metropolitan areas has larger “transit suburbs” by a 12.2 percent to 10.0 percent margin. The “auto suburban” figures are virtually the same, with Australia at 70.5 percent and Canada at 70.7 percent. Finally, Australia has a slightly larger “exurbs,” at 7.2 percent compared to Canada’s 5.2 percent (Figures 3 and 4).

Comparing to the United States

In the United States, the City Sector Model uses somewhat different criteria. Gordon’s central classifications (“active core” and “transit suburb”) parallel the City Sector Model’s “urban core: CBD” and “urban core: inner ring.” Gordon’s “auto suburban” and “exurban” also roughly parallel the two “suburban” and the exurban City Sector Model classifications.

Perhaps the largest difference between the two models is in the treatment of commuting. Professor Gordon’s approach is to classify the two central areas based on 50 percent higher than each metropolitan’s area average shares of walking, cycling and transit journey to work travel. The City Sector Model uses an across-the-board minimum 20 percent market share (transit, cycling and walking combined), to replicate a division between more dense pre-World War II development and the automobile oriented suburbs that followed.

Comparing to the United States

Of course, it is to be expected that the United States, with the lowest density built-up urban areas (called population centers in Canada and urban centres in Australia) would be even more suburban than Australia and Canada . This is indicated by the data (see Demographia World Urban Areas).

There are large differences in the two more central classifications. In Australia, the two central areas have 22.4 percent of the metropolitan area population, somewhat less than Canada’s 24.0 percent. In the United States the two central areas have a smaller 14.8 percent of the metropolitan area population (Figure 5).

Various factors account for this difference. There were, for example, huge urban core population losses   in the United States, but not in Canada and Australia. Another cause is the much earlier motorization of the United States, which by 1929, according to economist Robert Gordon, had achieved 0.9 vehicles per household and had 90 percent of the world’s registered vehicles (Note 2). With this unparalleled market penetration, the U.S. had a several decade long head start in automobile oriented suburbanization. Canada equaled the 1929 U.S. automobile market penetration in the middle 1950s and Australia in the middle 1960s.However, in the suburban classification, the metropolitan areas of the three nations were very similar. The US automobile suburb share of the population, at 68.8 percent was within two percentage points of both Canada and Australia. However, like the urban core, the suburbs showed considerably different results, with the United States having a 16.4 percentage exurban share, compared to approximately 10 percentage point lower shares in both Canada and Australia.

Part of difference in the exurbs is the larger geographic size of U.S. metropolitan areas, which are far less representative in capturing the genuine labor market. The building geographical blocks used by the U.S. Office of Management and Budget are simply too large for sufficient preciseness. This is illustrated by the Riverside-San Bernardino metropolitan area, which covers an area about the same size as the Canadian province of New Brunswick or the Australian state of Tasmania. By contrast, in Canada, Statistics Canada uses municipalities to construct metropolitan areas, while Australia uses “Statistical Areas Level 4,” which are generally smaller than US counties (Note 3). When the boundaries of a metropolitan area are far larger than the actual commuting shed (as often happens in the United States), more people will be in the metropolitan area.

At the same time, these results must be interpreted carefully, since there are differences in the criteria and geographical building blocks of metropolitan areas in all three nations.

Comparison of Population Growth

Professor Gordon’s research in both nations shows suburban growth   far out stripping growth in the central areas. In Canada, nearly 84 percent of major metropolitan area population growth between 2006 and 2011 was in the “auto suburbs” and “exurbs” (Figure 6). In Australia (27 metropolitan areas), the “auto suburbs” and “exurbs accounted” for nearly 78 percent of population growth (Figure 7). In the United States, the suburbs and exurbs accounted for over 85 percent   (Figure 8).

Suburban World

Contrary to planning preference for dense urbanization, suburbanization has occurred virtually wherever people can afford cars. This is even true in Europe, Japan and China. For example, the municipality of Paris continues to languish with a population a quarter below its level of 135 years ago (1881). The 8 million resident urban area growth since that time has been in the suburbs , which now cover more than 25 times the area of the ville de Paris (the central municipality). Other examples, such as the core municipalities of Copenhagen (from 1950), Barcelona and Milan (from 1970) have suffered significant population losses while all metropolitan area growth has been in the suburbs. There are many similar examples around the world.

Even with the differing definitions, the data in Canada, Australia and the United States is remarkably similar. Of course, not all suburbs are the same, but it should not be surprising that the organic growth of cities continues on their edges.

Note 1: For further information see: Paul Cheshire, Max Nathan and Henry G. Overman of the London School of Economics in their recent book, Urban Economics and Urban Policy: Challenging Conventional Policy Wisdom.

Note 2: See Robert J. Gordon, The Rise and Fall of American Growth: The U.S. Standard of Living Since the Civil War, page 374, reviewed at http://www.newgeography.com/content/005364-robert-gordons-notable-history-economics-and-living-standards.  

Note 3: The larger size of US exurbs is illustrated by the 11,400 square kilometer average areas outside the principal urban areas (exurbs) of US metropolitan areas. In Australia, the average outside the principal urban centres is 6,500 square kilometers, while in Canada the average area outside the principal population centres is 4,600 square kilometers (data based on metropolitan areas with more than 1,000,000 population).

Wendell Cox is principal of Demographia, an international public policy and demographics firm. He is a Senior Fellow of the Center for Opportunity Urbanism (US), Senior Fellow for Housing Affordability and Municipal Policy for the Frontier Centre for Public Policy (Canada), and a member of the Board of Advisors of the Center for Demographics and Policy at Chapman University (California). He is co-author of the "Demographia International Housing Affordability Survey" and author of "Demographia World Urban Areas" and "War on the Dream: How Anti-Sprawl Policy Threatens the Quality of Life." He was appointed to three terms on the Los Angeles County Transportation Commission, where he served with the leading city and county leadership as the only non-elected member. He served as a visiting professor at the Conservatoire National des Arts et Metiers, a national university in Paris.

Photo: Brisbane, Australia Inner Suburbs (by author)

How Post-Familialism Will Shape the New Asia

$
0
0

Surprisingly, the modern focal point for postfamilial urbanism comes from eastern Asia, where family traditionally exercised a powerful, even dominant influence over society. The shift toward post-familialism arose first in Japan, the region’s most economically and technologically advanced country. As early as the 1990s sociologist Muriel Jolivet unearthed a trend of growing hostility toward motherhood in her book Japan: The Childless Society?–a trend that stemmed in part from male reluctance to take responsibility for raising children.

The trend has only accelerated since then. By 2010 a third of Japanese women entering their 30s were single, as were roughly one in five of those entering their 40s – that is roughly eight times the percentage seen in 1960 and twice that seen in 2000. By 2030, according to sociologist Mika Toyota, almost one in three Japanese males may be unmarried by age 50.

In Japan, the direct tie between low birth rates and dense urbanization is most expressed in Tokyo, which now has a fertility rate of around one child per family, below the already depressed national average. Some of the lowest rates on earth can be seen elsewhere in eastern Asia, including those in Seoul, Singapore and Hong Kong, which are now roughly the same as the rate in Tokyo.

As more of Asia becomes highly urbanized like Japan, this kind of ultra-low fertility will spread to other parts of the continent. Most critically, this dynamic has already spread to mainland China, or at least to its larger cities, where fertility rates have dropped well below 1.0. In 2013, Shanghai’s fertility rate of 0.7 was among the lowest ever reported – well below the “one child” mandate removed in 2015 and only one-third the rate required to simply replace the current population. Beijing and Tianjin suffer similarly dismal fertility rates.

This pattern of low fertility, notes demographer Gavin Jones, suggests that rapid urbanization has already made the notion of the one-child policy antiquated. Now, even with fertility policies being loosened, many Chinese families are opting not to take advantage, largely due to the same reasons cited in other parts of the world: the high cost of living and high housing costs.

Perhaps no city better reflects Asia’s emerging urban paradigm than Seoul, the densest of the high-income world’s megacities outside of Hong Kong. The Korean capital is more than 2.5 times as crowded as Tokyo, twice as dense as London and 5 times as crowded as New York. No surprise then that self-styled urban pundits love the place, as epitomized by a glowing report in Smithsonian magazine that painted Seoul as “the city of the future.” Architects, naturally, joined the chorus. In 2010 the International Council of Societies of Industrial Design named Seoul the “world design capital.”

Ultimately, Seoul epitomizes the retro-urbanist fantasy: a city that is dense and dominating, rapidly turning the rest of the country into depopulating backwaters. Seoul has monopolized population growth in Korea, accounting for nearly 90% of total growth since 1970. Seoul also currently holds nearly 50% of the country’s population, up from 20% in 1960.

Seoul’s development has come at the expense of not just its own hinterlands but also its own humanity. Its formerly human-scaled form of housing, known as a hanok , which was one story tall and featured an interior courtyard, has been largely replaced with tall, often repetitive towers that stretch even into the suburbs. While architects and planners celebrate this shift, they rarely consider whether this form of urbanization creates a good place for people, particularly families.

When you consider the trends in similar cities, it’s unsurprising that Korean sociologists have noted the shift to high-density housing as being unsuitable for families with children.

Over time the impact of these housing policies will be profound. By 2040 Korea’s population will join those of Japan and Germany as one of the world’s oldest. This will occur despite determined government efforts to encourage childbearing, efforts that may well be doomed by the government’s similar commitment to a dense, centralized urban form.

What will happen to societies that are likely to retain extremely low rates of fertility? Japan, notes Canadian demographer Vaclav Smil, represents “an involuntary global pioneer of a new society.” Japan certainly exemplifies one way societies may evolve under diminishing birth rates.

Projecting population and fertility rates is difficult, but the trajectory for Japan is unprecedented. The UN projects Japan’s 2100 population to be 91 million, down from 2015′s 127 million, but Japan’s own National Institute of Population & Social Security Research projects a population of 48 million, nearly 50% lower than the UN’s projection.

Japan’s urban centralization both feeds and accelerates this trend. Rather than disperse, Japan’s population is “recentralizing.” A country with a great tradition of regional rivalries, home to an impressive archipelago of venerable cities, is becoming, in effect, a city-nation, with an increased concentration on just one massive urban agglomeration: Tokyo. This has, for the time being, allowed Tokyo to escape the worst of Japan’s demographic decline, drawing heavily on the countryside and smaller cities, both of which are losing population. From 2000 to 2013 the Tokyo metropolitan area added 2.4 million residents, while the rest of the nation declined by 2 million.

Tokyo is now home to almost one in three Japanese. But its growth is likely to be constrained, as the last reservoir of rural and small-city residents seems certain to dry up dramatically. A projection for the core prefecture of Tokyo indicates a 50% population cut by 2100 to a number smaller than it was at the beginning of World War II; 46% of that reduced population will be over 65.

This suggests it is time, in high-income countries at least, to shift our focus from concerns about overpopulation to a set of new and quite unique challenges presented by rapid aging and a steadily diminishing workforce. Even birth rates in developing countries are tumbling toward those of wealthy countries. As British environmental journalist Fred Pearce puts it, “the population bomb’ is being defused over the medium and long term.”

Some, like Pearce, see the Japanese model as an exemplar of a world dominated by seniors – with very slow and even negative population growth – that will be “older, wiser, greener.” Following the adolescent ferment of the 20th century, Pearce looks forward to “the age of the old” that he claims “could be the salvation of the planet.”

Yet, if the environmental benefits of a smaller, older and less consumptive population may be positive, there may be other negative ramifications of a rapidly aging society. For one thing, there will be increasingly fewer children to take care of elderly parents. This has led to a rising incidence of what the Japanese call kodokushi , or “lonely death,” among the aged, unmarried and childless. In Korea, Kyung-sook Shin’s highly praised bestseller, Please Look After Mom, which sold 2 million copies, focused on “filial guilt” in children who fail to look after their aging parents and hit a particular nerve in the highly competitive eastern Asian society that seems to be drifting from its familial roots.

Additionally, an aging population will certainly diminish demand for both goods and services and likely would not promote a vibrant entrepreneurial economy.

China will face its own version of “demographic winter,” although sometime later than Japan or the Asian Tiger states. The U.S. Census Bureau estimates that China’s population will peak in 2026 and then will age faster than any country in the world besides Japan. Its rapid urbanization, expansion of education and rising housing costs all will contribute to this trend. China’s population of children and young workers between 15 and 19 will decline 20% from 2015 to 2050, while that of the world will increase nearly 10%.

In China the consequences of the rising number of elderly will be profound. Demographer Nicholas Eberstadt, for example, sees the prospect of a fiscal crisis caused by an aging and ultimately diminishing population. China, he notes, faces “this coming tsunami of senior citizens” with a smaller workforce, greater pension obligations and generally slower economic growth.

It seems likely, as has occurred in Japan already, that rising costs associated with an aging population, and a dearth of new workers and consumers, will hamper wealth creation and income growth. Societies dominated by the old likely will become inherently backward-looking, seeking to preserve the existing wealth of seniors as opposed to creating new opportunities for the increasingly politically marginalized younger population.

The shift to an aging population also creates, particularly in Asia where urbanization is most rapid, the segregation of generations, with the elderly in rural areas and the younger people in cities. Around the world, the results of this shift are likely to resemble those seen in Japan, with cities becoming home to an ever expanding part of the population, while people in the countryside are destined to grow older and ever more isolated. It is not clear how the expanding senior population, which was traditionally cared for by younger generations, will fare with fewer children to support them and in the absence of a well-developed welfare state.

Later this century these same challenges will even be felt in many parts of the developing world. In rapidly urbanizing, relatively poor countries such as Vietnam, the fertility rate is already below replacement levels, and it is rapidly declining in other poorer countries such as Myanmar, Indonesia and even Bangladesh. In parts of Latin America, especially Brazil, fertility rates are plunging to below those seen in the United States. Brazil’s birth rate (4.3 in the late 1970s and now 1.9) has dropped not only among the professional classes but also in the countryside and among those living in the favelas. As one account reports, women in Brazil now say, “Afábrica está fechada”–the factory is closed.

Excerpted from The Human City: Urbanism for the Rest of Us, by Joel Kotkin (B2 Books, 2016)

This piece first appeared in Forbes.

Joel Kotkin is executive editor of NewGeography.com. He is the Roger Hobbs Distinguished Fellow in Urban Studies at Chapman University and executive director of the Houston-based Center for Opportunity Urbanism. His newest book, The Human City: Urbanism for the rest of us, was published in April by Agate. He is also author of The New Class ConflictThe City: A Global History, and The Next Hundred Million: America in 2050. He lives in Orange County, CA.

Photo: John Gillespie, CC License

New Year, Same Old Streetcar Named Disaster

$
0
0

On December 30 the city of Atlanta began Year 3 of operating its much-ballyhooed Atlanta Streetcar System, and so far, all that can be discerned is a lot of bally hooey.

This month, the Atlanta City Council approved the final payment to URS for the design-build of the 2.7-mile Atlanta Streetcar project, making the total payment $61,630,655. That was, according to Public Works Commissioner Richard Mendoza, “$6 million less than URS originally submitted.”

Not exactly. The 2014 URS contract authorized by MARTA (the transit authority designated to receive the $47.6 million federal grant for the Streetcar), was $59 million; the original URS contract, based on the preliminary design, was $52.2 million.

Asked about the project’s full cost, Mendoza told councilmembers, “The entire project came in a tad under $97 million, which was within the original budget.” 

Not really. The original budget for the project, as listed in the TIGER federal grant application in 2010, was a capital cost of about $72 million. Annual operation and maintenance (O&M) costs in 2013, when it was originally slated to start running, would be about $1.7 million.

Later, the city projected a cost of about $3.2 million a year to operate the system. Then in February 2016, the city revised that cost to $4.8 million – a 52 percent increase. The city’s FY2017 budget includes nearly $5.3 million for the Streetcar O&M.

As for revenues: The grant application projected $420,000 in farebox revenue for the expected first year of operation (2013), making up 20 percent of O&M costs. In fact, the farebox recovery ratio is just 5.2 percent, as Mendoza told councilmembers on December 14 during his quarterly update on the system.

From January through November 2016, tickets brought in $177,580; by extrapolation, the 2016 farebox will bring in less than $195,000. That’s less than half (46 percent) of the grant application projection.

There were 809,000 passengers in 2015. From January through November 2016, there were just 348,043. The grant application listed projected average weekday ridership at 2,600; but this year (without breaking out weekend ridership) it is 1,462, just 56 percent of that original estimate.

The Streetcar had a late and spotty start, too. After construction and testing delays, operations began on December 30, 2014. It was supposed to offer free rides for three months; in March 2015, the mayor declared it would be free for the entire first year.

Ridership plunged after the $1 fare was implemented on January 1, although it did help reduce the number of homeless riding the vehicles. Fare evasion is a problem: The city reports 53 just percent of riders are paying the fare; hopes are better policing and a newly launched app will improve revenues.

State and federal audits found safety and management problems; in May, the Georgia Department of Transportation threatened to shut down the Streetcar unless corrective action was taken. This month, Mendoza told the Transportation Committee that nine (14 percent) items of 66 on the “Corrective Action Plan” had been completed.

This week, the city announced reduced Streetcar hours for the holiday weekend, “a modified schedule for New Year’s Eve to accommodate large crowds expected to attend holiday events in the downtown area. On Dec. 31 the streetcar will operate from 8:30 a.m. to 4:30 p.m., and then will resume normal operating hours on Jan. 1, running from 9 a.m. to 11 p.m.”

Reducing hours when tourists are most likely downtown is a far cry from the hype in the grant application: “[I]t will provide connectivity and circulation for the core of the Downtown area of Atlanta, improving accessibility and making it possible to conveniently travel from key destinations and event venues without a car and connecting tourists, residents, students and workers to attractions, jobs and public amenities.”

Unfazed by the dismal results so far, the city has another 22-mile phase under environmental review, planning to leverage November’s transit sales tax proposals that won 72 percent voter approval. Apparently, the project is nowhere near big enough to fail yet. The biggest tragedy, however, is that in an era of rapidly changing technology, Atlanta residents will be stuck with this transit from a bygone era for another 40 years.

This piece was originally published by the Georgia Public Policy Foundation on their blog, The Forum.


Benita Dodd is vice president of the Georgia Public Policy Foundation, an independent think tank that proposes market-oriented approaches to public policy to improve the lives of Georgians. Nothing written here is to be construed as necessarily reflecting the view of the Georgia Public Policy Foundation or as an attempt to aid or hinder the passage of any bill before the U.S. Congress or the Georgia Legislature.

© Georgia Public Policy Foundation (December 30, 2016). Permission to reprint in whole or in part is hereby granted, provided the author and her affiliations are cited.

Photo by Spmarshall42 - Own work, CC BY-SA 4.0, Link

Obama's not so glorious legacy

$
0
0

Like a child star who reached his peak at age 15, Barack Obama could never fulfill the inflated expectations that accompanied his election. After all not only was he heralded as the “smartest” president in history within months of assuming the White House, but he also secured the Nobel Peace Prize during his first year in office. Usually, it takes actually settling a conflict or two — like Richard Nixon or Jimmy Carter — to win such plaudits.

The greatest accomplishment of the Obama presidency turned out to be his election as the first African American president. This should always be seen as a great step forward. Yet, the Obama presidency failed to accomplish the great things promised by his election: racial healing, a stronger economy, greater global influence and, perhaps most critically, the fundamental progressive “transformation” of American politics.

Racial healing

Rather than stress his biracial background, Obama, once elected, chose to place his whiteness in the closet and identified almost entirely with a particular notion of the American black experience.

Whenever race-related issues came up — notably in the area of law enforcement — Obama and his Justice Department have tended to embrace the narrative that America remains hopelessly racist. As a result, he seemed to embrace groups like Black Lives Matter and, wherever possible, blame law enforcement, even as crime was soaring in many cities, particularly those with beleaguered African American communities.

Eight years after his election, more Americans now consider race relations to be getting worse, and we are more ethnically divided than in any time in recent history. As has been the case for several decades, African Americans’ economic equality has continued to slip, and is lower now than it was when Obama came into office in 2009, according to a 2016 Urban League study.

The economic equation

On the economy, Obama partisans can claim some successes. He clearly inherited a massive mess from the George W. Bush administration, and the fact that the economy eventually turned around, albeit modestly, has to be counted in his favor.

Yet, if there was indeed a recovery, it was a modest one, marked by falling productivity and low levels of labor participation. We continue to see the decline of the middle class, and declining life expectancy, while the vast majority of gains have gone to the most affluent, largely due to the rising stock market and the recovery of property prices, particularly in elite markets.

At the same time, Obama leaves his successor a massive debt run-up, doubling during his watch, and the prospect of steadily rising interest rates. Faith in the current economic system has plummeted in recent years, particularly among the young, a majority of whom, according to a May 2016 Gallup Poll, now have a favorable view of socialism. Economic anxiety helped spark not only the emergence of Bernie Sanders, but later the election of Donald Trump.

Read the entire piece at the Orange County Register.

Joel Kotkin is executive editor of NewGeography.com. He is the Roger Hobbs Distinguished Fellow in Urban Studies at Chapman University and executive director of the Houston-based Center for Opportunity Urbanism. His newest book, The Human City: Urbanism for the rest of us, was published in April by Agate. He is also author of The New Class ConflictThe City: A Global History, and The Next Hundred Million: America in 2050. He lives in Orange County, CA.

Photo: The Official White House Photostream (originally posted to Flickr as P012109PS-0059) [CC BY 2.0 or Public domain], via Wikimedia Commons

California’s Racial Politics Harming Minorities

$
0
0

Across the country, white voters placed Donald Trump in office by a margin of 21 points over Clinton. Their backing helped the GOP gain control of a vast swath of local offices nationwide. But in California, racial politics are pushing our general politics the other direction, way to the left.

Some of this reflects California’s fast track toward a “minority-majority” state. Along with a few other states — Hawaii, Texas and New Mexico — California is there now, with minorities accounting for 62 percent of the population, compared to 43 percent in 1990. The shift in the electorate has been slower but still powerful. In 1994, registered Democrats held a 12 percentage-point margin over Republicans. By 2016, the margin had widened to 19 points.

The racial shift does much to explain why Trump lost some largely affluent suburban areas like Orange County, where 53 percent the population is Latino or Asian, up from 45 percent in 2000. Perhaps most emblematic of potential GOP problems was Trump’s — and the GOP’s — loss in Irvine, a prosperous Orange County municipality that is roughly 40 percent Asian.

California’s unique racial politics

Ideology plays a critical role in California’s emerging politics of race. Hispanic and Asian voters outside California — for example, in Texas — have tended to vote less heavily for Democrats. In 2014, Republican Gov. Greg Abbott won 44 percent of Texas Latinos. Florida’s Gov. Rick Scott garnered 38 percent of the Latino vote in his successful re-election campaign. In contrast, that same year, Neel Kashkari, Jerry Brown’s Republican opponent, won only 27 percent of the Latino vote in California. Only 17 percent of California Asians voted for Trump, nearly 40 percent lower than the national rate (27 percent).

These differences, ironically, have become more evident as California has become relatively less attractive to immigrants. Since the 1980s and 1990s, as California’s economy has become increasingly deindustrialized, the immigration “flood” has slowed, particularly among Hispanics. By the 2010s, other cities — notably Dallas-Fort Worth and Houston — were emerging as bigger magnets for newcomers.

Read the entire piece at The Orange County Register.

Joel Kotkin is executive editor of NewGeography.com. He is the Roger Hobbs Distinguished Fellow in Urban Studies at Chapman University and executive director of the Houston-based Center for Opportunity Urbanism. His newest book, The Human City: Urbanism for the rest of us, was published in April by Agate. He is also author of The New Class ConflictThe City: A Global History, and The Next Hundred Million: America in 2050. He lives in Orange County, CA.

Wendell Cox is principal of Demographia, an international public policy and demographics firm. He is a Senior Fellow of the Center for Opportunity Urbanism (US), Senior Fellow for Housing Affordability and Municipal Policy for the Frontier Centre for Public Policy (Canada), and a member of the Board of Advisors of the Center for Demographics and Policy at Chapman University (California). He is co-author of the "Demographia International Housing Affordability Survey" and author of "Demographia World Urban Areas" and "War on the Dream: How Anti-Sprawl Policy Threatens the Quality of Life." He was appointed to three terms on the Los Angeles County Transportation Commission, where he served with the leading city and county leadership as the only non-elected member. He served as a visiting professor at the Conservatoire National des Arts et Metiers, a national university in Paris.


2010-2013 Small Area Data Shows Strong Suburban & Exurban Growth

$
0
0

The latest small area estimates from the Census Bureau indicate that suburban and exurban areas continue to receive the overwhelming share of growth in metropolitan areas around the country, with a single exception, New York. The new American Community Survey (Note 1) 5 year file provides an update of data at the ZCTA (zip code tabulation area), which are described below, as analyzed by the City Sector Model. The data was collected from 2011 through 2015, and can therefore be considered generally reflective of the middle year of the period, 2013.

City Sector Model Analysis

The City Sector Model classifies small areas into five categories based on population density, commuting mode and age of development (the criteria is described in Figure 7). There are two pre-World War II classifications, the Urban Core CBD (central business district) and the Urban Core Inner Ring. These areas are typified by substantial reliance on transit, walking and cycling for commuting and have higher population densities. There are also three post-World War II, classifications, the Early Suburbs, Later Suburbs and the Exurbs, both of which have lower population densities and substantial automobile orientation (Figure 1).

The Overall Trends

In contrast to the narrative that there has been a “return to the cities” (meaning the urban core, as opposed to cities in the functional sense or physical sense, which are metropolitan areas and urban areas respectively see Note 2 in a previous post), most new residents are located in the suburbs and exurbs. Between 2010 and 2013, The automobile oriented suburbs and exurbs captured 89.9 percent of the new population growth in 52 major metropolitan areas (over 1,000,000 population in 2013). By contrast, 10.1 percent of major metropolitan population growth was in the Urban Core. The Urban Core-CBD, (largely identified with the Central Business District), accounted for 0.8 percent of the growth, and the Urban Core: Ring, the neighborhoods surrounding the core, for the other 9.3 percent (Figure 2). Although the vast majority of growth is concentrated in the suburbs and exurbs, the urban core has reversed their long-term decline, after suffering a small loss in population between 2000 and 2010.

Each of the five categories experienced population increases between 2010 and 2015 (Figure 3). However, only the Later Suburbs grew faster than its pre-existing share of the metropolitan population. The Later Suburbs had 26.9 percent of the population in 2010, yet added a much stronger 45.8 percent of the population increase from 2010 to 2013.

The Earlier Suburbs grew faster than in the previous decade, but their 29.5 percent share of metropolitan growth was far less than their 41.5 percent population share in 2010. The Urban Core: CBD captured 0.8 percent of the growth, less than its prior 1.3 percent share, while the Urban Core: Inner Ring fell nearly one-third short of equaling its previous population share. The Exurbs, which were hit hard by the Great Recession, also fell short of gaining at the rate of their population  (Figure 4).

New York and the Rest

 The New York metropolitan area, dominated the nation in urban core growth, with 73.2 percent of the population increase, leaving only 27.8 percent for the suburbs. Even this, however, is not likely an indication of a “return to the core city” because of apparent net domestic migration losses (Note 2) throughout the metropolitan area. In fact the city of New York was not attracting new domestic migrants at all, from the suburbs or elsewhere in the nation, with a net domestic migration loss of 400,000 between 2010 and 2015. All of the city of New York’s population gain was due to an excess of births over deaths and, as befits one of the world’s great global cities, international migration.

New York’s domination of urban core growth was astounding in raw numbers, as well. More than one-half of all the urban core growth among the major metropolitan areas was in the New York metropolitan area. Washington was a distant second, with 11.2 percent of the urban core growth. Boston was close behind at 9.7 percent, followed by San Francisco-Oakland at 8.1 percent. The other two metropolitan areas with legacy core cities were substantially lower, with Philadelphia accounting for 4.1 percent and Chicago 3.7 percent. All of the 46 metropolitan areas without legacy core cities, accounted for only 10.6 percent of total urban core growth, one-fifth the growth in New York alone. As with so much, the story of high density urban cores in the United States is largely about New York (Figure 5).

Nothing like New York’s domination of urban core growth over suburban and exurban growth occurred elsewhere, not even among the other five metropolitan areas with “legacy cities” (core cities). These are the metropolitan areas with the six largest central business district in the United States, and in which the core cities account for 55 percent of the national transit commuting destinations (despite having only six percent of the national employment).

Boston, came the closest, with 39.9 percent of its growth in the urban core. There was one other metropolitan area with more than 30 percent of its growth in the urban core, Philadelphia at 36.2 percent. The Chicago urban core accounted for 29.7 percent of its growth, San Francisco for 24.5 percent and Washington for 20.8 percent. Each of these, with the exception of San Francisco, managed to have proportionally greater growth in its urban core than the population share already living there (Figure 6).

The situation was much different in the 46 major metropolitan areas without legacy core cities. In these, nearly all population growth (98.6 percent) was in the suburbs and exurbs. This is slightly above the 94.5 percent of the population living there.

Suburban Nation

Using a different small area classification system, the Urban Land Institute (ULI) has reached similar conclusions on the distribution of metropolitan population and growth. Indicating that “America remains a largely suburban nation,” ULI indicates that 79 percent of the nation’s metropolitan population lives in the suburbs and that suburban areas accounted for 91 percent of metropolitan growth from 2000 to 2015. These trends are mirrored in large measure in Canada and Australia, according to work led by Professor David Gordon of Queens University in Kingston, Ontario.

To be sure, the improvement in urban core fortunes is a very positive development. There is no question that urban cores are far nicer places than they were two decades ago and that their renewed growth makes the entire city, from the central business district to the sparsely populated exurbs, a better and more productive place. But the bulk of growth, and the preponderance of the population, remains firmly suburban.

Note 1: The American Community Survey (ACS) uses sampling methods from which estimates are built, not actual counts like occur in the US Census every 10 years. The most reliable data is from the Census, which will be conducted next in 2020.

Note 2: “Apparent” is used because domestic migration data is not reported below the county level (such as in ZCTA’s). However, much of the Urban Core is in the city of New York and all of the inner ring suburban counties lost domestic migrants, suggesting that net domestic migration gains could not have occurred.

Wendell Cox is principal of Demographia, an international public policy and demographics firm. He is a Senior Fellow of the Center for Opportunity Urbanism (US), Senior Fellow for Housing Affordability and Municipal Policy for the Frontier Centre for Public Policy (Canada), and a member of the Board of Advisors of the Center for Demographics and Policy at Chapman University (California). He is co-author of the "Demographia International Housing Affordability Survey" and author of "Demographia World Urban Areas" and "War on the Dream: How Anti-Sprawl Policy Threatens the Quality of Life." He was appointed to three terms on the Los Angeles County Transportation Commission, where he served with the leading city and county leadership as the only non-elected member. He served as a visiting professor at the Conservatoire National des Arts et Metiers, a national university in Paris.

Photo: NASA satellite view of New York’s urban core

Our Most Popular Stories of 2016

$
0
0

2016 is gone, 2017 is here. Here’s a look back at the most popular stories at New Geography in 2016. Happy New Year, and thanks for reading.

12. This is Why You Can’t Afford a House. Back in February, Joel Kotkin made the case that housing costs are a huge burden on America’s middle class and argued for more discussion on the topic at the national level. This piece was also published by The Daily Beast.

11. Super Bowl: Super Subsidy Sunday. Just in time for last year’s Super Bowl, Matthew Stevenson outlined the massive public subsides enjoyed by pro sports franchises.

10. The New War Between States. In this Real Clear Politics Essay, Joel points out the variation in economic DNA across different regions of the country and the need to adjust policy to leverage those differences as a national competitive advantage.

9. What Happens When Wal-Mart Dumps You. Joel breaks down the future of the retail industry and its potential impacts on communities of all types: urban areas, suburbs, and small towns. This piece was also published by The Daily Beast.

8. Farewell Grand Old Party. From his weekly Orange County Register column, Joel notes how the rise of Trump signals a turning point for the Republican Party.

7. America’s Next Boom Towns: Regions to Watch in 2016. One year ago Joel and I created an index to identify some of the best-performing large U.S. metropolitan areas. This piece appeared in Forbes.

6. Best Cities for Jobs 2016. Our annual Best Cities for Jobs index ranks all of America’s metropolitan areas according to short- and longer-term job growth performance. Follow the link to see the various topical rankings.

5. New York’s Incredible Subway. In this piece Wendell Cox describes New York City’s subway system, unlike any other transit system in the United States.

4. Best and Worst: 2015 International Housing Affordability Survey. Wendell’s Annual Demographia International Housing Affordability Survey is a critical comprehensive reference on worldwide housing affordability by urban area. Here’s the highlights of the report.

3. Today’s Tech Oligarch’s are Worse than the Robber Barons. Joel argues that the political influence of high-tech business leaders are worse than the robber barons of the last century because today’s tech firms offer little to improve the lives of the middle class.

2. An Open Letter to the Democratic National Committee from a Rural Democrat. Former North Dakota State Senator Tyler Axness offers his advice to Democratic Party leaders from the perspective of rural America.

1. Largest Cities in the World: 2016. Wendell’s annual World Urban Areas report is perhaps the most comprehensive resource for worldwide urban population data. This April 2016 article summarizes the report.

Mark Schill is a community and corporate strategy consultant with Praxis Strategy Group and Managing Editor of New Geography.

California as Alt-America

$
0
0

In 1949 the historian Carey McWilliams defined California as the “the Great Exception” -- a place so different from the rest of America as to seem almost a separate country. In the ensuing half-century, the Golden State became not so much exceptional but predictive of the rest of the nation: California’s approaches to public education, the environment, politics, community-building and lifestyle often became national standards, and even normative.

Today California is returning to its outlier roots, defying many of the political trends that define most of the country. Rather than adjust to changing conditions, the state seems determined to go it alone as a bastion of progressivism. Some Californians, going farther out on a limb, have proposed separating from the rest of the country entirely; a ballot measure on that proposition has been proposed for 2018.

This shift to outpost of modern-day progressivism has been developing for years but was markedly evident in November. As the rest of America trended to the right, electing Republicans at the congressional and local levels in impressive numbers, California has moved farther left, accounting for virtually all of the net popular vote margin for Hillary Clinton. Today the GOP is all but non-existent in the most populated parts of the state, and the legislature has a supermajority of Democrats in both houses. In many cases, including last year’s Senate race, no Republicans even got on the November ballot.

Homage to Ecotopia

The election of Donald Trump has expanded the widening gap. The two biggest points of contention going forward are likely to be climate change, which has come to dominate California’s policy agenda, and immigration, a critical issue to the rising Latino political class, Silicon Valley and the state’s entrenched progressive activists.

Most of the big cities -- Los Angeles, San Jose, San Francisco, Oakland and Sacramento -- have proclaimed themselves “sanctuary cities,” and the state legislative leadership is now preparing a measure that would create “a wall of justice” against Trump’s agenda. If federal agents begin swooping down on any of the state’s estimated 2 million undocumented immigrants, incoming Attorney General (and former congressman) Xavier Becerra has made it among his first priorities to  “resist” any deportation orders, including paying legal fees.    

Equally contentious will be a concerted attempt to block Trump’s overturning of President Obama’s   climate change agenda.   In recent years Gov. Jerry Brown has gone full “Moonbeam,” imposing ever more stringent environmental policies on state businesses and residents. The most recent legislation signed by Brown would boost California’s carbon reductions far beyond those agreed to by the U.S. in the Paris accord (which Trump has said he will withdraw from). All of this is being done along with a virtual banning of nuclear power, which, as the Breakthrough Institute’s Michael Shellenberger notes, remains the largest and most proven source of clean energy.

California’s draconian climate policies have been oft-cited by Obama and environmentalists as a role model for not only America but the world. However, they will not be widely emulated in the rest of the country during the next four years. Instead, California may be opting for a kind of virtual secession, following the narrative portrayed in Ernest Callenbach’s 1975 novel, “Ecotopia,” where Northern California secedes from the union to create a more ecologically perfect state.

Ironically, the state’s policies, which place strong controls on development, road construction, and energy production and usage, are somewhat symbolic; by dint largely of its mild climate, the state is already far more energy efficient than the rest of the country.  But to achieve its ambitious new goals,  most serious observers suggest, the state would lose at least 100,000 jobs and further boost energy prices -- which  disproportionately affect the poorer residents who predominate in the state’s beleaguered, and less temperate, interior.

The impact of these policies would be far-reaching. They have already reduced outside investment in manufacturing to minuscule levels and could cost California households an average of $3,000 annually. Such economic realities no longer influence many California policymakers but they could prove a boon  to other   states, notably Texas, Arizona and Nevada, which make a sport of hunting down California employers.   

A ‘Light Unto the Nations’?

Even with these problems, no other part of the country comes close to being as deeply progressive as California.  Illinois, President Obama’s home state, is a model for nothing so much as larceny and corruption. New York, the traditional bailiwick of the progressive over-class, is similarly too corrupt and also too tied to, and dependent upon, Wall Street. In addition, both of these states are losing population, while California, although slowing down and experiencing out-migration by residents to other states, continues to grow, the product of children born to those who arrived over the past three decades.

California’s recent economic success seemingly makes it a compelling “alt-America.” After a severe decline in the Great Recession, the economy  has roared back, and since 2010 has outpaced the national average.  But if you go back to 2000, metro areas such as Austin, Dallas, Houston, Orlando, Salt Lake City and Phoenix -- all in lower-tax, regulation-light states -- have expanded their employment by twice or more than that in  Los Angeles.

Indeed, a closer examination shows that the California “boom” is really about one region, the tech-rich San Francisco Bay Area, with roughly half the state’s job growth recorded there since 2007 even though the region accounts for barely a fifth of the state’s population. Outside the Bay Area, the vast majority of employment gains have been in low-paying retail, hospitality and medical fields. And even in Silicon Valley itself, a large portion of the population, notably Latinos, are downwardly mobile given the loss of manufacturing jobs.

According to the most recent Social Science Research Council report, the state overall suffers the greatest levels of income inequality in the nation; the Public Policy Institute places the gap well over 10 percent higher than the national average. And though California may be home to some of the wealthiest communities in the nation, accounting for 15 of the 20 wealthiest, its poverty rate, adjusted for cost, is also the highest in the nation. Indeed, a recent United Way study found that half of all California Latinos, and some 40 percent of African-Americans, have incomes below the cost of necessities (the “Real Cost Measure”). Among non-citizens, 60 percent of households have incomes below the Real Cost Measure, a figure that stretches to 80 percent below among Latinos.

In sharp contrast to the 1960s California governed by Jerry Brown’s great father, Pat, upward mobility is not particularly promising for the state’s majority Latino next generation. Not only are housing prices out of reach for all but a few, but the state’s public education system ranks 40th in the nation, behind New York, Texas and South Carolina.  If California remains the technological leader, it is also becoming the harbinger of something else -- a kind of feudal society divided by a rich elite and a larger poverty class, while the middle class either struggles or leaves town.

Will America Turn to the California Model?

The new California model depends largely on one thing: the profits of the very rich. Nearly 70 percent of the state budget comes from income tax, half of which is paid by the 1 percent wealthiest residents (the top 10 percent of earners accounted for nearly 80 percent). This makes the state a model of fiscal instability. As long as the Silicon Valley oligarchs and the real estate speculators do well, California can tap their wealth to pay its massive pension debt, and expand the welfare state inexorably for its increasingly redundant working-class population.  

It’s highly dubious this model would work for the rest of the country. Due largely to its concentration of venture capital, roughly half the nation’s total, Silicon Valley may be able to continue to dominate whatever is the “next big thing,” at least in the early stages. Even parts of the tech community, such as Uber, Lyft and Apple, have announced major expansions outside of the state, in some cases directly due to regulatory restraints in California. Layoffs, meanwhile, are rising in the Valley as companies merge or move to other places. Google, Facebook and others, of course, will remain, keeping the big money in California, but the jobs could be drifting away.   

Under any circumstances, the rest of the country -- with the exception of a few markets such as Manhattan and downtown Chicago -- could not absorb the costs for housing or the taxes California imposes on its residents and businesses. Part of the reason stems from the fact that California is indeed different; its climate, topography, cultural life cannot be easily duplicated in Kansas City, Dallas or anywhere else. People will pay for the privilege of living in California, particularly along the coast. Would they do so to live in Minneapolis or Charlotte?

Nor, unlike during much of the postwar era, can it be said that California represents the demographic future.  The state -- even the Bay Area -- generally loses people to other states, particularly those in middle age, according to an analysis of IRS numbers.  Brown apologists suggest it’s only the poor and uneducated who are leaving, but it also turns out that California is losing affluent people just as rapidly, with the largest net loss occurring among those making between $100,000 and 200,000.  

Perhaps more revealing, the number of children is declining, particularly in the Los Angeles and San Francisco areas. Children made up a third of California’s population in 1970, but USC demographer Dowell Myers projects that by 2030 they will compose just a fifth.

Nor is help on the way. Although boomtown San Francisco has maintained its share of millennials, most large California cities have not. And the number of people in their mid-thirties -- prime child-bearing years -- appears to be declining rapidly, notably in the Bay Area.   Coastal California is becoming the golden land for affluent baby boomers rather than young hipsters. Surfing dudes will increasingly be those with gray ponytails.

Instead of a role model for the future, the Golden State seems likely to become a cross between Hawaii and Tijuana, a land for the aging rich and their servants. It still remains a perfect social model for a progressive political regime, but perhaps not one the rest of the country would likely wish to, or afford, to adopt.

Joel Kotkin is executive editor of NewGeography.com. He is the Roger Hobbs Distinguished Fellow in Urban Studies at Chapman University and executive director of the Houston-based Center for Opportunity Urbanism. His newest book, The Human City: Urbanism for the rest of us, was published in April by Agate. He is also author of The New Class ConflictThe City: A Global History, and The Next Hundred Million: America in 2050. He lives in Orange County, CA.

Photo by Thomas Pintaric (Own work) [GFDL or CC-BY-SA-3.0], via Wikimedia Commons

The Futility of Annual Top 10 Predictions

$
0
0

In every recent year, a black swan event has made top 10 lists appear quaintly naive and unimaginative. Our list is probably no better.

This time of year, top 10 predictions are all the rage. These lists can be interesting and entertaining but how useful are they really?

This question goes to the heart of forecasting. How futile or how useful is an attempt to forecast the economy, or technology, or world events for the next twelve months? There are three answers.

First, not futile and somewhat useful. Projecting the trends of 2016 into 2017 is a useful exercise to identify their linear logical trajectories and end points. For example, the automation of many job functions will continue as long as robotics and artificial intelligence make progress. Or, North Korea’s ability to deliver a nuclear warhead on a long-range missile will continue to improve if unchecked.

Second, futile and not that useful. When a desirable trend, say a decline in unemployment, is identified, policy makers will attempt to reinforce it. When an undesirable trend becomes obvious, they will work to counter it. However in both cases, the intervention can be either effective or counterproductive. It can either reinforce or roll back the trend. Human tinkering means that few trends are truly linear or logical beyond the near-term. There may be a slowdown in the spread of automation. There may be an agreement to stop North Korea’s nuclear ambitions.

Third, neither futile nor useful but somewhat irrelevant. While forecasters are focusing their sights on the high probability of a, b and c, there are always bigger low-probability events brewing under the surface. In fact, the most important event in any given year, the one event that shakes things up and that has wide long-lasting ramifications, is usually one that few people foresaw at the beginning of that year.

     •  In 2016, Brexit and the victory of Donald Trump. A large majority of experts gave either event a low probability.

     •  In 2015, the massive refugee influx into Europe. The numbers were rising in previous years but no one saw the surge coming.

     •  In 2014, the sudden rise of ISIS after it conquered large territories in Syria and Iraq. President Obama had famously dismissed them as the JV team a few months earlier.

     •  In 2013, the Boston Marathon bombing and Edward Snowden’s revelations.

And so on. If you look at it by decade, the most important events of the 1990s and 2000s were the collapse of the Soviet Union and the 9/11 terror attacks. Neither featured in top ten lists in any year but both had an enormous impact and repercussions that are still rippling around the world.

So instead of a list of top 10 higher probability predictions, we should consider a list of lower probability events each of which, were it to occur, would have a very large impact on the future of politics, economics, science etc. As extensively argued by Nassim Taleb, black swan events often have a much greater impact on the future.

Here is one attempt to compile such a list, with the caveat admission that it is only marginally better if at all than other lists and that the most important event of 2017 will likely be something else.

Low Probability high impact events

In no particular order:

     •  A major cyberattack that paralyzes the electric grid, payment exchanges, the stock market and/or other infrastructure. Until repaired, this would wreak havoc on daily life and the economy and would hit GDP for several quarters. It would also lead to new security measures and the attendant spending by corporations and governments.

     •  Putin removed from power. This has a low probability but it is not impossible. Referring to Putin, George Friedman recently wrote that “Russia must be led by a magician who can make small things appear large.” Through ways not always approved in the West, Putin has managed to spread Russia’s influence despite economic deterioration. But Russia has large demographic and economic challenges which could get worse after his departure.

     •  Another financial crisis starting in Europe or in emerging markets. Though regulation and oversight have increased since 2008, there was no deep overhaul of the cultural mindset at many leading financial institutions. The world is awash with credit and emerging markets are considerably weaker now than in 2008. If nothing else, moral hazard created by the bailouts means that the next crisis could be as severe as the last one, with little appetite in the public for saving the banks one more time.

     •  A joint Russia-NATO military operation against ISIS and a settlement of the Syrian war. ISIS has lost much territory in 2016 but is still effective at orchestrating terror attacks in other countries. During the campaign, Donald Trump vowed to hit them hard.

     •  A sharp economic slowdown in China. China has been a huge engine of growth for over two decades lifting its own economy and boosting commodity-based countries such as Brazil, Russia and the OPEC countries. Chinese demand also helped maintain strong demand for American and European goods at a time when growth in Western economies was sluggish or nonexistent. At the same time, China’s low-cost manufacturing and capital flows into the US lowered inflation and interest rates. A marked China slowdown could throw all of the above in reverse, lifting interest rates in the US and Europe and depressing demand for finished goods and commodities.

     •  Political turmoil in Saudi Arabia and/or Iran. Both countries have vast oil reserves and are the leading power brokers in the Middle East. Destabilization in either would have important near and long-term consequences.

     •  A coup d’état or populist revolt in an OECD country. OECD member Turkey experienced an aborted military takeover in 2016. Could it happen elsewhere? Highly improbable but not necessarily 100% out of the question, as far as black swans are concerned.

     •  The price of oil at $20 or $90 per barrel. Today oil is trading near $55 and a decline to $40 or a rise to $65 are neither here nor there in terms of their lasting impact. But a $30 to $40 rise or drop would certainly shake things up. It is not difficult to construct either scenario, improbable as it may be. For a drop, imagine China and/or the US economy weakening while production from Iran, Iraq, Libya and US shale producers surges back. For a rise, consider emerging markets recovering with a stronger India while turmoil in the Middle East threatens some production.

     •  A major terrorist attack with thousands of casualties. Unfortunately, this one will have to feature on the list every year for the foreseeable future. Though it has a low probability, its occurrence anywhere would shock and reshape the world for the several decades that follow.

     •  On the positive side, there will continue to be advances in science and medicine. Because positive developments tend to build on the previous years’ progress, they are by their nature incremental, and are therefore unlikely to generate surprise shock or awe headlines.

These are all low probability but not zero probability events. And the impact of each would be far greater than that of any higher probability event featuring in many top 10 predictions for 2017.

Sami Karam is the founder and editor of populyst.net and the creator of the populyst index™. populyst is about innovation, demography and society. Before populyst, he was the founder and manager of the Seven Global funds and a fund manager at leading asset managers in Boston and New York. In addition to a finance MBA from the Wharton School, he holds a Master's in Civil Engineering from Cornell and a Bachelor of Architecture from UT Austin.

Photo: Edvard Munch [Public domain or Public domain], via Wikimedia Commons

The Demographics of Poverty in Santa Clara County

$
0
0

Tucked away in the bottom corner of the San Francisco Bay, tech royalty make themselves at home in their silicon castles. Santa Clara County is the wealthiest county in California, and 14th in the nation, boasting an average median household income of $96,310. However, where there are kings, there must be subjects. Despite its affluence, Santa Clara remains one of the most unequal counties in the United States. The combined forces of enormous wage gaps, exorbitant housing prices, and shifts in the regional economy have compounded over recent years, resulting in a shrunken middle class and increased poverty levels.

Santa Clara County contains just over 1.9 million people and is home to much of the Silicon Valley. The relatively recent explosion of growth in the high-wage technology industry has generated a new rank of upper-middle class to fabulously wealthy individuals. But, even in the economic miracle that is Silicon Valley, poverty remains a prevalent force and affects a disturbing number of lives in the region. Although, according to the Census Bureau, only 8.3% of Santa Clara County residents live at or below the Federal Poverty Level (FPL), this number drastically underestimates the true number of people that are experiencing financial hardship in the region. In a study conducted by United Way, it was found that the real cost budget for a family of four residing in Santa Clara County stands at $65,380 per year, or 281% of the FPL.

High regional housing costs account for much of the discrepancy in poverty levels between the county and the nation. A study out of the California Budget and Policy Center calculated that the poverty rate in Santa Clara County soars to 18% when factoring in housing costs, meaning nearly one in five residents live in poverty.

It is for this reason that the region has one of the largest homelessness populations in the nation, with around 7,600 homeless individuals residing within Santa Clara County. When local homeless individuals were surveyed regarding obstacles to securing housing, the top four answers were as follows: No job/income, no money for moving costs, bad credit, and lack of available housing. Of course, poverty is cyclical, and these answers affect one another to some extent: a lack of income means no money for moving costs, which may lead to bad credit and which could then lead to an inability to secure permanent housing. Around 56% of survey respondents also reported being homeless for over a year, up significantly from 47% just two years prior, indicating that the homeless in Santa Clara County continue to face significant obstacles to securing housing. High homelessness rates are symptoms of a greater trend: the fact that gross income inequalities in Santa Clara County have created a society of have’s and have not’s, separated by an income gap that shows no sign of closing.

Housing Trends

The most significant impediment to financial security in the county is the volatile housing market and the exorbitant cost of owning a home. According to a report conducted by the U.S. Department of Housing and Urban Development on the South Bay Area, the average price of houses sold in 2014 stood at $788,500 for an existing home and $828,000 for a new home. This is over four times the median value of homes nationally, which stands at $178,600. The disparity is even more prevalent in the areas of the region closer to large technology firms, such as Palo Alto, where the average home costs $2.43 million. San Jose also has the 7th largest share of renters in major U.S. cities, 56 percent, a rate that only continues to increase as housing costs do the same. The median gross rent in Santa Clara County stands at $1705 per month, nearly double the national average.

Current trends indicate that the increasing housing costs show no signs of reversing, which does not bode well for residents that are already struggling financially. A study from the California Budget and Policy Center found that, in 2013, over 50% of households classified as low-income were at risk of moving out of the area due to increased housing costs.

Net migration in Santa Clara County is overwhelmingly negative.

The result of high housing costs? Net domestic migration has been negative every year since 1996, except 2011, and appears to be dipping further, despite the fact that the population of Silicon Valley has grown continually in recent years. This can be attributed to a combination of natural births and massive foreign immigration rather than domestic migration. Therefore, negative net domestic migration suggests that a large portion of residents are leaving the area due to a lack of an income that cannot keep up with rising costs of living.

However, for those who stay, high housing prices lead to a plethora of other disadvantages, creating a cycle of poverty that decreases social mobility in the region. A search for cheaper housing has led many to seek living arrangements in the southern and eastern parts of San Jose, where housing is cheaper, but comes at the cost of higher crime rates and worse school districts. Additionally, job growth has been concentrated in the western parts of the county. The search for cheap housing has led to an increase in overcrowded households, as residents move in with one another in order to share the costs of rent. The Santa Clara County Department of Public Health concluded in 2014 that 14% of residents were living in overcrowded households, with 5% living in severely overcrowded households. Latinos in the region are disproportionately affected, with 31% living in overcrowded households and 12% living in severely overcrowded households.

The combination of these factors limits social mobility by undermining each individual’s access to economic opportunity. Moving into an overcrowded house in an underfunded public school district limits potential to obtain a quality education that may provide access to high-skilled, high-wage jobs.

The Income Gap

Inequality in the region is perpetuated by a growing income gap, and the ardent hunt for afford-able housing may be explained by the gross income disparities among residents. As housing prices have skyrocketed over recent years, incomes simply have not kept up with costs of living, particularly at the lower end of the spectrum.

Santa Clara County’s income gap has widened considerably since 1989.

Economic gains in the region have flowed overwhelmingly to the top quintile of income-earners, who have seen their wages increase by over 25% over the past 25 years. In a shocking comparison, income levels have declined for low-income households since 1989, a clear sign of a widening wealth gap in the region. Those at the bottom also find themselves working harder for less money: the average income for those living above the previously described real cost of living in Santa Clara County stands around $27 per hour, whereas the average income for those living below the real cost of living comes in at a bit over $10, around the current California minimum wage.

To make matters worse, government efforts have proven relatively ineffective in remedying regional inequality. A recent study has shown that even when a family is a recipient of CalWORKS and CalFresh benefits, government-funded initiatives to provide benefits to needy families, an average family of four is still tens of thousands of dollars away from comfortably subsisting in Santa Clara County. Additionally, government benefits are not reaching populations that would benefit from them the most: a United Way study found that less than 19% of single mothers and less than 5% of immigrants statewide subscribe to these programs.

Shifts in the Regional Economy

Efforts to increase wages of low-paying jobs may alleviate financial hardship to a certain degree, but these actions fail to consider an underlying trend in Santa Clara County: low-skilled, blue collar jobs are disappearing. Wage increases in industries heavily populated by lower income earners matter little if those jobs do not exist. Historically, Santa Clara County was a manufacturing hub, famous for producing semi-conductors along with other components vital to the burgeoning technology industry. However, recent years have seen manufacturing jobs leaving the area in droves, either to other parts of the country or abroad.

Sector growth in the region, percentage change, 2000-2014.

The chart above shows that job growth in Santa Clara County has only been observed in a few sectors of the local economy. Despite this growth, total nonfarm payroll employment has decreased in the past 15 years, and the impact of this job loss may be observed across the economy. The most significant reductions of the workforce have occurred in sectors referred to as “blue-collar,” typically middle income jobs that may or may not require higher education. These types of jobs cover many of those within the goods-producing sectors, comprised here of the mining, logging, construction, and manufacturing industries.

The rapid decline of “blue collar” jobs in the region may be attributed at least in part to the explosive growth of Silicon Valley. As the region attracts more skilled workers, increases the region’s desirability, and pays workers competitive wages capable of keeping up with costs of living, those very expenses will continue to drive upwards. As a result, workers across all economic sectors have demanded higher wages, a sentiment exemplified in the recent minimum wage hikes. Unfortunately, this drives lower-paying blue-collar industries to relocate, often out of the state, so they can lower their input costs, creating a polarized society of high-wage earners in the information sector along with low-wage earners in a service sector dedicated to the needs of the technocrats.

Santa Clara County is a place of immense, but heavily-concentrated wealth. Multi-billion-dollar technology campuses dot the landscape like behemoths, yet the wealth and progress that accompanied the growth of the Silicon Valley has also left a significant proportion of its population behind. The environment is increasingly hostile to social mobility, the manufacturing sector has skipped town, and government efforts to mitigate the effects of these changes have proven relatively unsuccessful. Trends have shown that the region’s poor are increasingly confined to specific industries and geographies, and their freedoms restricted as they are subject to a degree of economic violence that shows no immediate signs of relenting. Significant shifts in local policy are needed to reverse the current social and economic trends and ameliorate the situation in an increasingly polarized Santa Clara County.

Alex Thomas is currently a sophomore at Chapman University pursuing a major in Political Science. He is originally from San Jose, California, and has worked extensively within the city and surrounding areas. He hopes to further his interest in local politics through continued study and community involvement in the upcoming years.

Photo: Coolcaesar [CC BY-SA 3.0], via Wikimedia Commons

Viewing all 3792 articles
Browse latest View live


Latest Images