Quantcast
Channel: Newgeography.com - Economic, demographic, and political commentary about places
Viewing all 3790 articles
Browse latest View live

Is L.A. Back? Don't Buy the Hype.

$
0
0

With two football teams moving to Los Angeles, a host of towers rising in a resurgent downtown and an upcoming IPO for L.A.'s signature start-up, Snapchat parent Snap Inc., one can make a credible case that the city that defined growth for a half century is back. According to Mayor Eric Garcetti, the Rams, Chargers and the new mega-stadium that will house them in neighboring Inglewood, show that “that this is a town that nobody can afford to pass up.”

And to be sure, Los Angeles has become a more compelling place for advocates of dense urbanism. Media accounts praise the city’s vibrant art scene, its increasingly definitive food scene and urbanist sub-culture. Some analysts credit millennials for boosting the population of the region and reviving the city’s appeal. Long disdained by eastern sophisticates, there’s an invasion from places like New York. GQ magazine called downtown L.A. “America’s next great city” last year.

Downtown has transformed itself into something of an entertainment district, with museums, art galleries, restaurants, and sports and concert venues. Yet it has not become, like San Francisco or New York, a business center of note. In fact, jobs in the region have continued to move out to the periphery; downtown accounts for less than 5% of the region’s employment, one-third to half the share common in older large cities.

Downtown’s residential growth needs to be placed in perspective. Since 2000 the population of the central core has increased by only 9,500; add the  entire inner ring and the population is up a mere 23,000. Meanwhile over the same span, the L.A. suburbs have added 600,000 residents. Jobs? Between 2000 and 2014, the core and inner ring, as well as older suburbs, lost jobs, U.S. Census data show, while newer suburbs and exurbs added jobs.

In our most recent ranking of the metro areas creating the most jobs, Los Angeles ranked a mediocre 42nd out of the 70 largest metro areas; San Francisco ranked first. That’s well behind places like Dallas, Seattle, Denver, Orlando, and even New York and Boston, cities that we once assumed would be left in the dust by L.A.

A New Tech Hub?

The emergence of Snap has led some enthusiasts to predict L.A.’s emergence as a hotbed of the new economy. And to be sure, there is a growing tech corridor in the Santa Monica-Marina area that may gradually gain critical mass. Talk of a growing confluence between tech and entertainment content -- the signature L.A. product -- and the proliferation of new entertainment venues, could position the area for future growth. At the same time, the presence of Elon Musk’s Space X in suburban Hawthorne, near LAX, has excited local boosters.

Yet despite these bright spots, Los Angeles’ current tech scene is almost piteously small. One consistent problem is venture capital. Despite the massive size of its economy, and huge population, Los Angeles garners barely 5% of the nation’s venture capital, compared to 40% for the Bay Area, 10% for New York and Boston. Companies that were born in L.A. often end up moving elsewhere, like virtual reality pioneer Oculus, which was frog marched to the Bay Area after being acquired by Facebook.

Indeed, despite bright spots like Snap, since 2001 STEM employment in the L.A. metro area has been flat, in sharp contrast to high rates of job growth in the San Francisco Bay Area, Austin, Houston and Dallas, and the 10% national increase. Tech employment per capita in the L.A. area hovers slightly below the national average, according to a recent study I conducted at Chapman University. Los Angeles County, once the prodigious center of American high-tech, is also now slightly below the national average of engineers per capita.

The Poverty Economy

The regional economy, notes a recent Los Angeles Development Corporation report, continues to produce largely numbers of low-wage jobs, mostly in fields like health, hospitality and services. Sixty percent of all new jobs in the area over the next five years will require a high school education or less, the report projects.

At the same time in the year ending last September, employment dropped in three key high-wage blue collar sectors: manufacturing, construction and wholesale trade notes the EDC The largest gains were in lower-wage industries like health care and social assistance, hospitality and food service.  Since 2007 Los Angeles County has 89,000 fewer manufacturing jobs, which pay an average of $54,000, but 89,000 more in food service that pay about $20,000. No surprise more than one out every three L.A. households have an income under $45,000 a year.

All this works well for the people who are increasingly coming to enjoy L.A.’s great restaurants, hipster enclaves and art venues. The football teams will add to this mixture, offering employment selling peanuts, popcorn and hot dogs to generally affluent fans in the stands.

Yet low wages could prove catastrophic in a region that lags only the Bay Area in housing costs. Some 45,000 are homeless throughout the metro area, concentrated downtown but spreading throughout the region all the way to Santa Ana, in the south. Housing prices have risen to five times median household income, highest in the nation and more than twice the multiple in New York, Chicago, Houston or Dallas-Ft. Worth. L.A. leads the nation’s big metro areas in a host of other negative indicators, including the percentage of income spent on housing, overcrowding and homelessness. A city which once epitomized middle class upward mobility is increasingly bifurcated between a wealthy elite, mostly Anglo and Asian, and a largely poor Latino and African-American community.

A recent United Way study, for example, found that 37% of L.A. families can barely make ends meet, well above the 31% average for the state; the core city’s south and east sides have among the largest concentrations of extreme poverty in the state. Once a beacon for migrants from all over America, L.A. now has a similarly high rate of mass out-migration as New York. But unlike New York, where immigrants continue to pour in, newcomers to the U.S. are increasingly avoiding Los Angeles – it had the lowest growth in its immigrant population of any major metropolitan area over the past decade. Perhaps even more revealing, the Los Angeles area has endured among the largest drops in the number of children since 2000,notes demographer Wendell Cox,  more than New York, Chicago and San Francisco.

Altered DNA

The writer Scott Timberg notes that L.A.’s middle class, was once “the envy of the world.” L.A. used to be a place where firemen, cops and machinists could own houses in the midst of a great city. Dynamic, large aerospace firms, big banks and giant oil companies sustained the middle class.

But the city has lost numerous major employers over the years, most recently longtime powerhouse Occidental Petroleum, and the U.S. headquarters of both Toyota and Nestle. The regional aerospace industry, which provided nearly 300,000 generally high-wage jobs in 1990, is now barely a third that size. High housing cost have devastated millennials, whose home ownership rate has dropped 30% since 1990, twice the national average.

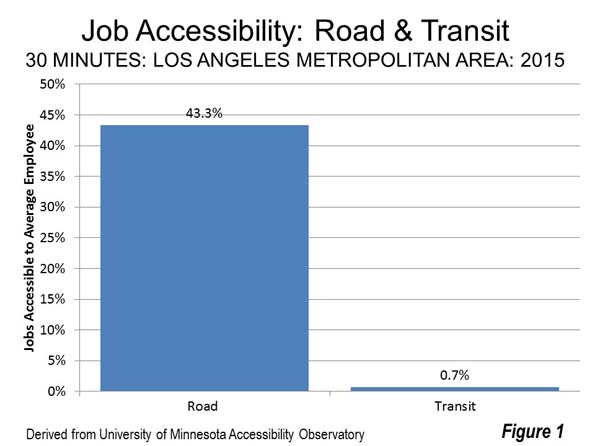
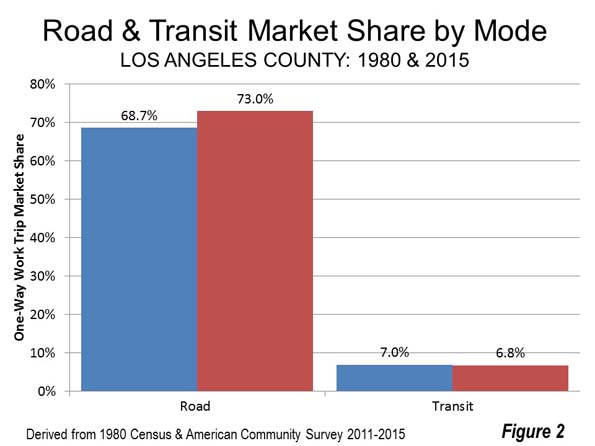
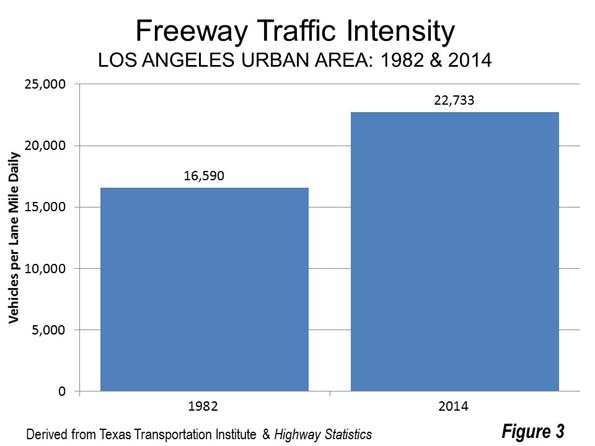
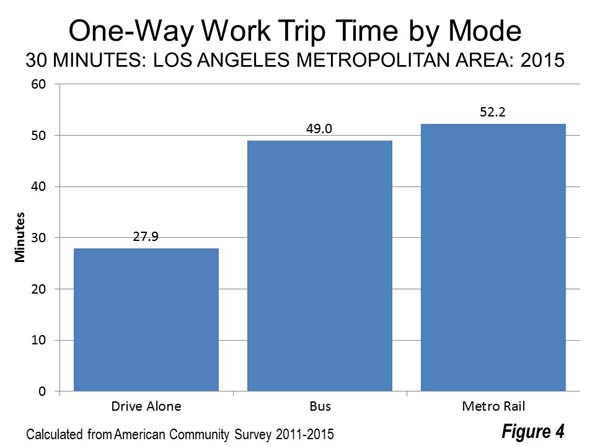
Many urbanists hail the emergence of a transit-oriented, dense city. Since 1990, Los Angeles County has added seven new urban rail lines and two exclusive busways at the cost of some $16 billion. Yet ridership on the Metropolitan Transportation Authority rail and bus services is now less than its predecessor Southern California Rapid Transit District bus services in 1985, before any rail services were opened. The share of work trips on transit in the entire five-county Los Angeles metropolitan region, has also dropped, from 5.1% in 1980 and 4.5% in 1990 to 4.2% in 2015. Meanwhile the city endures the nation’s worst traffic.

Some longtime Angelenos are mounting a fierce ballot challenge -- known as Measure S -- to slow down ever more rapid densification. The ballot measure would bar new high-density construction projects for the next two years. “The Coalition to Preserve L.A.,” which is funding the measure, claims to be leading in the polls for the March 7 vote, but faces well-financed opposition from politically connected large developers, Mayor Garcetti, both political parties, virtually the entire city council, and much of the academic establishment. The L.A. Times denounced Proposition S as a “childish middle finger to City Hall” and its architecture critic Christopher Hawthorne, has urged the citizenry “to move past the building blocks of post-war Los Angeles, including the private car, the freeway, the single-family house and the lawn.”

Proposition S proponents include many neighborhood and environmental groups, as well progressives and conservatives, including former Mayor Richard Riordan. The people controlling Los Angeles may dream of being the “next” New York but many residents, notes longtime activist Joel Fox, “are tired of the congestion and development and feel that more building will only add to congestion.”

Renewing La La Land

Of course, slowing or banning development by popular proposition is probably not the ideal  way to get control over the deteriorating situation. Yet it is clear that the current trajectory towards more dense housing is not addressing the city’s basic problems. Los Angeles, as the movie “La La Land so poetically portrays, remains a “city of dreams” but that mythology is clearly being eroded by a delusional desire to be something else.

In my old middle-class neighborhood in the San Fernando Valley, heavily populated by people from the creative industry, the worsening congestion, the upsurge of ever taller buildings and ever more present homeless did not reflect the giddiness of “La La Land.”

Yet despite all these problems, Los Angeles has the potential to make a great comeback. It has a dispersed urban form that allows for innovation and diversity, and an unparalleled physical location on the Pacific Rim. Its ethnic diversity can be an asset, if somehow it can generate higher wage employment to stop the race to the bottom. The basics are all there for a real resurgence, if the city fathers ever could recognize that the City of Angels needs less a new genome but  should build on its own inimitable DNA.

Joel Kotkin is executive editor of NewGeography.com. He is the Roger Hobbs Distinguished Fellow in Urban Studies at Chapman University and executive director of the Houston-based Center for Opportunity Urbanism. His newest book, The Human City: Urbanism for the rest of us, was published in April by Agate. He is also author of The New Class ConflictThe City: A Global History, and The Next Hundred Million: America in 2050. He lives in Orange County, CA.

Photo: AdamPrzezdziek


Los Angeles Traffic: Likely To Worsen with Higher Densities

$
0
0

A few recent days driving the Los Angeles freeways impressed me with how different they are from in most other places in the country. The intensity of the traffic is astounding. Even on the weekend, travel over Sepulveda Pass on the San Diego Freeway (I-405) was highly congested. Traffic really never stopped, but frustratingly inched along for parts of the way and approached 60 miles per hour on other parts. A Saturday trip I feared might take an hour and a half was completed from Simi Valley in less than 60 minutes. Caltrans and the local officials do an admirable job of keeping the traffic moving, which was obvious from the only slight delay near Sherman Way caused by an incident that required a fire truck.

Traffic Per Lane Mile

The latest Federal Highway Administration data indicates that nearly 23,000 cars are handled by each freeway lane on the average day. Among the larger urban areas, only San Jose and close-by Riverside-San Bernardino have a volume of more than 20,000 daily.

The freeway lane volume in Los Angeles is up from 16,500 cars per lane mile in the early 1980s,  a more 37 percent increase in traffic (Figure 1). This is not surprising, because the urban area, which stretches from the San Fernando Valley to Pomona and Orange County to San Clemente has added almost the same percentage of residents. The city of Los Angeles itself, which covers virtually the same area as it did more than three decades ago has become significantly more dense, also adding about one third to its population.

At the same time, public policy in California is calling for significant urban densification that will put an even greater strain on the roadway network. Any assumption that a more dense Los Angeles will be anything less than an even more horrific traffic environment is simply folly.

Billions Spent on Rail: Yet Traffic is Much Worse

Some, including me while I was on the Los Angeles County Transportation Commission, believe (or in my case “believed”) that an expansion of transit -- especially adding urban rail service, would relieve traffic congestion. Los Angeles has now had nearly three decades of experience with that strategy. Yet, traffic has only become more intense.

Indeed, despite the addition of a substantial urban rail system in Los Angeles County has been accompanied by a general decline in transit ridership on the Metropolitan Transportation Authority services compared to predecessor services operated by the Southern California Rapid Transit District in 1985. In 2016, ridership was even lower than the year before, despite the extensions of rail service to Santa Monica on the Expo Line and to Azusa on the Gold Line.

Even work trip ridership, which transit serves best, is down. In 1980, transit’s market share was 7.0 percent in Los Angeles County. By 2015, transit’s market share had fallen slightly to 6.8 percent. Meanwhile, driving alone expanded significantly from 68.7 percent in 1980 to 73.0 percent in 2015. Working at home increased from 1.5 percent in 1980 to 5.1 percent in 2015 (Figure 2).

Why Rail has Not Attracted Drivers

There are two principal reasons the transit has not been able to attract drivers out of their cars and reduce freeway volumes. The first is that, for the most part, you cannot get from here to there on transit. That is, most jobs and places people are traveling cannot be conveniently accessed by transit. The University of Minnesota Accessibility Laboratory has found that 43.3 percent of jobs in the Los Angeles metropolitan area can be reached by car within 30 minutes. By contrast. Only 0.7 percent of jobs can be reached by transit within 30 minutes. In other words, the accessibility provided by cars is much greater than that of transit. For every job that can be reached by transit within 30 minutes, nearly 60 times as many jobs can be reached by car (Figure 3).

Even where jobs can be reached by transit, it takes far longer. According to the latest American Community Survey data, the average one way work trip travel time for people driving alone in the Los Angeles metropolitan area is 27.9 minutes. By contrast, the average Metro Rail rider takes 52.2 minutes to reach work (Figure 4). It is not hard to imagine why people have not traded in their faster car travel times for slower trips on transit. Excess travel time, regardless of how traveled, takes away from other necessary activities and recreation.

Further, with all the talk about “urban villages,” with the expected improved jobs housing balance, it is well to recognize such an achievement would be unprecedented. As former principal planner of the World Bank Alain Bertaud put it: “…the urban village "model does not exist in the real world because it contradicts the economic justification of large cities: the efficiency of large labor markets." The cold water of reality is that "... the urban village model exists only in the mind of urban planners."

Of course, talk of people living near where they work is dubious, particularly in a metropolitan area where housing affordability  is challenging both for the vast majority of renters and potential buyers. When does anyone think this will happen? In “this life” or maybe in the “life to come?”

The bottom line, unfortunate and politically incorrect as it is, is that transit simply cannot reduce traffic congestion. Some other strategy needs to be deployed.

Prognosis: More Density, More Traffic

Los Angeles traffic is likely to get much worse, especially if the development becomes substantially denser. All of the 12 world urban areas in the recent Tom Tom Congestion Index that have worse traffic than Los Angeles are denser. This is consistent with the international evidence that shows a strong association between higher densities, greater traffic congestion and lengthened work trip travel times. The experience in Los Angeles shows the same thing.

Wendell Cox is principal of Demographia, an international public policy and demographics firm. He is a Senior Fellow of the Center for Opportunity Urbanism (US), Senior Fellow for Housing Affordability and Municipal Policy for the Frontier Centre for Public Policy (Canada), and a member of the Board of Advisors of the Center for Demographics and Policy at Chapman University (California). He is co-author of the "Demographia International Housing Affordability Survey" and author of "Demographia World Urban Areas" and "War on the Dream: How Anti-Sprawl Policy Threatens the Quality of Life." He was appointed to three terms on the Los Angeles County Transportation Commission, where he served with the leading city and county leadership as the only non-elected member. He served as a visiting professor at the Conservatoire National des Arts et Metiers, a national university in Paris.

Photo: North on the 110 Toward Downtown, AM Peak (by author)

The Economics of Dependency

$
0
0

This article first appeared at Foreign Affairs.

How countries hit the demographic sweet spot.

Demographics are among the most important influences on a country’s overall economic performance, but compared with other contributors, such as the quality of governance or institutions, their impact is underappreciated.

Demographic factors, such as the age structure of a population, can determine whether a given economy will grow or stagnate to an even greater extent than can more obvious causes such as government policy. One of the most consequential aspects of demographics as they relate to the economy is a phenomenon known as the “demographic dividend,” which refers to the boost to economic growth that occurs when a decline in total fertility, and subsequent entry of women into the work force, increases the number of workers (and thus decreases the number of dependents) relative to the total population. The demographic dividend has contributed to some of the greatest success stories of the twentieth century, and countries’ ability to understand and capture this dividend will continue to shape their economic prospects well into the future. Continue reading at Foreign Affairs >>>

Sami Karam is the founder and editor of populyst.net and the creator of the populyst index™. populyst is about innovation, demography and society. Before populyst, he was the founder and manager of the Seven Global funds and a fund manager at leading asset managers in Boston and New York. In addition to a finance MBA from the Wharton School, he holds a Master's in Civil Engineering from Cornell and a Bachelor of Architecture from UT Austin.

Photo: infradept

Chicago's Crime Wave Understood: Complex Problem, Simple Formula

$
0
0

Chicago's violent crime problem can be understood through this formula:

It's a simplistic, reductionist, even crude, but it explains the roots of Chicago's crisis as well as anything.

It has been particularly grueling time in Chicago this recently.  We experienced the murders of at least ten Chicagoans, including two girls, age 12 and 11, shot within 30 minutes of each other in different locations, and a 2-year-old boy.  Once again, Chicago is thrust into the spotlight as President Donald Trump spoke of "two Chicagos" and renewed his pledge to send some kind of federal assistance to deal with the violence (note: you may have seen me refer to "two Chicagos" before, but I'm definitely uneasy with our current President making even starker distinctions between them).  And with each new story of violence, of television and newspaper reporters being sent out to document another life lost, of an expression of heartbreak from a grieving parent, we ask ourselves, "how did it get this way?  How do we solve it?"

In many respects the violent crime wave is a reaction to the same trends that got our president elected, but coming from even deeper and longer lasting strains of dislocation and disenfranchisement.  It's also a set of unintended consequences related to very specific policies undertaken by the city itself.  While Chicago's experience is rather unique among American cities, other cities that exhibit similar traits are seeing the same spike as well.  In each case, the spike is decades in the making.

Segregation

It starts with segregation.  Chicago's leaders during the early years of the twentieth century were the innovators of a segregation system that plagues the city to this day.  Natalie Moore, South Side bureau reporter for Chicago public radio station WBEZ and author of The South Side: A Portrait of Chicago and American Segregation, noted the pervasiveness of segregation in Chicago in this interview with the Chicago Tribune:

"People know that segregation exists, but they don't always think about it," said Moore, WBEZ's South Side Bureau reporter and the author of "The South Side: A Portrait of Chicago and American Segregation." "It's like air and water: You just kind of live it, but you don't think about it."

And how was it established?  Tribune reporter Jeremy Mikula and Moore go on:

"The institutional racism Moore charts in the book goes back generations and has its roots after the start of the Great Migration. Restrictive covenants prevented African-Americans from moving outside the city's historic Black Belt until U.S. Supreme Court cases such as Hansberry v. Lee (1940) and Shelley v. Kraemer (1948) eliminated such restrictions in housing.

Through that time, Moore writes, "the city designed a way for blacks to not fully participate in the freedoms of the North," and later formulated subtle policy decisions that can still be felt today, she said.

"All the things from redlining to the Home Owners' Loan Corporation to blockbusting to white flight, there are so many things that happened in the 20th century that have lingering effects," Moore said. "It's never been about white people want to live there and black people want to live there. This is where the history is really important for us to understand."

Emphasis added. 

Tools were developed and employed to create a segregated Chicago -- restrictive covenants, redlining, exclusionary zoning, urban renewal, interstate highway development, public housing development, aggressive policing tactics and a judicial system that exploits inequality -- and those tools are foundational to our understanding of the way the city operates today. 

Chicago is not alone in its history of segregation, nor is it alone in its current spike in violent crime.  In fact, it may not even be the worst.  In late 2016, USA Today reported on the nation's most violent cities, based on 2015 FBI violent crime data.  Chicago was not among the top ten.  The list was headed by St. Louis, followed by Detroit, Birmingham, Memphis, Milwaukee, Rockford, IL, Baltimore, Little Rock, AR, Oakland and Kansas City.  What's dispiriting is the number of violent cities that are also among the most segregated.  St. Louis, Detroit, Birmingham, Memphis, Milwaukee and Kansas City are on most lists of highly segregated cities, as well as Chicago, Indianapolis, Cleveland, Cincinnati and Philadelphia.  Nearly all have seen violent crime increases.

Neighborhood Destabilization

So Chicago became a highly segregated city, with large numbers of blacks cut off from the economic and social networks necessary for upward mobility.  Old segregated spaces increasingly became impoverished spaces, as former white neighborhoods became new segregated spaces.  Concentrated poverty became super-concentrated with the development of the public housing in Chicago, and by the '80s and '90s Chicago was notorious for two features of its segregated system: 1) a gigantic collection of gangs operating as organized criminal enterprises; and 2) a depraved and dysfunctional public housing system, which also served as a base for gang activity.  To many, the dysfunction of Chicago's public housing was crystallized in the story of the murder of Eric Morse, a 5-year-old taken to a vacant 14th floor Ida B. Wells public housing complex apartment by two preteens, and dropped to his death because he would not steal candy for them.  The city, and the nation, was outraged.

It's at this point that Chicago made a significant departure from other cities and pursued three policy choices that impacted the stability of its neighborhoods.  First, it made a concerted effort to lock up the leadership of the gang hierarchy, intent on "cutting off the head" of the gangs.  Second, the city recognized the failure of its public housing system, and elected to dismantle its most troublesome projects through its Plan for Transformation.  Third, in a cost-saving measure, the city closed nearly 50 public schools, with nearly all being in the highly segregated south and west sides.

Each played a role in undermining the stability of Chicago's south and west side neighborhoods, sending them into the violent crime spiral we see today.

In the mid-'90s, Chicago police worked with the U.S. Attorney's office to establish Operation Headache.  At the time the Chicago drug trade was largely controlled by gangs that were more akin to organized crime syndicates than gangs in the conventional sense.  The Gangster Disciples, the Black Disciples, the Vice Lords and the Latin Kings covered large parts of the city and developed distribution networks and open-air drug sales areas, and law enforcement found the problem nearly intractable.  Operation Headache represented a shift in tactics designed to bring them down.  Rather than focus on lower-level drug dealing youth who cycled in and out of the criminal system, they chose to go after gang leaders in an effort to destabilize them, and it was successful:

"The first wave of convictions stemming from Operation Headache came in March 1996. But the biggest, most symbolically meaningful blow to the Gangster Disciples was delivered in May 1997, when Hoover was convicted of 42 counts of conspiracy to distribute drugs, received a sentence of six life terms, and was transferred to a supermax prison in Colorado, where his cell was located several stories underground and his ability to communicate with the remnants of his gang were severely constrained. Soon, the GDs in Chicago had been all but neutralized, and the authorities shifted their attention to decapitating the city’s other major drug organizations, the Black Disciples and the Vice Lords.

Over the course of a roughly 10-year stretch starting in the mid-1990s, leaders from the GDs, the Vice Lords, the Black Disciples, and to a lesser extent, the Latin Kings were successfully prosecuted and taken off the street. The top-down assault appeared to work as Safer and his colleagues had hoped: violent crime in Chicago began to decline, with the city’s murder total dropping from a high of 934 in 1993 to 599 10 years later."

Beginning in 2000, the Chicago Housing Authority moved out public housing residents from developments that looked like this:

and demolished them.  The goal was to replace them with less concentrated developments that would be integrated with their surrounding communities that looked more like this:

or like this:

The critical difference would be, however, that the CHA would now pursue a mixed-income approach to public housing development to address the city's segregation problems and poverty concentration.  To do that, a third of residential units in new developments would be reserved for public housing residents, another third would be developed as affordable units for working-class and middle-class residents, and the last third would be sold or rented as market-rate properties. 

Just as Operation Headache was successful in its early stages, so was the Plan for Transformation.  CHA worked closely with the U.S. Department of Housing and Urban Development to tear down the old public housing towers, and completed developments that did indeed appear more integrated into the surrounding neighborhood and fulfilled the mixed-income character that people desired.  By the mid-2000s both policies looked to be successful elements in the remaking of Chicago.

But there were unintended consequences that law enforcement and housing officials did not see.  Violent crime in Chicago dropped to historic lows by 2005, leveled off for a few years, and started trending upward.  One reason cited?  Law enforcement became a victim of its success:

"While experts say the Latin Kings, a Hispanic gang, continue to run a large and rigidly organized drug-selling operation on Chicago’s West Side, the majority of Chicago residents who call themselves gang members are members of a different type of group. Rather than sophisticated drug-selling organizations, most of the city’s gangs are smaller, younger, less formally structured cliques that typically lay claim to no more than the city block or two where they live. The violence stems not from rivalries between competing enterprises so much as feuds that flare up with acts of disrespect and become entrenched in a cycle of murderous retaliation.

Many close observers of Chicago’s violence believe that, as well-intentioned as it was, the systematic dismantling of gangs like the Disciples led directly to the violence that is devastating the city’s most dangerous neighborhoods in 2016. Taking out the individuals who ran the city’s drug trade, the theory goes, caused a fracturing of the city’s criminal underworld and produced a vast constellation of new entities that are no less violent, and possibly even more menacing, than their vanquished predecessors."

Meanwhile, CHA was successful in the dismantling of old projects, but had limited success in the development of new ones, especially when trying to implement the mixed-income model.  In 1999, CHA committed to finding replacement housing for all public housing residents who would be displaced by the demolition, counting on their ability to construct mixed-income developments.  However, they soon ran into several challenges.  Private developers were finding it difficult to obtain financing for mixed-income developments, despite federal, state and local commitments.  But more importantly, market-rate buyers and renters, and even buyers and renters in the affordable range, showed little desire to share space with public housing residents. 

This curtailed CHA's ability to construct new developments, and forced them to rely much more heavily on Housing Choice Vouchers (HCVs, commonly referred to as Section 8 vouchers) to provide housing for former public housing residents.   An April 2011 report by CHA found that of the 16,500 public housing family households they committed to developing mixed-income units for, only 20% were actually in such developments.  There were 36% living in CHA projects that weren't demolished, and 44% received HCVs and were living wherever their voucher would take them.

Where did voucher holders go?  Generally to working-class black neighborhoods further south or west of former public housing sites on the south and west sides.  Many Robert Taylor and Stateway residents left Bronzeville and moved to the Englewood and Auburn-Gresham neighborhoods further south; many Horner and Rockwell residents left the near west side and Garfield Park and moved to Austin, further west. 

The last straw was the closure of schools by the Chicago Public Schools in 2013.  By the mid-2000s, for anyone who cared to note it, there was growing evidence of conflict within the city's public schools as children new to various neighborhoods competed with children of long-time residents.  At the same time the school system continued down its own budget spiral as the service delivery costs went upward and pension obligations went unmet.  That forced consideration of closures by CPS, much to the dismay of community residents familiar with the disruption caused by gang disorganization and an influx of poor residents.  Not only would the education of students be compromised by the closings, they argued, but the conflicts seen as voucher-holding residents moved into their communities would arise again.  New school boundaries would put combustible mixes of vulnerable children in new and dangerous environments.

Globalization

The election of Donald Trump as president has brought sharp focus to the polarization of our nation by economics, class and geography.  Well-educated and high-skilled workers are succeeding in today's economy; less-educated and lower-skilled workers are failing.  A lot of people view this within the context of our nation's white working class in small cities and rural areas, but the same applies to blacks in cities like Chicago as well.

I'm going to plagiarize myself and pull some things about Chicago I wrote last year, when I saw six distinct categories of neighborhoods in the city.  Here's the map:


Gentrified Communities (dark green): Former middle and working-class neighborhoods that have firmly become well-to-do neighborhoods over the last 30 years or so. Home to a substantial amount of Chicago's walkable urbanism inventory. Transit supported and amenity rich.

Gentrifying Communities (light green): Historically similar to the adjacent gentrified communities, but part of a second or third wave of growth that emanated from the first group. Almost as affluent and educated as the first group, and quickly catching up, but not quite there yet.

Frontline Communities (yellow): Largely working-class neighborhoods that may be experiencing development pressure generated in the gentrified/gentrifying communities. People in the above two areas may identify with communities here as places for authentic ethnic dining or shopping. Less wealthy and with more minorities than the gentrified/gentrifying communities, but less than those on its outer flank. In Chicago, at least, fear of the prospects of gentrification here may exceed reality.

Stable Prosperous Communities (gold): Middle-class neighborhoods that sprouted in the city at the advent of the suburban era and have changed little since. Single-family home oriented and auto-oriented. In Chicago, home to many city workers who must remain in the city due to residency requirements. Rapidly growing older in its makeup.

Transitioning Communities (orange): Structurally similar to the stable prosperous communities, but more deeply impacted by one or two transitions. Some are receiving a large influx of new minority residents, largely Latino. Others are experiencing a huge outflow of middle-class families, largely African-American. Those experiencing the Latino influx are becoming younger and less affluent; those experiencing the African-American outmigration are being hollowed out, leaving behind large numbers of older and younger less affluent residents.

Isolated Communities (brown): Impoverished areas of the city. Middle-class white residents left here in the '50s and '60s, replaced by middle-class and working-class blacks who bore the brunt of job loss in the subsequent decades. Plenty of walkable urbanism exists here, but demolition means it's fading away.

Here are a few data pieces I gathered for each of the categories I identified (you can click to see bigger):

Looking at the map, the green and light green neighborhoods have been Chicago's winners in today's global economy.  The gold neighborhoods have been doing reasonably well.  Depending on your perspective, the yellow neighborhoods are threatened with gentrification encroachment, or have a reasonable expectation of upcoming revitalization.  The orange and brown neighborhoods?  They're not doing so well.  They're the ones largely impacted by Chicago's century-old segregation legacy, or in various stages of instability via the actions undertaken over the last 25 years. 

Chicago's rigid segregation patterns set the stage economic divergence before globalization did, but globalization made it worse.  And in the aftermath of the Great Recession, when globally connected communities returned to their upward trajectory, troubled communities sunk further into the abyss.

Chicago's violent crime spike will not be solved with National Guard troops patrolling the streets.  It will not be solved with greater emphasis on gun control laws.  It will not be solved by a wholesale reform of the Chicago Police Department, which has just come out of a year-long investigation by the U.S. Department of Justice that excoriated its "excessive force, lax discipline and bad training."  All of these measures would have some incremental impact on violent crime.  Crime would go down, if only temporarily.  However, these measures treat the symptom.  None would do anything to address root causes and eliminate the problem for good.

There is an answer to Chicago's madness.  It would not solve the problem overnight, but it would have the potential to solve it for the long term.  I'll outline it in my next blog post later this week.

Pete Saunders is a Detroit native who has worked as a public and private sector urban planner in the Chicago area for more than twenty years.  He is also the author of "The Corner Side Yard," an urban planning blog that focuses on the redevelopment and revitalization of Rust Belt cities.

Top photo: A body is removed from the scene after a man was shot and killed in the 3000 block of West 53rd Place in Chicago. — Anthony Souffle, Chicago Tribune, April 13, 2014

How the Democrats can Rebuild

$
0
0

Numerous commentaries from both the political left and right have expounded the parlous state of the Democratic Party. And, to be sure, the Democrats have been working on extinguishing themselves in vast parts of the country, and have even managed to make themselves less popular than the Republicans in recent polls.

Yet, in the longer term, the demographic prospects of a Democratic resurgence remain excellent. Virtually all of the growing parts of the electorate — millennials, Latinos, Asians, single women — are tilting to the left. It is likely just a matter of time, particularly as more conservative whites from the silent and boomer generations begin to die off.

But, in politics, like life, time can make a decisive difference. It’s been almost a decade since the Atlantic proclaimed the end of “white America,” but Anglos will continue to dominate the electorate for at least the next few electoral cycles, and they have been trending to the right. In 1992, white voters split evenly between the parties, but last year went 54 percent to 39 percent for the GOP.

Identity politics vs. social democracy

To win consistently in the near term, and compete in red states, Democrats need to adjust the cultural and racial agenda dominating the “resistance” to one that addresses directly the challenges faced by working- and middle-class families of all races. This notion of identity politics, as opposed to those of social class, is embraced by the progressives’ allies in the media, academia, urban speculators, Hollywood and Silicon Valley, since environmentalism, gender and race issues do not directly threaten their wealth or privileged status.

The rise of identity politics, born in the 1960s, has weakened the party’s appeal to the broader population, as Columbia University humanities professor Mark Lilla argued in a November New York Times column. But most progressives, like pundit Matthew Yglesias, suggest that “there is no other way to do politics.” To even suggest abandoning identity politics, one progressive academic suggested, is an expression of “white supremacy,” and she compared the impeccably progressive Lilla with KKK leader David Duke.

This hurts the Democrats as they seek to counter President Donald Trump. Americans may not be enthusiastic about mass deportations, but the Democratic embrace of open borders and sanctuary cities also is not popular — not even in California. And while most Americans might embrace choice as a basic principle, many, even millennials, are queasy about late-term abortions.

Democrats also need to distance themselves from the anti-police rhetoric of Black Lives Matter. Among millennials, law enforcement and the military are the most trusted of all public institutions. Rabid racial politics among Democrats, notes Lee Trepanier, political science professor at Saginaw Valley State University in Michigan and editor of the VoegelinView website, is steadily turning white voters into something of a conscious racial “tribe.”

Finally, Democrats have now embraced a form of climate change orthodoxy that, if implemented, all but guarantees that America will not have a strong, broad-based economic expansion. The economic pillars of today’s Democratic Party may thrive in a globalist, open-border society, but not many in the more decidedly blue-collar industrial, agricultural or homebuilding industries.

This piece first appeared in The Orange County Register.

Joel Kotkin is executive editor of NewGeography.com. He is the Roger Hobbs Distinguished Fellow in Urban Studies at Chapman University and executive director of the Houston-based Center for Opportunity Urbanism. His newest book, The Human City: Urbanism for the rest of us, was published in April by Agate. He is also author of The New Class ConflictThe City: A Global History, and The Next Hundred Million: America in 2050. He lives in Orange County, CA.

Photo: Gage Skidmore

A New Age of Progressive Suburbanism?

$
0
0

We are living in a global suburban age… While statistics demonstrate that the amount of the world population in metropolitan areas is rapidly increasing, rarely is it understood that the bulk of this growth occurs in the suburbanized peripheries of cities. Domestically, over 69% of all U.S. residents live in suburban areas; internationally, many other developed countries are predominately suburban, while many developing countries are rapidly suburbanizing as well.”

That’s not some anti-urban crackpot statement (as some inner urban elites might think) but from the introduction to a biennial theme of the MIT Center for Advanced Urbanism (USA). They understand that suburban and regional centres are not irrelevant for the future economy but highly important.  MIT are a pretty credible lot - hardly likely to pursue fringe urban planning or economic theories.

In Australia, however, that message is not getting through. From the Prime Minister, down, there is a sense of irrational exuberance that the jobs of the future will mostly be concentrated in our CBDs and inner cities. Urban planning which supports increased concentration of employment through generous infrastructure allocations to inner urban areas is the manifestation of this inner urban obsession.  And while CBDs and inner urban areas are lavished with costly projects designed mainly to benefit the minority of people who work there, suburban and regional centres – where the majority live, work and play - have been largely left to fend for themselves.

This process started in the late 1990s and early 2000s, notions about the “creative class” --- many of which are being re-examined by author Richard Florida in a new book ---   was a cause celebre amongst planning and government circles. It was widely argued that to attract the creative class of worker (synonymous with high skills and the new economy) cities needed to invest heavily in the quality of life in their downtowns. This was a precursor to the inner urban hipster, and, when real estate prices, rose their successors, the rise of the inner-city latte set.

This thinking fit in well with two other trendy theories, New Urbanism and ‘Smart Growth’ (which redefined suburban progress as urban sprawl). The collective wisdom moved from supporting a growing suburban realm to one that disparaged it: the burbs were for bogans, the home of sprawl, “McMansions” full of low wage earning, culturally deficient and poorly educated masses, eating fast food diets and slurping sugar drinks. Inner cities by contrast were for educated, cultured and knowledgeable people – who had little need for suburban spaces or suburban habits but greater need for inner city waterfront cycle ways, museums, theatres and quality restaurants run by notable chefs. And, of course, lots of baristas. 

Urban planning shifted quickly to a highly-regulated approach which promoted much higher densities of inner urban housing (and limits on outward expansion) because, after all, the inner city is where everyone in the future will want to live, right? The promises of these regional planning policies bordered on messianic. Take this example from the “Draft Metropolitan Strategy for Sydney to 2031” from the early 2000s:

“A home I can afford. Great transport connections. More jobs closer to where I live. Shorter commutes. The right type of home for my family. A park for the kids. Local schools, shops and hospitals. Liveable neighbourhoods.”

And what have we got thus? Some of the worst housing affordability in the world. Worsening congestion. Longer commutes. Limited housing choice, much of it not ideal for raising families.

The ongoing policy focus and infrastructure obsession with centralisation is utterly at odds with economic and community signals. New economy industries in technical, scientific or professional services, or health and social care, have little interest in centralisation. Digital technology has broken that tyranny of distance. Undeterred though, we continue to watch as political and industry leaders promote costly infrastructure projects that enhance and support further centralised employment and a concentration of amenity in inner urban cores enjoyed by a privileged, mostly childless minority.

For the record, the proportion of metropolitan wide jobs in the inner cities of Melbourne, Sydney and Brisbane was 11%, 13% and 12% respectively at the last census.  The reality remains that in our metropolitan centres, most people both live and work outside inner city bubbles of privilege. 

The penny is finally dropping in some minds. Former Victorian Planning Minister, Matthew Guy (now Opposition Leader) once extolled the virtues of high density inner urban development. Looks like he has had a Damascus moment, commenting in The Australian (March 1, 2017) that: “Victoria is becoming a great, heaving, unsustainable mess. The whole of Victoria is just becoming an offshoot of Melbourne.”

The emphasis on centralisation of jobs, housing and supportive infrastructure makes little sense in a country with such large land masses and capacity for expansion. Not only that, but the economic winds – enabled by rapid expansion of disruptive technology – are blowing the other way. Suburban and regional centres, long disparaged by the cognoscenti should instead be looked on as part of the solution to economic expansion and development. Where once we promoted urban renewal, we now need to turn our minds to suburban and regional renewal. We need to identify the critical infrastructure constraints of suburban and regional business centres and remedy them to encourage accelerated development of employment opportunities across the board.

In a bid to put some balance into the discussions about urban development and growth, a Suburban Alliance (www.suburbanalliance.com.au) has been formed in Australia – with the intention of supporting research projects into the nature and needs of the suburban economy, and to use these as a platform for well-informed policy advocacy. Wish us luck. The initial focus starts in Brisbane but if the idea finds support, we’d like to see this expand to cover all major urban and regional centres. 

The more supporters we can muster the sooner this absurd preoccupation with all things inner city can begin to be balanced with a better understanding of the important role played by suburban and regional business centres and why these are part of the solution to enhanced economic opportunity.

Ross Elliott has more than twenty years experience in property and public policy. His past roles have included stints in urban economics, national and state roles with the Property Council, and in destination marketing. He has written extensively on a range of public policy issues centering around urban issues, and continues to maintain his recreational interest in public policy through ongoing contributions such as this or via his monthly blog, The Pulse.

Photo: Photograph by Gnangarra [CC BY 2.5 au], via Wikimedia Commons

Detroit's Recovery? Oh Yeah, It's Real Alright

$
0
0

So it seems the debate has begun.  There's been enough progress in Detroit to discuss whether its rebound is for real, or not.

Two academics, Laura Reese of Michigan State University and Gary Sands of Wayne State University, wrote a piece for the Atlantic a couple weeks ago to counter the spreading narrative of Detroit's comeback.  The article notes the Motor City's rebound has caught the attention of the national media and parts of academia, but they aren't so certain that the trend is real, or if it is, whether it's indeed sustainable.  From the article:

"These rosy descriptions were not consistent with the reality of what we continued to see in many Detroit neighborhoods. To provide perspective on Detroit’s comeback story, we examined trends in a variety of indicators including population, poverty, income disparities, business recovery, unemployment, residential sales prices and vacancies, and crime.

Two major conclusions emerged from our data. First, by a number of measures Detroit continues to decline, and even when positive change has occurred, growth has been much less robust than many narratives would suggest. Second, within the city recovery has been highly uneven, resulting in increasing inequality."

In response to this article, blogger Lyman Stone added his take on Detroit's recovery.  He seems to agree with Reese and Sands that, whatever is happening in Detroit, it's not touching growing numbers of city residents, and therefore it's not exactly a comeback:

"I tend to be on team “Abandon all hope ye who enter here.” Saving Detroit is likely to be extremely costly while still holding a high risk of failure, in my opinion. But this view is predicated on a certain perspective of what it means to succeed. To some, success means population decline stops. To some, success means fewer empty buildings. To some, success means balanced municipal finances. To some, success means increasing employment. To me, I tend to think success means that huge population outflows will stop, and that population will begin to rise. Others may espouse other views, but I tend to think a locality’s ability to provide prosperity only matters in a general equilibrium framework, so a place that makes locals rich by culling the herd of non-rich locals is not “succeeding.” Success means that you offer prosperity to a rising share of the general population."

However, Stone notes that there are some positive demographic trends that are evident in Detroit, and seems to make the case that if Detroit is to get out of its hole, it's at least stopping digging.

The City Observatory's Joe Cortright took a positive spin on Detroit in the Atlantic, going against the grain of both pieces and suggesting that Detroit's comeback shouldn't be dismissed:

"Is Detroit “back?” As best I can tell, no one’s making that argument. The likelihood that the city will restore the industrial heyday of the U.S. auto industry, replete with a profitable oligopoly and powerful unions that negotiate high wages for modestly skilled work, just isn’t in the cards...

That said, there’s clear evidence that Detroit has stanched the economic hemorrhage. After a decade of year-over-year job losses, Wayne County has chalked up five consecutive years of year-over-year job growth. True, the county is still down more than 150,000 jobs from its peak, but it has gained back 50,000 jobs in the past five years."

Honestly, I think each of the pieces -- indeed, most people -- underestimate the depths of Detroit's collapse, and therefore underestimate the significance of its current recovery.  Detroit's collapse was not simply an economic one, but a cultural, social and demographic one as well.  It lost virtually all connections with the networks of wealth and information that drive economic growth, and the city had such a pervasive negative perception that it was effectively erased from the minds of many.  What's happening now is Detroit is reconnecting itself to the national and international network of cities, slowly returning to life among the living.  This is a necessary step for Detroit before any rebound that improves the lives of the majority its residents. 

I view things this way.  While Detroit suffered immensely from the restructuring and decline of the auto industry, it likely suffered even more from demographic collapse.  Four years ago, I wrote a piece that showed the strength of the city's demographic vacuum.  It's not just that the city lost jobs and people moved.  People soured on Detroit in ways no other major city experienced, and left behind a city of concentrated poverty. I've often brought this graphic out, and it still amazes me:


To his credit, Joe Cortright gets this in his article.  Where Reese and Sands argue that Detroit's economic boost in the downtown and Midtown areas and some select nearby neighborhoods is raising income inequality, Cortright responds with a comment from the Brooking Institution's Alan Berube: "Detroit does not have an income inequality problem—it has a poverty problem. It’s hard to imagine that the city will do better over time without more high-income individuals."

And that's indeed the critical first step for Detroit.  It has to once again attract a critical mass of middle income and upper income residents who are ready, willing and able to invest in the city, before it can effectively take on its greater economic challenges. The post Great Recession recovery we're witnessing now means the city is getting closer to being able to take on greater tasks.

Pete Saunders is a Detroit native who has worked as a public and private sector urban planner in the Chicago area for more than twenty years.  He is also the author of "The Corner Side Yard," an urban planning blog that focuses on the redevelopment and revitalization of Rust Belt cities.

Top photo source tomabouttown.wordpress.com

Is Climate Change Really the Cause of Mexico City’s Water Problems?

$
0
0

A couple weeks ago the New York Times ran a gigantic front-page Sunday article by architecture critic Michael Kimmelman on Mexico City’s water crisis.

This piece was billed as the first installment in a series on the effect of climate change on cities. Which is a head-scratcher, since Mexico City’s problems don’t seem to have anything to do with that.

Mexico City is a megacity of 21.2 million people, making it roughly the size of greater New York. It’s also a mile and a half above sea level on a former lake bed in a valley among the surrounding mountains. So it’s at a significantly higher elevation than even Denver.

This creates huge problems. A gigantic city has huge water needs. At high elevation, using a gravity feed for water is complicated to say the least. This necessitates costly pumping to delivery water from remote sources. The city is surrounded by mountains making even drainage complex. Much of the city’s water supply has come from its own ground water, and the city is sinking from the subsidence as a result of pumping.

And of course Mexico and its capital are in the developing world, and so do not have the wealth to construct and maintain New York City style infrastructure.

All of this is basically covered in the Kimmelman piece, which is good in many ways. But it’s not clear where climate change comes in. All of these problems would exist apart from any climate change. At best, he simply argues that climate change will make things worse, though without citing any real specifics. He only says:

"It is a cycle made worse by climate change. More heat and drought mean more evaporation and yet more demand for water, adding pressure to tap distant reservoirs at staggering costs or further drain underground aquifers and hasten the city’s collapse."

Why in the world would the Times want to make this into a climate change story? It’s manifestly obvious from the article itself that the core water problems in Mexico City have nothing to do with climate change, but come from geography, size, and bad decision making.

Trying to make it a climate change story only draws attention away from the need to make local changes to address the water situation. It also won’t convince anybody of anything. People who already believe in climate change don’t need any convincing. Those who don’t are never going to be convinced by this article. What’s the point?

It seems to me that too many urbanist writers today simply can’t resist trying to make every single thing some manifestation of climate change. In that regard, they simply link more and more policy areas to something which is politically gridlocked in the United States. So what people do when they make things about climate change is to implicitly state that they don’t actually want to do anything about it.

Many changes are eminently justifiable on their own merits. Bringing in climate changes only poisons the waters politically. And it’s a cop out. If you can’t make the case for, say, transit, without resorting to climate change, then your case is simply weak.

When it comes to things like Mexico City’s water, where there’s a real problem and some action should be taken, better to avoid talking about climate change if you actually want to get anything done.

Aaron M. Renn is a senior fellow at the Manhattan Institute, a contributing editor of City Journal, and an economic development columnist for Governing magazine. He focuses on ways to help America’s cities thrive in an ever more complex, competitive, globalized, and diverse twenty-first century. During Renn’s 15-year career in management and technology consulting, he was a partner at Accenture and held several technology strategy roles and directed multimillion-dollar global technology implementations. He has contributed to The Guardian, Forbes.com, and numerous other publications. Renn holds a B.S. from Indiana University, where he coauthored an early social-networking platform in 1991.

Photo: Fidel Gonzalez [CC BY-SA 3.0 or GFDL], via Wikimedia Commons


Canada’s Urban Areas: Descent from Affordability

$
0
0

Canada is a nation of wide open spaces, yet it has high urban area densities recently driven higher by a redefinition of urban area criteria (Note 1). Canada's largest urban area (population centre) is Toronto, with a population of 5.4 million continues to be the densest of the 59 with more than 50,000 residents. Toronto has a population of 3,028 per square kilometer (7,843 per square mile), approximately five percent above the European Union average. Montréal (population of 3.5 million) has a density of 2,720 per square kilometer (7,045 per square mile), followed by third ranked Vancouver (2,584/6,693), which has a population of 2.2 million.  The top ten is rounded out by Milton, a fast growing Toronto exurb with a density of 2,520 per square kilometer or 6.527 per square mile, Calgary (2,112/5,470), Regina, the capital of Saskatchewan (2,082/5,391) and Winnipeg, which has seen renewed recent growth (2,070/5,360).

Four other population centres have densities greater than 1,950 per square kilometer (5,000 per square mile , including  Oshawa and Hamilton, which are adjacent to Toronto, as well as Saskatoon, Saskatchewan and Kanata, an exurb of Ottawa (Figure 2).

Comparisons to the United States

The new, higher density figures are not surprising considering the especially compact suburbs in view when landing at Pearson Airport in Toronto, or even in Calgary or Edmonton. A combined Canada-US urban area density list illustrates the higher density of Canadian urban areas relative to those in the United States.  Among the five densest urban areas in Canada and the United States, four are in Canada. Los Angeles, the densest large urban area in the United States for the last three censuses, ranks third behind Toronto and Montréal. Vancouver and Milton rank fourth and fifth, just ahead of 6th ranked San Francisco. Immediately behind San Francisco is virtually all post-World War II suburban San Jose. Delano, California, an exurb of Bakersfield in the San Joaquin Valley has about 55,000 residents and ranks 8th on the combined list.

Residents of Calgary, Regina and Winnipeg, where densification advocates repeatedly condemn their perceived local urban sprawl (a pejorative term for urban dispersion) will doubtless be surprised to know that their population density exceeds that of New York. Only one more US urban area makes the top 20, Sacramento exurb Davis, at 14th, with a population of 73,000 (Figure 3).

Where's Portland?

To those inclined to venerate Portland's internationally famous densification policies, this list may be disconcerting. Calgarians who bemoan the inferiority of their city in relation to Portland should be heartened to find out that Calgary’s density is more than 50 percent higher than Portland's (Calgary’s transit market share is more than double Portland’s).

Portland is not among the densest 20 urban areas , but ranks 72nd, just behind all-suburban Riverside-San Bernardino and a bit ahead of Halifax. If Portland were in Canada, it would rank 38th in population density out of the largest 59 urban areas.

And Boston?

Boston has a reputation as one of the densest cities in the United States. Yet, Boston’s huge urban area  is denser than only three of Canada's urban areas on the list, Belleville, ON, North Bay, ON and Fredericton, NB. Each is smaller than Boston suburb Somerville, which has about 75,000 residents. Among the urban areas of  Canada and the US Boston is 218th in density. (Note 3).

Urban Containment Not Density Associated with Unaffordability

Canada’s urban areas illustrate that density does not have to mean unaffordable housing. There has been some densification since 2000, but Canada’s urban areas were nearly as dense even then. For example, in the last 15 years, the completely developed city of Toronto, with all its new residential towers, has added only 10 percent to its population. Five of Canada’s six major metropolitan areas Toronto, Montréal, Ottawa-Gatineau, Calgary and Edmonton were affordable at the beginning of the new century, hovering around a median multiple 3.0.

All that has changed, however, with the imposition of urban growth boundaries and equivalent policies. Ailin He and I showed in a Frontier Centre study (Canada’s Middle Income Housing Affordability Crisis) that house prices had “exploded” relative to household incomes between 2000 and 2015. This cannot be attributed to the modestly higher densities. The big change took place in land use policy, with, for example, Toronto and Calgary adopting urban containment policy that has been strongly associated with the destruction of housing affordability. Residents of Vancouver  --- an urban area widely praised among planners ---  have been paying the price for urban containment for much longer (Figure 4).

Canada’s experience up to the end of the 20th century proves that dense and affordable urban areas can be achieved. But since that time, as house prices have risen relative to incomes, Canada’s experience shows that all that can be reversed in an environment of binding urban containment policy.

Note 1: Between 2011 and 2016, Canada's urban areas increased more than 40 percent in population density, according to Statistics Canada data. This, however, was not a miracle of urban containment policy or smart growth, it was rather an improved method adopted by Statistics Canada for measuring urbanization. Urban areas are the "physical city," which unlike the metropolitan area has only urban land. Canada now calls its urban areas "population centres," having changed to the new label in 2011, when the United Kingdom labeled them "built up urban areas."

In 2011 and before, the Census had used municipalities as building blocks for urban areas. Often, those municipalities included large swaths of rural land (as did Los Angeles until well into the 1950s). Now, the building blocks for urban areas in Canada are "blocks", the lowest enumeration geography of the Census (the same revision was implemented by the US Census in 2000). Under the old definition, Canada's urban areas had a density of 1,180 per square kilometer (3,057 per square mile) in 2011. Now it is 1,698 per square kilometer (4,397 per square mile), a 44 percent increase.

Note 2: The comparisons are between the 2016 Census of Canada data and the 2010 US Census data, since urban area (population centre) data is only developed in the censuses (the next US census will be in 2020). The list is developed from the 59 urban areas in Canada and the 499 in the United States with 50,000-plus residents in the last censuses.

Note 3:  A recent article found Boston to be almost five times as dense as Houston. However, this was in municipal (inside the city limits) density. City limits are artificial, political constructs that have nothing to with the organic city (the physical city , also called urban area or the economic city, or the metropolitan area , which is the labor market).  The Houston urban area, with its reputation for "sprawl" is actually one-third denser (1150/2979 ) than Boston's (856 /2,278). At the physical city level, the urban area is the best indication of urban density. Using metropolitan density as an indicator of urban density is nonsensical, since all metropolitan areas include substantial rural territory.

Wendell Cox is principal of Demographia, an international public policy and demographics firm. He is a Senior Fellow of the Center for Opportunity Urbanism (US), Senior Fellow for Housing Affordability and Municipal Policy for the Frontier Centre for Public Policy (Canada), and a member of the Board of Advisors of the Center for Demographics and Policy at Chapman University (California). He is co-author of the "Demographia International Housing Affordability Survey" and author of "Demographia World Urban Areas" and "War on the Dream: How Anti-Sprawl Policy Threatens the Quality of Life." He was appointed to three terms on the Los Angeles County Transportation Commission, where he served with the leading city and county leadership as the only non-elected member. He served as a visiting professor at the Conservatoire National des Arts et Metiers, a national university in Paris.

Photo: Suburban density in Toronto (Markham) by IDuke - English Wikipedia, CC BY-SA 2.5

Common Sense on Immigration

$
0
0

No issue divides the United States more than immigration. Many Americans are resentful of the estimated 11 million undocumented immigrants, worry about their own job security, and fear the arrival of more refugees from Islamic countries could pose the greatest terrorist threat. At the other end of the spectrum are those who believe the welcoming words on the Statue of Liberty represent a national value that supersedes traditional norms of citizenship and national culture.

What has been largely missing has been a sharp focus on the purpose of immigration. In the past, immigration was critical in meeting the demographic and economic needs of a rapidly growing nation. Simply put, the country required lots of bodies to develop its vast expanses of land and natural resources and to work in its factories.    

The need for foreign workers remains important, but the conditions have changed. No longer a largely rural, empty country, more than 80 percent of Americans cluster in urban and suburban areas. Many routine jobs have been automated; factories, farms and offices function more efficiently with smaller workforces. Since at least 2000, notes demographer Nicholas Eberstadt, the “Great American Escalator” has stopped working.

These changes suggest the need to rethink national immigration policies. In a country where wages for the poorest workers have been dropping for decades and incomes have stagnated for the middle class, allowing large numbers of even poorer people into the country seems more burden than balm. They often work hard, but largely in low-income service jobs and in the low end of the health care field. In California, home to an estimated 2.7 million largely Latino undocumented immigrants, approximately three in four Latino non-citizens struggle to make ends meet, as do about half of naturalized Latino citizens, according to a recent United Way study.

Overall, our current immigrants, legal and illegal, have not advanced as quickly as in previous generations. This, along with the crisis in much of Middle America, should be our primary national concern. This doesn’t necessarily translate to mass deportations or even severe cutbacks in legal immigration, as some, including Attorney General Jeff Sessions and several congressional Republicans, have said. But it certainly does suggest taking a fresh look at how we view immigration.    

Learning From Abroad

So, what kind of immigration is best for America?

Models to consider are those that put premiums on marketable skills and language proficiency rather than family reunification. The Canadian and Australian systems, as President Trump correctly noted, are more attuned to their own national needs, compared with the U.S approach, which emphasizes family re-unification. Canadian authorities allow some 60 to 70 percent of their immigrants to come for economic purposes, notes Carter Labor Secretary Ray Marshall, supporting their system mainly by “filling vacancies that are measured and demonstrated in the Canadian economy.”    

Such a needs-based program would be a better, and fairer, way of addressing skills shortages than the odious H-IB program, which allows temporary indentured tech workers to replace American citizens. Instead, talented newcomers would be welcomed as future citizens and given the right to negotiate their own labor rates and conditions.

This emphasis on admitting immigrants with needed skills leaves Canadians and Australians with generally more positive views about immigration than Americans. Australia is one of only three countries in the world where children of migrants do better at school than children of non-migrants. Canadian support for immigration is particularly high in Toronto, which has been transformed from a sleepy Anglo enclave to a vibrant, diverse global capital.

But such hospitality is not limitless. A former Canadian immigration judge told me recently, in a tone of alarm, that his country’s invitation to 25,000 Syrian refugees could incubate the same sort of disorder that we see across Europe. There, in many heavily immigrant communities, poverty and isolation has persisted, sometimes for generations.    

I doubt many Americans would want to see the kind of social unrest we see across once peaceful places like Sweden, where women now complain of being perpetually harassed, even as supposedly feminist politicians look the other way. In France, Muslims make up about 7.5 percent of the French population compared to 1 percent in the U.S., but France has been ravaged by Islamic terrorism, Muslim-fueled anti-Semitism, and a widening cultural gap between the immigrants and the indigenous French population. In France and many other European countries, we see the rise of nativist politicians that make Donald Trump seem like Mother Theresa.

Citizenship and National Culture

The United States could be headed to a similar devolution. America’s ideals may be universal, but our political community has always been based on U.S. citizenship. You should not have to be an Anglo to admire the Founders, or to embrace the importance of the Constitution. Yet it’s now fashionable among some progressive activists to reject established American political traditions, which constitute a fundamental reason people have come here for the last two centuries.

Yet the “open borders” lobby on the progressive left increasingly demeans the very idea of citizenship. In some cases, they see immigration as way to achieve their desired end of “white America.” Some advocates for the undocumented, such as Jorge Bonilla of Univision, assert that America is “our county, not theirs” referring to Trump supporters. Others, like New York Mayor Bill di Blasio, refuse to differentiate between legal and illegal immigrants.

As usual, California leads the lunacy. Gov. Jerry Brown, who famously laid out a “welcome” sign to Mexican illegal and legal immigrants, has also given them drivers’ licenses and provides financial aid for college, even while cutting aid for middle-class residents. Some Sacramento lawmakers are pressing to give undocumented immigrants’ access to state health insurance. Senate President Pro Tem Kevin de Leon recently boasted, “Half of my family would be eligible for deportation under the executive order, because they got a false Social Security card, they got a false identification.”

The “open borders” ideology has reached its apotheosis in “sanctuary” cities which extend legal protection from deportation to criminal aliens, including those who have committed felonies. Donald Trump opportunistically emphasized this absurd and inappropriate situation—sometimes invoking the names of murdered Americans—during his 2016 campaign. The only mystery is why it would surprise the chattering class that many voters responded to his message.

Most Americans are more practical about immigration than politicians in either party. The vast majority of us, including Republicans, oppose massive deportations of undocumented individuals with no serious criminal record. Limiting Muslim immigration appeals to barely half of Americans. Only a minority favor Trump’s famous “big beautiful wall” on the Mexico-U.S. border.

Yet even in California, three-quarters of the population, according to a recent U.C.-Berkeley survey, oppose “sanctuary cities.” Overall, more Americans favor less immigration than more. According to a recent Pew study, most also generally approve tougher border controls and increased deportations. They also want newcomers to come legally and learn English, notes Gallup. This is not just an Anglo issue. In Texas, by some accounts roughly one-third of all Latino voters supported Trump.

Sadly, immigration as an issue has been totally politicized. Obama deported far more undocumented aliens than his Republican predecessor, or any previous president, for that matter, without inciting mass hysteria. To be sure, Republicans face severe challenges with new generations that are more heavily Latino and Asian and generally more positive about immigration. The undocumented account for roughly one in five Mexicans and upwards of half of those from Central American countries, meaning that overly brutal approaches to their residency would be eventual political suicide for Republicans in many key states, including Arizona, Florida, Nevada, Colorado and even Georgia.

Any new immigration policy has to be widely acceptable -- both where immigrants are common as well as those generally less diverse areas where opposition to immigration is strongest. Unlike many issues, immigration cannot be devolved to local areas to accommodate differing cultural climates; it is, and will remain, a federal issue. A policy that melds a skills-based orientation, compassion, strong border enforcement, expulsion of criminals, and forcing the undocumented to the back of the citizenship line seems eminently fair.

Economic Growth: The Secret Sauce of Immigration Policy

Strong, broad-based economic growth remains the key to making immigration work. A weak economy, unemployment, population density, or sudden uncontrolled surges in migration, notes a recent Economic Policy Institute, drives most anti-immigration sentiment. The labor-backed think tank suggests it would be far better to bring in migrants with skills that are in short supply and avoid temporary workers, such as H-1B visa holders, who are paid lower wages, undercutting the employment prospects for Americans.

Given the demands of competition and changes in technology, it seems foolish to allow many additional lower-skilled people enter our country. This is not elitism: Industry needs machinists, carpenters and nurses as well as computer programmers and biomedical engineers. What we don’t need to do is flood the bottom of the labor market. Again, this reality is race-neutral. Economist George Borjas suggests that the influx of low-skilled, poorly educated immigrants has reduced wages for our indigenous poor, particularly African-Americans, but also for the recent waves of immigrants, including Mexican Americans, over the past three decades.

Like most high-income countries, America’s fertility rate is below that needed to replace the current generation. This constitutes one rationale for continued legal immigration. But our demographic shortcomings are also entwined with lack of economic opportunity, crippling student debt, and the high cost of family-friendly housing stock. In other words, one reason Millennials are putting off having children is because they can’t afford them.

Overall immigration is a net benefit, if the economic conditions are right. An overly broad cutback in immigration would deprive the country of the labor of millions of hard-working people, many of whom are highly entrepreneurial. The foreign-born, notes the Kaufmann Foundation, are also twice as likely to start a business as native-born Americans. It’s always been thus—and these aren’t just small, ethnic, family-owned restaurants we’re talking about. More than 40 percent of Fortune 500 companies were founded by immigrants or their offspring.    

American immigration has succeeded in the past largely due to economic expansion. The historical lesson is clear: a growing economy, more wealth and opportunity, as well as a sensible policy, are the true prerequisites for the successful integration of newcomers into our society.

Joel Kotkin is executive editor of NewGeography.com. He is the Roger Hobbs Distinguished Fellow in Urban Studies at Chapman University and executive director of the Houston-based Center for Opportunity Urbanism. His newest book, The Human City: Urbanism for the rest of us, was published in April by Agate. He is also author of The New Class ConflictThe City: A Global History, and The Next Hundred Million: America in 2050. He lives in Orange County, CA.

Photo: Jonathan McIntosh

Fractions within the Working Class

$
0
0

This has been a rough year.  After the election, I reposted a few articles on my Facebook wall, as did so many of my friends, about the “working-class vote.”  Did the white working-class just elect Trump?  I didn’t think so, but I also understood that the world can look very different to a working-class person than it does to a middle-class one.  I knew this because I grew up poor, and it is a constant struggle speaking to both sides of my life, my past and my present, my mother and my colleagues.  My mother, let me point out, did not vote for Trump.  She thinks he’s a jackass.  Two of her sisters did, however.  I don’t know anyone else in my extended family who voted for him.  There were lots of Bernie supporters, not many Clinton supporters, and a whole bunch of abstainers.

A friend of mine from college, someone raised on the less wealthy spectrum of the educated middle class, took issue with even the idea of the “working class.” What was this really?  He knew a lot of blue-collar workers, plumbers, builders, who made a lot more money than he or his mother ever did.  I gave him the quick sociological explanations — it’s about power, not money, but his question remained with me.  Based on power at work, two-thirds of Americans can be classified as “working class” (see Michael Zweig’s excellent The Working-Class Majority).  That is a hell of a lot of people.  They don’t all think alike.  It struck me that sociologists, myself included, have spent untold ink arguing over the distinctions within the middle class (lower-middle, upper-middle, professional-managerial, those with economic capital vs. those with cultural capital, etc.) and where the line is between wherever this middle is and the top, and yet we have spent hardly any time  looking within the largest class of them all.

So, I pulled out the General Social Survey (GSS), which has been asking thousands of Americans every year or so all about their lives, political identifications, and voting patterns. I decided to see if there were differences within the working class based on type of working-class job, and not on education, race or  income level.  Working-class jobs are those with little autonomy and often involving the use of one’s body – to wield a hammer, carry a baby, deliver a package from Amazon, stand all day greeting customers.  These jobs are held by a very diverse group of people; there are more people of color in the working class than in the middle or upper class.  When I refer to “the working class,” I mean this whole diverse group, not only white male workers.

Let me give you a snapshot of five fractions of the working class: the Builders, the Makers, the Movers, the Clerks, and those who Serve (I call this category “CookCleanCare” to remind myself of the range of work within this fraction).  Builders most fit the stereotype of “the working class” (three-quarters are men, most are white, and many of them do wear hard hats at work), but it is only one fraction.  A more diverse lot are Makers, including assembly-line workers, tool-and-die makers, sewers, and cabinetmakers.  This is the fraction that has seen the largest influx of women in the past few decades, although still mostly male.  Movers include a wide array of transport jobs, from UPS drivers to ambulance drivers to long-haul truckers, also mostly men.  Most of those in the other two fractions are female. The CookCleanCare group includes those who prepare our food, clean our messes, and care for our children.  The Clerks are our growing retail worker category.  Back in the day being a clerk was seen as a move up, but today’s clerks are generally poorly paid and even less likely to hold a college degree than CookCleanCare workers (the most educated fraction).

Here are some other interesting differences between the fractions.  Builders are the most likely to be living in the same place where they grew up, Makers the least likely.  Movers are the most likely to identify themselves as “working class.”  Twice as many Builders as Makers think of themselves as “middle class.”  Makers, in contrast, are more likely than the others to think of themselves as “lower class.”  In terms of income, Builders make the most money, Movers the least.   If we looked only at white men in each of the fractions, we would find the most instances of sexism, nativism, and racism among the Makers, perhaps reflecting the fact that this group has seen the biggest changes over the past few decades.  But it is important to note that a greater proportion of rich white men and white male managers express racist views than any working-class fraction does.

During the past decade or two, ever since Reagan really, we have been hearing a lot about how “the working class” has turned its back on the Democratic Party.   But this is only true if we limit “the working class” to white men without college degrees.  If we include the whole of the working class, this claim is simply wrong.  According to my analysis of GSS data, there has never been a presidential election in which the majority of the working class voted for the Republican candidate.

If we look at the working class based on broad occupational categories rather than race or education, we get a very different picture from “the working class” that political pundits have been talking about.  We don’t yet have GSS data for the 2016 election, but figures from 2012 suggest the value of analyzing working-class voters based on their jobs rather than income or education.

This graph of voting patterns in the 2012 Presidential Election, arrayed by largest supporters of Obama from left to right, shows that while all occupational groups gave Obama a majority, two working-class fractions were at the polar ends of the spectrum. The Professional-Managerial Class fell near the middle. 

Organizing the data by job categories also helps us understand that white working-class men don’t vote as a unified bloc. If we look only at white men, Obama’s lead lessens, with Romney winning slight majorities with Makers, Movers, and Clerks (not to mention lots of PMC support).  Why were white male Movers, Makers, and Clerks swayed by Romney while white male Builders and CookCleanCare were not?  For one thing, the Democratic Party may have forgotten Movers and Makers.  Women and people of color in these fractions may find other aspects of the Democratic party compelling, but white males less so.  All five fractions took an economic hit during the Recession and, unlike the PMC, none of them have recovered, as you can see from the chart below.  Makers even saw their wages decline before the recession hit.

This points to the second problem with the “working class voting against their class interests” narrative.  Neoliberalism has clearly not been working for many working-class people.  The outrageous vote for Trump may be less an appreciation of his qualities or a heeled response to his dog-whistles and more a giant “Fuck You!” to the establishment.  If we don’t figure out a way to provide security and prosperity for all, we might just get neither for any of us.

Class is a complicated construct.  Each fraction includes millions of workers, living in different parts of America, with different pasts, different futures, different understandings of how the world works. One way to gain deeper insight into the working class is to consider how major fractions within the working class respond to political appeals.  A call for massive infrastructure building, for example, is more likely to resonate with Builders, while a threat to cut the Department of Education may worry CookCleanCare members most.  It is also true that the nature of work changes, sometimes rapidly, as has been the case for many Makers and Clerks.  We owe the working class the respect of paying attention to which fractions are being mowed down on the front lines of neoliberalism.  It doesn’t seem like either major party has been doing a good job of this lately.

This piece first appeared at Working Class Perspectives.

Allison L. Hurst is an Associate Professor of Sociology at Oregon State University and the author of two books on the experiences and identity reformations of working-class college students, The Burden of Academic Success: Loyalists, Renegades, and Double Agents (2010) and College and the Working Class (2012).  She was one of the founders of the Association of Working-Class Academics, an organization composed of college faculty and staff who were the first in their families to graduate from college, for which she also served as president from 2008 to 2014. She is Chairperson of the Working-Class Academics Section of the Working-Class Studies Association.

Taxpayers Need Protection from Dallas-Houston High Speed Rail Bailout? New Report

$
0
0

The proposed privately financed high-speed rail line from Houston to Dallas is projected to have a revenue shortfall of $21.5 billion in its first 40 years of operation. This is the conclusion of a Reason Foundation report by Baruch Feigenbaum, the Foundation’s assistant director of transportation policy (Texas High Speed Rail: Caution Ahead). This and other concerns lead the Reason Foundation to indicate: “… we cannot support Texas Central’s proposed Dallas to Houston project.” This is an important development, since the Reason Foundation has been a strong supporter of privately financed transport infrastructure for decades.

“Optimism Bias and Demand Exaggeration”

Feigenbaum explains: “Our analysis indicates that Texas Central is exhibiting the same ‘optimism bias; and ‘demand exaggeration’ that have plagued many public infrastructure projects —and especially high-speed rail projects—for decades around the world Simply put, Texas Central has exaggerated its ridership projections while underestimating costs.” Feigenbaum adds: “…private sector involvement is not a panacea. A wildly unsuccessful project is not going to become feasible with private financing.”

To any who follow infrastructure finance, these are familiar terms. The sorry record of major infrastructure forecasts has been documented by Oxford University professor Bent Flyvbjerg, along with Nils Bruzelius (a Swedish transport consultant) and Werner Rottenberg (University of Karlsruhe and former president of the prestigious World Conference on Transport Research). They reviewed 80 years of infrastructure projects and found initial cost estimates to routinely be low and demand (ridership) to have been routinely over-estimated (Megaprojects and Risk: An Anatomy of Ambition). They found passenger rail project cost overruns to be among the worst, averaging 45 percent. They also found ridership projections to be two-thirds too high in two-thirds of cases.

Reason Foundation and State DOT Estimates

The Reason Foundation report suggests that the Texas project might perform even more poorly. Feigenbaum estimates that the Dallas to Houston line would carry 1.4 million passengers by 2035. He also cites a Texas Department of Transportation analysis estimating annual riders at between 0.7 and 2.7 million trips, by 2035. The Texas Central estimates a considerably higher five million riders by 2025, 10 years earlier.

But the difficulties do not stop there. The costs of construction projected by the Texas Central Railway, at a maximum of $12 billion, may be significantly underestimated. Feigenbaum conservatively estimates costs that are nearly 50 percent higher ($17.8 billion) and suggest that the cost could exceed $20 billion. This is similar to a State Department of Transportation estimate of $18.7 billion, according to the report.

Either of these eventualities, both of which are fairly routine for such projects, would mean that the Texas Central Railway might not have enough money to operate the service, or even to finish construction, unless bailed out. Of course, it is hard to find investors for failed projects, and there would be strong political pressure for government grants and subsidies.

The California Boondoggle

California’s high speed rail project, well into the planning stage and about to lay some track, has already exceeded the Oxford research cost overruns with a vengeance. By 2012, construction costs had risen more than 60 percent compared to those publicized to obtain voter approval of bonds for the project in 2008. Worse, that’s after officials scaled back the system from high speed rail to a conventional blend between conventional (commuter rail) and high speed rail.

As if that were not enough, the first short segment, already under construction, according to a federal report   could have a cost overrun of up to $3.5 billion. The segment is approximately two-thirds the Dallas to Houston route length and is similarly flat, in the largely agricultural San Joaquin Valley. The Wall Street Journal referred specifically to the California high speed rail project in a recent editorial characterizing Sacramento as “America’s western swamp.”

The International Experience

Out of all of the high speed rail lines built in the world, only  two have avoided commercial losses (“broken even”) until recently (Tokyo to Osaka and Paris to Lyon). Both had very low construction costs, which made it possible to repay , unlike the highly escalated costs that have developed in subsequent projects. These have depended on taxpayer subsidies for their survival.

More recently, the Shanghai to Beijing high speed line became profitable, though its superlatives are well beyond replication by any other project (at least of any planet discovered so far). The line is slightly shorter than the distance between New York and Atlanta, but directly serves a market larger than the population of the European Union (more than 520 million residents) and 60 percent more than the United States. The stations on the exclusively high speed rail line itself serve municipalities with more than 160 million people, more people than live in Japan and 2.5 times as many as residents as in France. Another 360 million residents are served by trains that directly access the Shanghai to Beijing line from outside the corridor for part of their journey.

Whence the Bailout?

Feigenbaum suggests the likely source of a bailout for the Dallas to Houston high speed rail line: “While Texas Central may not be intending to take any public funding, we believe that if construction starts, the project will inevitably have to be bailed out by the taxpayers of Texas, which is unacceptable” (our emphasis).

He also notes that the Texas Central Railway plans to seek Railroad Rehabilitation and Improvement Financing (RRIF) program loan from the US Department of Transportation (USDOT). These below market rate loans are guaranteed by federal taxpayers. Of course, taxpayers already know how this works. Just a few years ago, Solyndra defaulted on a $0.5 billion federal loan, leaving taxpayers to “holding the bag.”

A genuine privately funded project would raise sufficient funds from private investors and from non-subsidized commercial financing sources. It would also attract ridership large enough to produce sufficient to pay the loans and repay the investors. The Reason Foundation and the Texas Department of Transportation findings suggest otherwise

All of this is disappointing to Feigenbaum, and also to me. After years of warning of taxpayer risks from such projects (Note ), I had hoped this one would be a genuinely commercial project, as this article from more than four years ago indicates (see: “Texas High Speed Rail: On the Right Track). It looks like it’s too good to be true.

Making it Work?

However, there may be a way to deliver the Texas Central project, while removing all potential taxpayer risk. According to the Dallas Business Journal Texas Central officials indicated that the Central Japan Railway would be the “primary investor”. There is also a report that Japan’s Government Pension Investment Fund may invest in US infrastructure, including the Texas high speed rail project. These organizations are more than financially capable of ensuring that there is no taxpayer risk.

The Japanese know high speed rail. They are likely to invest only if they are confident they can recover their money, with a commercial profit. Moreover, any such investment needs to include financial guarantees that ensure there is no potential for either US or Texas taxpayers to be called upon for subsidies to cover cost overruns, operations or anything else. Any other approach could be foolhardy.

Note: These publications include authoring or co-authoring a number of taxpayer risk reports on proposed high-speed rail lines, such as on Florida high-speed rail proposals between the 1990s and 2010s, the Xpress West Victorville to Las Vegas high-speed rail line, the first and second diligence reports on the California high-speed rail line, and a greenhouse gas emissions analysis of the California high-speed rail line. Sponsors included the Reason Foundation, the Howard Jarvis Taxpayers Association, Citizens Against Government Waste and the James Madison Institute.

Wendell Cox is principal of Demographia, an international public policy and demographics firm. He is a Senior Fellow of the Center for Opportunity Urbanism (US), Senior Fellow for Housing Affordability and Municipal Policy for the Frontier Centre for Public Policy (Canada), and a member of the Board of Advisors of the Center for Demographics and Policy at Chapman University (California). He is co-author of the "Demographia International Housing Affordability Survey" and author of "Demographia World Urban Areas" and "War on the Dream: How Anti-Sprawl Policy Threatens the Quality of Life." He was appointed to three terms on the Los Angeles County Transportation Commission, where he served with the leading city and county leadership as the only non-elected member. He served as a visiting professor at the Conservatoire National des Arts et Metiers, a national university in Paris.

Photograph: Texas flag

Small Colleges and Small Towns Working Together for Their Futures

$
0
0

My latest column in the March 2017 issue of Governing magazine is about how small liberal arts schools are partnering to try to help the small towns where they are located succeed. In this they are imitating big cities, where major institutions have often played a key role in driving revitalization efforts, often in part out of self-interest. Here’s an excerpt:

Many of the efforts these colleges are undertaking are still in their early days. But there’s a good chance that they will have staying power. Colleges’ increasing interest in the communities they anchor is not just a matter of civic altruism. In many cases, the schools face increasing pressures of their own. Between 2009 and 2014, according to The Wall Street Journal, 43 percent of the 300 small-town colleges it analyzed suffered declining enrollments. The squeeze has been particularly acute for schools with weak endowments. In 2015, Sweet Briar College in rural Virginia made headlines when it announced plans to close, though this was later rescinded after a public outcry and a number of new donations (and lawsuits).

These small liberal arts schools tend to have very high tuition rates, though because of student financial aid the actual price paid is often well below the posted rate. But with student loan debt levels through the roof and the media filled with anecdotal reports of graduates with large debts and no jobs, prospective students are looking harder than ever at the price-value ratio. Still, for prospective students who value the intimacy of small colleges and communities, small towns have a lot to offer.

Click through to read the whole thing.

Aaron M. Renn is a senior fellow at the Manhattan Institute, a contributing editor of City Journal, and an economic development columnist for Governing magazine. He focuses on ways to help America’s cities thrive in an ever more complex, competitive, globalized, and diverse twenty-first century. During Renn’s 15-year career in management and technology consulting, he was a partner at Accenture and held several technology strategy roles and directed multimillion-dollar global technology implementations. He has contributed to The Guardian, Forbes.com, and numerous other publications. Renn holds a B.S. from Indiana University, where he coauthored an early social-networking platform in 1991.

Photo: TravisNygard [CC BY-SA 3.0], via Wikimedia Commons

The Cities Creating the Most Tech Jobs in 2017

$
0
0

A growing tech industry is often considered the ultimate sign of a healthy local economy. By that measure, the Bay Area still stands at the top of the heap in the United States, but our survey of the metropolitan areas with the strongest tech job growth turns up some surprising places not usually thought of as tech meccas.

Charlotte, N.C., is more often associated with banks than bots. Yet from 2006 to 2016, tech businesses in the Queen City expanded their job count by 62%, with 18% growth from 2014-16, the fastest clip in the nation. Meanwhile, over the past decade, the metro area logged a 23% increase in the number of workers in STEM occupations (science, technology, engineering and mathematics-related jobs). This rapid job growth and strong recent momentum, driven partly by health care and environmental technology, ranks it second on our list. In the past 10 years, the region has added 7,400 jobs in two key high-tech business services sectors, custom programming and systems design services, along with nearly 700% growth in software publishing employment. To be sure, the share of tech jobs in Charlotte’s economy remains one third that of Silicon Valley, and the tech and STEM workforces are far smaller, but quality of life, lower housing prices, as well as decent plane connections, seem likely to help it to continue to attract tech workers.

To determine the metro areas that are generating the most tech jobs, Mark Schill of Praxis Strategy Group analyzed employment data from the nation’s 53 largest metropolitan statistical areas from 2006 to 2016, with extra weighting for growth from 2014-16 to give credit for current momentum. Half our ranking is based on employment growth at companies in high-technology industries, such as software and engineering services. (This includes all workers at these companies, some of whom, like janitors or receptionists, do not perform tech functions). Half is based on changes in the number of workers classified as having science, technology, engineering and mathematics-related jobs (aka STEM). This captures the many tech workers in industries not primarily associated with technology, such as finance and business services. Data is sourced from EMSI.

Another surprising up and comer is Indianapolis in fifth place. The share of STEM jobs in the local economy, 5%, is close to the national average but STEM employment is up 18% since 2006. Tech employment has grown rapidly, with the job count at tech companies up an impressive 68% since 2006, led by 1,700% growth at Internet-based businesses and 8,100 new jobs in custom programming and systems design.

California-based companies are in the forefront such as Salesforce, which is adding 800 employees to its already 1,600-person office in Indianapolis. Similarly No. 7 Nashville is poaching jobs from the Bay Area with firms such as Lyft but also developing its own roster of defense and health-related tech firms. Since 2006, Nashville added jobs in nearly every tech industry we track, led by 3,700 new jobs in systems design, 1,800 in data processing, and 1,100 in engineering services.

The Bay Area continues to excel in large part as a product of the rapid growth over the past decade of social media and business applications for technology. The San Francisco metro area, which includes tech-heavy suburban San Mateo County, ranks first. The City by the Bay and its environs, a hub for technical service firms like Uber and Salesforce.com, has experienced remarkable 90% growth in tech employment and a 36.5% expansion in STEM jobs from 2006 to 2016. Silicon Valley, with a concentration of tech industry workers 75% higher than upstart San Francisco, has also achieved rapid job creation, with tech industry employment up 80% and the number STEM workers increasing 32%, ranking it fourth. STEM employment per capita is roughly twice that of San Francisco.

Other familiar faces make the top 10: No. 3 Austin, No. 6 Raleigh-Durham, No. 8 Seattle and No. 10 Denver. These lower-cost alternatives to the Bay Area have all been attracting people and companies from pricier California. Yet these areas too face rising housing prices, which is a challenge particularly for workers entering their early 30s and looking to settle down.

Easily the biggest surprise on the list is Detroit, which improved its position to ninth, a remarkable 30-place jump from the last edition of this list in 2015. It generated 26% growth in high-tech jobs and boosted its STEM employment by 8.4%. Despite the decline of the central city, the Detroit metro area has never faded as a technical center; due largely to the auto industry its per capita STEM employment has long been above the national average. This is reflected in a post-recession boom in engineering services in the region – some 14,000 new jobs since 2006 – leaving Detroit with a concentration of engineering services more than three times the national average. Its percentage of STEM workers is 50% above the U.S. norm, roughly equivalent to that of Raleigh-Durham, Boston and Denver.

More help could be on the way from a reviving urban core, says Chicago-based analyst Pete Saunders, himself a Detroit native. There is some evidence that the city itself is beginning to attract skilled and better educated workers. Microsoft has set up an outpost downtown for 165 employees and there is a small but evolving start-up scene.

Winners, Losers and Stagnaters

Detroit’s rise since our last study tells us something about the importance of industry to tech and the allure of lower housing prices. Another clear Rust Belt winner in this year’s survey is Pittsburgh. Still an energy and industrial center, and with low housing prices, the former steel capital jumped 10 places on our list to 21st. Pittsburgh has gained tech momentum as a center for autonomous vehicles, with Uber and Ford setting up operations there to tap talent at Carnegie Mellon. Like other upstart regions, Pittsburgh has seen a rise in high-tech business services, with 2,400 new jobs in engineering and 3,900 in systems design.

Rochester, N.Y., is up 13 places to 36th, and Washington, D.C., gained 12 spots to 38th, while No. 41 Milwaukee and No. 25 New York both rose 10 places. New York’s improvement is tied to social media and a surge in biotech research and development. The region saw nearly 400% growth in employment at internet and web-based firms, but was not as competitive in many other tech sectors in our analysis. This plays to the city’s communications industry strengths, as well as Wall Street-connected fintech growth. While the metro area has by far the nation’s largest number of STEM workers at 450,500, in part by virtue of its massive population, New York is certainly not likely to emerge as a Silicon Valley competitor --the number of STEM jobs per capita in the New York metro area remains below the national average.

Many traditional tech powerhouses have just held onto their positions, with little movement up or down. No. 16 Portland and No. 18 Boston held their own. So too, despite the excitement around Snapchat’s IPO, did Los Angeles at 37th. Its per capita STEM employment has now disturbingly dropped below the national average.

And then there are the big losers, which include some traditional tech powerhouses. Despite its powerful medical and chip technology industry, San Diego dropped sixteen places to 39th. Houston dropped the most, some 39 places to 43rd, due to the energy bust. Yet it’s too early to count either of these places out in the long run since they both retain larger than average shares of STEM workers. A Trump defense boom could help jumpstart San Diego and Houston’s energy industry could be a prime beneficiary of the President’s “America first” energy policy.

Future Prospects

In the immediate future, no place will challenge the Bay Area as the mecca of technology and STEM employment. Other metro areas may now be growing as fast -- and Charlotte even faster -- but the Bay Area juggernaut has a big lead, even if it may finally be slowing down. James Doti, who directs the regional forecast at Chapman University, estimates that the job growth rate in the Valley’s information technology sector dropped to 2% in 2015 from a torrid 9% the previous year.

Doti and other observers trace this in large part to the area’s soaring housing costs, now the highest in the nation. This particularly impacts millennials, many of whom are now entering their 30s, the prime age for family formation and home buying. If millennials continue their current rate of savings, notes one study, it would take them 28 years to save up enough to afford a median-priced house in the San Francisco area, but only five years in Charlotte, or three years in Atlanta.

In 2015 7,500 more Americans left the Valley than arrived, the first time there’s been a net loss since 2011, according to the Silicon Valley Competitiveness and Innovation Project.

If these trends represent the future, there could be an increasing exodus of jobs and talent from the Valley. In many of the upstart regions, there likely will be opportunities for economic migrants in the robustly growing (if less “sexy”) tech services sector, which includes engineering, systems design and custom programming.

The big question is who will be the biggest beneficiaries, already established tech hubs like Seattle or Denver, or a long list of rising wannabes?

In a word, as Sherlock Holmes would say, “the game’s afoot.” The future of regional economies around the nation could be at stake.


2017 Metropolitan Tech-STEM Growth Index
RankRegion (MSA)Score2006-2016 Tech Industry Growth2014-2016 Tech Industry Growth2016 Tech Industry LQ2006-2016 STEM Occuptn Growth2014-2016 STEM Occuptn Growth2016 STEM Occuptn LQ
1San Francisco98.790.0%17.5%2.8736.5%9.9%1.79
2Charlotte, NC88.762.1%18.0%0.9128.5%10.4%1.01
3Austin86.276.6%14.0%1.9335.4%7.4%1.76
4San Jose85.979.6%12.5%5.1232.2%8.6%3.43
5Indianapolis72.468.1%16.8%0.9617.8%5.3%0.98
6Raleigh, NC70.346.9%8.2%2.0731.9%7.0%1.56
7Nashville65.775.6%12.4%0.7113.7%4.5%0.80
8Seattle62.747.7%6.9%2.3228.5%4.7%1.89
9Detroit61.626.1%14.8%2.129.6%8.4%1.50
10Denver60.840.3%6.9%1.7225.6%5.5%1.48
11Salt Lake City, UT60.238.9%6.5%1.4124.5%6.0%1.19
12Dallas59.743.2%9.3%1.1320.5%5.0%1.17
13Phoenix59.548.5%12.2%0.9310.1%5.8%1.16
14Grand Rapids58.834.0%8.9%0.4613.4%7.9%0.88
15Kansas City, MO57.137.5%9.8%1.4815.7%5.5%1.16
16Portland, OR53.430.4%7.4%1.0716.2%5.5%1.36
17Tampa52.420.9%10.6%0.943.8%8.3%0.90
18Boston, MA50.538.4%6.6%2.2115.3%3.8%1.55
19Louisville, KY50.427.6%8.3%0.5715.0%4.3%0.69
20Atlanta47.623.7%7.7%1.2311.8%4.6%1.13
21Pittsburgh, PA46.932.5%7.8%1.1512.8%2.8%1.06
22San Antonio46.128.2%1.5%0.8222.2%3.4%0.83
23Orlando45.98.5%7.4%0.898.4%6.8%0.78
24Cincinnati, OH43.521.9%6.6%0.819.3%4.1%1.04
25New York43.330.4%7.7%0.985.9%3.4%0.89
26Miami41.98.9%8.4%0.622.3%6.0%0.63
27Sacramento40.941.0%7.5%0.903.8%1.7%1.26
28Baltimore39.725.1%4.2%1.5212.5%2.1%1.38
29Minneapolis39.418.2%4.7%1.049.3%3.4%1.29
30Richmond, VA38.020.3%6.2%0.784.8%3.1%0.98
31Jacksonville, FL37.923.1%3.1%0.807.3%3.5%0.76
32Chicago, IL37.522.6%6.8%0.923.7%2.5%0.93
33Las Vegas37.26.6%5.6%0.531.5%5.6%0.47
34Hartford36.734.7%4.3%1.003.2%2.1%1.14
35Columbus, OH36.59.9%2.9%1.0511.9%3.1%1.18
36Rochester, NY35.127.1%5.1%0.761.1%2.5%1.10
37Los Angeles34.016.4%6.6%0.840.2%2.7%0.93
38Washington, DC32.44.8%3.8%2.546.7%2.7%1.99
39San Diego31.219.1%-2.2%1.6210.0%2.6%1.38
40Cleveland29.014.1%3.3%0.731.4%1.8%0.97
41Milwaukee28.72.9%4.6%0.771.0%2.5%1.02
42Oklahoma City, OK28.67.1%3.9%0.528.4%0.0%0.96
43Houston28.418.5%-2.3%1.0920.0%-1.8%1.22
44St. Louis, MO27.22.8%4.5%0.860.0%2.0%0.96
45Buffalo27.122.9%1.0%0.772.4%0.7%0.79
46Memphis, TN26.330.8%-5.8%0.393.6%2.6%0.59
47Providence25.08.0%2.5%0.720.4%1.2%0.88
48Philadelphia, PA22.22.5%1.7%1.09-1.8%1.5%1.06
49Virginia Beach18.8-3.0%-1.7%1.032.2%1.0%1.09
50Birmingham18.41.4%2.0%0.62-4.2%0.4%0.81
51Riverside16.5-15.4%0.8%0.30-4.6%2.2%0.48
52New Orleans16.021.6%-1.9%0.62-0.8%-2.3%0.67
53Tucson, AZ15.96.0%-1.9%86.8%-2.5%0.01.1

To determine the metro areas that are generating the most tech jobs, Mark Schill of Praxis Strategy Group analyzed employment data from the nation’s 53 largest metropolitan statistical areas from 2006 to 2016, with extra weighting for growth from 2014-16 to give credit for current momentum. Half our ranking is based on employment growth at companies in high-technology industries, such as software and engineering services. (This includes all workers at these companies, some of whom, like janitors or receptionists, do not perform tech functions). Half is based on changes in the number of workers classified as having science, technology, engineering and mathematics-related jobs (aka STEM). This captures the many tech workers in industries not primarily associated with technology, such as finance and business services. Data is sourced from EMSI.

This piece originally appeared at Forbes.

Joel Kotkin is executive editor of NewGeography.com. He is the Roger Hobbs Distinguished Fellow in Urban Studies at Chapman University and executive director of the Houston-based Center for Opportunity Urbanism. His newest book, The Human City: Urbanism for the rest of us, was published in April by Agate. He is also author of The New Class ConflictThe City: A Global History, and The Next Hundred Million: America in 2050. He lives in Orange County, CA.

Mark Schill is a community and corporate strategy consultant with Praxis Strategy Group and Managing Editor of New Geography.

Charlotte photo by Daritto7117 (Own work) [Public domain], via Wikimedia Commons

Big Box Jesus

$
0
0

One of my cousins recently attended an event at a suburban church and I tagged along. I’m amoral and omnivorous. I’ll go to any house of worship on the odd chance I might actually learn something useful – and I often do. And I meet a lot of really nice people along the way. But mostly I like to explore the landscapes other people inhabit. Church provides an intimate glimpse into what people are thinking and feeling in a particular location.

I was immediately impressed with how much this church looked and functioned like a shopping mall. The size, shape, and general construction of the buildings and surrounding parking lots were indistinguishable from a large retail center. I spent more time than I probably should have trying to figure out which denomination it was. Catholic? Definitely not. Lutheran? Not exactly. Baptist? Meh. Mormon? Nope. It was a generic all inclusive Christian arrangement that celebrated the lack of any specific affiliation. Come and worship. We take all kinds. And enjoy the ample free parking and food court while you’re here. There was a well populated Christian school, a substantial auditorium, and all manner of programs and facilities. It was a highly successful suburban version of Big Box Jesus.

The event my cousin was attending wasn’t strictly religious in nature. It was more of a collection of speakers who each preached a version of financial independence with a Christian slant. The majority of the attendees were suburban women like my cousin looking to start or improve an independent business venture.

A borrower is a slave to his master. A thousand heads nodded. Always set aside 25% of everything you earn. The congregants listened intently. Start small and build up incrementally. There were biblical parables about prudence leading to abundance. Knowing smiles of agreement followed. There were some folksy stories about the misguided foolishness good people often stumble into. Laughs ensued from the audience. I liked these people.

But then I looked out at the parking lot. How many people paid cash for their cars? I explored the subdivisions all around the church. How many people bought their suburban homes with cash? How many people are capable of setting aside even a sliver of savings on a regular basis ever. How many people bought their clothes and shoes and had their hair done with a credit card that got rolled over into a big ball of vague but gradually mounting debt? How many people are approaching middle age and still paying off student loan debt?

I understand the dynamics of contemporary accounting. Carrying mortgage debt provides a substantial tax advantage. Using “other people’s money” at a low interest rate to invest in an asset that consistently rises in value is smart and frees up cash to be deployed in other more productive ways. Putting cash into savings is inefficient since it sits in a bank earning near zero interest these days. Stock values keep rising so investing in equities is a no brainer.

You can’t go around wearing thrift store clothes and sporting a bowl haircut and expect to be taken seriously in a professional business setting. You don’t want to drive around in an old clunker and put your family at risk when you could have the latest safety and reliability features of a newer car bought on credit. If you can buy that car with a home equity loan and get the tax deduction, all the better. Everything about respectable modern life is predicated on people spending a certain amount of money in a very specific way that is nearly impossible to achieve on a cash basis. And that set of arrangements is in direct conflict with the traditional virtues of frugality, saving, and self reliance. Big Box Jesus takes Visa, Mastercard, and American Express.

This particular suburb is still very much in the aggressive growth phase of development. Everything is shiny and new. Did the developers build this town on a cash basis? No. It’s built on an Everest of commercial debt. How many of the people at the church earn their living selling real estate, or cars, or brokering mortgages, or refinancing people’s obligations, or helping them manage their stock portfolios? How many people are critically dependent on other people buying their products or services on credit? One way or another… almost everyone.

Is the city paying as it goes for infrastructure with funds set aside for maintaining and replacing all the pipes, pumps, and pavement when they wear out? Are pensions fully funded? Will this development pattern generate enough taxable value as it ages to support and maintain all the critical public infrastructure of schools, police, and fire protection? I’ve spent a lot of time exploring the municipal finances of towns all over the country for years. They’re all functionally insolvent beyond a certain not-too-distant point.

What all these practices and institutions need – what they can’t function without – is constant growth based on ever more leverage and debt. This can’t go on forever. Sooner or later there’s going to have to be a day of reckoning when the whole house of cards comes down. If I were a religious man I’d start praying right about now. Instead, I actually do what the preachers say. Pay cash, live below your means, save for the future, and opt out of the situations that trap you in a dysfunctional living arrangement with no future.

John Sanphillippo lives in San Francisco and blogs about urbanism, adaptation, and resilience at granolashotgun.com. He's a member of the Congress for New Urbanism, films videos for faircompanies.com, and is a regular contributor to Strongtowns.org. He earns his living by buying, renovating, and renting undervalued properties in places that have good long term prospects. He is a graduate of Rutgers University.

All photos by Johnny Sanphillippo


Can Tech Oligarchs Thrive Under Trump?

$
0
0

With the first billionaire in the White House, Wall Street booming and, for the first time in almost a decade, very solid and broad based job growth, one would think America’s business elite would be beaming. But that’s not so because the country’s moguls are more divided than at any time in recent history.

This conflict stems largely from divergent interests among rival factions of the putative ruling class. Trump’s backers tend to have links with the “real” economy, that is, those people who make things, such as energy producers, domestic manufacturers, agribusiness, suburban home-builders, and aerospace firms. These interests are increasingly concentrated in parts of America Trump painted “red”—the South, the Midwest, the Great Plains, and Appalachia.

On the other side lies the “ascendant” ephemeral economy, based in such industries as media, entertainment, software, and social media, as well as their financial backers. These industries are less affected by environmental regulations than those in more tangible lines of business. They are also concentrated in the deep blue slivers along the coasts and in college towns, the very places where the progressive social and environmental agenda is most deeply entrenched.

Obama’s Legacy: A New Post-industrial ruling class

Barack Obama’s most “transformative” achievement was the consolidation of this potentially hegemonic, post-industrial ruling class. They reaped high returns from the Obama era embrace of ultra-low interest rates, nudging billions into risky tech ventures and speculative urban real estate. These increasingly oligopolistic interests  also benefited  from a Justice Department that eschewed anti-trust inquiries in such areas as smartphone operating systems, search, and social media, where the main players often control  80 and even 90 percent share globally. IT, telecommunications, and media now compose America’s most concentrated sector and is consolidating somewhat faster than older industries, such as manufacturing, property. and wholesale trade.

In the past, Democrats received some support from business, but the GOP ruled the corporate mainstream. As William Domhoff  illustrated in his classic study Fat Cats and Democrats, Democrats drew support from outsiders, some of them less than savory, in industries from energy,  real estate, and gambling (Trump himself was a long-time Democrat). They also drew on diverse industries. As recently as the Bill Clinton years, Bill White, a savvy oil and gas attorney from Houston, served as chairman of the Democratic Party. It is doubtful now that someone with that background, even with White’s prodigious skills, will again be allowed into the party’s inner sanctum.

Obama’s post-industrial corporate elite emerged in his first 2008 election, with Google, Microsoft, Time Warner, IBM, and General Electric (NBC) ranking among the largest business donors. During his time in office, companies like Google enjoyed unprecedented access to the White House: More than 250 people moved between jobs at Google or related firms, the federal government, and Democratic political campaigns.

In the process,  the technology and media oligarchies became core funders of the  Democratic Party. This could prove more important in the future, as six of the ten and eight of the top 15 richest people on the planet, according to Forbes, derive their fortunes from these businesses. And this could just be the beginning: All of the 12 richest entrepreneurs under 40 come from the tech industry.

Even Hillary Clinton, a far less appealing figure than Obama, garnered most of the big money from tech oligarchs and their employees. Open Secrets notes that among private firms the largest business donors to her campaign included tech media establishments, including Alphabet (Google’s parent company), Microsoft, Apple, Time Warner, and Comcast.

Trump’s victory shocked this cozy alliance, and placed them in opposition. Silicon Valley, along with its idiot aunt, Hollywood, are now the most likely business constituencies to go into hysterics over the most recent inane Trump tweet, with some CEOs active participants in the anti-Trump “resistance.” Those few in Silicon Valley who backed Trump, like Peter Thiel, are now subject to campaigns to drive them from prominent boards. Uber’s Travis Kalanick, himself a rather unpleasant character, has been forced by such pressure to remove himself from any association with the current White House.

Ideology here mixes with self-interest. Mark Zuckerberg, whose $50 billion net worth makes him easily the wealthiest American under 40, recently issued a pronunciamiento that places his company’s objective as far from Trumpian nationalism as possible. He wants to create “a global community” even though his industry has helped foster the most social isolation since people discovered caves. His vision of the future, notes Bloomberg’s Leonid Bershidsky, offers something of a “social dystopia” run by Facebook’s management, with terms of discussion powered by computer algorithms.  

It’s clear what won’t make the cut in Zuckerberg’s “community”: Facebook is  increasingly hostile to any dissenting opinions from the right. The traditional media now wholly or partially  owned by the “ephemeral” economy oligarchs—Jeff Bezos’s Washington Post, Microsoft’s MSNBC and Carlos Slim’s New York Times—have also joined the anti-Trump “resistance,” having just previously served as claques for Obama and Hillary Clinton. Newsrooms may always have tilted somewhat to the left, but today they seem about as objective as those in Putin’s Russia or, for that matter, Fox News.

Immigration may be the biggest hot button issue separating the oligarchs from a   White House that has fanned nativist flames. But for them, embracing immigration—most notably the odious HIB visa program—does not mean adhering to legal norms or American traditions. Instead, their immigration vision fits that of companies seeking indentured tech servants as well as a cheap and inexhaustible supply of undocumented cheap dog-walkers, toenail painters, and nannies.

For this constituency, neither Trump’s proposed infrastructure program nor his moves to deregulate the economy have much appeal. After all, the Bay Area oligarchs seem perfectly fine with California’s regulatory insanity, and the piteously poor condition of the state’s infrastructure. Who needs roads and bridges when you have the cloud?

Of course, not all the new ruling class can dismiss Trump so haughtily. Elon Musk, a Hillary supporter who still sits on the new president’s economic council, needs skilled tradespeople and reasonable regulation to build electric cars and rockets. He yearns to play a role in Trump’s “lunar gold rush.” Caught in the middle, Musk is trying to make nice even in the face of assaults sent to him from the “resistance.”

Trump’s Oligarchs: Old School and Middle Class Friendly

The Obama oligarchs, like establishmentarians everywhere, clearly missed what the Chicago sociologist Richard Longworth predicted two decades ago: that rapid globalization,   now known as Davos capitalism,  would cause a full scale “social crisis.” The middle and working classes, as the Guardian has correctly noted, have little reason to love “superstar” oligarchs who employ few of them and, according to a recent paper by the Bureau of Economic Research, are a primary reason for the growth of inequality.

Trump’s oligarchs, for their part, reflect interests that jibe more closely with those of many middle and working class families. Trump’s so called  “cabinet of billionaires”—their  net worth is estimated at $14 billion—rightly has elicited criticism from   the Guardian and Mother Jones, which predictably also labeled them a bit too pro-Russian. And to be sure, Wall Street’s hoary hand, notably the ubiquitous Goldman Sachs, has secured  top posts at both the Treasury and the head of the National Economic Council.

Nonetheless, these billionaires have embraced a president who trolls corporations sending jobs overseas and bullies foreign firms, like Softbank, into committing themselves to major employment in the states. Obama and his academic coterie might dismiss such behavior as unseemly, darkly nationalistic and even ahistorical, but there may well be political gold there.

Of course, self-interest is a guiding factor, something particularly evident in the energy industry. The Trump cabinet features Rex Tillerson, former CEO of Exxon Mobil, as its secretary of State,   Rick Perry, former governor of Texas, as Energy secretary, and Oklahoma’s former attorney general, Scott Pruitt, as director of the EPA. David Wolff, one of the Houston’s largest land owners, notes  the change of administration has sparked renewed optimism across the energy belt. “It is nice to have a president who doesn’t hate your major industry,” Wolff quips.    

Many manufacturers—at least those who build products  here—also have reason to celebrate the Trump ascension. A lot of firms felt threatened by the Democrats’ regulatory regime, which threatened to boost their energy and other costs. They also were the primary victims of globalist trading polices embraced by the grandees of both parties. The 79-year-old billionaire Wilbur Ross, the new Commerce secretary, made his fortune by buying and selling companies in such trade-impacted sectors as steel, textiles, and coal. Trade advisor Peter Navarro is well-known for pushing neo-protectionist and nationalist policies abhorred by the new oligarchs but popular in large parts of the country.

Interregnum or Change of Direction?

To the increasingly disconnected and increasingly concentrated blue state media, Ross and his ilk may epitomize an unhealthy attraction to “backward” sectors that need to be “disrupted” by the geniuses of Silicon Valley. Given their sense of historical inevitably, the tech oligarchs may feel that this shift is just a temporary halt in their drive, as notes Newsweek’s Michael Wolff,  to create “a more careful, regulated, and corrected world.”

Yet many more Americans—particularly blue collar Americans—may prefer the Trump approach. Manufacturing employs some 11 million workers compared to 2.7 million in information. Both have seen their share of jobs go down since 2004, but, suggests the Bureau of Labor Statistics, industrial jobs are likely to remain six times as numerous by 2024. Throw in the mining sector, which includes energy, and the difference is expected to be roughly 9.4 million jobs compared to 2.4 million in the information sector.

Ironically, the workforce in these industries is far more diverse than in those businesses run by the Obama oligarchs, who loudly champion the rainbow ideal but rarely in practice.   Silicon Valley  employs very few African-Americans or Hispanics; they make up barely 6 percent, for example, of Facebook’s workforce while overall leading tech firms employ barely 5 percent. In contrast,  according to 2015 data, 16.2 percent of manufacturing workers are Latinos and 9.7 percent are African-Americans. In mining, quarrying, and oil and gas extraction, Latinos make up 16.9 percent of the workforce and African-Americans 4.8 percent, while in agriculture, forestry, fishing, and hunting, nearly a quarter of the workforce—23.0 percent—is Latino and 2.7 percent African-American.

If Trump policies can unleash a boom in these industries, he may have more staying power than many in the chattering classes admit. At least the Trumpians offer the prospect of upward mobility, greater independence, and the pride of work. In contrast, Silicon Valley’s vision, notes Greg Ferenstein, who has researched the views of the post-industrial elite, suggests a world where a “greater share of economic wealth will be generated by a smaller slice of very talented or original people”—that is, the denizens of Silicon Valley. “Everyone else,” he continues, “will increasingly subsist on some combination of part-time entrepreneurial ‘gig work’ and government aid. “

One has to wonder whether the prospect of widespread downward mobility for all but the “best and brightest” will prove very attractive to the majority of Americans. In contrast, Trump’s outsized promises, however unrealistic, may retain surprisingly long-term appeal. 

Trump’s business cronies may be grizzled, and even reactionary. They still may well end up as anachronisms, the last devotes of a dying industrial, largely white, America. But the Trump interregnum could become a new dominant paradigm if the Obama oligarchs fail to develop a vision that allows a better future than the jobless, socially stagnant and politically correct one now on offer.
This piece first appeared in The Daily Beast.
Joel Kotkin is executive editor of NewGeography.com. He is the Roger Hobbs Distinguished Fellow in Urban Studies at Chapman University and executive director of the Houston-based Center for Opportunity Urbanism. His newest book, The Human City: Urbanism for the rest of us, was published in April by Agate. He is also author of The New Class ConflictThe City: A Global History, and The Next Hundred Million: America in 2050. He lives in Orange County, CA.
Photo: Gage SkidmoreCC License

Hollywood's Self-Inflicted Wounds

$
0
0

No industry is more identified with Southern California than entertainment. Yet, in the past, the industry’s appeal has lain in identifying with the always-changing values and mythos of American society. But, today, that connection is being undermined, not just by technology, but also by a seemingly self-conscious decision to sever the industry’s links with roughly half of the population.

This was painfully obvious during the Oscars — the penultimate event of the seemingly endless award season — when speaker after speaker decided to spend their moments of fame denouncing President Donald Trump. For all his personal failings, and often misguided policies, most Republicans and independents disapprove of the relentless Trump bashing in the media.

Hollywood’s decision to make itself part of the anti-Trump resistance would make for wonderful satire, if you could get it on film. Imagine feminist icon Emma Watson fighting for “women’s empowerment” while baring her breasts in Vanity Fair. Or a host of social justice warriors, like Meryl Streep, demanding justice for the dispossessed, then returning to their estates where these victims of Trumpism are not likely to be found outside the servants’ quarters.

The results also have a hard side: dismal ratings, down from a traditional viewership of 40 million to a mere 32 million, following a pattern that has seen it slide badly the last three years. Most Trump voters turned off the political speeches, notes one survey. But the Academy had other ways to show its contempt for its customers: None of the 10 largest grossing movies, notes USA Today’s Mitch Albom, got nominated for best picture, best actor or actress, or for supporting roles.

The everyman era

The preference of sophisticated opinion may be quintessential to Europe’s boutique film industry, but the blending of popular tastes with art has long propelled Hollywood’s historical success. This separation between audience and the Academy was not always the case. Films like “Gone with the Wind” (1939), “Around the World in 80 Days” (1956), “Ben-Hur” (1959), “The Sound of Music” (1965), “The Godfather” (1972), “Forest Gump” (1994) and “Titanic” (1997) all managed to be both blockbusters and best picture winners.

Hollywood, wrote author Leo Rosten in 1940, was “the very embodiment” of “magic success,” allowing a truck driver to dream of being a hero, or a small-town waitress “to compare herself to a movie queen.” Hollywood was Middle American to the core, which appealed not just to our own audiences, but also to those around the world.

In a political sense, Hollywood connected with Americans across the ideological spectrum. During the contentious 1930s, Hollywood could accommodate both the conservative myth of the loner — Gary Cooper and John Wayne — and also produce powerful dramas that touched on issues of class and inequality, such as “Our Daily Bread” (1934), “How Green Was My Valley” (1941) and “The Grapes of Wrath” (1940).

Some progressive-leaning films were written by people who were later “blacklisted” during the McCarthy era, a tragedy that deprived the industry of some of its greatest talents. The industry instead favored biblical epochs like “Quo Vadis” (1951) as well as innocuous comedies starring the likes of Doris Day.

“It was boy meets girl, lives happily ever after,” recalled former Los Angeles and Orange County Republican Congressman Bob Dornan, who grew up during this time. “There were clear-cut heroes and villains. Nazis torturing little old ladies, John Wayne landing on the beaches. … America was the bearer, the hope of the world.”

Read the entire piece at The Orange County Register.

Joel Kotkin is executive editor of NewGeography.com. He is the Roger Hobbs Distinguished Fellow in Urban Studies at Chapman University and executive director of the Houston-based Center for Opportunity Urbanism. His newest book, The Human City: Urbanism for the rest of us, was published in April by Agate. He is also author of The New Class ConflictThe City: A Global History, and The Next Hundred Million: America in 2050. He lives in Orange County, CA.

Photo: BDS2006 [CC BY-SA 3.0 or GFDL], via Wikimedia Commons 

Suburban and Urban Housing Cost Relationships

$
0
0

Perhaps this is old hat to you, but this came across as a bit of an epiphany to me earlier today.

I was listening to the local public radio station this morning and there was a segment about the Chicago regional housing market that was fairly interesting.  Real estate and personal finance expert Ilyce Glink talked about home buying in the Chicago regional market.  Like many other housing markets nationwide, Chicago took an incredible hit in 2008-09 via the Great Recession, and regionally, home prices have been slow to rise from the depths of the early parts of the 2010s.  There's some greater optimism that prices might be up throughout the area, even as the potential for higher mortgage rates increases, too. 

In describing the Chicago regional housing market, Glink described many things in our recent housing history that are familiar to a lot of people in metro Chicago, and in other metros as well -- depressed prices, numerous foreclosures, and a razor-thin inventory.  But she also alluded to the pre-Great Recession pattern that defined the region's housing market -- the continued movement outward of new home construction at the edges of the region -- and how that essentially stopped around 2009 and hasn't resumed since. 

That got me thinking.  YIMBYs, the "yes-in-my-backyard" group that's been pushing for relaxed housing regulation so that more housing units are built in cities to address affordable housing, have been effective in using the obscene housing prices and rents of cities to justify new city housing construction, despite my repeated objections.  My contention has usually been that prices rose so steeply in the hottest city neighborhoods because the demand was so high.  There was a newfound preference for city living, especially among young professionals.  However, there simply wasn't enough of Lincoln Park or Wicker Park for everyone that wanted in.  Furthermore, there are other neighborhoods, like South Shore, that have the same positive qualities (lakefront location, easy public transit, close to the Loop) that should make it appealing to those wanting to live in the city, but it was being bypassed.  My argument was that such neighborhoods might actually welcome investment.  The combination of these factors, I believed, led to the price and rent spikes in the hottest areas, and it could be resolved in part by city newcomers considering previously unconsidered parts of the city.

Here's the epiphany -- what if the lack of housing supply, at the regional level, has less to do with the lack of housing production within cities, and more to do with the lack of housing production at the metro area's margins?

Just before and well after the last recession, I worked for a city at our region's edge and it was a huge beneficiary of the pre-2007 housing free-for-all.  In fact, the city where I worked more than doubled its population between 1990 and 2010 on the strength of annexation and new housing construction, becoming one of the largest cities in Illinois.  In 2007, weaknesses in the housing market were becoming apparent; in 2008, the bottom fell out; in 2009 and 2010, people were wondering when the old normal would return, or if a new normal would set in.  I think it's fair to say the latter, since nothing approaching the pre-2007 boom has returned to the metro edges. 

This would require further study and analysis by someone far more qualified than me, but here's what I'm thinking.  Maybe, in a strange way, early urban pioneering was dependent on housing growth at the margins.  It could be affordable for those who chose to live there because it was one part of a housing market conveyor belt: first step a trendy but safety-optional urban apartment, second step a safer and quieter apartment or condo, third step a house in the suburbs.  The lack of edge housing construction disrupts that model, especially if there's a shift in housing preferences as well.

In other words, what's broken is not the ability of cities to accommodate new construction, but the edge-driven model we've had for the last 60-70 years. 

Don't get me wrong.  I don't see a return to our suburban-sprawl frenzy as a way to reduce prices and rents in cities.  But maybe it pays to examine the entirety of a regional housing market before designating a culprit.

Pete Saunders is a Detroit native who has worked as a public and private sector urban planner in the Chicago area for more than twenty years.  He is also the author of "The Corner Side Yard," an urban planning blog that focuses on the redevelopment and revitalization of Rust Belt cities.

An unfinished subdivision.  Source: joyyehle.com

Ten Things You Need to Know About Indianapolis City Culture

$
0
0

What makes one city different from another? Some of it is the geography, the economy, or the buildings. But a big chunk of it is culture.

Every city has its own culture. A journalist recently interviewed me about Indianapolis and asked about some of the things that make that city’s culture distinct. I’m reposting ten of my observations here. Keep in mind that many of these points are relative, not absolute. They are comparisons versus what I see in other cities.

1. Indianapolis has a very open social structure. Many cities have very insular cultures that are difficult to penetrate. The Midwest river cities like Cincinnati, Louisville, and St. Louis are like this. If you weren’t born there, in a sense you’re always something of an outsider. I’ve also heard reports of similar things about Cleveland, where people who come there have trouble making new friends and connections. The stereotype of some Southern cities is that who your daddy was, etc. matters a lot.

In Indy, outsiders can move to the city and rapidly make friends and contacts, and to get integrated into civic networks. Columbus, Ohio is similar I’m told. I speculate that these cities have a more open orientation because they are state capitals. They frequently have new players circulating in and out, and this opens up the social networks considerably.

A newcomer is likely to have a much better time of it in Indianapolis than most other Midwest cities.

2. The social life of Indianapolis happens in back yards. This was an observation made some time ago by local cultural commentator David Hoppe. It’s dead on. In a city like New York or Chicago, there’s a palpable sense of bustling street life. This is largely absent in Indianapolis. If you operate on the assumption that this is the One True Way cities should function, Indy looks bad. But in reality the history and even built environment of Indy simply created different forms of social life. Different doesn’t mean worse.

People in NYC have tiny apartments, so of course they want to be out and meet people out. People in Indy mostly have single family homes, and so people can gather inside and in back yards. This produces things like Sunday night dinners and porch parties. In my experience, this produces many more useful “collisions” than the merely physical ones you’re likely to have on the street in Chicago.

3. A bimodal distribution of quality. Indianapolis has a “barbell” shaped quality curve. There’s a lot of stuff that’s pretty bad, but some things that are truly excellent. So, for example, the design of the average street in Indianapolis is terrible, but Monument Circle is one of the world’s great urban spaces. This contrasts with say Columbus, Ohio, where the vast majority of things are solid but relatively few stand out as terrible or exceptional. Interestingly, Nassim Taleb recommends barbell strategies. This may be one reason why Indy has the best small city tech scene in the Midwest.

4. An excessive preference for the pragmatic. This is a common Midwest trait. Again, I’m writing a future magazine column about this and its downsides. But for now note that the Midwest tends to actively discourage ambitious undertakings and the pursuit of excellence. This can produce a stifling environment for people who want to dream big and care about doing things right. Indy is certainly far better than the rest of Indiana on this, but it’s still present.

Looking at Indy’s barbell quality distribution, it’s clear the community gives itself permission to do A+ level work in certain areas: sports hosting, Monument Circle, etc. But I’ve yet to crack the code on what the characteristics of these are that made them acceptable while so many others were not.

5. A weak sense of neighborhood identity. Cities like Chicago and Cincinnati are deeply steeped in a sense of neighborhood. They have strongly delineated, long-standing neighborhood areas people strongly feel themselves to be part of. Like Detroit, Indy has always been more about what side of town you live on than what neighborhood you live in. There were some exceptions to this, but the norm has been a weak sense of neighborhood identity. Unigov, where the city took in a lot of suburban and rural areas in a city-county merger, doubtlessly contributed to this, but I suspect it far predates that.

One reason some friends and I started the Naplab Indianapolis Neighborhood Map project was to start strengthening a sense of neighborhood identity.

6. Low cultural differentiation vs. the state. People who live in Indianapolis are Hoosiers and think of themselves that way. There’s historically been little sense of urban identity apart from the state. Chicago is like a different planet from Illinois. People in Chicago think of themselves as Chicagoans first, and Illinoisans secondarily if at all. By contrast, in Indy people are Hoosiers first, residents of the city second. It’s telling that there isn’t even a commonly used word to refer to residents of Indianapolis. Indianapolitans anyone?

Also, the city is mostly a draw from the rest of the state, so it has a very Hoosier feel. In Chicago, there’s a Midwest feel because it draws from a regional catchment area. In Dallas, you meet people from everywhere.

This is one the urban progressives would probably like to dispute, but they are a relatively small tribe in the city.

7. Low institutional differentiation vs. the state. As the only big city in the state, the city’s major institutions are frequently pressed into double duty as statewide ones. There’s an Indiana Historical Society but no Indianapolis Historical Society. (Is Indianapolis the biggest city in the country without its own historical society?) The major state economic development groups like TechPoint are basically Indianapolis organizations that serve a statewide audience.

People in the rest of the state people feel the state and major institutions give too much focus to Indy. But again, in many cases these are de facto Indianapolis institutions doing double duty for the state. In many (most?) states there would be separate organizations for the major urban region and for the state. In Indiana, that’s not the case. (I’m not familiar with how others states with one major city like Georgia and Minnesota are set up. Are they similar?)

8. A strong civic but weak political culture. Indianapolis is known for having three top notch mayors in a row: Richard Lugar, Bill Hudnut, and Stephen Goldsmith. But in general mayoral leadership and city government have not been the drivers of change. I don’t know how Lugar operated as I was not around. Goldsmith seemed to have a strong mayoral agenda (e.g., outsourcing). But others relied more on a broader civic grouping of people – business, foundations, etc. to get things done.

I suspect most cities would claim their civic sector is strong. Chicago likes to boast of its corporate involvement, for example. But it’s also clear that Chicago likes to get things done through a powerful mayor in City Hall. In Chicago, if the mayor says Yes to you, you are probably golden. In Indy, however, that’s not the case.

It’s hard to describe how this works because frankly it’s very opaque. Civic initiatives are largely cooked up in the back room behind the scenes. There seems to be a big focus on consensus. Disputes are generally not aired in public. And there’s a very “go along to get along” civic ethic.

This has had a lot of benefits. First, while it generally takes longer for Indy to decide to do something than other cities, once the decision is made to go forward, it almost always happens. You don’t see things like Louisville arguing for 40 years over whether and where to build a bridge (which only got built because Mitch Daniels stepped in). You don’t see repeated failures to pass a light rail program, like in Kansas City. When Indy decides to do something, it has a very high success rate. (A critic might say some of these things should have failed and that success at doing something you never should have done in the first place is a Pyrrhic victory).

Secondly, there is long term continuity in civic initiatives. Rarely do things die when mayors change. The sports hosting strategy has gone back over 30 years, for example. While the current mayor didn’t strongly support the transit initiative developed under his predecessor of a different party, he didn’t stand in its way either. Contrast with how a new mayor came into Cincinnati and tried to pull the plug on a streetcar project. Or at the state level Chris Christie in New Jersey taking office and cancelling a rail tunnel project.

The downside is a very enfeebled and low capacity city bureaucracy. Also, some changes need to come from the political sector in order to have democratic legitimacy. This makes the Indianapolis system bad at solving certain kinds of civic challenges. It should be no surprise that the mayor-driven (i.e., politically driven) system of suburban Carmel, Indiana was better able to redesign infrastructure, for example.

Another downside is that it’s an extremely difficult environment for a civic entrepreneur to try to get things done. That’s where cultural fit comes in. If you don’t know how to navigate an opaque civic structure, accumulate political capital in that environment, etc. then you are going to fail to accomplish anything. This tends to reward insiders vs. outsiders. Though because of point #1, outsiders can become insiders fairly easily in Indianapolis, if they know how to play the game. Due to the nature of the civic structure, playing the game is likely to involve significant dilution of their ideas and compromises many people might find unpalatable.

9. A strong preference for local hires. Indianapolis might be the biggest city in the country that’s basically never hired a global starchitect to design a major civic structure. Now there are many negative things one might say about the starchitect trend, but this is still revealing of the local culture. There’s a strong preference to hire locally in most places, but it’s very high in Indianapolis and often very clearly trumps quality. In fact, an out of towner with high flying ideas is exactly the kind of person who is going to be resented by a significant faction of the local power structure, and probably not be long for this world.

10. You need to a guide to find the good stuff. Similar to point #2, you’re not just going to stumble into some famous place randomly, like you can in many cities. It’s a city where you need a guide to point you at the good stuff. For example, PRINTtEXT at 52nd and College is one of the best magazine stores in the entire world. I’m not exaggerating. But you’d never find it unless you were looking for it. There are all sorts of great things and great people in Indy, but they take time to find and get to know. In some cities the greatness is on the surface. In Indy, it’s in layers you need to dig up over time.

Aaron M. Renn is a senior fellow at the Manhattan Institute, a contributing editor of City Journal, and an economic development columnist for Governing magazine. He focuses on ways to help America’s cities thrive in an ever more complex, competitive, globalized, and diverse twenty-first century. During Renn’s 15-year career in management and technology consulting, he was a partner at Accenture and held several technology strategy roles and directed multimillion-dollar global technology implementations. He has contributed to The Guardian, Forbes.com, and numerous other publications. Renn holds a B.S. from Indiana University, where he coauthored an early social-networking platform in 1991.

Top photo: Daniel Schwen, CC BY-SA 4.0

Second photo: Monument Circle. Photo Credit: alexeatswhales, CC BY 2.0

Fourth photo: Indianapolis hosting the Super Bowl. Image via Shutterstock.

Fifth photo: Image via PRINTtEXT Instagram

Flight from Urban Cores Accelerates: 2016 Census Metropolitan Area Estimates

$
0
0

The flight from the nation’s major metropolitan area core counties increased 60 percent between 2015 and 2016, according to just-released estimates from the US Census Bureau (Note). A total of 321,000 more residents left the core counties than moved in, up from 199,000 in 2015. This is ten times the decade’s smallest domestic migration loss of 32,000 for the same counties which occurred in 2012.

Suburban counties continued to attract net domestic migrants, at a somewhat higher rate than in recent years and much higher than in the early part of the decade. The suburban counties gained 235,000 domestic migrants in 2016, compared to 224,000 in 2014 and more than double the low point of 113,000 in 2011 (Figure 1).

The 60 percent rise in net domestic migration out of the core counties converts to a 0.4 percent annual loss relative to last year’s population. This loss is more than one-half the annual growth rate of only 0.7 percent. This is a substantial deterioration from the net domestic migration loss in 2012 of 0. 04 percent, which was only 1/25th of the 1.1 percent growth rate for the core counties.

At the same time, the suburbs had their best performance of the decade. Their minimum advantage was in 2012, when the suburbs attracted 150,000 new domestic migrations relative to the core counties (118,000 compared to negative 32,000). The 2016 advantage was 556,000 (235,000 compared to negati ve 321,000).

The suburbs outperformed core county domestic migration in 40 of the 50 major metropolitan cases. The ten exceptions include three with strong urban cores (San Francisco, Boston and Washington) and seven with very small urban cores, indicating that much of the central county population is post-war suburban (see: Growth Concentrated in Most Suburbanized Core Cities).

Overall Domestic Migration

The deterioration in core county domestic migration led to overall negative domestic migration for the major metropolitan areas in 2016, the first time this has happened this decade. Overall, the 53 major metropolitan areas had a net domestic migration loss of 64,000, down from 17,000 in 2015 and 98,000 in 2012. Since the 2010 census, the major metropolitan areas have gained 222,000 net domestic migrants. This represents an overall net domestic migration rate of 0.13 percent relative to their 2010 population.

The big, and perhaps surprising, news here is that the “second tier” of metropolitan areas   (between 500,000 and 1 million population) have begun to perform better than their larger counterparts, a result reminiscent of the last decade. These 53 metropolitan areas gained 97,000 net domestic migrants, topping the major metropolitan areas for the third year in a row (Figure 2). Since the 2010 census, second tier metropolitan areas have gained 334,000 domestic migrants. This is 0.92 percent of the 2010 census population, seven times the major metropolitan area figure of 0.13 percent.

Where People Are Moving To and Away From

As has become customary, the greatest rates of domestic migration among the major metropolitan areas are overwhelmingly in the South. Austin is again number one, gaining nearly 1.7 percent from domestic migration. Austin is followed by Tampa St. Petersburg, Raleigh and Jacksonville. Las Vegas is the only non-southern major metropolitan area among the top five in net domestic migration. The second five includes four southern metropolitan areas, Charlotte, Orlando and Nashville, ranking sixth through eighth and San Antonio ranking tenth. Phoenix placed ninth.

The bottom 10 are a relatively familiar group of metropolitan areas, with San Jose placing last and being alone in having more than one percent (1.1 percent) of its population move away between 2015 and 2016. San Jose was also last in net domestic migration in the decade of the 2000s, if hurricane ravaged New Orleans is excluded. The bottom five also includes New York, Chicago, Hartford and Milwaukee. Los Angeles had the sixth worst net domestic migration, followed by Rochester, Virginia Beach-Norfolk, Washington and Buffalo (Figure 3).

The net domestic migration leaders among the large metropolitan areas posted even stronger gains than Austin. All of the top five had greater net domestic migration rates, and all are in Florida. Leader Cape Coral added more than 2.5 percent to its population from domestic migration. Nearby Sarasota was near 2.5 percent in Daytona Beach was also over two percent. Melbourne and Lakeland were approximately 1.9 percent. The second five was led by Charleston, South Carolina, followed by Boise, Fayetteville AR-MO, Spokane and Provo, UT.

The largest domestic migration loss was in Honolulu, at 1.1 percent and slightly worse than San Jose (minus 1.08 percent compared to 1.06 percent in San Jose). Two of New York’s commuter rail exurbs ranked second and fourth worst, Bridgeport-Stamford and New Haven, while Syracuse ranked third. El Paso had the fifth worst net domestic migration. The second five worst in net domestic migration were Springfield, Massachusetts, Youngstown, Bakersfield, Oxnard and McAllen, Texas (Figure 4).

Population Rankings and Trends

Again, New York, Los Angeles, Chicago, Dallas-Fort Worth and Houston were the largest. They were followed by Washington (which passed Philadelphia last year), Philadelphia, Miami, Atlanta and Boston. There was no change in the rankings of the top 22 major metropolitan areas. Portland dropped two notches, from 23rd to 25th largest, as both Orlando and San Antonio jumped ahead. Austin jumped 2 positions, passing both Cleveland and Columbus, becoming the 31st largest metropolitan area. Finally, Raleigh passed Louisville to become the 43rd largest metropolitan area. The table at the end of the article includes information on the 106 largest metropolitan areas.

The population growth rates for both the major and second tier  metropolitan area leaders and trailers looks similar to the domestic migration rankings (Figures 5 and 6). Austin leads the majors and Cape Coral leads the large metropolitan areas. There are greater differences in the bottom ten, where some of the largest domestic migration losers (such as New York, Los Angeles and Chicago) attract strong international migration have been replaced by others that attract fewer, and tend to have lower population growth rates as a result.

More Major Metropolitan Areas?

Meanwhile, some metropolitan areas should soon pass the 1,000,000 mark. Honolulu has been at the top of the list for some time. If the annual growth rates from 2010 to 2013, 2014 or 2015 had been sustained, Honolulu would have reached a million by 2016. But, Honolulu’ growth rate has slowed substantially in each of the last years since 2012, culminating in a modest population loss in 2016, leaving Honolulu 7,000 short of a million. Current growth rates suggest that Tulsa and Fresno could get to a million before Honolulu.

Reason For Concern

While the domestic migration data has long since disproven any thesis of a general movement of people from the suburbs to the urban core, the escalation in core county domestic migration losses is cause for concern.

The urban cores are far nicer places than they were before. But their recovery has been all too concentrated ; meanwhile the rings around trendy downtown residential areas continue, as before the micro-core renaissance, to suffer serious poverty levels and other social ills more intensely than elsewhere. We have been down a similar road before, and have never recovered from the serious costs.

Note: Major metropolitan areas have more than 1,000,000 population. The domestic migration comparison between core and suburban counties is limited to 50 of the 53 metropolitan areas, because four have only one county (Las Vegas, San Diego and Tucson). The lowest geographical level at which domestic migration data is available is counties. The core counties are often so large that they include large suburban components. This makes for a more crude comparison than would be the case if more precise data were available.


Metropolitan Areas Over 500,000:  Population Estimates: 2016
Population (Millions)2015-2016
RankMetropolitan Area201020152016Population ChangeNet Domestic MigrationRank: Domestic Migration
1New York, NY-NJ-PA    19.566    20.118    20.154 0.18%-0.99%103
2Los Angeles, CA    12.829    13.269    13.310 0.31%-0.66%95
3Chicago, IL-IN-WI      9.462      9.533      9.513 -0.21%-0.94%101
4Dallas-Fort Worth, TX      6.426      7.090      7.233 2.02%0.85%25
5Houston, TX      5.920      6.647      6.772 1.88%0.42%38
6Washington, DC-VA-MD-WV      5.636      6.078      6.132 0.88%-0.51%91
7Philadelphia, PA-NJ-DE-MD      5.966      6.062      6.071 0.14%-0.43%84
8Miami, FL      5.566      6.002      6.066 1.08%-0.28%72
9Atlanta, GA      5.287      5.699      5.790 1.59%0.64%30
10Boston, MA-NH      4.553      4.767      4.794 0.58%-0.35%76
11San Francisco, CA      4.336      4.642      4.679 0.80%-0.26%69
12Phoenix, AZ      4.193      4.568      4.662 2.05%1.13%20
13Riverside-San Bernardino, CA      4.225      4.475      4.528 1.17%0.34%43
14Detroit,  MI      4.296      4.298      4.298 0.00%-0.47%86
15Seattle, WA      3.440      3.727      3.799 1.93%0.83%26
16Minneapolis-St. Paul, MN-WI      3.349      3.518      3.551 0.93%0.01%57
17San Diego, CA      3.095      3.290      3.318 0.84%-0.25%68
18Tampa-St. Petersburg, FL      2.784      2.971      3.032 2.06%1.57%7
19Denver, CO      2.544      2.809      2.853 1.58%0.72%28
20St. Louis,, MO-IL      2.788      2.808      2.807 -0.05%-0.41%83
21Baltimore, MD      2.711      2.794      2.799 0.18%-0.40%81
22Charlotte, NC-SC      2.217      2.425      2.474 2.05%1.31%13
23Orlando, FL      2.134        2.38      2.441 2.48%1.24%15
24San Antonio, TX      2.143        2.38      2.430 2.01%1.04%21
25Portland, OR-WA      2.226      2.385      2.425 1.68%1.01%22
26Pittsburgh, PA      2.356      2.351      2.342 -0.38%-0.33%73
27Sacramento, CA      2.149      2.268      2.296 1.27%0.54%34
28Cincinnati, OH-KY-IN      2.115      2.155      2.165 0.45%-0.06%61
29Las Vegas, NV      1.951      2.109      2.156 2.20%1.31%12
30Kansas City, MO-KS      2.009      2.084      2.105 0.96%0.32%44
31Austin, TX      1.716      1.998      2.056 2.92%1.67%6
32Cleveland, OH      2.077      2.060      2.056 -0.21%-0.49%89
33Columbus, OH      1.902      2.020      2.042 1.06%0.22%48
34Indianapolis. IN      1.888      1.987      2.004 0.89%0.13%51
35San Jose, CA      1.837      1.969      1.979 0.52%-1.06%105
36Nashville, TN      1.671      1.829      1.865 1.99%1.14%19
37Virginia Beach-Norfolk, VA-NC      1.677      1.723      1.727 0.20%-0.55%92
38Providence, RI-MA      1.601      1.613      1.615 0.13%-0.24%66
39Milwaukee,WI      1.556      1.574      1.572 -0.12%-0.72%98
40Jacksonville, FL      1.346      1.448      1.478 2.09%1.36%11
41Oklahoma City, OK      1.253      1.357      1.373 1.20%0.40%39
42Memphis, TN-MS-AR      1.325      1.342      1.343 0.07%-0.48%88
43Raleigh, NC      1.130      1.271      1.303 2.48%1.46%10
44Louisville, KY-IN      1.236      1.278      1.283 0.46%-0.01%58
45Richmond, VA      1.208      1.270      1.282 0.89%0.26%46
46New Orleans. LA      1.190      1.262      1.269 0.54%-0.07%62
47Hartford, CT      1.212      1.210      1.207 -0.26%-0.80%100
48Salt Lake City, UT      1.088      1.168      1.186 1.60%0.32%45
49Birmingham, AL      1.128      1.145      1.147 0.22%-0.05%60
50Buffalo, NY      1.136      1.135      1.133 -0.24%-0.51%90
51Rochester, NY      1.080      1.081      1.079 -0.22%-0.64%94
52Grand Rapids, MI      0.989      1.038      1.047 0.84%0.11%53
53Tucson, AZ      0.980      1.008      1.016 0.79%0.25%47
54Honolulu, HI      0.953      0.993      0.993 -0.06%-1.08%106
55Tulsa, OK      0.938      0.980      0.987 0.69%0.17%50
56Fresno, CA      0.930      0.972      0.980 0.80%-0.27%71
57Bridgeport-Stamford, CT      0.917      0.945      0.944 -0.05%-1.04%104
58Worcester, MA-CT      0.917      0.934      0.936 0.17%-0.39%79
59Omaha, NE-IA      0.865      0.914      0.924 1.08%0.12%52
60Albuquerque, NM      0.887      0.905      0.910 0.52%0.11%54
61Greenville, SC      0.824      0.873      0.885 1.34%0.88%24
62Bakersfield, CA      0.840      0.879      0.885 0.60%-0.48%87
63Albany, NY      0.871      0.881      0.882 0.12%-0.25%67
64Knoxville, TN      0.838      0.861      0.869 0.86%0.73%27
65New Haven CT      0.862      0.859      0.857 -0.26%-0.79%99
66McAllen, TX      0.775      0.839      0.850 1.25%-0.41%82
67Oxnard, CA      0.823      0.848      0.850 0.24%-0.44%85
68El Paso, TX      0.804      0.837      0.842 0.57%-0.69%97
69Allentown, PA-NJ      0.821      0.833      0.836 0.31%-0.08%63
70Baton Rouge, LA      0.803      0.830      0.835 0.65%0.03%56
71Columbia, SC      0.767      0.810      0.817 0.95%0.48%36
72Dayton, OH      0.799      0.800      0.801 0.11%-0.17%65
73Sarasota, FL      0.702      0.768      0.788 2.66%2.46%2
74Charleston, SC      0.665      0.745      0.761 2.22%1.54%8
75Greensboro, NC      0.724      0.752      0.756 0.58%0.17%49
76Little Rock, AR      0.700      0.732      0.735 0.42%-0.10%64
77Stockton, CA      0.685      0.723      0.734 1.41%0.57%32
78Cape Coral, FL      0.619      0.700      0.722 3.15%2.54%1
79Colorado Springs, CO      0.646      0.698      0.712 2.11%1.16%18
80Akron, OH      0.703      0.703      0.702 -0.16%-0.35%75
81Boise, ID      0.617      0.676      0.691 2.32%1.47%9
82Lakeland, FL      0.602      0.649      0.666 2.58%1.87%5
83Winston-Salem, NC      0.641      0.658      0.662 0.64%0.45%37
84Syracuse, NY      0.663      0.660      0.657 -0.53%-0.99%102
85Ogden, UT      0.597      0.642      0.654 1.88%0.69%29
86Madison, WI      0.605      0.641      0.649 1.30%0.49%35
87Wichita, KS      0.631      0.643      0.645 0.26%-0.35%74
88Daytona Beach, FL      0.590      0.623      0.638 2.29%2.24%3
89Des Moines, IA      0.570      0.623      0.635 1.95%0.95%23
90Springfield, MA      0.622      0.630      0.630 0.02%-0.67%96
91Toledo, OH      0.610      0.606      0.605 -0.06%-0.37%77
92Provo, UT      0.527      0.585      0.603 3.07%1.18%17
93Augusta, GA-SC      0.565      0.590      0.595 0.83%0.35%42
94Jackson, MS      0.568      0.579      0.579 0.10%-0.37%78
95Melbourne, FL      0.543      0.568      0.579 1.97%1.91%4
96Harrisburg, PA      0.549      0.565      0.568 0.52%-0.03%59
97Durham, NC      0.507      0.551      0.560 1.51%0.55%33
98Spokane, WA      0.528      0.547      0.557 1.69%1.23%16
99Scranton, PA      0.564      0.558      0.555 -0.45%-0.40%80
100Chattanooga, TN-GA      0.528      0.547      0.552 0.85%0.64%31
101Youngstown, OH-PA      0.566      0.549      0.545 -0.85%-0.59%93
102Modesto, CA      0.514      0.535      0.542 1.15%0.38%40
103Lancaster, PA      0.519      0.536      0.539 0.40%-0.26%70
104Portland, ME      0.514      0.527      0.530 0.54%0.37%41
105Fayetteville, AR-MO      0.463      0.513      0.525 2.26%1.28%14
106Santa Rosa, CA      0.484      0.501      0.503 0.32%0.06%55
From: US Census Bureau Data

Wendell Cox is principal of Demographia, an international public policy and demographics firm. He is a Senior Fellow of the Center for Opportunity Urbanism (US), Senior Fellow for Housing Affordability and Municipal Policy for the Frontier Centre for Public Policy (Canada), and a member of the Board of Advisors of the Center for Demographics and Policy at Chapman University (California). He is co-author of the "Demographia International Housing Affordability Survey" and author of "Demographia World Urban Areas" and "War on the Dream: How Anti-Sprawl Policy Threatens the Quality of Life." He was appointed to three terms on the Los Angeles County Transportation Commission, where he served with the leading city and county leadership as the only non-elected member. He served as a visiting professor at the Conservatoire National des Arts et Metiers, a national university in Paris.

Photo: Coral Gables Florida (MSA), largest domestic migration and population gain of any metropolitan area over 500,000 population, 2015-2016 (by author)

Viewing all 3790 articles
Browse latest View live


Latest Images