Quantcast
Channel: Newgeography.com - Economic, demographic, and political commentary about places
Viewing all 4167 articles
Browse latest View live

The High-Speed Rail Program Under Congressional Scrutiny

$
0
0

A combative and clearly agitated Transportation Secretary Ray LaHood defended the Administration’s high-speed rail program at a December 6 oversight hearing of the House Transportation and Infrastructure Committee to discuss congressional concerns with the program’s direction and focus. "We will not be dissuaded by the naysayers and the critics," LaHood said heatedly.

But he convinced few skeptical committee members who believe that the Administration has bungled the program by spreading the money too thinly all over the country and on projects that are not truly high-speed. Average speeds after the $10 billion worth of improvements, the Committee was told, will range from 60 to 70 mph. In Europe and Japan, high speed trains maintain average speeds of 150 mph and higher (average speed is considered a more accurate measure of performance and service quality than top speed for it reflects trip duration.) "The President’s vision of providing 80 percent of Americans with access to high-speed rail service is unnecessary and isn’t going to happen," said Railroads Subcommittee Chairman Bill Shuster (R-PA).

"We need one high-speed rail success, and our country‘s best opportunity to achieve high-speed rail is in the Northeast Corridor," Committee Chairman John Mica (R-FL) told the Secretary. This sentiment was echoed by a panel of experts who followed LaHood’s testimony. The panel consisted of Joan McDonald, N.Y. DOT Commissioner and Chairman of the NE Corridor Advisory Commission, Richard Geddes, associate professor at Cornell University, Ross Capon, President of the National Association of Railroad Passengers and NewsBriefs editor Ken Orski. "The Northeast is a compelling market for high-speed rail service," said McDonald. It is probably the only corridor that has all the attributes necessary for viable high-speed rail service, and where passenger trains do not have to share track — and thus are not slowed by— freight trains," added Orski. An abbreviated version of Ken Orski's testimony follows below. 

###

Let me state at the outset that I do not question the merits or the need for intercity passenger rail service. Railroads have been an integral part of the nation’s transportation system for a century and a half and they continue to play a vital role in the economy. Nor do I question the desirability of high-speed rail— a technology that I believe we ought to pursue in this country.
What I do question is the manner in which the Administration has gone about implementing its ten billion dollar rail initiative— or what the White House expansively calls "President Obama's bold vision for a national high-speed rail network."

Misleading Representations
The Administration’s first misstep, in my judgment, has been to misleadingly represent its program as "high-speed rail," thus, conjuring up an image of bullet trains cruising at 200 mph, just as they do in Western Europe and the Far East. It further raised false expectations by claiming that "within 25 years 80 percent of Americans will have access to high-speed rail." In reality the Administration’s high-speed rail program will do no such thing. A close examination of the grant announcements shows that, with one exception, the program consists of a collection of planning, engineering and construction grants that seek incremental improvements in the existing facilities of Class One freight railroads, in selected corridors used by Amtrak trains.

While some of the projects funded with HSR dollars may result in modest increases in speed, frequency and reliability of Amtrak services, none of the awards, except for the California grant, will lead to construction of new rail beds in dedicated rights-of-way. As any railroad operator will tell you, dedicated track reserved exclusively for passenger trains is essential to the operation of true high-speed rail service— such as the service offered by the French TGV, the German ICE and the Japanese Shinkansen trains, that run at top speeds of 200 miles per hour and higher.

Lately, the Administration has toned down its rhetoric. It no longer claims that high-speed rail is "just around the corner" (Sec. LaHood’s own words of some time ago) but rather that the HSR grants are "laying the foundation for high-speed rail corridors." But even that claim seems overblown. While track upgrades will allow Amtrak trains to reach top speeds of 110 mph in some cases, average speeds— which is a more accurate measure of performance and service quality, for it determines trip duration — will increase only moderately.

For example, while a $1.1 billion program of track upgrades between Chicago and St. Louis will enable Amtrak trains to increase top speeds to 110 mph, average speeds between those two cities —slowed by frequent stops and the need of Amtrak trains to share track with freight traffic — will rise only 10 miles per hour, from 53 to 63 mph. Travel time will be cut by 48 minutes, to 4 hours 32 minutes (Illinois DOT announcement, December 22, 2010)

In France, TGV trains between Paris and Lyon, cover approximately the same distance (290 miles) in a little under two hours, at an average speed of 150 mph. Yet, federal officials did not hesitate proclaiming the Chicago-St. Louis project as "historic" and hailing it as "one giant step closer to achieving high-speed passenger service."

Had the Administration candidly represented its HSR initiative for what it really is — an effort to introduce useful but modest enhancements in existing intercity Amtrak services— it would have earned some plaudits for its good intentions to improve train travel. But by pretending to have launched a "high-speed renaissance," when all evidence points to only small incremental improvements in speed and trip duration, the Administration, I believe, has suffered a serious loss of credibility. Its pledge to "bring high-speed rail to 80 percent of Americans" is not taken seriously any more.

Lack of a focus
The Administration’s second mistake, in my opinion, has been to fail to pursue its objective in a focused manner. Instead of identifying a corridor that would offer the best chance of successfully deploying the technology of high-speed rail, and concentrating resources on that project, the Administration has scattered nine billion dollars on 145 projects in 32 states, and in all regions of the country. (A complete list can be found here). Only a few of these awards (CA, IL, NC, WA, NEC) are of a sufficient scale to produce any appreciable service improvements. The remaining grants will support minor facility upgrades, preliminary engineering, and planning and environmental studies. Indeed, the program bears more resemblance to an attempt at revenue sharing than to a focused effort to pioneer a new transportation technology.

The Northeast Corridor
Ironically, the Northeast corridor, where high-speed rail has the best chance of succeeding, has received scant attention. And yet, this corridor is probably the only one in the nation that has all the attributes necessary for effective and economical high-speed rail service. It also is the only rail corridor in the nation where passenger trains do not have to share track — and thus are not slowed by— freight trains.

In sum, no other travel corridor in the nation offers better conditions for successful implementation of high-speed rail service, or a more compelling case for moving forward with an ambitious investment program.

To its credit, the Administration has belatedly recognized the deployment potential of the Northeast Corridor and tried to make up for its past neglect by awarding two major grants for track and catenary improvements in the Corridor. These grants are a small beginning in what will hopefully become a redirected HSR program, with a focus on the Northeast corridor. Its goal should be to raise average speeds between city pairs to 150 mph—the generally accepted standard for high-speed rail service.

The need to involve the private sector
In view of the constraints on the federal budget, any such program will of necessity require substantial participation of the private sector. The density of travel in the NE Corridor and its continued growth should, in principle, generate a sufficient stream of revenue to attract private capital and create opportunities for public-private partnerships.

However, this is still an untested hypothesis. We simply do not have enough experience with public-private partnerships in the passenger rail sector to make confident predictions about the response of the private investment community— its assessment of the risk, rewards and expected rate of return on investment in such an enterprise.

Thus, I believe that an early step in the process should focus on thoroughly exploring the potential of private financing and ascertaining the private investors’ interest in this venture— both domestically and internationally. This should include an examination of the lessons learned from the Channel Tunnel project — the largest rail infrastructure project in the world totally financed by the private sector.

###

While the Administration’s handling of the high-speed rail program has— understandably and justifiably— made Congress reluctant to support this initiative any further, I do hope that under the Committee’s leadership, and with the help of the NEC Advisory Commission, Amtrak and the several participating states, a reformulated high-speed rail initiative— focused on the NE Corridor and involving a public-private partnership— will soon begin taking shape.

One often hears these days that we, as a nation, have lost the will to think big— that we no longer have the ambition and imagination to mount "bold new endeavors" that capture the public imagination— the kind of motivation that caused our parents’ and grandparents’ generation to build the Hoover Dam, the Golden Gate Bridge and the Interstate Highway System. Launching a multi-year public-private venture to usher in true high-speed rail service in the Northeast Corridor, a project of truly national significance, offers us an opportunity to prove the skeptics wrong.

Ken Orski has worked professionally in the field of transportation for over 30 years.
 
Photo courtesy of BigStockPhoto.com

~~~~~~~~~~~~~~~~~~~~

Note: the NewsBriefs can also be accessed at www.infrastructureUSA.org

A listing of all recent NewsBriefs can be found at www.innobriefs.com

Let’s Level the Inter-generational Playing Field

$
0
0

With President Obama’s speech in Osawatomie, Kansas decrying the growing economic inequality and lack of upward mobility in America, the issue has finally arrived at the center of this year’s campaign debates. While most discussions of this growing inequality focus on the gap between America’s poorest and richest citizens, a recent report by the Pew Foundation highlights how the same economic trends over the last two and a half decades have also widened the wealth gap between the oldest and youngest Americans to the highest levels in history.

In a time of great political unrest and economic anxiety, this inter-generational wealth gap has the potential to throw gasoline on an already white hot fire. Only by understanding the sources of this increasing disparity can the country develop policies that will help to close the gap and create a fairer, less economically stratified society.

Drawing on data provided by the U.S. Census Bureau’s Survey of Income and Program Participation (SIPP), Pew documents the tectonic shifts that have occurred in households’ net worth based upon age between 1985 and 2009. During this time, the average net worth of households headed by those under 35 fell from $11,521 to just $3,662, a drop of 68%.  During the same period, the net wealth of households, as measured by adding up the value of all assets owned minus liabilities such as mortgages or credit card debt associated with those assets, headed by those over 65 increased by 42%, from $120,457 to $170,494 (all figures are expressed in 2010 dollars).

Of course younger households have always been less wealthy than older ones, since the heads of those households haven’t had a lifetime to acquire wealth. In 1984, this effect of age on household wealth meant that senior citizen households had, on average, ten times the wealth of those headed by people younger than 35. However, the enormous generational shift in household wealth that occurred in the intervening twenty-five years meant that, by 2009, the net worth of senior citizen households was 47 times greater than younger households. The resulting disparities in economic well-being are reflected in each generation’s perception of its own economic situation.  

Those Americans over 65 in 2009 are members of what generational historians call the Silent Generation. Only 25% of Silents expressed any dissatisfaction with their personal financial situation that year, a percentage that did not increase in the next two years of the Great Recession.

By contrast, 36% of people under 35 in 2009 – mostly members of the Millennial Generation – expressed dissatisfaction with their individual finances in 2009, a number that rose to 39% in 2011. But the biggest jump in dissatisfaction with personal finances between 2009 and 2011 occurred among the next older cohort, who are considered to be members of Generation X. In 2009, only 30% of Xers felt dissatisfied, a number that shot up to 42% in 2011.  Finally, 32% of the Baby Boom generation, born from 1946 to 1964 and approaching their retirement years in 2009, were dissatisfied with their personal financial situation, a number that rose only to 39% by 2011.

One of the reasons behind this disparity of financial and economic concern among generations lies with the different impact the nation’s housing market has had on each generation between 1985 and 2009.  The great housing price collapse that began in 2008 had little impact on Millennials, only 18% of whom currently own their own home. By comparison, 57% of Gen Xers own their own home. Three-fourths of them bought after 2000 when housing prices began to soar. As a result, about one in five members of Gen X now say their home mortgage is under water, with the balance owed greater than the value of the house. By comparison, only 13% of Boomers and a miniscule 4% of Silents, most of whom bought homes well before the crash, report having under water mortgages. In fact, if it weren’t for the overall rise in housing prices since 1984 that Silents were able to take advantage of, that generation’s net worth would have fallen by a third in the twenty-five years since, instead of rising by 42%. Clearly, to improve Gen X’s attitudes toward the economy and reduce the inter-generational wealth gap, something must be done to fix the nation’s housing market.

For older generations – Boomers facing retirement and Silents already enjoying their new life – housing is not an especially large concern. Retirement savings based on stock market valuations and/or interest rates and the certainty of pension payments are clearly a much bigger issue with these generations. Almost two-thirds of Boomers believe they may have to defer their retirement beyond 65 because of the decline in their savings and net worth, with about one in four now expecting to work until at least 70. While the stock market has almost fully recovered from the 2008 crash, for those counting on a more interest-oriented set of retirement payouts from bonds or CDs, years of rock bottom interest rates, designed by the Federal Reserve to stimulate the housing market and help the economy recover, have made these investments problematic at best. In some ways, economic policies that are designed to help Gen X with their housing challenges offer older generations scant comfort, and in certain instances actually exacerbate their concerns over their personal finances.

Millennials diminished sense of economic opportunity remains focused almost entirely on the job market. About two-thirds of Millennials are employed but only slightly half of those are working full-time. Almost two-thirds of Millennials without a job are looking for work. Unemployment among 16-24 year olds rose to 19.1% by the fourth quarter of 2009, a full eight points higher than in 2007 before the crash. For all other generations, unemployment has gone up on average by only 5 points during the same time period. It seems too obvious to be worth stating, but the best way to increase Millennials’ wealth is to create an economy where they can all find jobs.

Anxiety that the nation’s economy is only working for the wealthiest drives much of  the overall feeling of fear, uncertainty and doubt that pervades the nation’s political debate.  But an examination of household wealth suggests the remedy to this disease varies by generation.

Senior citizens turned out in record numbers in the 2010 election to decry the policies of the Obama administration, but it would appear from both the economic and attitudinal data that most of them are more interested in fighting to hang on to what they have or in resisting other societal changes than in expressing any dissatisfaction with their own personal financial situation. Boomers complain about what has happened to their plans for retirement, but it is hard to see how fixing entitlements by raising the retirement age, or cutting the overly generous pensions of public employees will do anything to impact their own retirement prospects directly. To really close the generational wealth gap, policies should be adopted which raise the economic well being of America’s two youngest generations, rather than focusing on those who are already relatively better off. 

To bring up the least wealthy of the nation’s households to levels closer to those more fortunate would require taking much more aggressive steps than Washington has so far been willing to consider.  This might require expanding the scope and size of government, something older generations especially are steadfastly resisting. This inter-generational debate over the nation’s “civic ethos,” driven by the differing economic circumstances of each generation, will be and ought to be the fundamental issue of the campaign – precisely where President Obama’s speech in Osawatomie, Kansas placed it.

Morley Winograd and Michael D. Hais are co-authors of the newly published Millennial Momentum: How a New Generation is Remaking America and Millennial Makeover: MySpace, YouTube, and the Future of American Politics and fellows of NDN and the New Policy Institute.

Heavy Metal Is Back: The Best Cities For Industrial Manufacturing

$
0
0

For a generation American manufacturing has been widely seen as a “declining sport.” Yet its demise has been largely overplayed.  Despite the many jobs this sector has lost in the past generation, manufacturing remains remarkably resilient, with a global market share similar to that of the 1970s.

More recently, the U.S. industrial base has been on a powerful upswing, with employment climbing steadily since 2009. Boosted by productivity gains and higher costs in competitors, including China, U.S. manufacturing exports have grown at their fastest rate since the late 1980s. In 2011 American manufacturing continued to expand, while Germany, Japan and Brazil all weakened in this vital sector.

To determine the best cities for manufacturing my colleague Mark Schill at Praxis Strategy Group measured the 51 largest regions in the country in terms of how they expanded their “heavy metal” sector — think automobiles, farm and energy equipment, aircraft, metal work and machine shops. We averaged absolute growth rate and momentum in 148 heavy metal manufacturing industries over ten-, five-, two-, and one-year time frames.

Our top ranked area, Houston, is one of only four regions that enjoyed net job growth in manufacturing in the past 10 years. This year its heavy manufacturing sector expanded by almost 5%. Houston’s industrial growth is no fluke; over the past year its overall job growth has been about the best among  all the nation’s major metros.

Houston’s industrial success owes much to the city’s massive port and booming energy sector, says Bill Gilmer, senior economist at the Federal Reserve office of Dallas. “Houston is about energy — it’s about fabricated metals and machinery,” he says. “It’s oil service supply and petrochemicals. It’s all paced by a high price of oil and new technology that makes it more accessible.”

This shift towards domestic energy augurs well for a huge and economically beneficial  shift in America’s  longer term economic prospects, he points out. Cheap natural gas, for example, makes petrochemical production in America more competitive than anyone could have imagined a decade ago. Linkages with Mexico in terms of energy as well as autos has made Texas — which is also home to No. 4 ranked San Antonio and No. 15 ranked Dallas — the nation’s primary export super-power, with current shipment 15% to 20% above pre-crisis levels.

The energy and industry connection also can be seen in No. 10 Oklahoma City, where heavy industry has been booming through much of the recession due to its strong fossil fuel industry. This synergy between energy and manufacturing could also spread to other regions, including many not associated with large fossil fuel deposits  New finds in the Utica shale in Ohio, for example, could be worth as much as  $500 billion; one energy executive called it “the biggest thing to hit Ohio since the plow.”

These gas finds may help ignite the heavy metal revival. As coal-fired plants become more expensive to operate due to concerns over greenhouse gas emissions, the region will have a new, cleaner and potentially less expensive power source.

Already the  boom in natural gas has sparked a considerable industrial rebound in parts of eastern Ohio including the building of a new $650 million steel plant for gas pipes in the Youngstown area.  Karen Wright, whose Ariel Corporation sells compressors used in gas plants, has added more than 300 positions in the past two years. “There’s a huge amount of drilling throughout the Midwest,” Wright says. “This is a game changer.”

But the industrial rebound is not only about energy. Another critical factor is rising  wages in East Asia, including China. Increasingly, American-based manufacturing is in a favored position as a lower-cost producer. Concerns over “knock offs” and lack of patent protection in China may also spark a growing “Made in the USA” trend.

The shift back to U.S. production may be a great sign for many regions. Our No. 3 ranked area, Seattle-Tacoma-Bellevue, is picking up heavy metal jobs associated with the aerospace industry. A growing focus on domestic production for Boeing’s new aircraft could bring even more prosperity to the high-flying region, which also ranked No. 1 on our recent technology industry growth ranking.

If new industrial growth is just another piece of good news in the Pacific Northwest, it’s manna from heaven to the long suffering industrial heartland heavily concentrated in the Great Lakes region, which includes much of Ohio, Michigan, Indiana, Illinois , Wisconsin and Minnesota.  Long reviled as the “rust belt” this area now leads in the industrial rebound with over 100,000 new manufacturing jobs in just the past year.

Particularly well positioned is No. 2 ranked Milwaukee, which is home to a wide array of specialized manufacturing firms ranging from machine tools to energy. Over the past year alone the region added almost 3900 heavy metal jobs and has consistently led other Great Lakes communities in job creation.

But Milwaukee is not the only rust belt rebound town. The greater Detroit area, No. 6 on our list, actually added the most heavy metal jobs — more than 12,000 — than any region of the country. The area’s ranking, however, was dragged down by its legacy; greater Detroit still has lost almost 130,000 positions in the past decade.

The heavy metal revival has a long way to go. And we cannot expect it to produce the same kinds of jobs produced in the last century. For example, the new jobs will be more highly skilled; even as the share of the workforce employed in manufacturing has dropped from 20% to roughly half that, high skilled jobs in industry have soared 37%, according to a New York fed study.

Regions seeking strong industrial growth will have to focus more and more on training more skilled workers. Even after years of declining employment and surplus numbers of graduates in the arts and law, manufacturers in heavy industry are running short on skilled workers. Industry expert David Cole predicts there could be demand for 100,000 new workers by 2013. According to Deloitte Touche, 83% of all manufacturers suffer a moderate or severe shortage of skilled production workers.

The resurgence of heavy metal should lead regions, and the federal government, to consider shifting their emphasis toward productive, skilled based training and away from a single-minded focus on the BA or graduate degree. Few regions suffer a shortage of art history or English graduates.   This more practical emphasis is particularly critical for the Midwest, which is home to four of the ten highest-ranked industrial engineering schools in the nation.

Even more important: training workers for the assembly lines of tomorrow. These jobs, notes Ariel’s Karen Wright, will require not BA degrees but high degrees of math and mechanical skills that can be apply to expanding companies like hers.

As we enter a new economic era, regions should look beyond the current obsession with “creative” and “information” industries. Instead, they should focus on a resurgent industrial economy — which then can provide a customer base for advertising, graphics and software companies — as a primary driver of economic growth.  Turn down those soulful   Adele tracks: Heavy metal is back.


The Top Regions for Heavy Metal
Manufacturing Job Growth


Score consists of 10, 5, 2, and 1 year job growth rate and job momentum and 2011 industry concentration. 

Rank MSA Name Score
1 Houston-Sugar Land-Baytown, TX 68.5
2 Milwaukee-Waukesha-West Allis, WI 65.6
3 Seattle-Tacoma-Bellevue, WA 64.7
4 San Antonio-New Braunfels, TX 60.7
5 Virginia Beach-Norfolk-Newport News, VA-NC 60.4
6 Detroit-Warren-Livonia, MI 58.2
7 Kansas City, MO-KS 56.3
8 Hartford-West Hartford-East Hartford, CT 56.1
9 Sacramento--Arden-Arcade--Roseville, CA 54.4
10 Oklahoma City, OK 53.3
11 Pittsburgh, PA 53.2
12 Salt Lake City, UT 52.6
13 Richmond, VA 52.0
14 Portland-Vancouver-Hillsboro, OR-WA 51.8
15 Dallas-Fort Worth-Arlington, TX 51.5
16 Cincinnati-Middletown, OH-KY-IN 51.3
17 Cleveland-Elyria-Mentor, OH 51.3
18 San Diego-Carlsbad-San Marcos, CA 50.5
19 Raleigh-Cary, NC 50.1
20 San Jose-Sunnyvale-Santa Clara, CA 48.7
21 Birmingham-Hoover, AL 48.0
22 Minneapolis-St. Paul-Bloomington, MN-WI 47.9
23 Atlanta-Sandy Springs-Marietta, GA 47.6
24 Louisville/Jefferson County, KY-IN 47.3
25 Austin-Round Rock-San Marcos, TX 47.2
26 St. Louis, MO-IL 46.8
27 Orlando-Kissimmee-Sanford, FL 46.7
28 Charlotte-Gastonia-Rock Hill, NC-SC 46.2
29 Denver-Aurora-Broomfield, CO 45.7
30 Boston-Cambridge-Quincy, MA-NH 44.9
31 Chicago-Joliet-Naperville, IL-IN-WI 44.6
32 Washington-Arlington-Alexandria, DC-VA-MD-WV 44.0
33 Memphis, TN-MS-AR 43.9
34 Tampa-St. Petersburg-Clearwater, FL 42.9
35 Indianapolis-Carmel, IN 42.9
36 Providence-New Bedford-Fall River, RI-MA 42.9
37 Rochester, NY 42.3
38 Columbus, OH 42.2
39 Phoenix-Mesa-Glendale, AZ 41.9
40 Jacksonville, FL 41.1
41 Los Angeles-Long Beach-Santa Ana, CA 40.2
42 Miami-Fort Lauderdale-Pompano Beach, FL 40.1
43 Nashville-Davidson--Murfreesboro--Franklin, TN 39.8
44 Philadelphia-Camden-Wilmington, PA-NJ-DE-MD 39.1
45 Buffalo-Niagara Falls, NY 38.7
46 Riverside-San Bernardino-Ontario, CA 37.9
47 New Orleans-Metairie-Kenner, LA 35.7
48 Baltimore-Towson, MD 34.3
49 Las Vegas-Paradise, NV 31.0
50 New York-Northern New Jersey-Long Island, NY-NJ-PA 30.1
51 San Francisco-Oakland-Fremont, CA 24.5
Analysis includes job data from 148 six-digit NAICS industry sectors covering Primary Metal Manufacturing (NAICS 331), Fabricated Metal Manufacturing (332), Machinery Manufacturing (333) and Transportation Equipment Manufacturing (336).
Data Source: EMSI Complete Employment, 2011.4 


This piece first appeared at Forbes.com.

Joel Kotkin is executive editor of NewGeography.com and is a distinguished presidential fellow in urban futures at Chapman University, and contributing editor to the City Journal in New York. He is author of The City: A Global History. His newest book is The Next Hundred Million: America in 2050, released in February, 2010.

Mark Schill of Praxis Strategy Group perfomed the economic analysis for this piece.

Photo courtesy of BigStockPhoto.com.


Iowa: Not Just the Elderly Waiting to Die

$
0
0

Stephen Bloom, a journalism professor at the University of Iowa, created quite a stir in Iowa this week with a piece in The Atlantic describing his unique observations on rural Iowa as evidence that it doesn’t deserve its decidedly powerful hand in the vote for the president. After the article appeared last Friday both his colleagues and the massive student body of the state he so harshly criticizes are returning the favor.

Mr. Bloom’s writing is not offensive because it contains no truths, but because has over-generalized our collective character as unfalteringly Christian, complacent, ignorant, and uncultured.  He continually describes a sense of delusion that is rampant in the Iowa populace. And, of course, since we’re from Iowa we must have met a meth head before, right?

When I was a four year old, my parents picked up everything they had and transplanted their lives from Phoenix all the way to Northwest Iowa. I was young, but I can still remember the farm that we originally settled in-- it was the kind of farm you see in a painting: a one-level home, a big red barn, two silos for storage, a small thicket grove with a number of deer, and even a fenced-in area for hogs. I was living the rural Iowa dream.

Eventually, when I was around seven, our next settlement of choice was a (very) small town only a couple of miles from the farmhouse. The city’s population had around 200 people, the vast majority of them at least 50 years old, and a main street littered with old buildings and storefronts of yesterday that had been abandoned over the years since their mid-century inceptions. People didn’t move to this town; instead those living in it would die from old age, or, in my case, move away in hopes of seeing something bigger.

I’m well aware of the stereotypes of Iowans: we’re wannabe hicks, we’re uncultured, we hunt, we tend to our rolling hills of corn and beans, we all drive Ford trucks because they “ride better” than anything else. I’ve grown up with people that fulfill these stereotypes here and there and I am no stranger to small town life, but not every soul that I have met in this state fits the profile as Professor Bloom posits. Far from it.

Expectedly, Bloom’s portrayal of Iowans hasn’t exactly had a warm reception. On Tuesday, the Daily Iowan’s front page had perhaps the most outrageous quote that Bloom’s article included, labeling rural Iowans as nothing more than “the elderly waiting to die, those too timid (or lacking in educated [sic]) to peer around the bend for better opportunities, an assortment of waste-toids and meth addicts with pale skin and rotted teeth, or those who quixotically believe, like Little Orphan Annie, that ‘The sun'll come out tomorrow.’”

Yesterday, Sally Mason, the president of the University of Iowa, sent out a campus-wide letter reminding the students that she “disagrees strongly with and was offended by Professor Bloom’s portrayal of Iowa and Iowans”. She reminds us of the generosity that Iowans famously possess and of our “pragmatic and balanced” lifestyles. She also goes on to speak about Dubuque’s recent revitalization, the kinds of companies Iowa has attracted (namely Rockwell Collins in Cedar Rapids and Google in Council Bluffs), and the fact that Iowa City, at times called the “Athens of the Midwest”, is designated as the only “City of Literature” in the United States. It seems like Bloom forgot to take any of this into account.

He even goes so far as to berate and categorize Iowa’s Mississippi River cities as “some of the skuzziest cities” that he’s ever visited. Cities such as Burlington, Keokuk, Muscatine, and Davenport all seem to be more degraded, violent, and worse-off than some of the cities he’s used to having seen growing up in New Jersey, a place with cities that are labeled time and time again for their overall “skuzziness.” Has he ever driven to Newark?

It seems that Bloom’s laughable interpretation of his years in Iowa have a few rings of truth that I’ve definitely witnessed, but to completely overgeneralize a people into one category assuming it’s only an “Iowa thing” is inappropriate and crude. Is he correct about anything at all? The numbers show that he is off base about the state as a whole.

The Mississippi River cities’ so-called blight is similar to many other hard hit industrial cities in the Midwest, perhaps on a similar scale to areas in Michigan (which was the only state in the past Census to actually lose population) where Bloom has holed up most recently as a visiting professor for the University of Michigan. Even so, Iowa has the 11th lowest household poverty rate in the nation. So much for widespread blight.

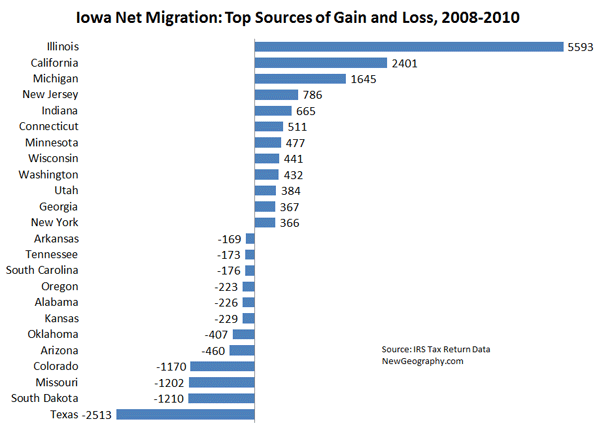
The state’s brain drain is always a topic of discussion. There has been a very noticeable population shift of rural to urban in the past half-century which was especially fueled by the farming crisis in the 80s, but this trend holds out empirically for all Midwestern states. The problem is that a look at the numbers doesn’t confirm major outmigration. Iowa saw a net gain from other states according to IRS tax return data from 2008-2010. In fact, the net gain from the top 12 source states ­­– states like Illinois, California, and Michigan – in the last three years is 40% higher than the net loss to the top destinations. If Iowans are “fleeing” anywhere, it’s to places like Texas, the largest gainer, and second placed South Dakota which the professor would no doubt like even less.

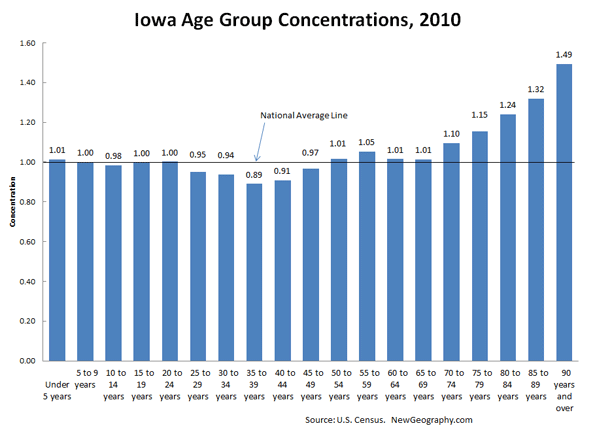
Iowa does have high concentrations of people over age 70, but that group makes up about 10% of the total population, not enough to skew the other age groups much from the national average. Iowa has an average number of children, and it lags the most in 35-44 year olds: about 10%. This older group skews the state’s educational attainment numbers as well. Iowa’s young workforce is well educated, ranking 11th of all states in residents with at least an associate’s degree. Bloom’s claim that the state is uneducated is simply not true.

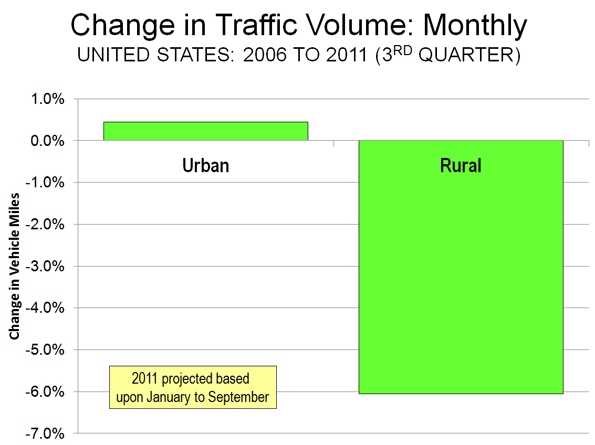
The median age of those living in rural areas is 41.2 while urbanites are relatively young at 35.8. To further add to these negative trends, rural areas have a job growth rate of -6% in the past three years, these numbers mainly fueled by the recession. But overall state jobs are is down 2.8% since January 2008, better than 35 other states. Clearly Iowans are not lazy and giving up.

Four Iowa cities were even included on CNN Money’s Best Cities to Live in 2011. (This includes the Mississippi River city of Bettendorf.) The state and its cities are also a great place to do business, according to Forbes. In 2010, Des Moines was ranked first, with Cedar Rapids at 13th beating out even a few Texan heavyweights, including Houston, Dallas, and Fort Worth that have been lauded for having a plethora of jobs. The 2011 list puts Des Moines in second place and Cedar Rapids in 11th. It seems Iowa isn’t as economically distraught as Bloom leads us to believe.

Bloom comes off as nothing more than an ignorant, smug “city-slicker” (a word that Iowans apparently use to describe Obama) who sees the state through an apparently very blurry window. He claims to have seen all 99 counties of Iowa, but how can he possibly paint a portrait of the state that is so absurdly misguided after living here for so long?  If this is what they teach in journalism school, perhaps our skepticism of the media may be better placed than even we suspect.

Jacob Langenfeld is a senior undergraduate at the University of Iowa studying economics and geography.

Mark Schill contributed demographic analysis to this piece.

Des Moines photo courtesty of BigStockPhoto.com.


The Robotics Census

$
0
0

Immigration is a concern for countries around the world, not just the U.S. It’s that annoying tendency of humans to gravitate toward an area where they can survive as opposed to staying where they are barely surviving or worse.  Once there, of course, these workers are seen often as taking jobs, altering local cultures and in general upsetting lots of apple carts.  

Here in the US, most fear concerns Spanish speakers but how about a whole other classification of immigrant workers whose impact may be the most insidious I of all: those that speak machine code, the basic language of computers.

We’re talking about what we call robots, machines that can think and can do tasks for humans. In many instances, they can replace or reduce the human workers needed to do a job. Hence, they must be considered workers themselves.

Unfortunately, they aren’t even counted in our national census, a clear instance of anti-machine racism. How are we to evaluate our true workforce? It’s left to the statistical department of the International Federation of Robotics (IFR) to keep track of them, where they are born and where they eventually work.

The numbers IFR deals with are not cumulative numbers. The actual number of robots working at any one time is a function of their lifespan which is about that of a dog:  about 12-15 years, usually. But since we’ve only had robots since the late sixties, that doesn’t mean much. Improvements that increase lifespan are always being made.

These new workers come in various categories including personal service robots, professional service robots and industrial robots. Like their human counterparts, robot workers come with varying levels of skill and intelligence.

A personal service robot can do anything from vacuum cleaning to lawn-mowing to window cleaning. Recognize those jobs? They used to be done by low-skilled workers and kids looking to make a buck around their neighborhood. Not anymore. This constitutes the fastest growing segment of robotics, with about 15 million more of these are due to be released into the wild by 2014.

The professional service robot can handle medical applications, search and rescue, bomb disposal, and in increasing numbers, military jobs like aerial surveillance: drones. The fastest growing jobs of this segment are milking robots – the days of stools and pails are over – and defense applications.  

And therein lies the paradox of the robot worker. You can’t really complain about fewer jobs for window washers while praising the selfless robots willing to die for us.

How then are we to think about those now ubiquitous automated checkout stands in your local CVS which management wants to make you use to check out your own purchases — as if it’s fun? While ignoring that each of those stations used to be a human’s job. Almost makes you want to resolve to patronize only human checkers, that is, if you can find one!

Some of the smartest of the new immigrant workers are the industrial robots. Industrial robots generally have appendages and they work overwhelmingly in the automobile and the electronics industry. Most of them have found work of late in the Republic of Korea, China and the ASEAN countries.  The IFR tells us there are more than 1,300,000 in service.

Don’t let that apparently low number fool you. You have to understand that one industrial robot can be a factory. All it takes to turn that one robot into an army is new software. They are quick learners. One day it’s a welder, the next it’s an electrician. They are designed to work 24 hours straight, with no lunch and no breaks, doing the same operation over and over with the utmost precision.

Mind-numbing consistency, that’s the ticket. Robots don’t make things better than people do. They simply make things the same, forever. Work turned out on Friday is the same as that turned out on Monday. Moreover, they have other advantages. A robot-populated factory filmed for a documentary in Japan needed to import lighting. The actual factory needed none. Such factories may also dispense with HVAC systems, potted plants and lavatories.  You can hear the heavy breathing among the bean-counters!

If the hairs on the back of your neck haven’t perked up by now, we can add a chilling coda. Who do you think is turning out all these robots? That’s right, robots! Under the watchful eyes of their control humans as of now, but later, who knows?

To measure the impact of these immigrants on local populations, the IFR uses a metric called Robot Density. Simply it is the number of multipurpose industrial robots per 10,000 persons employed in manufacturing industry whether automotive, electronic or generally. The IFR found the worldwide average industrial robot density of the 45 countries it surveys is about 50 robots. The bottom 21 countries have less than a 20-robot density.

However, in 2010, the most automated countries were Japan, Republic of Korea, and Germany with densities of 306, 287 and 253 respectively. The fact that all these countries have low human birthrates makes you think a bit.

If you take just the auto industry in Japan and Germany the densities rise to 1,436 and 1,130. Number three in the auto industry by the way is Italy with 1,229.

What about the good ol’ USA? In 2010, 1,112 industrial robots worked in the auto industry for every 10,000 human workers. We also tend to have more babies.

You see what’s happening here? At 1000, the number of robots equals one-tenth of the (human) workforce.

Our future arch enemy in the auto industry, China, increased their density from a paltry 2006 level of 37 to a paltry 105 in 2010, though with their population numbers and still relatively low wages they could probably put autos together Henry Ford style and still make money.  

The undeniable fact is robots are taking over the auto industry in the same way the Swiss captured the watchmaking industry just four hundred years ago. Remember? The other big robot user, the electronics industry, can boast similar numbers and similar robotic domination.

Are robots to blame for the recent recession and its attendant job losses? Well, you can rest easy knowing that robots suffered during the last few years, too. Job placements, in fact, were down 47% to the lowest level reported since 1994.

But by 2010, the auto and electronics industries had begun their recovery and robot placements recovered by 50%. In monetary terms this uptick was worth $5.7 billion to robot manufacturers. Substantial, but still not up to 2008 levels. Worldwide worth of the robot worker market, notes IFR, now totals some $18 Billion annually.

Noted science fiction writer Isaac Asimov once composed a set of laws to restrain the behavior of robots and to make them more acceptable to society. The original set has been refined and added to over the years by others and by Asimov, himself. They are:

  1. A robot may not injure a human being or, through inaction, allow a human being to come to harm.
  2. A robot must obey the orders given to it by human beings, except where such orders would conflict with the First Law.
  3. A robot must protect its own existence as long as such protection does not conflict with the First or Second Laws.

And, there is a fourth known as the “zeroth” law, to precede the others:

0.  A robot may not harm humanity, or, by inaction, allow humanity to come to harm.

Robots currently are not smart enough to read, understand or follow these laws. In the case of milking robots that isn’t a problem, but with drones, it might be. Humans have to control them. When things are going well, these multi-talented helpers are more than welcomed and appreciated. After all, nobody really wants handmade automobiles. If they’re all different, how would you get parts for them? And electronics built by Chinese ladies with soldering irons is not a business model that inspires confidence.

The fact is, for good and/or evil robots are now firmly entrenched in our industrial culture. And more are on the way. In the next four years, robot immigration , according to IFR, will increase by about 6% per year on average: about 6% in the Americas, about 7% in Asia/Australia, and about 4% in Europe.

Whether they are harming humanity depends on your perspective. They are taking jobs in some places and they are creating jobs in others. Perhaps the most we can hope for is a tempering of the automation frenzy while we humans prepare for the onslaught. We’re going to need more education and training to live with and control our new compatriots. For the near future, it may be wise to keep track of the new census, the combined census, because that’s the way it’s going to be from now on. Us and them.

So far, in some countries,  one in ten industrial workers has their more capable, robotic counterpart.    Every technological advance has consequences, winners and losers; and it’s disingenuous to pretend they don’t.

Robert Carr, as far as we know, is human and writes occasionally on technology. He is based in Los Angeles.

Photo by BigStockPhoto.com.

California: Codes, Corruption And Consensus

$
0
0

We Californians like collaboration. Before we do things here, we consult all of the “stakeholders.” We have hearings, studies, reviews, conferences, charrettes, neighborhood meetings, town halls, and who knows what else. Development in some California cities has become such a maze that some people make a fine living guiding developers through the process, helping them through the minefields and identifying the rings that need kissing.

Here’s an example. This is a (partial?) list of the groups who will have a say on any proposed project in my city, Ventura:

  • City agencies (Planning, Engineering, Flood Control, Traffic, Building & Safety, Utilities, Police, Fire)
  • Historic Preservation Committee
  • Parks and Recreation Committee
  • Design Review Committee
  • Planning Commission
  • City Council
  • School District
  • Neighborhood and Community Councils
  • No-Growth Citizen Groups
  • Chamber of Commerce
  • Ventura Citizens for Hillside Preservation
  • California Department of Fish and Game
  • United States Department of Fish and Wildlife
  • Ventura County Local Agency Formation Committee (discretionary authority regarding annexations)
  • Los Angeles Regional Water Quality Control Board (new MS4 Stormwater Permit issues)
  • Ventura County Environmental Health
  • California Coastal Commission (for some projects within the Coastal Zone)
  • California Native American Heritage Commission and Designated Most Likely Descendant of local tribe
  • United States Army Corps of Engineers
  • Natural Resources Defense Council, Surfrider Foundation, Heal the Bay, other environmental groups
  • And all parties who have requested to be on notice, as well as the general public and other agencies, will be informed of any California Environmental Quality Act (CEQA) document.

I didn’t pick Ventura because it is the most difficult. It’s not. I think Ventura is pretty typical for a coastal California city, actually.

The result of having all these stakeholders is that, in many California communities, particularly those in coastal and upscale locations, everyone has a veto on everything. At the beginning of a project the developer faces a huge amount of uncertainty about what the project will look like once it gets past the gauntlet and about the cost of the development process. Add to that uncertainty about who will demand what, how long the approval process will take, market conditions and the regulatory environment when the project is completed, if it is completed.

This is where the corruption connection comes in.

In economics, we teach that there are two types of corruption, centralized and decentralized. Decentralized corruption is the more pernicious of the two.

Think of a city where organized crime has a successful protection racket. This would be centralized corruption. The mob is going to collect from everyone, but it has an incentive not to collect too much. It doesn’t want to draw too much attention to itself or chase the business out of town.

By contrast, decentralized corruption consists of a bunch of independent gangs, each trying to collect all they can before the next group of thugs comes along. Each gang of thugs will demand and collect too much, and chase the business out of town.

Of course, if you want to develop a property in California no one will hold a gun to your head and demand money, and everyone is way too polite to call it extortion. Certainly, no group thinks of itself as a mob of corrupt gangsters. Instead, the members think of themselves as stakeholders, and they hold delays, lawsuits, or project denial to your head. The results are the same.

First, you have to meet everyone, and everyone wants something in return for support, or for refraining from opposition. Groups will demand “mitigation fees,” delays, studies and more studies, and changes in the project. You will meet their demands, or you will be sued, or the project will be denied.

Time spent on meetings, studies, and negotiations is expensive. The cost of the local “guide,” necessary to get through the local maze, is expensive. The “mitigation fees” are expensive. Delays are expensive. Studies are expensive. Changes in the project are expensive. Lawsuits are expensive. And risk is expensive.

Eventually, the project is no longer profitable. No wonder California’s unemployment rate is 30 percent above the United States unemployment rate.

The current climate provides California’s local governments with their best economic development opportunity: Eliminate the legal extortion by guaranteeing a project’s prompt approval if it meets existing general plans, specific plans, zoning, building codes, and adopted design criteria. Any community that did this would see immediate increased economic activity. To steal a phrase from a famous economist, it is the closest thing to a free lunch.

A city does outreach before it develops its zoning and community design plans. It only adds to the cost of development to require builders to go through the entire process again, fighting the same battles, every time a project is proposed.

The best thing about this idea is that it has been tried, and it works. The City of San Diego has seen an amazing-for-California energy since its redevelopment agency implemented such a plan several years ago. In the worst economy in 50 years, San Diego has been building and providing commercial and housing projects for all economic levels in its downtown area. It is time for the rest of California to get on with it.

Bill Watkins is a professor at California Lutheran University and runs the Center for Economic Research and Forecasting, which can be found at clucerf.org

Photo: Two Tree Hill, Ventura California by Joseph Liao (Chowee).

Rethinking College Towns

$
0
0

As a practitioner in both consulting and local government, I have observed that in local communities nothing seems to prompt productive action better than a local crisis or strongly felt threat like a factory closure. 

Unfortunately, we are often inclined to take action to close the barn door only after the horse has escaped.

That may be why “college town economic development” could be considered the ultimate oxymoron.  Higher education has been a growth industry for half a century. As a result, college towns and university neighborhoods have prospered in good times and bad and typically see little reason to pursue economic growth. 

New realities in the economy and technology, however, mean their admirable invulnerability is no longer assured.  The paradigm of guaranteed growth in college town USA is coming to an end.

More Debt, Fewer Jobs

As this is written, the Occupy movement on campuses is protesting high tuition costs and the $25,000 average debt that comes with the diploma, with even the Secretary of Education in a Democratic administration calling upon colleges in a Las Vegas conference November 29 to cut their prices.

Increasingly, what doesn’t always come with that diploma these days is a job or even a place to live away from mom and dad. Corporate cost-cutting, offshoring, and white collar automation promise fewer jobs for our graduates even beyond the current slowdown.  And the growth of for-profit universities, fast-track degree programs, and lower-cost distance learning offer strong competition to the traditional economic base of college towns that relies on large numbers of students spending four years in their town.

In addition, there is likely to be a reduction in the number of future college students, as the millennial or “echo boom” begins to pass through their teens and early twenties.    To survive, college towns have to reinvent themselves in order to “find a new way to prosper and thrive” in future years.

Additional Roles for College Towns

These various threats to colleges place the economy of the town or neighborhood outside the campus in even greater jeopardy. Thanks to technology, professors can now deliver their services to customers who have never set foot in town. College town barbers and pizza places cannot.

But happily, the college town has the potential for even greater growth than the university, not being narrowly tied like the latter to instruction and research nor to serving a single age group.

The key to that growth lies in marketing. But that’s an activity college towns have seldom done well when they’ve done it at all. Colleges themselves have often mystifyingly underperformed in this pursuit.

Despite the college town’s current prestige and trendiness, there simply won’t be enough high tech to fill the space in every college town with aspirations for a research park. And tech is unlikely to create jobs in places with only small non-research colleges.

But colleges’ assets can lend themselves to college town success not only as “A Place to Learn” and “A Place to Research” but also as “A Place to Visit” and “A Place to Live.”

A Place to Visit or Live

As detailed in The Third Lifetime Place, college towns have significant opportunities to further develop and market themselves to potential visitors as “A Place for Sports and Entertainment,” “A Place to Heal,” “A Place to Meet,” and even “A Place to Vacation.”  The biggest payoff, however, may be from marketing the college town as “A Place to Come Home To” during working years or “A Place to Retire” thereafter.

College towns are already taking off as retirement destinations. With the now-beginning retirement of the huge Baby Boom generation, a college town with advantages for retirement that doesn’t develop and market them is simply leaving money on the table.

But the technology that enables telecommuting and the money it saves both corporations and independent entrepreneurs can also make the college town a great place to live for workers who are not faculty or college staff. The advantages of good schools and small town living that so many families pay top dollar for in metropolitan suburbs can be readily found in many college towns and with a smaller price tag.

A Unique Competitive Advantage

As places to market for living or retirement, college towns are blessed with a unique competitive advantage: their status as the Third Lifetime Place (TLP) in the lives of thousands of alumni. 

Most of us have a special place that joins in lifetime significance the place where we grew up — which will always be “home” — and the place where we’re spending most of our adult lives. This third place is or was a pleasurable temporary refuge from both work and home responsibilities.

The traditional TLP has been the year-after-year vacation spot. Later becoming the location of the second home, the final validation of its TLP significance was its choice for retirement. The most conspicuous success among traditional TLPs has been Florida, which moved from vacationland status to Retirement Central and also a favored place to locate a business, take a job, or hold a convention.

But as suggested in The Third Lifetime Place, for the  highly college-educated generations that started with the Boomers, the four or more years spent in the college town may make it a more potent TLP than the place at the lake where they spend two weeks every July. 

The most enjoyable and often most life-changing years of one’s youth were often those spent in the college town. Lifetime devotion to the football team, return trips to campus for reunions, and gifts to the alma mater testify to the strong feelings graduates have about these years.  And emotional appeals are probably the most potent force in marketing anything.

Obstacles to Overcome

But despite the powerful TLP marketing advantage, business as usual on campus, in city hall, or in the chamber of commerce office will not be enough to make the economic payoff happen.

The most daunting impediment may be an “if-it-ain’t-broke-don’t-fix-it” complacency, the consequence of a seemingly bulletproof prosperity. Another is a left-of-center activist political climate that is characteristically anti-business and anti-growth which commonly results in high local taxes or high levels of regulation.   

Unfortunately, a long history of dominating the provision of a universally popular product like higher education no longer assures places perpetual prosperity. The poster child for that reality is Detroit.  The Motor City once figured it would keep riding high so long as Americans continued to buy cars. But that’s not what happened.

Per the Chinese character that designates both “danger” and “opportunity,” the effects of changes in higher education on college towns will depend on how our towns respond to them.  And that will depend to a large degree on the quality of their business, civic, and political leadership.

John L. Gann, Jr., President of Gann Associates, Glen Ellyn, Illinois--(800) 762-GANN—consults, trains, and writes on marketing places to grow sales, jobs, property values, and tax revenues.  Formerly with Extension at Cornell University, he is the author of How to Evaluate (and Improve) Your Community’s Marketing published by the International City/County Management Association.

E-mailed information on The Third Lifetime Place: A New Economic Opportunity for College Towns is available from the author at citykid@uwalumni.com.

New Paltz, NY photo by Flickr user joseph a

.

New Census Data Reaffirms Dominance of the South

$
0
0

The 2011 state population estimates released earlier today by the Census Bureau show that the South has retained its dominant position in both population and growth over the last year. Southern states accounted for more than one half of the nation's population growth between 2011 and 2000, despite having little more than one third of the population. Moreover, the South was the recipient of 95% of the inter-regional net domestic migration (people moving from one state to another), with the West accounting for the other 5%, with the losses split between the Northeast and the Midwest.

Overall, a net 533,000 people moved from one state to another, somewhat above the low of 503,000 in 2008 and below the 573,000 at the beginning of the previous decade (2001). The figure, however, remained less than one-half that of the mid 2000s peak.

The state data confirmed the "return to normalcy," that had been indicated by the 2010 American Community Survey data.

The South Rises Again

In 2011 (July 2010 to June 2011), seven of the top domestic migration gaining states were in the South. This is a restoration of the same dominance the South achieved in 2001 to 2006. Some of the states have changed, but the overall impact is little different.

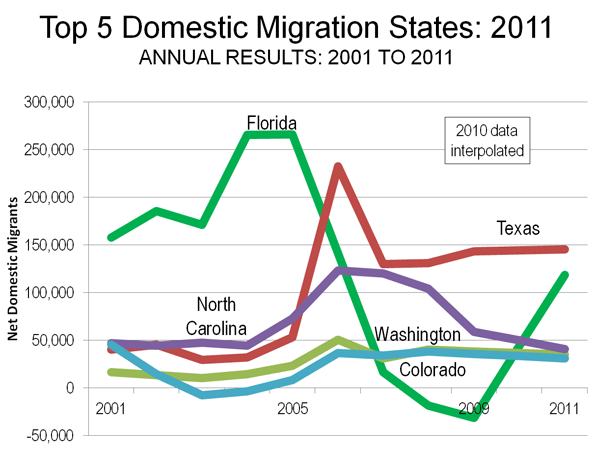
Texas:Texas again led the nation in net domestic migration, adding 145,000 people from other states to its population. This was a slight increase from the 143,000 net domestic migrants in 2009 (Note 1) and was the highest for Texas since the artificially intense exodus from Louisiana in the year (2006) following hurricanes Katrina and Rita. Texas has led the nation in net domestic migration for six years and ranked second in the nation over the 2001 to 2009.

Florida: Most spectacularly, however, has been the performance of Florida. Florida had been a net domestic migration leader for years, and had been number one from 2001 through 2005. However, when its highly inflated house prices collapsed (New York Federal Reserve Bank research refers to Florida as one of the "four bubble" states, along with California, Arizona and Nevada), Florida lost domestic migrants for the first time in at least six decades, in both 2008 and 2009. That has been radically turned around. In 2011, Florida added 119,000 net domestic migrants, housing prices dropped to normal levels (Note 2). While this is less than one half the gains in 2004 and 2005, it exceeds the annual Texas increase in the previous decade by 20%.

North Carolina and South Carolina: North Carolina ranked third, adding 41,000 net domestic migrants. This is an improvement from a fourth-place ranking in the previous decade. Neighboring South Carolina added 22,000 net domestic migrants and ranked sixth. This is an improvement from the previous decade's ranking of seventh. The domestic migrants to North Carolina and South Carolina have been called "halfbacks," as some have suggested that many who had moved to Florida from the Northeast have subsequently moved to North Carolina and South Carolina, essentially one half of the way back to where they moved from originally.

Tennessee, Georgia and Virginia: Tennessee (7th), Georgia (8th) and Virginia (9th) rounded out the South's seven of the top 10 states. Tennessee improved from having been 8th in 2001 to 2009, while Georgia dropped from 5th and Virginia was a new entrant, having previously ranked 12th.

Western Runners-Up

While the West continued to show net domestic migration gains, this formerly fastest-growing area of the nation has fallen well behind.

Washington: Washington ranked fourth in 2011, an improvement from ninth between 2001 and 2009. Washington added 35,000 net domestic migrants.

Colorado: Colorado also improved its position, adding a net 31,000 domestic migrants and ranking fifth in 2011, which is up from its 10th ranking in 2001 through 2009.

Oregon:Oregon ranked 10th, adding 14,000 net domestic migrants and was a new entrant to the top 10, having placed 11th between 2001 and 2009.

Things Never Change: The Bottom 10

A similar restoration of normalcy is evident in the bottom 10 states. From 2001 to 2009, all of the bottom 10 net domestic migration states were in the Northeast or the Midwest, joined by California. This changed somewhat in 2011, with formerly fast-growing Nevada, edging out one of the former bottom 10. There was some movement at the very bottom of the list.

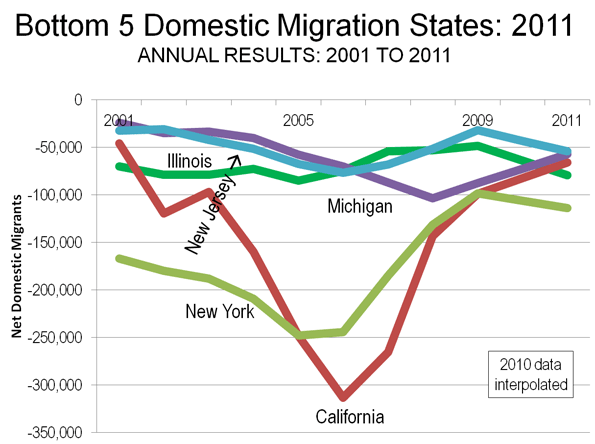
New York: New York recovered its last place position (51st), which it held overall between 2001 and 2009, but had yielded to California later in the decade. New York lost 114,000 net domestic migrants in 2011, which compares to the 1,650,000 loss between 2000 and 2009.

Illinois:Illinois had the second-highest net domestic migration loss, sending 79,000 of its residents to other states. Illinois had ranked 49th in net domestic migration in the previous decade, with a 615,000 loss. Unlike the other biggest losers, New York and California, the Illinois rate in the single year of 2011 exceeded its annual rate of net domestic migration loss between 2000 and 2009.

California:The bad news is that California continues to be among the most hemorrhaging states in net domestic migration. The 2000 to 2009 net domestic migration loss of 1,500,000 was more than the population of the cities (municipalities) of San Francisco and Sacramento combined. Perhaps it is good news that the net domestic migration loss dropped to 66,000 in 2011, less than half the annual rate in the previous decade. California ranked 49th in net domestic migration in 2011, an improvement from its 50th place position in 2001 through 2009.

Michigan: Michigan continued its heavy losses, losing a net 57,000 domestic migrants in 2011 and ranking 48th. In the previous decade, Michigan had also ranked 48th and had a net loss of more than 535,000 domestic migrants.

New Jersey, Ohio and Connecticut: New Jersey, Ohio and Connecticut occupied the next three higher positions in the bottom ten. The New Jersey and Ohio ranks of 47th and 46th were the same as in the previous decade. Connecticut ranked 45th in 2011 and had ranked 42nd, at the top of the bottom 10, in the previous decade. Each of these states experienced an acceleration of net domestic outmigration relative to their annual loss in the previous decade. In the previous decade, the New Jersey and Connecticut losses had been driven by the New York metropolitan area, which suffered the preponderance of the net domestic migration losses in the Northeast.

Missouri and Indiana: The Midwestern states of Missouri and Indiana were new entrants to the bottom 10. Missouri ranked 44th in net domestic migration in 2011, losing 12,000, a substantial deterioration from its 20th ranking in the previous decade when the state added 41,000 residents from other states. Indiana ranked 43rd compared to its 32nd place ranking in the previous decade.

Nevada: Nevada, which had ranked sixth in net domestic migration in the previous decade, occupied the top position in the bottom 10, at 42nd. Nevada lost 11,000 domestic migrants, compared to a gain of more than 360,000 in the previous decade. Like Florida, house prices had escalated sharply during the housing bubble and prices have since fallen back to normal levels. However, much of Nevada's economy is tied to that of California, which could be a hindrance to the restoration of its previous growth.

Other Notes

The other "bubble state," Arizona ranked 11th in net domestic migration, adding 13,000 new residents from other states. As in Florida, house prices had escalated sharply but have since fallen back to normal levels. However, despite its healthy domestic migration, Arizona's gain is far less than its annual rate in the previous decade.

There are nothing but surprises in the balance of the top 15. Oklahoma, which has long exported people, especially to the West, ranked 12th in net domestic migration, an improvement from 19 in the previous decade. The District of Columbia ranked 13th, which is a strong improvement from its previous ranking of 37th. Louisiana continued its recovery, ranking 14th, which is an improvement from 45th in the previous decade. North Dakota, whose 2000 population was less than that of 1920, ranked 15th, which is an improvement from 31th in the previous decade.

No Matter How Much Things Change They Stay the Same

Both over the last decade and in 2011, the South accounted for 53% of the nation's growth, the West 32%, with the Midwest rising from 8% to 9% and the Northeast falling from 7% to 6%. And, as indicated above, net domestic migration results were similar. The conclusion from the new census estimates is consistent with the old adage that "no matter how much things change, they stay the same."


Net Domestic Migration by State:
2001-2009 and 2011
By 2011 Rank
State 2011 2011 Rank 2001-2009 2001-2009 Rank
Texas       145,315                   1        838,126                   2
Florida       118,756                   2     1,154,213                   1
North Carolina         41,033                   3        663,892                   4
Washington         35,166                   4        239,037                   9
Colorado         31,195                   5        202,735                 10
South Carolina         22,013                   6        306,045                   7
Tennessee         20,328                   7        259,711                   8
Georgia         17,726                   8        550,369                   5
Virginia         15,538                   9        164,930                 12
Oregon         13,636                 10        177,375                 11
Arizona         13,150                 11        696,793                   3
Oklahoma           8,933                 12           42,284                 19
District of Columbia           8,334                 13         (39,814)                 37
Louisiana           7,085                 14       (311,368)                 45
North Dakota           6,368                 15         (18,071)                 31
Kentucky           5,761                 16           81,711                 15
Arkansas           5,724                 17           75,163                 16
Montana           3,888                 18           39,853                 21
West Virginia           2,814                 19           17,727                 26
South Dakota           2,610                 20             7,182                 27
Delaware           2,347                 21           45,424                 18
New Mexico           2,202                 22           26,383                 24
Alabama           1,974                 23           87,199                 14
Alaska               740                 24           (7,360)                 29
Wyoming             (149)                 25           22,883                 25
Idaho             (256)                 26        110,279                 13
Utah             (826)                 27           53,390                 17
Vermont             (841)                 28           (1,505)                 28
Nebraska             (977)                 29         (39,275)                 36
Maine          (1,000)                 30           29,260                 23
Pennsylvania          (1,121)                 31         (33,119)                 34
Iowa          (1,361)                 32         (49,589)                 40
Hawaii          (2,320)                 33         (29,022)                 33
Maryland          (2,994)                 34         (95,775)                 43
New Hampshire          (3,645)                 35           32,588                 22
Rhode Island          (6,273)                 36         (45,159)                 38
Mississippi          (6,672)                 37         (36,061)                 35
Kansas          (7,928)                 38         (67,762)                 41
Minnesota          (8,073)                 39         (46,635)                 39
Massachusetts       (10,886)                 40       (274,722)                 44
Wisconsin       (10,990)                 41         (11,981)                 30
Nevada       (11,113)                 42        361,512                   6
Indiana       (11,412)                 43         (21,467)                 32
Missouri       (11,831)                 44           41,278                 20
Connecticut       (16,848)                 45         (94,376)                 42
Ohio       (44,868)                 46       (361,038)                 46
New Jersey       (54,098)                 47       (451,407)                 47
Michigan       (57,234)                 48       (537,471)                 48
California       (65,705)                 49   (1,490,105)                 50
Illinois       (79,458)                 50       (614,616)                 49
New York     (113,757)                 51   (1,649,644)                 51
Data from US Bureau of the Census


-----

Note 1: The Census Bureau did not produce domestic migration data for 2010 (2009-2010). Any reference to 2010 in this article is based upon an interpolation of the 2010 estimate from 2009 and 2011 Census Bureau estimates.

Note 2: By 2010, housing affordability in all of Florida's four major metropolitan areas with the exception of Miami had been returned to a Median Multiple (median house price divided by median household income) of approximately 3.0 or less, which is the historical norm (See: 7th Annual Demographia International Housing Affordability Survey). During the housing bubble of the early to middle 2000s, the Median Multiple had risen to above 5.0 in all of the major metropolitan areas except Jacksonville.

Wendell Cox is a Visiting Professor, Conservatoire National des Arts et Metiers, Paris and the author of “War on the Dream: How Anti-Sprawl Policy Threatens the Quality of Life


The Sun Belt's Migration Comeback

$
0
0

Along with the oft-pronounced, desperately wished for death of the suburbs, no demographic narrative thrills the mainstream news media more than the decline of the Sun Belt, the country’s southern rim extending from the Carolinas to California. Since the housing bubble collapse in 2007, commentators have heralded “the end of the Sun Belt boom.”

Yet this assertion is largely exaggerated, particularly since the big brass buckle in the middle of the Sun Belt, Texas, has thrived throughout the recession. California, of course, has done far worse, but its slow population growth and harsh regulatory environment align it more with the Northeast than with its sunny neighbors.

Moreover, the Sun Belt is poised for a recovery, according to the most recent economic and demographic data. Even such hard-hit states as Arizona and most impressively Florida appear to be making an unexpected, and largely unheralded, recovery.

Take Florida. The Sunshine State may have experienced rapid population loss during 2008 and 2009, but the just-released 2011 Census estimates show a remarkable turnaround, with the state adding 119,000 domestic migrants last year. This may be less than half the gains in 2004 and 2005, when the in-migration reached nearly 250,000, but it is close to levels enjoyed a decade ago.

The big winners in terms of growth were in the South, with Texas, Florida and North Carolina as the leading in-migration states. Virginia, South Carolina, Georgia, Tennessee and Virginia also ranked in the top 10. Overall, the Southern states reaped 95% of the inter-regional net domestic migration (people moving from one state to another). Arizona, another state widely written off, enjoyed an 11th place finish, with a net gain over 13,000.

As for the much-cherished notion that people will start flocking to highly urbanized, high-cost littoral states? Well, as they say in my native New York, fuggedaboutit. As has been the case for most of the past few decades, the Empire State has once again been the biggest loser, not of pounds, losing 113,000 people. Following close behind are California and Illinois, all of which are once again losing people in large numbers to other places.

In contrast, one of the few Sun Belt states to lose migrants is former high-flier Nevada, which lost 11,000 people to other states. The Silver State’s continued decline seems traced to what Phoenix economist Elliot Pollack describes as its “one-trick pony economy.” In Nevada, that economy is tied to gambling, which has been hit by the recession and by increasing competition both domestically and in East Asia. It also suffers from its unhealthy “evil twin” dependency on still-weak California.

The reasons behind these shifts are complex. For one, there is a slowly improving economic climate in many Sun Belt cities. In terms of year-to-year job growth, Dallas ranks first and Houston third, while  Orlando, Miami and Phoenix all are among the top 10 of the country’s 32 largest metropolitan areas. Among the states Texas ranks fifth and Arizona ranks seventh, while Florida clocks in at 16th. This may not be the gangbuster growth of previous decades, but is far from moribund.

Looking forward, some of the “bubble states” appear to be taking a lesson from Texas and are reconsidering their former growth formula, which relied far too much on tourism, retirees and housing construction. “We know the business model has to change from just tourism and retirees,” notes Chris McCarty, director of the Bureau of Economic and Business Research at the University of Florida. “We need to make a modification in our approach and now there’s a desire to do something about it.”

Increasingly, places like Phoenix, Orlando and Tampa are focusing on more broad-based growth in such fields as biomedicine, software and trade, which may produce steadier, if not quite as rapid, growth. Aggressively pro-business governments in almost all Sun Belt states — with the exception of California — will enjoy better economic prospects as companies seek out lower-tax, less regulated environments.

But ultimately demographic trends may prove more determinative. People moving into a state provides many things — such as new workers, skills and, perhaps most important, capital. An examination of IRS data of income brought in as a result of migration by the Tax Foundation shows that Florida ranked third in terms of overall gains, behind only Montana and South Carolina. Arizona ranked fifth. The biggest losers are all in the frost belt: Michigan, New York, Rhode Island and Illinois.

If we are, as is likely, returning to something approximating earlier patterns, we should expect these trends to accelerate gradually over the coming years. One critical factor will be our rapidly aging population.  Over the past decade, Phoenix as well as the Florida burgs of Tampa-Saint Petersburg, Orlando and Jacksonville all ranked among the top 10 destinations for aging boomers. This pattern may be reasserting itself.

Housing prices are a critical factor here. Once-soaring prices in communities such as Orlando and Phoenix have adjusted to the more historic median multiple (median housing price relative to income) of roughly three; in contrast, despite some declines, prices in metropolitan areas like New York, Los Angeles, San Francisco, San Diego and San Jose all remain around six or higher.

This suggests that many retirees and down-shifting boomers — people still working but able to relocate their jobs — may find cashing out of their more expensive houses in the Northeast, Chicago or coastal California an effective way of supplementing often depleted IRAs. “There’s a lot of older people with equity who can find bargains that weren’t around in 2006,” observed the University of Florida’s McCarty.

More important still is the movement of younger people from the large millennial generation. Despite the assumption that this group inevitably prefers dense, expensive cities, the 2010  Census showed people 25 to 34 moving primarily to Sun Belt cities such as Orlando, Tampa, Houston and Austin, as well as Raleigh, North Carolina.

“There are a lot of people who will be getting into their 30s [who] still haven’t created a household or bought a home,” says Phoenix-based economist Elliot Pollack. “They mostly won’t be able to do that in California or the Northeast, but they can do it in places like Arizona.”

Pollack maintains that the real estate meltdown has actually created opportunities for the emerging generation. Burdened by college debt and what could still be a sluggish economy, they may find, like so many of their parents, that their best options for homeownership lie in these Sun Belt growth markets. In this sense, the millennials, like the generations before them, may not be the ones to kill the Sun Belt  but the demographic which will  propel it into a new period of more steady, and sustainable, growth.


Net Domestic Migration By State, 2010-2011
State 2011
Texas    145,315
Florida    118,756
North Carolina      41,033
Washington      35,166
Colorado      31,195
South Carolina      22,013
Tennessee      20,328
Georgia      17,726
Virginia      15,538
Oregon      13,636
Arizona      13,150
Oklahoma        8,933
District of Columbia        8,334
Louisiana        7,085
North Dakota        6,368
Kentucky        5,761
Arkansas        5,724
Montana        3,888
West Virginia        2,814
South Dakota        2,610
Delaware        2,347
New Mexico        2,202
Alabama        1,974
Alaska           740
Wyoming         (149)
Idaho         (256)
Utah         (826)
Vermont         (841)
Nebraska         (977)
Maine      (1,000)
Pennsylvania      (1,121)
Iowa      (1,361)
Hawaii      (2,320)
Maryland      (2,994)
New Hampshire      (3,645)
Rhode Island      (6,273)
Mississippi      (6,672)
Kansas      (7,928)
Minnesota      (8,073)
Massachusetts    (10,886)
Wisconsin    (10,990)
Nevada    (11,113)
Indiana    (11,412)
Missouri    (11,831)
Connecticut    (16,848)
Ohio    (44,868)
New Jersey    (54,098)
Michigan    (57,234)
California    (65,705)
Illinois    (79,458)
New York  (113,757)
Data from US Bureau of the Census


This piece first appeared at Forbes.com.

Joel Kotkin is executive editor of NewGeography.com and is a distinguished presidential fellow in urban futures at Chapman University, and contributing editor to the City Journal in New York. He is author of The City: A Global History. His newest book is The Next Hundred Million: America in 2050, released in February, 2010.

California in 2011: Suburbs Up, Exurbs Down?

$
0
0

I had the fortune recently to stumble on the California Department of Finance’s estimates of population change in California during the period July 1, 2010 – July 1- 2011. This is distinct from the Federal census, which tried to establish the number of people in all localities as of April 1, 2010. These California statistics are for a short period of only one year; they are not as reliable, of course, as a real census.  

Percentagewise, the county that grew fastest was a Sacramento suburban county called Placer, which grew by 1.45 per cent (or, I suppose, what financial people would call 145 basis points) during that one year. It was also only one of two California counties where more people moved to from within the United States than from outside the United States (the other being Riverside County). It was also  one of three where the number of people moving in over that moving out was greater than the excess of births over deaths, the other two being Napa County, which is suburban in its southern reaches before the grapes begin, and San Francisco County, which is known for, well, for not being big on baby-making. (Nevertheless San Francisco County did have a natural increase of 3,138 persons, whereas, as we shall see later, some rural counties had more deaths than births.)

But what came as a surprise  was that Placer’s sister county, El Dorado, also a Sacramento suburban county running up into the mountains, gained a mere 26 basis points; and the other foothill counties of the Gold Country actually lost population during the year! This came as a surprise to me, for I have a house in Calaveras County and in the past I had spent time there; the Gold Country seemed to be a haven for the semi-retired and the part-time worker and even the long distance commuter; and Grass Valley had the beginnings of a high tech industry spilling over from Silicon Valley.

I don’t know what the terms “suburb” and “exurb” mean to New Geography readers, but I have my own definition which seems handy enough to me. A “suburb” has subdivisions and planned communities; developers buy land, subdivide, and build homes or sell lots often with covenants of various kinds.  People still prefer suburbs – even ones quite distant from the urban cores – over the city, in part due to factors like cheaper housing, better schools, and newer amenities.

Exurbs are different. In an exurb, people split parcels into smaller lots, sell the lots, and then people build custom houses on them with no covenants (except maybe a few easements) and any architectural style the government will allow and perhaps a few they don’t. A good place to see the contrast is in the area just north of Cajon Pass. Victorville, Adelanto, and parts of Hesperia and Apple Valley abound with subdivisions, like the Orange County of my youth. But if you go a little bit to the southwest, around Pinnon Hills and Phelan, there is not a “subdivision” to be seen, and yet houses and, on the road, commercial establishments get thicker and thicker every year. (I have, on occasion for the past 25 years, taken the road to the monastery at Valyermo from Orange County, and I have seen these changes.)

Overall, it looks like the “suburbs” are growing – far more than the cities –  while the “exurbs” are not. Placer County is an explosion of subdivided suburbs and “planned communities” as far as Newcastle and Lincoln.

In contrast, El Dorado has some of these in its west end, but they are not expanding much. And the other Gold Country Counties, Nevada, Amador, Calaveras, Tuolumne, and Mariposa, all of which shrank slightly in population, fit my definition of “exurban” – they have exurbs, and they are not very agricultural unless you count backyard wine and marijuana patches.  These areas had been much sought out since the inflationary “survivalist” days of the 1970s. Now, it seems, the economy and gasoline prices are not affecting the prosperity and desirability of organized suburbia, but they are making the areas beyond organized suburbia less desirable than they used to be. I wonder if this is a nationwide trend.

Another discovery may point to the age of residents in various counties. Of the counties that actually lost population over the year the three on the Redwood Coast  – Del Norte, Humboldt, and Mendocino – did so in spite of having an excess of births over deaths. So did the two in the far northeast, Modoc and Lassen. To read that a county in California lost population is in the “this I have lived to see” category.

Oddly, did one county in the Central Valley also declined. Kings, which is metropolitan Hanford, declined despite the fact that next door Tulare County was a big gainer; and Inyo County – home of Bishop, Lone Pine, and Death Valley – had an identical number of births and deaths. On the other hand, the Gold Country counties I mentioned – plus Sierra, Plumas, Siskiyou, Trinity, and Lake, outside the Sacramento Valley – had an excess of deaths over births. Perhaps these particular counties, more than the others, had been settled by retirees or empty nesters, who were no longer having children.

For its part, the rain-drenched Redwood Coast and the far northeast were less attractive, apparently, to retirees. In the counties not attractive to retirees, natural increase exceeded even immigration from outside the United States, which was positive in every county except Alpine, where it was exactly zero. Also, only in the aforementioned Placer and Napa Counties, and the City of San Francisco, did inward migration of any kind – from the U.S. or outside – exceed the “natural increase.”

The “native Californian,” once a slightly exotic phenomenon, seems to be becoming the norm. The days of what Carey McWilliams called, in his book title of 70 years ago, California: The Great Exception, seem to be at an end. We have entered a world we never knew before. California may become, at long less, less exceptional, still sprawling but in a more organized fashion.

Howard Ahmanson of Fieldstead and Company, a private management firm, has been interested in these issues for many years.

Photo courtesy of Bigstockphoto.com

Public Pensions: Reform, Repair, Reboot

$
0
0

Ill-informed chatter continues to dominate the airwaves when it comes to California public pensions. It’s a big, complex and critical issue for government at all levels in the Golden State. What makes debate so distorted is that public pensions actually differ from agency to agency — and advocates on the issue often talk past each other. Pension critics often point to outrageous abuses as if they were typical. On the other hand, pension defenders often cite current averages that understate long-term costs. All this fuels the typical partisan gridlock that Californians lament yet seem powerless to change in our state.

Credit Governor Jerry Brown for trying to overcome the polarization. That’s what most California voters want him to do, according to a new Field Poll, one of the leading opinion research firms in California. His 12-point pension package (unveiled in October) is successfully framing the debate — and enjoys encouraging support from voters. I agree with them. While Brown’s plan is far from perfect (as he acknowledged in presenting it as a way to build consensus) it sensibly tackles some of the most challenging areas where reform is needed. Among the key reforms he’s proposed:

  • Increasing the retirement age from 55 to 67 (with a lower age to be spelled out for public safety workers).
  • Replacing the current “defined benefit” pensions with a hybrid program that includes a defined benefit component, but also a 401(k)-like defined contribution component
  • Prohibiting retroactive pension increases.
  • Requiring all employees to contribute at least 50 percent of the cost of their pensions

These generally follow the surprisingly strong stand taken by the League of California Cities, which was based on recommendations from a committee of City Managers that I served on. Our work was grounded in four core principles:

  1. Public retirement systems are useful in attracting and retaining high-performing public employees to design and deliver vital public services to local communities;
  2. Sustainable and dependable employer-provided defined benefits plans for career employees, supplemented with other retirement options including personal savings, have proven successful over many decades in California;
  3. Public pension costs should be shared by employees and employers (taxpayers) alike; and
  4. Such programs should be portable across all public agencies to sustain a competent cadre of California public servants.

Our goal was to ensure the public pension system is reformed, instead of destroyed. Our reform package mirrors Brown’s calls for a hybrid system, raising retirement ages and increasing the portion of pension costs borne by employees. We also backed his bid to base retirements on the top three highest years of pay, curbing the abuses that often artificially raise final year salaries to “spike” pension pay-outs.

Typical of California’s other challenges, the issue faces long odds in the Legislature and uncertain fate at the ballot box. Partisan Democrats are leery of crossing unions by embracing Brown’s package. Partisan Republicans are demanding more far-reaching changes. Brown hopes to bridge the differences to win majority support by drawing on moderates in both parties. “He hasn’t riled up one side or the other,” noted Field Poll director Mark DiCamillo. “He’s managed to strike the middle ground on a very polarizing issue.” Unfortunately, moderates are hard to find in Sacramento.

That leaves the roll of the dice that comes with ballot initiatives. Since it takes millions to bankroll a successful ballot measure, few sensible measures get far without support from well-heeled interests.

In the eternal game of chicken that goes on in Sacramento, the Legislature keeps one eye on those special interests. About the only hope for reform is if a majority is worried that failure to act might spur an expensive ballot box war and an even worse outcome.

This issue might be the exception, however. Public outrage is real. So is the need for reform. In Ventura, we took an early lead on this issue, first with our Compensation Policies Task Force, then union contracts that established a lower benefit and later retirement age for new hires and increased contributions from all employees of at least 4.5% of their pay. But real reform to level the playing field can only come at the State level.

Before this issue devolves into another ballot box catastrophe that radically oversimplifies the issues to a “yes” or “no” choice on an initiative bankrolled by special interests, legislators in both parties need to come together on sensible reform. The Governor has put such a program on their desks. Reasonable people can differ on the details. But only unreasonable people want all-or-nothing victories. This is an issue that both sides should be willing to compromise on. The only way that will happen is if voters push both parties toward sensible compromise in the year ahead!

Photo by Randy Bayne

Rick Cole is city manager of Ventura, California, and recipient of the Municipal Management Association of Southern California's Excellence in Government Award. He can be reached at RCole@ci.ventura.ca.us

Looking at the New Demography

$
0
0

In the last 200 years the population of our planet has grown exponentially, at a rate of 1.9% per year. If it continued at this rate, with the population doubling every 40 years, by 2600 we would all be standing literally shoulder to shoulder. 
-- Professor Stephen Hawking

Eighty-two years after the original development of the four stage Demographic Transition Model (DTM) by the late demographer Warren Thompson (1887-1973), the cracks are starting to show on the model that for many years revolutionised how we think about the geography of our global population.

Thompson’s achievement was an important one. He suggested that we were in the midst of a transition, from an ‘old’ world dominated by high mortality, autocracy and subsistence to a ‘new’ world characterised by low mortality, democracy and an ever globalising economy. Our global society, slowly but surely, was moving to what he described as a ‘stage 4’ of the DTM: an earthly paradise in which mortality, fertility and population growth are low. However, is this really paradise? Is it too early to pop the champagne and congratulate ourselves for thousands of years of social and economic development? Is this the end of the demographic transition?

What is stage 5?

The mainstay of the geography classroom in secondary and tertiary education is the 4 part DTM.  Its theoretical representation shows a graph whereby high and fluctuating birth and death rates dramatically decline in stages 2 and 3 and come to equilibrium in stage 4 whereby birth and death rates are low. Simultaneously intertwined in the graph is a line representing population growth rates which starts low, increases exponentially and levels off in stage 4.

Today we may be entering the next and largely unanticipated stage of development. Countries of the developed world have long said farewell to times where woman used to be chained to an animal cycle of reproduction and death used to be an almost daily occurrence. We may need to ask: is stage 4 really sustainable in the long term? Are we still in transition? The developed world is now one that experiences a low death rate and therefore an aging population, a birth rate far below the replacement level and a flat lining of population growth.

I would by no means be the first to suggest we may be entering something what would be best defined as stage 5. The three main indicators of stage 5 of the DTM are: a very low birth rate, a low death rate and a slow decrease of the total population. How is this different from stage 4? The birth rate is the lowest the human race has ever experienced and for the first time since the Stone Age (excepting medieval plagues), the total population of some developed countries are in decline.

Does Stage 5 exist anywhere?

Firstly, a distinction needs to be made between the old world, the new world and the whole world. The ‘old’ world simply refers to the relatively undeveloped world characterised by high birth rates and a predominantly agrarian economy. Examples include Zambia and Uganda, places sitting at around stage 2 of the DTM. The ‘new’ world refers to the developed world of places which include East Asia, Europe, North America and increasingly parts of the developed world, notably China. Much of the developed and developing world has already reached stage 4 and many countries are headed decisively into stage 5.

The most startling example of the exhaustion of stage 4 is Russia’s recent demographic performance. Since the breakup of the Soviet Union, Russia has lost 5.7 million people through higher death rates and lower birth rates. This is equivalent to the emptying of Scotland and the city of Newcastle-upon-Tyne.

The rest of Europe is seeing below replacement level fertility rates. The only phenomena sustaining the level of population in these countries are the diasporas of overpopulated Africa and Asia. Not only has Europe entered stage 5 of the demographic transition, it’s now facing the challenge of its related social issues*.

What might a stage 5 world look like?

Some current trends lead to some fascinating projections of the future demographic make-up of the most technologically advanced factions of our global society. The low birth rate, especially in Europe, has allowed for an empowerment of women unseen before in history. Many are essentially swapping children for careers. This financially advantages both the parents and the 1 or 2 children who can enjoy a healthy share of the family income.

Another dimension to a ‘stage 5 family’ is the inter-generational relationships between 3 and sometimes 4 generations of a single blood line. That is to say, it creates a situation where a grand child can have a relationship with a parent, a grand-parent and sometimes even a great grand-parent thanks to longer life expectancy and low death rates. This of course is rare in the ‘old’ world where a child may never know a grandparent beyond childhood. The reader may care to notice that this particular geography of the family, a 1 or 2 child household with living grand-parents, is not all that unusual.

The decline of fertility in Europe has reached a point where it is below the replacement level needed to sustain the population. The reason that the European population is still growing, albeit slightly, is because of the influx of immigrants. The resulting greater multiculturalism can strain the patience of the most liberal and tolerant of people. It is a well known script from social scientists that immigrants tend to form insular communities in their arrival destination. The conflict between the British far-right pressure group, the English Defence League and British Muslims provides a textbook example of problems that arise from the ever evolving demographic transition. Problems that are of such importance, they are often reflected in the make up of parliament.

Beyond stage 5

Clearly, Thompson’s 4 stage DTM is increasingly outdated in most developed parts of the world. One possible solution to the dilemma of lost identity, rapid aging and depopulation may be a policy aimed at reversing the negative correlation between economic development and fertility. Mikko Myrskylä, Hans-Peter Kohler and Francesco C. Billari published an article in Nature 36 months ago outlining an irregularity in one of the most established relationships in the social sciences. Although it is normal for fertility decline in medium to high-HDI countries, there is evidence for fertility increase in areas of very advanced human development.  Perhaps it is this that could serve as a new model of what might be called ‘stage 6’ of humanities ever changing demographic transition.

Edward Morgan is a 3rd Year Human Geography student at the University of St Andrews, Scotland.

*It has been suggested that the ‘top-up’ of population with immigrants has led to the return of the anti-immigration far-right in Europe and it has been used to explain the electoral successes of parties such as the British National Party, Front National (France) and the ultra-right wing Danish Peoples Party.

~~~~~~~~~~~~~~~~~~

Keith Montgomery does a good introduction to the demographic transition model

Paper by Mikko Myrskylä, Hans-Peter Kohler and Francesco C. Billari.


http://hs-geography.ism-online.org/2010/09/07/the-demographic-transition-model/
Thompson’s Demographic Transition Model with stage 5.

Photo courtesy of BigStockPhoto.com

.

Suppressing the News: The Real Cost of the Wall Street Bailout

$
0
0

No one really knows what a politician will do once elected. George “No New Taxes” Bush (George I to us commoners) was neither the first nor will he be the last politician to lie to the public in order to get elected.  It takes increasing amounts of money to get elected. Total spending by Presidential candidates in 1988 was $210.7 million; in 2000 it was $343.1 million and in 2008, presidential candidates spent $1.3 billion. Even without adjusting for inflation, it’s pretty obvious that it takes A LOT MORE MONEY now. For those readers who are from the Show Me state, $210.7 million in 1988 is equivalent to roughly one-third of the buying power used by Presidential Candidates in 2008.

When Texas Governor and presidential hopeful Rick Perry told Iowan voters in early November, “I happen to think Wall Street and Washington, D.C., have been in bed together way too long,” it made headlines for Reuters and ABC . But that’s not news; that’s advertising. News, according to Sir Harold Evans, is what somebody somewhere wants to suppress. News Flash: The average member of Congress who voted in favor of the 2008 Bank Bailout received 51 percent more campaign money from Wall Street than those who voted no – Republicans and Democrats alike. That’s according to research by Center for Responsive Politics and was reported as news by the OpenSecrets.org blog on September 29, 2008.

In other news fit to be suppressed, the Federal Reserve "provided more than $16 trillion in total financial assistance to some of the largest financial institutions and corporations in the United States and throughout the world." This was revealed in an audit of the Federal Reserve released in July 2011 by the Government Accountability Office. All the goods and services produced in the United States in the last twelve months are worth about $14 trillion – Ben Bernanke and Timothy Geithner spent more than that to bailout Wall Street in twelve months! This is news, news that Bloomberg and Fox Business Network had to file lawsuits to get access to and that Bernanke and Geithner want to suppress.

The answer to the differences in the value of the bailouts – it was “only $1.2 trillion” according to Bernanke – can be found in the GAO’s audits.  The latest audit of the TARP, released November 10, 2011 makes it clear: “In valuing TARP …, [Office of Financial Stability] management considered and selected assumptions and data that it believed provided a reasonable basis for the estimated subsidy costs …. However, these assumptions and estimates are inherently subject to substantial uncertainty arising from the likelihood of future changes in general economic, regulatory, and market conditions.” [emphasis added]. TARP is under Treasury – which is run by Geithner – and is headed up by Timothy Massad, formerly of Cravath, Swaine & Moore LLP in New York …[still following this?]…, who represents Goldman Sachs, Morgan Stanley, etc. as underwriters for (among other things) European public debt. Cravath, Swaine & Moore advised Citigroup on their repayment of TARP funds and Merrill Lynch in their orchestrated takeover by Bank of America.

The dispute about the cost of the bailout is not the stuff of conspiracy theories. This is basic finance and economics,  not accounting. In accounting, debits and credits balance at the end of the day; in finance, you get to assume rates of return, costs of capital, etc., etc. – a lot of stuff that has much room for judgment. It is in the area of judgment that Bernanke and Geithner are able to make their numbers look smaller than those added up by Bloomberg and Fox. The GAO, on the other hand, should have no dog in this fight and therefore should (we live and hope) give us the right stuff to work with. GAO says (in a nice way) that Geithner has been fiddling with the numbers.

The GAO had been recommending to Congress that they get audit authority over the Federal Reserve System at least since 1973. They finally got that authority in the Wall Street Reform Act of 2010 – about the only piece of that legislation that has so far resulted in anything of substance. The Center for Responsive politics also did an analysis of the campaign contributions for Senators who opposed the financial regulatory reform bill in 2010. Those opposing the reforms got 65 percent more money from Wall Street banks than those voting for the bill.

For politicians, it doesn’t matter who votes for them. They will figure out what they need to say to get the money to get the votes to get elected. What they need most – and what makes them Wall Streetwalkers – is the money. The big donors don’t care who they give to, as long as the one they give to gets elected. According to Federal Election Commission data, Warren Buffett gives money almost exclusively to Democrats; Donald Trump likes to spread it around between the parties, as do Goldman Sachs employees. But that’s only the money that can be traced back to a source, unlike the opaque donations given to PACs and SuperPACs.

The revolving door between Wall Street and Washington swings both ways. When John Corzine departed Goldman Sachs he left Hank Paulson in charge in 1999. Investment Dealers’ Digest reported that Corzine left Goldman “against a backdrop of fixed-income trading losses.” Corzine won a Senate seat in 2000 (D-NJ).  He was then elected Governor of New Jersey in November 2005, where he put forth Bradley Abelow for state Treasurer. Abelow worked with Corzine at Goldman and was a former Board member at the Depository Trust and Clearing Corporation, the world’s largest self-regulatory financial institution. Together, Corzine and Abelow later went on to run MF Global into bankruptcy. Both have been invited back to Washington, the first time a former Congressman has been called to testify before a Congressional Committee. Wherever they get started, Washington and Wall Street tend to end up in bed together.

It’s this kind of knowledge that makes me question why I should vote at all. Congressmen from both parties are generally for sale. Even with self-described liberals in Congress, right-wing conservatives could get approval for everything they want – free-for-all-banking and the US military engaged in active combat.  It’s the taxpayers – the mothers, fathers and families of service men – who suffer. Sure, Barack Obama took more money from Wall Street than John McCain – but it was only $2 million more, hardly enough to run one ad campaign in a big state.

Then I pause and remember what my mentor, Rose Kaufman, from the League of Women Voters of Santa Monica told me: if you don’t vote, you open the door for someone to take away your right to vote.  The benefit of living in a democracy with freedom of the press is that you can find out all those things that Washington and Wall Street “want to suppress.” Whether or not we have good choices among the presidential candidates, we have choices.  It’s better than nothing.

Susanne Trimbath, Ph.D. is CEO and Chief Economist of STP Advisory Services. Her training in finance and economics began with editing briefing documents for the Economic Research Department of the Federal Reserve Bank of San Francisco. She worked in operations at depository trust and clearing corporations in San Francisco and New York, including Depository Trust Company, a subsidiary of DTCC; formerly, she was a Senior Research Economist studying capital markets at the Milken Institute. Her PhD in economics is from New York University. In addition to teaching economics and finance at New York University and University of Southern California (Marshall School of Business), Trimbath is co-author of Beyond Junk Bonds: Expanding High Yield Markets. She participated in an Infrastructure Index Project Workshop Series throughout 2010.

Follow Susanne on Twitter @SusanneTrimbath

Photo by Kay Chernush for the U.S. State Department

Central Florida: On the Cusp of Recovery?

$
0
0

Central Florida is poised at the cusp of a major turnaround, and its response to this condition will either propel the region forward, or drag it backward.  This cusp condition is brought about by a train and a road; neither of which have begun yet but both of which appear imminent.  Sunrail uses existing 19th century railroad tracks as a commuter spine through Orlando’s disperse, multipolar city.  The Wekiva Parkway completes a beltway around Orlando, placing it with Washington DC, Houston and other ringed cities.  Before either gets built, the region deserves some analysis on their combined effect, and how they can be nudged onto a pathway to make the region better.

Sunrail brings with it mythology  about how trains affect cities.  In what has now become the standard, tired kabuki dance between developer interests and municipal ones.

Not surprisingly, heavy regulation has entered the scene, with the avowed goal of creating dense urban pockets along even largely rural  train stops. This has sparked rising property values which may end up  frustrating the dream of transit-oriented development (TOD).  Affordable dwellings and meaningful employment within a half-mile of a train stop must be created in order to make this development work, but unless Central Florida can spark this, the new train will likely suffer from the same fate as the vast majority of its sunbelt counterparts:  low ridership and increasing tax subsidies.

Inserting TOD into 17 locations in Central Florida is a bold experiment. In order for it to work, the rising costs of housing will need to be addressed, and Central Florida can take advantage of this ambition to succeed.  Orlando home sales are coming back, thanks to the mild climate and desirable lifestyle. That is very different, however, from guaranteeing that the economics of the rail commuter will make it worth discarding the single-family detached American Dream in favor of a relatively new model that has an unproven track record.

Orlando also seems to be blithely going about the business of creating another ring of traffic around itself, descending into the same level where Atlanta’s Perimeter, the DC Beltway, and other like-kind roads live.  The Wekiva Parkway, long considered unneeded, is now being designed to complete the ring around Orlando, and will cross 25 miles of pristine wetlands that is a vestige of once-vast water resources of the region. 

The Expressway Authority proposes this ring as an alternative to existing roads to serve the “growth needs of this area,” it conceded recently that this road segment made little economic sense except as a toll road accessing a new suburban single-family home development carved out of the swamps by one of the Governor’s chief fundraisers .  The asset value of this ring road may be more private than in the public interest.

Traditionally agricultural land interlaced with wetlands, The Wekiva area to the northwest of Orlando has avoided large-scale Florida style bulldozing.  All this will change if the Governor is successful in eliminating water management regulations , freeing up much of Florida, including this corner of Orlando, for speculation.

The local press, quick to criticize Alaska’s Bridge to Nowhere and always ready to jump on environmental issues, meekly ponders  the need for this $2 billion highway.  Maybe the elevated design, intended to be more ecologically friendly, makes it OK, despite the safety problems and high maintenance associated with this design.  Florida’s history is littered with the drawings of many other elevated highways eventually built on grade to save cost.  Once approved, the Wekiva Parkway may quickly be brought down to earth as well, displacing wetlands and agricultural land.

The Wekiva Parkway will open up land supply which indeed will allow for more growth.  Done right, the asphalt will make land available that could be useful to the area’s economy.  It will bring traffic to historic, but presently lonely Sanford, potentially infusing the economy of this once-vibrant rail town.  Using principles of scarcity, land values could reflect people’s high desire to live in rural areas with all the services and guarantees that 21st century suburban life offers: fire and police protection, state-of-the-art infrastructure, and free pizza delivery.  It could invigorate neighboring towns that are currently struggling for survival.

The risk is that such a road will simply allow more investment into Florida real estate without giving Florida much back in exchange.  Florida, already strained to meet its current population needs, should not simply trade another commercial strip for water resources that benefit many species and contribute to the region’s resilience. Rather, development models should emulate the best of America’s conservation development happening in states where water rights are scarce.  Connecting local employers with residential areas will enhance the value of both, and strategically keeping rural agricultural areas intact will preserve the region’s present land use diversity.

Well managed development that conserves resources and balances broader needs with private interests will elevate the state’s prospects at this critical juncture.  One more bit of the original subtropical wilderness represents an asset for both present and future generations. With the right approach, the Wekiva Parkway can provide an enlightened model of low-density development that respects the value of open space.

In town, Sunrail presents denser development as an alternative.  The normal pathway, however, seems to pit the profit-seeking real estate developer against ever higher regulatory burdens, which eventually make his product unaffordable to those coming here to escape high costs and regulations in other cities.  Keeping both employment and housing affordable are critical to achieving success with any of these projects.

Moving product down the value chaindoes not do well current system, which leaves out the very people who Sunrail supposedly will benefit.  Density is one of those characteristics that seems to be about good timing: if you have it today, like San Francisco or New York, this is largely the result of history;  if you do not have it today, like Orlando, it is risky and probably a dubious proposition.

The road and the train open up land that must be carefully stewarded to create opportunities for meaningful employment and affordable housing, both of which are presently scarce commodities.  The concept of transit-oriented development needs a success story, and Sunrail provides 17 opportunities to find one; meanwhile, the road presents a danger as well as an opportunity for Florida’s wetlands.  As the region slowly recovers from the recession, the two projects together should be carefully considered by the region’s citizens and leadership to truly redefine Central Florida’s identity for the 21st century.

Richard Reep is an Architect and artist living in Winter Park, Florida. His practice has centered around hospitality-driven mixed use, and has contributed in various capacities to urban mixed-use projects, both nationally and internationally, for the last 25 years.

Photo courtesy of BigStockPhoto.com.

The Driving Decline: Not a "Sea Change"

$
0
0

The latest figures from the United States Department of Transportation indicate that driving volumes remain depressed. In the 12 months ended in September 2011, driving was 1.1 percent below the same  period five years ago. Since 2006, the year that employment peaked, driving has remained fairly steady, rising in two years (the peak was 2007) and falling in three years. At the same time, the population has grown by approximately four percent. As a result, the driving per household has fallen by approximately five percent.

There are likely a number of reasons for the driving decline, some of which are described below.

Democratization of Mobility: The leveling off of driving is something analysts have expected for some time. More than ten years ago, Alan Pisarski noted that drivers licenses and automobility had saturated the market among the While-non-Hispanic population. For decades, driving had been increasing at a substantially faster rate than the population, as driving rates for women and minorities converged  upon the rate of White-non-Hispanic males.

Clearly, the continued, extraordinary increase in driving of recent decades could not be expected to continue, since nearly all were already driving. Pisarski called this the "democratization of mobility" in a 1999 paper. At that time only African-Americans and Hispanics were still behind the curve. The recent economic difficulties have slowed the progress toward equal automobility for minorities. In 2009, American Community Survey data indicates that the share of Hispanic households without access to a car remained 40 percent above White-non-Hispanic Whites. The rate of African-American no-car households was 20 percent above that of White-non-Hispanics. The driving decline reflects in large part the failure of the economy to produce equal mobility opportunities for minority households.

Higher Gasoline Prices and the Middle Class Squeeze: One of the most important factors has to be the unprecedented increase in gasoline prices. Over the past decade, gasoline prices have doubled (adjusted for inflation) and have remained persistently high. It has worsened in the last five years, with prices having risen more rapidly than in any period relative to the previous decade in the 80 years for which there are records. This has taken a huge toll on households. At average driving rates, budgets have increased by nearly $1,800 annually to pay for the higher gasoline prices. In a time (2000-2010) that median household incomes declined $3,700 (inflation adjusted), it is not surprising that people are driving less.

Unemployment: Not Driving to Work: Today's higher unemployment means that fewer people are driving to work. Employment peaked in 2006. Assuming average work trip travel distances, the smaller number of people working now would reduce travel per household by more than one percent (one-fifth of the household reduction).

Shopping Less Frequently due to Higher Gasoline Prices: According to the Nationwide Household and Transportation Survey (2009), the average household makes 468 shopping trips annually. If shopping trips were reduced by one quarter in response to higher gasoline prices, the reduction in travel per household would be enough, along with the work trip reductions, to account for all of the decline over the past five years.

Information Technology: Not Driving and Telecommuting Instead: Again, advances in information technology appear to have also added to the decline. Even while employment was falling, working at home (mainly telecommuting) increased almost 10 percent between 2006 and 2010 (latest data available) and telecommuting added six times as many commuters as transit. Working at home eliminates the work trip and is thus the most sustainable mode of access to employment. In just four years, in working at home removed as much automobile travel to work as occurs every day in the Salt Lake City metropolitan area.

More Information Technology: Not Driving and Texting Instead? Adie Tomer at the Brookings Institution notes a decline in the share of people 19 years and under who have drivers licenses as potentially contributing to the trend. She cites University of Michigan research by Michael Sivak and Brandon Schoettle, who documented the decline. Sivak told The Michigan Daily that "a major reason for the trend is the shift toward electronic communication among America’s youth, reducing the need for 'actual contact among young people.'"

Still More Information Technology: Not Driving and Shopping On-Line Instead? And, as with electronic communication and telecommuting, there is also an information technology angle to shopping. The substantial increase in on-line shopping could be reducing shopping trips.

Not Making Intercity Trips? All of the loss in driving has been in rural areas, rather than urban areas. Since the employment peak in 2006, urban driving has increased 0.4 percent (though driving per household has decreased). By comparison, rural driving has declined 6.0 percent (Note). This much larger rural driving decline could be an indication that people have reduced discretionary travel, such as longer trips that extend beyond the fringes of urban areas (Figure). As with transit, however, it would be a mistake to characterize Amtrak as having attracted much of the reduced rural travel (or for that matter from airlines, see If Wishes were Iron Horses: Amtrak Gaining Airline Riders?). Over the period, Amtrak's gain (passenger mile) has been approximately one percent of the rural loss.

Not Driving and not Transferring to Transit: Transit ridership trends have been generally positive over the past decade. Since 2006, transit ridership has risen 3.4 percent. This compares to the 1.1 percent decline in automobile use. However, it would be incorrect to assume attraction to transit as contributing materially to the decline in driving. Because transit has such a small market, even this healthy increase has budged its urban market share (now approximately 1.7 percent) up by barely 0.5 percentage points.

Besides scale, there is another reason transit has not been the beneficiary of the driving reduction. Automobile competitive transit service is simply not accessible for most trips. For example, it is estimated that less than four percent of metropolitan jobs can be reached in 30 minutes by transit for the average metropolitan area resident. This compares to the more than 65 percent of automobile commuters who do reach their jobs in 30 minutes or less. In short, transit is not an alternative to the car for the vast majority of urban trips.

It does no good to suggest this can be materially improved by increasing transit service. The most lucrative transit markets are already served, and new ones would be more expensive. This is illustrated by the exorbitant cost of adding ridership. Over the most recent decade, transit ridership increased 21 percent, which required an expenditure increase of 59 percent, nearly three times as much.

Decentralization of Jobs and Residences: The 2010 census indicated that the American households continue to decentralize, increasingly choosing to live in single-family detached houses in the suburbs. The same trend has been occurring in employment locations, as Brookings Institution research indicates. Between 1998 and 2006, less than one percent of new employment was located within three miles of urban cores. Nearly 70 percent of the new jobs decentralized to outer suburban rings.

The continuing dispersion of jobs and residences could dampen the increase rate of driving in the years to come, as households have greater opportunities to live in the suburban surroundings they prefer, while also commuting to the more proximate jobs that have moved to the suburbs.

The Decline in Context: Among the potential causes, certainly the most important is the economic situation,with steeply declining household incomes and the worst economic situation since the 1930s. The longer term driving trends will be more apparent when (and if) prosperity restores healthy growth in employment. Moreover, with only a small part of travel being attracted to transit, a more significant shift could involve substitution of access by information technology (on-line). Even with the decline, however, there has been nothing like a "sea change" in how the nation travels.

Note: The data on driving is estimated from Federal Highway Administration (FHWA) reports. FHWA produces monthly preliminary estimates, which are subsequently adjusted in annual reports.

Wendell Cox is a Visiting Professor, Conservatoire National des Arts et Metiers, Paris and the author of “War on the Dream: How Anti-Sprawl Policy Threatens the Quality of Life

Photograph: Harbor Freeway, Los Angeles


New Geography's Most Popular Stories of 2011

$
0
0

As our third full calendar year at New Geography comes to a close, here’s a look at the ten most popular stories in 2011. It’s been another year of steady growth in readership and reach for the site.  Thanks for reading and happy new year.

10.  The Other China: Life on the Streets, A Photo Essay Argentinean architect and photographer Nicolas Marino offers a set of stunning photographs from the streets of Chengdu and Shanghai.

9.  Six Adults and One Child in China Emma Chen and Wendell Cox outline the rising numbers of elderly and increasing age dependency ratios in China and across the globe.  Chen and Cox outline a number of solutions, including “extending work and careers into the 70s; means tested benefits; greater incentives for having children; and measures to keep housing more affordable and family friendly,” but conclude “the ultimate issue will be maintaining economic growth.”

8.  The Texas Story is Real Aaron Renn takes a look at a number of broad-based economic measures of Texas over the past decade. He finds that “While every statistic isn't a winner for Texas, most of them are, notably on the jobs front. And if nothing else, it does not appear that Texas purchased job growth at the expense of job quality, at least not at the aggregate level.”

7.  Let’s Face it High Speed Rail is Dead and Obama’s High Speed Rail Obsession Aaron Renn and Joel Kotkin look at high speed rail in America from two angles, Renn from the practical and Kotkin from the political.  According to Renn: “In short, it’s time to stop pretending we are going to get a massive nationwide HSR rail network any time soon.  Advocates should instead focus on building a serious system in a demonstration corridor that can built credibility for American high speed rail, then built incrementally from there.” Kotkin’s piece also appeared at Forbes.com.

6.  America’s Biggest Brain Magnets Joel Kotkin and Wendell Cox use American Community Survey data to estimate the biggest gainers of bachelor’s degree holders in U.S. regions.  The big winners:  New Orleans, Raleigh, Austin, Nashville, and Kansas City. This piece also appeared at Forbes.com.

5.  The Next Boom Towns in the U.S. Joel Kotkin examines the U.S. regions most primed for future growth, based on my analysis of six forward-looking metrics.  “People create economies and they tend to vote with their feet when they choose to locate their families as well as their businesses.  This will prove   more decisive in shaping future growth than the hip imagery and big city-oriented PR flackery that dominate media coverage of America’s changing regions.” The piece also appeared at Forbes.com.

4.  The Decline and Fall of the French Language Gary Girod wonders if the French language is declining in worldwide significance.

3.  Census 2010 Offers a Portrait of America in Transition Aaron Renn’s summary of this spring’s new Census 2010 results includes eight county and metropolitan area level maps showing population change and shifts in racial group concentrations.

2.  The Golden State is Crumbling In this piece, also appearing at The Daily Beast, Joel Kotkin blames California’s stagnancy on self-imposed policy decisions.  While the state has many assets and is rich in promise “the state will never return until the success of the current crop of puerile billionaires can be extended to enrich the wider citizenry. Until the current regime is toppled, California's decline—in moral as well as economic terms—will continue, to the consternation of those of us who embraced it as our home for so many years.”

1.  Best Cities for Jobs 2011 Our best cities rankings measure one thing: job growth.  This purposefully simple approach leaves out other less tangible measures of such as quality of life or other amenity indicators, leaving you with a tool to use creating policy for your region.

The U.S. Needs to Look Inward to Solve Its Economy

$
0
0

Over the past months as the global economy heads for another recession, U.S. lawmakers have done their best to deflect blame by focusing on various external forces including the most popular straw-man of the day: China’s currency.

Almost every year for the last few years, Congress and the White House have pressed China to revalue its currency, the renminbi. And every time this happens, China responds that it will do what it always does: let it appreciate gradually, at about 5% per year as it has done for the last several years.

With the APEC Summit in Honolulu last month, Obama and the White House strategically --- and perhaps with an eye to the coming re-election campaign ---prodded at China and also managed to further deflect America’s problems by focusing attention on the Eurozone Crisis. Timothy Geithner, tailoring his speech for the Asia-Pacific audience, said Europe needs to “move quickly as instability hurts the U.S. and Asia.”

Geithner, the godfather of “too big to fail” from his days at the New York Fed, is an expert at delivering economic policy speeches that do not address America’s problems head-on. He is the mouthpiece of American weakness and misdirection, and has been recently seen so not only in China, but in Europe where people scoff, understandably, at the very idea of his giving advice to the bedraggled Eurozone.

The fact is that, right now, the US cannot dictate the conditions of economic gain. Although still the world’s largest economy by far, the US can no longer impose its mantra of ‘free-trade’ on the rest of the world.  Instead it needs to take an honest look at the reality of the 21st Century global marketplace to better assess what it can do to improve its situation. The following suggestions might be a good start:

Forget About Economic and Political Ideologies

Many Americans, including politicians, are under the impression that certain ‘isms’ are magic bullets for prosperity while other ‘isms’ hold prosperity back. For instance, conservatives like to use the talking point that ‘socialism’ will destroy America. Similarly, many of those on the left protest against as what they see as ‘capitalism’ leading to widening inequality. Being for or against a particular ‘ism’ does nothing to improve the economic situation but only serves to inflame rhetoric and kill policies that could potentially help the U.S. economy.

One example is domestic government investment. Conservatives detest any kind of public spending proposal as ‘socialism’, even if public funds would be used for practical things like improving roads or public schools. On the other side, those on the left confuse high-level collusion between the financial sector and federal government with free-enterprise, which it is not.  Geitner is not a capitalist, but a collusionist. He is no more a free-market capitalist than he is a Maoist.

Stop Blaming China

Nothing else debunks the validity of mainstream political and economic ideologies better than China’s rise to economic prominence. Still considered a ‘communist’ state by Cold-War minded individuals, China’s development would be best described as a gradual evolution in policy decisions rather than a static, ideologically-based approach. To be sure, the Communist Party desire to stay in power remains paramount. But this leads to policies designed to keep the economic engine humming as a way to maximize social stability.

Despite its advances, China still has tremendous obstacles to overcome including a still very low per-capita GDP and an environment polluted from industrial development. Yet it is the height of hypocrisy for the U.S. government to call out China on its currency manipulation and intellectual property theft when U.S. companies have benefited enormously from China’s opening up of the past three decades. This also has allowed U.S. consumers buy coveted products at low prices.

Of course, politicians at the Federal level (and even some Republican Presidential candidates) talk tough on China to score brownie points with voters. But meanwhile local state and city governments as well as prominent business leaders continue to send delegations to China in droves to promote cooperation and trade. Yes, China’s competitive cost of labor and lack of regulations has had a direct impact on the loss of jobs in the U.S. Unfortunately forcing China to float its currency will not reverse this trend as manufacturing jobs move to lower cost locales, and will continue to do so, perhaps to other countries.

Acknowledge That Not All Regulation Is Created Equally

Conservatives love to point the blame for economic malaise on government regulation. This argument is only half correct. For one thing there is not enough regulation on large banks in terms of how they divert investments when huge recent profits can be traced largely to fiscal largesse from Washington. Large banks received huge stimulus injections from the Federal Reserve during QE I and II, but did not invest enough of that money into the domestic economy. Instead, investment banks were free to take that money wherever maximum returns were to be had. That’s fine for an investor who has made his own way, but when the bank profits have stemmed from taxpayer largesse, some other priorities should creep in.

At the state and local municipal levels, regulation is perhaps the greatest roadblock to restoring economic prosperity. Crippling state and local taxes, along with outdated zoning regulations – such as restrictions on something as simple as running a business from one’s own home – slow enterprise formation. This is not to mention the cost of obtaining permits from various authorities and the constant threat of lawsuits. Clearly the pendulum – at least in some states such as California – has swung too far in the wrong direction. Unfortunately, given ubiquitous budget shortfalls across state and local levels, it is unlikely that local governments will be willing to decrease taxes and fees when they are in desperate need of revenue generation.

Reassess the American Social Contract

Conservatives balk at any mention of social programs, yet they fail to acknowledge that American corporate institutions no longer play the role they once did in promoting social stability. Across the board, businesses are understandably cutting retirement and healthcare benefits just in order to survive. America’s broken social contract is perhaps the greatest obstacle to restoring prosperity and economic growth.

Politicians are under the impression that high-taxes and runaway government spending are the primary cause for economic malaise. The reality is that America’s economy lags because individual spending is paralyzed due to increased costs of living across the board. The costs of housing, healthcare, and higher education have all increased in the past 10 years while wages and job opportunities have stagnated. This paralyzes risk-taking and investment in new businesses. Not only that, the presence of large oligopolies in everything from high-tech and cellular phones to food processing work to reduce competition from  entrepreneurial upstarts.

Conclusion

The U.S. needs to stop looking at external factors as the source of its problems. Instead, American leaders should look inwards and take an honest assessment of the current problems resulting from the changes in the world over the past 20 years.

Unfortunately, no one on either side of the political aisle seems willing to step forward and lead the country out of its predicament. The Republican presidential contenders continue to waste time bickering about irrelevant social issues while President Obama jet sets around the world trying to allay doubts about the country’s decline.

America needs a concrete plan to get up and running again. This will mean more regulation at the macro level and less regulation at the lower levels. It will mean that Americans need to be confident that basic needs like housing and healthcare are taken care of so they can get on with starting businesses and creating employment. Education needs to promote trade skills and remove the stigma that expensive college degrees are mandatory for future prosperity.

Until these things happen, the U.S. economy will be stuck in its rut.

Adam Nathaniel Mayer is an American architectural design professional currently living in China. In addition to his job designing buildings he writes the China Urban Development Blog.

Photo courtesy of Bigstockphoto.com

.

The Shifting Landscape of Diversity in Metro America

$
0
0

Census 2010 gave the detail behind what we’ve known for some time: America is becoming an increasingly diverse place.  Not only has the number of minorities simply grown nationally, but the distribution of them among America’s cities has changed. Not all of the growth was evenly spread or did it occur only in traditional ethnic hubs or large, historically diverse cities.

To illustrate this, I created maps of U.S. metro areas showing their change in location quotient. Location quotient (LQ) measures the concentration of something in a local area relative to its concentration nationally. This is commonly used for identifying economic clusters, such as by comparing the percentage of employment in a particular industry locally vs. its overall national percentage. In a location quotient, a value of 1.0 indicates a concentration exactly equal to the US average, a value greater than 1.0 indicates a concentration greater than the US average, and a value less than 1.0 indicates a concentration less than the US average.

While commonly used for economic analysis, the math works for many other things. It can be useful to measure how the concentration of particular values changes over time relative to the national average.  In this case, we will examine the change in LQ for various ethnic groups between the 2000 and 2010 censuses for metro areas. Those metro areas with a positive change in LQ grew more concentrated in that ethnic group compared to the US average over the last decade. Those with a negative change in LQ grew less concentrated compared to the nation as a whole, even if they grew total population in that ethnic group.

To increase concentration level requires growing at a faster percentage than the US as a whole. This is obviously easier for places that start from a low base than those with a high base. In this light, places that have traditionally been ethnic hubs – such as west coast metros for Asians – can grow less concentrated relative to the nation as a whole even if they continue to add a particular ethnic group. Asian population, for example, can grow strongly in California, but at a slower rate than the rest of the country. This is indeed the case as groups like Hispanics and Asians have been de-concentrating from the west coast, and now are showing up in material numbers even in the Heartland.

Black Population


Black Only Population, Change in Location Quotient 2000-2010

The change in Black concentration is particularly revealing. Much has been written about the so-called reversing of the Great Migration. But contrary to media reports, there is no clear monolithic move from North to South. Instead, we see that the outflow has been disproportionately from America’s large tier one metros like New York, Chicago, and Los Angeles. In contrast, Northern cities like Indianapolis, Columbus, and even Minneapolis-St. Paul (home to a large African immigrant community) grew Black population strongly, and actually increased their Black concentrations. Similarly, there were clearly preferred metro destinations in South for Blacks, like Atlanta and Charlotte. Many other Southern metros , particularly those along the Atlantic coast of Georgia and the Carolinas continued to lose their appeal to Blacks, relatively speaking.

Hispanic Population


Hispanic Population (of any race), Change in Location Quotient 2000-2010

Here we see de-concentration clearly in action. The Mexican border regions retained high Hispanic population counts, but they are no longer as dominant as in the past. Places like Nashville, Oklahoma City, and Charlotte particularly stand out for increasing Hispanic population percentage. Again, large traditionally diverse tier one cities like New York and Chicago show declines on this measure as smaller cities are now more in on the diversity game.

Asian Population


Asian Only Population, Change in Location Quotient 2000-2010

Again, we see here that America’s Asian population spread well beyond traditional west coast bastions. There were big increases in Asian population counts, with resulting LQ changes, in places like Atlanta, Indianapolis, Philadelphia, and Boston. Even New York (which now has over one million Asian residents within the city limits alone) and Chicago showed gains among Asians.

Children (Population Under Age 18)

As a bonus, here is a look at LQ change for metro areas for people under the age of 18.


Children (Population Under Age 18), Change in Location Quotient 2000-2010

Here we see that metros along America’s northern tier now have relatively fewer children than a decade ago, while metros like Denver, Dallas, and Nashville had more. Clearly, some places are increasingly seen as better – and perhaps also more affordable – locations for child rearing than others.  Perhaps unsurprisingly many of the out of favor locales are either expensive, have poor economic prospects, and/or are excessively cold. Not surprisingly, for example, Atlanta, Houston and Florida’s west coast have gained in this demographic while much of the Northeast, particularly upstate New York, have lost out.

The overall key is while there are certain broad themes that emerge from the recent Census, such as America’s increasing diversity or signs of a reversing of the Great Migration, we need to take a more fine grained view to see which places are in fact benefitting and being hurt by these trends.  What we see here is that traditional large urban bastions of black population and ethnic diversity are no longer the only game in town. Smaller places in the interior and the South are now emerging as diversity magnets in their own right, as well as magnets for families with children. This is the collection of places to watch to look for the next set of great American cities to emerge.

Aaron M. Renn is an independent writer on urban affairs based in the Midwest. His writings appear at The Urbanophile, where this piece originally appeared. Telestrian was used to analyze data and to create maps for this piece.

The U.S. Economy: Regions To Watch In 2012

$
0
0

In an election year, politics dominates the news, but economics continue to shape people’s lives. Looking ahead to 2012 and beyond, it is clear that the United States is essentially made up of many economies, each with distinctly different short- and long-term prospects. We have highlighted the five regions that are most poised to flourish and help boost the national economy.

Our list assumes that we will be living in a post-stimulus environment. Even if President Obama is re-elected, it will largely be the result of the unattractive nature of his opposition as opposed to his economic policies. And given it is unlikely the Democrats will regain the House — and they could still lose the Senate — we are unlikely to see anything like the massive spending associated with Obama’s first two years in office.

Clearly the stimulus helped prop up certain regions, such as New York City, Washington and various university towns, which benefited from the financial bailout, lax fiscal discipline and grants to research institutions. But in the foreseeable future, fundamental economic competitiveness will be more important. Global market forces will prove more decisive than grand academic visions.

With that in mind, here are our five regions to watch in 2012.

1. The Energy Belt. Even if Europe falls into recession, demand from China and other developing countries, as well as threats from Iran to cut off the Persian Gulf, will keep energy prices high. While this is bad news for millions of consumers, it could be a great boon to a host of energy-rich regions, particularly in Texas, Oklahoma, the Dakotas, Montana, Louisiana and Wyoming. New technologies that allow for greater production require higher prices than more conventional methods — roughly $70 a barrel — and most experts expect prices to stay above $100 for the next year.

Goldman Sachs recently predicted that the U.S. will become the world’s largest oil producer by 2017. The bounty is so great that the key energy-producing states have consistently out-performed the national average in terms of job and income growth. Houston, the nation’s energy capital, has enjoyed the fastest growth in per-capita income in the past decade. No reason to expect this to slow down much this year.

Energy growth, notes Bill Gilmer, senior economist at the Federal Reserve Bank of Dallas, also sparks “upstream” expansion in a host of other industries, such as chemicals and plastics. Massive new expansions to serve the industry are being planned not only in Texas and Louisiana but in former rust belt states, including now gas-rich Ohio. The big exception is oil-rich California, which seems determined to keep its fossil fuels — and the growth they could drive — out of mind and underground.

2. The Agricultural Heartland. You don’t have to have oil or gas to enjoy a strong economy. Omaha, Neb., is not in the energy belt, but its strong agriculture-based economy keeps its unemployment rate well under 5%. Demand from developing countries — especially China, which is expected to supplant Canada as our No. 1 agricultural market — should boost the nation’s farm income to a record $341 billion.

Most of the increased product demand lies in commodities like soybeans, corn, barley, rice and cotton. Contrary to the assumptions of East Coast magazines such as The Atlantic, which paint a picture of a devastated and dumb rural America, places like Iowa are doing very well indeed and are likely to continue doing so. Urban economies like Des Moines are also benefiting and expanding into finance and other non-farm related activities. The once massive out-migration from the region has slowed to something like a balance, with increasingly strong in-migration from places like Illinois and California.

3. The New Foundry. The revival of Great Lakes manufacturing is one of the heartening stories of the past year, but the biggest beneficiaries of American manufacturing’s revival will likely be in the Southeast and along the Texas corridor connected to Mexico. Future big growth will not come from bailed-out General Motors or Chrysler, with their legacy costs and still-struggling quality issues, but from foreign makers — Japanese, German and increasingly Korean — that build highly rated, energy-efficient vehicles. These countries are not just investing in cars; they also have placed steel mills and aerospace facilities in the rising south-facing foundry.

Foreign companies have good reasons to look to an expanded U.S. base: aging domestic markets, diminishing workforces and a growing concern over China’s tendency to steal technology and favor state-owned firms. This shift from domestic production has been building for years, in large part due to familiar reasons of less unionization and lower business costs. Of the ten foreign auto assembly plants opened or announced between 1997 and 2008, eight were in Southern right-to-work states. As the recovery has taken hold, new expansions are being announced. In 2011 Toyota opened a new plant in the tiny hamlet of Blue Springs, Miss., just 17 miles from Elvis’ hometown of Tupelo, while Mercedes-Benz announced  $350 million to add capacity to its plant just outside of Tuscaloosa.

4. The Technosphere. Silicon Valley, as well as the Boston area, has thrived under the stimulus, and worldwide demand for technology products will continue to spark some growth in those areas. Over the past year, San Jose-Silicon Valley, Boston and Seattle all stood in the top five in job creation among the country’s 32 largest metro areas. The coming IPO for Facebook and other Valley companies may heighten the tech sector’s already smug sense of well-being.

Unfortunately for the rest of California, and even more blue-collar Bay Area communities like San Jose and Oakland, high costs and an unfavorable regulatory environment will keep this bubble geographically constrained. Historic patterns, particularly over the past decade, suggest that as the core tech companies expand, they are likely to head  to business-friendly places such as  Salt Lake City, Raleigh and Columbus, Ohio, which have picked up both tech companies and educated migrants from California.

5. The Pacific Northwest. This is one blue region in the country with excellent prospects. For one thing, both Washington and Oregon enjoy considerable in-migration, in sharp contrast to New York, California and Illinois. They also have a more varied economy than Silicon Valley, with strong companies connected to retail (Amazon, Costco and Starbucks), aerospace (Boeing) and software (Microsoft).

The Seattle region, home to all these companies,  is the real standout. It ranked first on our recent list of technology regions and third in industrial manufacturing, a trend likely to continue as Boeing expands production of its new 787 Dreamliner. The business climate and the housing costs are somewhat challenging, but more favorable than in California. The Bay Area and Los Angeles continue to send large numbers of migrants to the Puget Sound region. Over the long term, the area also benefits from possessing ample cheap renewable energy (mostly hydro) and water, which are both  in short supply elsewhere.

These scenarios, of course, could be changed by either world events — such as an unexpected crash in the Chinese economy — or a stunning Democratic sweep in 2012 that would occasion another round of Obamaian stimulus and ever more heavy-handed regulation. Yet barring such developments, expect the back to basics economy to continue enriching these regions best positioned to take advantage of it.

This piece also appeared at Forbes.com.

Joel Kotkin is executive editor of NewGeography.com and is a distinguished presidential fellow in urban futures at Chapman University, and contributing editor to the City Journal in New York. He is author of The City: A Global History. His newest book is The Next Hundred Million: America in 2050, released in February, 2010.

Photo by BigStockPhoto.com.

California's Deficit: The Jerry Brown and 'Think Long' Debate

$
0
0

California has three major problems: persistent high unemployment, persistent deficits, and persistently volatile state revenues. Unfortunately, the only one of these that gets any attention is the persistent deficit. It is even more unfortunate that many of the proposals to reduce the deficits are likely to make all three of the problems worse over the long run.

Two major proposals to deal with the deficit will shape the coming debate. One is from the newly formed Think Long for California Committee; the other from the governor.

Governor Jerry Brown’s plan would increase sales taxes, and would increase the tax rate on the portion of anyone’s income that is over $250,000 (the marginal rate). It is a general rule of tax analysis that if you want there to be less of something, tax it. Indeed, this proposal would result in some wealthier people leaving California, and it would accelerate the trend of substituting internet retail purchases for local retail purchases.

It would also increase California's tax receipt volatility. California's tax base is dependent on the income of a relatively small group of wealthy people. It turns out that this income is more volatile than the economy. Increasing top marginal tax rates would only increase the volatility of the state’s revenue.

So, why would the governor make such a silly proposal? I've heard a few reasons.

• The government is starving and it needs the income now.

This is nonsense. Combined national, state, and local government spending is now over 35 percent of gross product. This is highest it has ever been, including the peak spending years of World War II.

We can disagree on the optimal size of government, but to argue that this is a time of scarce government spending is absurd.

• The wealthy have too much money. We must increase the progressivity of California's tax code.

The governor's proposal will do that. If implemented, the plan will give California the highest marginal tax rates in the United States. The problem is that people with high incomes often have more choices than most of us. They can move. They can reallocate earnings to other states or into less-taxed activities. They can just forego earnings if the return is too low.

Most analysts agree that California's tax structure should be broader based. The only way to do that is to make the system less progressive, not more progressive. Increasing taxes on the wealthy may feel good when the law is implemented, but it will eventually lead to lower tax revenues, increased revenue volatility, and slower economic growth.

• There is nothing else we can do. The political situation does not allow a better fix.

It never will be easy to implement comprehensive tax reform in California. There are too many groups with too much at stake. However, it is senseless to argue that we should therefore increase the distortions in an already distorted tax code. California has been doing this for years, and it just keeps making things worse. California's governance is a mess precisely because it is the result of hundreds of ad-hoc decisions.

California desperately needs comprehensive tax reform, "if not now, when?"

Which brings us to the proposal by the Think Long for California Committee . The Think Long committee is a subset of California's political elite. You will recognize many of the names; for a start: Nicolas Berggruen, Eli Broad, Willie Brown, Gray Davis, Condoleeza Rice, Bob Hertzberg, Eric Schmidt, Terry Semel, Laura Tyson, and George Schultz. The proposal has three components:

Empowering Local Governments and Regions: Here's what it says about decentralizing decision-making: "While the committee embraces the principles of de-centralization, devolution and realignment of revenues and responsibilities, we have not endeavored to propose precisely how that should be accomplished."

That's a bit like endorsing Mom and apple pie, isn't it? The committee has not earned itself any honor or credibility by failing to have a proposal for one of the three major components of its plan, the first that it enunciates.

Improving Accountability: "The Citizens Council For Government Accountability – an independent, impartial and non-partisan body – would be established to develop a vision encompassing long-term goals for California’s future."

Only, it is not a citizens group at all. It would be funded by the state, and it would have access to state agencies for support. Nine of the committee's thirteen members would be appointed by the governor, two of whom could not be registered in either party. The Senate Rules Committee and the Speaker of the Assembly would each appoint two members, one from each major party. The committee would have four non-voting ex-officio members: the director of finance, the state treasurer, the state controller, and the attorney general.

That sounds to me a lot like just another government agency. Not exactly; this would be a super-committee with broad powers. It would soon be involved in almost every aspect of California's government. The committee would have subpoena power, and the ability to publish on the election ballot its comments and positions on proposed ballot initiatives and referendums, as well as to place initiatives directly on the ballot.

Giving the committee the ability to place initiatives directly on the ballot is a nice touch in a document that elsewhere tries to make it more difficult for others to place initiatives on the ballot.

Restructuring the Tax Code: California's tax code needs restructuring, no doubt about that. This proposal doesn't get us to where we need to be, though. It reduces sales tax rates, top marginal income and business tax rates, and deductions from personal income taxes, except for education and health care, and for taxing services.

In general, these are steps in the right direction. However, exempting education and healthcare is a serious, perhaps fatal, flaw. It amounts to a huge subsidy for those industries, and places an extraordinary burden on the remaining service providers. The exempted industries are big, and exempting them means higher taxes on other service providers.

Who would actually bear the tax burden? That depends on the elasticities of supply and demand. In general, when demand is less elastic than supply (when the consumer is relatively indifferent to price changes), the consumer bears the tax burden, which is what is desired. However, for many services, it would appear that demand is not that inelastic.

Consumers can easily reduce the frequency of services such as haircuts, lawn maintenance, and the like. This would shift the burden of the tax from the consumer to the provider, that is, the hairdresser or landscape worker. In many cases, these are very low-income workers, making the tax extraordinarily regressive. California's tax code needs to be less progressive, but this could be a huge regressive swing, one that would create extreme hardships for some of our least advantaged citizens.

Economic theory is clear that there are fewer distortions in consumption taxes than in income and capital taxes. However, these models assume that the tax burden is squarely placed on the consumer. It appears that for many services this may be impossible. Perhaps that is why we don't observe many service taxes.

It is also the case that, in many services, taxes are avoided by the use of cash transactions. Estimates of the size of the "underground economy" vary, but most economists believe it is significant. A tax on services would likely increase its size dramatically.

The Think Long proposal is not the solution to California's challenges. It does, however, represent far more thought than went into the governor's proposal. It provides a service, in that it provides a starting point for a conversation that California desperately needs.

Photo by Randy Bayne; California Governor Jerry Brown

Bill Watkins is a professor at California Lutheran University and runs the Center for Economic Research and Forecasting, which can be found at clucerf.org

Viewing all 4167 articles
Browse latest View live