The rioting that swept Baltimore the past few days, sadly, was no exception, but part of a bigger trend in some of our core cities towards social and economic collapse. Rather than enjoying the much ballyhooed urban “renaissance,” many of these cities are actually in terrible shape, with miserable schools, struggling economies and a large segmented of alienated, mostly minority youths.
We are witnessing an unwelcome reprise of the bad old days of the late ’60s, when much of American core cities went up in smoke. Already this year there have been serious disturbances in St. Louis as well as neighboring Ferguson. There’s also been a cascading of urban violence in cities such as Chicago, where the murder rate in 2013 exceeded that of the Capone era. Overall, the geography of fear remains very much what it was a half century ago. The most dangerous places in in the U.S. in terms of violent crime tend to be heavily black cities, led by Detroit, Oakland, Memphis, St. Louis, and Cleveland. Baltimore ranks sixth.
Of course not everything is as it was. Some cities, notably New York and Los Angeles, are much safer today, and there remains a strong pull for younger people, particularly the well-educated, to move to core cities, at least in their 20s. Black urban professionals enjoy opportunities that were rare a generation ago to reach the highest levels in our most elite cities.
But, as Baltimore makes clear, we are still very far from what Aaron Ehrenhalt has labeled the “great inversion,” in which our cities change into affluent redoubts while the suburbs devolve into future slums. In reality, this is very far from the truth: cities are, if anything, becoming more bifurcated than ever, with a large, and seemingly unmovable, population that has benefited little from the gentrification of some urban neighborhoods, including some in Baltimore itself.
The Persistence of Concentrated Poverty
Perhaps the biggest sign of how limited the urban renaissance has been is to look at the growth of precisely the kind of highly concentrated poor areas like those that blew up in Baltimore. Yet although the suburbs’ share of poverty may have increased, the average poverty rate in the historical core municipalities in the 52 largest U.S. metro areas remains at 24.1 percent, more than double the 11.7 percent rate in suburban areas—despite a considerable urban turnaround in this period.

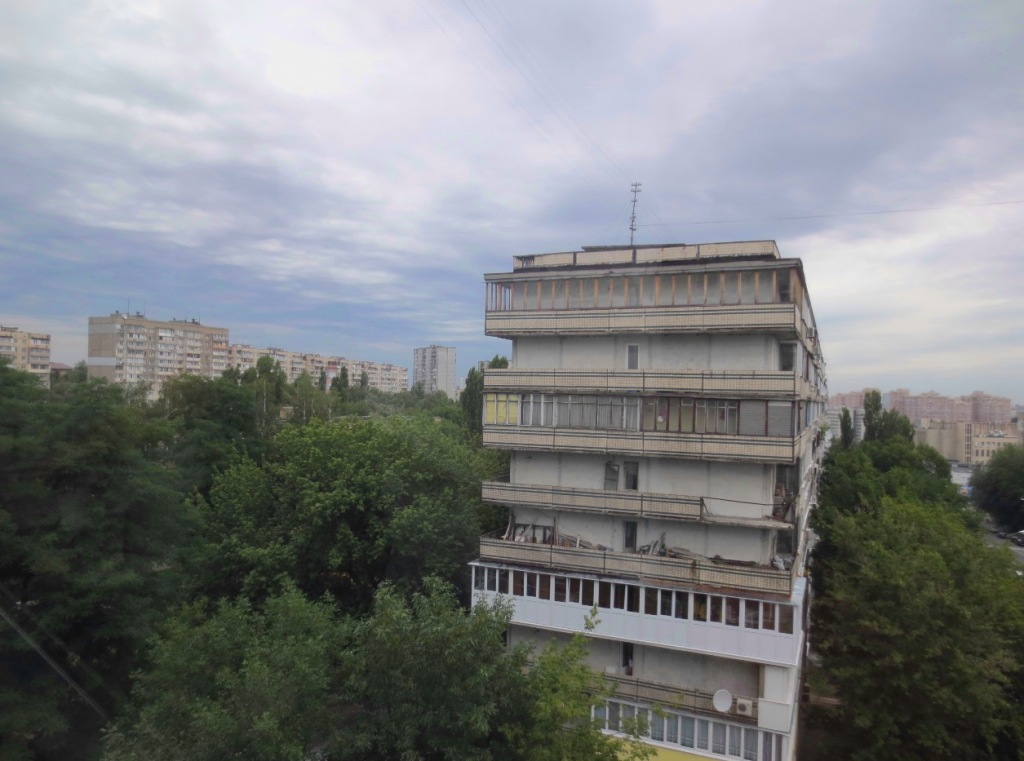
David S. Holloway/Getty
In fact, neighborhoods suffering entrenched urban poverty (PDF) actually grew in the first decade of the new millennium, increasing in numbers from 1,100 to 3,100 and in population from two to four million. In other words, poverty spread but also became far more intense in cities. “This growing concentration of poverty,” note urban researchers Joe Cortright and Dillon Mahmoudi, “is the biggest problem confronting American cities.”
Certainly Sandtown-Winchester—where Freddie Gray, whose death sparked the riots, grew up—fits this mode. As the liberal Think Progress website explains, more than half of that neighborhood’s people between the ages of 16 and 64 are out of work and the unemployment rate is double that for the rest of the city. Median income is below the poverty line for a family of four, and nearly a third of families live in poverty. About a quarter to a third of the buildings are vacant, compared to 5 percent in the city as a whole.
Yet the people in these neighborhoods do not represent the majority of black America. Besides the gap between blacks and whites, there is also a growing one among African-Americans themselves. This is painfully obvious in the Baltimore region which, extending to the Washington, D.C., suburbs, has some of the highest black wages and homeownership rates of any of the county, and ranks among the best places for African-Americans in a new study I co-authored for the Center for Opportunity Urbanism.
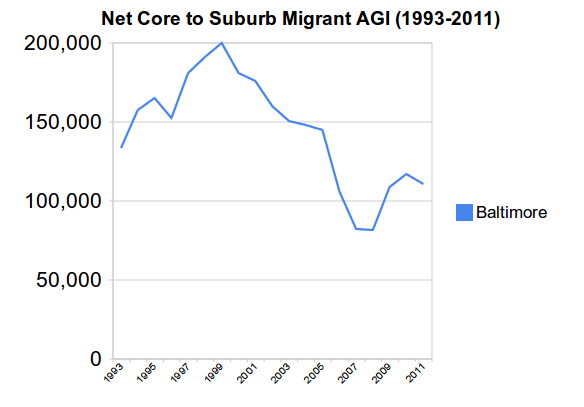
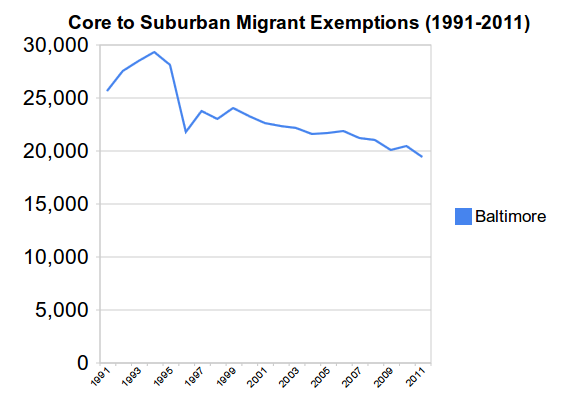
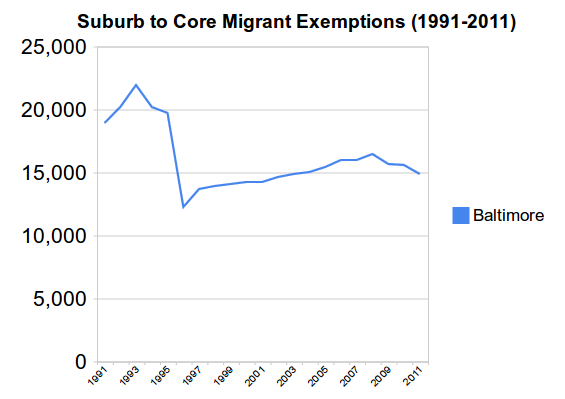
In fact, five of the ten wealthiest black communities in America are in Maryland. Needless to say, residents in those towns are not rioting. There is an increasingly enormous gap between entrenched poor communities, such as those in Baltimore, and a rapidly expanding black suburban population. Barely half of the 775,000 African-Americans in the Baltimore metropolitan region live in the city, and those outside do far better than inside the city limits. In the last decade, suburban Baltimore County added160,000 blacks, far more than moved into the city (PDF). The black suburbanites not only make more money than their urban counterparts but their life expectancy (PDF) is at least eight years longer.
These trends can be seen nationwide. In the last two decades of the 20th century, more blacks moved into the suburbs than in the previous 70 years, a trend that continues unabated. The 2010 Census indicated that 56 percent of African Americans in major metropolitan areas live in the suburbs. This movement was particularly marked among families with children; the number of black children living in cities like New York, Oakland, Atlanta, Los Angeles all dropped precipitously, as families sought out safer streets, better schools, and more affordable space.
The Changing Nature of Urban Economies
African-Americans came to Baltimore and other northern cities in large part to work in the steel, port, and other blue collar, industrial businesses that flourished in mid-century America. Yet most of those jobs are now gone, leaving behind those who must scramble to find work in the growth industries of today—education, technology, medical services. This is the case in almost all heavily black cities, not only in the Northeast, but the Midwest and even parts of coastal California. But today’s star urban industries, notably technology and high-end business services, employ few working class blacks. African-Americans, for example, occupy only the tiniest sliver of jobs—roughly 2 percent—in Silicon Valley. Nor have African Americans done well in the tech boom, driven by software-related firms more likely to staff themselves with Indian technocoolies than boys up from the ’hood. Between 2009 and 2011, earnings dropped 18 percent for blacks and 5 percent for Latinos, according to a 2013 Joint Venture Silicon Valley report.
Overall the places where these industries have grown often produce not more opportunities for poor people or minorities but rather a subtle form of “ethnic cleansing.” A recent report from the Urban League, for example, pointed out that the very cities most praised as exemplars of urban revival—San Francisco, Chicago and Minneapolis—also suffer the largest gaps between black and white incomes. Notwithstanding the rhetoric, much of the “hip cool” world increasingly consists of monotonic “white cities” with relatively low, and falling, minority populations, such as San Francisco, Portland, and Seattle. These places are achingly political correct in theory, but are actually becoming whiter and less ethnically diverse as the rest of the country diversifies. The situation has changed so much that former MayorGavin Newsom even initiated a task force to address black out-migration.
Inverting the Inversion
Baltimore proves that the “great inversion,” insofar as it exists at all, positively affects a relatively small part of the urban population, particularly in historically black cities. Cities may well have become a popular abode for the young, well-educated, and the rich (usually white), but they also contain another, usually much larger population of those, mostly minorities, who have been left behind in the urban evolution. Midwestern urban analyst Pete Saunders describes Chicago in this manner: “one third San Francisco, two thirds Detroit.”
This is precisely what we see in Baltimore and many traditionally black cities. Everything that does not work in cities today—education, for example, and sometimes law enforcement—most directly affects minorities and the poor. Crime may be down overall in many cities, but not necessarily in predominately minority neighborhoods. As blogger Daniel Hertz has demonstrated, violent crime has actually increased since the early ’90s in several large, predominately African-American Chicago neighborhoods.
Clearly what we are seeing then is not an urban kumbaya you see in TV ads for fast food and web services, but a hardening of class and racial divisions. Suburban poverty and crime may have increased in recent years, but they are not nearly as entrenched on the periphery as they are in the city. Places like inner Baltimore function essentially as a kind of dead-end, a cul-de-sac for dreams of a better future.
The Changing Geography of African-American Opportunity
We are witnessing a very unwelcome resurgence of racial tensions over the past six years, with concern about racism at the highest level since the Rodney King riots in 1992. Today, particularly in the divisive aftermath of Ferguson and other police-related controversies, two in five Americans feel race relations have gotten worse since President Obama took office, while only 15 percent thought they had gotten better.
How do we reverse this ugly trend? Sadly it takes more than good intentions and handouts. To be sure, the initial Great Society programs helped reduce chronic black poverty. But the poverty rate was already dropping: in the prosperous early ’60s, black poverty plummeted from 56 percent to 34 percent; in contrast, in the years after President Lyndon Johnson launched the war on poverty, it dropped only slightly, to 32 percent. But by the ’70s this progress—despite the implementation of such programs as affirmative action—slowed to a crawl, in large part due to cascading social problems, particularly in industrial cities like Baltimore.
Many progressives have blamed conservatives starting with President Reagan for the conditions that still prevail for many African Americans. Yet it turns out that expansive era was pretty good for blacks, if not for their leaders. Even as poverty spending growth slowed, the poverty rate dropped in the Reagan years to around 30 percent for African-Americans. Similarly the economic boom of the Clinton era saw even greater progress, with poverty dropping to 25 percent. It began to rise again, albeit slowly, during the tepid recovery of the Bush era, but then began to rise more steeply during the Great Recession, and through the slow, and also tepid, recovery of the Obama years.
Clearly an improved economy is more important than ramping up social spending. Indeed, according to USC’s Luke Phillips, states. like New York, Massachusetts , California and Illinois spend almost twice as much on welfare payments than do states like North Carolina, Texas, or Florida, both in terms of GDP and state spending. Yet the best results for African Americans in our Center for Opportunity Urbanism study were found overwhelmingly in the former Confederacy, states generally not well known for their generosity to the poor or interest in racial redress.
This is leading to a stunning reversal in black migration patterns. Between 1910 and 1970 six million African Americans migrated from the South to the North in what became known as the Great Migration. But since World War II the migration has changed course: ambitious blacks now head toward the suburbs, or the South. Between 2000 and 2013, the African American populations of Atlanta, Charlotte, Orlando, Houston, Dallas-Fort Worth, Raleigh, Tampa-St. Petersburg, and San Antonio all experienced growth of close to 40 percent or higher, well above the average of 27 percent for the 52 metropolitan areas.
“Blacks who have relocated tend to be either retirees or well-educated, well-off middle-agers with children,” John Giggie, associate professor of history and director of graduate studies at the University of Alabama in Tuscaloosa, toldBET.com. They move to the South not because they like the politics (most probably don’t) but because they seek economic progress. Part of the reason may be that sunbelt cities have more broad based opportunites for middle and working class residents than have the increasingly post-industrial economies of California and the Northeast corridor.
Our leadership class, black and white, misses all this. Sending Al Sharpton, President Obama’s highly publicized advisor, to Baltimore hardly bodes well for improving things on the ground. A little bit of catharsis, perhaps, but at some point you need to deal with reality.
It would be far better if some CEOs or investors—American, Asian, or European—came to the old Chesapeake city bearing plans for expanding jobs and opportunities. That, at least, would begin to address the economic and social isolation that, inevitably, finds its expression in fires on the street. Good jobs and the prospect of a better future—not good intentions—is what ultimately matters.
This piece first appeared at The Daily Beast.
Joel Kotkin is executive editor of NewGeography.com and Roger Hobbs Distinguished Fellow in Urban Studies at Chapman University, and a member of the editorial board of the Orange County Register. He is also executive director of the Houston-based Center for Opportunity Urbanism. His newest book, The New Class Conflict is now available at Amazon and Telos Press. He is also author of The City: A Global History and The Next Hundred Million: America in 2050. He lives in Los Angeles, CA.
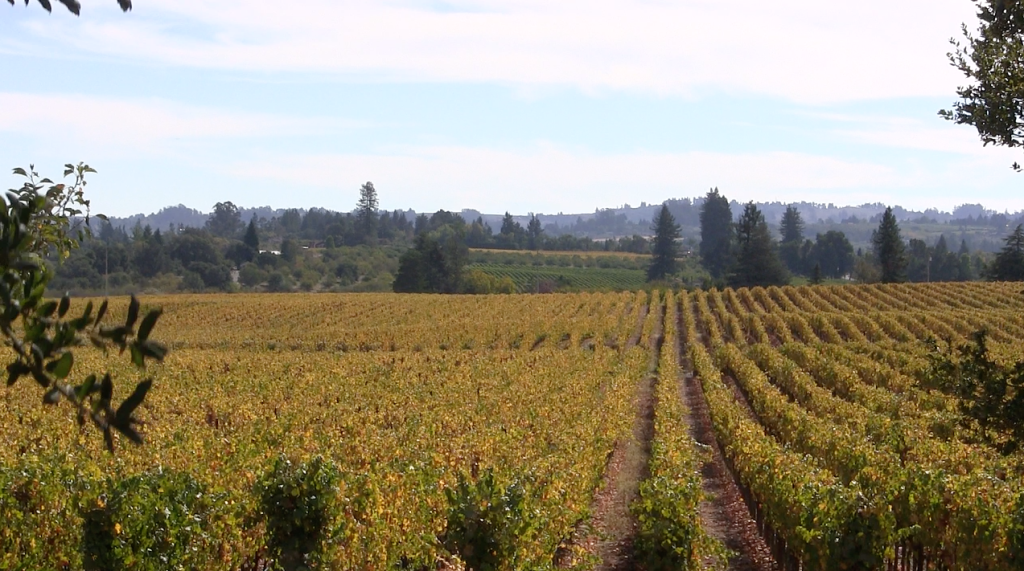
Photo by Voice of America, Victoria Macchi
![]()


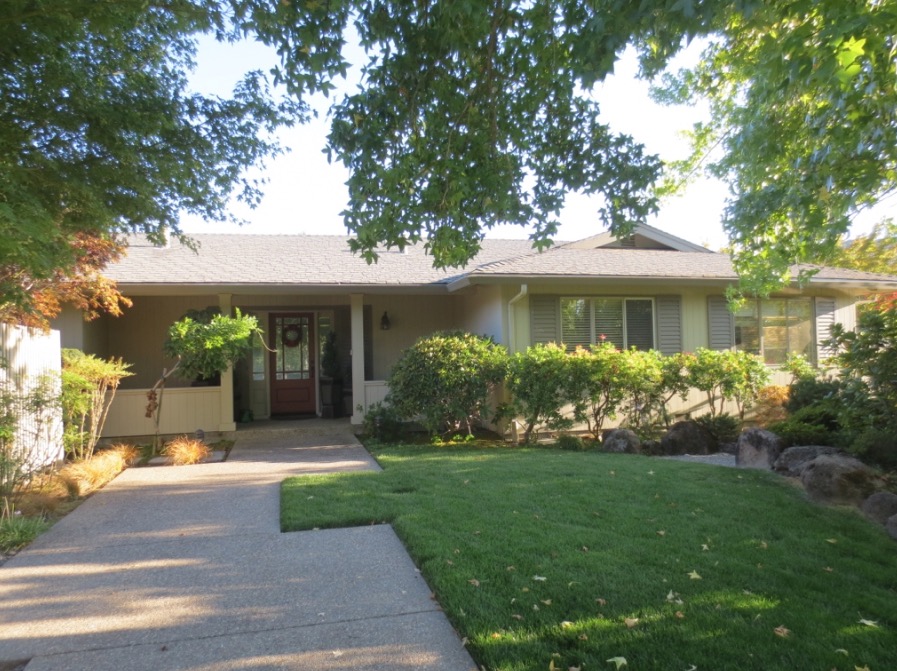
 David S. Holloway/Getty
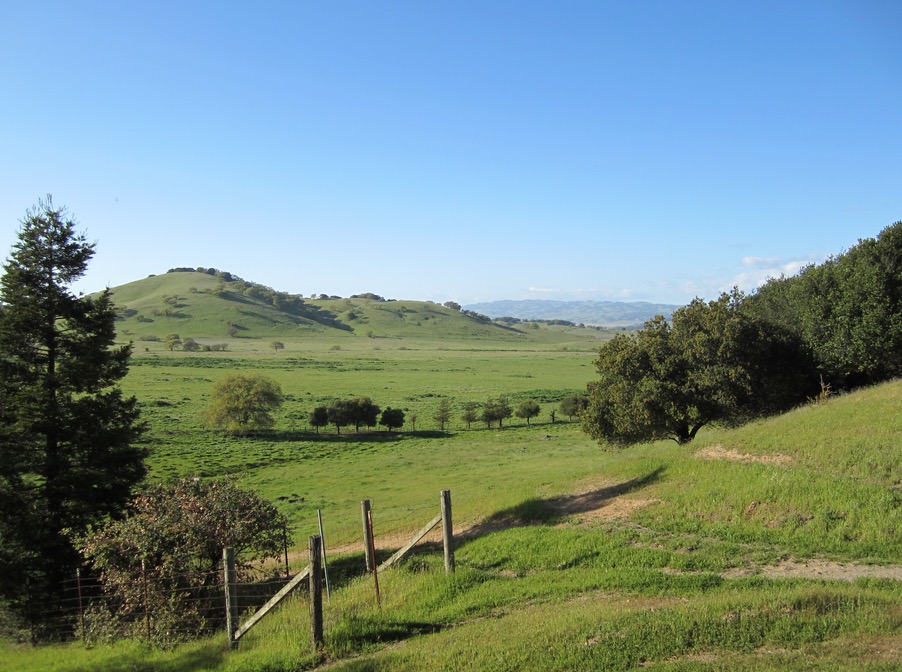