Quantcast
Channel: Newgeography.com - Economic, demographic, and political commentary about places
Viewing all 3792 articles
Browse latest View live

Can Hipsters Save Providence?

$
0
0

Providence regularly lands on the lists of top hipster cities and top hipster colleges for its cool factor, having earned plaudits from Travel and Leisure to Buzzfeed for live music, coffee shops, and hip culture.  

But can hipsters save Providence?

In 2013, when Providence took the number four slot on Travel and Leisure's list of America's Top Cities for Hipsters, the publication stated of Rhode Island's capital city, "On the west side, you can order vegan cuisine at The Grange, hear concerts at the Columbus Theatre (with a clever 1492 seats), or browse the vintage fashions, ceramic poodles, and kitschy kitchenware at Rocket to Mars."

Aaron Renn, urban analyst and senior fellow at the Manhattan Institute, offered his perspective on the "hipster impact" in Providence -- and nationally.  

"There are not enough "hipsters" to plausibly resurrect the urban economies of America," said Renn. "If you're in downtown Providence, in the proximity to its center, you can live an eminently hipster lifestyle, and ask yourself, 'Where would Providence be without it?' And it would probably not be as great."

"Is that the solution to the jobs issue on the south side of Providence?  No.  [The hipster economy] has its positives, but it's something that's happening more now everywhere," said Renn.  "I was just in Indianapolis.  There were plenty of beards, plaid shirts, and locally sourced food there."

Part of Economy

"It's a great thing to be considered a livable city with a vibrant nightlife and art scene," said Providence City Council President Luis Aponte.  "Our goal is to have a city that draws interest and investment at all levels.  The artists and designers need to be part of the city -- but so do blue collar and white collar workers as well."

Renn noted that in his view, Providence's relatively rooted hipster culture put it in a different position than newer hipster destinations.  

"People are going to come and go, that's the nature of a college town, but the people that I know that decided to stay in Providence did so for relatively concrete reasons," said Renn. "They're 'sticky'-- they didn't seem like the people to flee to Detroit because it's the next hip city. Many people have reasons that they picked Providence that aren't applicable to a Detroit. Having New England roots, for instance, or wanting to be close to New York, Boston, but having a lower cost of living."

"I'm not anticipating there's going to be any mass exodus of the creative class, that's a positive note -- the people that are in Providence are loyal, but if you don't have a job, that's a big problem," added Renn.  

Renn noted some advantages that emerging hipster markets have that Providence does not.  

"Take Detroit and its collapse," said Renn.  "The ability for the government to function is barely coming around. That's allowed people to take chances, to know the building inspector isn't necessarily going to bother you.  New England is so heavily regulated, it's a daunting process to come in and do something.  I think the people who move to Providence have a reason, they didn't just up and move because they heard it was cool."

Urban Growth Factor

"I think Providence has fallen flat compared to hipster cities such as Portland [Oregon]," said Renn.  "There's more of an economy build in say Portland [Oregon] for small business. For a lot of people, to go to Providence, you have to bring money from somewhere else, there's not a ton of jobs.  For the most part, if you're a younger, creative person, there's simply a limited number of positions in Providence right now.  You've got to figure out how to make money, and that's namely exporting services and goods, and that brings some wealth in."

City Council President Aponte noted that the firm that the City Council recently hired to do cluster analysis identified that at least a fifth of Providence's workforce are contract workers. 

"What they found is that 21% of folks earning in Providence are 1099 workers," said Aponte of the classification of contract workers.  "That's high as compared to other parts of the region and the country as a whole.  If people are disconnected to an employer, and selling their services as consultants, how much spin off does that create?  We have an older housing stock, which is attractive to hipster types, and having them here means something for our tax base.  We need to see where the jobs are though, and enable growth there."

Renn spoke to where he saw Providence could succeed.  

"Rhode Island has had some wins in the past, we just need a lot more.  On a whole, if I were Providence, I'd feel pretty good about the number of people in that creative class who have an affinity for the city and aren't likely to leave," said Renn.  "The industries that are booming, however, are ones where Rhode Island isn't necessarily well placed.  Everybody and their brother is chasing biotech.  Boston is booming, and Rhode Island just doesn't have the assets. There are only so many coders -- if you're that good, you're going to another city."

"Where Providence and Rhode Island has the skills is in design," said Renn.  "The question is how do you parlay that beyond a boutique firm.  You can argue Alex and Ani did it, that it's effectively a design firm that leverages the state's jewelry expertise.  That's just one example.  Providence needs lots of people starting businesses.  Very few will become successful, and usually it takes on average 7 to 10 years to make it.  But to do so you have to build it."

This piece first appeared at GoLocalProv.com.

Kate Nagle is a writer and editor at GolocalProv. Find her on Twitter @naglekate78.


Asian Augmentation

$
0
0

California, our beautiful, resource-rich state, has managed to miss both the recent energy boom and the renaissance of American manufacturing. Hollywood is gradually surrendering its dominion in a war of a thousand cuts and subsidies. California’s poverty rate – adjusted for housing costs – is the nation’s worst, and much of the working class and lower middle class is being forced to the exits. Our recent spate of high-tech growth has created individual fortunes, but few jobs, outside the Bay Area. The agricultural heartland is suffering not only from drought, but from green policies that allow a torrent of unused water to flow into the Sacramento Delta and San Francisco Bay while huge parts of the Central Valley go fallow.

But California retains one powerful trump card that our leaders in Sacramento have not yet found a way to squander: Its link to Asia. True, the state’s growth-restrained ports are increasingly tied up, and, over time, much of our trade with China and other Asian countries might pass, instead, through the Panama Canal en route to Houston and other ports. But geography, culture and family ties have a way of overcoming even the most deluded policy environments.

In the 19th century, many in California railed against the “Asian invasion,” and led the drive to restrict Asian immigration to America. As early as 1850, Asians accounted for one-tenth of the state’s non-native American population. Early on, Chinese, Indian and Japanese immigrants showed remarkable ingenuity, largely as farmers and merchants, which only made whites more antagonistic. “Indispensable as the Chinese are,” one grower report admitted, “they must go, as gradually as possible.”

Read the entire piece at the Orange County Register.

Joel Kotkin is executive editor of NewGeography.com and Roger Hobbs Distinguished Fellow in Urban Studies at Chapman University, and a member of the editorial board of the Orange County Register. He is also executive director of the Houston-based Center for Opportunity Urbanism. His newest book, The New Class Conflict is now available at Amazon and Telos Press. He is also author of The City: A Global History and The Next Hundred Million: America in 2050.  He lives in Los Angeles, CA.

Wendell Cox is principal of Demographia, an international public policy and demographics firm. He is co-author of the "Demographia International Housing Affordability Survey" and author of "Demographia World Urban Areas" and "War on the Dream: How Anti-Sprawl Policy Threatens the Quality of Life." He was appointed to three terms on the Los Angeles County Transportation Commission, where he served with the leading city and county leadership as the only non-elected member. He was appointed to the Amtrak Reform Council to fill the unexpired term of Governor Christine Todd Whitman and has served as a visiting professor at the Conservatoire National des Arts et Metiers, a national university in Paris.

Map courtesy of U.S. Census.

Shades of Red and Blue Across Counties Show Surprising Balance

$
0
0

We cannot escape the reality of a polarized America, given the current level of rhetorical and real political gridlock. And maps are frequently invoked to illustrate that this polarization is also geographic, with clear-cut Red and Blue territories.

Clearly there are large areas of extreme polarization, and we will show them. But there are also more balanced kinds of counties which vote not consistently with one side. These contested areas are more extensive than people likely believe or the media proclaim. This is healthy for the nation.

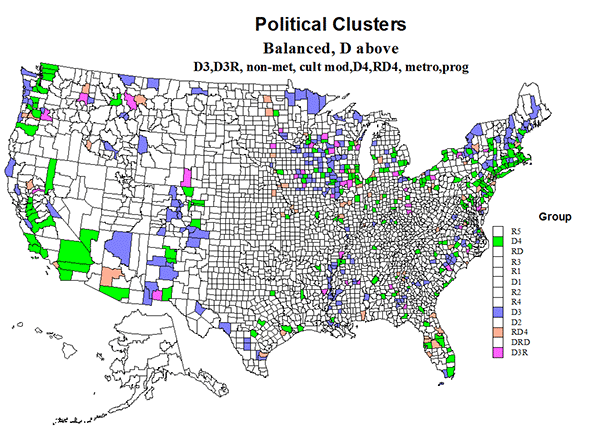
I employed a cluster analysis of US counties with selected variables that do best at distinguish voting Democratic or Republican.  This produced a useful 10 cluster solution, based most critically on voting Red or Blue, but also taking into account kinds of settlement, i.e metropolitan, small city, and rural, and a cultural gradation from traditional religious conservative to socially progressive. The historic scale on economic distinctions between Democrat and Republican is virtually extinct.    

Five clusters exhibit extreme spatial polarization—three highly Republican, two strongly Democratic. Two are solid Republican but not extreme. Three are balanced, so much so that counties in each voted Republican and Democratic, so we divided each of these into Democratic and Republican sub-groups.


CategoryRepublicanDemocrat
True BelieversR1, R2, R3D1, D2
Moderate RepublicanR4, R5
BalancedRD, DRDD3, D3R, D4, RD4


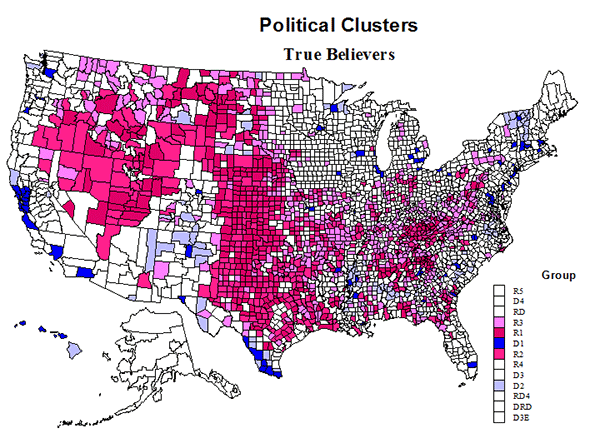
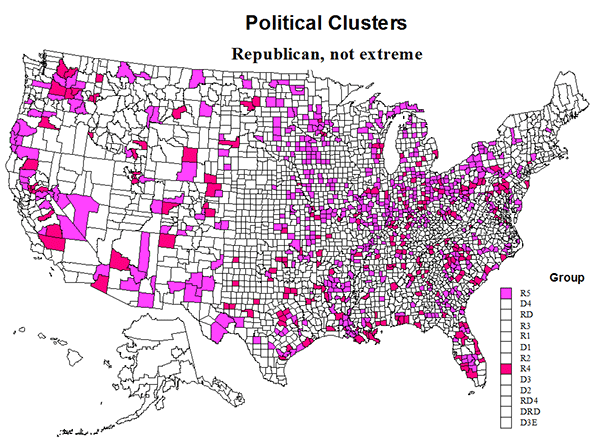
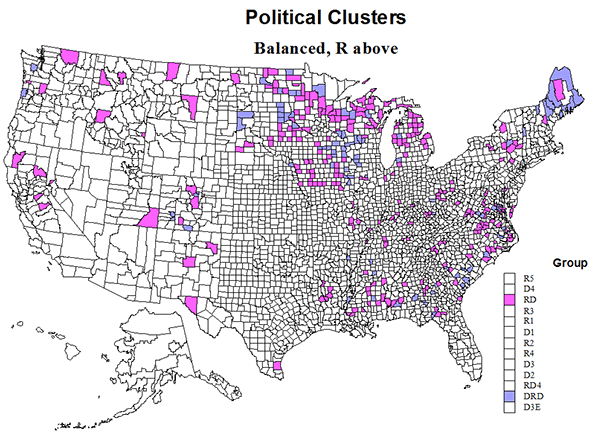
We locate these groups on four maps, one for True Believer counties of extreme polarization, two not extreme  but Republican leaning counties, two (with 4 sub-groups) that are majority Democratic, and one (with two subgroups) that is majority Republican. 
Population, votes for Obama and Romney, and values for political character are summarized in Table 1.  The table numbers should surprise many readers. True believer America is hugely important to the parties, especially the Democrats, (and symbolically for Republicans?), but contain just 103 million people and 41 million voters, about one-third of the total.


Clusters of US Counties on Presidential Politics, 2008-2012
Group# of Counties% Obama 2012Settlement PatternCultureRaceObama voteRomneyD MarginPopulation (Thousands)
D110472Lg metProg +47          19,600           7,077          12,523                68,307
D211270non-metmoderate56                820               353                467                   2,776
D extreme21670mixedhigh min          20,420           7,430          12,990                71,083
R350632ruralCons+13            1,342           2,791          (1,449)               10,034
R245425non-metCons 21            1,737           5,297          (3,560)               17,920
R134018ruralCons +25                323           1,587          (1,264)                  4,164
R extreme130026rural, non-metCons low            3,402           9,675          (6,273)               32,118
All True Bel151658all          23,827         17,105            6,722              103,201
R552840Non-metmoderate19            3,944           5,777          (1,833)               23,231
R427836Larg metmoderate21            6,774         11,581          (4,867)               44,727
R not extreme80637mixmoderate20          10,718         17,358          (6,640)               67,958
D319456.5non-metromod to pro21            2,227           1,727                500                   8,723
RD33849non-metromod to pro28                415               435                (20)                  2,033
D3 total23255non-metro22            2,642           2,162                480                10,756
D419456large  metProg+30          22,573         17,792            4,780                95,835
RD46847.3Prog+24            4,677           5,358             (681)               24,865
RD total26254Prog+29          27,250         23,150            4,100              120,700
R>D24445.2ruralMod to cons19                946           1,486             (540)                  4,574
DR>D9253.6ruralMod to cons21                454               396                  58                   1,814
R>D total344ruralMod to cons19            1,400           1,882             (482)                  6,388
All balanced83054          31,262         26,194            5,068              137,844
All D62.5metro dominated          45,674         27,335          18,379              177,455
All R37nonmet dominated          20,155         34,312       (14,157)             131,548
All groups51.6          65,832         61,647            4,185              309,003


Another 68 million people and 28 million voters are in strong Republican areas, which, together with the true believer Republican areas, give the GOP dominance in counties with 100 million people and 41 million voters—about one-third of the total. This is higher than the strongly Democratic core areas with 71 million people and 28 million voters.

But the really interesting story is about the remainder of the country, which we argue is somewhat balanced, with 137 million people (44%) and 57 million voters (45%). These are significant and meaningful battleground territories, and a warning to both parties to be more careful in proclaiming long term dominance. But it is true that the total population in Democratic majority groups totals 177 million, compared to 132 million for the Republican clusters, and thus the basis for a Democratic net margin in 2012.   

We will discuss the variable settlement and cultural characteristics of the clusters through an analysis of the four maps.

True Believers

OK here is the quintessential polarization! Between areas of concentrated blue. Group D1 is mainly in large metropolitan cores, especially on the two coasts – the northeastern Megalopolis, and Los Angeles, San Francisco, Portland and Seattle, but also Chicago, Detroit, Minneapolis, plus a few ethnic minority areas, as along the border with Mexico, and noted in the table as metropolitan, high in minorities, and culturally progressive. Cluster D2 is smaller, non-metropolitan, majority minority, culturally moderate, and primarily with black, Hispanic or Native American settlement, but with a different sub-set of counties in Vermont, upstate New York, and in environmental recreation areas in the west. These tilt more progressive.

The contrast with the true believer Republican clusters is profound. R1 and R2 are the most conservative, mainly rural and non-metropolitan respectively, and tend to occupy the same areas, dominating huge portions of two realms: the western high plains from Texas to North Dakota, and the extended Mormon region, centered on Utah but stretching to neighboring states. In addition, there are  some added counties in Appalachia and into the south.  R3 counties are as conservative and also rural, and are found mainly in Appalachia, Missouri (Ozarks) and in a far north belt from the Dakotas to eastern Washington. These true believer red counties constitute over half of US counties, and almost half the territory, but have only 11 percent of the population.

The strongly Republican , yet less extreme counties have a very different geography. They do tend to occur together, embracing many smaller metropolitan areas, together with adjoining non-metro counties. They tend to be culturally moderate, and much more populous than the extreme R1 to R3 groups, with 68 million people, and as important to Republican margins. They are most prevalent across the west and “the north of Appalachian north ---  OH, IL, MI, IN, WI, MO, and MN --- than in metropolitan and suburban areas in the south, notably FL, NC, SC, LA, and TX, and then in the less or smaller metropolitan west.

The more balanced counties have 138 million people, and provided a small but critical margin for Obama in 2012, with 106 million in the D majority groups, and 32 million in the R majority groups.

The Republican majority balance group RD is rural and moderately conservative. They are most prevalent across the northern edge of the country from Maine to MI, WI, MN, and IA  to the Dakotas, a historically moderate area, with scattered exurban and rural areas in the west (mainly R carried) and scattered across the south from LA to VA (also mainly R carried)

The Democratic majority balanced groups D4 and D3 are quite varied, almost a prototype of the US average! The D3 counties are mainly non-metropolitan, and moderate to progressive. The D and R carried counties tend to be intermingled. These counties are most prevalent in the “old” north from MN and IA to northern New England, but also fairly common in the Rockies and along the Pacific coast. Many of these counties were and even still are resource-oriented, and many have become exurban professional and/or environmental amenity dependent (CO, CA, WA, ID, NM, ME, NH).  

The D4 group is larger and less dominantly Democrat carried. It is mainly larger metropolitan and culturally progressive, but not as strongly Democratic as the D1 counties. The difference is that many are smaller, often “satellite” metropolitan areas, or suburban-exurban counties, as along the Pacific coast, in Florida and Megalapolis. Many were counties that were historically Republican but have become increasingly socially liberal,   experiencing declines in the Republican margins. Notable are big areas like San Diego, Riverside-San Bernardino, Phoenix, Dallas, Houston, suburban Denver, and suburban-exurban NJ, NY, and CT.

The balanced counties would seem difficult for a very conservative “Tea party” candidate, and good for Hilary Clinton, but could possibly revert to Republican with a more mainstream candidate. Thus it is premature to write off the long term Republican prospects. Both parties have a long history of decline and resurgence.  If mainstream Republican leaders can restrain the extreme conservatives, then there is at least some prospect of a serious realignment, with perhaps four parties for a transition period, the Tea Party, a Business party, a Green party (progressive environmentalists), historically liberal Republican, and dare I hope, a (social) Democratic party? Bring back economics and this could happen.

Richard Morrill is Professor Emeritus of Geography and Environmental Studies, University of Washington. His research interests include: political geography (voting behavior, redistricting, local governance), population/demography/settlement/migration, urban geography and planning, urban transportation (i.e., old fashioned generalist).

Affordable Housing Maui Style

$
0
0

I was recently at a friend’s wedding on Maui. It was a beautiful ceremony in a magnificent location. The wedding was a week-long affair and the other guests were thrilled to enjoy the beach and sip drinks along the cascade of infinity pools at the resort. But I’m weird. I can’t sit still that long so I started to explore how the place works – not just the one resort, but the whole Maui tourist economy. First, I checked out real estate prices in the area. The cost of even the most modest homes and apartments are off the charts expensive. Property is pegged to what wealthy outsiders from the mainland and abroad are willing and able to pay rather than what the local population can afford.

Screen Shot 2015-03-29 at 2.01.11 AM Screen Shot 2015-03-29 at 2.00.58 AM

I was recently at a friend’s wedding on Maui. It was a beautiful ceremony in a magnificent location. The wedding was a week-long affair and the other guests were thrilled to enjoy the beach and sip drinks along the cascade of infinity pools at the resort. But I’m weird. I can’t sit still that long so I started to explore how the place works – not just the one resort, but the whole Maui tourist economy. First, I checked out real estate prices in the area. The cost of even the most modest homes and apartments are off the charts expensive. Property is pegged to what wealthy outsiders from the mainland and abroad are willing and able to pay rather than what the local population can afford. That got me thinking about where the hotel staff lived. So I asked the people I encountered how they manage under the circumstances. There were a few standard answers.

Screen Shot 2015-03-29 at 2.42.19 AM Screen Shot 2015-03-29 at 2.31.29 AM Screen Shot 2015-03-29 at 3.11.24 AM Screen Shot 2015-03-29 at 2.32.05 AM Screen Shot 2015-03-29 at 2.15.56 AM

First, there was upper management who were highly trained and well educated professionals who earned tolerable salaries and, with a spouse’s professional income and a little help from family, were able to own a modest property within a reasonable commute from work. Next, were the clerks, waiters, bartenders, and such. They were generally young and spending a bit of post-college pre-marriage time in a gorgeous place doing work that was either pleasant or at least bearable given the location. The largest proportion of these folks lived in nearby properties owned by older relatives. If dad or grandma is providing free or heavily subsidized accommodations it really doesn’t matter what the place costs on the open market. A good percentage of these homes are seasonal second or third homes and would sit empty or rented to strangers anyway. Having young family members occupy these vacation and retirement properties while they work at the hotels makes perfect sense. The third most common housing arrangement involved a few people pooling their resources and sharing a single apartment to cover the rent. There was a general lack of space and privacy in these situations, but everyone understood it was temporary for a season or two. The Hawaiian adventure was worth any inconvenience.

Screen Shot 2015-03-29 at 2.52.24 AM Screen Shot 2015-03-29 at 4.50.01 AM Google
 Screen Shot 2015-03-29 at 2.53.09 AM Screen Shot 2015-03-29 at 4.44.48 AM Google
 Screen Shot 2015-03-29 at 2.48.10 AM Screen Shot 2015-03-29 at 5.04.34 AM Google
 Screen Shot 2015-03-29 at 2.48.34 AM Screen Shot 2015-03-29 at 4.56.41 AM Google
 Screen Shot 2015-03-29 at 2.49.27 AM Screen Shot 2015-03-29 at 5.11.31 AM Google

Within a fifteen minute drive of the beachfront resorts I discovered a variety of housing types ranging from multi-million dollar single family homes to three hundred square foot studio apartments. None of these were what anyone with a normal budget or a family to support would ever call “affordable”. But one way or another the young front-end staff at the hotels find ways to make things work.

As I explored I was fascinated by the market segmentation of each product type. The subdivisions were sealed off from each other. It would be inconceivable for the people in a $5,000,000 home on a half acre lot to exist in the same pod as a complex of $900,000 two bedroom condos. The condos would be far too trashy for them. And the folks who owned $900,000 condos would be scandalized if someone tried to build $1,800 a month studio rental apartments inside their pod. That would attract “the wrong element”. The pods could all exist next to each other across the shrubbery and landscaped berms so long as they each had their own home owners associations and the roads in and out were completely segregated – preferably with a gate. Endless rules and restrictions, both private and municipal, control each pod to ensure property values are maintained at the appropriate level. This is the default suburban arrangement all over North America – give or take a few zeros and a comma.

Screen Shot 2015-03-29 at 2.11.29 AM Screen Shot 2015-03-29 at 2.14.52 AM Screen Shot 2015-03-29 at 2.59.00 AM Screen Shot 2015-03-29 at 3.24.54 AM

It was a little trickier to discover where the maids and gardeners lived. The majority were older than the kids waiting tables and working the front desk and they were overwhelmingly immigrants from the Philippines. Unlike bartenders they were not generally inclined to chat with hotel guests in a casual manner. My inquiries about affordable workforce housing were met with confusion or slight suspicion. But I was eventually able to identify a few neighborhoods and the general living arrangements.

Screen Shot 2015-03-29 at 2.04.03 AM Screen Shot 2015-03-29 at 2.03.23 AM Screen Shot 2015-03-29 at 2.05.48 AM Screen Shot 2015-03-29 at 2.04.55 AM

There’s simply no economic or political force on Maui that can provide sufficient affordable housing for the number of low wage workers required to run the tourist economy. Land is too expensive. Government and philanthropic funds are entirely inadequate. And political will to construct subsidized housing absolutely anywhere is a non starter at every level of the approval and community engagement process. The minimum wage in Hawaii is $7.25 per hour. The best paid housekeepers on Maui earn no more than $14.50 per hour. The median home price on Maui is $527,500 although that half million dollar number is actually misleading due to the geography of the island. Jobs are concentrated in a handful of locations where housing is significantly more expensive. Lower cost housing is in remote areas that are outside a reasonable commuting distance. HOA restrictions and a host of municipal regulations prevent too many people from sharing a rented apartment in the more expensive regions. Landlords in prime locations can pick and choose who to rent to and they tend toward Canadian tourists rather than immigrant cleaning ladies. So the sweet spot for these workers involves ordinary tract homes in specific older subdivisions that lack HOAs, are far enough from wealthy neighborhoods to escape regulatory push back, yet are close enough for a tolerable commute.

Screen Shot 2015-03-29 at 2.31.42 PM Zillow
Screen Shot 2015-03-29 at 2.30.47 PM Zillow
Screen Shot 2015-03-29 at 2.30.59 PM Zillow
Screen Shot 2015-03-29 at 2.31.19 PM Zillow
Screen Shot 2015-03-29 at 2.31.32 PM Zillow

Here’s an example I pulled from a real estate site. This 1962 three bedroom one bath tract home is among the least expensive properties on the island. It’s listed for $449,000. It doesn’t get any more affordable than this. It’s been on the market for a year and the price was recently cut by $100,000. If someone were to buy this place with a standard 20% down payment of $90,000 the monthly mortgage would be $1,642. At either $7.25 or $14.50 per hour for low wage workers the numbers don’t add up unless many people occupy the space to get the per person rent or mortgage down to a manageable level. So each bedroom gets multiple sets of bunk beds. The living room is a bedroom. The dining room is a bedroom. The garage is a bedroom. People work day, night, and swing shifts so the same beds and parking spots are used at different times by different people. They call these homes “hot beds” since the mattresses are always occupied and never have a chance to cool. (This is exactly how my Sicilian grandparents grew up in Brooklyn during the Great Depression and war years. This kind of arrangement isn’t really new or different.)

Screen Shot 2015-03-29 at 5.03.45 PM Screen Shot 2015-03-29 at 5.44.53 PM Screen Shot 2015-03-29 at 5.45.43 PM

This particular subdivision is protected from gentrification and redevelopment since it’s sandwiched between the airport runway and the oil tank farm of the industrial seaport. Most of these homes are owned and occupied by extended multigenerational families. Cousins arrive, work and save, send money back to their home country, or prioritize their children’s advancement. They scrub things clean and give the walls fresh paint. They make due with the resources they have. The arrangement might not be ideal, but it gets the job done in the absence of any other option. Neighbors tend to live and let live since they’re all in the same position. Local authorities are disinclined to engage in too much code enforcement since the county would simply create a homeless problem they know they can’t resolve. Employers at the resorts wouldn’t like it too much either if members of their cleaning and gardening staff suddenly stopped showing up for work. So there you have it. Affordable housing – Maui style.

John Sanphillippo lives in San Francisco and blogs about urbanism, adaptation, and resilience at granolashotgun.com. He's a member of the Congress for New Urbanism, films videos for faircompanies.com, and is a regular contributor to Strongtowns.org. He earns his living by buying, renovating, and renting undervalued properties in places that have good long term prospects. He is a graduate of Rutgers University.

Calling Out the High-Tech Hypocrites

$
0
0

The recent brouhaha over Indiana’s religious freedom law revealed two basic things: the utter stupidity of the Republican Party and the rising power of the emerging tech oligarchy. As the Republicans were once again demonstrating their incomprehension of new social dynamics, the tech elite showed a fine hand by leading the opposition to the Indiana law.

This positioning gained the tech industry an embarrassingly laudatory piece in the   New York Times, portraying its support for gay rights as symbolic of a “new social activism” that proves their commitment to progressive ideals.

“So many tech companies have embraced a mission that they say is larger than profits,” Glenn Kelman, chief executive of Redfin, the online real estate firm, told the Times. “Once you wrap yourself up in a moral flag, you have to carry it to the top of other hills.”

Yet beneath the veneer of good intentions, the world being created by the tech oligarchs   both within and outside of Silicon Valley fails in virtually every area dear to traditional liberals. On a host of issues—from the right to privacy to ethnic and feminine empowerment and social justice—the effects of the tech industry are increasingly regressive.

The valley elite may have won its gender discrimination lawsuit against Ellen Pao, but this does not dispel the notion that it runs largely on testosterone. The share of women in the tech industry is barely half of their 47 percent share in the total workforce.  Stanford researcher Vivek Wadhwa describes Silicon Valley as still “a boys’ club that regarded women as less capable than men and subjected them to negative stereotypes and abuse.”

Race is another hot spot for progressives, but outside of Asians, the valley’s record is nothing short of miserable. Some of this reflects the rapid de-industrialization of the industry—the valley has lost 80,000 manufacturing jobs alone since 2000—as companies shift their industrial facilities either to China or to states like Utah and Texas, where they can escape the tax and regulatory regime that they so avidly support back in California.

So good blue-collar jobs go elsewhere, and the valley’s  own  African-Americans and Hispanics (who  make up roughly one-third of the population) now occupy  barely 5 percent of jobs in the top Silicon Valley firms.  They have not done well in the current tech “boom”: Between  2009 and 2011,  earnings dropped  18 percent for blacks and 5 percent for Latinos, according to a 2013 Joint Venture Silicon Valley eport. 

Nor can we expect tech firms to go out of their way to train or develop too many American-born workers, of whatever race, for their jobs. Instead the industry’s elites seek to get their employees through H-1B immigrants, largely from Asia. These workers are likely to be more docile, and more limited in their job options than native born or naturalized citizens. Given that there is a surplus of American IT workers, this brings to mind not global consciousness but instead the importation of the original coolie labor force brought to California to build the railroads.

Similarly, despite claims of a commitment to personal freedom, valley firms like Google are  renowned for their calculated violations of privacy. Support the free movement of labor? Others, notably Apple, are also leaders in seeking to restrain employees  from changing jobs.

And what about the sensible liberal idea that the rich and corporations should pay their “fair share” of taxes?  That’s a progressive ideal paid for by your Main Street businessman or your local dentists, but don’t expect your tech oligarchs to play by the same rules.  True, Bill Gates has voiced public support for higher taxes on the rich but tech companies, including Microsoft, have bargained to evade paying their own taxes. Facebook paid no taxes in 2012, despite profits in excess of $1 billion.  Apple, which even the New York Times described as “a pioneer in tactics to avoid taxes,” has kept much of its cash hoard abroad to keep away from Uncle Sam.

If these actions were taken by oil companies or suburban developers, the mainstream media would be up in arms. Yet by embracing “progressive” values on issues like gay rights, the tech oligarchs are trying to secure a politically correct “get out of jail free” card. Monopolistic behavior, tax avoidance, misogyny, and privacy violations are OK, as long as you mouth the right words about gay rights and climate change—and have the money and  the channels to broadcast your message.

Like other plutocrats, the tech oligarchs seek to buy political protection, usually from the Democrats. In 2012, tech firms gave Democrats roughly twice as much  campaign money to Democrats than to Republicans.

If anything, grassroots techies are even more left-oriented, with 91 percent  of the contributions of Apple employees in the 2012 presidential race going to President Obama.

Yet despite these leanings, the tech oligarchs manage to get a pass from conservatives. Perhaps some have over-imbibed Ayn Rand, becoming prisoners of an ideology that suggests the valley elites reflect a  “meritocratic” ideal driven by profits. That’s an interesting take since so many leading tech firms, from Amazon to Twitter, actually earn little or no profit. They benefit instead from easy access to capital markets, from which they can extract enormous earnings through stock inflation.

Other conservatives also seem to share the views of the most prominent tech libertarian, Paypal co-founder Peter Thiel, who claims that non-conformist business is now “increasingly rare outside of Silicon Valley.” Yet given the “me too” nature of much of what passes for tech today, and the huge advantages to those who can access venture capital,  perhaps American farmers, wildcat oil drillers and even cutting edge restaurateurs take bigger risks, and provide better bigger social rewards to the overall economy.

Commentators on the right and much of the left  seem to have forgotten that the valley is no longer dominated by scraggly outsiders creating amazing innovative products. In most cases now they are essentially extending the power of the Internet—developed by the U.S. military and paid for by American taxpayers—into a host of fields from transportation to renting out rooms. In many cases they are simply redistributing to themselves money that once went to publishing companies, taxi drivers and hotels. That’s capitalism, but not inherently moral, or compassionate.

In reality the valley elite is increasingly nothing more than the latest iteration of   oligopolistic crony capitalism. Firms like Google, Apple and Microsoft hold market shares in their fields upwards of 80 percent. In some cases, they do it without improving their products, as anyone using Microsoft products can certainly attest. Their control of their markets is far greater than those of  the  largest oil, automobile or home-building firms.  Tech firms, particularly in California, have also been primary beneficiaries of crony capitalism, particularly in terms of “green energy” schemes that are far from market-worthy. Despite this, Google and their ilk get subsidies to reap profits while forcing California’s middle and working classes to pay higher bills.

As a country, it is time to understand that the tech oligarchs are not much different from, and no better than, previous business elites. Like oil companies under the Bushes, they relish their ties to the powerful, as evidenced by Google’s weekly confabs with Obama administration officials. No surprise that a host of former top  Obama aides—including former campaign manager David Plouffe (Uber) and White House press secretary Jay Carney (Amazon)—have signed up to work for tech giants.  

None of this is to say that the tech elites need to be broken up like Standard Oil or stigmatized like the tobacco industry. But it’s certainly well past the time for people both left and right to understand that this oligarchy’s rise similarly poses a danger to our society’s future. By their very financial power, plutocratic elites -- whether their names are Rockefeller, Carnegie, Page, Bezos or Zuckerberg --  need  to be closely watched for potential abuses instead of being the subjects of mindless celebration from both ends of the political spectrum.

This piece first appeared at Real Clear Politics.

Joel Kotkin is executive editor of NewGeography.com and Roger Hobbs Distinguished Fellow in Urban Studies at Chapman University, and a member of the editorial board of the Orange County Register. He is also executive director of the Houston-based Center for Opportunity Urbanism. His newest book, The New Class Conflict is now available at Amazon and Telos Press. He is also author of The City: A Global History and The Next Hundred Million: America in 2050.  He lives in Los Angeles, CA.

Official White House Photo by Pete Souza.

Is Suburbia Crashing? Suburban Traffic Myths Refuted

$
0
0

Traffic crashes are a cause of ill health, impaired living or curtailed lifespan. Does city growth, in its sprawl-type outward expansion, increase the incidence of fatal and injurious crashes? This factor is the latest addition to numerous attempts to pin a correlation or causality linking traffic accidents with any number of causes.

The twentieth century is not the only time in city evolution at which traffic accidents became a concern. Around the end of nineteenth century, when all in-city transportation was hoof and foot-dependent, accidents in cities were common.

In New York, for example, 200 persons died in accidents in the year 1900, which, when transposed, means a 75 percent higher per capita rate than today. In Chicago the rate per horse-drawn vehicle in 1916 would be almost seven times the per auto rate in 1997.

These are surprising, counter-intuitive statistics: the two cities, as all others at the time, were not just walkable, they were predominantly foot-based cities; exemplars of urbanism. No person had to cross six-lane arterials or dodge high-speed vehicles. Distances were short, city blocks small, densities high, and personal daily routine took place mostly on foot. It seems paradoxical that a walkable, dense, mixed-use city would generate high fatality rates; and more so because the speed of traffic ranged between 3 and 9 m/hr : half or less the 20 m/hr threshold beyond which fatalities increase. Without sidetracking for explanations, we can draw at least one simple idea from this past: a dense, foot-based city can generate high rates of fatalities.

Soon after motorized transport entered city streets, fatal crashes rose. In the face of appalling and rising death figures, many adjustments occurred over a 30-year period. None of these changes involved urban form; they were inevitably operational and regulatory (e.g. lane markers, stop signs, driving rules, etc).

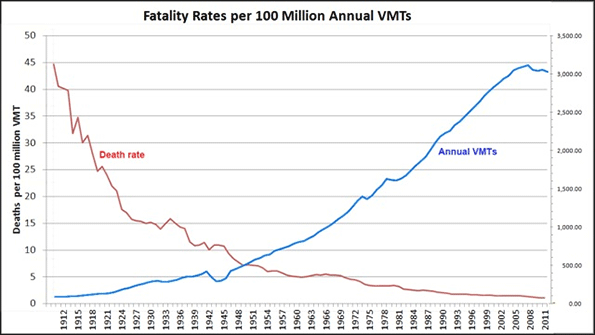
In the U.S. during the first decades of the automobile’s presence on city streets, car accident rates fell rapidly even though car travel tripled between 1920 and 1955.

During the same period the urban form characteristics remained fairly stable. The modest suburban expansion of cities at that time was light-rail dependent; “motopia” had yet to emerge . Most urban form of the '30s and '40s was generally similar to the early twentieth century prototypes: medium to high density compact development around a rail line or station with a core of amenities and services. It is nearly impossible to determine whether or not this form played a role in the drop in fatalities, due to the absence of concurrent alternative forms. When new “motopia” forms emerged, trends in fatalities did not bear out their influence.

When automobile dominance was firmly established and new highways opened vast tracts of land for city growth, urban form at the city periphery changed decisively from compact, mixed use, walkable and transit-centered to typical “motopia” or “sprawl.”

Despite a Smart Growth America recent claim of a correlation between sprawl and an increase in fatal accidents and a small decrease in injuries, the traffic fatality rate actually decreased as U.S. cities sprawled and total VMTs increased.

The current level of traffic fatalities stands at about one third of the 1955 level and less than 1/20 of the 1925 rate. Intriguingly, sprawl at the national scale did not produce an increase in fatal or total crashes as analysts predicted. If the sprawl paradigm did play its negative role, then other countervailing factors must have had a greater influence that overshadowed its effect.

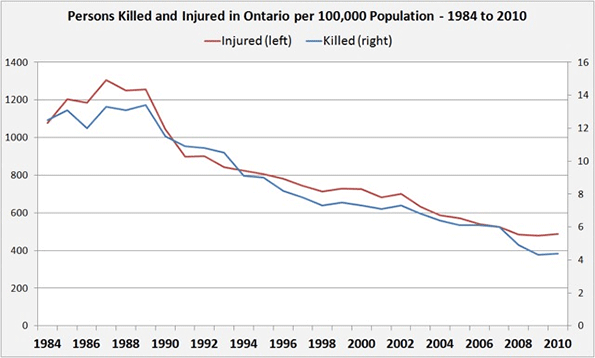
The national trends in Canada mirror those of the U.S. Notably, fatal crashes fell at a faster rate than injuries, increasing the uncertainty about the correlation that links a substantial rise in fatalities with a rise in “sprawl-ness”. Provincial statistics show similar trends. The chart below shows the trends in Ontario, the most populous Canadian province:

During a quarter century of more suburban expansion, fatalities and injuries followed a similar decline for a respective drop of around 70 percent in fatalities and about 60 percent in injuries; a substantial change. Like the national level statistics, provincial ones reinforce the uncertainty about a correlation between urban form and traffic fatality rates; instead of upward climb, we see an unmistakable decline.

But what do statistics show at the finer, city scale?

We turn to two – Toronto and Calgary – of six Canadian cities whose sprawl has been documented in detail. In spite of their anti-sprawl policies, in most the movement was retrograde, toward more sprawl.

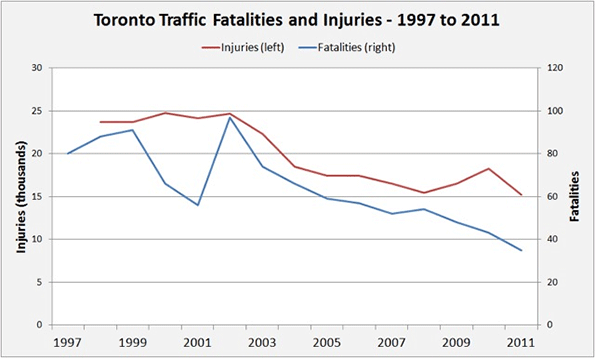
The graph above shows Toronto's trend in fatal crashes and injuries for the period of 1997 to 2011. Toronto during these 15 years can be characterized as a suburbanized region (with a few exurban appendices) that continues to expand using the conventional development model.

In addition, Calgary, Alberta, the “car capital of Canada”, according to a Smart Growth report, has Canada's lowest overall density; it remains a sprawled city. As with the national and provincial trends, the two cities’ traffic safety trends show a persistent overall drop in fatal and injurious accidents. Once more, the city-level fatalities and injuries trends contradict the correlation that links sprawl-type urban form with an increase in fatal accidents and a decrease in injuries. Whatever the countervailing factors are, they mask and overwhelm an expected rise in fatalities. As for the decrease in injuries, the actual drop is far greater than what the postulated correlation would predict and cannot be explained by it alone.

If at the national, provincial and city levels the trends are positive in spite of the negative direction of urban form, the health concerns that would justify planning interventions appear to have been alleviated on this front, at least for the first century of automobility and for the half century of uninterrupted sprawl.

One might speculate that had growth been in a compact, walkable, diverse use, transit-centered form, fatalities could have declined even faster. This could well be true but cannot be deduced from the above statistics. Regardless, the current trends could not be seen as a cause for concern and urgent action on the urban form front. On strictly health grounds, cities and provinces are progressing in the right direction. There is no apparent imminent or growing threat.

So far we have seen the difficulty of explaining the persistent drop in traffic fatalities via a correlation with “sprawl-ness” and we hypothesized that other factors may be at work. Indeed they are. We find several in overlapping lists of international, national, provincial and city documents: some linked to the causes of fatal crashes, others as government directives. Here is a collection in no particular order of importance:

Speed limit range/control
Drinking and driving laws
Young driver restrictions
Intersection geometry
Car crash-worthiness rating
Car fitness regulations
Road condition care
Driving fitness/age
Speeding penalties
Vulnerable user protection
Motorcycle helmets
Seat belt use/air-bags
Child restraints usage
Pre-hospital, on-spot care
Distraction prohibitions

As one example of the potential effect of safety measures, NHTSA in 2005 estimated that 5,839 lives would have been saved in 2004 (or 14 percent of total car-related fatalities) if all passengers wore seat belts.

Planning interventions can have multiple beneficial effects. On at least one front there is no cause for alarm or a rationale for a call to arms; the battle against traffic fatalities is being won, without urban form change. This does not suggest that a correlation between sprawl and the reduction in fatal and injurious crashes exists, or imply that sprawl is a desirable urban form. It simply means that the effect of urban form on crashes cannot be established unequivocally and therefore cannot be a lead driver for action.

Fanis Grammenos heads Urban Pattern Associates (UPA), a planning consultancy. UPA researches and promotes sustainable planning practices including the implementation of the Fused Grid, a new urban network model. He is a regular columnist for the Canadian Home Builder magazine, and author of Remaking the City Street Grid: A model for urban and suburban development. Reach him at fanis.grammenos@gmail.com.

After twenty-four years at Canada Mortgage and Housing Corporation, Tom Kerwin now leads an active volunteer life, including being the Science and Environment Coordinator for the Calgary Association of Lifelong Learners. He holds a Master’s degree in Environmental Studies from York University.

A different version of this article appeared at SustainableCitiesCollective.

Flickr photo by 7mary3: a car accident due to an unsafe lane change.

Transit Ridership Increases: No Escape from New York

$
0
0

Transit ridership is increasing in the United States. The American Public Transportation Association (APTA) has reported that 10.8 billion trips were taken on transit in 2014, the largest number since 1956. With a more than 80% increase in gasoline prices since 2004, higher transit ridership was to be expected. However, it would be wrong to suggest the transit ridership is anywhere near its historic peak, nor that the increases have been broadly spread around the nation.

Highest Ridership Since 1956 (Which was the Lowest Since 1912)

Total transit ridership in 2014 was the highest since 1956. That's just the beginning. The 2014 modern record ridership was lower than every year from 1956 all the way back to at least 1912, the last year of William Howard Taft's presidency, when transit carried 13.2 billion riders.

Transit ridership has virtually collapsed since that time in relative terms. In 1912, the average man, woman and child rode transit at least 170 times a year. Today, the figure is about 35, down 80% from 1912. During the intervening century, non-farm employment increased by more than five times and the urban population, transit's principal market, also increased more than five times. Ridership was elevated to its peak by gasoline rationing during World War II. Before that, transit ridership had peaked in 1926, as car ownership and suburbs rose before the Great Depression.

The Continuing Dominance of New York

Further, contrary to some media accounts, recent transit increases have not really been national in scope. Nearly all of it was on transit systems that serve local mobility in the City of New York as well as the rail systems serving the City from the suburbs. In the City, most of the service is provided by the Transit Authority. Additional services are provided by the New York City Department of Transportation and the Staten Island Railway. The suburban rail systems are the Long Island Railroad, the Metro North Railroad, New Jersey Transit Rail and PATH Rail. On these systems, nearly 90% of national work trip travel was to the city of New York and nearly three-quarters of those were to Manhattan.

Transit and New York: The Last Decade

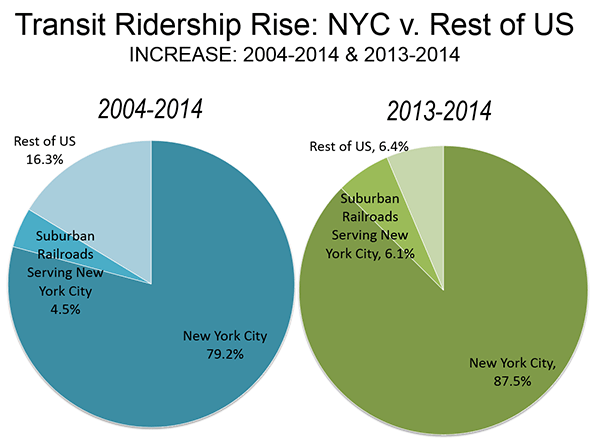
Overall, the enormous system of buses and subways of New York City alone accounted for 88 percent of the national ridership increase from 2013 to 2014. If the ridership on the four large suburban rail systems that serve New York City (the Long Island Railroad, the Metro-North Railroad, New Jersey transit commuter rail, and the PATH trains) is added, City related transit accounts for 94 percent of the increase. A great achievement for the City, but not one that is being repeated in the rest of the nation.

This is nothing new. National transit ridership has increased about 10 percent over the decade since 2004. Much of the increase --- 79 percent --- has been on New York City's buses and subways. The suburban rail systems raise that total to 84 percent. This does not include the many commuter buses that enter the city especially from New Jersey and other suburbs, which cannot extracted from the data because it is not separately reported (Figure).

New York's transit turnaround has been nothing short of impressive. Nearly all of the nation's progress in transit has been on a bus and subway system that carries one third of the national rides.

The results have not been nearly so positive in the rest of urban America, where 30 times as many people live. While New York City related transit services experienced a ridership increase of 33% in the last decade, in the rest of the nation, the increase was less than three percent. Even huge ridership increases in New York City cannot make much of a difference nationally. In 2004, transit accounted for approximately 1.6% of urban travel. By 2014, it had risen to only 1.7%. Without taking anything from New York City's impressive transit record, these results are not likely to be replicated elsewhere. New York City is a very unique place. It is home to the world's second largest business district, after Tokyo, the area south of Central Park in Manhattan. Approximately 2 million peoplework in this small area, a number approximately four times the next largest central business districts, in Chicago and Washington.

Approximately three quarters of Manhattan employees reach work by transit. This is 15 times the national average, New York City's population density (excluding Staten Island, with its postwar suburbanization) is by far the highest and most extensive in the nation. The city of San Francisco comes the closest to New York City, with little more than half the population density and only 1/10 the total population.

Transit is often suggested as a substitute for the car. The reality is that transit can compete with the car only to the largest downtowns. Destinations within the six transit "legacy cities," (not metropolitan areas) of New York, Chicago, Philadelphia, San Francisco, Boston, and Washington account for most of the nation's transit work trips. And, 60% of these trips are to downtown.

Transit cannot compete elsewhere, because travel times tend to be double those of the automobile (according to the American Community Survey) and it provides little practical access to most jobs.  University of Minnesota research indicates the average employee can reach fewer than 10 percent of jobs in less than one hour by transit in 46 major metropolitan areas. By contrast, approximately 65% of people who drive reach their jobs in less than 30 minutesby car in the major metropolitan areas. Building new rail systems doesn't change the equation. At least 20 new urban rail systems have been built in the last four decades, though transit's percentage of work trips has generally not improved, despite representations about reducing traffic congestion to the contrary. For example, in Portland, Washington, Los Angeles, Dallas-Fort Worth, and Atlanta, which have among the most extensive new rail systems, a smaller percentage of commuters use transit than before rail opened, when there were only buses.

Even low income workers, who are often portrayed as "transit dependent," use cars much more than transit, and at a rate nearly equal to that of others in the labor force.

Yet, transit funding advocates continue to seek even more money, claiming that transit can attract drivers from their cars and reduce traffic congestion. That may be true in New York City's uniquely transit-friendly environment, but not elsewhere.

Wendell Cox was a three-term member of the Los Angeles County Transportation Commission and chaired two APTA national committees. He is a public policy consultant in St. Louis and is a senior fellow at the Center for Opportunity Urbanism.

Photo: Bart A car Oakland Coliseum Station

Why California's Salad Days Have Wilted

$
0
0

“Science,” wrote the University of California’s first President Daniel Coit Gilman, “is the mother of California.” In making this assertion, Gilman was referring mostly to finding ways to overcoming the state’s “peculiar geographical position” so that the state could develop its “undeveloped resources.”

Nowhere was this more true than in the case of water. Except for the far north and the Sierra, California – and that includes San Francisco as well as greater Los Angeles – is essentially a semiarid desert. The soil and the climate might be ideal, but without water, California is just a lot of sunny potential, but not much economic value.

Yet, previous generations of Californians, following Gilman’s instructions, used technology to build new waterworks, from the Hetch Hetchy Dam to the L.A. Aqueduct and, finally, the California State Water Project and its federal counterpart, the Central Valley Project. These turned California into the richest farming area on the planet and generated opportunities for the tens of millions who came to live in the state’s cities and suburbs.

Read the entire piece at The Orange County Register.

Joel Kotkin is executive editor of NewGeography.com and Roger Hobbs Distinguished Fellow in Urban Studies at Chapman University, and a member of the editorial board of the Orange County Register. He is also executive director of the Houston-based Center for Opportunity Urbanism. His newest book, The New Class Conflict is now available at Amazon and Telos Press. He is also author of The City: A Global History and The Next Hundred Million: America in 2050.  He lives in Los Angeles, CA.

Photo of Lake Palmdale California Water Project by Kfasimpaur (Own work) [Public domain], via Wikimedia Commons


Florida's Everglades: A Vernacular Far From Miami

$
0
0

South Florida connotes a certain lifestyle in media and popular culture. Miami’s bright, tall energy has always been intertwined with the Florida Everglades’ quiet, flat landscape – low, grassy plains soaked with swamp water and edged by dense jungle. The seam where these two opposites meet is neither active nor passive; it is, instead, a third thing, where man’s activity has subtly modified the landscape, and nature has slowed man’s pace closer to its own. The edge of the Everglades has an almost off-kilter Caribbean or Central American sense of place that feels exotic and familiar at the same time. Its pleasant tension reassures me there is still an edge to Florida, when the scratchy blanket of protective regulation is thrown off to reveal informal, naturalized structures that blend beautifully into the natural environment.

Southwest of Miami lies the city of Homestead, Florida, famous for being the front door through which Hurricane Andrew entered Florida in 1992. Today, Homestead is an exurb of Miami, with a relentless street grid extending west and south. Homestead’s housing, schools, and commercial strips grew after Andrew’s devastation, ending only at the hard edge of the Everglades National Park.

Along this line, the housing and farmland stops, and is taken over by the wide 'River of Grass' –the term of the writer Marjory Stoneman Douglas, which has come to be synonymous with the Everglades' ecosystems of marshes, swamps, mangrove forests, rocky land, and marine environments. Douglas, as well as local writers Patrick Smith and Carl Hiassen, has brought this unique place to life, with vivid descriptions of the colorful, offbeat character of the people who seem attracted to its vastness, and the freshwater river under it that flows down to the Caribbean Sea.

Homestead’s western frontier is a jagged edge, a squared-off, pixilated curve defined by a patchwork of rear property lines and rural roads. On one side, houses pop up in between rows of beans; on the other, there grows a green a jumble of ficus and palmetto. At more than one location abandoned asphalt strips crumble into the jungle’s interior, a subdivision extended a little too far. Here, no one ever built a home, and the empty lots pass into a suburban archeology of rusted street signs and vine-choked fire hydrants, a developer’s dream faded away.

In the agricultural areas, open fields with crops alternate with tropical fruit groves. Mango, papaya, banana, and coconut bloom in the spring, their fragrant scents wafting in the early morning air. Workers in the field are dwarfed by the flat landscape, a world away from the America’s eighth largest metropolitan area.

Here, the vernacular building style is a colorful, deliciously un-Miami-like mix of shipping containers and barn tin. The traditional Seminole chickee —a rough, open hut with a raised floor, on a log frame — lends a tropical, exotic flair to this spotty rim of human inhabitation, pressed against nature’s vast size. The chickee's thatched palm fronds create a natural insulation barrier that blocks the sun’s heat, and the fully open sides allow the tiniest of breezes to move air through the space underneath. This native response to the land is more appropriate than the thick-walled, stucco-buttered architecture imported from arid Spain and grafted onto Florida’s humid, wet character. The Seminole answer was to work with nature, have a light touch, and when a hurricane blows it all away, build it again. The classic Florida Chickee is an informal structure that the Seminole tribe builds. Some still use as living quarters in a way similar to camping (for those who prefer air conditioning, power, and plumbing, a more modern house is used).This zen approach to fulfilling the human need for shelter is decidedly un-modern and soft, and the chickee presence at the edge of the Everglades lends a certain amount of respect to the power of nature just beyond.

Civilized life is stripped away, layer by layer, on the margin of the city. Abandoned subdivisions and Native American chickees coexist together, creating a sense of place that overlays the premodern chickee onto the failed subdivisions of modernity. This sense of place tends to mark man’s over-reach into the wilderness. Yet another marker can be found on buildings constructed by modern means, where layers of veneer have not been added: raw materials, unpainted and unadorned, stand crude and timeless against the trees and the sky. The edge’s presence can be sensed where structures start to dissolve into informality.

Everglades National Park is a hard, urban boundary on the map, but on the ground it is a blurred zone where the slow-moving river of grass influences human activities. The nuanced edge continues into the Everglades themselves, where Florida’s subtle water-nature is uninterrupted. Water flows in a gentle, slow sheet across Florida’s flat limestone bed, coated with organic material barely thick enough for life to cling to. Where the limestone base dips a few inches, grass fails to grow; where a nub rises a few inches above this hard plain, unique tree islands gather. These islands are too densely vegetated to admit any human. Their edges are wrapped in a thick tangle of branches and leaves, a sort of bonsai-forest in miniature. Insects, birds, and other small creatures inhabit these infrastructures, forming their own natural urban civilizations of city-states, out of man’s reach.

In between approaching jets and the distant rumble of airboats, a larger silence takes over. Penetrating the membrane between inside and outside gives us a new perspective. To confine our efforts to areas that are already strongly modified by human activities suddenly makes philosophical sense. Boundaries, once created, harden over time, and the softness of the western edge of humanity against the eastern boundary of the Everglades seems destined to harden. In its current state, this snapshot of the feathered, nuanced edge of civilization seems to be delicately balanced between the rural and the natural. Agricultural industry on the periphery of the great conurbation of Miami moves at a pace that is in between the seasonal flow of the Everglades and the nanosecond street culture of contemporary western civilization.

Florida’s ubiquitous industry, tourism, mixes with agriculture even here at the edge of the wetlands, with the airboat rides, fruit stands, and alligator wrestling shows that pepper it. The vernacular architecture of the Everglades is not quite agricultural, yet not quite contemporary Florida either. Its flavor is connected to the Caribbean tropicalism one finds on islands like Puerto Rico, Barbados, and Hispañola. Endlessly adaptable shipping containers sit cheek-by-jowl with chicken coops and thatch awnings to create an ad hoc pedestrian space under palm trees. All is a little too clean and, well, 'inspected,' to be really offshore. But it’s also a little more relaxed than the uptight, postmodern built environment we’ve come to expect in America.

Heading east out of the Everglades is a somewhat wistful journey forward in time. Rural roads lined with mango trees abruptly give way to fruit processing plants, which back up to grocery store strips, and the standard parade of global brand names enters the windshield, a gateway back into contemporary America. Stoplights take longer, the traffic pace quickens, and today’s Florida, like a hair shirt, envelops you in a cocoon of highly regulated infrastructure, put there for your own protection.

Richard Reep is an architect with VOA Associates, Inc. who has designed award-winning urban mixed-use and hospitality projects. His work has been featured domestically and internationally for the last thirty years. An Adjunct Professor for the Environmental and Growth Studies Department at Rollins College, he teaches urban design and sustainable development; he is also president of the Orlando Foundation for Architecture. Reep resides in Winter Park, Florida with his family.

Photos by the author: (top) vernacular building style on the edge of the Everglades; early morning workers arrive in Homestead by bus; protypical Chickee hut; unpainted structure, common on the edge of the Everglades.

The Valley And The Upstarts: The Cities Creating The Most Tech Jobs

$
0
0

No industry generates more hype, and hope, than technology. From 2004 to 2014, the number of tech-related jobs in the United States expanded 31%, faster than other high-growth sectors like health care and business services. In the wider category of STEM-related jobs (science, technology, engineering and mathematics), employment grew 11.4% over the same period, compared to 4.5% for other jobs. The Commerce Department projects that growth in STEM employment will continue to outpace the rest of the economy through 2018.

But all the new tech jobs have not been evenly distributed across the country. To determine which areas are benefiting the most from the current tech boom, Mark Schill, research director at Praxis Strategy Group, analyzed employment data from the nation’s 52 largest metropolitan statistical areas from 2004 to 2014. He looked at the change in employment over that timespan in companies in industries we associate with technology, such as software, engineering and computer programming services. (Note that this includes everyone at these companies, such as non-tech employees like janitors and receptionists). He also looked at the change in the numbers of workers in other industries who are classified as having STEM occupations (science, technology, engineering and mathematics-related jobs). This captures the many tech workers who are employed in businesses that at first glance may not seem to have anything to do with technology at all. For instance just 7% of the nation’s 1.5 million software developers and programmers work at software firms — the vast majority are employed in industries as disparate as manufacturing, finance, and business services.

Our list features some well-known outperformers, but also some surprising metro areas usually not associated with venture capital and Silicon Valley. We also found that some high-profile metro areas that like to tout themselves as the “next Silicon Valley” are actually at best the middle of the pack in terms of tech and STEM job growth.

The Strongest Engines

At the top of our list is a group of cities that have long been identified with tech growth. Our No. 1 city, Austin, Texas, boasts the strongest expansion in tech sector employment of any of the nation’s 52 largest metropolitan areas from 2004 to 2014, 73.9%,  as well as 36.4% growth in STEM jobs, the fourth-highest growth rate in the country. Coming in a close second is Raleigh, N.C.,  part of the renowned Research Triangle region, home to outposts of multinationals like Bayer, BASF, GlaxoSmithKline, IBM and Cisco. The Raleigh metro area posted a 39% increase in STEM jobs from 2004-14, the fastest growth in the nation, albeit from a smaller base than many of the other biggest metro areas.

However, the Bay Area continues to reign as the tech center with the most momentum. San Jose, which covers most of Silicon Valley, ranks third with 70.2% growth in tech sector employment since 2004 and a hefty 25.8% increase in STEM employment. The San Francisco metro area, which includes San Mateo to the south, ranks fifth with a 67.4% jump in tech industry employment as well as a STEM jobs increase of 27.5%.

There may be more tech industry employees and workers in STEM occupations in the New York City, Washington, D.C., and Los Angeles metro areas, but San Jose has the strongest concentration of tech horsepower in the nation, with by far the highest per capita concentration of people in engineering professions. San Jose’s tech industry is responsible for 14.1% of all jobs, almost five times the national average of 2.9%. The share of STEM workers is 15.5% of its total workforce, three times the 5.0% proportion in the overall U.S. population. Both figures are easily the highest in the nation. San Francisco clocks in at second nationally with 7.6% of its jobs in tech industries and is fifth in STEM representation, at 8.7% of all workers, behind San Jose, the nation’s capital, Seattle, and our No. 1 city, Austin.

Silicon Valley’s thick concentration of titans like Intel, Apple, Oracle, Google and Facebook has created an innovative ecosystem, which, as Pando Daily’s Michael Carney describes, supports a “systematic irrationality and a feedback loop” that encourages many tech entrepreneurs to turn down the easy early exit of selling out to a bigger company and make the commitment to grind for a decade or more in the hopes of joining the afore-mentioned standouts as a massive success.

No other area apart from Seattle (No. 7 on our list) comes close in this regard to nurturing tech giants. The success of the Bay Area and Valley also attracts outsiders who want to be close to the action, including foreign players like Samsung, and old economy stalwarts that need a tech infusion like Wal-Mart.

The Surprise Tech Upstarts

Some of the others in our top 10 are not as renowned as tech centers, but have experienced rapid growth over the past decade. The biggest surprise may be No. 4 Houston, which enjoyed a 42.3% expansion of jobs in tech industries and a big 37.8% boost in STEM jobs from 2004-14. Much of the growth was in the now sputtering energy industry, but also medical-related technology, which continues to grow rapidly. Houston is the home to the Texas Medical Center, the world’s largest concentration of medical facilities. It also ranks second to San Jose in engineers per capita.

The Mountain West metropolises of Salt Lake City (sixth) and Denver (11th) also have posted impressive growth, and now boast considerably higher share of tech and STEM workers in their populations than the national average; in Salt Lake City 5.9 percent of jobs are in tech industries and 4.1% are in STEM. Denver is even more impressive with 7.3% of jobs in tech industries and 5.1% working in STEM.  Salt Lake City’s gains are linked to a continued migration of tech firms, largely from Silicon Valley, whereas Denver is making waves as a start-up incubator.

The other top cities on our growth list all tend to be emerging tech centers. These include No. 8 Nashville, where strong growth in data centers and systems design firms is at least partially tied to its strength in the health sector, No. 9 Jacksonville, driven by IT and computer programming services firms, and, perhaps most surprising, No. 10 Memphis, whose 35% tech growth since 2012 is due mostly to significant recent growth in engineering services. However, the tech sectors in these cities are still very small — Memphis had only 7,800 tech industry workers last year — and all three still trail the national average for the share of tech workers in the population.

More Hat Than Cattle?

Some journalists and pundits believe tech is moving from its suburban roots and towards dense, large cities. And there’s some truth to the fact that the social media boom, and some tech-driven services, appeal naturally to the same creative and culturally minded workforce concentrated in core cities. But this shift is not too evident in terms of job creation. High-tech growth in city centers may have more to do with tech sector expansion in general occurring in every type of geography.

Suburban Silicon Valley, for example, has nearly twice the concentration of tech jobs as San Francisco; even amidst the social media boom, the Valley since 2012 has greatly outpaced the City and its immediate suburbs in terms of both new tech and STEM employment. The largest tech projects going up in the Bay Area — new headquarters for Google, LinkedIn and Apple – are being built in the Valley, not the city.

Unlike San Francisco, cities located far from tech centers have not done nearly as well as often reported. Chicago has been desperate to portray itself as a major tech center, developing elaborate facilities for companies, while promoting its own high-tech icon, Groupon, and crowing over the high-profile names its lured to open up offices in the city, like Google. Mayor Rahm Emmanuel has even proposed expanded bike lanes as part of his plan to lure tech-savvy members of the “creative class” to his city.

Yet despite all the noise, Chicago ranked a mediocre 33rd on our growth list, with 20.3% tech industry employment growth from 2004-14 and a mere 3.8% growth in STEM jobs. Both numbers are below the national average, as is the region’s percentage of employees in tech and STEM.

How about Los Angeles, with its fabulous weather, elite universities (Caltech, University of Southern California, UCLA, Cal Poly Pomona and Harvey Mudd College) and close ties to the creative engine of Hollywood? Local boosters like to claim that the metro area is undergoing a full-scale “tech boom” focused on the west side in its so-called “Silicon Beach.” To be sure, the region still boasts the second largest pool of STEM workers in the country, in part due to its legacy of manufacturing, led by its shrunken but still sizable aerospace industry (63,000 jobs, down by 90,000 since the end of the Cold War). But Los Angeles’ large STEM numbers are to a great degree a function of the massive population of the metro area – the percentage of STEM employees in the workforce is 4.9%, a hair below the national average of 5%, while 2.5% of its workforce is in tech industries, trailing the national average of 2.9%. Los Angeles lands a poor 38th on our growth list, with an 18.7% expansion in tech industry jobs since 2004 and a 4% increase in STEM jobs, a shade below the national average of 4.2%.

But perhaps the biggest surprise is New York, whose boosters are now claiming it to be the No. 2 tech center in the nation and the Valley’s chief rival. However, on our job growth list New York sits in a mediocre 35th place, with 24.3% growth in tech industry employment over the past 10 years, and only 4% in the last two. In STEM, New York still has the largest number of jobs of any metro area in the nation at 428,000 as of 2014, but that’s up a paltry 2.7% since 2004, and, as in the case of L.A., is a function of its large population. The percentage of STEM employees in the local workforce falls short of the national average at 4.4%. New York has gained about 51,000 technology industry jobs since 2004 and 12,000 since 2012, giving it a total of roughly 265,000 tech jobs. But that’s some 70,000 fewer than the Bay Area, an economy about one third the size of New York’s.

Critically, most New York “tech” seems more linked to media than actual physical products, essentially replacing many of its old media jobs with newer ones. Part of the problem for New York is that it’s profoundly weak in engineering talent, ranking 78th out of 85 metropolitan areas in engineers per capita.

The Bay Area Versus The Rest

The current social media bubble will surely pop, but as Michael S. Malone and others have noted, the Bay Area’s preeminence will likely continue, fueled by its unique concentration of engineers, entrepreneurs, and risk capital. Instead of losing out to New York, Silicon Valley and San Francisco are luring many top performers from Wall Street. Google alone has 1,200 employees who formerly worked for large U.S. investment banks, and migration from the Big Apple to California is now at its highest level since 2006.

In the coming years the engineering-centered Valley seems better positioned to seize on the challenges posed by the “Internet of things,” including systems for heating and cooling and autonomous cars, as well as biotechnology. In the long run, the Valley’s hegemony is threatened not by any one place, but by several that offer significant technical expertise, with far lower housing costs. San Francisco is already by far the nation’s least affordable metro area. Only 11% of residents making the median annual income can afford to buy a home, according to the NAHB/Wells Fargo Housing Opportunity Index – and the median income is in the San Francisco area is a hefty $100,400. The Valley is not far behind at 21.8%. The high prices throughout the Bay Area has become a concern of tech executives, who fear they will have troubles attracting more experienced engineers and managers.

No matter the headlines, the reality is that future tech growth is more likely to be created by the less sexy business services sectors than by Internet media or software publishers. In the last decade three often-ignored industries — engineering services, systems design and custom programming – added nearly 750,000 jobs, while software providers and Internet properties added less than 200,000. The decentralizing force of these boring sectors is what’s driving growth in the second- and third-tier tech cities.

But despite these trends, don’t expect the landscape of American technology, particularly at the high end, to change dramatically in the near future. Inertia is a powerful force, as is the enormous concentration of venture funds and expertise around the Bay Area. But if no one area can hope to challenge Silicon Valley’s lead position, it is likely tech growth will continue to flow to other areas that could collectively take the tech capital of the world down a notch or two.


2015 Metropolitan Tech-STEM Growth Index
RankRegion (MSA)Score2004-2014 Tech Industry Growth2012-2014 Tech Industry Growth2014 Tech Industry LQ2004-2014 STEM Occuptn Growth2012-2014 STEM Occuptn Growth2014 STEM Occuptn LQ
1Austin87.473.9%21.8%1.9036.4%11.2%1.77
2Raleigh, NC85.762.3%17.0%2.2339.0%13.4%1.63
3San Jose78.170.2%19.6%4.9225.8%10.2%3.11
4Houston77.842.3%18.5%1.2637.8%12.3%1.30
5San Francisco70.567.4%13.0%2.6427.5%7.9%1.74
6Salt Lake City, UT70.062.4%11.0%1.4433.3%7.5%1.17
7Seattle66.558.3%7.4%2.3437.6%6.2%1.94
8Nashville65.368.6%15.1%0.6814.7%7.6%0.80
9Jacksonville, FL62.758.4%13.5%0.8716.0%8.2%0.84
10Memphis, TN61.035.3%34.9%0.415.0%7.4%0.63
11Denver56.434.5%10.1%1.7924.4%7.8%1.47
12Indianapolis55.952.2%8.2%0.8815.0%7.4%1.04
13Charlotte, NC54.836.4%8.7%0.8123.8%7.1%0.96
14Phoenix54.151.1%13.3%0.9013.9%5.1%1.10
15Kansas City, MO54.046.2%11.2%1.4916.5%6.0%1.11
16Portland, OR52.533.2%9.6%1.1019.8%7.2%1.31
17San Antonio52.143.5%4.3%0.9226.6%4.8%0.82
18Dallas52.143.9%6.0%1.1122.0%5.4%1.20
19Boston, MA50.943.4%9.9%2.2816.0%5.2%1.59
20Sacramento47.547.8%6.7%0.9411.6%4.7%1.36
21Grand Rapids46.726.4%13.2%0.507.1%7.6%0.95
22Louisville, KY46.523.7%10.8%0.5716.4%6.0%0.74
23San Diego45.433.8%7.2%1.8116.0%4.7%1.44
24Las Vegas45.113.6%15.0%0.578.8%8.0%0.47
25Tampa43.726.8%10.7%0.994.2%7.4%0.91
26Orlando42.918.3%8.7%0.9613.9%6.4%0.82
27Baltimore40.030.4%5.2%1.5516.6%2.6%1.42
28Atlanta38.019.1%5.7%1.2210.2%5.4%1.10
29Minneapolis37.817.8%7.7%1.0711.0%4.6%1.24
30Cincinnati, OH37.020.6%8.7%0.818.1%4.0%1.04
31Pittsburgh, PA35.825.2%3.1%1.0614.4%2.5%1.06
32Miami35.03.6%13.3%0.64-1.0%7.3%0.62
33Chicago, IL34.320.3%8.8%0.913.7%3.8%0.93
34Richmond, VA32.433.9%-2.9%0.799.7%2.2%1.00
35New York32.224.3%4.7%0.965.0%2.7%0.89
36Cleveland32.121.7%5.3%0.744.1%3.2%0.91
37Hartford31.930.7%4.9%0.894.9%1.2%1.12
38Los Angeles31.118.7%4.9%0.862.1%4.0%0.99
39Detroit29.26.2%8.5%1.97-2.3%5.4%1.44
40Columbus, OH27.99.5%3.1%1.079.4%2.3%1.19
41Riverside25.512.8%0.1%0.334.7%2.7%0.53
42Providence24.913.1%1.3%0.760.5%3.1%0.88
43New Orleans24.821.6%8.0%0.68-11.1%2.4%0.68
44Oklahoma City, OK23.90.4%-4.8%0.4915.5%2.6%0.96
45Buffalo23.226.3%-2.4%0.803.1%-0.1%0.85
46Birmingham22.73.3%2.7%0.651.7%2.8%0.82
47St. Louis, MO21.99.5%-3.5%0.893.1%2.9%1.00
48Philadelphia, PA21.610.0%2.4%1.170.6%1.2%1.09
49Rochester, NY19.912.0%8.1%0.74-4.5%-0.8%1.06
50Washington, DC16.47.3%-4.7%2.5910.8%-2.0%2.07
51Milwaukee16.30.1%-2.8%0.761.5%1.6%0.99
52Virginia Beach8.0-2.2%-7.3%1.041.5%-1.5%1.05

To determine the metro areas that are generating the most tech jobs, Mark Schill of Praxis Strategy Group,  mark@praxissg.com, examined employment data in two different categories. Half our ranking is based on changes in employment at companies in high-technology industries, such as software and engineering. (This includes all workers at these companies, some of whom, like janitors or receptionists, do not perform tech functions). Half is based on changes in the number of workers classified as being in STEM occupations, which captures tech workers who are employed in all industries, including those not primarily associated with technology, such as finance or business services. We ranked the 52 largest U.S. metropolitan statistical areas by the growth in tech and STEM employment from 2004 to 2014, as well as for their more near-term growth from 2012 to 2014 to give credit for current momentum.

This piece originally appeared at Forbes.

Joel Kotkin is executive editor of NewGeography.com and Roger Hobbs Distinguished Fellow in Urban Studies at Chapman University, and a member of the editorial board of the Orange County Register. He is also executive director of the Houston-based Center for Opportunity Urbanism. His newest book, The New Class Conflict is now available at Amazon and Telos Press. He is also author of The City: A Global History and The Next Hundred Million: America in 2050.  He lives in Los Angeles, CA.

Mark Schill is a community process consultant, economic strategist, and public policy researcher with Praxis Strategy Group.

Photo "Sixth Street Austin" by Larry D. Moore. Licensed under CC BY-SA 3.0 via Wikimedia Commons.

In NYC, Throwing Good Infrastructure Money After Bad

$
0
0

Ten billion dollars — for a bus station. And if other projects are any guide, this price tag for a Port Authority Bus Terminal replacement is only going up from there.

That’s after we’ve committed: $4.2 billion at the PATH World Trade Center station; $1.4 billion for the Fulton St. subway station; $11 billion for the East Side Access project; $4.5 billion for just two miles of the Second Ave. Subway, and $2.3 billion for a single station extension of the 7-train.

Having grown numb to multi-billion price tags for building almost anything, New Yorkers might not know just how messed up all this is. In any other American city, even just one of these fiascoes might well have sunk the entire town.

Read the entire piece at the New York Daily News.

Photo by Metropolitan Transportation Authority of the State of New York (East Side Access: January 13, 2014) [CC BY 2.0], via Wikimedia Commons

Dispersion in Europe's Cities

$
0
0

For any who had been following demographic trends closely in Western Europe, it is long been obvious that suburbanization was following generally the same track as in Canada (more than 75 percent suburban), Australia and the United States (85 percent suburban). Nearly all growth in the major cities has been in the suburbs for the last four decades.

The massive postwar automobile oriented suburbanization of Europe started a bit later than in the Western offshoots of the British Empire as the fabled economic historian Angus Maddison called them. It took a while for Western Europe to recover from World War II, but by 1970 much had been restored.

This article reviews citywide population trends, divided into their core and suburban (or exurban) components from 1971 to 2011. This is a far more complicated exercise than reviewing the urban trends of Canada, Australia, and the United States. Ten years ago I published an examination of European trends relying principally on using data from the Ranally Metropolitan Areas, which had been established by my friend Richard Forstall, then at Rand McNally. Metropolitan areas are particularly difficult to compare across international lines because the few nations that designate them use different criteria and most nations do not designate them at all.

Regretfully, the internet and perhaps other commercial considerations made the Ranally Metropolitan Areas a thing of the past.

Data Difficulty in Western Europe

The only source that approaches consistency is the United Nations Urban Agglomerations (urban areas) list. In its latest iteration the list includes data from 1950 through projections to 2030 in five year increments for approximately 1700 cities around the world. But, the United Nations must rely on member states to provide the information, which is often not urban agglomeration data at all.

Some nations report urban area data. Others report metropolitan area data. Urban areas and metropolitan areas are not the same thing. Urban areas are built up areas defined by the extent of the urban form, rather than by jurisdictional boundaries (see Demographia World Urban Areas). Metropolitan areas encompass both the urban area and the economically connected areas to the outside (exurbs). The difference is that urban areas do not include exurbs and metropolitan areas do (Figure 1).

Some nations report only core municipality data, which is incomplete. Characterizing cities as only the core is rather like declaring a leg or a lung to be the same thing as a human body. These nations include Germany and Austria. Data for Valencia, Spain is also for the core municipality only.

Perhaps the best source for citywide trends over the last 40 years in Western Europe is the United Nations data. The results are reported for urban areas and metropolitan areas, ignoring the irrelevant reported core data. Cities are included that had a population of 750,000 or more in any year from 1970 to 2010 on the UN World Agglomerations list. As of 2011, there are 24 urban areas and 16 metropolitan areas with comparable United Nations data (Table).

How the Cities have Dispersed

Among the urban areas, the suburbs monopolized population growth over the period (1971 to 2011). Overall, the 24 urban areas increased their population by 9.1 million residents. This was the combination of a 9.7 million increase in the suburbs and a 600,000 loss in the cores. With the core losses, the suburbs accounted for 107% of the urban area growth.

The monopolization of suburban and exurban growth was even greater in the 16 metropolitan areas. The overall citywide population increase was 6.2 million. This included 8.2 million in the suburbs and exurbs and the loss of 2.1 million in the cores.

Combining these two different urban conceptions for statistical purposes shows how dominant suburban and exurban growth has been. In 1971, the cores and suburbs had about the same population. By 2011, the suburbs had grown to have 60% more residents than the cores (Figure 2).

Some of the disparities were large. In Madrid, the suburbs grew 450 percent between 1971 and 2011, compared to only 5 percent in the core. In Toulouse, the suburbs grew 327 percent, while the core edged up only 20 percent, while in Zurich, the suburbs grew 186 percent compared to the core decline of 12 percent.

Overall, core population performance exceeded that of the suburbs in only three of the 40 cases. The most significant is slow-growing Birmingham, which is closing in on its 1951 peak. Then there is Liverpool, which is managed to drop from the population peak of more than 850,000 in 1931 to under 475,000 in 2011. Liverpool's loss over the 40 years was even less percentage wise than that of the suburbs. The core of Southampton also grew faster than the suburbs.

Core Resurgence

At the same time, it notable cores have reversed their previous loss patterns in recent years. Some resurgent cores remain well below their much earlier peaks. The ville de Paris has regained little more than 100,000 of its 800,000 loss since 1921. Inner London (Note) has regained much more (800,000), but still needs another 1.3 million to restore its 1901 peak (Outer London is so suburban that it provided much of the ammunition for the British anti-suburban movement). Others cores, like Stockholm and Madrid have risen above previous peaks.

As in the United States, this urban resurgence should not lead to a perception that suburbanites are "flocking" to the urban cores. Domestic migration data continues to show net population movements from the cores to the suburbs and exurbs. Much of the resurgence has been propelled by international migration since enlargement of the European Union (such as from the growing London core), which has virtually eliminated westward barriers to immigration from the less affluent former Soviet satellites. Even the core of Stockholm, now at its population peak, has lost domestic migration to the suburbs in Stockholm County in each of the last five years according to Statistics Sweden data.

Earlier Core Troughs

The forty-year perspective masks some huge core population losses that occurred earlier. Perhaps the most spectacular is Copenhagen, which dropped from 768,000 in 1950 to 464,000 in 1992, for a percentage loss near that of Detroit from 1950 to 1990. Copenhagen's population loss was 40 percent, compared to Detroit's 44 percent (See: Shrinking Cities, Chapter 2). Since 1992, the core of Copenhagen has made up only a quarter of its loss since 1950.

The core of Glasgow also suffered earlier losses. In 1931, the core municipality had a population nearing 1.1 million. By 1971, Glasgow became the first core municipality in the world to fall below 1,000,000 population after having achieved that status. Glasgow has since been followed by Naples, Turin and Detroit. Glasgow increased its population modestly after 2001, to just under 600,000.

The Missing Cities

What can be said about Germany and Austria, which do not provide data for either urban areas or metropolitan areas? If such data were available, it would likely show the same general trends. By the early 2000s, cores such as Berlin, Dresden, Frankfurt, Hamburg, Leipzig, Munich and Stuttgart had lost population from their peaks. Between 1987 and 2001, all growth in the Rhine-Ruhr, Western Europe's third largest city, was in the suburbs and exurbs. This area, which defines the very term conurbation, may have been the first truly polycentric metropolitan area in the world, with its historic municipalities like Essen, Dusseldorf, Bochum, Gelsenkirchen, Oberhausen, Dortmund, Duisburg, Dusseldorf and Wuppertal.  Vienna reached its population peak in 1910,when  capital of the Austro-Hungarian under Emperor Franz Josef.

Better Data Ahead

Meanwhile, the state of urban statistics is improving significantly in Europe. It is to be expected that historical data would be non-comparable and cumbersome with Europe's multiple nations. However, Eurostat now publishes its own, consistent metropolitan area data. Generally data is available back to the early or mid 2000s, which will make the lives of interested statisticians better in the future.

The suburbanization of Europe may be surprising to New World tourists, who rarely venture beyond the historical cores. I called this the Louvre Syndrome, which describes New World tourists who jealousy wonder why their cites cannot look like attractive European cores, but never experience, predictably,  their extensive and   less historically appealing  suburbs. And why should they? Americans and Canadians go to Europe to see what's different, not what's similar.

What is similar is that the cities of Europe, like those in Japan and the New World have dispersed as they have become more affluent, a dynamic pointed out by Robert Bruegmann in Sprawl: A Short History. There is also considerable dispersion going on in developing world cities. There is also an imperative to disperse the inhuman densities and living conditions in many parts of African, Asia and South America. These include shantytowns like Dharavi in Mumbai, Kibera in Nairobi, Rio's notorious favelas and in Manila, with its all too frequent fires that destroy thousands of homes at once.


Core & Suburban Growth in Cities
Western Europe: 1971-2011
Urban Areas (Urban Agglomerations) and Metropolitan Areas
Population in 000s1971 Population2011 Population
 UA/MACoreSuburbsUA/MACoreSuburbs
URBAN AREAS (URBAN AGGLOMERATIONS)   
Amsterdam9388201181,064780284
Athens2,5358621,6733,0896642,425
Birmingham2,3691,0131,3562,4461,0861,360
Bordeaux590254336853239614
Dublin7835692141,114528586
Glasgow1,7328978351,210593617
Helsinki522529-71,134588546
Lille9122336791,020228792
Liverpool1,253607646865466399
London7,7872,9594,82810,2973,2327,065
Lyon1,1285076211,5634911,072
Manchester2,3915421,8492,5595032,056
Marseille1,1978943031,569851718
Newcastle876222654776149627
Nice649328321947344603
Oslo643488155916599317
Paris8,2782,5045,77410,5372,2508,287
Rotterdam959687272995606389
Stockholm1,0317472841,385847538
Southampton740213527857254603
Thessaloniki557340217754325429
Toulouse476372104891447444
West Yorkshire1,7055061,1991,7874751,312
Zurich7114232881,198373825
Urban Areas40,76317,51623,24749,82416,91832,906
METROPOLITAN AREAS (LABOR MARKETS)   
Antwerp858227631976185791
Barcelona3,5211,8281,6934,9991,6213,378
Bergamo561126435799115684
Bologna746488258766371395
Brussels1,5761431,4331,9751701,805
Copenhagen1,3386267121,207540667
Florence725460265694358336
Genoa91883286701586115
Lisbon1,8747821,0922,8265532,273
Madrid3,5953,1214745,8703,2652,605
Milan3,0401,7321,3083,0651,2421,823
Naples2,0191,2677522,2139621,251
Palermo757653104855658197
Porto9413266151,2882381,050
Rome3,1682,6565123,6172,6171,000
Turin1,7751,1426331,742872870
Metropolitan Areas27,41316,40911,00433,59414,35319,241
All68,17733,92534,25283,41831,27152,148
Populaton Change1971 Population2011 Population
 UA/MACoreSuburbsUA/MACoreSuburbs
URBAN AREAS (URBAN AGGLOMERATIONS)   
Amsterdam126-4016613%-5%141%
Athens553-19875122%-23%45%
Birmingham777343%7%0%
Bordeaux263-1527845%-6%83%
Dublin331-4137242%-7%173%
Glasgow-522-304-218-30%-34%-26%
Helsinki61159552117%11%
Lille108-511312%-2%17%
Liverpool-389-141-248-31%-23%-38%
London2,5102732,23732%9%46%
Lyon435-1645039%-3%72%
Manchester169-392087%-7%11%
Marseille372-4341531%-5%137%
Newcastle-101-73-28-11%-33%-4%
Nice2981628246%5%88%
Oslo27211116142%23%104%
Paris2,259-2542,51327%-10%44%
Rotterdam36-811174%-12%43%
Stockholm35410025434%13%90%
Southampton118417716%19%15%
Thessaloniki197-1521235%-4%97%
Toulouse4157534087%20%327%
West Yorkshire82-311135%-6%9%
Zurich487-5053769%-12%186%
Urban Areas9,061-5989,65922%-3%42%
METROPOLITAN AREAS (LABOR MARKETS)   
Antwerp118-4216014%-19%25%
Barcelona1,477-2071,68442%-11%99%
Bergamo238-1124943%-9%57%
Bologna21-1171383%-24%54%
Brussels3992737225%19%26%
Copenhagen-131-86-45-10%-14%-6%
Florence-31-10271-4%-22%27%
Genoa-217-24629-24%-30%34%
Lisbon952-2291,18151%-29%108%
Madrid2,2751442,13163%5%450%
Milan24-4905141%-28%39%
Naples194-30549910%-24%66%
Palermo9759213%1%88%
Porto347-8843537%-27%71%
Rome449-3948814%-1%95%
Turin-33-270237-2%-24%37%
Metropolitan Areas6,181-2,0568,23723%-13%75%
All15,242-2,65417,89622%-8%52%
Population in 000s
Sources:
   Urban Area/Metropolitan Area data estimated from UN
   Core data from national statistics bureaus
Core: Core municipality or previous core municipality where data available
Urban Areas/Metropolitan Areas over 750,000 in 1971 or 2001
No data for Germany, Austria or Valencia (Spain)
   Do not report data in urban area or metropolitan area format
Some cores may have added land area during the period


Wendell Cox is principal of Demographia, an international public policy and demographics firm. He is co-author of the "Demographia International Housing Affordability Survey" and author of "Demographia World Urban Areas" and "War on the Dream: How Anti-Sprawl Policy Threatens the Quality of Life." He was appointed to three terms on the Los Angeles County Transportation Commission, where he served with the leading city and county leadership as the only non-elected member. He served as a visiting professor at the Conservatoire National des Arts et Metiers, a national university in Paris and is a Senior Fellow at the Center for Opportunity Urbanism.

Photograph: Paris: Eifel Tower & La Defense from Tour Montparnasse (by author)

The Big Idea: California Is So Over

$
0
0

California has met the future, and it really doesn’t work. As the mounting panic surrounding the drought suggests, the Golden State, once renowned for meeting human and geographic challenges, is losing its ability to cope with crises. As a result, the great American land of opportunity is devolving into something that resembles feudalism, a society dominated by rich and poor, with little opportunity for upward mobility for the state’s middle- and working classes. 

The water situation reflects this breakdown in the starkest way. Everyone who follows California knew it was inevitable we would suffer a long-term drought. Most of the state—including the Bay Area as well as greater Los Angeles—is semi-arid, and could barely support more than a tiny fraction of its current population. California’s response to aridity has always been primarily an engineering one that followed the old Roman model of siphoning water from the high country to service cities and farms.  

But since the 1970s, California’s water system has become the prisoner of politics and posturing. The great aqueducts connecting the population centers with the great Sierra snowpack are all products of an earlier era—the Los Angeles aqueduct (1913), Hetch-Hetchy (1923), the Central Valley Project (1937), and the California Aqueduct (1974). The primary opposition to expansion has been the green left, which rejects water storage projects as irrelevant. 

Yet at the same time greens and their allies in academia and the mainstream pressare those most likely to see the current drought as part of a climate change-induced reduction in snowpack. That many scientists disagree with this assessment is almost beside the point. Whether climate change will make things better or worse is certainly an important concern, but California was going to have problems meeting its water needs under any circumstances.  

Not Meeting the Challenges. 

It’s not like we haven’t been around this particular block before. In the 1860s, a severe drought all but destroyed LA’s once-flourishing cattle industry. This drought was followed by torrential rains that caused their own havoc. The state has suffered three major droughts since I have lived here—in the mid ’70s, the mid ’80s and again today—but long ago (even before I got there) some real whoppers occurred, including dry periods that lasted upwards of 200 years.  

This, like the threat of earthquakes, is part of the price we pay to live in this most beautiful and usually temperate of states. The real issue is how to meet this challenge, and here the response has been slow and lacking in vision. Not all of this is to be blamed on the greens, who dominate the state politically. California agriculture, for example, was among the last in the nation to agree to monitoring of groundwater. Farmers have also been slow to adjust their crops toward less water-dependent varieties; they continue to plant alfalfa, cotton, and other crops that may be better grown in more water-rich areas. 

Many cities, too, have been slow to meet the challenge. Some long resisted metering of water use. Other places have been slow to encourage drought-resistant landscaping, which is already pretty de rigeur in more aridity-conscious desert cities like Tucson. This process may take time, but it is already showing value in places like Los Angeles where water agencies provide incentives. 

But ultimately the responsibility for California’s future lies with our political leadership, who need to develop the kind of typically bold approaches past generations have embraced. One step would be building new storage capacity, which Governor Jerry Brown, after opposing it for years, has begun to admit is necessary. Desalinization, widely used in the even more arid Middle East, notably Israel, has been blocked by environmental interests but could tap a virtually unlimited supply of the wet stuff, and lies close to the state’s most densely populated areas. Essentially the state could build enough desalinization facilities, and the energy plants to run them, for less money than Brown wants to spend on his high-speed choo-choo to nowhere. This piece of infrastructure is so irrelevant to the state’s needs that even many progressives, such as Mother Jones’ Kevin Drum, consider it a “ridiculous” waste of money. 

And there needs to be, at least for the short term,an end to dumping water into San Francisco Bay for the purpose of restoring a long-gone salmon run, or to the Delta, in order to save a bait-fish, the Delta smelt, which may already be close to extinct. This dumping of water has continued even as the state has faced a potentially crippling water shortage; nothing is too good for our fish, or to salve the hyper-heated consciousness of the environmental illuminati. 

The Political Equation 

The biggest reason California has been so slow, and uncharacteristically feckless, in meeting this existential challenge lies with psychology and ends with political power. The generation that built the sinews of modern California—most notably the late Governor Pat Brown Sr., the current governor’s father—sprang from the old progressive spirit which saw in infrastructure development a chance not only to create new wealth, but also provide opportunity to working- and middle-class Californians. 

Indeed, if you look at California’s greatest achievements as a society, the Pat Brown legacy stands at the core. The California Aqueduct turned vast stretches of the Central Valley into one of the most productive farming regions in the world. The freeway system, now in often shocking disrepair, allowed for the construction of mass suburbia that offered millions a quality of life never experienced by previous generations. At the same time the development of energy resources—California still boasts the nation’s third-largest oil production—helped create a huge industrial base that included aerospace, semiconductors, and a host of specialized industries, from logistics to garment manufacturing. 

In contrast, Jerry Brown has waged a kind of Oedipal struggle against his father’s legacy. Like many Californians, he recoiled against the sometimes haphazard and even ugly form of development that plowed through much of the state. Cutting off water is arguably the most effective way to stop all development, and promote Brown’s stated goal of eliminating suburban “sprawl.” It is typical that his first target for cutbacks this year has been the “lawns” of the middle-class suburbanite, a species for which he has shown little interest or tolerance.  

But it’s not just water that exemplifies the current “era of limits” psychology. Energy development has always been in green crosshairs and their harassment has all but succeeded in helping drive much of the oil and gas industry, including corporate headquarters, out of the state. Not building roads—arguably to be replaced by trains—has not exactly reduced traffic but given California the honor of having eight of the top 20 cities nationally with poor roads; the percentage of Los Angeles-area residents who take transit has, if anything, declined slightlysince train-building began. All we are left with are impossible freeways, crumbling streets, and ever more difficulty doing anything that requires traveling.  

The Road to Feudalism 

These policies have had numerous impacts, like weakening California’s industrial sector, which cannot afford energy prices that can be twice as high as in competing states. Some of those who might have worked in the factories, warehouses, and farms of California now help swell the numbers of the welfare recipients, who remarkably make up one-third of the nation’s total. As recently as the 1970s and ’80s, the percentage of people living in poverty in California wasbelow the national average; California today, based on cost of living, has thehighest poverty rate in the country.  

Of course, the rich and entitled, particularly in Silicon Valley have achieved unprecedented riches, but those middle-class Californians once served by Pat have largely been abandoned by his son. California, long a relative beacon of equality and opportunity, now has the fourth-highest rate of inequality in the country. For those who, like me, bought their first home over 30 years ago, high housing prices, exacerbated by regulation, are a personal piggybank. But it’s doubtful either of my daughters will ever be able to buy a house here. 

What about “green jobs”? California leads in total number of green jobs, simply by dint of size, but on a per-capita basis, a recent Brookings study notes, California is about average. In wind energy, in fact, California is not even in first place; that honor goes to, of all places, Texas, which boasts twice Californias level of production. Today even  The New York Timeshas described Governor Jerry Brown’s promise about creating a half-million green jobs as something of a “pipe dream.” Even surviving solar firms, busy in part to meet the state’s strict renewable mandates, acknowledge that they won’t be doing much of the manufacturing here, anyway. 

The Cost of Narcissism 

Ultimately this is a story of a state that has gotten tired, having lost its “animal spirits” for the policy equivalent of a vegan diet. Increasingly it’s all about how the elites in the state—who cluster along the expensive coastal areas—feel about themselves. Even Brown knows that his environmental agenda will do little, or nothing, to combat climate change, given the already minimal impact of the state on carbon emissions compared to escalating fossil fuel use in China, India and elsewhere. But the cosmopolitan former Jesuit gives more priority to his spiritual service to Gaia than the needs of his non-affluent constituents.  

But progressive narcissism is, as some conservatives assert, not the main problem. California greens are, to be sure, active, articulate, well-organized, and well-financed. What they lack is an effective counterpoint from the business class, who would be expected to challenge some of their policies. But the business leadership often seems to be more concerned with how to adjust the status quo to serve privileged large businesses, including some in agriculture, than boosting the overall economy. The greens, and their public-sector allies, can dominate not because they are so effective as that their potential opposition is weak, intimidated, and self-obsessed. 

What we are witnessing the breakdown of a once-expansive, open society into one dominated by a small group of plutocrats, largely in Silicon Valley, with an “amen” crew among the low-information donors of Hollywood, the public unions, the green lobby, and wealthy real estate developers favored by Brown’s pro-density policies. This coalition backs Brown and helps maintain the state’s essentially one-party system. No one is more adamant about reducing people’s carbon footprint than the jet set of Silicon Valley or the state’s planning elite, even if they choose not to live in a manner that they instruct all others.

This fundamentally hypocritical regime remains in place because it works—for the powerful and well-placed. Less understandable is why many Hispanic politicians, such as Assembly Speaker Kevin de Leon, also prioritize “climate change” as his leading issue, without thinking much about how these policies might worsen the massive poverty in his de-industrializing L.A. district—until you realize that de Leon is bankrolled by Tom Steyer and others from the green uberclass.

So, in the end, we are producing a California that is the polar opposite of Pat Brown’s creation. True, it has some virtues: greener, cleaner, and more “progressive” on social issues. But it’s also becoming increasingly feudal, defined by a super-affluent coastal class and an increasingly impoverished interior. As water prices rise, and farms and lawns are abandoned, there’s little thought about how to create a better future for the bulk of Californians. Like medieval peasants, millions of Californians have been force to submit to the theology of our elected high priest and his acolytes, leaving behind any aspirations that the Golden State can work for them too.

This piece originally appeared at The Daily Beast.

Joel Kotkin is executive editor of NewGeography.com and Roger Hobbs Distinguished Fellow in Urban Studies at Chapman University, and a member of the editorial board of the Orange County Register. He is also executive director of the Houston-based Center for Opportunity Urbanism. His newest book, The New Class Conflict is now available at Amazon and Telos Press. He is also author of The City: A Global History and The Next Hundred Million: America in 2050.  He lives in Los Angeles, CA.

Los Angeles aqueduct photo by BigStockPhoto.com.

Iran's Urban Future: Tehran and Beyond

$
0
0

With Iranian-American nuclear relations back on the front burner — make that front and center — I was able to secure a visa and travel counter-clockwise by train around Iran, covering more than a thousand miles. In American headlines and Congressional outbursts, Iran is thought only to be grappling with its nuclear dilemma. But I came to the conclusion that Iran’s future is tied more closely to its cities, where some 60 percent of the population lives, than it is to its nuclear capabilities or its revolutionary doctrines.

By the time I left, a few weeks ago, nothing I saw lined up with its sinister reputation for revolutionary violence or near-fascist religious zeal. Mostly, I saw a developing country — like China in many ways — moving its young population sideways from the countryside into the cities (usually in an old car, spewing fumes). Herewith, an urban rundown:

Tehran: I flew into and out of Tehran, the city that dominates the life of Iran. Even at 3:00 AM the traffic was heavy, and when I went around on the metro, there was never a moment when I wasn’t as squeezed as canned caviar.

For a city of never-ending tenements (similar to Queens or Brooklyn), Tehran remains comparatively calm. I never heard shouting, car horns, or confrontations, just as I never saw an armed police officer (except at the airports) or Revolutionary Guard. Omnipresent portraits of ayatollahs Khomeini and Khamenei are the only symbols of sidewalk politics.

Diplomats and wealthier Iranians prefer to remain crowded into North Tehran, which feels like an alpine village, given the snowcapped peaks that soar in the background. This is where the last two Shahs had their palaces (which are now open as museums of imperialist decadence). The poor live in the desert flatlands to the south. I walked outside the embassy complex where in 1979 the American diplomats were held hostage; its twenty-seven acres looks like an 1850s textile mill in Pawtucket.

For reasons few can explain, Tehran works well as a city. The subway trains — while packed — come and go on schedule. The bazaar is a mall of plenty, even with all the sanctions; the university attracts the best students (including my gifted guide), and even the dense traffic seems to move.

Tehran may lack architectural grace, central focus, cozy neighborhoods, restaurants (I saw few), tea gardens, and sufficient parks. But it doesn't feel as if it is on the edge of a fundamentalist abyss, as it's portrayed in the Western press. It struck me more as an endless block party.

Mashad: Iran’s most holy city. With a population of three million, Mashad is holy because it is where the remains of the Eighth Imam (Reza) are entombed. Pilgrims from all over Iran and Iraq come to the shrine, which is at the center of a large complex of mosques, museums, minarets, and open courtyards.

Before the 1979 revolution, Mashad had an old-city feel, with the shrine at the core of narrow twisting lanes and alleys. Now the shrine is at the center of an open, polished-marble mall that would be a skateboarder’s dream, were dudes ever called to prayers.

Faith is the serious business in Mashad, and most of the women I saw wore black, no-nonsense chadors and hijabs. (In Tehran, younger women, especially, wear their headscarves as fashion statements, and wrap themselves in vibrant colors.)

What surprised me is how welcoming the shrine is to non-believers. I came and went from the courtyard at all hours. Inside the shrine, I was free to sit on the Persian carpets, take pictures, read my book, or check my iPhone. Who knew that Iran’s holiest site doubles as a vibrant city park?

Esfahan: Iran’s cultural capital. I rented a bicycle to get around this city of seventeenth-century splendor that fans out from the vast Naqsh-e Jahān Square (think of an enormous college quadrangle). In one direction are the warrens of the grand bazaar, while off at other angles there are palaces, mosques, and the incomparable mosaic dome of the Sheikh Lotfollah mosque (the inside of a Swiss watch, done in turquoise comes to mind). I was reminded of Florence (the good and bad), sensing that someday, when Iran has rejoined the travelers’ universe, bus tours will overrun the delicate Renaissance balance of the city center.

The new city of Esfahan is bland by comparison to the old town and the bazaar. It stretches into the desert on the other side of the Zayandeh River, arched by an iconic bridge. There is also an old Armenian Quarter, which testifies, if on a small scale, that Iran is a polyglot mix of Persians (51 percent), Azeris (24 percent), Gilakis and Mazandaranis (8 percent), Kurds (7 percent), and Arabs (3 percent).

Yazd: Southeast of Esfahan, in the center of Iran; an oasis of sorts. Come the restoration, Yazd — a city of mud-colored palaces and soaring minarets — will become the end of the rainbow for Persian Empire tourists, complete with five-star boutique hotels set around interior pools (there are some already) and rooftop gardens that serve tea at sunset and deliciously warm bread for breakfast.

Shiraz: Near the ruins of Persepolis, the Persian showcase city in the desert. After the intensity of Tehran and Mashad, Shiraz came as a relief, with its palm trees, wide sidewalks, cool interiors, laid-back atmosphere, and many places in the shade to drink bottled water. Travelers come much as they used to pay homage to local vineyards that gave the world (but no longer Iran) Shiraz wines.

Traffic is detoured from the city center, although on the edges it has the confusion associated with American cities in which interstates blaze their way through downtowns. Only the car speaks to most Iranians. While I loved my trains, they were largely for school kids on excursions and pilgrims on the move. VIP buses are for intercity connections. For the rest, there are cars, a gamut from clunkers to new SUVs that run on $1-a-gallon gasoline.

Qom: The city of mullahs. South of Tehran by about 100 miles, and not far from the new Imam Khomeini International Airport, which was built to serve both cities. The clerics who control Iran from behind veils of secrecy live in Qom, which is — so to speak — the Vatican City of Iran. Ayatollah Khomeini lived here for much of his life, although later the Shah had him deported.

Qom surprised me with its Disney-esque qualities. I had expected mullahs ready to flagellate themselves, or perhaps angry crowds of the faithful eager to demonstrate their spiritual purity to the ayatollahs. Instead, it brought to mind what might be thought of as Allah’s Asbury Park, complete with blinking lights, souvenir stands, food stalls, cruising teenagers, and a summer holiday atmosphere. Even inside the shrine I watched mullahs checking their iPhones and small boys playing tag.

Even in Qom, as elsewhere throughout the country, Iran did not strike me as obsessively religious. Yes, the chadors and hijabs give the impression of a devout society. But those answering the call to prayers struck me as a minority. For example, nobody did anything in the metro when the muezzin was piped over the intercom. (Eternity just sounded like another stop.)

When, at sunset one evening, my train stopped at a station for evening prayers, only a few passengers went into the platform mosque. The rest, it seemed, bought chewing gum.

Matthew Stevenson, a contributing editor of Harper’s Magazine, is the author of, among other books, Remembering the Twentieth Century Limited and Whistle-Stopping America. He has just returned from Iran, and lives in Switzerland.

Flickr photo of Tehran at night by Loizeau.

Southern California Housing Figures to Get Tighter, Pricier

$
0
0

What kind of urban future is in the offing for Southern California? Well, if you look at both what planners want and current market trends, here’s the best forecast: congested, with higher prices and an ever more degraded quality of life. As the acerbic author of the “Dr. Housing Bubble” blog puts it, we are looking at becoming “los sardines” with a future marked by both relentless cramming and out-of-sight prices.

This can be seen in the recent surge of housing prices, particularly in the areas of the region dominated by single-family homes. You can get a house in San Francisco – a shack, really – for what it costs to buy a mansion outside Houston, or even a nice home in Irvine or Villa Park. Choice single-family locations like Irvine, Manhattan Beach and Santa Monica have also experienced soaring prices.

Market forces – overseas investment, a strong buyer preference for single-family homes and a limited number of well-performing school districts – are part of, but hardly all, the story. More important may be the increasingly heavy hand of California’s planning regime, which favors ever-denser development at the expense of single-family housing in the state’s interior.

Read the entire piece at The Orange County Register.

Joel Kotkin is executive editor of NewGeography.com and Roger Hobbs Distinguished Fellow in Urban Studies at Chapman University, and a member of the editorial board of the Orange County Register. He is also executive director of the Houston-based Center for Opportunity Urbanism. His newest book, The New Class Conflict is now available at Amazon and Telos Press. He is also author of The City: A Global History and The Next Hundred Million: America in 2050.  He lives in Los Angeles, CA.

Photo by Downtowngal (Own work) [CC BY-SA 3.0 or GFDL], via Wikimedia Commons


China's Shifting Population Growth Patterns

$
0
0

As demographers have projected for some time, China's population growth is slowing. The nation gained population at a rate of 0.49% between 2010 and 2013, according to data from the National Bureau of Statistics. This is a reduction from the rate of 0.57% between 2000 and 2010. Further growth rate declines are expected until the 2030s when the total population, according to United Nations projections, will actually begin to decline.

Right now the biggest slowdown is taking place in regions with the greatest and densest urbanization such as in the province of Guangdong, home of the Pearl River Delta and the Yangtze Delta, anchored by Shanghai. At the same time, the northern plains economic region of Beijing-Tianjin continues its growth, but following a more decentralized pattern that sees more growth away from Beijing.

Guangdong and the Pearl River Delta

Guangdong is unique in being home to two of the world's megacities (urban areas over 10 million population), Guangzhou-Foshan and Shenzhen. No other sub-national jurisdiction (province or state) in the world has more than one. The province, anchored along the Pearl River Delta, has been the heart of China's three decade long economic advance. Between Guangzhou-Foshan and Shenzhen, the Dongguan urban area has 8 million residents. Across the Pearl River, Jiangmen, Zhongshan and Zhuhai all have more than one million residents. If the China's adjacent special economic regions of Hong Kong and Macau are included, the area's population reaches 55 million, nearly one-half more than Tokyo, with nearly the same land area. However, with little day-to-day work trip commuting between, they do not, at least as of yet, represent a single labor market (metropolitan area).

This slowdown comes after years of spectacular growth. Between 1990 and 2000, the province added more than 40 million new residents, more people than live in California. On average, the the population rose 2.1 million every year, an annual rate of 2.6 percent. Just between 2009 and 2010 the increase was 3.1 million. However, over the three years between 2010 and 2013 Guangdong added only 700,000 each year, for an annual growth rate of 0.66 percent., 

Shanghai and the Yangtze Delta

Shanghai, a city province that contains nearly all of the Shanghai mega-city, also experienced a huge drop in its population growth rate (Parts of Shanghai's continuously built-up area are now stretching into neighboring Jiangsu and Zhejiang provinces). Between 2000 and 2010, Shanghai grew at an annual rate of 3.65% and added nearly 7 million new residents. Over the last three years, the annual rate of population growth has dropped by more than half, to 1.67% as only 1.1 million new residents have been added. Shanghai was estimated to have a population of 24,150,000 at the end of 2013.

Shanghai is at the core of the larger Yangtze River Delta, home to nearly 160 million residents crowded into an area the size of Oregon. The Yangtze Delta includes the provinces of Zhejiang, Shanghai and Jiangsu and stretches from Ningbo, through Hangzhou, Shanghai, Suzhou, Changzhou, and Zhenjiang to Nanjing. Like Guangdong, the Yangtze Delta experienced a substantial drop in its rate of population growth. Between 2000 and 2010, the Yangtze Delta added approximately 20 million new residents, or 1.4 percent annually. This dropped to only 2 million between 2010 and 2013, dropping the annual growth rate  to 0.5%.

Beijing, Tianjin and the Northern China Plain

All the population of the Beijing mega-city is contained within the municipal province of Beijing. With its adjacent megacity of Tianjin (also a municipal province) the two provinces combined have a population of 35 million. When combined with the surrounding province of Hebei (capital Shijiazhuang), the population of this Northern China Plain megalopolis is nearing 110 million. Unlike China's other two major economic regions, the North China Plain is sustaining its population growth. Between 2000 and 2010, the annual population growth rate was 1.47 percent. Over the past three years, it was 1.46 percent.

Beijing was estimated to have a population of 21,150,000 at the end of 2013.Yet, there has been a substantial slowdown in growth but not as marked as that of Shanghai. Between 2000 and 2010, Beijing added more than 6 million residents, growing at an annual rate of 3.70 percent. Another 1.5 million residents were added between 2010 and 2013, but the growth rate dropped to 2.67 percent.

The trajectory of growth has now shifted to Tianjin. Tianjin is by far the fastest growing provincial level jurisdiction in China. Between 2010 and 2013, Tianjin grew at an annual rate of 4.49 percent, and added 1.7 million new residents. This is more in total numbers than either Beijing or Shanghai, which are both larger. Among the provincial level jurisdictions, only Guangdong, seven times as large, added more residents. Tianjin is estimated to have a population of 14,720,000.

Tianjin appears to be an opportunity corridor for growth. Tianjin is located approximately 90 miles (145 kilometers) from Beijing and is the principal seaport in the area. High speed trains between Tianjin and Beijing operate about 100 times each way daily, completing the trip in 35 minutes. Tianjin is a natural safety valve for the continuing growth of the North China Plain megalopolis.

Hebei continued its stronger than national growth. In the 2000s, Hebei added 5.2 million residents, and added another 1.4 million over the past three years.

This shift of growth from Beijing to surrounding areas could indicate some success in the policy initiatives of the national and Beijing governments to control Beijing's rapid population growth and shift it to more peripheral areas. More decentralization initiatives are due, such as the planned seventh ring road, which will traverse most of its distance in surrounding Tianjin and Hebei.

The Dongbei Rust Belt

Population growth continues to elude China's historic Rust Belt, the Dongbei ("East North," also called Manchuria). This area, consisting of Lioaning, Jilin and Heliongjiang provinces, with major cities Shenyang, Harbin and Dalian grew by only 200,000 residents, an annual rate of 0.06 percent. This is down from 0.26 percent in the 2000s, which was less than one-half the national growth rate. The Dongbei has nearly 110 million residents.

Other Areas

At the same time, population in the interior province of Hubei (capital Wuhan) has been propelled from 0.14 percent annually between 2000 and 2010 to a near national rate of 0.41 percent since 2010. Adjacent interior province Hunan (capital Changsha) recovered from a 0.01 percent annual growth rate in the 2000s to 0.62 in the last three years. Next to Hunan, city province Chongqing recovered from a lethargic 0.12 percent growth rate between 2000 and 2010, to an impressive 0.99 percent over the last three years. These cases may also be another indication of the success of government policies to encourage growth away from the East Coast.

Outside of Tianjin, only four regions of China are growing at a greater than one percent annual rate. Three are to the west, including Tibet (1.31 percent), Xinjiang (1.21 percent) and Ningxia (1.12 percent). All are experiencing slower growth than before. To the south, Hainan, the island province, is also growing at just above one percent), about the same rate as in the 2000s.

Floating Population: Slower Growth

China's large floating population, --- internal migrants who have moved to the cities to provide the work force for much of the manufacturing and construction boom --- continued to grow, but at a somewhat slower rate. The floating population grew 8 million annually between 2010 and 2013, down from 15 million annually between 2005 and 2010. Of course, that is still a big number. With reform of the internal passport system ("hukou" system) promised, there may be an important incentive for many to remain in the cities, where economic aspirations may be more likely to be met.

China's Changing Growth Patterns

China is going through an important transition from nearly speed-of-light economic expansion to much slower growth that is, nonetheless the envy of just about every other major economy. Nonetheless, these changes are already bringing spatial changes.

Photo: Dalian (Liaoning), in the Dongbei (by author)

Wendell Cox is principal of Demographia, an international public policy and demographics firm. He is co-author of the "Demographia International Housing Affordability Survey" and author of "Demographia World Urban Areas" and "War on the Dream: How Anti-Sprawl Policy Threatens the Quality of Life." He was appointed to three terms on the Los Angeles County Transportation Commission, where he served with the leading city and county leadership as the only non-elected member. He served as a visiting professor at the Conservatoire National des Arts etMetiers, a national university in Paris and is a Senior Fellow at the Center for Opportunity Urbanism.

The French housing Bubble also has Roots in Excessive Land Use Regulations

$
0
0

Despite the claim to uniqueness that is quintessentially French, the housing bubble shares the same root as we see in the Anglo-Saxon world. To be sure, some analysts blame it only on low interest rates: they made the households more solvent, and thus drove home prices up. This rise in purchasing power might have been enhanced by some specific subsidies to new rental units. Some also y point to normative constraints on new buildings have added to production costs.

These facts are undisputed, but a demand-only driven bubble can’t happen in a really free market where price signals provide incentives to supply more units, moderating price escalation, and eventually revert the price curve. After all, there hasn’t been anything like a “car price bubble”. So there has to be a supply side factor constraining the building of new homes. And since building itself doesn’t require scarce skills, the constraint has to come from land. These analysts observe that in middle America booming cities like Texas’ Houston and Dallas, or others in Kansas, Georgia, Oklahoma, and elsewhere didn’t experience such a price bubble despite identical credit conditions, despite in some cases, as in Texas, an even greater surge in demand.

Numbers

Let's take a look at official French statistics.

Professor Joseph Comby (From Institut d’Urbanisme de Paris) summarizes essential data in an exhaustive article (not available online) published in the very specialized peer reviewed "Revue Foncière" (n°3, January 2015), dedicated to land and housing issues. His graphs can be accessed from data provided by our national institute of statistics (INSEE).

The first graph shows that home prices surged between 1997 and 2007, and that the prices didn't really slump then, despite worldwide economic crisis. Average home price rose by a whopping 150% in 11 years, and rose 86% faster than households’ disposable income.


Fig 1. Home price Index, adjusted from households’ disposable income – Base 1, 1965.

Source: French Ministry of Sustainable Development (
doc format)

In this period, the median multiple in France (Average Home price / Average Household disposable income) rose from a stunningly low 2.25 to 4.21, and these average figures hide numerous regional discrepancies.

Home prices can be truncated between land costs and building costs, including the home and the infrastructure costs (road access, sewage, water and energy adduction, and so on). Had this price hike uniquely "credit and demand" driven, we should have seen a relatively parallel evolution between land and building components in home prices.

Our national statistics institute conducts regular wealth inquiries on the total wealth of French households. These studies show that the  share of aggregate land value in  homes value rose from 15% in 1996, to 50% in 2007, and slowly decreased then to 45% in 2013.


Fig 2. France - Share of land in aggregate real estate value

Source: J. Comby, computed from
INSEE Annual wealth surveys

So, from these data, let’s compute how the prices of land and building components evolved between the 1996 low and 2007 peak, relatively to households revenue. The following table summarizes it all:


 1996

2007

Price Increase

Existing homes, average price - (current prices, €) (INSEE)

77 100

192 800

+150%

Average disposable income per household (current values, €)

34 149

45 800

  • 33%

Ratio Home price / disposable income

2.25

4.21

+86 %

Land, % of home value

15

50


Land, average value in existing homes (€)

11 565

(15% of 77100)

96 400

(50% of 192800)

+ 733 %

Land price appreciation, adjusted from household disposable income appreciation

-

-

+ 520 %

Building, average value in existing homes (€)


65 535

96 400

+ 47 %


As has been seen in the Anglo-Saxon regulated markets, land appreciation overwhelms construction costs appreciation. Figures show clearly that the 1996-2007 real estate bubble is driven by land prices appreciation.

As a confirmation pattern, INSEE figures from its annual wealth studies show that the total value of built land plots went from 67% of GDP in 1998 (no figures for 1996) to 308% in 2007. So owning developable land in the end of the 90s provided returns that no other asset class could offer, despite creating absolutely no new added value for society. On the contrary, high home prices have been harmful to modest households, with 6% of people experiencing very bad housing conditions (obsolete and/or overcrowded units), 9% other having tough times financing their housing needs (1).  And according to INSEE, there were 112 000 homeless people in 2012, a 44% increase from 2001 (2).

Since there is no physical shortage of land in France (most of the country is rather flat, and only 7% of land is developed), this suggests loudly to look at our land use regulations to understand how they fed the monster.

Our regulation of land belongs to the “prescriptive” family, according to Wendell Cox and Hugh Pavletich classification (3). It means that land is, by default, limited for natural or agricultural usage, and turning it into developable land must endure a long and politically complex zoning process. Worst of all, not only each city is zoned, but every local zoning has to comply, since the new millennium, with “territorial coherence schemes” which tend to cap the maximal amount of land available for development through years. Prescriptive regulations can be opposed to “responsive” ones, which can be seen in central parts of America and Canada. In a responsive regulatory frame, default status of land is let to the free choice of the owner, and only limitations for some collective purpose have to pass through a political process, and open a right   for owners to be compensated for the loss of land value resulting of limitations. As Cox and Pavletich as well as the Brookings institution showed, places with prescriptive regulations experienced a much tougher bubble than responsive ones during the years of wild credit expansion. France is not different and the same phenomenon happened.

The idea of a bubble driven by strong regulatory constraints put on land meets a lot of resistance among several groups familiar in other countries: Local politicians, who get power from a population prone to NIMBY attitudes, and feeling richer through home value appreciation, are the first of them; most farmers, 70% of whom are renters, have an interest in preserving legal interdiction to turn  plots at the fringe of cities into housing developments; and there are about 40,000 employees in public and private jobs who make a living from elaborating and implementing these regulations. 

So we can see that in France, like other countries, the role of artificial restriction of land supply for new development can’t be dismissed. The costs and benefits of these regulations should be publicly questioned. Can their advocates still deny that that this price bubble is largely an unintended outcome of regulations. Nor can they acknowledge that this  results in increasing levels of “housing poverty” and drives so much resources from more productive investments. Is this  more desirable than “sprawl containment”, “farmland preservation” and other pretenses which provided justifications for these regulations in first place ?

Vincent Benard is senior economic analyst for the Turgot Insitute (www.turgot.org), a french classical liberal think tank. His principal interests are housing, land use and infrastructure policies, and the study of the unintended consequences of regulations.  Since 2006, he authored one book and many articles about the French housing crisis. " 

(FYI: The book : https://www.scribd.com/mobile/doc/80163334 - Free, PDF, in French) 


---------

Notes: (1) Figures from the annual report of the “Abbe Pierre” Foundation, dedicated to homelessness and poverty assistance  www.fondation-abbe-pierre.fr/

(2) Source: “L’express”, November 2014 - http://www.lexpress.fr/actualite/societe/le-nombre-de-sdf-en-france-a-explose-en-dix-ans_1623371.html

(3) See Annual Housing affordability report, by Cox and Pavletich, www.demographia.com

Photo by Benh LIEU SONG (Own work) [GFDL or CC BY-SA 4.0-3.0-2.5-2.0-1.0], via Wikimedia Commons

Growth and the Suburban Chassis

$
0
0

I tend to explore what happens to suburbs as they age and begin to decline. But this time I’m going to explore what happens to suburbs that thrive and continue to grow and work their way up the value chain. It isn’t exactly what many people expect. “Be careful what you wish for.”

A friend moved from San Francisco to San Jose this winter. Now that I’ve been visiting her on a regular basis I have an excuse to poke around. It’s actually pretty fascinating.

 Screen Shot 2015-04-08 at 1.35.48 AM Screen Shot 2015-04-08 at 1.36.12 AM

A friend moved from San Francisco to San Jose this winter. Now that I’ve been visiting her on a regular basis I have an excuse to poke around. It’s actually pretty fascinating. Her tract home was built in 1947 on land that had previously been orchards. By the 1960’s the area had become home to military and aerospace firms that then spun off civilian electronics companies in little low rise office parks. By the 1980’s the area had officially emerged as Silicon Valley. Oracle, Apple, Facebook, Hewlett-Packard, Microsoft, Google, eBay, Juniper Network, PayPal… these companies stretch out for miles in every direction. It’s an economic development dream for local governments. While there are a dozen separate municipalities (Redwood City, Cupertino, Mountain View, Palo Alto, Santa Clara, Fremont, Los Gatos, and so on) the entire southern end of San Francisco Bay is essentially one giant suburban corporate office park blur.

Screen Shot 2015-04-11 at 3.49.19 PM Google Screen Shot 2015-04-08 at 1.09.30 AM Screen Shot 2015-04-08 at 1.06.01 AM Screen Shot 2015-04-08 at 1.10.00 AM

Here are three examples of the kinds of commercial buildings that served earlier waves of businesses in Silicon Valley. They were probably built between the 1970’s and 1990’s. This office park happens to be in the town of Sunnyvale, but nearly identical arrangements can be found all over the Bay Area. In fact, I bet there are buildings just like these in whatever town you live in too whether it’s in Florida, Michigan, or Utah.

Screen Shot 2015-04-11 at 4.25.53 PM GoogleScreen Shot 2015-04-08 at 1.52.00 AM   Screen Shot 2015-04-08 at 1.09.00 AM

Here’s what’s happening to these office parks as the economy heats up. The land has become very valuable and it makes good economic sense to build new eight or ten story office blocks on vacant land and surface parking lots. It’s good for the tech companies who want to expand their existing operations. It’s good for the land owners who can cash in on the sale. It’s good for the city since it brings increased tax revenue to the municipal coffers. And it’s good for people looking for high paying jobs, both in the initial construction phase and later office workers and support staff. There are, of course, also problems associated with this kind of redevelopment, which I’ll get to in a minute.

Screen Shot 2015-04-11 at 6.33.25 PM Google Screen Shot 2015-04-11 at 6.32.52 PM  Screen Shot 2015-04-08 at 1.52.32 AM

Here’s another construction site directly across the street. The old one story buildings were scraped and are being replaced by parking decks and office blocks. These are all part of the same company that is experiencing rapid expansion and doubling their corporate campus that already has over a million square feet of space. These few buildings alone will ultimately house another eight hundred well paid workers. Part of the long term plan for this site is to include a two hundred room hotel for business travelers associated with the company. Perhaps that new hotel will replace the existing one story motel.

Screen Shot 2015-04-11 at 5.26.01 PM Google   Screen Shot 2015-04-11 at 8.04.09 PM Screen Shot 2015-04-11 at 8.04.26 PM Screen Shot 2015-04-11 at 7.27.03 PM Screen Shot 2015-04-11 at 7.26.05 PM

Here’s the bigger picture. Zooming out on Google Earth you can see how multiple older office parks are being absorbed and folded in to much larger more unified corporate complexes. The scale of the construction is too large to capture even with a macro lens on the ground. These tech workers were walking between buildings at lunchtime and it was quite a trek. This kind of land use intensification is actually very similar to how old orchards were converted to residential subdivisions. Land values increased and property was pressed into service for tract homes which were much more lucrative than apricots or prunes. The same process is now unfolding at the next higher economic level with office parks. If I hadn’t taken these photos myself I would swear some of them were computer generated. The buildings have such a generic AutoCAD look about them. And there are dozens of them at this one site alone.

Screen Shot 2015-04-11 at 7.44.08 PM Google   Screen Shot 2015-04-11 at 8.14.31 PM  Screen Shot 2015-04-08 at 3.40.10 AM Screen Shot 2015-04-13 at 5.58.20 PM 

Here’s another corporate campus. This one is in Redwood City. Everywhere you look the old one and two story buildings are being razed and replaced with significantly larger buildings. The schmaltzy motels, strip malls, and office parks of previous decades have been upscaled both physically and economically. This was once open water and marshland that was filled, dredged and contoured in the 1960’s, but has since been redeveloped to a higher value use.

Screen Shot 2015-04-13 at 5.42.01 PM Google Screen Shot 2015-04-13 at 5.43.28 PM Google

Companies are fond of the “theme park” suburban campus where the environment is akin to an all inclusive resort destination for workers. These are islands – sometime literal islands – in the suburban landscape. From the air these corporate campuses look a lot like Epcot Center at Disney World or a regional shopping mall off the side of a highway.

Screen Shot 2015-04-14 at 9.24.20 AM Google Screen Shot 2015-04-14 at 9.12.06 AM Google

Screen Shot 2015-04-14 at 9.22.14 AM Google  Screen Shot 2015-04-14 at 9.13.02 AM Google

This inward looking mega block form of development is common in suburbia. The images above show a college, an amusement park, and a corporate office park. When you’re inside one of these bubbles it’s actually very pleasant. But getting to and from these locations is pretty much impossible without a car. Even if you live directly across the street walking wouldn’t work all that well. Add in the fact that many of the nearby residential subdivisions are gated communities and that each of these bubbles are separated by highways, walls, and drainage canals… a car becomes essential. That loads the road network with an insane amount of traffic. If the one story buildings incrementally ramp up to eight story buildings you have a very big transportation problem on your hands.

Screen Shot 2015-04-11 at 9.05.27 PM Google Screen Shot 2015-04-08 at 2.00.16 AM Screen Shot 2015-04-11 at 9.15.54 PM Screen Shot 2015-04-08 at 1.56.54 AM

Here’s an intersection halfway between my friend’s house and the corporate campus where she works. It’s a typical suburban commercial corridor lined with standard one story buildings of the office park and light industrial variety that were built anytime from the 1960’s to the 1990’s.

Screen Shot 2015-04-11 at 9.16.34 PM Screen Shot 2015-04-08 at 1.59.10 AM Screen Shot 2015-04-11 at 9.17.10 PM Screen Shot 2015-04-13 at 8.24.15 PM Screen Shot 2015-04-08 at 1.58.53 AM Screen Shot 2015-04-08 at 2.00.03 AM

Here’s what’s happening all around Silicon Valley. The small old buildings are being replaced with much larger ones. These aren’t exactly skyscrapers, but they’re significantly more substantial than what was there before.

Screen Shot 2015-04-13 at 7.26.36 PM Google Screen Shot 2015-04-12 at 11.56.58 AM Screen Shot 2015-04-12 at 11.31.13 AM

The same thing is happening with residential property. The old suburban roads lined with gas stations and Kwickie Marts are giving way to multi-story apartment buildings with underground parking decks. These two photos show two sides of the same street. This spot is immediately adjacent to a 1950’s residential subdivision of single family homes. The apartment building fills a need for workforce housing at a high, but tolerable price. One bedroom apartments in this neighborhood rent for about $2,000 a month. Two bedroom units rent for closer to $3,000. If you want to buy an actual house the bargain basement fixer uppers start at $600,000. There are a lot of people in the area who can afford to carry a mortgage of that size, but the problem is often the down payment. Twenty per cent of $600,000 is $120,000. That’s a hurdle many people struggle with. I’ve seen some very nice double wide trailers for sale in the $320,000 range, but that doesn’t include the land under the trailer which you would still need to rent. So rental apartments and condo complexes are in fact necessary in this area if many workers are to live anywhere near where the jobs are.

Screen Shot 2015-04-13 at 5.16.11 PM Google

That brings us to some of the serious problems with an economically successful suburb. Silicon Valley, as the name suggests, is hemmed in by mountains and water. All the flat, easily developed land has already been built on in the standard suburban fashion. Over the decades highways have been built through mountain passes to access new land on the other side of these mountains and many people and businesses have expanded outward to the far edges where possible. But the resulting transportation bottlenecks and commute times are severe. Driving to and from Silicon Valley to the outer outer outer suburbs is like pouring molasses through a funnel. People are willing to pay a lot extra to not have to endure that schlep every day. In theory public transportation could ease the commute for many people, but the dispersed development pattern guaranties that transit will never be efficient or cost effective since most people need to drive from their house to a transit center and then take a shuttle bus to the office at the other end of the train line. Living closer to work is a better option for many people. If you have a million dollars on hand you can buy a nice big home with a front lawn and swimming pool in the back yard. Many people in the area do. The median income in Silicon Valley for people with a bachelor’s degree is $95,000 a year. That’s the median, so half the working population earns more than that. A million dollar house is within reason, particularly if there are two incomes per household to carry the mortgage. If not, living in a condo or apartment complex is the next best option.

Screen Shot 2015-04-08 at 3.41.17 AM Screen Shot 2015-04-08 at 3.41.49 AM Screen Shot 2015-04-13 at 8.29.38 PMScreen Shot 2015-04-13 at 8.28.45 PMScreen Shot 2015-04-13 at 8.29.00 PM 

From my perspective these intensifying suburbs are in an adolescent phase of development. They are rapidly losing the qualities that people like about the suburbs: open space, privacy, convenience, quiet, lower cost, ample free parking, and so on. But they aren’t yet delivering the things people like about cities: culture, vibrant street life, walkability, convenient public transportation, night life, and such. I stopped and took photos of large numbers of tech workers walking along the side of the eight lane highways at lunchtime. There isn’t anyplace for these folks to walk to. There’s nothing but parking lots, highway fly-overs, gas stations, landscaped berms, and convenience stores as far as the eye can see. When I ask the workers where they’re going they say they’re just stretching their legs and getting some air. They eat lunch (and very often breakfast and dinner) inside their office compounds in subsidized cafeterias. Perhaps in another thirty years the transformation from suburb to something more vital may be complete. Given the suburban chassis these places inherited I don’t see how the underlaying infrastructure will ever support anything other than a bad compromise.

Joel Garreau calls places like this Edge City: a place that has a suburban form but at an urban density. Driving private cars is no longer convenient here anymore, but transit will never function well either. Jobs are plentiful, but housing is too expensive. It lacks the privacy and peace of a good suburb, but is deficient in the vibrancy and culture available in a real city. It’s too thick to be jam, but too thin to be jelly. 

John Sanphillippo lives in San Francisco and blogs about urbanism, adaptation, and resilience at granolashotgun.com. He's a member of the Congress for New Urbanism, films videos for faircompanies.com, and is a regular contributor to Strongtowns.org. He earns his living by buying, renovating, and renting undervalued properties in places that have good long term prospects. He is a graduate of Rutgers University.

The Simulated City Vs The Urban Downtown

$
0
0

While the city’s star is rising in popular literature, it has fallen in popular usage. Where have our sidewalks gone—and why is sidewalk activity disappearing? Sidewalk life has declined in urbanized areas, while population has swelled. Here in Florida, the third most populated state in the country, the average town’s sidewalks should be teeming with colorful crowds of businessmen, shoppers, and people on errands going to and fro. We should see sidewalks full of people happy to be out in the sunshine, and even happier to have escaped the gray cold and the snow. Instead, on weekdays, a trickle of lunch-goers emerges from towers. On weekends, there’s a brief crush of crowds before events. This seems to be all that our downtowns can manage anymore.

The simulated city is the new place to be. It's a manufactured copy of our downtowns, and can be found in theme parks and places where throngs congregate to experience the sidewalk in its current incarnation.

The simulated city carries none of urbanity’s institutional hardware: no visible governmental facilities, religious institutions, schools or civic centers clutter the street wall. The simulated city eschews manufacturing and offices, instead making itself the chief enterprise: a mecca of retail, dining, and entertainment. It has cherry-picked the good stuff from the old urban form, presenting a cosmetically perfect face without blemish or quirk, redolent in its synthetic beauty.

In Florida, with few natural resources and scant manufacturing, the simulated city takes advantage of tourism and growth. With the number of annual visitors approximately four and a half times its permanent population, Florida is a natural place for simulated cities to sprout. The earliest was the Magic Kingdom’s Main Street at Walt Disney World. This ancestor of the simulated city engendered replicants in other theme parks, each one topping the other in surprise and delight.

This spring, Orlando’s Downtown Disney reopened as Disney Springs, a retail, dining, and entertainment district that is themed to resemble a lost small town. Nearby, Universal’s Citywalk incrementally reinvents itself, restaurant by restaurant. Further south, Miami’s South Beach has enjoyed an upsurge as well. With some of the highest real estate prices in Florida, South Beach has jumped species to become a simulated city too, enjoying a sidewalk life that is the envy of downtown Miami and, frankly, of the rest of Florida’s beach communities. There is magic on Ocean Boulevard’s pavement that is not found anywhere else in the state.

What groups these together is simple: sidewalks full of people. Unlike the shadow-world of Florida’s urban downtowns, riverwalks, boardwalks, and Main Streets, throngs of people crowd these places every day and every night. For all the hoopla about the reinvigorated city, Florida’s urban scene fails to deliver even a fraction of the sidewalk life that these places have. The simulated city is the powerhouse of the future.

Once going out meant heading to Main Street, and then, briefly, it was to the mall. Today, in the simulated cities one must carefully navigate between families, stepping between neon sneakers and wheeled strollers, flip-flops and brogans. This delicate ballet occurs while eye contact flickers between faces and facades; the traffic and the sky. The sum of such casual contact gives people a feeling for their public identity, and the simulated city is a tool to deliver this identity in the best possible light. The simulated city has become the choice for people to display their social selves.

Dry cleaners, dentists, and others who provide services that imply an unclean recipient are banished completely from the synthetic city. In South Beach, the providers are in the less expensive real estate many blocks from the beach. The city is an unabashed celebration of sybaritic pleasure, the frosting on the urban experience without any of the cake.

It is a city where your expectations as an urban connoisseur are completely fulfilled; decrepitude, blight, and eyesores are disallowed. Even better, a simulated city’s employees are rigorously trained to be cheerful and bright. No homeless people lounge on park benches, and there’s no visible crime, since there is no apparent indigence, want, or fear. Although it would not be turned away, the riskiest tranche of society seems to shun the simulated city. Its design reflects mainstream success, and discourages subversion, by having no alleys, no trashy areas, and no low income community adjacent to it.

South Beach was able to jump species from being a regular city and evolve into a simulated city partly because of this last feature, what with being an island. No low-income edge rankles its visitors, or exposes them to a broad cross section of society. It is unique among Florida’s simulated cities because it does have housing (upscale, of course) in its mix.

Urban boosters vaunt the ancient metropolitan core as if it still mattered. While urbanists are still fighting against the influences of the car, under their noses a new mobility trend threatens, one that will dwarf the damage done by the automobile.

This, of course, is the internet, that global marketplace of goods and services that makes nearly everything but a haircut available online. Downtowns and suburban commercial clusters alike are fighting for their lives, and between telecommuting, online shopping, and social media, fewer and fewer folk find reasons to step out onto the sidewalk. Soon, if we go online to vote, even our civic duty can be done without stepping on pavement.

Disney Springs presents a heady abundance of experiences to visitors along a lakeside walkway near Orlando. Families cluster together, friends walk in groups or split apart for different adventures. No obligation exists for greater social contact, since you are a visitor among visitors, and your anonymous bubble is preserved. This is a different state of mind than when you are in your own city where you may run into an acquaintance. As in a theme park, you are unlikely to run into someone you know.

And because people are in a place that is made especially for pleasure, the sense of self tends to magnify, as evidenced by ubiquitous and annoying selfie sticks. Without the glowering facades of authoritarian institutions like churches, police stations, or city halls, the sense of place is completely recreational and mildly celebratory, inducing a temporary state of pleasant expansiveness.

To see solid evidence for the simulated city’s high desirability, look at its twin conditions: Huge crowds coupled with high barriers to entry. South Beach requires visitors to take a slow crawl over a traffic-choked bridge onto the island, and pay stiff parking fees. Theme parks also charge parking fees, and entry requires a long, hot trudge through a parking lot. Driving, paying for parking, and then walking? Simulated cities must deliver high perceived value in exchange for this effort.

As the twenty-first century lifestyle migrates from the urban-centric past into the online and suburbanized future, the sidewalk seems destined to become a playground. Florida’s three or four simulated cities, enormously successful places, tell us that people will overcome hurdles to seek out urban experiences, including light social contact as a recreational activity, while shunning their own urban core back home. This paradox, particularly easy to see here in Florida, may point to a future where people prefer to sip the urban water, rather than swim in it.

Richard Reep is an architect with VOA Associates, Inc. who has designed award-winning urban mixed-use and hospitality projects. His work has been featured domestically and internationally for the last thirty years. An Adjunct Professor for the Environmental and Growth Studies Department at Rollins College, he teaches urban design and sustainable development; he is also president of the Orlando Foundation for Architecture. Reep resides in Winter Park, Florida with his family.

Photograph by the author: Downtown Disney, a simulated small town, around lunchtime on a recent Sunday.

Global Cities in the 21st Century: a Chicago Model?

$
0
0

As America’s “third” city, Chicago competes for international attention against the usual rivals: New York and Los Angeles. Even San Francisco, next to Silicon Valley, claims prominence for its cutting-edge industries and progressive culture. Ultimately, though, Chicago’s domestic peers have global status through definitive leadership in industries with visibility and impact (New York in finance, Los Angeles in entertainment, Houston in energy, and San Francisco in technology and innovation). Chicago has dim prospects of replicating such undisputable competitive advantages, but it may not need to.

Global status in the 21st century favors international collaboration over industry dominance, for three reasons. First, the innovative nature of emerging industries and modernizing traditional industries shifts competitive determinants from resources to ideas. This equalizes the international knowledge race, with companies seeking ideas regardless of geographical origin. Second, technology-enabled connectivity integrates previously isolated regions into the global economy, creating what a recent Foreign Affairs article labels a “unified global marketplace for labor.” Third, the dynamic knowledge sector rewards flexibility over size; footloose over big and rigid. Accordingly, local workforce size loses relevance, good news for small cities. The digital revolution enables geographic dispersal of talent through “internet-based globalization.” In short, collaboration enables flexible capacity, while international collaboration taps a vastly more diverse and hungry talent pool.

Is Chicago prepared to abandon pursuit of industry dominance and seek global status in the hyper-connected knowledge economy? The city already boasts corporate prominence and diverse lifestyle amenities, and has even seen post-recession growth in emerging creative industries like high-tech and film. Chicago also has a lively private sector, and visionary, pro-developmental planning from both its recent and distant past. In 2013 the city committed US$ 3 billion to revive urban neighborhoods, through a public-private initiative that Mayor Rahm Emanuel insists will help Chicago “live up to its potential as the global city that it should be.” Such factors make a city great, but do they make it global?

Despite being a paragon of economic diversification, Chicago lacks an undisputed position in any transformative and globally relevant industry, as enjoyed by its coastal rivals. The city is even perceived by some as a striver whose influence is more regional than global. For example, in a 2012 New York Timesarticle, a relocation expert stated that global business and political leaders “have an idea of Chicago that is 20 or 30 years out of date.” Indeed, Chicago has a development history that is steady but not exceptional. Before its recent struggles, the city’s plodding, linear economic progress was a product of the typical determinants: population growth and path-dependent agglomeration. Outdated theories recommend that Chicago aim for inimitable dominance in an emerging industry. However, such efforts would be misplaced in the current global economy.

In practice, a growth approach favoring industry dominance has two problems. First, it ignores the fact that the most elite global cities acquired prominence the hard way: through gradual institutional evolution. Dominance across multiple industrial eras is only the shiny product of underlying economic, social, and political circumstances that generated structural flexibility. These circumstances, rather than industry prominence itself, should be the focus of urban growth strategies prioritizing prepared opportunism over industrial roulette.

Second, the industry dominance approach unduly emphasizes competition, with a zero-sum philosophy that marginalizes collaboration. No industrial windfall or shock-opportunity has fundamentally transformed Chicago’s competitive position since the 19th century, when connectivity through railroads, canals, and westward expansion made the city a trading and logistics hub. Chicago can now develop global status through connectivity of a new sort, as a collaborative leader in emerging global networks for trade and production. It can even anchor an inter-governmental urban network addressing economic challenges in large inland cities lacking inimitable competitive advantages.

Historically, an unchallenged advantage in trending industries generates global visibility and relevance. However, modern embodiments of the dominance model are fundamentally unstable, in particular due to sector cyclicality. Only three cities have historically maintained near-permanent global status: Tokyo, London, and New York. Their type of competitive advantage is institutionally entrenched and therefore largely inimitable, although Tokyo has struggled throughout Japan’s multi-decade economic slump. Aside from these mega-cities, Chicago’s global aspirations face significant competition from ambitious secondary cities. Rapid economic growth in Asia has attracted capital to places whose names were just decades ago scarcely recognizable in the West (e.g. Wuhan and Guangzhou, both with populations comparable to New York’s).

A 21st century growth strategy should not assume zero-sum economic competition, but instead emphasize membership in the right “clubs.” Inter-urban cooperative networks are increasingly common; for example, Singapore is collaborating with Indian cities on “smart” development. This type of soft-diplomatic relationship is a form economic symbiosis that emerges from a “flattening” world. Networks also emerge around industry complementarity (e.g. Los Angeles-Nashville-Austin in entertainment, Oklahoma City-Dallas-Houston in energy, and Singapore-New York-Frankfurt in finance). Chicago must contemplate what it offers as a network partner, and move early in establishing inter-urban relationships to jointly capture global opportunities.

Recent history is littered with failed urban growth strategies derived from outdated models. For example, to quickly garner status many cities have made grandiose commitments such as Olympic bids, sports stadiums, and ambitious megaprojects. Such efforts are cheap and politically expedient to announce, but drain municipal coffers during implementation. Chicago can alternatively stake its future on the more sustainable and farsighted growth model of networked interdependence. An internationally connected economy may not be glamorous, but it is certainly “global” and can also be diverse and stable, as quietly proven by some of the world’s more creative secondary cities (e.g. Toronto, Sydney, Amsterdam, and Bangalore). Chicago must decide first what kind of status is wants, and ultimately whose company to keep.

Kris Hartley is a Visiting Researcher at Seoul National University and PhD Candidate at the National University of Singapore. He focuses on economic policy, urban planning, and governance innovation, and has a decade of experience with government agencies, community development corporations, and research institutes. His book Can Government Think? Flexible Economic Opportunism and the Pursuit of Global Competitiveness proposes a model for urban economic growth through the alignment of institutional structures and administrative processes supporting evidence-based policy. His work is available at www.krishartley.com.

Viewing all 3792 articles
Browse latest View live


Latest Images