Quantcast
Channel: Newgeography.com - Economic, demographic, and political commentary about places
Viewing all 3795 articles
Browse latest View live

Rise of the Nation-States

$
0
0

In this highly polarized political environment, states and localities, are ever more taking on the character of separate countries. Washington’s gridlock is increasingly matched by decisive, often “go it alone” polices from local authorities. Rather than create a brave, increasingly federalized second New Deal, the Obama years, particularly since the Republicans took control of the House in 2010, have seen discord rise to a level more akin to that left by James Buchanan, the last president before the Civil War, than Franklin Roosevelt.

This makes understanding the sometimes-divergent economic and demographic trends of various states ever more important. With no compelling national vision, not only are politics more “local” but are increasingly distinct by region.

The Main Event: Texas vs. California

Today’s two leading economic models come, not surprisingly, from our two megastates, California and Texas. For its part, the Lone Star State follows a traditional American growth model, spread among a wide array of industries, notably energy, and prodded by population growth.

Read the entire piece at The Orange County Register.

Joel Kotkin is executive editor of NewGeography.com and Roger Hobbs Distinguished Fellow in Urban Studies at Chapman University, and a member of the editorial board of the Orange County Register. He is also executive director of the Houston-based Center for Opportunity Urbanism. His newest book, The New Class Conflict is now available at Amazon and Telos Press. He is also author of The City: A Global History and The Next Hundred Million: America in 2050.  He lives in Los Angeles, CA.

Wendell Cox is principal of Demographia, an international public policy and demographics firm. He is co-author of the "Demographia International Housing Affordability Survey" and author of "Demographia World Urban Areas" and "War on the Dream: How Anti-Sprawl Policy Threatens the Quality of Life." He was appointed to three terms on the Los Angeles County Transportation Commission, where he served with the leading city and county leadership as the only non-elected member. He was appointed to the Amtrak Reform Council to fill the unexpired term of Governor Christine Todd Whitman and has served as a visiting professor at the Conservatoire National des Arts et Metiers, a national university in Paris.

USA map image by BigStockPhoto.


North By Midwest: Minneapolis-St. Paul as the Capital of the North

$
0
0

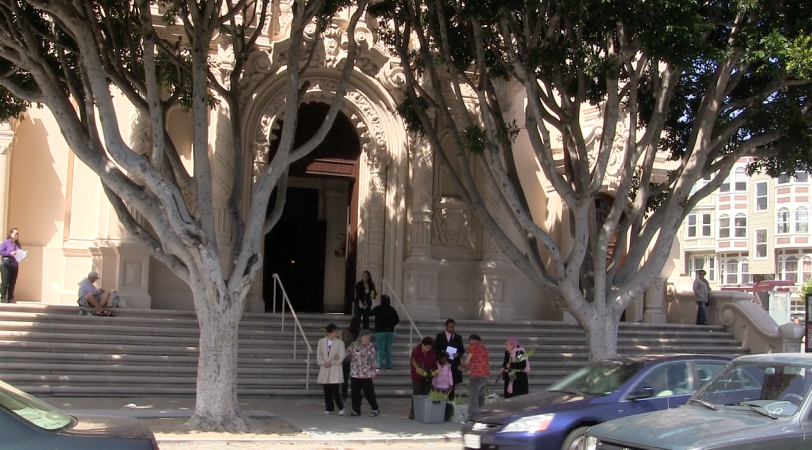
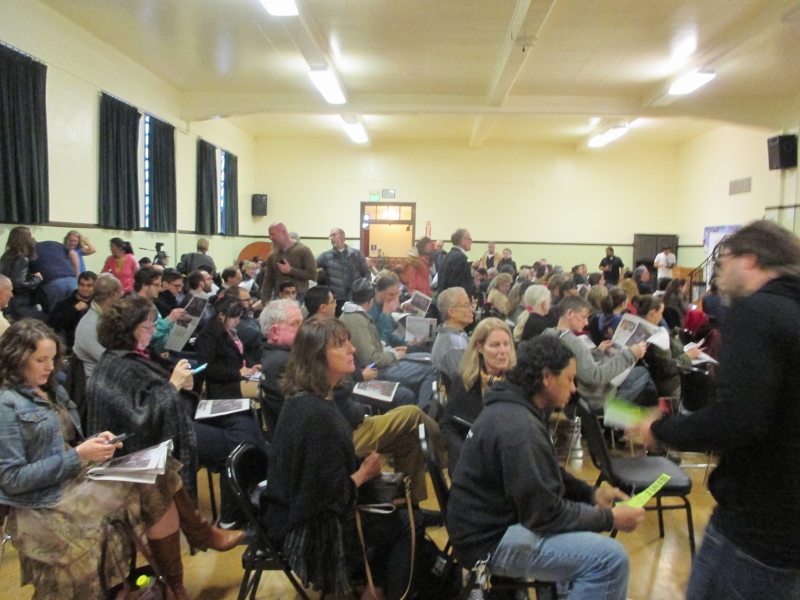
In November, I joined an overflow crowd at the Walker Arts Center to hear a panel discussion entitled Midwest? The Past, Present, and Future of Minnesota’s Identity. The discussion stemmed from common questions of identity, and proposed that Minnesota and the Twin Cities secede from the “Midwest” and claim ownership of a new region: the North. If you’re reading this article, you’ve probably heard about this, perhaps from the Star Tribune’s original write-up. There are some powerful people behind the movement. It’s the brainchild of Eric Dayton, son of the governor and owner of The Bachelor Farmer restaurant and the Askov Finlayson clothing store.

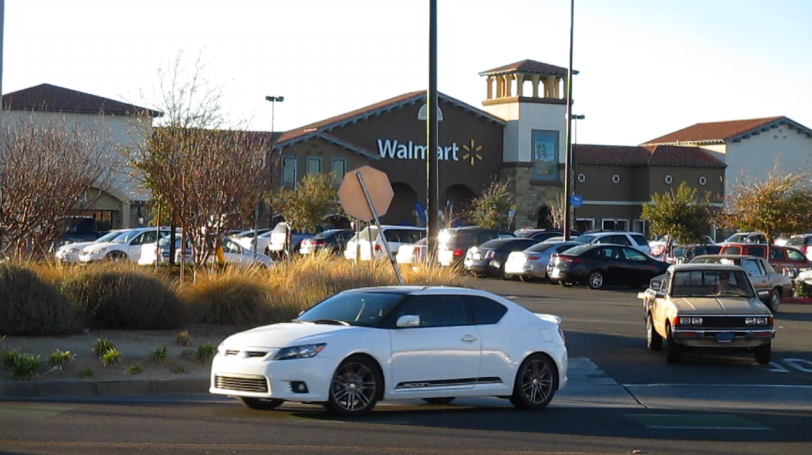
Recently, the idea has experienced another surge of media interest. Brian Martucci, The Line‘s Innovation and Jobs News Editor, wrote an article that catalogs piecemeal some of the projects and movements that are transforming the Minneapolis-Saint Paul cityscape. A day later, The Wall Street Journal (of all newspapers), published a different take by Christina Brinkley, their fashion and style columnist.

It’s a fascinating experience to read these two commentaries side by side. Martucci writes from the perspective of someone who lives here, and his focus is firmly on the built environment. As is evident to any resident, Minneapolis and Saint Paul are undergoing a breakneck physical transformation, with further changes hurtling down the pipeline. Meanwhile from New York, Brinkley is interested in goods. Red Wing shoes, Faribault wool, Duluth packs, and other ‘Made in Minnesota’ products are reportedly—this writer wouldn’t know, he cannot afford them—in vogue, thanks in part to their decades-old, blue collar, lumberjack bona fides. At the confluence of both of these trends, both writers found Eric Dayton and his determination that we live in the ‘North’, and that Minneapolis-Saint Paul should assert its place as the capital of this new region.

The Idea of North

I love the idea of “North.” I am a New York native. I came to Minnesota for college, studied geography and have lived here in the short period since. I have flown over Minnesota and I have also called it home. I have an unshakable certainty that Minnesota is deeply underrated, especially among people like myself. After the event at the Walker in November, I convened a Facebook focus group of high school friends and asked them what came to mind when they imagined Minnesota. I heard back—

The Vikings—

Adrian Peterson—

Outdoorsy stuff when it’s not cold—

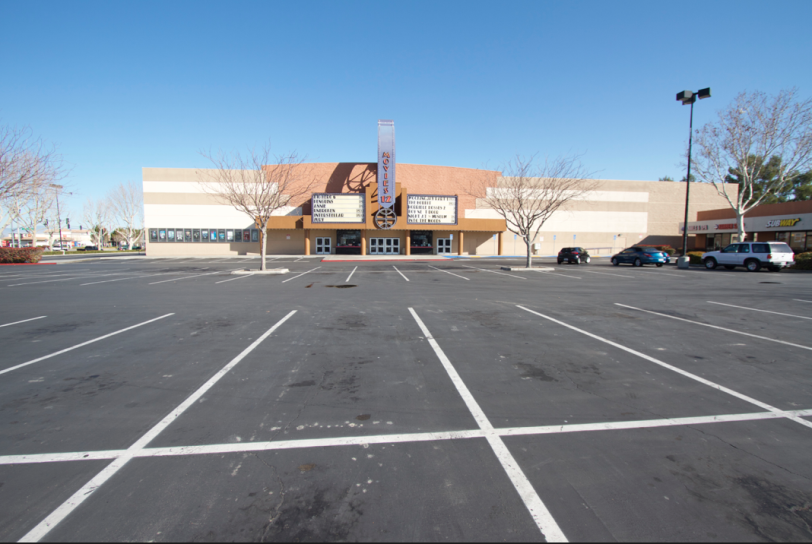
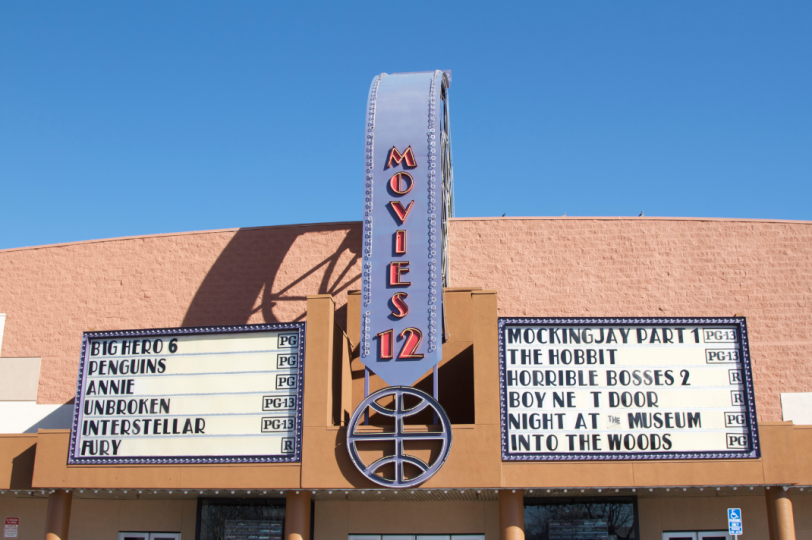
You can go to the movies or marry your high school sweetheart or get cold in Minnesota—

We’ve all heard something to the same effect. Minnesota is a frozen tundra populated by mostly second rate football players and provincial people. No theater. No bikes. No beer. We barely get credit for being an objectively incredible sports town. I wholeheartedly blame our association with the Midwest for this. We are shoehorned into a familiar “flyover state” template and the thermostat is turned down. At least Ohio gets to choose the president.

Why yoke our region to images of yokels? There’s hardly a consensus that we’re part of the Midwest anyway. Meanwhile, the commonly used “Upper Midwest” is the unsweetened oatmeal of place names, hardly worth insisting on.

In “North,” we would own an identity that is simple, evocative, and accurate. It is miles beyond what we have now.

mayday2

Keep Minnesota weird

Yet is this reason enough? It may be that most Minnesotans feel the same way and that the roots are already laid for a reinvention. The capacity crowd at the Walker indicated that many are ready to jump on board. But the success of the North movement relies on both broad and fervent support. To harness both, advocates need to make a compelling argument that embracing our Northern identity is not just a good idea because it feels better than before, but because there is an economic and cultural imperative toward doing so.

Do we Really Have a Place-Branding Problem?

It’s not clear that the Twin Cities and our hinterland are struggling because of our attachment to the boring Midwest and our reputation as the American manifestation of Hoth.

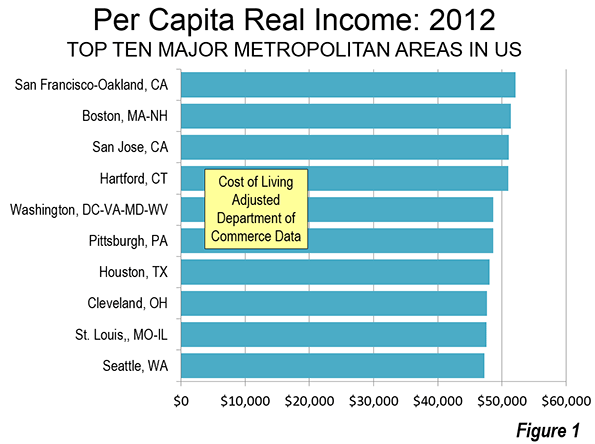
Minneapolis-Saint Paul is punching well above its weight economically. The metro unemployment rate is the lowest of any large American city, we have high wages, and a modest cost of living. We have the fifth most Fortune 500 companies and the most per capita of American metropolitan areas. We’re not bad for small businesses either. As a result of the MSP economic engine, the state of Minnesota is also doing relatively well. Our state’s unemployment rate is the nation’s fifth lowest and our economy is growing at a reasonably strong rate.

Of course, the problem here is that we’re dealing with a counterfactual. If Minneapolis-Saint Paul had a stronger identity, would we see the results in a better economy?

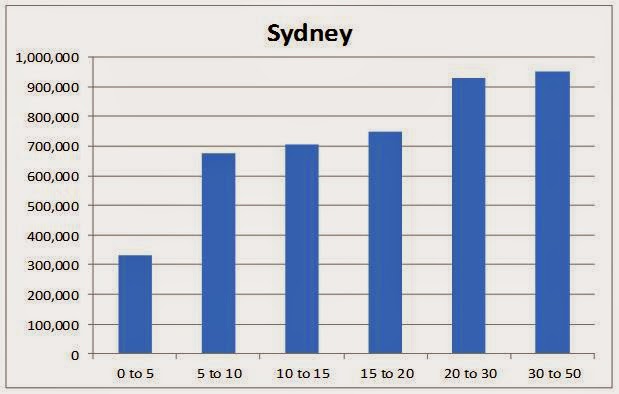
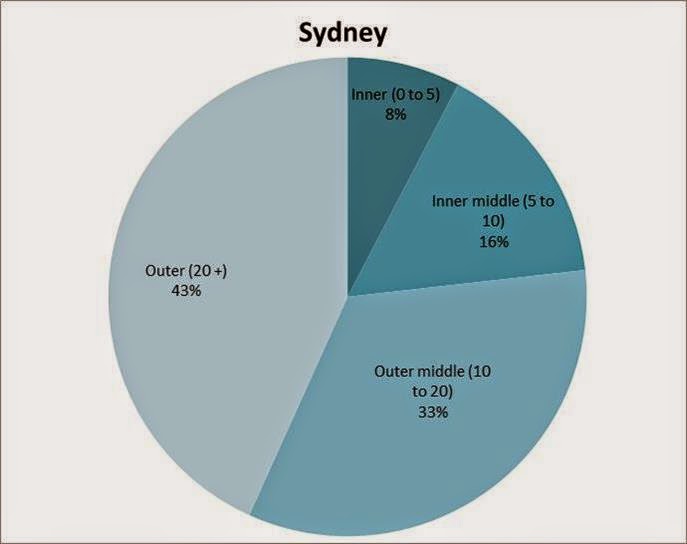
It’s nearly impossible to prove, but with basic data we can make a few back-of-the-envelope observations that may bolster that claim. We know that cities and regions with more human capital have a strong correlation with economic strength. There is some evidence that suggests we could do better at attracting that talent. Data from City Observatory‘s ‘Young and Restless’ Report shows that the Twin Cities boasts one of the better educated cohorts of young people in the country. Given our strong economic position and wealth of colleges and universities this is not surprising. But despite an increase in the number of young and educated in the city and the metro area, we lag behind some of our national rivals in growing these numbers in a way that seems at odds with what our economic and educational attractiveness would predict.

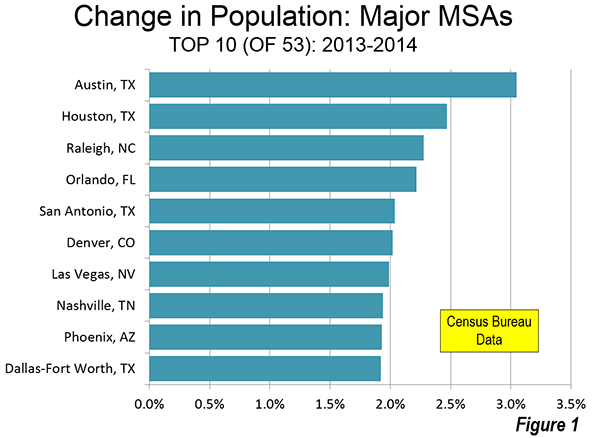
Minneapolis-Saint Paul ranks tenth in young and educated adults who live in the city, but fourteenth in terms of real growth, and twenty ninth in percentage terms. Denver is an easy comparison. The Mile High City (that’s their tourist slogan too—straight, to the point, and in sync with how outsiders think of the city) had just over 2000 more young and educated adults than MSP in the year 2000. Now the gap is over 6000. That’s why Denver got the star treatment from the New York Times in this article that Facebook’s algorithm has been advertising to me for the past three months.

Baltimore is the nation’s biggest turnaround story, having doubled the young and educated population of the city from 2000 to 2010, surpassing MSP in the meantime. Baltimore doesn’t have a brilliant identity (The Charm City), but it offers a relatively low cost of living,dramatic cityscape improvements, powerful educational institutions, and an enviable position in the undoubtedly cool Northeast megalopolis (with the ability to commute to DC). MSP can boast three of the four, but not the East Coast brand.

It’s plausible to infer that Baltimore’s low cost, urban and high ed assets, and unique position have helped it draw in a young, educated crowd, but that its lack of a compelling identity has contributed to the lack of attachment to it that residents feel.

The Branding Theory

So the theory as a whole goes like this:

We are mired in a classic economic morass of having a product that people cannot distinguish from other substitutes. Those substitutes are regional railroad and rust-belt towns like Indianapolis, Cleveland, and Milwaukee. The image of these cities is cold, boring, and downtrodden. If we want Minneapolis-Saint Paul to attract people, especially people who have the agency to move to a place of their choosing, what outsiders think of us matters. It is not enough to simply have a superior product. We want to be competing globally as a region and nationally with places like Baltimore and Denver, cities near our size that are buoyed by capturing a greater share of the flood of young human capital. To better compete, we need to celebrate our strengths, turn our weaknesses into opportunities, and emphasize what makes us unique.

guthrie

Minneapolis at its most dramatic

The third rail to this argument is the (in)famous University of Toronto geographer and public intellectual Richard Florida. His work, first laid out in his astonishingly influential 2002 book, The Rise of the Creative Class, is referenced in the original Star Tribune article, and was also brought up at the Walker discussion. Florida essentially takes the human capital economic theory and identifies certain groups—like scientists, engineers, gays, and bohemians—who are “creatives”, and thus (more) important to urban economic vitality. Creative class theory offers policy prescriptions that are extremely appealing to many urbanites, and a beguiling foundation for the Northern argument. There are two problems with it. The first is that Florida’s work, while popular with policy makers and media, is extremely controversial among academics, and has been thoroughly criticized. Second, the creative class is a deeply exclusionary group. While I enjoy belonging to the demographic being fêted by city officials, the identity of our cities and our region must belong to all, not just people like me.

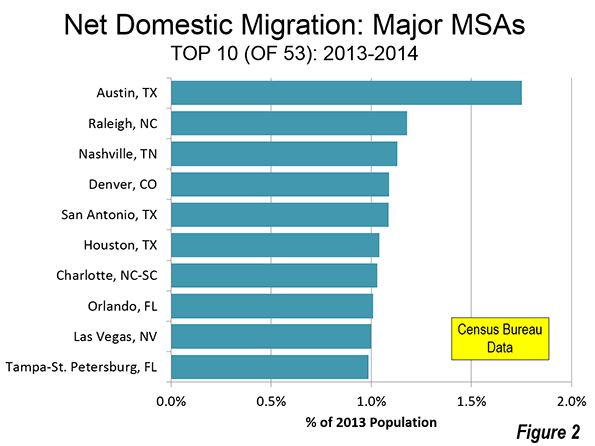
This perspective is biased in another way, too. When I ran this article past a friend of mine who is originally from Wisconsin, he called me out on my own coastal bias. In writing extensively on how to make Minnesota attractive to outsiders, I had left unsaid what championing the North might say to those who already live here. This was an embarrassing omission. 29,000 young adults leave Minnesota to attend schools out of state (21,000 come in) and far fewer return. Overall, Minnesota suffers a net loss of residents to domestic migration. Even to those who live here, the North’s image could use burnishing.

Culture is the Key

That’s why the Northerners must make a cultural argument as well.

There’s a lot of low hanging fruit here. Minnesota is the state of hockey (despite thedisappointments wrought by our local professional team). We supply the US Olympic Team’s curlers. We host the Loppet, a pond hockey championship, and the best attended Red Bull Crashed Ice event. Snowmobile manufactures Polaris and Arctic Cat are Minnesota-based. We’re avid ice anglers, an activity that is the subject of ridicule in most of America. (Full disclosure: I don’t really get it either.) There is no state in the union that so thoroughly embraces the full spectrum of winter activity. Meanwhile, in the summer, Saint Paul hosts the Minnesota State Fair, which can claim the highest daily attendance in the nation. If any event celebrates the spectrum of what it means to be a Northerner, it’s this.

That’s what you put in a 30 second tourism television spot. But being from the North can mean more than just winter activities. Cabin culture is something that seems a uniquely Northern phenomenon. Minnesota has one of the highest rates of second homes among US states (5.1% of the total dwellings); fifth if you remove sparsely populated states. Wisconsin and Michigan have similarly high rates of vacation homes, while Maine, New Hampshire, and Vermont have the highest percentages nationwide. Northern forests are a transcendent cultural asset.

Historically, the North was settled by Germans and Scandinavians, and their legacy is evident in a way that is easy to spot. Perhaps as a result, our region differs linguistically, which is a powerful source of identity. The Minnesota accent is distinct and a cultural hallmark of the region, just as the drawl defines the American south. Some of our words are different too. Northerners play Duck, Duck, Grey Duck and eat hot dish. (NOT grape salad, remember that now.) And if we’re talking about the legacies of the past, the new North could properly recognize the American Indian history of the region, something that only the Southwest and Pacific Northwest seem to do in any measure.

Our region is also different politically, especially given recent elections in which our neighbors have become Republican territory while Minnesota has remained steadfastly progressive. But this is an element of Northern identity that is problematic, not least because it threatens to excommunicate about half of those whom we would welcome into our tent. Another concern is that political winds are mercurial. Not long ago Minnesota was governed by a Republican and represented by a Republican senator, while Wisconsin was more proudly liberal. Any Northern identity must be durable enough to withstand political shifts.

The Economic Argument

But what do we get from affirming these cultural quirks as the bedrock of an identity distinct from the Midwest? I think a few things.

One, we bolster the value of Minnesotan goods. The ‘North’ movement has been criticized as an elaborate branding campaign by Dayton on behalf of his businesses. Obviously I believe it is and ought to be much more than that. But that does not mean that spreading and supporting Minnesota brands cannot be one of the goals of the campaign. If Minnesota-made boots, sweaters, blankets, and more become fashionable, than Minnesota itself benefits. In the Star Tribune article, Thomas Fischer, dean of the College of Design at the U of M, admits that the region has a “slightly hick” reputation. Northern goods can pave the way for greater respect for Minnesota, the Twin Cities, and this region’s lifestyle.

Second, we better control our own narrative. Fargo is a wonderful movie, but the impact it has had on Minnesota’s image is hard to understate. At Macalester (where I went to college), the movie is one of the few reference points many new students have when relating to their new home. It’s a wonder anyone actually attends. Prairie Home Companion is another revered Minnesotan cultural export that does the state few favors in the population at large. I love it too, but it benefits substantially from context (and repeated listening). ‘North’ can be that context. ‘North’ can trigger the connections between not just Fargo and PHC, but on to other strengths as well. There’s a reason that no amount of Hollywood violence set in New York can diminish that city’s glamour. The context is too strong. Yet Minnesota is best known by just a few cultural touchstones.

Third and finally, emphasizing a Northern culture also includes our rural hinterland. I live in the Twin Cities, as do those who have launched this campaign. At the discussion at the Walker, there was a tension in defining the North; who is a part of it, and who is not? This does not need to be centrally planned; as with all of our nation’s regions, membership islargely down to self-identification. But the North’s borders will not extend beyond I-494 if Minneapolis-Saint Paul dictates the entire platform. There is no dispute that MSP is the economic and cultural capital of the region. There is no dispute that becoming more attractive to young, college educated, creative professionals (near and far) is primarily an urban concern. But rural areas demand respect and deserve it, given that much of the Northern identity we’re peddling is derived from and preserved by them.

minnesotawsj

The Wall Street Journal’s map of Minnesota’s offerings

A Northern Agenda

In one sense, there’s not a lot that really needs changing. The North already exists; it’s not something we need to invent, only identify. This is already well-covered ground. Look no further than The Line or the WSJ articles for a detailed survey of how Minnesota and Minneapolis-Saint Paul are distinct from other Midwestern places, better than other Midwestern places (would we be here if we didn’t believe that on some level?), and uniquely represent what it means to be a Northern region and city. At the Walker, one point of discussion was how to turn our biting winter into a positive. That’s something that Northerners already do. From the Winter Carnival, to the Holidazzle Parade/Village, to Crashed Ice there is plenty to do in wintertime. What’s left for us to do is to be proud of our region’s characteristics (in this case, the climate) and to sell them.

But in another sense, it would be a missed opportunity to think of North as simply a marketing campaign. North could (should) be as much about placemaking as place branding. This may be a chance to set the course of the region in a deliberate way. The recent media coverage illustrates these dual objectives, because both Brinkley and Martucci capture important parts of what North is about. The aim is to reinvent the image of our cities and our region—and reinvent the cities and the region themselves.

If we want it to be—this could be a big undertaking.

Marketing Ourselves 

One thing we could get right immediately is the marketing. We should learn from Denver, whose municipal logo and tourism logo both emphasize the skyline of a major metropolis, the rocky mountain backdrop, and the same evocative nickname: ‘The Mile High City’. On the other hand, Minneapolis, our region’s most dynamic hub and economic powerhousehas an awful logo that comes in ballpoint-pen-blue and says absolutely nothing meaningful about the city. Meet Minneapolis has a nice logo, but the tagline; “City By Nature” falls flat. It’s certainly not wrong, our parks are one of the absolute highlights of the cities, but it doesn’t play any of the chords that outsiders have when it comes to Minneapolis. “The Capital of the North” is a bold statement of the city’s prominence, and one that also embraces the region’s climate and culture. It would serve well as both the city’s nickname and tourist slogan, or in a parallel universe, the slogan of a combined MSP tourism agency. As for a logo, there are a number of possible starting points. But my vote is for the North Stars’ iconic mark, which could easily be converted from an “N” to an “M”. The Minnesota/Northern state/region motto and team namesake L‘Etoile du Nord is referenced brilliantly here, and I love the dual meaning that comes from the mapping convention of using a star to represent a capital city.

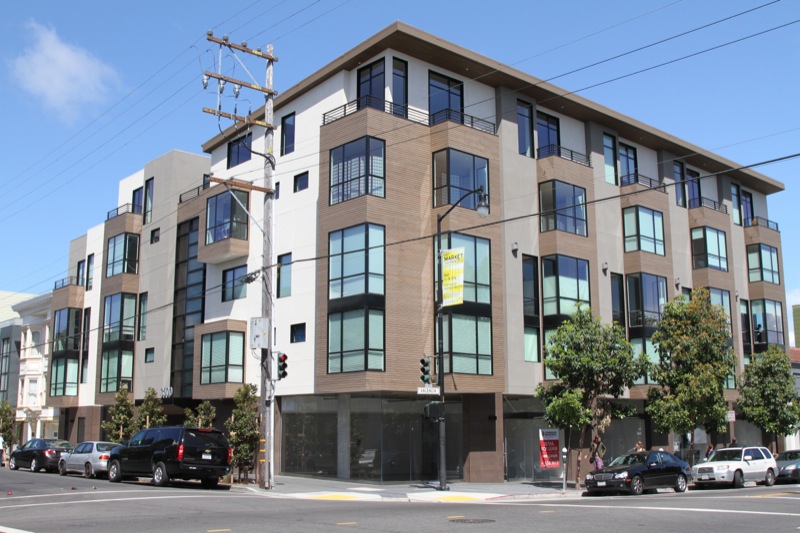
There’s also a conversation to be had about Minneapolis-Saint Paul’s symbols. Seattle has the Space Needle, St. Louis has the Gateway Arch, Chicago has the Willis Tower, and so on. It’s certainly not necessary to have a single monolith somewhere, but it’s hard to think of an iconic image of MSP that outsiders might have. Unless MSP hosts the Olympics (which we might want to consider, we wouldn’t have to build much) or the World’s Fair, we’re unlikely to throw a ridiculous amounts of money at a massive landmark project in the future. Plus,we’re already doing it. The new Downtown East stadium will soon be the most well-known building in the cities, beating out four important Minneapolis works by Pritzker Prize winning architects, two classical marvels in Saint Paul, and a sculpture of a utensil that will soon be usurped on all the postcards. That’s not the end of the world. The stadium may well look pretty tremendous. It might also change the default-picture-taking-place fromthat pedestrian bridge over 35W to the Cedar Avenue bridge that crosses over the light rail, which would put the green line in the foreground.

The renewed focus on Downtown East offers some unique chances to create a unique, iconic place. One interesting urban feature that will come from the downtown east redevelopment is Wells Fargo’s rooftop signage that will shine down on the Commons park. Here’s to hoping that Wells Fargo does something interesting with their branding. The Twin Cities already have a plethora of memorable advertising signs, but none that really stand out as a regional symbol. If the city asked to be able to take over a rooftop space, they could do something much more interesting. As placemaking ideas go, signs are ridiculouslycheap.

There are other major projects going on that will be local landmarks. The Water Works park would be a tremendous addition to the river, which remains our best (and not entirely fully realized) asset. The reconstruction of Nicollet Mall is another large scale project, and one that’s much further along in the planning and funding. The city has repeatedly indicated their desire to see the mall become the region’s “main street”. On February 3rd, the city issued a call for artists for four large scale projects along the street. Among the projects, the city would like to see an artist “create a large-scale iconic artwork” on the mall. Whatever shape this takes will probably come down to the mind of a mad genius, but the selection process ought to consider work that is derivative our our city and region.

The key date for this marketing push is February 4th, 2018. That’s the day when over 100 million Americans will tune in to watch two teams—neither of whom is likely to be the Vikings—contest Super Bowl LII. For the week leading up to this event, the nation’s sports media will be in the cities, making jokes about the weather. During the game, NBC will be leading into the play with blimp shots and stock footage. It’s easy to overstate the effect of events like these; politicians do it repeatedly. But the Super Bowl’s visibility and timing make it a natural checkpoint in any branding initiative. The bid committee reportedly won the NFL owners over with their plans to embrace winter. Hopefully that does not just mean hanging out in the MoA. If the organizers are true to their word, the Super Bowl will be the perfect opportunity to show the largest possible audience what living in the North is all about.

redbullcrashedice

A new image of Northern cool

Growing the Region Through Tolerance

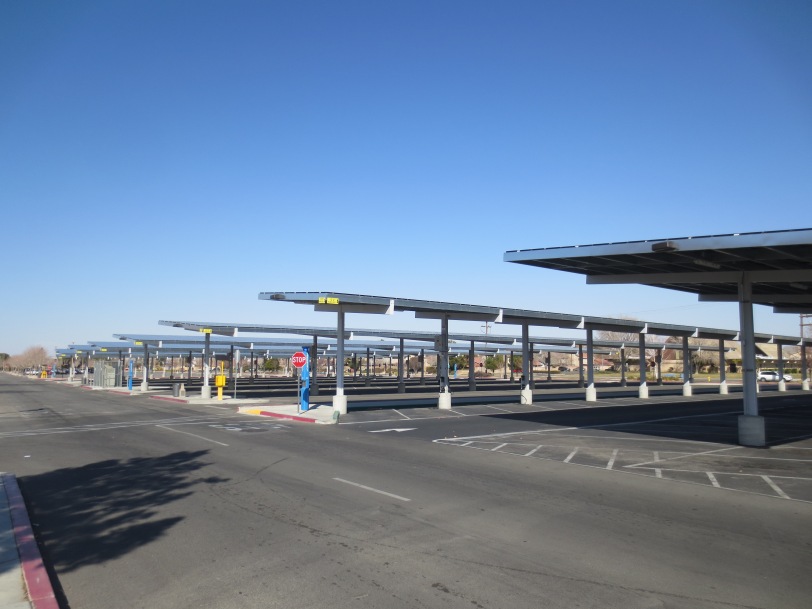
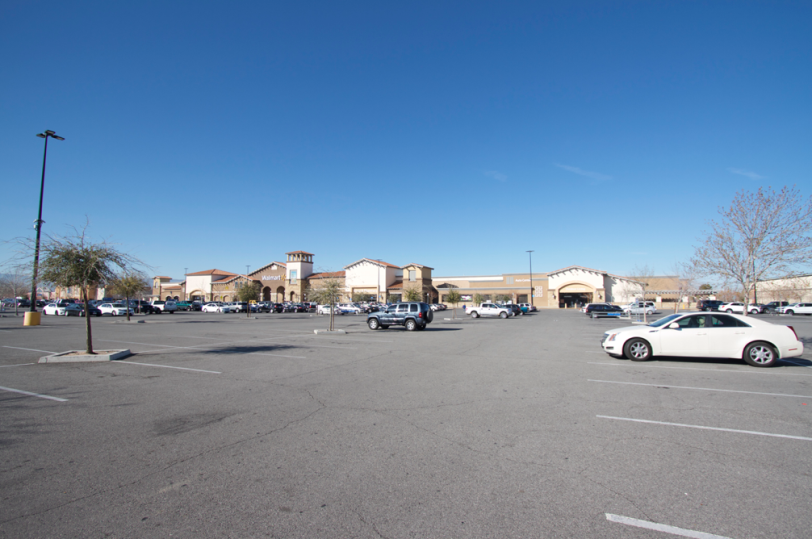
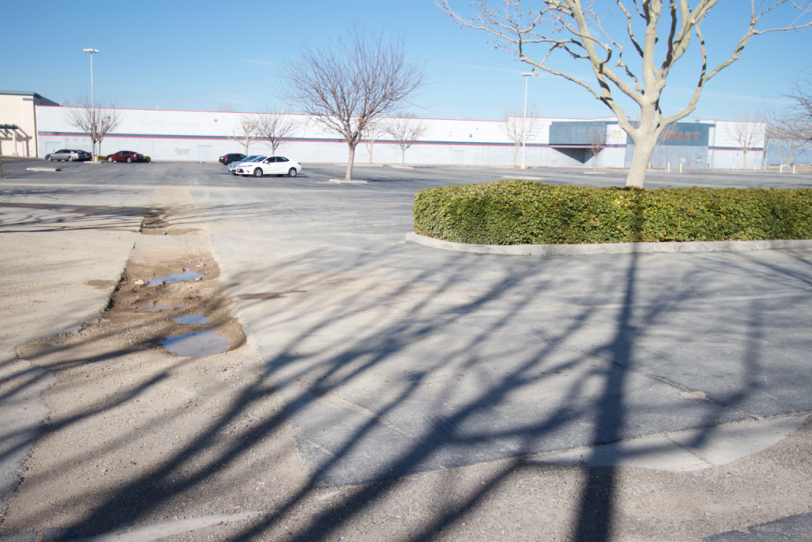
Altering the image of the region is one project. Altering the region itself is another. The North is worth distinguishing and promoting. But it is certainly worth working to change and improve. It seems as though every month brings new construction projects that will transform the Twin Cities into a more dense, livable, and remarkable place. Yet there is still a parking lot across from the Warehouse District light rail station and the downtown Saint Paul Macy’s still casts a pall over the surrounding sidewalks. The real estate market is strong, but not yet strong enough to fill all of the available holes. Growth is still an imperative. Meanwhile the battles over transportation investments, which could bind the cities, state, and region closer together, instead divide them along political lines.

Is there an apolitical, Northern resolution to these issues? Perhaps not, but in building a Northern identity, we could make choices about our culture that would help us navigate these storms. In particular, I’d urge a reflection on what ‘Minnesota Northern Nice’ could mean.

All sides of every issue do not need to agree on the particulars, but what they should do instead is make a commitment to a process of compromise and conciliation. Many Minnesotans are descended from Scandinavians, who have a long political tradition of seeking consensus. In an increasingly polarized America, politicians and those promoting the idea of a Northern identity should all agree to work to make Minnesota an exception that can serve as a model. We already can count on voter turnout and civic engagement that rank among the highest in the nation. All sides should at minimum find common ground in bolstering the ownership that all Northerners feel in their society through a political process that takes inspiration from our Nordic cousins. Initiatives like solving the achievement gap and reducing our pernicious residential segregation (linked issues that have been addressed by both parties) would be a powerful start.

Northern identity should also influence our perspective of who becomes a Minnesotan. The state loses more people each year to other states than it takes in. However, Minnesota is still adding newcomers, thanks to international immigration. Again, Scandinavian nations should provide a Northern model. While these nations are more restrictive towards immigration than the United States, they accept high numbers of refugees. This tradition already exists in the state, and it should become a point of policy emphasis. As Minnesota ages, it will become increasingly crucial to bring people to the state from wherever we can; not just the educated 20-somethings covered above. Other regions will have a similar idea, but the North can gain an advantage by creating resettlement policy in the Scandinavian image that would attract those seeking to start a new life in this country. Meanwhile, the North would set in stone a welcoming and helpful culture that eases the transition for international migrants. We have the affluence, the space, and the culture to adopt such a policy.

Assessing how Minnesota markets itself, inside and out, is easy. Building and shaping our landscape and culture in this new image is profoundly difficult. But small steps count too, and we should be bold in setting far reaching goals for the city and the region. If there’s a thread that runs through the North campaign, it’s about taking charge of our own story. As the Midwest, we’re on the fringe of a large, flat, and forgettable mass. As North, we’re at the center of a region with its own story to tell and our own story to write.

minneapolis sunset

 Keep Minnesota awesome

Yes, I Know This Is Long…

At one point, this article was conceived as a personal reaction to an issue that struck a chord. It ballooned, in part because everywhere I looked, I found more to discuss. The prospect of changing an entire geographic identity is a daunting one. I believe it can be done, and moreover, I believe there’s a compelling case to be made that it should be done.

That said, I have just one perspective. This article attempts to approach from multiple angles, but there is only one that this writer can truthfully inhabit. I expect to hear about those I shortchanged in the comments.

I have some reservations about the Northern idea. Would it be possible to maintain MSP’s exceptional gap between wages and cost of living if the cities became more popular? New York City Mayor Mike Bloomberg once referred to Manhattan as a luxury product, and luxury goods behave differently in economic theory. While comparisons between the Twin Cities and Manhattan are ludicrous, it’s possible to envision the Twin Cities as losing their budget option appeal if the market properly valued (or overestimated) our assets. There’s surely a benefit for those of us who are here now in living in a place that is underrated.

Or might the concept of North simply divide, instead of unite? Would we end up with Team Midwest vs. Team North?

And of course, there’s the real possibility that the idea just never gains momentum. This is the eventuality I can do the most about, and this article’s main contribution may simply be to keep the idea of North in the spotlight. But beyond that, I’d love to add to the debate about the idea. There is not necessarily a right or a wrong answer, nor may there be disagreement as to whether there’s a solution at all. But I think in this time of change, the discussion is worth having.

This piece first appeared on the non-profit and volunteer run Streets.mn. Support Streets.mn by becoming a member.

Alex Schieferdecker is a New York City native. He graduated from Macalester College with a major in Geography and an Urban Studies concentration. He's currently stationed on the border between Minneapolis and Saint Paul, living the Green Line life. He also writes about Minnesota soccer for The Loon Call. His twitter handle is @theschief.

California's Social Priorities, A New Report

$
0
0

This is the introduction to a new report, California’s Social Priorties, from Chapman University’s Center for Demographics and Policy. The report is authored by David Friedman and Jennifer Hernandez. Read the full report (pdf).

California has achieved a great deal since 1970, including much cleaner air, water and more effective resource stewardship notwithstanding a population increase from approximately 19.9 million in 1970 to over 38 million by 2014. 2 Nevertheless, the state continues to face significant, and in many cases increasingly adverse educational and social equity challenges. As summarized in more detail below:

  • California’s grade 9-12 dropout rates remain high and, contrary to national trends, the state’s population of adults with less than a high school education significantly increased from 1970 and currently accounts for nearly 20% of the state’s adults, second highest in the nation. The number of Americans with less than a high school education fell by over 23 million during 1970-2012, and rose in only four states: California, Nevada, Arizona and New Mexico. California’s net increase—over 515,000 adults—was greater than the increase in the other three states combined (409,000).
  • The state’s population of high school and community college graduates grew much slower than in the rest of the country, and the population of 4-year or more college educated adults barely kept pace with average national growth rates. In contrast, Texas, also a large, high-immigration state, has added high school and community college-level educated adults more rapidly than the national average since 1970, while the number of adults with less than a high school education declined.
  • Inequality has dramatically increased since 1970, when California’s rate of inequality was 25th in the nation. By 2000, the state had the second worst in - come inequality in the country, trailing only New York. The state’s inequality remained fourth worst in the nation (behind only New York, Connecticut and Louisiana) in 2013.
  • Income growth for all but the richest 20% of all California households was below the national average from the mid-1970s to the mid-2000s. Incomes for the richest 20% and 5% of all house - holds rose much faster than in the rest of the country.
  • Between 1970 and 2013, California’s official poverty rate (which ignores cost of living differences in the U.S.) rose from less than 10% to over 16% of the population. In 2012, the U.S. Census Bureau developed a supplemental poverty measure that accounted for higher living costs in coastal locations such as California. The supplemental measure indicated that, during 2010-2012, nearly 9 million Californians, or about 24% of the state’s population, was impoverished, by far the largest poverty rate in the country. Although California accounts for 12% of the U.S. population, the state has over 18% of the nation’s poor.
  • California’s capacity to generate new jobs has severely diminished over time. During 1970-1990, the state generated nearly 5.6 million new jobs and 14.5% of the total employment growth in the country although it accounted for less than 10% of the nation’s population in 1970. From 1991-2013, the state produced 2.6 million new jobs, just 9.7% of the net U.S. employment growth, and well below the state’s 12% share of the nation’s population in 1990. Although the state’s population rose by roughly similar amounts in 1970-1990 (9.8 million) and 1991-2013 (8.6 million), California was unable to generate even half the number of jobs during 1991- 2013 than were created in 1970-1990.
  • Annual nonfarm employment growth averaged 3% in 1970-1990, well above the national average, but just 0.8% in 1991-2013, well below the national average. In contrast Texas, with 70% of California’s population, produced over 4 million new jobs during 1991-2013, and Florida, with half of California’s population, generated nearly the same number of new jobs as California (2.2 million). During 1991-2013, California more closely resembled historically slow growing northeastern and Midwest states than faster-growing regions of the U.S., especially in the southeast.

These data show that California needs to address significant, and growing social priorities, including significant improvement in adult educational rates at the high school and post-secondary level, increasing employment opportunities at a rate sufficient to serve past and forecast population growth, and reducing the state’s inequality and very high poverty rates.

California continues to lead the country, and by some measures even the world, in environmental quality and climate change initiatives. But public policy must evolve to leverage these environmental achievements into corresponding improvements in educational attainment and middle class job creation. With more than 18% of the nation's poor, and less than 1%3 of global greenhouse gas emissions, California should also embrace the challenge of leading the world in the creation of middle class manufacturing jobs for the rapidly evolving clean and green technology that California's laws mandate, California's educational and technology sectors invent, and California's venture capital investors bring to the global market.

Instead, California’s policies, and regulatory and legal costs and uncertainties, tend to divert thousands of middle class jobs even in emerging green industries (including those not requiring high school diplomas) to other locations, including the Tesla battery manufacturing facility, which moved to Nevada. The loss of projects that help achieve important environmental objectives, create high quality jobs, and comply with California's strict environmental and public health protection mandates, continues to occur in part because well-funded special interest groups ranging from business competitors to labor unions file "environmental" lawsuits as leverage for achieving narrow political or pecuniary objectives rather than to protect the environment and public health. This study suggests that the state must work much harder to ensure that California's landmark environmental laws are not misused or pursued in a manner that adversely affects other, equally important policy priorities for California's large undereducated and underemployed population.

Read the full report (pdf).

The New, Improved? Rust Belt

$
0
0

There is no longer a Rust Belt. It melted into air. The decline of manufacturing, the vacancy of the immense, industrial structures that once defined the productive capacities and vibrant lives of so many pockmarked towns, the dwindling of social capital—all the prognosticators writing the obituaries for these dead geographies were right.

How long were rust belt cities going to be able to, as author Robert Putnam would phrase it, “bowl alone?" It turns out not very long.

Rust Belt cities don't exist because the narrative surrounding them over the past few years has slowly changed. No longer are they identified as places of decay; now the story is that they're places of opportunity and renewal. This conviction is emerging against the backdrop of a general sort of reintroduction of the American city as a great, good place; a crucible of talent, energy, youth and creativity. (As if that hasn’t always been the case.)

Now, for every Detroit horror story, there’s a shiny Shinola. Buffalo is a nascent hipster haven.

Levon Helm has risen from the dead and is singing, “Look out, Cleveland, some craft brew is comin’ through…”

With its well-defined physical landscapes and deep cultural histories, the Rust Belt aesthetic has long been subject to the same forces that have turned places like Williamsburg, Brooklyn and Chicago’s Wicker Park into moneyed enclaves of those seeking a repurposed past for modern means. As the global city shatters into a million pieces, Rust Belt cities are poised to piggyback on their own organic growth, becoming ever more attractive with their lower barriers to achieve a sense of urban authenticity.

Yet, as pockets of Rust Belt cities are successfully redeveloped, is there reason for concern that they may be losing some of what sets them apart?

In Chicago, where the Rust Belt exists under the glittering shadow of its Global City sheen, the steady march of hipsterdom through Wicker Park and Logan Square is nearly complete. On the Far South Side of the city, on the fallow 700-acre grounds of the former US Steel South Works mill, a massive, master-planned mixed-use development is envisioned and (very) slowly taking shape.

In the Corktown section of Detroit, the long-abandoned and derelict Michigan Central Station has morphed into an asset for a bevy of bars, shops and nightlife stops, which have deservedly garnered travel nods from Martha Stewart. Working through the Bedrock Financial-led-revitalizing downtown and past the hip enclave of Midtown, a new steward is currently cleaning up the infamous Packard Motor Plant and entertaining plans of perhaps an “autonomous community.”

In Pittsburgh, a city always a little ahead into the future, Lawrenceville has been dubbed one of the “top 26 most hipster neighborhoods in the world” by Business Insider magazine, while in the South Side neighborhood, the old J&L Steel mill on the banks of the Monongahela River is currently home to SouthSide Works, a “shop/dine/play/live” mixed-use lifestyle center of offices, residences, movie theaters and outlets of H&M, American Eagle and The Cheesecake Factory.

These movements through the cityscape may seem disconnected, but they represent a waning of the cultural affect that is specific to a sense of place and defines it. Whether it is a sort of hipster-variation-on-a-theme or a top-down, master planned repurposing of formerly industrial sites, there is an emerging urban typology that is seen and felt in cities everywhere. In this way, these commoditized developments echo their suburban forbearers in standardizing a formula for successful sameness.

When the French anthropologist Marc Auge coined the term 'non–place' to describe the interstitial spaces in which so much of modern life unfolds, he focused in on the transitory nodes of transit and commerce such as airports, highways, and supermarkets to describe a condition wherein the individual “becomes no more than what he does or experiences in the role of passenger, customer, or driver”— namely, a consumer. Many critical urban theorists have adopted Auge’s theory to describe the monotony, placelessness, and anywhere-ness of sprawling suburbs.

One could argue, though, that as cities proper increasingly mirror one another in their (re)development, Auge’s theory now threatens to apply itself to the fabric of cities themselves. It begs the question of whether there are perhaps other ways to engage and activate 'non-place' into meaningful, active space.

Managing needed investment while maintaining distinctiveness — which is, of course, what makes any city worth its while to begin with — is a delicate dance. Like everywhere else, the Rust Belt is inspiration for a form of American magic realism, wrestles with this.

Cities change. To assume the city hasn’t always been a speculative spectacle is ludicrous, as silly as it is to perpetuate dead geographies onto the living. But the refashioning of Rust Belt cities’ physical and cultural landscapes should at least give us pause to wonder if we’re losing realism and magic in manufacturing a sense of place.

Ben Schulman is the Communications Director for the American Institute of Architects Chicago (AIA Chicago) and the co-creator of the Contraphonic Sound Series, a project that documents cities through sound.Follow @skyscrapinknees (https://twitter.com/skyscrapinknees)

Flickr photo by Russ: Detroit Bike City Shinola

Life is Good in St. Louis

$
0
0

The headline line in the Sunday St. Louis Post-Dispatch asked "Are St. Louis Area's Home Prices too Low?” This is could not possibly have appeared describing any major metropolitan area of Australia, New Zealand, or the United Kingdom. Nor will newspapers in Vancouver, Toronto, Calgary, Portland, Seattle, Boston, New York or in any of the overpriced markets of California decry low prices any time soon.

The March 8, 2015 article by Jim Gallagher rightly noted that house prices tended to be higher in cities outside St. Louis, there are "restrictions on building, either geographical or political." Gallagher quotes William Rogers, an economist at the University of Missouri- St. Louis says that "Developers have really serious problems putting up houses in Los Angeles or San Francisco."

The 11th Annual Demographia International Housing Affordability Survey, produced with Hugh Pavletich of Performance Urban Planning in Christchurch New Zealand,  confirms the low house prices in St. Louis. In 2014, the median multiple, a price to income ratio calculated by dividing the median house price by the median household income, was 2.7 in the St. Louis metropolitan area. St. Louis is tied for fifth most affordable middle-income housing market among the 86 major metropolitan area markets (over 1,000,000 population) in nine nations.

No one should imagine that the low prices of St. Louis are the result of a depressed economy. Yes, St. Louis is on the periphery of the rustbelt. And yes, the city (core municipality) of St. Louis has lost a larger share of its population than any other large municipality in modern history. Since 1950, the city of St. Louis – a mere 11 percent of the metropolitan area – has lost 63.2 percent of its population, slightly more than the city of Detroit, at 61.4 percent.

Yet, somehow the city of St. Louis has avoided the financial train wreck of Detroit, nor do planners suggest the next industry should be urban agriculture. At a minimum, the difference suggests that St. Louis, even as it has lost population, has been much better led than the Motor City. Further, the much larger St. Louis metropolitan area (which is the area described in the Gallagher article and rated in the Demographia Survey) is anything but depressed.

Gallagher indicates that "lots of people here could pay more for houses, but they don't have to." That is correct. However, households in St. Louis pay approximately the same percentage of their income to buy houses today that most people have since World War II. That is also the same amount that Angelos and San Franciscans paid until the coming of excessive regulation (see Fischel) in the 1970s; since then  house prices there have increased between 2.5 and 3 times.

On the surface, St. Louis appears about average in income. St. Louis ranks 25th, slightly above the middle of the 52 major metropolitan areas in per capita income. But that's just the beginning of the story. As anyone looking for employment in other metropolitan areas quickly finds out, housing cost differences can be huge and make up most, if not all the difference in cost of living. When the cost of living is considered, real personal incomes in St. Louis rank ninth among the 52 major metropolitan areas. It may be surprising, but St. Louis ranks above number 10 Seattle. While nominal incomes in Seattle are nearly 20% above that of St. Louis, when the cost of living is considered, St. Louisans had nearly 1% more income than Seattleites in 2012 (Figure).

The metropolitan areas ranked above St. Louis are the usual suspects of nominal affluence. No one would be surprised that San Francisco has the highest incomes, both nominal and adjusted for cost-of-living. San Francisco's nearly 50% advantage in nominal personal income over St. Louis drops to less than 10% when the cost of living is considered. Given the graduated nature of the federal income tax, the difference could be less. The other most affluent cities are Boston, San Jose, Hartford, and Washington. The cost of living conversion factor (regional price parity) is more than 25% in San Francisco, San Jose and Washington and 18% in Boston. Only in Hartford, among the leaders, has anything similar to a normal cost of living (6% above the national average)

There are other surprises in the top 10. Both Pittsburgh and Cleveland have higher cost of living adjusted incomes than St. Louis. Less surprising is that Houston is in the top 10, given its robust economy, at least before oil prices dropped.

There are some interesting omissions from the top 10. Global city New York ranks 17th, just behind "Music City" Nashville. Portland, America's incubator of house price increasing planning policies, finds itself ranked 39th. Even in Jackson, Mississippi, not large enough to make the over 1,000,000 list, has higher real per capita income than Portland.. Perhaps the biggest surprise is Los Angeles. Like New York, often considered a Global City, the city of my birth is anything but Global City real per capita incomes. Even depressed Detroit (though the suburbs of Detroit are anything but depressed) is ranked 10 positions above Los Angeles and has real per capita income 10% higher.

All of this should be regarded as good news for St. Louis. Once, to be sure, St. Louis was far more important. As late as 1910, St. Louis was the fourth largest municipality in the United States, trailing only New York, Chicago and Philadelphia. While St. Louis is not depressed, it has grown much more slowly than most metropolitan areas. But the decline has been more in the urban core city than the surrounding areas. Over the past the past 60 years the city of St. Louis lost more than 500,000 residents, while between 1950 and 2010, while the suburbs added 1,400,000.

Gallagher indicates that construction prices are reasonable in St. Louis. In fact they are not much less than in the stratospheric housing markets of San Francisco and Los Angeles. For example, a 2,500 square foot starter house in the East Bay of San Francisco would cost less than 10 percent more to build than in St. Louis, according to data at building-cost.net.The difference between housing costs in St. Louis and high-cost market is in the land, which is where the cost of excess regulation shows up

As a metropolitan area, St. Louis has competitive difficulties (see: Shrinking City, Flourishing Region: St. Louis Region). The weather is not as nice as in California. The winters are tougher than in Texas or Florida. But the one great advantage St. Louis possesses is reasonable middle income housing affordability. This is an important competitive advantage that led to only modest domestic migration losses during the 2000, when high priced Los Angeles and New York were bleeding more than 1.3 million net domestic out migrants.

Also, with the money they don't have to pay for over-priced housing, St. Louisans can buy more "stuff" or take longer vacations. Nor do St. Louisans get less for their less money. The median sized detached house is the same in St. Louis (1,800 square feet) as in  San Francisco and slightly larger than in Los Angeles (1,744 square feet), according to the American Housing Survey in 2012, yet St. Louisans pay much less.

The bottom line is that for all of the competitive difficulties, life is good in St. Louis. And, one big reason is housing prices middle-income households can afford.

Wendell Cox is principal of Demographia, an international public policy and demographics firm. He is co-author of the "Demographia International Housing Affordability Survey" and author of "Demographia World Urban Areas" and "War on the Dream: How Anti-Sprawl Policy Threatens the Quality of Life." He was appointed to three terms on the Los Angeles County Transportation Commission, where he served with the leading city and county leadership as the only non-elected member. He was appointed to the Amtrak Reform Council to fill the unexpired term of Governor Christine Todd Whitman and has served as a visiting professor at the Conservatoire National des Arts et Metiers, a national university in Paris.

Photo: St. Louis Skyline (by author)

Two Sides of the Same Coin: Decline and Gentrification

$
0
0

Recently I attended a presentation at Mission Dolores Church sponsored by the San Francisco Chronicle called “A Changing Mission”. The discussion was based on a newspaper article and associated short film about the neighborhood. It’s well worth a quick look here.

Screen Shot 2015-02-25 at 5.35.26 PM Screen Shot 2015-02-25 at 5.34.23 PM   unnamed-3


Lancaster, Palmdale 039 (800x600) Screen Shot 2014-11-29 at 2.58.26 AM Screen Shot 2014-11-29 at 2.58.59 AM Screen Shot 2015-02-25 at 6.24.53 PM

A week later I was in Lancaster, California to attend a similar meeting sponsored by the local city planning authority and the Strong Towns organization here. Lancaster is also changing, but in a different way than the Mission.

If I were to boil down the two situations into crude cartoon blurbs they might go something like this. “The Mission is being overrun with rich white people who are screwing up the place.” And “Lancaster is being overrun with poor brown people who are screwing up the place.” Like I said… crude. Obviously the reality is far more nuanced and complicated than that. But that’s pretty much the gist of things. Gentrification and economic decline are two sides of the same coin and a lot of folks don’t like any of it. The irony is both sides seem to want the same things even if they don’t know it.

Screen Shot 2015-02-25 at 5.51.18 PM Screen Shot 2015-02-25 at 8.00.33 PM Screen Shot 2015-02-25 at 5.49.56 PM Screen Shot 2015-02-25 at 5.49.29 PM Screen Shot 2015-02-25 at 4.54.25 PM

There’s a scene in Alfred Hitchcock’s classic 1958 film “Vertigo” where James Stewart mentions an appointment he has with a shady character in the Mission. Kim Novak looks concerned and comments, “That’s Skid Row”. That always gets a laugh from San Franciscans in the audience at the revival theaters. Many people who don’t know San Francisco well assume it’s all tourist spots, internet millionaires, and gay bars. If you walk around the Mission you’ll quickly discover a neighborhood full of families with young children, elderly pensioners, and lots of small mom and pop shops. Until the 1950’s the Mission was a working class neighborhood dominated by German, Irish, Italian, and Greek stock. After World War II white flight to the suburbs left behind a great deal of inexpensive real estate that was eventually filled by Central American and Asian immigrants, as well as various bohemian types. The neighborhood and its low wage workers were quietly ignored by city authorities as well as the more prosperous residents in more fashionable neighborhoods. This was a part of the city no one ever saw on a postcard.

Screen Shot 2015-02-25 at 5.52.02 PM Screen Shot 2015-02-20 at 12.51.35 AM Screen Shot 2015-02-26 at 1.14.57 AM

The Mission deteriorated and served as a repository for the low rent light industrial activities that every city needs but are generally kept out of pricier neighborhoods: auto body shops, carpentry shops, iron and steel fabricators, glass cutting shops, upholsters, discount fabric warehouses, plumbing and electrical supply companies… But it was also the perfect place for nightclubs and after hours establishments since there were no hostile neighbors to complain. The Mission was noisy and ugly, but it was that unseemly quality along with the cheap rent that made it possible for a lot of people to scrape by while pursuing other activities that didn’t necessarily pay well. It’s no coincidence the Burning Man and other such movements emerged from the Mission rather than exclusive Pacific Heights or Sea Cliff. You might have to tolerate the occasional drug dealer or prostitute, but there was no HOA regulating your every move. The Mission was all about slack and that’s what made it interesting and vibrant, if a bit rough around the edges.

unnamed-3 Google Bus 002 Screen Shot 2015-02-25 at 9.30.23 PM  Screen Shot 2014-11-03 at 10.52.50 AM Screen Shot 2014-11-05 at 11.57.26 PM

As the tech economy out in the distant suburbs heated up over the last twenty years more and more of the smart young IT professionals chose not to live in the dull suburban cul-de-sacs of Silicon Valley. They were looking for a grittier more dynamic environment and found it in the Mission. Tech workers endured a lengthy reverse commute in order to achieve a higher quality of life in their off hours at home in the city. In order to attract talent tech companies in the suburbs created the private so-called “Google Bus” system to shuttle workers from the Mission to corporate campuses an hour and a half outside the city. Tech workers had unlimited budgets compared to the existing Guatemalans, Vietnamese, and artists. Rents and property values rose considerably year after year. Today a one bedroom apartment in the Mission typically rents for $3,800 a month – if you can find a vacancy. If you want to buy that same place it will set you back well north of $850,000 and there is precious little on the market to satisfy the endless demand. If you want a single family home with a little patch of back yard you can buy the ruined shell of an old Victorian for a couple of million dollars and then spend at least as much to renovate it. Evictions and property conversions have skyrocketed. Bodegas and pho noodle shops are being replaced by boutiques and fine dining establishments. Hence all the fuss about gentrification driving out the working class. For the city’s coffers it’s a nice problem to have. The city is flush and is on a prolonged capital improvement spree that is transforming the local infrastructure and public spaces from parks, to school buildings, to libraries, to fire and police stations. Everything is getting a massive face lift and city workers have all been given substantial raises. But for the displaced residents it often means leaving the city altogether.

Screen Shot 2015-02-25 at 8.25.25 PM Screen Shot 2015-02-25 at 8.27.11 PM Screen Shot 2015-02-25 at 6.25.16 PM Screen Shot 2015-02-25 at 8.23.43 PM Screen Shot 2015-02-25 at 8.23.11 PM

Now let’s get back to Lancaster which is in the Antelope Valley of far eastern Los Angeles County in southern California. Lancaster was a small agricultural community until in was discovered by the aerospace industry in the 1950’s. The high desert location not too far from Los Angeles made it the perfect place to develop and test rockets, fighter jets, and ultimately the Space Shuttle and Stealth Bomber. Along the way it attracted people from the city who were looking for a more relaxed environment at a lower price point. The area sprouted endless white middle class subdivisions and accompanying shopping centers. For most residents work and culture remained “Down Below” in Los Angeles proper. That became increasingly true as the aerospace industry ramped down and was phased out. What remained of the local economy was based primarily in building and servicing more suburban development.

Palmdale, Lancaster 056 (800x600)unnamed-5 Lancaster, Palmdale B roll 038 (800x600) unnamed-8 unnamed-6 IMG_0005

The entire Antelope Valley, including Lancaster, was hit especially hard by the crash of 2008. Homes lost half their value overnight. Foreclosure and unemployment rates shot way up just as tax revenues plummeted and city services were cut. What was once a solidly middle class community became economically insecure and especially sensitive to further downward mobility – real or perceived. Both private developers and the City of Lancaster worked hard to deliver a better more up-to-date “product” incorporating the latest bells and whistles to jump start the resumption of growth after the crash. New homes boasted renewable energy packages and gray water recycling systems. The city began installing bicycle lanes. LEED certified office parks were promoted. And Lancaster’s economic development plan included inducements to battery and electric bus manufacturers for the growing market for clean energy and transportation. So far these measures have been too little too late. The solar and wind farms are great for generating clean power, but they don’t employ very many locals. New homes aren’t selling well and profit margins are down to a couple of thousand dollars per home which just isn’t enough to keep developers interested in building any more. The market for far flung exurban living has simply dried up. The bike paths that are all the rage in reviving city centers are effectively useless out in the distant sprawl. It isn’t the paths that are attracting prosperous new residents – it’s the urbanism the paths encounter along the way. Putting green lipstick on a sick pig hasn’t helped.

Lancaster, Palmdale 513 (800x600) Screen Shot 2014-11-29 at 1.24.25 AM Lancaster, Palmdale 526 (800x600) Lancaster, Palmdale 533 (800x600) Screen Shot 2014-11-29 at 2.30.56 AM 

While Lancaster has concentrated most of its efforts on inducing new construction it has ignored its older building stock. Each new home and commercial complex built out on the edge of town only cheapens the older existing suburban fabric. There’s no economic justification for buying, maintaining, or improving a fifty year old home or thirty year old strip mall when brand new homes and shops sit unsold and half vacant. Unfortunately for old timers in Lancaster all that cheap property has proven very appealing to many of the lower income residents from down below in Los Angeles who are rapidly being displaced. Like the Mission in San Francisco many previously impoverished neighborhoods in central Los Angeles are experiencing serious gentrification and all those poor folks who are getting squeezed out have to move and live somewhere else. The last several years have been a perfect storm delivering a massive wave of new arrivals to Lancaster who are not only poorer than the existing population, but overwhelmingly black and brown. This has set off alarm bells with the already stressed locals with vocal demands for government policies to prevent “Them” from moving in. (I’ll refrain from commenting on the whole race thing here. It is what it is.) In the end these are powerful market forces that the city has very little control over. For those people who are financially able their first choice is to sell and move. For those who are trapped in a home that is worth less than they owe the choice is to tough it out and hope for a market rebound or to walk away and take a big loss.

So there you have it. Gentrification in one community and economic decline in another. These are two sides of the same coin. In the end I suspect the freakish bubble in places like San Francisco will eventually cool while the decline in outer suburbs like Lancaster will level off and stabilize. In the meantime it’s all pretty bumpy for the folks caught in the middle.

John Sanphillippo lives in San Francisco and blogs about urbanism, adaptation, and resilience at granolashotgun.com. He's a member of the Congress for New Urbanism, films videos for faircompanies.com, and is a regular contributor to Strongtowns.org. He earns his living by buying, renovating, and renting undervalued properties in places that have good long term prospects. He is a graduate of Rutgers University.

As Nonwhites Grow Their Majority in Southern California, How Can they Find More Success?

$
0
0

California teachers, politicians and media types like to extoll the benefits of ethnic diversity. Certainly, the state’s racial makeup has changed markedly since 1970, with the white non-Hispanic population now a minority. Some, like state Assemblyman Luis Alejo, D-Salinas, and some education activists now insist that multicultural studies be mandated for the public school curriculum. This is in addition to materials that, as most California parents with kids can tell you, already go out of their way to foster appreciation of different cultures and strongly focus on such issues as slavery, racism and discrimination.

Yet, if we look at how minorities are faring in the state, and particularly in the Southland, we need a greater sense of reality about how this new demography is working out. Students in Salinas might soon learn more about ethnic history, but it’s not likely to help rescue their schools, which are rated poorly – even in comparison with the state’s overall mediocre standards.

As California continues to become less white – largely because of both foreign immigration and outmigration of native-born – we have to understand that diversity alone does not assure a prosperous society; that takes greater attention to issues like education and broad-based economic growth than to the politically correct approach of ethnic pandering or curricula manipulations.

Read the entire piece at The Orange County Register.

Joel Kotkin is executive editor of NewGeography.com and Roger Hobbs Distinguished Fellow in Urban Studies at Chapman University, and a member of the editorial board of the Orange County Register. He is also executive director of the Houston-based Center for Opportunity Urbanism. His newest book, The New Class Conflict is now available at Amazon and Telos Press. He is also author of The City: A Global History and The Next Hundred Million: America in 2050.  He lives in Los Angeles, CA.

Minneapolis-St. Paul: Capital of the New North?

$
0
0

There’s been a lot of discussion in Minneapolis-St. Paul about whether they should try to dissociate themselves from the Midwest by rebranding themselves as the Capital of the North.

This immediately raises three questions:

  1. Is “The North” really a distinct region?
  2. Are the Twin Cities the capital of it?
  3. Is branding the Twin Cities as “the Capital of the North” a good idea and likely to succeed?

What Is “The North”?

Is the North a distinct region from the Midwest? While popular maps of the nine (or eleven) nations of North American don’t include a cohesive North region, there are some reasons that suggest so. The areas of northern Wisconsin, the Upper Peninsula of Michigan, the Dakotas, etc. were more sparsely populated than the rest of the Midwest. They also had a different economic structure.

This map highlights the area whose economy was driven by heavy industry and manufacturing.  Most of the North was outside of this zone. The economy of that area was more dependent on natural resources (mining, such as copper in Michigan’s Upper Peninsula), farming, and grain processing.  Fracking for oil in North Dakota is a continuation of this resource based economic heritage.

The area is also demographically distinct. It was more heavily settled from northern Europe, notably Scandinavia, versus the Eastern European influence felt elsewhere. The Great Migration of blacks to the industrial north also had much less of an effect on this area, which was historically very white, and still is less diverse than the rest of the country.

Climatically, the North, as the name implies, is the coldest region of the continental United States.

So there are some attributes of this region that do set it apart from the rest of the Midwest.

Are the Twin Cities that Capital of the North?

Where the capital idea doesn’t hold up is in looking at contemporary migration.  The map below shades in blue any county that had people move to or from Minneapolis’ Hennepin County between 2001 and 2011, using IRS tax return data:

Outside of Minnesota itself, the only place in the North of which the Twin Cities are the capital from a migration perspective is part of Wisconsin.

Are there other areas where the Twin Cities look more like a capital? One of them would be sports fandom.  Here’s a map of football team spheres of influence based on the number of Facebook “likes.”

Here the Minnesota Vikings get no love in Wisconsin, which is owned by the Packers.  But the Vikings do have strong followings in much of Iowa and the Dakotas, which fits well to a concept of the North.

The area encompassed by the North is for the most part sparsely populated, with the Twin Cities being the only major urban area (more than a million people) for quite a distance.  The closest other city of that size is Milwaukee, about 300 miles away.  Minneapolis-St. Paul is about as far away from Chicago as Kansas City.  This by itself creates a sort of capital effect, as there is a pretty large swath of territory which logically looks to the Twin Cities for big city amenities and attributes. Pro sports would definitely fall into this category. So perhaps there is some level of “capital” attribute here.

Should the Twin Cities Brand Themselves As the Capital of the North?

If there is conceivably a North and the Twin Cities can potentially claim be or push to develop itself as the capital of this region, is that the best way to brand itself?

There are two basic approaches cities are pursuing today. One is the regional capital approach of a Barcelona. (It would perhaps like to see itself as a national capital).  The other is the global city approach of Chicago in which the city seeks to brand itself as a stand alone entity directly in the marketplace while actively divorcing itself from the region.

The global city model seems more popular at present. In Chicago’s case it’s easy to understand why; the Midwestern Rust Belt has struggled so why hitch yourself to that wagon?  This has had some good success and Chicago’s brand image is strong. The challenge for Chicago is that its wagon is economically hitched to the Midwest whether it wants it to be or not, at least to some extent. Chicago is the business services, tourism, etc. capital of the Midwest. The struggles of that region explain a chunk of that city’s now well-publicized travails.  Chicago’s fiscal weakness, inequality, etc. problems would likely be less if it were in the middle of a booming region.

So if the Twin Cities are functionally a capital, this regional relationship will assert itself organically, however it seeks to brand itself.

Where the branding idea falls flat is in two areas.  First, unlike Catalonia, the North isn’t an area with any sort of existing public resonance. Thus the Twin Cities would have to create a brand not just for itself – where they already feel they have weaker marketplace awareness – but also for the North itself, which is presently non-existent. This just makes things harder.

The second is the cultural disconnect between the Twin Cities and the rest of the North. Yes, one can look to Madison, Wisconsin (which probably more connected to Chicago in any case) as sympatico. But the rest of the North seems quite different. Don’t forget, there are a lot of Republican voters in Minnesota. The state had a very conservative Republican governor in Tim Pawlenty until recently.  Can the Twin Cities embrace them?  Natural resources has always played a key role in the North – 3M is Minnesota Mining and Manufacturing, don’t forget. Can the Twin Cities embrace the North Dakota fracking boom as its own?

Color me skeptical.  Given our politically polarized environment, the time does not seem ripe for a city to actively embrace its hinterland, and the politics and economic activity it contains. That’s not to say it shouldn’t.  America needs more bridge building than ever, not just politically, but between large urban and small urban and rural areas. But I don’t think it likely a region that prides itself on progressivism (e.g., environmentalism) and is already concerned about its standing in elite circles is ready to take that step.

Aaron M. Renn is a senior fellow at the Manhattan Institute and a Contributing Editor at City Journal. He writes at The Urbanophile.

"Minneapolis on Mississippi River" by Jdkoenig - Own work. Licensed under Public Domain via Wikimedia Commons.


Behind the Driving Increase

$
0
0

The Federal Highway Administration reported that driving increased 1.7 percent between 2013 and 2014 in the United States. This compares to virtually no increase over the period from 2004 to 2013. The 2014 increase will come as a disappointment to those who have perceived that the flat driving volumes of recent years signaled a shift in preferences away from driving. It had even been suggested that America had reached "peak car."

Despite the congruity of such sentiments with urban planning orthodoxy, it’s somewhat risky to divine future economic trends from the perspective of a weak economy. It is rather like predicting future employment trends from realities of the late 1930s, when the world had still not climbed out of the Great Depression

The problem for those who seek to replace the car is that the current form of cities, from Phoenix to Paris, requires cars to support the millions with middle-class standard of living. Of course, with a sufficient decline in the standard of living, cars could become less essential. After all, you don’t need a car to not go to work when you are unemployed.

Nor is “peak oil” coming to rescue; we now live in something more like an oil glut. Even when prices were soaring, the amount of driving barely changed. People may have shifted to more efficient cars, they didn't give up their cars, they just drove a little bit less.  

The latest driving data may indicate that even the somewhat tepid recovery is speeding up in the United States. This combined with falling gasoline prices is likely to be why driving is increasing again.

Employment Exceeds 2008 Level

Employment is probably the most important factor in the recent recovery of car use

According to data at the St. Louis Federal Reserve Bank "FRED" website, national employment peaked at 138.3 million in January 2008. By early 2010, employment had dropped to under 130 million. It took until April 2014 to restore the employment level that had been previously achieved more than six years earlier. This was the longest employment trough since before World War I, except for the period of 1929 to 1936, during the Great Depression.

As more people return to employment and incomes rise, driving can be expected to increase. During 2014, the nation's nonfarm employment rose to the highest level in history. As the year progressed and employment increased, so did driving (Figure 1).

But there is still a long way to go for the economy. The civilian labor force participation rate continues depressed. If early 2008 levels of labor participation were restored, there would be at least 10 million additional jobs.

Falling Gasoline Prices

US Department of Energy data indicates that the average price per gallon of gasoline rose by more than one half between 2005 and 2011. Until the middle for 2014, gasoline prices fluctuated around this level until early summer of 2014. Then the gas price reductions began. By the end of 2014, gasoline prices had dropped to near 2005 levels, which they actually reached in early 2015. Much of the 2014 increase in driving was concentrated since the decline in gasoline prices started in the last half of the year (Figure 2).

Driving and Transit

Ridership and road travel data also shows that there has been little relationship between the annual changes in driving and transit use over the period of the gas price increases and the subsequent decrease. Advocates of greater transit funding have claimed for decades that transit can be effective in attracting drivers from their cars. This was transit's time.

However, the highly publicized transit ridership increases have been small in context and have shown virtually no relationship to the changes in automobile use in urban areas. This is illustrated in Figure 3. Driving volumes have risen and fallen, with little response in transit ridership. If there were a significant relationship between transit ridership and travel by car, the two lines on the chart would nearly follow one another. However, the lines show virtually no relationship. In relation to the actual changes in travel by car and light vehicle, the changes in transit are imperceivable. Transit ridership remains relatively small, at approximately two percent of all trips and five percent of work trips. An American Public Transportation Association (APTA) press release confirms the weak nexus between driving trends and transit for the most recent period. APTA notes that transit ridership late in the year increased despite the significant reduction in gasoline prices.

Transit does not provide rapid mobility for most urban trips, which is why it has so little potential to attract people from cars. As higher prices force people to cut back on driving, they simply travel less, rather than getting on transit that cannot take them where they need to go in a reasonable time. That would be different if transit provided mobility competitive throughout the metropolitan area. Indeed, transit's percentage of urban travel would be far above its current two percent. But to build out a system that reaches most jobs, of course, that would be financially prohibitive.

Transit's strength is downtown (the central business district, or CBD). The largest CBDs have employment densities are 100 times the urban average, and are well served by rapid, radial transit routes. In four of the nation's largest CBDs --- New York, Chicago, Boston and San Francisco --- transit carries more than half of workers to their job, 77 percent in Manhattan alone. Americans use transit where it is competitive or superior to travel by car, which should dispel any notion that there is a national aversion to transit.

But the city is much more than downtown. According to research by Lee and Gordon only eight percent of employment in the 48 largest metropolitan areas was in CBDs. This is despite the presence of impressive office towers that convey a sense of CBD dominance.

Lee and Gordon also show that about 13 percent of jobs are in employment centers centers outside the CBDs, which are often called "edge cities." Because these centers do not have the radial networks of direct transit, even their high densities produce little in transit ridership.  My analysis of more than 80 post-World War II form suburban employment centers (mainly edge cities) indicated a transit work trip percentage of only 4.9 percent, which is approximately the national average for all areas. Transit's share to the remaining nearly 80 percent of jobs dispersed throughout the metropolitan areas is just 4.6 percent.

The basic problem is access. Outside of downtowns, few jobs can be conveniently reached by transit. This means transit takes about twice as long as driving alone and often is either not within walking distance of home or does not drop the passenger off within walking distance of work. This is illustrated by research at the University of Minnesota Accessibility Laboratory, which has shown that in 45 large metropolitan areas, only 10 percent of jobs can be reached by the average employee in 60 minutes by transit. By comparison, American Community Survey data indicates that nearly 65 percent of employees who drive alone in the same metropolitan areas actually reach work --- and in half the time (30 minutes).

Even low income workers, whose constrained budgets should make transit more attractive largely use cars to get to work.

Driving and a Middle-Income Lifestyles

I have referred before to the research that equates better economic performance with better mobility for people throughout the labor market (metropolitan area).

Driving is not based on the shallow, arbitrary preference expressed in the threadbare cliché of a "love affair with the automobile." Cars are essential to realizing the aspirations of a majority of people, not only in the United States but in Europe and beyond.

Wendell Cox is an international public policy consultant. He was appointed to three terms on the Los Angeles County Transportation Commission and chaired two American Public Transit Association (APTA) national committees (Policy & Planning and Governing Boards). Full biography is here.

The Evolving Geography of Asian America: Suburbs Are New High-Tech Chinatowns

$
0
0

In the coming decades, no ethnic group may have more of an economic impact on the local level in the U.S. than Asian-Americans. Asia is now the largest source of legal immigrants to the U.S., constituting 40% of new arrivals in 2013. They are the country’s highest-income, best-educated and fastest-growing racial group — their share of the U.S. population has increased from 4.2% in 2000 to 5.6% in 2010, and is expected to reach 8.6% by 2050.

Some Asian immigrant groups tend to struggle, notably Hmong, Laotians and Bangladeshis,,but on average, Indians, Chinese and Koreans do at least as well as Anglos, and in some cases better. In the 52 major metropolitan areas, Asians’ median household income is $70,600, compared to $66,100 for White non-Hispanics.

Widening the focus to smaller cities, for the most part, the most heavily Asian communities in America tend to be prosperous, and many are tech oriented. They also tend to be overwhelmingly suburban, often in places that have good public schools.

Shift To The Suburbs

In the past Asians, like other immigrants, tended to cluster in “gateway cities” and often in the densest urban neighborhoods, like New York’s Chinatown. Now the center of gravity has shifted to the suburbs. Between 2000 and 2012, the Asian population in suburban areas of the nation’s 52 biggest metro areas grew 66.2% while those in the core cities expanded by 34.9%. In 2000 three large cities ranked among the 20 most heavily Asian cities with populations over 50,000: Honolulu, San Francisco and San Jose. In 2012, only the Hawaiian capital made the grade (Hawaii is the only state with an Asian majority).

As of 2012, 18 of the 20 most heavily Asian communities were suburban, all but one of them are in California. Not surprisingly quite a few are the smaller cities of Silicon Valley, where Asians constitute roughly half of all tech employees. Cupertino, a city of 59,700 that is home to Apple’s headquarters, takes the title of the most Asian city in the U.S., with a population that was 65% Asian as of 2012, up from 45.9% in 2000. Other suburban cities around the Bay that are majority Asian include No. 2 Milpitas (64.5% Asian), Daley City, Sunnyvale, Fremont , Santa Clara and Union City. Of them, only Daley City and Milpitas were majority Asian in 2000.

Most of the other top California cities are clustered in the San Gabriel Valley east of Los Angeles, including No. 3 Rosemead (62% Asian), No. 4 Monterey Park (61.1%), Arcadia, Alhambra and Diamond Bar. Many, like once solidly middle class Arcadia, are being “mansionized” by new immigrants into what some suggest is an Asian version of Beverly Hills. The other hot spot is Orange County, long seen as more a place for right-wing politics and surfers, which now has several cities in the top 20 of our list of the cities of the most Asian-dominated cities, including Westminster, Irvine and Garden Grove.

Shifts Beyond California

California has long been is the natural place for Asian immigrants to land, with 4.8 million currently residing in the state, almost the population of Singapore. New York, with 1.4 million Asians, ranks  second while Texas, with 964,000, ranks third. But Asian populations are increasing quickly in the Sun Belt. Texas’ Asian population increased by 71.5% from 2000 through 2010, adding a net 402,277, second most in the country over that span behind California’s  1.1 million gain. Texas is home to the only city outside California and Hawaii in the top 20 of our list of the most heavily Asian U.S. cities: the Houston suburb of Sugar Land, where 37.1% of the 82,000 residents are Asian. The area, not known as an immigrant hub in the past, now boasts the second largest Hindu temple in the country. In Plano, a suburb of Dallas, the Asian population rose 123% between 2000 and 2012 to 50,160, the highest growth rate in the nation among cities over 50,000 in population. It’s now 18.5% Asian.

A number of states in the Southeast posted fast growth from 2000-10. Florida’s Asian population increased 70.8% to 266,256, while Georgia’s rose 81.6% to 314,467.

Positioning For The Asian Century

One clear trend here is that Asian populations are growing in areas that are on the cutting edge of the economy — in tech centers like Silicon Valley, and near New York’s global service firms (across the river from Manhattan, Jersey City is now 25% Asian, and New Jersey’s Asian population expanded 51% in the first decade of the century to 480,270). Around the manufacturing and technology companies of the Detroit and Seattle areas, Asian communities are growing. Troy, Mich., the center of “automation alley,” has attracted a small but expanding Asian population, and in Washington, the Boeing-dominated town of Renton and Bellevue, near Microsoft, have taken on more of an Asian flavor in the past decade.The fact that many Asians are well-educated and ideally suited to these critical industries is likely to enhance this correlation over time, whether engineering cars or tech gear, or getting into the guts of the global transactional economy.

Asian growth is slower in areas less integrated into the emerging global economy, notably in places like small town Florida, the rural south and parts of the still hard-hit Rust Belt. These are generally not the hot-spots for Asian investment today. What these communities may want to consider in the future is how to enhancetheir attractiveness to Asians and Asian investors, who likely will play an ever-expanding role in shaping the country’s economic future.

No. 1: Cupertino, Calif.

Overall Population, 2012: 59,701

Percentage Asian: 65.1%

Percentage Change In Asian Population Since 2000: +71.9%

No. 2: Milpitas, Calif.

Overall Population, 2012: 44,226

Percentage Asian: 64.5%

Percentage Change In Asian Population Since 2000: +34.9%

No. 3: Rosemead, Calif.

Overall Population, 2012: 33,686

Percentage Asian: 62.0%

Percentage Change In Asian Population Since 2000: +29.9%

No. 4: Monterey Park, Calif.

Overall Population, 2012: 37,192 

Percentage Asian: 61.1%

Percentage Change In Asian Population Since 2000: +1.4%

No. 5: Arcadia, Calif.

Overall Population, 2012: 34,158 

Percentage Asian: 59.8%

Percentage Change In Asian Population Since 2000: +42.3%

No. 6: Daly City, Calif.

Overall Population, 2012: 60,137

Percentage Asian: 58.0%

Percentage Change In Asian Population Since 2000: +15%

No. 7: Honolulu, Hawaii

Overall Population, 2012: 186,940

Percentage Asian: 54.2%

Percentage Change In Asian Population Since 2000: +10.1%

No. 8: Diamond Bar, Calif.

Overall Population, 2012: 29,883

Percentage Asian: 53.2%

Percentage Change In Asian Population Since 2000: +25.3%

No. 9: Fremont, Calif.

Overall Population, 2012: 115,948

Percentage Asian: 52.4%

Percentage Change In Asian Population Since 2000: +55.1%

No. 10: Union City, Calif.

Overall Population, 2012: 36,374

Percentage Asian: 50.8%

Percentage Change In Asian Population Since 2000: +23.5%

This piece first appeared at Forbes.

Joel Kotkin is executive editor of NewGeography.com and Roger Hobbs Distinguished Fellow in Urban Studies at Chapman University, and a member of the editorial board of the Orange County Register. He is also executive director of the Houston-based Center for Opportunity Urbanism. His newest book, The New Class Conflict is now available at Amazon and Telos Press. He is also author of The City: A Global History and The Next Hundred Million: America in 2050.  He lives in Los Angeles, CA.

Wendell Cox is principal of Demographia, an international public policy and demographics firm. He is co-author of the "Demographia International Housing Affordability Survey" and author of "Demographia World Urban Areas" and "War on the Dream: How Anti-Sprawl Policy Threatens the Quality of Life." He was appointed to three terms on the Los Angeles County Transportation Commission, where he served with the leading city and county leadership as the only non-elected member. He was appointed to the Amtrak Reform Council to fill the unexpired term of Governor Christine Todd Whitman and has served as a visiting professor at the Conservatoire National des Arts et Metiers, a national university in Paris.

Photo "asian american" by flicker user centinel.

Inside the Bubble

$
0
0

I was recently asked by a neighbor to write a blog post about greed in the super heated economic bubble here in San Francisco. I told her I think the problems that vex her are more complicated than pure greed, but I’d give it a shot. Keep in mind, where a person stands on any of these issues depends a great deal on their particular circumstances. The point of this post isn’t to argue in favor of one thing or another, but to illustrate how some people experience the city at this moment in time.

So… my friend has lived in the same spacious rent controlled flat in an old Victorian for many years. Her tenure predates the current tech culture by decades. Chatting over lunch in her kitchen and dining room is like visiting a bygone version of San Francisco where everything is more relaxed and comfortable and perhaps a bit less glossy. Over the last several years she’s seen half the buildings on her block transformed by the tsunami of money that has washed over the neighborhood. The elderly Chinese couple who own her building will eventually pass and when they do she knows their adult children will sell the place and she’ll be forced out. For her it’s not just a matter of leaving the building or even the neighborhood, but leaving the city altogether. There’s simply no possible financial scenario that will allow her to stay in the Bay Area on her income as a freelance graphic designer. That world is gone and she doesn’t have a Plan B.

 unnamed-4

Her preoccupation with the new money culture in the city has been especially stirred up by the activities of the building directly next door. Back in 2010 the owner of the building had a structural engineer certify that the building was unstable and therefore uninhabitable. This could be seen as a landlord who was deeply concerned for the health and safety of his tenants, or a legal tactic to remove them. A series of challenges ensued, but at the end of the day the building was emptied, fully gutted, and renovated. The apartments were then sold off as condos. The average sale price in 2014 was just shy of a million dollars for each of the one bedroom apartments. Some of the people who purchased the units were investors who then rented them at the current market rate of $4,950 a month.

Screen Shot 2015-02-27 at 12.57.29 AM Screen Shot 2015-02-27 at 12.57.00 AM Screen Shot 2015-02-27 at 12.55.48 AM

One of those renovated condos was bought by a young Russian DJ. I’ve met him and he’s actually a perfectly nice guy. I’m listening to his audio stream right now – house trance techno electronica… Evidently he’s a big deal in international music circles. (I’m more of a Billy Holiday Ella Fitzgerald kind of guy, but I digress.) Shortly after he moved in he decided to take six months off and travel to Thailand. While he was gone he left the apartment in the hands of a popular home hosting service that arranges short term rentals to tourists and business travelers. In theory the service was completely turnkey with booking, cleaning and so on. But in reality the apartment needed a bit more care over such a long period of time than the company was able to provide. The Russian asked my friend next door if she could help out. “Could you” this and “Would you mind” that. Individually none of these favors was particularly onerous, but collectively it became a lot of work as the months dragged on. The Russian was having such a good time in Thailand he decided to extend his stay. At a certain point my friend let it be known that her services had gone beyond merely being a helpful neighbor and it was time she was paid for her work. An e-mail exchange ensued with a list of time that had been spent on various projects. The Russian felt that he had been misled. “That seems like a lot of money.” This was coming from someone who just spent nearly a million dollars on an apartment and can afford to spend half a year on vacation in Asia. You can see how this might rub my friend the wrong way. Hence her frustration with the freakish economic situation in the city.

On the other hand, there are a fair number of people who are living in tiny run down apartments with multiple room mates paying outrageously high rents who feel that a massive rent controlled apartment is a seriously sweet deal. Sure, it will come to an end someday, but dude! Really? You’re bitching that it doesn’t come with a lifetime guarantee? Suck it up cupcake.  Like I said. Where you stand on these issues depends a lot on your particular situation.

6 EasterDinner(12)2007 IMG_0120 (640x480) 

For those of you who aren’t intimately familiar with the local dynamics I’ll give you some context. On most nights friends and family gather around our kitchen table for dinner and we discuss the events of the day. Over the last few years we’ve hardly had a month go by where someone hasn’t had to pack up and leave the city because of eviction, unreasonably high rents, or a lack of available housing at any price. Other folks who already owned property decided to cash out and took their substantial profits to more affordable towns.

Screen Shot 2015-02-28 at 5.21.13 AM

Last week we had a couple over who had rented a charming house with a back garden in Bernal Heights for nearly twenty years with the enormous benefit of rent control that kept their expenses well below the market rate all that time. The landlord sold the home a few months ago and the new owners evicted them in order to live in the house themselves.

Screen Shot 2015-02-28 at 5.23.47 AM

They reluctantly moved to an apartment in Oakland. They don’t hate the apartment or Oakland per se, but it’s definitely a transitional space for them. They’re looking to move as soon as they decide what exactly they want and can afford. There was a lot of talk about how San Francisco has become inhospitable to people with normal budgets. At a certain point I asked them why they hadn’t prepared for the eventuality of the big move. They knew what the real estate market was like. Their eviction couldn’t have come as a surprise. They’re both professionals with solid incomes. They could have pulled together a downpayment and bought property at any point during the last twenty years when prices were more reasonable. Instead they enjoyed the benefits of a great rent controlled place. It was a perfectly reasonable economic decision and it served them very well for two decades. But there were trade offs. Now it’s time to come up with a new plan. Let’s just say they didn’t appreciate my interpretation of their situation.

Screen Shot 2015-02-28 at 5.40.17 AM

A couple of months ago we noticed one of the longterm tenants of a nearby building packing up and loading his furniture into a moving van. We were shocked. He had lived in that apartment with rent control for forever. We all thought he’d eventually leave feet first. It turns out that the landlord paid him $30,000 to go voluntarily and he agreed to take the money. Once the landlord gets new tenants he’ll likely receive $3,800 or more per month for that unit so his $30,000 “investment” in freeing up the apartment will be repaid in eight months. $30,000 won’t buy you anything at all in San Francisco, but it’s pretty good seed money in many parts of the country. If this guy is smart he’ll use the cash to put a downpayment on a house in a less expensive town.

Now, here’s something else to consider. San Francisco is in an enormous economic bubble. It won’t last. These things never do. And when the bubble pops there are going to be a whole lot of folks who paid top dollar for real estate that’s going to be worth infinitely less. Any number of things could puncture the balloon: another Wall Street crash, an earthquake, a shift in foreign investors, or the inevitable maturation of the tech sector and its associated stock options and super sized bonuses… When that day arrives everyone’s situation may change and the general perception of who’s a winner and who’s a loser may flip as well. And we’ll all have to suck it up. That’s life.

John Sanphillippo lives in San Francisco and blogs about urbanism, adaptation, and resilience at granolashotgun.com. He's a member of the Congress for New Urbanism, films videos for faircompanies.com, and is a regular contributor to Strongtowns.org. He earns his living by buying, renovating, and renting undervalued properties in places that have good long term prospects. He is a graduate of Rutgers University.

Demography & Destiny: America's Youngest Community

$
0
0

The village of Kiryas Joel is a perfect illustration of how demographic differences can play out spatially. An enclave of ultra-orthodox Satmar Hasidic Jews tucked in the woods of Orange County, about 60 miles north of New York City, Kiryas Joel is an uncharacteristically high-density settlement filled with individuals whose high birth rate and dependence on federal aid often incurs the anger of the upper-middle class suburbs that surround it.

Between a few hills in a picturesque but otherwise none-too-remarkable part of a mostly automobile-oriented suburban county of New York City, the settlement of Kiryas Joel has the distinction of being one of the fastest-growing communities in the entire country. In 1980, the Census recorded its population at around 2,080 people; by 2010, it had over 20,000. While such rates might not cause public officials in Nevada, Arizona or Idaho to bat an eyelash, in a slow-growth state like New York, this is unusual—all the more so because, prior to 1975, Kiryas Joel didn’t exist.

The original founders were a group of Jews belonging to the Satmar Hasidic dynasty. Most lived in Brooklyn, and, like so many who fled to the suburbs at that time, the first arrivals in “KJ” were escaping what they perceived as the ills and crowds of the big city.

The community has an Orthodox and Haredi population that surpasses virtually everywhere in the world outside of Israel. Its ethos is distinctive for its vocal opposition to Zionism: no Satmar Hasidim would ever culturally identify with Israel; the Hebrew lettering in its signs use Yiddish orthography. While the population in Williamsburg burgeoned, it was only a matter of time before the surrounding, secular neighborhoods of Brooklyn encroached on the enclave. After scouting several sites in New Jersey and Staten Island (rejected fiercely by locals), they discovered an area 60 miles north of their prior home, which at the time was still lightly populated, dirt-cheap and primarily exurban in character.

Kiryas Joel grows largely through natural increase. It has among the highest birth rates of any municipality not just in the US, but in the developed world. In 2010, an astonishing 730 of 1000 women between ages 20 and 34 gave birth, a high figure even for many developing countries. Hasidic women marry young, usually shortly after completing the equivalent of high school. They do not practice birth control, so they then almost immediately begin to have children every year or two, resulting in a community with the nation’s lowest median age: thirteen years. It's an extreme outlier, since no other place in the country has a median age under 20.

The community can claim a number of distinctions, but among those for which it is the most notorious is that it is the poorest municipality with a population of over 10,000 in the entire country, with many estimates placing approximately 70 percent of the population at incomes that would qualify them as below the federal poverty line. About half of the residents receive food stamps, while one-third receive Medicaid benefits. This poverty correlates directly to the fact that virtually none of the women work full-time jobs, and a significant number of the men devote most of their lives to studying the Torah and Talmud; not even 40 percent of them have the equivalent of a high school degree, and the low levels of English proficiency make them further unemployable.

Visually, its most prominent feature is its housing. It may not be architecturally distinctive, but the density is atypical for outer suburbs, even considering that these are outer suburbs to the nation’s largest and most densely populated city. Since the median household size is nearly six people, homes are both thickly clustered together and crowded within.


And they’re expanding, often using construction standards that appear dubious.


Virtually none of the housing is single-family. Approximately 95 percent is attached, a higher rate than much of New York City, meaning yards are virtually unheard of, which explains why the streets become a play area so much of the time. And more multifamily goliaths are popping up along the forested fringe.

In its earliest years, Kiryas Joel was almost exclusively residential. Those (mostly male) KJ residents who worked would often take buses for the lengthy trip back to the City. A Park-and-Ride service is still available on the village’s outskirts. But in more recent years, the community has become increasingly self-contained, with retail tucked in the street level of these large residential complexes, as well as basic services to meet other needs.

With more than one synagogue, multiple commercial buildings, emergency response, and dedicated recreational space, it broadly occupies the goods-and-services domain one might expect of a smaller city of 20,000 inhabitants.

Bearing in mind that Kiryas Joel is surrounded on all sides by mid-century homes on large, wooded lots, accessed only by undulating rural collector roads, it is really the most urban community around. It’s safe to say that KJ comprises the highest concentration of pedestrian activity in the entire area, at least on the Sabbath day, when its residents do not ride, and probably every other day of the week as well.

The community bears more than a passing resemblance to other religiously inspired outliers in the United States, also characterized by fundamentalist interpretations of their sacred texts, atypically high birth rates, and an overt repudiation of certain contemporary mores. Certain Anabaptists (particularly the Amish) and the Fundamentalist Church of Jesus Christ of Latter-Day Saints come to mind. Perhaps the principles that shape the way of life of Satmar Hasidim are not as distinct as they may initially seem. Kiryas Joel isn’t the only exurban settlement of Hasidic or Haredi Jewry in metro New York. While Kiryas Joel is the largest, most of the others share its growth rate and are likely only to escalate in public visibility in the years ahead.

Kiryas Joel embodies a collision of values written many times over. Apparently, the surrounding population in the Town of Monroe has vigorously protested its further growth because it represents suburban sprawl. The irony of such an accusation is obvious. Not only was the development pattern of the 1960s and 1970s a glorification of a decentralized, anti-urban ethos that many deride as sprawl, most recent development in Orange County comes far closer to the "sprawling" densities of Monroe than does Kiryas Joel.

Even if Kiryas Joel is not unique, it’s still such an anomaly that it is impossible to ignore. It’s a greenfield development more tightly packed than the densest neighborhoods in many American cities. It required no market analyses to determine if a sufficient demand existed to support such high density; the demand was obvious to the rabbinical leadership. The Town of Monroe did not overtly incentivize the development of this concentrated settlement through density bonuses in order to bolster its tax base (quite the opposite). While KJ looks nothing like the Traditional Neighborhood Development (TND) planned communities that have popped up across exurbs throughout the country, it shares at least a few of their objectives: mixed uses and high densities promote the sort of walkability that an increasing number of suburbanites find appealing. And for the Satmar Hasidim, walkability is essential.

The community remains antithetical to what most of its neighbors would define as the “American Dream” as it applies to housing—a catchphrase that by now is hackneyed, not just from overuse, but from the narrow cultural implications it evokes. Yet Kiryas Joel continues to boom in population The American Dream is diversifying exponentially, fueled by disparate, self-actualizing initiatives, and manifesting in ways that depend largely upon their location. Kiryas Joel is just one example of many that are only “bad” or “good” when compared to their counterparts, whose own goodness or badness depends just as much on subjective judgment. The escalating elasticity of the American Dream must therefore concede to another catchphrase: live and let live.

Eric McAfee is an itinerant urban planner/emergency manager who fuses his cross county (and trans-national) travels and love of contemporary landscapes into his blog, American Dirt (http://dirtamericana.com/). A longer and slightly different version of this post originally appeared in American Dirt: Part I and Part II.

Photos by the author.

Singapore After Lee Kuan Yew: Future Is Uncertain For The Utilitarian Paradise He Created

$
0
0

In this age of political Lilliputians, we must acknowledge the passing of giants. Although he ran only a small city-state, Lee Kuan Yew, along with late Chinese Premier Deng Xiaoping, ranks among Asia’s most pivotal figures of the past 50 years.

These two men — a tall, aristocratic scion of a Hakka trading family and the diminutive Chinese revolutionary — came from very different perspectives, but shared a pragmatic streak, and ultimately strategies that came to be widely copied. You can see their legacy today across the continent, in rapid urbanization and growing economic power.

But it was Lee who first formulated the essentials of the new Asian economic approach, blending capitalistic modernity with a state-directed economy and authoritarianism. Although repression of dissidents in both countries rightfully offends Westerners, particularly journalists, it has not deterred foreign capital, technology and capital from seeking to cash in on Asia’s growth.

American and British capital may have fueled global capitalism’s 20th century triumph, but Lee and Deng shaped its expansion in the 21st.

Lee’s Achievement

This is not merely a testament to Lee’s tenure as prime minister from 1959 to 1990, the longest of any in world history, but the singularity and durability of his accomplishment. From Singapore’s independence to the present day, Lee helped fashion what is arguably the most successful and best run city in the world.

In 1965, after Singapore’s acrimonious exit from Malaysia, its outlook was far from promising. Unemployment was high and the fledgling city-state was wracked by internal dissension between its ethnic mix of Chinese, Indians and Malays, and between conservatives and communists, who seemed in political ascendancy as elsewhere in Southeast Asia. The then rough-edged Asian metropolis, an important trading center, boasted a per capita GDP of$2,667 in 1990 dollars, more than double the average for East Asian countries and trailing only Japan in the region, but well behind European countries and North America.

Faced with imminent disaster, Lee’s response was to create a new political system that blended a mildly socialist program with a development strategy aimed at attracting foreign capital and building up the manufacturing sector. Lee and his People’s Action Party (PAP) focused on developing a modern infrastructure — from the port and roads to education — that is second to none.

Perhaps PAP’s most remarkable achievement was the creation of the Housing Development Board, which turned the vast majority of Singaporeans from slum-dwellers to owners of apartments that were small but clean and modern. As Asian real estate markets have heated up, HDB has helped keep Singaporean housing costs far more reasonable than in China’s primary cities, or Hong Kong or Tokyo.

Lee believed widespread homeownership would make Singapore more stable, but it was not enough to make it rich. Under his guidance, everything — from cleaning the streets to developing arguably the best primary education system in the world — was calculated to attract foreign companies and skilled individuals; this at a time when China, India and much of Southeast Asia was either closed to investment, embroiled in lethal civic conflict or primarily dominated by crony capitalists.

And the world did come, making Singapore among the favored destinations for international corporations. In 1968 Texas Instruments TXN +1.26% established a chip-making plant there, the break Lee later credited with helping transform the city into a technology hotspot.

A 2011 Roland Berger study named Singapore as the leading location for European companies to establish headquarters in the Asia-Pacific region.Companies with regional headquarters include Microsoft MSFT +1.12%Google GOOGL +0.16%Exxon Mobil XOM +0.15%, and Kellogg’s. Singapore now has more than twice as many regional headquarters as far-larger Tokyo, not to mention Asia’s less affluent megacities.

Lee’s Chinese Legacy

Cambridge-educated, and with the demeanor of a British aristocrat, Lee promoted English as the country’s primary language, a decision that made the city particularly attractive to foreign investors and workers. But in many ways he remained very Chinese. Lee’s People’s Action Party blended British parliamentary forms with a highly authoritarian, centrally directed system. Author Alex Josey compared Lee’s role in the PAP to Mao Zedong’s suzerainty over the Chinese Communist Party.

When Deng visited the city-state in 1978, he saw it as an appealing model for his poor country: a top-down, mandarin-led system that could appeal to global capitalists. Deng, Lee would later recall, was most captivated by Singapore’s modern prosperity: “What he saw in Singapore in 1978,” he recalled in his book Third World to First, “had become the point of reference as the minimum the Chinese people should achieve.”

Anyone visiting China today can see the results of Deng’s insight: gleaming cities, massive expansion of educational institutions, modern roads and transit systems, and most of a general prosperity that has lifted the mother country of most Singaporeans to almost unimagined heights.

The story is not so positive for those who believe in liberal democracy. Although Singapore is generally less repressive than China, it did show the Chinese communists that being “free” was not necessary for becoming rich. It’s a lesson that many developing countries around the world — in the Middle East, Africa and Latin America — have taken to heart.

Singapore After Lee

Lee bequeathed to Singapore prosperity and order, but the durability of his legacy is in question. To some extent, this reflects the technocratic cast of the Republic; Lee may have been a “founding father” of his country, but he did not leave behind a system of beliefs that can tie people together in the manner of George Washington & co. in the United States. Lee is revered simply for being effective.

Indeed despite massive government efforts to promote a sense of identity, a recent survey found half of all Singaporeans indifferent to their citizenship as long as their wealth could be maintained. Stabilizing forces like religion and family, have also been weakened by the rush to embrace what former foreign minister S. Rajaratnam labeled “moneytheism.” The emptiness of this religion can be seen in the fact that residents of this highly successful city-state are now among the most pessimistic of peoples, alongside understandably dour residents of Greece, Spain, Cyprus, Slovenia and Haiti.

So even as the Republic prospers, there is growing disaffection, with the PAP’s support dwindling to the lowest level since independence. Fed up with government controls and the increasingly high cost of living, many Singaporeans are considering a move elsewhere. Already some 300,000 now live abroad, almost one in 10. As many as half of Singaporeans, according to a recent survey, would leave if they could

The utilitarian paradise created by Lee will also have to face competition from Chinese cities like Shanghai and Beijing, notes Ravi Menon, the former head of the Ministry of Trade and Industry. Companies that might once have located operations in Singapore now feel pressure to locate in Asia’s dominant economy. Once Asia had few places where advanced technology and services could be developed; now it has many. China alone has 13 cities larger than Singapore, many of them with breathtakingly modern infrastructure and far less expensive workforces.

There is also widespread dissent about PAP’s policy prescription. One particularlyunpopular proposal has been to boost the city-state’s population from 5 million to roughly 7 million by 2030, largely through immigration. To help accommodate this growth, planners have suggested building a vast underground city with shopping malls, public spaces, pedestrian links and cycling lanes. Even normally docile and sociable Singaporeans may recoil from spending their lives like Morlocks in H.G. Wells’ Time Machine.

The city also has become more dependent on imported labor, not surprising in a county that has one of the world’s lowest birth rates. Many Singaporeans feel the foreign influx is turning them into strangers in their own city. In 1980, over 90% of residents were citizens. Today the percentage is 63% and, by 2030, if the government’s plans hold up, foreigners will outnumber the natives.

Yet despite these problems, Lee Kwan Yew’s accomplishments are undeniable. He took a struggling, ununified city and left it an urban jewel. That history has moved on is inevitable, but one has to wonder, among all the current chiefs of state, whether any will leave behind anything approaching Yew’s legacy when they pass from this world.

Percentage Change In Asian Population Since 2000: +23.5%

This piece first appeared at Forbes.

Joel Kotkin is executive editor of NewGeography.com and Roger Hobbs Distinguished Fellow in Urban Studies at Chapman University, and a member of the editorial board of the Orange County Register. He is also executive director of the Houston-based Center for Opportunity Urbanism. His newest book, The New Class Conflict is now available at Amazon and Telos Press. He is also author of The City: A Global History and The Next Hundred Million: America in 2050.  He lives in Los Angeles, CA.

Singapore skyline photo by Bigstockphoto.com.

How the California Dream Became a Nightmare

$
0
0

Important attention has been drawn to the shameful condition of middle income housing affordability in California. The state that had earlier earned its own "California Dream" label now limits the dream of homeownership principally people either fortunate enough to have purchased their homes years ago and to the more affluent. Many middle income residents may have to face the choice of renting permanently or moving away.

However, finally, an important organ of the state has now called attention to the housing affordability problem. The Legislative Analyst's Office (LAO) has published "California's High Housing Costs: Causes and Consequences," which provides a compelling overview of how California's housing costs have risen to be by far the most unaffordable in the nation. It also sets out the serious consequences.

The LAO says that:

Today, an average California home costs $440,000, about two-and-a-half times the average national home price ($180,000). Also, California’s average monthly rent is about $1,240, 50 percent higher than the rest of the country ($840 per month).

LAO describes the evolution:

Beginning in about 1970, however, the gap between California’s home prices and those in the rest country started to widen. Between 1970 and 1980, California home prices went from 30 percent above U.S. levels to more than 80 percent higher. This trend has continued.

Much of the LAO focus is on California's coastal counties, where:

....community resistance to housing, environmental policies, lack of fiscal incentives for local governments to approve housing, and limited land constrains new housing construction.

These causes result from conscious political decisions. While California's coastal counties do not have the vast stretches of flat, appropriately developable land that existed 50 years ago, building is increasingly  prohibited on that which remains (for example, Ventura County, northern Los Angeles county and the southern San Jose metropolitan area).

Demonstrating an understanding of economic basics not generally shared by California policymakers or the urban planning community, LAO squarely places the blame on the public policy limits to new housing construction:

This competition bids up home prices and rents.

In other words, where the supply of a demanded good is limited, prices can be expected to rise, other things being equal. LAO describes the impact of so-called "growth control" policies, which are also called "urban containment" or "smart growth:"

Many Coastal Communities Have Growth Controls. Over two-thirds of cities and counties in California’s coastal metros have adopted policies (known as growth controls) explicitly aimed at limiting housing growth. Many policies directly limit growth—for example, by capping the number of new homes that may be built in a given year or limiting building heights and densities. Other policies indirectly limit growth—for example, by requiring a supermajority of local boards to approve housing projects. Research has found that these policies have been effective at limiting growth and consequently increasing housing costs.

According to LAO, the problem is exacerbated by voter initiatives: "More often than not, voters in California’s coastal communities vote to limit housing development when given the option." It is hard to imagine a more sinister disincentive to aspiration, under which voters can deny equality of opportunity in housing to others by artificially driving up the price.  Because new housing further from coast is also limited, options for a middle income living standard are also diminished.

These public policies have consequences.

Notable and widespread trade-offs include (1) spending a greater share of their income on housing, (2) postponing or foregoing homeownership, (3) living in more crowded housing, (4) commuting further to work each day, and (5) in some cases, choosing to work and live elsewhere

Each of these consequences is described below.

LAO Consequence #1: Spending a Greater Share of Income on Housing

LAO models the market situation from 1980 to 2010 to estimate the prices that would have prevailed if the regulatory environment had permitted building sufficient to satisfy customer demand at previous lower price levels. In both years, LAO estimates that the median priced house would have cost 80% more than in the rest of the nation (actual data in 1980, modeled data in 2010). This would have kept California house price increases at the national level. I think it would have been better to have modeled from 1970, before the huge house prices before 1980 described by Dartmouth economist William Fischel.

I have applied this LAO model estimate to the median multiple for California's six major metropolitan areas (Los Angeles, San Francisco-Oakland, Riverside-San Bernardino, San Diego, Sacramento, and San Jose) to identify how much better middle income housing affordability would be without California's excessive regulation. Using the LAO estimates the median multiple (median house price divided by median household income) in 2014 would have been at least 40% lower than the actual level in each of the metropolitan areas (Figure 1).

Many California households already have been priced out of the market. In the worst case, it is estimated that in the San Francisco metropolitan area, a median income White Non-Hispanic household will have nearly $60,000 annually left over after paying the mortgage on the median priced house. This is less than they would have if house prices had remained reasonable, but it's enough to live on. The median income Asian household would do almost as well, with about $50,000 left over. The median income Hispanic household would have less than $20,000 left, which is considerably less than is likely to be needed for other essentials. The median income Black household would have less than $3,000 left over (Figure 2). If the price ratios of 1980 were controlling, that amount would rise by $16,000.

LAO also points out that the Golden State has the highest housing cost adjusted poverty rate in the nation. The latest data shows housing-adjusted poverty rate is far higher even than that in states with a reputation for grinding poverty. California's housing adjusted poverty rate is more than 50% higher than that of Mississippi and approaches double that of West Virginia (Figure 3, LAO Figure 13)

LAO Consequence #2:  Postponing or Forgoing Homeownership

LAO indicates that California ranks 48th in homeownership percentage, behind only New York and Nevada. LAO emphasizes the value of home ownership:

Homeownership helps households build wealth, requiring them to amass assets over time. Among homeowners, saving is automatic: every month, part of the mortgage payment reduces the total amount owed and thus becomes the homeowner’s equity. For renters, savings requires voluntarily foregoing near-term spending. Due to this and other economic factors, renter median net worth totaled $5,400 in 2013, a small fraction of the $195,400 median homeowner’s net worth.

Californians are buying their first houses later. LAO indicates that the average first home buyer in California is three years older than the national average.

LAO Consequence #3:  Living in More Crowded Housing

The nation's worst overcrowding is an unfortunate result of California's housing policies.

LAO indicates that California's overcrowding rate is well above that of the rest of the nation’s rate. Among Hispanics, which were expected to exceed the White-Non-Hispanic population in 2014, to become the state’s largest ethnic group, California overcrowding is more than 2.5 times the Hispanic rate elsewhere. Among households with children, overcrowding in California is four times the national households with children rate. Among renters, overcrowding in California is more than three times the national renter rate (Figure 4, LAO Figure 15).

This has important negative social consequences. According to LAO, research indicates that overcrowding retards well-being and educational achievement:

Individuals who live in crowded housing generally have worse educational and behavioral health outcomes than people that do not live in crowded housing. Among adults, crowding has been shown to increase stress and aggression, lead to social isolation, and weaken relationships between parents and their children. Crowding also has particularly notable effects on children. Researchers have found that children in crowded housing score lower on standardized math and reading exams. A lack of available and distraction-free studying space appears to affect educational achievement. Crowding may also result in sleep interruptions that affect mood and behavior. As a result, children in crowded housing also displayed more behavioral problems at school.

Overcrowding is particularly acute in the higher cost coastal metropolitan areas of Los Angeles, San Francisco, San Diego, and San Jose. There, overcrowding among households with children reaches 10%, and among Hispanic households, overcrowding reaches 18%. Among households with children the figure is slightly higher (Figure 5, LAO Figure 16). Overcrowded housing is generally worse, according to LAO, in areas with higher house prices.

In a state with a political establishment that prides itself in watching out for low income citizens and ethnic minorities, the need to reform the responsible policies could not be clearer.

LAO Consequence #4: Commuting Farther to Work

LAO finds that California’s average work trip commuting times are only moderately above the national average. However, LAO suggests that the commute lengthening impact of higher house prices may be reduced by California's widespread (I call it dispersed) development pattern, its freeway system and the "above-average share of commuters who drive to work. (Driving commutes are generally fast, and therefore metros with higher shares of driving commuters tend to have shorter commute times.)"

Nonetheless, according to LAO:

...our analysis suggests that California’s high housing costs cause workers to live further from where they work, likely because reasonably priced housing options are unavailable in locations nearer to where they work.

LAO Consequence #5:  Choosing to Work and Live Elsewhere

LAO also indicates that California's high housing prices are likely to have reduced its population (and economic) growth. LAO sites the strong net outmigration of California households to other states. LAO also finds in its national metropolitan area analysis that counties with higher growth rates tend to have better housing affordability than counties with lower growth rates.

There has also been strong net outmigration from the coastal counties to inland counties. This is most evident in the growth of the Riverside-San Bernardino metropolitan area (the Inland Empire) between 2000 and 2010. The Inland Empire captured more than two thirds of the population growth of the Los Angeles Combined Statistical Area (Los Angeles, Orange, Riverside, San Bernardino and Ventura counties). LAO notes the impact of the excess of demand in the coastal counties, again recognizing the nexus between overzealous regulation and the loss of housing affordability:

This competition bids up home prices and rents. Some people who find California’s coast unaffordable turn instead to California’s inland communities, causing prices there to rise as well.

LAO also refers to the difficulty that employers have in retaining and recruiting staff. LAO cited survey data from the Silicon Valley, which has for years been California's economic "Golden Goose" in recent years:

In a 2014 survey of more than 200 business executives conducted by the Silicon Valley Leadership Group, 72 percent of them cited “housing costs for employees” as the most important challenge facing Silicon Valley businesses.

In addition, there has been a strong movement of California companies to other parts of the nation, where more liberal regulations foster a better business climate.

Restoring Housing Affordability

LAO indicates the importance of fundamental reform and calls for putting "all policy options on the table."

Major changes to local government land use authority, local finance, CEQA (California Environmental Quality Act), and other major polices would be necessary to address California’s high housing costs.

In addition:

The greatest need for additional housing is in California’s coastal urban areas. We therefore recommend the Legislature focus on what changes are necessary to promote additional housing construction in these areas.

Perhaps the only weakness of the report deals with densification, particularly in coastal counties. For example, LAO suggests that without the housing restrictions the city of San Francisco is population would be 1.7 million, rather than the approximately 800,000 who live there today. In fact that would be unprecedented beyond belief. No core city that had become fully developed and reached 500,000 people by 1950 has achieved growth of this magnitude. The greatest growth was less than 10%, in this category of 60 core cities (which includes the city of San Francisco). Even less likely would be public support for such huge population growth in the second densest major municipality in the nation.

While LAO does not indicate the additional population that its estimates would have placed in the core of Los Angeles, given the scale of the San Francisco increase, this could be a number of up to 3 million. This area, the broadest expanse of over 10,000 population per square mile density in the nation outside New York City is in the middle of the urban area with the nation's worst traffic congestion, according to the Texas A&M Transportation Institute. It is doubtful that residents would have the "stomach" to expand roadway capacity to keep the traffic moving. Transit could not have made much difference. Even with its now extensive rail network that has opened since the early 1990s, driving alone accounted for 85% of the additional travel to work from 2000 to 2013 in the city of Los Angeles. Yet, the city of Los Angeles has the most extensive transit in the metropolitan area, including service by all rail lines.

In reality, core densification is likely to be modest. Keeping housing affordability from getting worse requires regulatory liberalization throughout California, including coastal and inland areas

The reality is that if California had permitted growth, it would naturally occurred mostly on the periphery. Even with the restrictions on building, the preference for suburban living (largely in detached housing) could not be repressed between 2000 and 2010. Less than 10% of the population growth in the Los Angeles and San Francisco Bay areas occurred in the cores.

The Challenge

Should the state of California begin to seriously discuss housing affordability, it will be important to ease restrictions throughout the state, not just in the coastal counties. There are serious barriers to placing the appropriate priority on improving the standard of living and minimizing poverty rates among California's diverse population. Perhaps the biggest impediment is Senate Bill 375, which is being interpreted by the state and its regional planning agencies to require even more stringent land-use regulation.

In this environment, LAO rightly raises this concern:

If California continues on its current path, the state’s housing costs will remain high and likely will continue to grow faster than the nation’s. This, in turn, will place substantial burdens on Californians—requiring them to spend more on housing, take on more debt, commute further to work, and live in crowded conditions. Growing housing costs also will place a drag on the state’s economy.

It is to be hoped that California's distorted policy priorities will be righted to restore the California Dream.

Photograph: Dense suburban development: Inland Empire (San Bernardino Freeway with Uplard toward the top and Ontario toward the bottom) - By author

Wendell Cox is an international public policy consultant and principal of Demographia in St. Louis. He is a native Los Angelino, having been born within two miles of City Hall. He was appointed to three terms on the Los Angeles County Transportation Commission by Mayor Tom Bradley. Full biography is here.

Where We Live: The Case for Suburban Renewal

$
0
0

The advent of Australian ‘urban renewal’ in the 1990s has been such a blistering policy success that it’s now arguably well out of proportion to the realities of need based on where people actually live. It’s as if the magic “5 kilometre ring” around our city centres has become a policy preoccupation and an industry obsession. One look at the evidence though suggests perhaps it’s time we turned attention to the suburbs, where the vast majority of us live, to restore some balance.

The middle and outer suburbs may not capture the interest of intellectual elites or (with some exceptions) provide the homes of the wealthiest in our society, but they do continue to house the vast majority of Australians. All the hype and excitement about “inner city café lifestyles” belies the statistics which show in stark reality that Australia is not only a nation of city dwellers, but within those cities we are overwhelmingly a nation of sub-urban, as opposed to urban, dwellers. 

Gushing media reports about inner city real estate markets and frantic development activity, public transport projects, parkland projects, bikeways, cultural facilities and the like fail to mention that only 10% of us, at most, live within the 5 kilometre ring. A thumping majority of 90% to 95% of Australians, in the major cities of Sydney, Melbourne and Brisbane, live outside the 5 kilometre ring of privilege. As a rule, 70% to 80% of us live further than 10 kilometres from the city centre, in outer-middle and outer suburban areas. It’s also true that the majority of us not only live beyond the inner city, but we also work outside it. Our pattern of living is not only overwhelmingly suburban, but so is our economy. (More on this next month).  

So how do our three largest cities shape up on the evidence?

Sydney


There are just over 330,000 Sydney residents living within 5 kilometres of the city centre. There are a total of 4.34 million people living within 50 kilometres of the city centre, so that’s a fairly small 8% of the total who call the inner city home.   Twice as many people – 675,000 – live from 5 to 10 klms out and the numbers and percentages continue to rise the further out you go. They may live at lower densities in the outer suburbs but numerically they outnumber inner city residents ten to one. If we think of suburbs from 10 to 20 klms out as ‘outer middle’ areas and those over 20 klms out as ‘outer’, then 80% of the Sydney population lives further than 10 klms from the city centre. 

Melbourne


There are fewer people living within 5 klms of the Melbourne City Centre than even Brisbane. Of the total 4.154 million people who live within 50 klms of the city centre, this is just 5% of the total. There are a further 13% of Melburnians who call the 5 to 10 klm band home, while a very substantial 82% of Melburnians call the outer-middle and outer bands home.  Even if the number of people living within the 5 klm ring of Mebourne’s CBD doubled, it would have next to no impact on the overwhelmingly suburban distribution of the population across the Melbourne metro area.

Brisbane


In Brisbane, there are around a quarter of a million people within 5 klms of the city centre. That represents 11% of the total 2.15 million people who live within 50 klms of the centre. A further 17% or 356,500 live from 5 to 10 klms out, which actually makes Brisbane the more centrally populated of the three cities studied. 72% of Brisbane residents live further than 10 klms out in middle-outer and outer suburbs which is still a very large majority but not quite the 80% of Sydneysiders nor the 82% of Melburnians. 

Observations

One observation worth making is that our governance systems aren’t well designed to deal with large metro regions. Sydney has an astonishing 38 local governments across its metro area, and Melbourne has 12. Brisbane is the exception, with one large local authority providing local government services to 1.13 million people. But even in Brisbane’s case that leaves a further 1 million people living within 50 klms of the city centre governed by a number of different local authorities.

I am not suggesting we should have single local governments for our entire metro areas. In fact there are some good reasons for the ‘local’ in local government to focus on smaller areas. However, if we want metro wide solutions to apply policy attention and taxpayer funds equitably to suburban and urban areas, local governments may not be best vehicle. You could hardly expect, for example, the highly exclusive Sydney City Council – which at 25 square kilometres covers an area not much larger than its CBD and nothing more – to put up their hand and say “we don’t really need NSW taxpayers to subsidise our outrageously expensive light rail extension because we understand there are higher priorities for people in Bankstown or Hornsby.” 

Which means that state governments, working with local and federal agencies, are the ones needed to adopt a broader governance approach to metro regions, with a focus on sustaining and developing the suburban economy along with the inner urban.

The other, more glaring observation is that democracy seems to be failing the suburbs. Nine out of ten city dwellers may live in the suburbs and more eight in ten also work there, but increasingly it’s hard to shake the suspicion that it’s the people who live and work within a 5 klm ring of our city centres that are making the decisions and spending the money. 

From politicians to heads of government departments, media organisations and industry leaders: the well off and the influential are overwhelmingly from the inner city. They live there, they work there, and primarily socialise and circulate within this hot house of privilege and influence. It may also explain why in some urban planning circles, there is an increasing sense of anti-suburban elitism creeping in. The suburbs and their ‘McMansions’ are topics of disdain for some, which is a pity. 

The people who live in the middle-outer and outer suburbs of our cities in the main don’t live there because they have to: they live there because they want to. They don’t deserve derision, nor are they looking for sympathy. It may surprise inner city elites, but many have little interest in battling congested inner city traffic or paying excessive real estate prices or living in crowded inner urban arrangements or paying exorbitant parking fees for the privilege of working or living in or simply visiting in the inner city and what it has to offer.

Yet while numerically superior in every way, the suburban existence remains largely shunned in policy circles. The more that the intelligentsia become isolated from the suburban heartland of our economy and way of life, the weaker we become as a nation. 

Ross Elliott has more than 20 years experience in property and public policy. His past roles have included stints in urban economics, national and state roles with the Property Council, and in destination marketing. He has written extensively on a range of public policy issues centering around urban issues, and continues to maintain his recreational interest in public policy through ongoing contributions such as this or via his monthly blog The Pulse.


California Should Make Regular People More of a Priority

$
0
0

California in 1970 was the American Dream writ large. Its economy was diversified, from aerospace and tech to agriculture, construction and manufacturing, and allowed for millions to achieve a level of prosperity and well-being rarely seen in the world.

Forty-five years later, California still is a land of dreams, but, increasingly, for a smaller group in the society. Silicon Valley, notes a recent Forbes article, is particularly productive in making billionaires’ lists and minting megafortunes faster than anywhere in the country. California’s billionaires, for the most part, epitomize American mythology – largely self-made, young and more than a little arrogant. Many older Californians, those who have held onto their houses, are mining gold of their own, as an ever-more environmentally stringent and density-mad planning regime turns even modest homes into million-dollar-plus properties.

What about California society as a whole? The Chapman University Center for Demographics and Policy released a report this month, by attorneys David Friedman and Jennifer Hernandez, on “California’s social priorities.” It painstakingly lays out our trajectory over the past 40 years. For the most part, it’s not a pretty picture and – to use the most overused word in the planning prayer book – far from sustainable from a societal point of view.

Read the full article at The Orange County Register.

Joel Kotkin is executive editor of NewGeography.com and Roger Hobbs Distinguished Fellow in Urban Studies at Chapman University, and a member of the editorial board of the Orange County Register. He is also executive director of the Houston-based Center for Opportunity Urbanism. His newest book, The New Class Conflict is now available at Amazon and Telos Press. He is also author of The City: A Global History and The Next Hundred Million: America in 2050.  He lives in Los Angeles, CA.

Photo by Thomas Pintaric (Own work) [GFDL or CC-BY-SA-3.0], via Wikimedia Commons

Still Moving to Texas: The 2014 Metropolitan Population Estimates

$
0
0

Texas continues to dominate major metropolitan area growth. Among the 53 major metropolitan areas (with more than 1 million population), Texas cities occupied three of five top positions in population growth, and four of the top 10 (Figure 1).

Other parts of the nation are adding population in large numbers as well. The six top 10 cities not in Texas were split evenly between the South and the Mountain West. In the South, Raleigh ranked third, Orlando ranked fourth and Nashville was eighth. Out West, sixth-ranked Denver is maintaining its quick  growth rate as the middle of the decade approaches. Two cities that were especially hard hit by the housing bust now seem to be making progress. Las Vegas, has recovered to become the seventh fastest growing city, largely on the strength of substantially improved domestic migration numbers. In 2013-2014, the rate of net domestic migration quadrupled in Las Vegas. Phoenix (9th) is also recovering, and is now established as the nation's 12th largest metropolitan area, having passed Riverside-San Bernardino.

Texas

But the biggest gains were in Texas.

Houston gained the most population between 2013 and 2014, adding 166,000 new residents. This is nearly as much as the gain in the entire Midwest states (177,000) which is home to 10 times as many people. Since 2000, Houston has risen from the nation's eighth largest metropolitan area to its fifth, passing Washington, Miami, and earlier in this decade, Philadelphia.

For the first time in US history, two of the five largest cities in the nation are in Texas. Just ahead of Houston is fourth-ranked Dallas-Fort Worth, which had the second largest population gain at 127,000. This is a larger increase than occurred in the Northeast, which stretches from Pennsylvania, New Jersey, and New York through New England and has more than eight times as many people as Dallas-Fort Worth. While Dallas-Fort Worth's population increase has been slower than Houston's in recent years (10th in 2013-2014), it has risen from a position of ninth in 1992 fourth today (present metropolitan boundaries).

Other Texas cities are also performing well. Austin, as has often been the case since the moderation of growth in Las Vegas during the last decade, has by far the largest population growth rate, at 3.0%, compared to the Houston's 2.5%.

San Antonio, so often overlooked in a state with Houston, Dallas-Fort Worth, and Austin ranked fifth in population growth rate between 2013 and 2014.

Net Domestic Migration

The top cities in net domestic migration almost duplicate the top 10 in population growth. Charlotte and Tampa-St. Petersburg replace Phoenix and Dallas-Fort Worth among the top 10 in net domestic migration (Figure 2).

A number of cities suffered substantial net domestic migration losses (Figure 3). The largest loss was in New York, which lost nearly one percent of its residents to other parts of the country. New York's net domestic migration loss increased more than a third from that of 2011 through 2013, rising to 163,000 in 2014. Almost a net 100,000 left New York City, up from 69,000 in 2012-2013. The suburbs experienced a smaller loss, 64,000, up from 44,000.

The other two largest cities, Los Angeles and Chicago also had larger domestic migration losses (61,000 66,000 respectively) than the other cities.  Washington had by far the largest reversal, experiencing a domestic migration loss of 25,000, down from a plus 43,000 between 2012 and 2013.

Additional Developments

There’s also a new member of the million person metropolitan club, Tucson, the 53rd major metropolitan area.

Chicago's growth has virtually stalled. Over the last year, the metropolitan area added only 0.1% to its population. This is less than one quarter the longer-term rate that had previously been projected. At that rate, Chicago would have reached 10 million residents within a decade. At the most recent growth rate, it would take nearly a half century. In light of the expected slower growth rates in the future, Chicago may never reach megacity status, unless its commuting shed expands enough to add new counties along its metropolitan fringe.

However, even without Chicago, the United States could add two new megacities within the next two decades. Both Houston and Dallas-Fort Worth would exceed 10 million by 2040 population if their current growth rates were to be maintained.

Despite being passed by Houston and Dallas-Fort Worth in the last two decades, Washington appears sure to emerge larger than Philadelphia by next year's population estimates. This year, Washington exceeded 6 million population for the first time.

Domestic Migration: Core and Suburban Counties

This is indicated by domestic migration trends, which are reported by the Census Bureau only at the county level. Suburban counties continue to increase their net domestic migration and over the last year attracted nearly 420,000 more new residents from other parts of the nation than the core counties. The suburban counties gained 230,000 net domestic migrants, while the core counties lost 190,000. The low point of suburban net domestic migration occurred in 2012 when the gap relative to core counties was approximately 155,000. In each of the years of this decade, core counties have lost domestic migration, while suburban counties have gained more new residents from elsewhere (Figure 4).

As the nation continues its tepid recovery from the Great Recession, the largest number of people are moving to the suburbs and away from the core counties. This suggests that, normalcy may be gradually returning, with strong growth both in the suburbs and throughout the Sunbelt.


Major Metropolitan Area Population Estimates
Population2013-2014
RankMetropolitan Area201020132014% ChangeNet Domestic MigrationRank: Domestic Migration
1New York, NY-NJ-PA 19,567  20,002  20,093 0.45%-0.81%         53
2Los Angeles, CA 12,829  13,176  13,262 0.66%-0.47%         47
3Chicago, IL-IN-WI   9,461    9,545    9,555 0.10%-0.69%         51
4Dallas-Fort Worth, TX   6,426    6,823    6,954 1.92%0.72%         13
5Houston, TX   5,920    6,334    6,490 2.47%1.04%           6
6Philadelphia, PA-NJ-DE-MD   5,965    6,036    6,051 0.25%-0.34%         42
7Washington, DC-VA-MD-WV   5,636    5,967    6,034 1.12%-0.41%         45
8Miami, FL   5,565    5,863    5,930 1.13%-0.21%         35
9Atlanta, GA   5,287    5,525    5,614 1.61%0.58%         15
10Boston, MA-NH   4,552    4,698    4,732 0.73%-0.22%         37
11San Francisco-Oakland, CA   4,335    4,530    4,594 1.42%0.32%         21
12Phoenix, AZ   4,193    4,404    4,489 1.93%0.93%         11
13Riverside-San Bernardino, CA   4,225    4,390    4,442 1.18%0.24%         23
14Detroit,  MI   4,296    4,295    4,297 0.03%-0.47%         48
15Seattle, WA   3,440    3,614    3,671 1.60%0.48%         16
16Minneapolis-St. Paul, MN-WI   3,349    3,461    3,495 0.97%-0.02%         31
17San Diego, CA   3,095    3,223    3,263 1.27%0.08%         28
18Tampa-St. Petersburg, FL   2,783    2,874    2,916 1.44%0.99%         10
19St. Louis,, MO-IL   2,788    2,802    2,806 0.16%-0.28%         39
20Baltimore, MD   2,710    2,774    2,786 0.43%-0.23%         38
21Denver, CO   2,543    2,700    2,754 2.02%1.09%           4
22Charlotte, NC-SC   2,217    2,337    2,380 1.84%1.03%           7
23Pittsburgh, PA   2,356    2,361    2,356 -0.19%-0.12%         33
24Portland, OR-WA   2,226    2,315    2,348 1.45%0.71%         14
25San Antonio, TX   2,143    2,282    2,329 2.04%1.09%           5
26Orlando, FL   2,134    2,271    2,321 2.22%1.01%           8
27Sacramento, CA   2,149    2,218    2,244 1.21%0.37%         19
28Cincinnati, OH-KY-IN   2,115    2,139    2,149 0.51%-0.04%         32
29Kansas City, MO-KS   2,009    2,055    2,071 0.77%0.05%         29
30Las Vegas, NV   1,951    2,029    2,070 1.99%1.00%           9
31Cleveland, OH   2,077    2,065    2,064 -0.08%-0.38%         44
32Columbus, OH   1,902    1,969    1,995 1.30%0.44%         17
33Indianapolis. IN   1,888    1,953    1,971 0.93%0.11%         26
34San Jose, CA   1,837    1,929    1,953 1.25%-0.37%         43
35Austin, TX   1,716    1,886    1,943 3.05%1.75%           1
36Nashville, TN   1,671    1,759    1,793 1.94%1.13%           3
37Virginia Beach-Norfolk, VA-NC   1,677    1,707    1,717 0.54%-0.30%         40
38Providence, RI-MA   1,601    1,606    1,609 0.24%-0.16%         34
39Milwaukee,WI   1,556    1,570    1,572 0.13%-0.45%         46
40Jacksonville, FL   1,346    1,396    1,419 1.65%0.92%         12
41Memphis, TN-MS-AR   1,325    1,342    1,343 0.11%-0.55%         50
42Oklahoma City, OK   1,253    1,321    1,337 1.23%0.43%         18
43Louisville, KY-IN   1,236    1,262    1,270 0.59%0.12%         25
44Richmond, VA   1,208    1,247    1,260 1.06%0.36%         20
45New Orleans. LA   1,190    1,242    1,252 0.80%0.16%         24
46Raleigh, NC   1,130    1,215    1,243 2.28%1.18%           2
47Hartford, CT   1,212    1,216    1,214 -0.14%-0.71%         52
48Salt Lake City, UT   1,088    1,142    1,153 1.03%-0.32%         41
49Birmingham, AL   1,128    1,140    1,144 0.37%0.02%         30
50Buffalo, NY   1,136    1,136    1,136 0.02%-0.22%         36
51Rochester, NY   1,080    1,084    1,083 -0.06%-0.52%         49
52Grand Rapids, MI      989    1,017    1,028 1.03%0.25%         22
53Tucson, AZ      980       998    1,005 0.65%0.09%         27
In 000s
Data from Census Bureau


--------

Note: Core counties are the counties with the largest historical core municipalities as well as the five counties that make up the core city of New York.

Photograph: Houston Suburbs by author


Wendell Cox is principal of Demographia, an international public policy firm located in the St. Louis metropolitan area. He has served as a visiting professor at the Conservatoire National des Arts et Metiers in Paris since 2002. His principal interests are economics, poverty alleviation, demographics, urban policy and transport. He is co-author of the annual Demographia International Housing Affordability Survey and Demographia World Urban Areas.

Can Singapore Thrive After Lee Kuan Yew?

$
0
0

On Sunday, Singapore cremates its greatest leader, the late Lee Kuan Yew, architect of its good fortunes. Yet the flames also could extinguish the era of relentless social and economic progress that Lee ushered in during his long, amazingly productive life.

World leaders, corporate hegemons, and much of the foreign policy establishmenttend to worship Lee’s achievements. But the view from on high, not to mention across the seas, can be quite different from the reality on the ground, as I have learned over many trips to this most remarkable city-state.

Lee is rightly celebrated for his remarkable success in transforming a poor, southeast Asian metropolis into one of the wealthiest and most productive places on the planet. At the time of its independence in the mid-’60s, Singapore was a corrupt, dirty, and divided Asian metropolis, with a GDP of roughly $2,600 per capita, which put it ahead of China and most of its southeast Asian neighbors but below such countries as the Philippines, Brazil, Yugoslavia, Bolivia, and Argentina, and several times lower than Greece, Spain, and the United Kingdom.

Uncontestable: A Record of Economic Achievement

Under Lee and his cadre of well-educated, thoughtful civil servants, the tiny 225 square mile island republic has created arguably the best run and most successful dense urban place on the planet. Today the city-state has a per capita GDP estimated at $55,000, according to the U.S. Bureau of Labor Statistics, above the U.S. level and well ahead of Japan, Germany, and France, as well as its old colonial master, Great Britain.

Lee got there by having goals but being pragmatic about how to achieve them. He was what one observer called “a patient revolutionary,” a Fabian socialist whose underlying ideology can be boiled down to “what works.” This pragmatism was evident in economic policy, as the country focused first on trade and manufacturing and then towards a greater orientation to technology and high-end services.

Education was a critical component, and from the start it was seen as the primary way to build both the state and the economy. This policy has resulted in a high proportion of technically trained professionals, leading the ++Center on International Education Benchmarking Education ++ [http://www.ncee.org/programs-affiliates/center-on-international-education-benchmarking/] to call Singapore’s workforce “among the most technically competent in the world. Unlike many places in the developing world, Singapore knows it must compete primarily on quality, not price.”

Perhaps the most critical aspect of Lee’s success, and that of his successors, was the ability to meet the requirements of multinational companies. Designating English as the national language  was a primary advantage. Due largely to Lee, Singapore is a primarily English-speaking country, and global business tends to go where it is understood, and where its nationals can most easily function.   

As a result, efficient, globally focused Singapore now boasts more than twice as many regional headquarters of foreign firms than far-larger Tokyo, not to mention Asia’s less affluent megacities. They provide expats working for multinationals with sanitation, parks, trees, clean housing, an educated workforce, and low corruption not readily available in the rest of south Asia. Anyone who has spent time in India, or even Vietnam, marvels at the relative ease of life in Singapore.

The Limits of Globalization

Yet with wealth have come new problems that are not widely acknowledged outside the city-state. The influx of foreigners has made property owners wealthier, but many feel it also has eroded local culture. Its benefits to ordinary Singaporeans are increasingly dubious. Even as GDP growth continues to chug at somewhat close to 5 percent per annum,   real wages for ordinary Singaporeans have stagnated. From 1998 to 2008, the income of the bottom 20 percent of households dropped an average of 2.7 percent, while the salaries of the richest 20 percent rose by more than half. 

For many Singaporeans, discontent has led them to consider a move elsewhere. Already some 300,000 citizens now live abroad, almost one of ten. As many as half of Singaporeans, according to a recent survey, would leave if they could.

The Shrinking Family

Arguably the biggest threat to Singapore’s future is occurring in the country’s bedrooms.     As Lee was himself aware, Chinese civilization was built around a large extended family, often with several generations under the same roof. In the Chinese tradition, “regulating the family” was seen as critical to both “ordering the state” and pacifying the world.

As the Chinese began to spread to Southeast Asia and beyond, they carried elements of this family-centric culture with them. Kinship ties, according to the sociologist Peter Berger, constituted “the absolutely central institution” of overseas Chinese businesses in the Americas, Europe, Africa, and Australia. In Singapore this familial situation propped up the hierarchy of the state; Lee, in a sense, was the father of all Singaporeans while the bureaucracy played the role of “tiger moms,” cajoling, instructing, demanding ever better results from their charges.

Yet this familial-based system is clearly breaking down. This is reflected by the decision of   more Singaporeans not to have offspring. Indeed today Singapore has one of the world’s lowest fertility rates; and more young people are postponing or completely avoiding marriage (children out of wedlock remain very rare). The fertility rates in Singapore have fallen almost 50 percent below the replacement rate of 2.1. Overall, Singapore-based demographer Gavin Jones estimates that up to a quarter of all East Asian women now entering their 20s—including those in Singapore—will still be single by age 50, and up to a third will remain childless. 

“People increasingly see marriage and children as very risky, so they avoid it,” notes Singapore based demographer Gavin Jones. “Even though there’s a strong ideology in Asia to have a family, it is fading.”

The Spiritual Crisis

Jones and others see this trend as something of a spiritual crisis, coupled with high housing prices and an overemphasis on work. In the old Chinese world, children were seen as essential to economic stability and social status. Now those values have drowned in a tsunami of materialism and global culture.

“My father was from the old generation,” says Singapore pastor Andrew Ong. “He came from a family of 16. Now people’s priorities have changed. They don’t really believe in sacrifice and family. They want the enjoyment of life, and children would impinge on that … they don’t value family and children the way we used to.”

In interviews, young Singaporeans often express the decision not to have children in very pragmatic  terms. “Having kids was important to our parents,” noted one 30-something civil servant in Singapore, “but now we tend to have a cost and benefit analysis about family. The cost is tangible but the benefits are not knowable or tangible.”

The links among housing prices, work competition, and the decision not to have families was repeatedly mention by young people in Singapore. As one young civil servant told me, “I feel Singapore is becoming more stressful—people are living in smaller spaces. There’s no room for a child. The costs are tremendous. A generation ago, it was different. My father was a bus driver and could get a big HDB [Housing Development Board] flat. For my generation, it will be harder.”

Demographer Jones also links the low marriage and birth rates in part to extreme competition that forces people to work long hours. Despite successes over the past few decades, the degree of economic uncertainty has grown considerably in successful Asian countries, all of them faced with increased competition from the behemoths of India and China. Faced with these challenges, Singapore employers, Jones reports, remain “generally unforgiving of the divided loyalties inherent in the effort to combine child-raising with working.”

Such pressures were repeatedly reported in interviews with younger Singaporeans. “People are consumed by their work,” one young Singaporean told me. “There’s a lack of time. You would expect nature will take care of this but it doesn’t.”

These same phenomena can be seen in all the densest cities of Asia, from Tokyo and Seoul to Shanghai. The very work culture that is so impressive to foreign companies has had a very direct impact on family and society. “The focus in Singapore is not to enjoy life, but to keep score: in school, in jobs, in income,” noted one 30-year-old scholar at the NUS Institute for Policy Studies. “Many see getting attached as an impediment to this.”       

The biggest impact on these change has been among  women, who are playing an increasingly critical role in the local economy. Although most senior executives in the government and outside are male, the middle ranks, and many of the fastest up and comers, are female. Demographer Wolfgang Lutz notes that while Singapore may have strong pro-natalist policies, it still operates an economic system that encourages, even insists on, long hours for employees, many of whom are women. Singapore’s labor force participation rate for women is almost 60 percent. “In Singapore,” Lutz points out, “women work an average of 53 hours a week. Of course they are not going to have children. They don’t have the time.”

The danger of a ‘now’ society

The tendency to put off marriage and child-bearing, as well as the focus on material gain,     works against the fundamental values of patience and persistence that animated Lee Kuan Yew’s career, and also shaped Chinese civilization. A society that is increasingly single and childless is likely to be more concerned with serving current needs than addressing the future. Like other societies, Singapore can tilt more into a “now” society, geared towards consuming or recreating today, as opposed to nurturing and sacrificing for tomorrow.

These problems, of course, exist across the high-income world, but in Singapore, given its small space and its unfriendly neighborhood, the stakes are higher. After all, there is no suburbia for families to flee to, and there is no Texas to balance off the problems of an over-expensive New York or San Francisco. Singapore’s miracle, as Lee knew, was always a fragile one, and may become more so in the years after his passing.

Joel Kotkin is executive editor of NewGeography.com and Roger Hobbs Distinguished Fellow in Urban Studies at Chapman University, and a member of the editorial board of the Orange County Register. He is also executive director of the Houston-based Center for Opportunity Urbanism. His newest book, The New Class Conflict is now available at Amazon and Telos Press. He is also author of The City: A Global History and The Next Hundred Million: America in 2050.  He lives in Los Angeles, CA.

Photo: "Lee Kuan Yew" by Robert D. Ward - Cropped by Ranveig from defenselink.mil. Licensed under Public Domain via Wikimedia Commons.

The House of the Future Will be Solid-State

$
0
0

Housing will take a great leap forward when the house becomes married to the concept of solid-state. This revolution will begin when solid-state – i.e., no moving parts – becomes meshed into notion of shelter; ergo, the solid state house. This will be the housing of the future.

With the introduction of solid-state circuitry in the 1940s, the transistor replaced the vacuum tube to shrink circuits, improve precision, and eliminate maintenance and wear. This concept revolutionized electronics. Tubes were large, coarse, and had to be replaced when they overheated. Transistors did not. Tubes required a lot of energy and current to move electrons around to do their jobs, rest and recharge, and activate devices. Transistors could do the same jobs with a fraction of the energy, thus reducing heat, cost, and time; they could also be spaced closer together. Radios, which were briefcase sized objects, collapsed from to thumb-sized objects. A radio today is a mere speck; a partition within a larger microchip measured in nanometers.

The solid-state house is not to be confused with the tiny house. Today, the tiny house movement is still in its nascent stages, and running into some important obstacles. For one thing, the entire economic system is blockading this movement, because the system is entirely designed for the supersized. During the permitting process, whether you permit 400 square feet or 4000 square feet, the same baseline cost applies, and the increase is only incremental. Municipalities, desperate for cash, have no incentive to reduce permitting costs. So the tiny house must pay the same tribute to the king as a McMansion.

Builders have little interest in not-so-big houses, because they are built more quickly, and with fewer materials. Why would a builder want to sacrifice price? The management of a construction job is the same, whether managing a three month, 400 square foot project or a three month 4,000 square foot project.

Builders also are accustomed to a supply chain of vendors with whom they have developed relationships. Gypsum wallboard, for example, is, the bread-and-butter staple of interior construction. If you are seeking an interior finish that has less impact on the environment, you will always pay more. The small house movement has not yet figured out how to work around the consumptive, wasteful supply chain, and unwittingly adopts it into the movement, rewarding the same people, taking the same resources from the earth, and injecting the same waste. The notion that the movement is doing less harm only means that a tiny house is less bad than a large house.

And finally, a tiny house, once it is finished, has hundreds, if not thousands, of individual separate parts, and all of them move. During the daily temperature cycle things warm up, expanding during the day and shrinking at night. Rain wears down finishes and opens up joints between materials. Air conditioning creates a humidity imbalance that nature is constantly trying to correct. Even with today's current construction methods, these issues are addressed no differently than they were fifty or a hundred years ago.

Machines within the house — air conditioners, ceiling fans, switches, faucets, water heaters, and on and on and on — all have moving parts. They break down, require maintenance, and have their own supply stream. Whether a house is small or large, it has all the same baggage in terms of motors, lights, machines, and pipe joints. The lengths of straight pipe between joints may be shorter, but the connections, where the leaks occur, are still the same.

The not-so-big-house will not, in its current form, succeed and converge into a broad ethos for the masses. The 'system' is embedded way too deeply into its bones. This system has evolved, Darwinian style, carrying its bad genes into the present. If the McMansion is doomed, so is the small house.

But a different type of evolution is possible: Lamarckian evolution, in which change can come in one generation. Just as transistors evolved out of tubes, so can a solid-state house evolve out of a current house. This is the pathway towards the future. The ideal solid-state house shall have no separate moving parts, and shall be endlessly customizable out of factory parts. And the solid-state house shall shrink.

The not-so-big house movement will be the testing ground for the solid-state house. Small projects are the province of invention. A new way of doing things is easier to test when failure is small scale.

For example, water-carrying pipes currently are rigid PVC or copper because it is cheaper for long distance. In a small house, where water needs to be carried for shorter distances, more flexible hoses can be used, eliminating pipe joints. In the future small house these may be baked into the wall, much like holes in bread, eliminating a second material from the mix.

Air conditioning may be under the floor or in the walls, operating through microtubules that work like sweat glands in reverse, constantly removing moisture from the air and channeling it into a system that cools air, creating a transpiration cycle that will allow the small house's microclimate to function in the same way as the space under a tree canopy. LEED, the green certification rating system, requires a hermetically sealed space to minimize energy. But this new system will work best when the windows are open. Reconnecting with nature will be a pleasant byproduct of the solid-state house.

As many appliances as possible will be 24 volt direct current, and will function without motors, gears, or bearings. A 'gear room' or utility room will be where the shameful old appliances, like washing machines, will be placed. Eventually these will be solid-state, too.

The solid-state house will be at first very small. Finishes — the 'look' of the house — can meet any preference. If the current preference is stucco, for example, that can be added. The solid-state nature of the house, with prefabricated wall and roof panels cut to size and fitted together seamlessly will have its own integrity regardless of the clothing it wears.

The most important part of the solid state house, though, will be its transportability. A foundation system will allow it to anchor firmly to the ground and be connected to local utilities (if required). As a not-so-big house, however, it will also be easily transportable.

This exciting revolution will allow time and space to finally collapse, and bring architecture into our liquid, postmodern, nanosecond twenty-first century.

Richard Reep is an architect with VOA Associates, Inc. who has designed award-winning urban mixed-use and hospitality projects. His work has been featured domestically and internationally for the last thirty years. An Adjunct Professor for the Environmental and Growth Studies Department at Rollins College, he teaches urban design and sustainable development; he is also president of the Orlando Foundation for Architecture. Reep resides in Winter Park, Florida with his family.

Illustration by the author: "The solid state house is a thought project. I created the design and illustrated it [above]. I call the form the qwave. It's shaped a little like a wave. And the house borrows from old technology - the Quonset™ hut. Quonset hut + wave = qwave."

Big Box Urbanism

$
0
0

I’m ambivalent about big box stores. I occasionally shop at places like Walmart, Costco, and Target just like most people. I buy various packaged goods in bulk from these mega retailers to take advantage of a volume discount. I don’t moralize over these things. But when it comes to meat, dairy, and fresh produce I walk around the corner or down the street to my local mom and pop stores, farmers market, or Community Supported Agriculture plan. I’m fine with buying a pallet of inexpensive toilet paper that was manufactured on an industrial scale. Chicken? Not so much.

 Screen Shot 2015-03-08 at 3.23.46 AM

But I’m really interested in the giant retail buildings themselves. A large proportion of the North American landscape is dominated by big box stores and the associated land use pattern that we’ve all come to recognize. They’re so ubiquitous that we tend not to question how they came into being. This blog post will explore the retail development in the Antelope Valley in California, but I use this example because it’s typical rather than unique. Whether you live in Florida, Texas, or Nebraska the same dynamics are at work.

Screen Shot 2015-03-08 at 4.55.37 PM Google

Screen Shot 2015-03-10 at 1.38.12 AM Google Screen Shot 2015-03-10 at 1.37.40 AM Google

The story begins with a rivalry between the two contiguous municipalities of Lancaster and Palmdale. If you were to drive through the Antelope Valley you would have no way of knowing when you had passed through one town and into the other. Not only are they composed of identical building types, but their borders are incredibly intertwined and gerrymandered after decades of annexation in an arms race to see who could grow the fastest. The big prize is always sales tax revenue from high volume retailers: car dealerships, big box stores, department stores, chain restaurants… Anything with a cash register will do. Like most towns the property tax revenue from residential development isn’t nearly enough to cover the costs of city services such as schools, road maintenance, and police and fire protection. Sales tax receipts are desperately needed to fill the gap. The construction and service jobs associated with new retail are also welcomed by city authorities. New growth is paramount at the economic development agencies.

Screen Shot 2015-03-09 at 1.19.09 AM Google

With this in mind the City of Lancaster prepared a site for a regional shopping mall in the late 1980’s. The land next to the freeway was set aside, it was properly zoned, expensive infrastructure was installed, a “business friendly” package of heavy subsidies and sweeteners was put in place, and an extensive lobbying campaign was launched. Basically, Lancaster hiked up its skirt, put on a Wonder Bra and a lot of rouge and hoped a big strong regional shopping mall would come calling.

Screen Shot 2015-03-09 at 1.22.39 AM Google

Unfortunately for Lancaster it was Palmdale that successfully wooed the mall developer with a $20,000,000 incentive package back in 1990. The customer traffic heading to and from the new mall spawned a dozen adjacent retail sites that sprouted big box stores and a penumbra of chain restaurants and strip malls. It was a city planner’s dream for almost eighteen years.

But then Palmdale was hammered by the economic crash of 2008. The mall lost its Gottschalk’s and Mervyn’s anchor stores. Palmdale’s economic development team felt it had no choice but to entice Macy’s and others to fill the void with multi million dollar tax deferments and business “incentives”. Remember, a big mall with no anchor stores rapidly fails as foot traffic declines. In fact, no developer can even secure bank financing to build or improve a retail complex unless they already have signed contracts with a couple of big stores. That’s why the largest stores in any mall pay the lowest proportional rent. The real cost of the mall is carried by the smaller shops and very often the tax payers. A Cinnabon pays a great deal more per square foot in rent than a big anchor like Macy’s. The Cinnabon is also far more productive and pays more tax and employs more people pound for pound. The anchors effectively take up a lot of space, negotiate with veiled threats, pay as little rent as possible, and virtually no tax. That’s standard business practice across the country.

The idea that a town can repeatedly offer tax abatements to the same property in the short term in order to create tax revenue and prosperity over the long haul is a bad economic model. In fact, having neighboring towns race to see who can repeatedly impoverish themselves the most in an attempt to grow rich on new business is also a bad plan. Both towns know private corporations actively game the system, yet they can’t seem to help themselves. They still wet their pants at the thought that the next town over might get the new Applebee’s or Jiffy Lube instead of them. It’s a form of institutional insanity.

Screen Shot 2015-03-09 at 1.37.09 AM Google

Since Lancaster couldn’t have the regional mall it needed to find a new use for the land it had set aside. There aren’t that many things that can fill that kind of space. Like the mall in Palmdale it needed to be something that would serve as a catalyst for growth all around it. And it had to be something that Palmdale didn’t already have. So Lancaster built what was intended to be a regional entertainment center with a baseball stadium, hotel, multiplex movie theater, and a premium outlet mall. “Build it and they will come.”

Screen Shot 2015-03-10 at 5.34.22 PM Screen Shot 2015-03-10 at 5.33.38 PM

In 1995 the city of Lancaster spent $14,500,000 to build the baseball stadium in the hope that economic growth and development would spring up all around it. So a decade on what does the area look like?

Screen Shot 2015-03-10 at 1.54.34 AM Screen Shot 2015-03-10 at 1.53.31 AM Screen Shot 2015-03-10 at 1.53.06 AM Screen Shot 2015-03-10 at 2.34.17 AM

Near the ball park is the Lancaster Marketplace – an outlet mall. I checked the official management website and the leasing agent lists half the stores as “available”. The spaces that are occupied include a dialysis clinic, a dentist, various nail solons, a recycling center, an evangelical church, and a few outlet stores that sell sneakers and jeans. This clearly isn’t the economic engine or tax base that the city had originally envisioned. It wasn’t simply the economic crash of 2008 that brought this place down. It was the institutional over supply of retail space across the entire region. No town needs the insane number of shops that were induced into being by overly optimistic developers and tax starved municipal authorities.

Screen Shot 2015-03-10 at 5.36.08 PM Screen Shot 2015-03-10 at 5.36.52 PM

Here’s the movie theater with all the modern bells and whistles: 22 screens, IMAX, 3D, stadium seating, all digital, a sound system that can pull the gold fillings out of your teeth… you name it. It’s a massive stand alone building with an even bigger parking lot. In fact, the collection of reserved handicapped parking spots close to the front door is as large as many ordinary parking lots at lesser movie theaters. But here’s the problem.

Screen Shot 2015-03-10 at 1.49.18 AM Screen Shot 2015-03-10 at 1.48.52 AM

This is the old 12 screen movie theater half a mile away. It’s now a “second run” theater catering to the discount matinee crowd because it can’t possibly compete on anything other than price with the new super deluxe theater down the road.

Screen Shot 2015-03-09 at 2.28.27 AM Screen Shot 2015-03-09 at 2.28.54 AM

And here’s the old, old movie theater that used to play second run shows when the 12 screen opened up. It was eventually driven out of business. The building sat empty for a long while until someone attempted to operate a hairdressing school at the location. That business failed and now the place sits empty again. The new growth isn’t adding to the town’s economy. New bigger buildings simply replace old buildings that never get repurposed.

Screen Shot 2015-03-08 at 3.06.38 AM Screen Shot 2015-03-10 at 1.49.40 AM 

Across the street from the struggling outlet mall and old 12 screen movie theater is a Walmart. In fact, there are two Walmarts right next to each other. The older “small” Walmart was built in 1990. In 2006 Walmart decided it was time for a new larger super store and there was still plenty of land available in the same retail complex. Even as I stood on the far edge of the enormous parking lot with a special wide angle camera lens I still couldn’t get the two side-by-side buildings into view in a single frame. These buildings are massive.

Screen Shot 2015-03-10 at 3.58.09 AM deccabuilders.com

Screen Shot 2015-03-10 at 3.57.58 AM deccabuilders.comScreen Shot 2015-03-10 at 3.58.44 AM deccabuilders.com

I found photos of the old Walmart on the building contractor’s website. They were proud of the fact that this was the very first Walmart built in the state of California and they delivered the project on time and on budget.

Screen Shot 2015-03-09 at 4.57.04 PM Screen Shot 2015-03-09 at 4.57.31 PM Screen Shot 2015-03-09 at 4.57.54 PM Screen Shot 2015-03-10 at 1.27.47 PM

Here’s what that same Walmart looks like today – just twenty five years later. In theory a new big box retailer would have opened up in the old Walmart building, but instead it has remained empty since 2006. There’s simply no market demand for these hulking ruins.

Screen Shot 2015-03-09 at 2.22.47 AM

Across the street from the two Walmarts is another strip of big and medium sized retail buildings. When the regional shopping mall fell through the idea was that the new Super Walmart would draw enough traffic to the area to support additional shops. “With thousands of folks driving to Walmart everyday the new Circuit City will thrive!” The building pictured above was once a Circuit City. Past tense. Not only was there too much retail space built in the Antelope Valley, but many of these chain stores have gone out of business entirely due to competition from on-line retailers who deliver goods directly to customers via UPS and FedEx.

Screen Shot 2015-03-11 at 10.58.00 PM Screen Shot 2015-03-11 at 10.59.39 PM Screen Shot 2015-03-11 at 11.00.17 PM

One of the popular urban planning strategies in vogue these days is to reuse dead retail buildings by converting them to “meds and eds”. Junior colleges and medical centers are of a suitable size that they can fill old big box stores and help reactivate the surrounding space. The above photos are of the newest medical center in Lancaster. It’s solar powered and hyper energy efficient. The native draught tolerant landscaping is irrigated with recycled gray water. High quality regionally appropriate public art is in abundance. And it’s almost exactly the same size as the old Walmart that’s been sitting empty for the last decade. But where is it?

Screen Shot 2015-03-11 at 11.03.44 PM Screen Shot 2015-03-11 at 11.15.31 PM

If you were to search out the least developed patch of this already sprawling hopscotch part of Lancaster… that’s where. Why? I’m sure there were all sorts of reasons having to do with the medical people, the developers, the city planners, the banks… Maybe the medical center is expected to be the engine of economic development in this patch of the desert and they want loads of extra room so they can spread out in the future. Or maybe that’s where the really cheap land was near a freeway cloverleaf. Or perhaps the medical center was too prestigious to be located in a low rent shopping plaza. Who knows?

Screen Shot 2015-03-10 at 5.31.42 PM Screen Shot 2015-03-10 at 5.32.24 PM Screen Shot 2015-03-12 at 12.03.48 AM Google

There was still a big chunk of the old mall site that couldn’t be filled with much of anything. Reluctantly the city rezoned it for single family residential subdivisions. Housing wouldn’t bring in tax revenue the way retail development would, but it was better than nothing. Growth was growth and Lancaster needed it badly. From Google Earth view you can see the cul-de-sacs carved into the desert. So far… no takers.

Screen Shot 2015-03-10 at 5.32.57 PM Screen Shot 2015-03-10 at 5.34.47 PM Screen Shot 2015-03-10 at 5.36.37 PMScreen Shot 2015-03-10 at 5.35.05 PM Screen Shot 2015-03-10 at 5.34.05 PM

Here are a few views of that old regional shopping mall site: the back of the 22 screen movie theater, the back of the outlet mall, the back of the baseball stadium, and the back of the hotel. Notice the roads that were built to accommodate all the anticipated growth.

But they built it and they didn’t come.

Again, this isn’t unique to the Antelope Valley. These same patterns of development play out all over the country. Some of you may dismiss this particular part of the world and assume your town is much better at managing its affairs. You may have more employers pumping money into your local economy. Or perhaps you live in a more sensible state with a pro business legislature, unlike the folks who run California. The truth is that California just did everything earlier and faster and on a grander scale than other places. Your turn is coming.

John Sanphillippo lives in San Francisco and blogs about urbanism, adaptation, and resilience at granolashotgun.com. He's a member of the Congress for New Urbanism, films videos for faircompanies.com, and is a regular contributor to Strongtowns.org. He earns his living by buying, renovating, and renting undervalued properties in places that have good long term prospects. He is a graduate of Rutgers University.

Viewing all 3795 articles
Browse latest View live


Latest Images