Quantcast
Channel: Newgeography.com - Economic, demographic, and political commentary about places
Viewing all 3788 articles
Browse latest View live

Best Cities for Minorities, Gauging the Economics of Opportunity

$
0
0

THis is the overview from a new report, Best Cities for Minorities, Gauging the Economics of Opportunity by Joel Kotkin and Wendell Cox for the Center for Opportunity Urbanism. Read the full report here (pdf viewer).

This study provides an initial analysis of African-American, Latino and Asian economic and social conditions in 52 metropolitan regions currently and over the period that extends from 2000  to 2013. Our analysis includes housing affordability, median household incomes, self-employment rates, and population growth. Overall, the analysis shows that ethnic minorities in metropolitan regions with significant economic growth and affordable housing tend to do better than in other locations irrespective of the dominant political culture.

Understanding the dynamics of minority economic mobility is critical to the future of all Americans. If ethnic minorities may once have been viewed as a cultural afterthought in a primarily anglo society, they are
now unquestionably America’s future. According to the U.S. Census Bureau, minority children will outnumber white children by as early as 2020, and by 2050, non-white ethnic groups will equal the total number of White-non Hispanics in the population. These estimates likely understate the rate of ethnic transformation in the U.S. because of the country’s growing number of mixed race households.

For years America has been an anglo-dominated nation and ethnic groups largely peripheral societies all too frequently marginalized by discrimination, segregation and racial strife. If W.E.B. Dubois famously noted that “the problem of the twentieth century is the problem of the color line” at the beginning of the 20th century,” the great historian John Hope Franklin asserted that racial issues will continue to shape our society in the 21st.

Demographic trends suggest this is inevitable. Today, America’s ethnic population has surged to an unprecedented extent Latinos, together with African Americans and Asians, now constitute 43 percent of the population

in the country’s 52 largest metropolitan areas with a population of at least one million residents, which also comprise 55 percent of the total U.S. population. This is up from 35 percent in 2000.

African Americans, including new immigrants from the Caribbean and Africa, constitute 15 percent of the population, Hispanics are now 21 percent and Asians 7 percent. These areas. Today Latinos are the nation’s largest ethnic minority and Asians the fastest growing in percentage terms.

Despite the massive new and growing influence of ethnic minorities, there are surprisingly few studies comparing the economic performance of American’s burgeoning communities in different metropolitan areas. Fewer still have attempted to identify specific factors that correlate with the most and least favorable results in different regions. As the ethnic composition of America decisively shifts, it is vitally important to understand what regional factors work best to create and sustain economic and social opportunities for the nation’s emerging majority groups.

Overall we found that metropolitan areas with less burdensome regulations, especially those affecting land use and housing costs, tended to do better, in the survey, but not in every instance. Some areas with more restrictive regulations were also highly ranked if other factors, such as a proximity to a relatively robust government employment base (Washington D.C. and Baltimore regions), or rapid private sector growth (Asians in the San Jose area) were sufficiently strong to overcome adverse regulatory and tax burdens.

The data also show a strong contrast between America’s luxury cities, such as New York, San Francisco or Boston, where high costs have significantly reduced opportunities for middle and working class households, and “opportunity cities,” often located in less costly portions of the country like Texas or the South but that have also sustained more rapid and broadly based economic growth.

Although most, if not all, luxury cities sustain strongly progressive politics African-Americans, Asians and Latino households have done relatively worse in these locations; cities in the states with the more generous welfare provisions aimed to help the minority poor - notably California, New York and Illinois -  tended to perform worse than those that were less forthcoming, notably in the sunbelt. Ironically, in many of these places, such as metropolitan New York, Chicago, San Francisco and Los Angeles, the media and public officials may be the most adamant in attacking racial and class inequality, but their outcomes have been generally less than optimal.

Instead, America’s ethnic population growth, has shifted away from these slower growth, higher cost regions, irrespective of the level of public assistance or political ideology, towards opportunity cities where economic, housing and other policies provide greater chances of social advancement for middle and working class Americans of all races.

The implication of these findings is that America’s emerging majorities, like the Anglo communities before them, primarily desire and will populate regions where they can afford decent homes, earn higher incomes relative to the cost of living, and have greater independence and opportunity, as reflected in self-employment rates. These broad strategies do much more to enhance the lives of African-Americans, Asians and Latino households than the redistributive war on poverty-era programs employed in regions with high housing and living costs. These programs are usually not sufficient to improve the prospects of minorities if the business environment is burdened by high costs and regulatory burdens.

Minorities Head to Opportunity Cities

The data overwhelmingly show that minority populations are growing much faster in opportunity cities than in the more expensive, highly regulated luxury cities in the Northeastern corridor or on the west coast.iv In some cases, this has to do with the changing post-industrial nature of these economies. The increasing dependence on industries, such as software and social media, that employ few Latinos or African Americans. In Silicon Valley, African Americans and Hispanics make up roughly one-third of the valley population but barely five percent of employees in the top Silicon Valley firms.

Over the past forty years States such as Texas, Arizona, the Carolinas and Florida have seen their employment base grow far more rapidly and broadly in terms of manufacturing and other blue collar sectors than either California or the Northeast corridor.vi Generally, the leading metropolitan areas in the sunbelt also have overall enjoyed higher growth in population, income and self- employment and considerably higher rates for minority homeownership. “Luxury cities” such as described by
former New York Mayor Michael Bloomberg are generally not so good for minorities.

Read the full report (pdf viewer).

Joel Kotkin is executive editor of NewGeography.com and Roger Hobbs Distinguished Fellow in Urban Studies at Chapman University, and a member of the editorial board of the Orange County Register. He is also executive director of the Houston-based Center for Opportunity Urbanism. His newest book, The New Class Conflict is now available at Amazon and Telos Press. He is also author of The City: A Global History and The Next Hundred Million: America in 2050.  He lives in Los Angeles, CA.

Wendell Cox is principal of Demographia, an international public policy and demographics firm. He is co-author of the "Demographia International Housing Affordability Survey" and author of "Demographia World Urban Areas" and "War on the Dream: How Anti-Sprawl Policy Threatens the Quality of Life." He was appointed to three terms on the Los Angeles County Transportation Commission, where he served with the leading city and county leadership as the only non-elected member. He was appointed to the Amtrak Reform Council to fill the unexpired term of Governor Christine Todd Whitman and has served as a visiting professor at the Conservatoire National des Arts et Metiers, a national university in Paris.

Celebrating Strips Malls: Strength in Standardization

$
0
0

Our current urbanized form has become remarkably homogenous. Anywhere in Florida, and in much of the United States, one now experiences a new sense of sameness in the texture and the pace of places. America has entered a period of uniform buildings, roads, and infrastructure, differing only in the details. We live in a very standardized America today.

To witness the new homogeneity, look no farther than the commercial strips that have come to dominate the 21st century experience. These strips are our marketplace, our town square writ large, and are a study in careful, intentional uniformity. In commercial America, from New York to California, these strips are smoothly uniform in both their scale and their details to a startling degree, differentiated only by local geography.

This is the quiet strength of our country. Our commercial environment, although criticized for its aesthetic monotony, unifies our national experience. The endless asphalt strip expresses the contemporary American lifestyle, a way of ordering our space that represents our participation in the high-energy global economy. It’s ugly, but it works; so goes consumerism.

Businesses that compete for the customer dollar ensure familiarity and efficiency, and the uniformity extends to the design of the store, both inside and out. From the front door to the street, a precise series of moves are choreographed around the invisible practices of safety, security, and barrier-free flow from the car door to the cash register. All of these dictate uniformity of design, a certain monolithic character, which moves the customer effortlessly from merchandise to the point of sale to the driveway.

The driveway leads to the street. While we yearn for alternatives to the car, we still cling to its super mobility. Its influence results in a rigid, standardized design for all pavement. Lights, signs, intersections, and the pulse and rhythm of the road all become one. Gone, for the most part, are local eccentricities such as stoplights turned sideways; in their place are broad, well-lit roadways with the same signals everywhere, built with the future in mind. This, again, is a strength. Americans have always tended towards mobility, and standardization enables freedom of movement and a state of supermobility that is imagined, if not quite achieved.

Because America’s building industry climbed a series of regulatory steps in the last several generations, today’s built environment is more uniform and less specific to its particular locale, with a vague, broad national character that is barrier-free and safe. Starting with the 1992 Americans with Disabilities Act (ADA), and continuing today with the International Building Code, standardization has become a quiet but powerful force.

The ADA sought to remove the localized, obstacle-ridden geography that restricted a large population with sensory or mobility difficulties from having access to buildings and places. Since its passage, a substantial portion of our constructed world has been built under these rules, and older buildings have been adjusted to remove barriers. The result of this act has been to cause much of America to look the same, from the way our sidewalks rise up from the street to the size of our public bathrooms.

Building codes became standardized, too. In the 1990s, three regional codes converged into one International Building Code. With the real estate development economy normalized at a national scale, it has become more efficient to deliver the same product everywhere, rather than customize an office or a store to local eccentricities. Building codes, which go back to Hammurabi’s time, have evolved into exquisitely complicated texts, annotated like the Talmud and as complex as the tax code. This sameness, again, allows super-mobility and comparisons of sales and productivity metrics from one place to another. It smooths the evolution of a new, migratory America. This again is a strength, if efficiency is any measure.

Local codes still customize structures to particular locales; California requires resistance to seismic activity, and Florida protects against hurricanes. A lot of idiosyncratic localisms — nuances that did little to protect anybody — have been done away with, however. A wood building in the Midwest, for example, was called a Type Five building, while in the South it was Type Six, with accompanying detailed descriptions differing in little details. These were all melded into one, wood-frame building type by the new code, simplifying national-scale construction and design, and eliminating wastefulness. This convergence of codes promotes a common system of definitions and measures of firmness and safety.

Intertwined with this rather massive regulatory convergence is, of course, the globalization of the economy. Standardization of materials is critical for manufacturers importing key products from overseas, and for assuring national real estate developers of similar costs from coast to coast. Sameness is a virtue, from an accounting perspective.

Should this sameness be doubted, interview any offshore visitor about their American experience. While American behavior may generate complaints, the American built environment inspires awe and respect. “Why can’t we have this in our country,” more than one international guest has bitterly questioned me, usually pointing to a clean, well-ordered aspect of place that we take for granted. “America,” stated one South American to me recently, “is still the safest place to buy real estate, because of your standardization.” Monotony and safety features make for a dull sense of place, but great property values.

How this came about is a study in our faith in the future. America has always had faith that things will get better, even in the darkest of times. This belief in the future seems lost today if one focuses merely on the surface, and the general deterioration of our national conversation. Our actions, however, are different than our words, and our actions – widening roads, consolidating codes, standardizing infrastructure – are those of a people in the process of perfecting our built environment. Only a people that cares about the future would be doing this.

American roads and buildings are not precious; we are not a sentimental people, by and large, when it comes to our physical environment. The American style of place is a product of our society’s character. It is barrier-free, safe, and guarded well against disaster. Our character transcends the superficial notion of “style” and is expressed in a uniform, shared sense of place. Monotonous, yes; as all standardization tends to become, but with a great value placed upon planning and design.

A positive byproduct of this style of place is equity. Roads (except toll roads) can be travelled by all, and buildings are built safely for all. Another is efficiency, speeding up the process of rolling out new infrastructure. A final byproduct is the future; we are giving our children’s generation a simplified infrastructure with one operating manual.

What our progeny does with our standardized environment is up, of course, to them. Uniformity is a tacit scaffold upon which a unique, more localized future can be built, celebrating the specific geography and society of each individual place. Suffocating monotony can perhaps give way to flexibility, creativity, and a character that expresses our diversity as we move ahead.

Richard Reep is an architect with VOA Associates, Inc. who has designed award-winning urban mixed-use and hospitality projects. His work has been featured domestically and internationally for the last thirty years. An Adjunct Professor for the Environmental and Growth Studies Department at Rollins College, he teaches urban design and sustainable development; he is also president of the Orlando Foundation for Architecture. Reep resides in Winter Park, Florida with his family.

Flickr photo by Payton Chung, Meanwhile in Ethnoburbia: the new Chinatown in California's San Gabriel Valley.

The Changing Geography of Racial Opportunity

$
0
0

In the aftermath of the Baltimore riots, there is increased concern with issues of race and opportunity. Yet most of the discussion focuses on such things as police brutality, perceptions of racism and other issues that are dear to the hearts of today’s progressive chattering classes. Together they are creating what talk show host Tavis Smiley, writing in Time, has labeled “an American catastrophe.”

Yet what has not been looked at nearly as much are the underlying conditions that either restrict or enhance upward mobility among racial minorities, including African-Americans, Latinos and Asians. In order to determine this, my colleague at Houston-based Center for Opportunity Urbanism Wendell Cox and I developed a ranking system that included four critical factors: migration patterns, home ownership, self-employment and income.

We found, for all three major minority groups,   that the best places were neither the most liberal in their attitudes nor had the most generous welfare programs. Instead they were located primarily in regions that have experienced broad-based economic growth, have low housing costs, and limited regulation. In other words, no matter how much people like Bill de Blasio talk about the commitment to racial and class justice, the realities on the ground turn out to be quite different than he might imagine.

Southern Comfort

Perhaps the greatest irony in our findings is the location of many of the best cities for minorities: the South. This is particularly true for African-Americans who once flocked to the North for both legal rights and opportunity. Today almost all the best cities for blacks are in the South, a region that has enjoyed steady growth and enjoys generally low costs. Indeed, of the top 15 cities for African-Americans, 13 are in the old Confederacy starting with top-ranked Atlanta, No. 2 Raleigh, No. 4 Charlotte, No. 6 Virginia Beach-Norfolk, No. 7 Orlando, No. 8 Richmond (a distinction it shares with Miami and San Antonio), as well as   four of Texas’ large metro areas: No. 12 Houston, No. 13 Dallas-Ft. Worth and No. 8 San Antonio. The only two other metros are “inside the Beltway”: the metropolitan expanses of Washington and, surprisingly, Baltimore.

What accounts for this? Well, in Washington and Baltimore, the obvious answer is the federal government.  Roughly one in five black adults works for the government, and are far more likely to have a public sector job than non-Hispanic whites, and twice as likely as Hispanics. These are not the people who rioted in the inner city; most of them live in prosperous suburbs surrounding these cities. But outside the Beltway region, the explanations tend towards more basic economics, like job creation, low housing prices and better opportunities for starting businesses.

Ironically, blacks – 6 million of whom moved to the North during the great migration -- are once again voting with their feet, but back to the same region in which, for so long, they were so harshly oppressed.   Between 2000 and 2013, the African-American population of Atlanta, Charlotte, Orlando, Houston, Dallas-Fort Worth, Raleigh, Tampa-St. Petersburg and San Antonio all experienced growth of close to 40 percent or higher, well above the average of 27 percent for the nation’s 52 metropolitan areas with more than 1 million residents.  

In contrast, the African-American population actually dropped in five critically important large metros that once were beacons for black progress: San Francisco-Oakland, San Jose, Los Angeles, Chicago and Detroit.  In many cases, most notably in San Francisco, blacks have become the unintended victims of soaring housing prices and rampant gentrification, with little option to move to the also high-priced suburbs.   Today, suggests economist Thomas Sowell, the black population of the city itself is half that of 1970; the situation has changed so much that former Mayor Gavin Newsom even initiated a task force to address black out-migration.

Yet if many African-Americans can be seen “going home” to their native region, the South is also doing well among ethnic groups that have historically had little attachment to Dixie. For Latinos, now the nation’s largest ethnic minority, seven of the top 13 places are held by cities wholly or partially in the old Confederacy, led by No. 1 Jacksonville, Fla., as well as No. 4 Houston, No. 6 Virginia Beach, No. 7 Dallas-Ft. Worth, No. 9 Austin, No. 12 Tampa and #13 Orlando.The majority of newcomers to the South, notes a recent Pew study, are classic first-wave immigrants: young, 57 percent foreign-born and not well educated -- but they see the South as their land of opportunity.

In Florida, no stranger to Latino populations, Tampa-St. Petersburg, Orlando and Jacksonville all experienced Hispanic growth rates since 2000 between 100 and 150 percent, well above the average of 96 percent among the 52 metropolitan regions.  Lower housing costs and better prospects for advancement drive this change.  Despite their historically large populations in Texas, Latino populations still grew at a rapid rate in Houston, at 68 percent, Dallas-Ft. Worth at 70 percent and Austin, 83 percent.  "You go where the opportunities are," explains Mark Hugo Lopez, associate director of the Pew Hispanic Center in Washington, D.C.

Asian-Americans, although their economic and educational performance tends to be better than other minorities, follow a surprisingly similar pattern. Seven of the top 10 regions for them also were in the South, as well as two others, Washington and Baltimore, that abut the old Confederacy. Most of the best metros for Asians were in the Sunbelt, starting with No.1 Riverside-San Bernardino, Calif., No. 2 Richmond, No. 4 Raleigh, No. 5 Houston,   No. 7 Dallas-Ft. Worth, No. 8 Austin, No. 9 Las Vegas, No. 12 Phoenix, No. 13 Atlanta and No. 15 Jacksonville.

Like African-Americans and Latinos, Asians are voting for these places with their feet. Although Asian migration still is largely to California, that’s not where Asians are increasingly moving. Since 2000, Asian population growth in their traditional hubs like Los Angeles, San Francisco and San Jose was roughly one-third what was seen in the top Asian cities.

The New Geography of Racial Opportunity

Perhaps the biggest determinant of immigrant and minority opportunity has to do with home ownership. In the aftermath of the housing crash, minorities, notably blacks and Hispanics, suffered tremendous losses. This exacerbated the largest cause of the wealth gap  between minorities and whites: the extent of homeownership, which represents the key asset class for most Americans.

Whereas older whites may have been able to benefit from wildly inflated home values, the results for minorities, who are generally younger and newer to the market, are less satisfactory. One useful comparison can be drawn between two adjacent metropolitan regions, Los Angeles and Riverside-San Bernardino. House prices in Los Angeles are roughly twice as high, based on income; not surprisingly, minority home ownership is much lower there. Black homeownership in Riverside-San Bernardino (an area known as the Inland Empire) is over 40 percent, 10 points higher than in L.A.; for Asians it is 14 percent higher, and for Latinos the percentage difference with L.A.  is more than 20 points.

Some of the worst results -- in terms not only homeownership but income -- are ironically in those part of the country that purport to be most sympathetic to minority interests. In New York, Los Angeles and San Francisco, between 25 and 30 percent of African-Americans own their own home. In Atlanta it’s nearly 50 percent and well over 40 percent in most of the other Dixie metro areas.  

This is not likely to change soon. Black incomes in these Southern cities, where there is a much lower cost of living, are roughly the same as they are in super-blue New York, Los Angeles, Boston or San Francisco.  Much the same pattern can be seen for both Latinos and Asians, with the exception of San Jose, where Silicon Valley employment keeps their household income well north of $100,000 annually.

Policy Implications

What this study shows us is, if nothing else, the relative worthlessness of good intentions. As we have seen over the past 50 years, the expansion of transfer payments, while critical to alleviating the worst impacts of poverty, have not generally been best at promoting upward mobility for African-Americans and, increasingly, Latinos. If higher welfare costs and political pronunciamentos were currency, New York, Los Angeles, Boston and San Francisco would not be, for the most part, stuck in the second half of our rankings.

Ultimately what really matters are the economics of opportunity. Many of the cities that scored best for all three groups -- the Washington, D.C. area, Houston, Dallas-Fort Worth, San Antonio and Austin -- have enjoyed stronger than normal economic growth over the past decade.  In the areas around the nation’s capital, government employment has been a critical factor; in the other areas more generalized business growth has taken the lead.  In contrast, notes University of Washington demographer Richard Morrill , many regions that have seen rapid de-industrialization and slow housing growth have developed “barbell” economies based on a combination of ultra-high-wage industries, like technology and finance, and low-end service jobs.  

There are other policy implications. Blue state progressives are often the most vocal about expanding opportunities for minority homeownership but generally support land use and regulatory policies, notably in California, that tend to raise prices far above the ability of newcomers -- immigrants, minorities, young people -- to pay. Similarly blue state support for such things as strict climate change regulation tends to discourage the growth of industries such as manufacturing, logistics and home construction that have long been gateways for minority success.

Given the persistence of racial tensions, this data begins to give us a clearer understanding of what actually works for America’s emerging non-white majority. Denunciations of racism, police brutality and xenophobia may be all well and good for one’s sense of justice. But  if you want actually to improve the lives of minorities, we might consider focusing instead on policies that promote economic opportunity, keep living costs down, and allow for all Americans to enjoy fully the bounty of this country.

This piece first appeared at Real Clear Politics.

Joel Kotkin is executive editor of NewGeography.com and Roger Hobbs Distinguished Fellow in Urban Studies at Chapman University, and a member of the editorial board of the Orange County Register. He is also executive director of the Houston-based Center for Opportunity Urbanism. His newest book, The New Class Conflict is now available at Amazon and Telos Press. He is also author of The City: A Global History and The Next Hundred Million: America in 2050.  He lives in Los Angeles, CA.

Photo "asian american" by flicker user centinel.

Working at Home: In Most Places, the Big Alternative to Cars

$
0
0

Working at home, much of it telecommuting, has replaced transit as the principal commuting alternative to the automobile in the United States outside New York. In the balance of the nation, there are more than 1.25 commuters who work at home for each commuter using transit to travel to work, according to data in the American Community Survey for 2013 (one year). When the other six largest transit metropolitan areas are included (Los Angeles, Chicago, Philadelphia, Washington, Boston and San Francisco), twice as many people commute by working at home than by transit.

Overall, working at home leads transit in 37 of the 52 major metropolitan areas (over 1 million population in 2013).

The Top Ten

Not surprisingly, most of the strongest work at home markets are technology hubs. However, the strength of working at home, and particularly its growth in these metropolitan areas may seem at odds with the huge expenditures on urban rail. Nine of the top 10 working at home metropolitan areas have built or expanded rail systems, yet working at home has grown far faster than transit. The exception is Seattle, where transit has grown faster, but nearly all the increase has been on buses and ferries. Only two of the top ten metropolitan areas have larger transit shares than work at home shares.

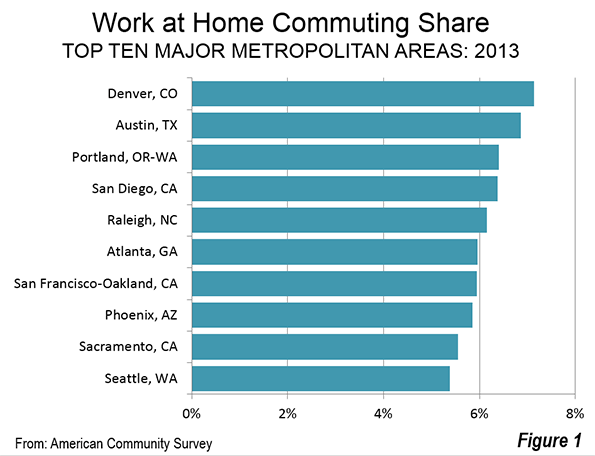
Here are the top 10 working at home major metropolitan areas (Figure). Market shares are shown to the second digit to eliminate ties.

  • Denver has the highest working at home commute share, at 7.14%. Like nine of the other top 10 major metropolitan areas, Denver has an urban rail system. Even so, Denver's transit work trip market share is a full third lower, at 4.41%. In 2000, working at home had only a lead over transit (4.58% v. 4.45%).
  • Technology hub Austin places a close second, at 6.87%. Austin's working at home commute share is nearly 3 times its 2.37% transit share. Working at home increased from 3.60% in 2000, while transit dropped from 2.51%, despite the addition of a rail line.
  • Portland, also a technology hub, and a decorated model among urban planners, ranks third in working at home commute share, at 6.40%. Transit share slightly smaller, at 6.37%. In 1980, however, transit's market share was nearly a third again its present level (8.4%), before the first of its six rail lines opened. In contrast, working at home has nearly tripled its share from 2.2% in 1980. In 2000, working at home attracted 4.60% of commuters in Portland, well below the 6.27% transit share.
  • San Diego ranks fourth in working at home, with a 6.38% market share. The California city built the first of the modern light rail lines in the early 1980s. San Diego's transit market share is approximately one half its working at home share (3.17 percent). In 2000, working at home had a commute share of 4.40%, while transit's share was 3.31%.
  • Raleigh, another technology hub, ranks fifth in working at home with a 6.16% market share. Raleigh is the only metropolitan area among the top 10 that does not have an urban rail system. Raleigh's transit work trip market share is 1.03%. In 2000, working at home had a commute share of 3.46%, while transit's share was 0.86%, modestly below the 2013 figure.
  • Atlanta ranks sixth in working at home, with a 5.96% market share. Atlanta has built more miles of high quality Metro (grade separated subway and elevated rail) than anywhere outside Washington and San Francisco in the last half century. Even so, Atlanta has experienced a more than 50% decline in its transit market share and now that share is barely half that of working alone (3.08%). In 2000, working at home had a commute share of 3.47%, while transit's share was 3.46%.
  • San Francisco, another technology hub, ranks seventh in working at home, with a 5.94% market share. San Francisco is unique in having a substantially higher transit than work at home market share (16.13%). San Francisco is the second strongest transit market in the United States, trailing only New York (30.86%). In 2000, working at home had a commute share of 4.27%, while transit's share was 13.77%.
  • Phoenix nearly equals San Francisco, with a 5.85% working at home market share. This is more than double the 2.61% transit market share. In 2000, working at home had a commute share of 3.66%, while transit's share was 1.93%.
  • Sacramento ranks 9th in working at home market share, at 5.56%, more than double its 2.65% transit work trip share. In 2000, working at home had a commute share of 4.03%, while transit's share was 2.67%.
  • Seattle, also a technology hub, has a working at home market share of 5.38%, for a ranking of 10th. Like San Francisco has a higher transit work trip market share (9.31%). In 2000, working at home had a commute share of 4.17%, while transit's share was 6.97%.

The work at home and transit market shares are indicted for each major metropolitan area in the table.

Where Working at Home is the Weakest

In most of the strongest transit metropolitan areas, as opposed to cities that have systems that simply are not so widely used, working at home doesn’t usually achieve second place to cars.  As noted above, San Francisco has a considerably stronger transit share than virtually any major metropolitan area outside New York.

New York, by far the largest transit market in the United States, is also the largest work at home market in raw numbers (386,000). Yet, New York's transit market share (30.86%) is seven times its work at home share (4.17%).

Chicago, Washington and Boston have transit market shares approximately three times that of working at home, while Philadelphia's transit share is 2.5 times as high.

This is not to say that working at home is in decline. Strong working at home gains --- nearly 50% to over 100% from 2000 to 2013 --- were made in each of these six metropolitan areas. Yet, with its smaller base, working at home is not likely to exceed transit in the near future.

Los Angeles is a possible exception. Since 2013, working at home has closed approximately 60% of the gap with transit. Continuation of present trends would have working at home becoming the most popular alternative to cars in Los Angeles before 2020.

The Future?

Working at home has grown despite having received little attention in urban planning, compared to that of expensive rail projects. Its success has eliminated millions of daily work trips, reduced greenhouse gases and responded to the desire for better lifestyles by many. With continuing improvements in technology, and higher acceptance among companies and government agencies, working at home seems likely to continue its growth in the coming decades.


Work at Home to Transit Commuting Ratio
Major Metropolitan Areas: 2013
Metropolitan AreaWork at Home Work Trip ShareTransit Work Trip ShareWork at Home Commuters per Transit Commuter
Atlanta, GA5.96%3.08%1.93
Austin, TX6.87%2.37%2.89
Baltimore, MD4.10%6.79%0.60
Birmingham, AL2.79%0.78%3.57
Boston, MA-NH4.46%12.76%0.35
Buffalo, NY2.62%2.92%0.90
Charlotte, NC-SC5.19%1.74%2.98
Chicago, IL-IN-WI4.32%11.75%0.37
Cincinnati, OH-KY-IN3.85%2.17%1.78
Cleveland, OH3.80%3.25%1.17
Columbus, OH4.14%1.69%2.44
Dallas-Fort Worth, TX4.98%1.39%3.58
Denver, CO7.14%4.41%1.62
Detroit,  MI3.52%1.68%2.09
Grand Rapids, MI4.22%1.62%2.61
Hartford, CT3.50%3.07%1.14
Houston, TX3.69%2.37%1.56
Indianapolis. IN3.93%1.12%3.51
Jacksonville, FL4.99%1.07%4.66
Kansas City, MO-KS4.08%1.22%3.35
Las Vegas, NV3.18%3.47%0.92
Los Angeles, CA5.13%5.84%0.88
Louisville, KY-IN2.77%1.71%1.63
Memphis, TN-MS-AR2.37%1.15%2.07
Miami, FL4.76%4.07%1.17
Milwaukee,WI3.52%3.65%0.96
Minneapolis-St. Paul, MN-WI4.88%4.64%1.05
Nashville, TN4.50%1.02%4.43
New Orleans. LA2.67%2.70%0.99
New York, NY-NJ-PA4.17%30.86%0.13
Oklahoma City, OK3.07%0.54%5.74
Orlando, FL5.05%1.73%2.92
Philadelphia, PA-NJ-DE-MD3.99%10.00%0.40
Phoenix, AZ5.85%2.61%2.25
Pittsburgh, PA3.71%4.89%0.76
Portland, OR-WA6.40%6.37%1.01
Providence, RI-MA3.23%2.68%1.21
Raleigh, NC6.16%1.03%5.96
Richmond, VA4.25%1.34%3.18
Riverside-San Bernardino, CA5.00%1.46%3.42
Rochester, NY3.39%2.53%1.34
Sacramento, CA5.56%2.65%2.10
Salt Lake City, UT5.13%3.25%1.58
San Antonio, TX4.33%2.51%1.72
San Diego, CA6.38%3.17%2.01
San Francisco-Oakland, CA5.94%16.13%0.37
San Jose, CA4.05%4.24%0.96
Seattle, WA5.38%9.31%0.58
St. Louis,, MO-IL4.09%2.91%1.40
Tampa-St. Petersburg, FL5.11%1.38%3.70
Virginia Beach-Norfolk, VA-NC3.38%1.71%1.98
Washington, DC-VA-MD-WV5.02%14.16%0.35
From: American Community Survey, 2013 (One Year)


Wendell Cox is principal of Demographia, an international public policy and demographics firm. He is co-author of the "Demographia International Housing Affordability Survey" and author of "Demographia World Urban Areas" and "War on the Dream: How Anti-Sprawl Policy Threatens the Quality of Life." He was appointed to three terms on the Los Angeles County Transportation Commission, where he served with the leading city and county leadership as the only non-elected member. He served as a visiting professor at the Conservatoire National des Arts et Metiers, a national university in Paris. Wendell Cox is Chair, Housing Affordability and Municipal Policy for the Frontier Centre for Public Policy (Canada), is a Senior Fellow of the Center for Opportunity Urbanism and is a member of the Board of Advisors of the Center for Demographics and Policy at Chapman University.

Photo by By Rae Allen, "My portable home office on the back deck"

Flexible Economic Opportunism: Beyond Diversification in Urban Revival

$
0
0

Discouraging employment data have recently dampened optimism about America’s economic recovery. These challenges are nothing new for developed regions long beset by manufacturing decline amidst globalization. Exemplars of this trend, America’s rust belt cities have battled unemployment, decaying infrastructure, and social challenges since economic decline emerged in the 1960s. In response, some now cultivate service, knowledge, and tourism industries. Explaining these new growth models, analysts often espouse the virtues of diversification. However, legacy industrial systems and native constraints (e.g. geography and culture) can hinder this strategy. Chasing diversification for its own sake diverts policy attention from a more valid determinant of growth. Post-industrial urban policy should target structural flexibility, enabling diversification or specialization – neither deserving preeminent status – to occur naturally.

In exploring rival economic development strategies, two management theories are particularly relevant: Michael Porter’s competitive advantage and Harry Markowitz’s portfolio theory. Competitive advantage describes the strategic orientation of business operations and brand image to command an inimitable market position. Portfolio theory is the logic behind investment diversification to maximize returns for given risk preferences. In management, these are not rival theories. However, when applied to urban economic development they present a direct contrast. The former can be likened to specialization, and the latter to diversification.

In attempting to revive their economies, cities often reduce strategic options to the simple dichotomy of specialization versus diversification. Some compromise by favoring a primary industry and enabling the emergence of secondary industries. Economic orthodoxy generally argues that diversification is the wiser choice in volatile economies. This portfolio-style approach assumes that stability in one industry offsets decline in another. This argument is convincing: many “single-engine” economies have underperformed amidst globalization. Besides the usual cases, overlooked examples are Oakland, California (shipbuilding and automobiles), Birmingham, Alabama (steel), and upstate South Carolina (textiles). A similar fate befell the British Midlands and German Ruhr Valley, where recovery strategies have generated mixed results. Instability in single-industry dependence is not limited to manufacturing. Las Vegas, where the pro-cyclical tourism mirrors national economic trends, remains fairly irrelevant outside its casinos and related industries.

By contrast, many successful cities boast diversified economies. New York has a path-dependent advantage in finance, with recent volatility offset by tourism, business services, and the arts. The 1986 collapse in oil prices tested the resilience of Sunbelt boomtown Houston, whose shipping industry offset energy sector declines while banking, finance, and healthcare kept the city competitive. Large cities are naturally more diversified, but smaller cities can also exhibit diversification: examples are Austin, Texas (research, education, and technology), Nashville, Tennessee (entertainment, insurance, and health care), and Tampa, Florida (military, tourism, trade, and retirement services). Austin added jobs even during the 2008 recession, and has routinely been labelled the nation’s best-performing economy in recent years. These examples show that economic resilience is dependent more on diversified industrial portfolios than on size.

Nevertheless, a larger story underlies America’s revitalization champions. While the flag of diversification flies high, at the base of the pole stands structural flexibility, arguably a more durable, achievable, and powerful mechanism for growth. Cities prepared to re-orient towards emerging opportunities maintain development potential across economic cycles. Furthermore, flexibility gives cities of any size hope for transformative growth. Not every city has the native advantages to meaningfully diversify, but flexibility can be their wild-card strategy.

Two former manufacturing cities have exhibited post-industrial flexibility: Pittsburgh and Bilbao. Once the pride of America’s post-WWII steel industry, Pittsburgh suffered a precipitous decline in the 1980s as manufacturing moved overseas. 200,000 jobs and nearly half the population were lost. However, Pittsburgh’s situational advantages provided a flexible platform for revival. Well-endowed cultural institutions and flourishing medical, education, and research sectors supported a lifestyle economy based on knowledge, services, and creative entrepreneurship. Pittsburgh’s economic performance was seventh best in the nation during the 2008 recession, an example of how flexible planning, private sector creativity, and situational advantages converged to make progress halting seemingly irreversible decline. Similarly, Bilbao, Spain, sharply declined after the withdrawal of manufacturing. Without its economic engine and facing crisis-level unemployment, it creatively turned to tourism and culture. The government’s stated commitment to collaborative policy making and quality-of-life now complements efforts to sustain post-industrial competitiveness. Like Pittsburgh, Bilbao has used flexible, opportunistic planning to pursue economic growth.

Despite their highly publicized transformations, however, these post-industrial success stories are not without challenges. The Pittsburgh metropolitan area has failed to gain population for years, and lost nearly 5,000 residents between mid-2013 and mid-2014. The city’s stagnant job growth has led some claim that Pittsburgh’s amenities, rather than employment opportunities, are a relocation magnet. Others claim that flat overall job growth conceals local economic restructuring, as manufacturing industries give way to the creative sector. Despite recent signs of a recovery, Spain’s persistent unemployment (23.8% in the first quarter of 2015) indicates that the nation, and particularly secondary cities such as Bilbao, continues to struggle in the stubborn wake of the 2010 euro crisis. Further, Bilbao’s top-down approach of museum-based revitalization has failed to generate vitality in the grassroots cultural scene, where artists have collectively mobilized but still struggle to obtain financial support.

Manchester has recently enjoyed consistent growth, and is now considered the UK’s healthiest economy outside of London. Like Pittsburgh and Bilbao, the city experienced rapid mid-century decline with the closure of its shipping port and loss of heavy manufacturing. The city’s economic revival has pivoted towards knowledge, services, and entertainment, a strategy attracting recognition for liveability and cultural vibrancy. Financial services now outsize manufacturing and engineering, with no single industry representing more than 16% of the economy. Poised to benefit further from devolutionary reforms and “northern powerhouse” status, Manchester has garnered recognition for its economic diversity and entrepreneurial spirit. The city exemplifies a flexible approach to post-industrial development, particularly for a hinterland region overshadowed by a dominant neighbour (London).

Other efforts at revitalization, however, have produced lesser results. Like Pittsburgh and Bilbao, Cleveland’s steel industry flourished in the mid-20th century before industrial decline gutted the city of jobs and population. In 1969 the emblematic Cuyahoga River fire brought national attention to Cleveland’s economic crisis. Since 1990 the city has caught fire once again – in a revival driven by services, tourism, and entertainment. Global connections in knowledge industries and education complement Cleveland’s flexible economic vision. However, the city still struggles with disinvested neighbourhoods, ageing infrastructure, and regional competition from Pittsburgh, where flexible strategies also target culture and technology.

Taken superficially, these revival cases support the concept of diversification. Cities focusing on a singular competitive advantage – geography, image, or path-dependent conditions – tend to specialize but often struggle to re-configure inflexible industrial infrastructure for new opportunities. Regardless, specialization versus diversification is a false choice. Beyond this continuum, the true survival instinct is structural flexibility. Diversification often correlates with overall growth but is more a lagging indicator of opportunistic preparedness. Flexible policy broadens structural capabilities and builds resilience into urban systems, in either a specialized or diversified economy. The outputs include infrastructure both hard (transport, technology and housing) and soft (education, culture, and institutions). In providing platforms for investment that adapt to global trends, this strategy transforms industrial determinism into flexible economic opportunism.

Kris Hartleyis a visiting researcher at Seoul National University and PhD Candidate at the National University of Singapore, Lee Kuan Yew School of Public Policy. For more details about his argument, see his book Can Government Think? Flexible Economic Opportunism and the Pursuit of Global Competitiveness.

Better Suburbs = Better Cities: Employment and the Importance of the Suburban Economy

$
0
0

Australia’s inner city areas and CBDs are a focus of media and public policy attention, with good reason. But it’s also true that the real engines of employment are outside the inner city areas and that the dominant role of our suburban economy as an economic engine is grossly understated, even ignored. This is not good public policy. It’s not even common sense. 

I have a view that the focus on urban renewal and inner urban economic development has become a policy obsession of late. It’s the trendy thing to quote Richard Florida’s ‘creative class’ theories which become the excuse to increasingly spoil inner city workers with transport, cultural and other forms of taxpayer funded infrastructure. There was a time when inner city areas, if not recapitalised, risked pockets of blight. But those days have passed. Today, it is the suburban landscape – much derided in fashionable inner city policy circles – that risks pockets of blight if not brought back to the attention of policy makers and strategically recapitalised.

The imperative is simple: the suburban economy is so much larger than inner city areas. As a rule of thumb, between 8 and 9 out of ten jobs in our major metro regions of Brisbane, Sydney and Melbourne are suburban. Only one in ten or at most two in ten, are found in the inner city areas. Achieving a 10% improvement in the suburban economic engine is hypothetically equivalent to achieving an 80% improvement in the economic performance of the inner cities. 

So why this preoccupation with the inner cities to the detriment of the suburbs?

First, a quick review of the evidence as provided in the Census. 

In Brisbane, the CBD itself accounts for 12.5% of the Brisbane region’s employment numbers – one in eight. The combined CBD and inner city areas – including the CBD - account for around 170,000 jobs.  That’s not a very big number.  As a proportion of state-wide jobs, it’s less than 9%. As a proportion of the 925,000 jobs across the metro region of Brisbane, it’s less than one in five – and that’s with including the near city areas like South Brisbane, Fortitude Valley and Spring Hill. 

In Sydney in 2011, the CBD accounted for only 8.3% of all jobs in New South Wales, and for only 13.4% of all jobs in wider metropolitan Sydney. Including the surrounding areas of Pyrmont, Ultimo, Potts Point, and Woolloomooloo raises this share to just 9.7% of all jobs in the state and 15.6% of jobs in metropolitan Sydney. So one in ten state-wide jobs and one in every six or seven metro wide jobs. 

In Melbourne, the CBD is home to just 7.6% of the state’s total employment, and to just 10.6% of all jobs in greater Melbourne. Including the ‘fringe’ locations of Docklands and Southbank sees this share rise to only 10.3% of the state and 14.3% of greater Melbourne, which is one in ten of all jobs in the state and one in seven metro wide jobs.

In none of these centres is the concentration of inner city jobs close to one in four metro wide jobs. Yet if you asked a room full of people – industry and planning experts included –a significant proportion will think the figures are much higher. I’ve done this several times at workshops and presentations and there are a worrying proportion of people who seem to think the figure is more than 50%. A wider survey of the general public might even put the figure higher – it would be an interesting exercise to find out.

Suburban employment centres are by nature much more widely dispersed. Teachers, doctors, dentists, tradies, factory workers, shop workers and so on do not rely on close proximity to each other to perform their work, as do CBD employment markets. In the suburban business districts of our metro regions, workforce concentrations typically fall into a band somewhere between 3,000 and 5,000 jobs per square kilometre. Places with super-regional shopping centres will tend to be at the upper end of that scale while industrial areas at the lower end. CBDs, by contrast, can easily have pockets where the employment density sails past 10,000 or 20,000 jobs per square kilometre.

But however dispersed these suburban jobs may be, it doesn’t make them any less important to the economy – particularly given their dominant role as employment and economic engines.

So why then the preoccupation with the inner cities and why the dearth of policy interest in the suburbs? 

Perhaps the inner cities are seen as more glamorous? There are more higher paying jobs and more CEOs to the square mile than anywhere else. It’s where cultural facilities and seats of government are found. It’s where the most expensive real estate is. Basically, any concentration of money plus power is always going to grab attention. It’s an age when celebrity tweets capture more media and public attention than important issues of economic policy. The CBDs and inner city areas are widely seen as ‘where it’s at’ and where the cool people are. ‘Nuff said?

Sadly, even policy makers seem to have fallen for the inner city bling over suburban substance. The importance of transport workers, freight workers, teachers, doctors, tradies or suburban white collar employment to the economy receives next to no policy comment. The performance of suburban transport systems, the need to promote higher employment density in key centres, the pathways by which property owners could be encouraged to partner with public sector agencies for suburban centre improvement – none of these seem to appear as workshop or forum topics promoted by any of the leading industry groups. 

I suspect there’s also a strong element of cultural cringe as it applies to our suburban heritage. Frequently mocked as a cultural wasteland or ‘home of the bogan’, there’s an almost desperate desire to prove we’re an advanced society by focussing on the lifestyles and achievements of our inner city areas and the people who live and work there, to the exclusion of all else. ‘Urbanists’ grab headlines and appear as keynotes at any number of planning conferences. Sub urbanists (and there are plenty of them) are evidently persona non grata.

It’s as if a prosperous, successful and highly efficient suburban economy simply doesn’t cut it in the global race for attention and status amongst cities, which seems almost exclusively focussed on the how much like downtown New York or downtown Paris every other city can pretend to be. 

The reality is that the inner city economy is reliant on – not divorced from – the performance of the suburban economy. In the same way that there can be no public sector without a profitable private sector, I suggest that a strong and prosperous inner city economy relies heavily on a strong and prosperous suburban economy. And in the same way that strategic infrastructure and policy decisions are needed for the inner city to operate at optimum efficiency, the exact same applies to suburban economies.  

The question is whether this balance is being achieved.

Ross Elliott has more than 20 years experience in property and public policy. His past roles have included stints in urban economics, national and state roles with the Property Council, and in destination marketing. He has written extensively on a range of public policy issues centering around urban issues, and continues to maintain his recreational interest in public policy through ongoing contributions such as this or via his monthly blog The Pulse.

A Leaky Economy

$
0
0

Real gross domestic product is growing at an anemic pace. Exports are down, and state and local governments are spending less. The consumer price index is falling in a condition known as deflation. Even national defense spending is down. Despite the bad news, consumer spending and home building are rising. Real disposable personal income is roaring ahead at growth rates of 6.2 percent in the first quarter of 2015 and 3.6 percent at the end of 2014. Even the personal savings rate is up (5.5 percent so far this year and 6.2 percent at the end of 2014). These consumer factors are attributed to an increase in government social benefits, though, and not to jobs and economic prosperity. Social Security makes payments to more than 64 million Americans and nearly 3 million more receive federal government retirement checks. More than 20 percent of the US population is basically living on fixed-incomes.

The banks also continue to benefit from government largess. The Federal Reserve’s Open Market Committee has been holding onto the view“that the current 0 to 1/4 percent target range for the federal funds rate remains appropriate” for more than five years. The stated purpose of offering this free money to banks is to maintain high employment. Although the Fed declines to set a specific goal, they generally believe that the unemployment rate should be around “5.2 percent to 6.0 percent.” For perspective, the US unemployment rate averaged 6.15 percent last year (2014); compare that to an average unemployment rate of 4.62 percent in 2007, the year before the financial crisis that was the reason for dropping the federal funds rate to zero.

The offsetting condition that could thwart the Fed’s efforts to bolster the economy is high inflation – too much money chasing too few goods. The Fed has a stated goal of keeping inflation at or below 2%. As long as there are enough people working, producing plenty of goods and having money to spend on those goods, inflation this should not be a problem. In the 12 months just ended, consumer prices fell 0.1 percent. In 2007, prices rose about 2.1 percent. The most recent peak inflation was nearly 6 percent in 2008 and the peak deflation was about -2.4 percent in 2009.

As long as there is some unemployment, wages and prices will not rise too rapidly – if we had more jobs than workers there would be a tendency for employers to bid up wages in trying to attract the best workers. But we are facing the opposite situation. Despite so much Federal Reserve money pouring into banks, the economy is slowing and deflating.

There is worse news. Corporate fixed investment is running higher than the cash being generated by businesses. This was true in 2007 right before the crash and also in 1977 when Hyman Minsky wrote about “the era of the post-World War II financial crunches, squeezes, and debacles.” Corporations investing more than they are earning is the kind of event the Fed means when they write: “The Committee currently anticipates that, even after employment and inflation are near mandate-consistent levels, economic conditions may, for some time, warrant” continuing their loose money policy. They are referring to exactly this condition where an incipient financial crisis can be triggered by increases in interest rates.


Borrowing to Make Ends Meet: Then

$ Billions

2003

2004

2005

2006Q4

2007Q3

Internal funds (US)

732.0

850.7

1061.3

747.2

782.4

Internal funds (total)

831.3

928.4

995.0

935.8

912.3

Fixed investment

747.5

788.3

889.7

1000.6

1057.0

Source: Flow of Funds, Table F.102 Nonfarm Nonfinancial Corporate Business March 6, 2008 (Federal Reserve System, Washington, D.C.)

Borrowing to Make Ends Meet: Now

$ Billions

2010

2011

2012

2013Q4

2014Q4

Internal funds (US)

1520.4

1575.2

1569.2

1607.2

1590.2

Internal funds (total)

1676.7

1728.5

1761.0

1844.6

1782.6

Fixed investment

1178.6

1297.4

1415.2

1512.9

1681.0

Source: Flow of Funds, Table F.103 Nonfinancial Corporate business March 12, 2015 (Federal Reserve System, Washington, D.C.)


The reasoning is quite simple: if businesses are investing more than they are making, they must be borrowing to do it. Fixed investment – the construction of things like buildings, plants and factories – has to be paid for before it produces income. That means taking a lot of short term loans, refinancing them when they come due and sometimes borrowing a little more to cover the interest due on the last loan. If interest rates rise between the planning phase and when the completed project starts generating revenue, that is what triggers Minsky’s “incipient” financial crisis. The only difference between the gap in 2007 and the gap in 2014 is that some of it is being made up by foreign earnings – a source that may not hold up as Europe teeters on its third recession in six years, China’s growth slows and Japan continues to struggle. The possibility of the Fed raising interest rates is receding further and further into the future.

Falling prices and low interest rates might sound like “good” things. They are not. Low interest rates favor borrowers (and speculators) but it harms the elderly and baby-boomers going onto pensions because it reduces the rate of return they can earn on their safe-harbor investments like savings accounts and government bonds. Speculators in stocks, real estate, collectibles, etc. make out in a low-interest rate environment with deflation. Safe-and-sound investors are more likely to lose because they are more likely to depend on interest for income. This is especially true for households living on fixed incomes and have a low tolerance for investment risk.

This is another Lesson Not Learned by US policymakers: Banks and businesses find a way around Fed policy while consumers take it on the chin. We will all be better off when businesses depart from the crony-capitalist cycle of dependency on Federal Reserve hand outs. The business and consumer winners in the post-Capitalist society will be the ones who learn to accumulate human-capital knowledge instead of staking the health of the economy on financial capital. Capital flows are characterized by panics and manias. It will take human knowledge to resolve the financial crises that follow.

Susanne Trimbath, Ph.D. is CEO and Chief Economist of STP Advisory Services. Dr. Trimbath’s credits include appearances on national television and radio programs and the Emmy® Award nominated Bloomberg report Phantom Shares. She appears in four documentaries on the financial crisis, including Stock Shock: the Rise of Sirius XM and Collapse of Wall Street Ethicsand the newly released Wall Street Conspiracy. Dr. Trimbath was formerly Senior Research Economist at the Milken Institute. She served as Senior Advisor on United States Agency for International Development capital markets projects in Russia, Romania and Ukraine. Dr. Trimbath teaches graduate and undergraduate finance and economics.

Photo: "Federal Reserve" by Dan Smith - Own work. Licensed under CC BY-SA 2.5 via Wikimedia Commons.

The Best Cities For Jobs 2015

$
0
0

Since the U.S. economy imploded in 2008, there’s been a steady shift in leadership in job growth among our major metropolitan areas. In the earliest years, the cities that did the best were those on the East Coast that hosted the two prime beneficiaries of Washington’s resuscitation efforts, the financial industry and the federal bureaucracy. Then the baton was passed to metro areas riding the boom in the energy sector, which, if not totally dead in its tracks, is clearly weaker.

Right now, job creation momentum is the strongest in tech-oriented metropolises and Sun Belt cities with lower costs, particularly the still robust economies of Texas.

Topping our annual ranking of the best big cities for jobs are the main metro areas of Silicon Valley: the San Francisco-Redwood City-South San Francisco Metropolitan Division, followed by San Jose-Sunnyvale-Santa Clara, swapping their positions from last year.

Our rankings are based on short-, medium- and long-term job creation, going back to 2003, and factor in momentum — whether growth is slowing or accelerating. We have compiled separate rankings for America’s 70 largest metropolitan statistical areas (those with nonfarm employment over 450,000), which are our focus this week, as well as medium-size metro areas (between 150,000 and 450,000 nonfarm jobs) and small ones (less than 150,000 nonfarm jobs) in order to make the comparisons more relevant to each category. (For a detailed description of our methodology, click here.)

An Economy Fit For Geeks

Venture capital and private-equity firms keep pouring money into U.S. technology companies, lured by the promise of huge IPO returns. Last year was the best for new stock offerings since the peak of the dot-com bubble, with 71 biotech IPOs and 55 tech IPOs. It’s continuing to fuel strong job creation in Silicon Valley. Employment expanded 4.8% in the San Francisco Metropolitan Division in 2014, which includes the job-rich suburban expanses of San Mateo to the south, and employment is up 21.2% since 2009. This has been paced by growth in professional business services jobs in the area, up 9% last year, and in information jobs, which includes many social media functions – information employment expanded 8.3% last year and is up 28.7% since 2011.

San Jose which, like San Francisco, was devastated in the tech crash a decade ago, has also rebounded smartly. The San Jose MSA clocked 4.9% job growth last year and 20.0% since 2009. Employment in manufacturing, once the heart of the local economy, has grown 8% since 2011, after a decade of sharp reversals, but the number of information jobs there has exploded, up 16% last year and 35.7% since 2011.

Meanwhile, there’s been a striking reversal of fortune in the greater Washington, D.C., area, while the greater New York area has also fallen off the pace. In the years after the crash, soaring federal spending pushed Washington-Arlington-Alexandria to as high as fifth on our annual list of the best cities for jobs; this year it’s a meager 47th, with job growth of 1.5% in 2014, following meager 0.2% growth in 2013, while Northern Virginia (50th) and Silver Spring-Frederick-Rockville (64th) also lost ground, dropping, respectively, five and 15 places.

Job growth has also slowed in the greater New York region, which also was an early star performer in the immediate aftermath of the recession, in part due to the bank bailout that consolidated financial institutions in their strongest home region. Virtually all the areas that make up greater New York have lost ground in our ranking: the New York City MSA has fallen to 17th place from seventh last year, as employment growth tailed off to 2.6% in 2014 from 3.2% in 2013. Meanwhile Nassau-Suffolk ranks 49th, Rockland-Westchester 60th and Newark is second from the bottom among the biggest metro areas in 69th place.

The Shift To ‘Opportunity Cities’ Continues

Not every tech hot spot has the Bay Area’s advantages, which include venture capital, the presence of the world’s top technology companies and a host of people with the know-how to start and grow companies.

But other metro areas have something Silicon Valley lacks: affordable housing. Most of the rest of our top 15 metro areas have far lower home prices than the Bay Area, or for that matter Boston, Los Angeles or New York. And they also have experienced strong job growth, often across a wider array of industries, which provides opportunities for a broader portion of the population.

The combination of lower prices and strong job opportunities are what earns them our label of “opportunity cities.” The Bay Area may attract many of the best and brightest, but it is too expensive for most. Despite the current boom, the area’s population growth has been quite modest — San Jose has had an average population growth rate of 1.5% over the past four years. In contrast, seven of our top 10 metro areas, including third place Dallas-Plano-Irving, Texas, and No. 4 Austin, Texas, are also in the top 10 in terms of population growth since 2000. If prices and costs are reasonable, people will go to places where work is most abundant.

In the Dallas metro area, the job count grew 4.2% last year, paced by an 18.6% expansion in professional business services, while overall employment is up 15.7% since 2009. Job growth last year in Austin, Texas, was a healthy 3.9%, while the information sector expanded by 4.7% and since 2011 by 17.8%.

Many Texas cities, of course, have benefited from the energy boom — the recent downturn in oil prices make it likely that growth, particularly in No. 6 Houston, will decelerate in coming years.

But what is most remarkable about the top-performing cities is the diversity of their economies. Most have tech clusters, but several, such as Houston, Nashville, Tenn., Dallas and Charlotte, N.C., have growing manufacturing, trade, transportation and business services sectors. The immediate prognosis, however, may be brightest in places like Denver and Orlando, where growth is less tied to energy than business services, trade and tourism. Nashville, which places fifth on our list, has particularly bright prospects, due not only to its growing tech and manufacturing economy, but also its strong health care sector which, according to one recent study, contributes an overall economic benefit of nearly $30 billion annually and more than 210,000 jobs to the local economy.

The Also-Rans

Some economies lower in our rankings have made strong improvements, notably Atlanta-Sandy Spring-Roswell, which rose to 12th this year, a jump of 12 places. Long a star performer, the Georgia metro area stumbled through the housing bust, but it appears to have regained its footing, with strong job growth across a host of fields from manufacturing and information to health, and particularly business services, a category in which employment has increased 24% since 2009.

In California, one big turnaround story has been the Riverside-San Bernardino area, which gained six places to rank 11th this year as it has again begun to benefit from migration caused by coastal Southern California’s impossibly high home prices.

Several mid-American metro areas also are showing strong improvement. Louisville-Jefferson County, Ky., jumped fifteen places to 21st, propelled by strong growth in manufacturing, business services and finance. Kansas City, Kan. (23rd), and Kansas City, Mo. (46th), both made double-digit jumps in our rankings. In Michigan, Detroit-Dearborn-Livonia, bolstered by the recovery of the auto industry, gained six places to 59th, while manufacturing hub Warren-Troy-Farmington Hills picked up two to 39th. These may not be high growth areas, but these metro area no longer consistently sit at the bottom of the list.

Losing Ground

One of the biggest resurgent stars in past rankings, New Orleans-Metairie, dropped 17 places to 43rd, while Oklahoma City fell 17 places to 33rd. These cities lack the economic diversity to withstand a long-term loss of energy jobs if the sector goes into a prolonged downturn.

Yet perhaps the most troubling among the also-rans are the metro areas that have remained steadily at the bottom. These are largely Rust Belt cities such as last place Camden, N.J., which has been at or near that position for years.

Future Prospects

Now the best prospects appear to be in tech-heavy regions, but it’s important to recognize that a key contributor to the tech sector’s frenzy of venture capital and IPOs had been the Federal Reserve’s unprecedented monetary interventions, which are now phasing out. As it is, headwinds to expansion in the Bay Area are strong. High housing prices, according to recent study, may make it very difficult for these companies to expand their local workforces. The median price of houses in tech suburbs like Los Gatos now stand at nearly $2 million — rich for all but a few — while downtown Palo Alto office rents have risen an impossible 43% in the last five years.

Companies like Google, which has run into opposition over its proposed new headquarters expansion, may choose to shift more employment to other tech centers, such as Austin, Denver, Seattle, Raleigh and Salt Lake City, where the cost of doing business tends to be less. Similarly the stronger dollar could erode the modest progress made by some industrial cities, such as Detroit and Warren, as it gives a strong advantage to foreign competitors.

Normally we would expect these processes to play out slowly. But in these turbulent times, it’s best to keep an eye out for disruptive changes — a new economic cataclysm, should one occur, could quickly shift the playing field once again.

Joel Kotkin is executive editor of NewGeography.com and Roger Hobbs Distinguished Fellow in Urban Studies at Chapman University, and a member of the editorial board of the Orange County Register. He is also executive director of the Houston-based Center for Opportunity Urbanism. His newest book, The New Class Conflict is now available at Amazon and Telos Press. He is also author of The City: A Global History and The Next Hundred Million: America in 2050.  He lives in Los Angeles, CA.

Michael Shires, Ph.D. is a professor at Pepperdine University School of Public Policy.


Volcano Urbanism

$
0
0

Before I get to the urbanism portion of this post I need to do a quick geography and geology lesson for those readers who are unfamiliar with Hawaii. The state is made up of a chain of islands: Oahu, Maui, Kauai, Molokai, Lanai, the Big Island (that’s the largest island called “Hawaii”) and numerous lesser islands. All the islands formed from the same volcanic hot spot on the sea floor over a period of 70 million years.

Screen Shot 2015-05-25 at 1.13.56 AM
Google

Screen Shot 2015-05-23 at 7.12.16 PM

DSC_6314 Picture 082 DSC_7911 Lava (2)

lava_6687

The hot spot continually pushes up molten lava from the center of the Earth forming new islands. Over time the plates of the Earth’s crust drift carrying the old islands away while a new island forms at the hot spot. The old islands gradually erode, shrink, and disappear under the sea, while a new underwater mountain gradually pushes its way up to the surface. At the moment the youngest island is the Big Island and it’s still growing in size. These Hawaiian volcanoes aren’t the kind that lay dormant for centuries and then suddenly erupt like Mount Saint Helens, Vesuvius, or Pinatubo. Instead they are shield volcanoes that continually release slow steady flows of lava. You can actually walk away from the lava as it inches forward.

Screen Shot 2015-05-24 at 12.34.25 AM Screen Shot 2015-05-22 at 8.33.00 PM Screen Shot 2015-05-24 at 12.37.36 AM

Screen Shot 2015-05-24 at 12.37.57 AM

I just took these photos of the newest lava field that formed from June through February this year.

Screen Shot 2015-05-22 at 8.31.12 PM

Screen Shot 2015-05-22 at 8.29.18 PM

Screen Shot 2015-05-22 at 8.32.18 PM


Screen Shot 2015-05-23 at 10.47.32 AM

Screen Shot 2015-05-23 at 10.47.18 AM

Screen Shot 2015-05-23 at 10.22.52 AM

Screen Shot 2015-05-25 at 2.26.54 AM

Screen Shot 2015-05-25 at 2.06.39 AM

Screen Shot 2015-05-25 at 2.19.09 AM

In the first hundred years after a new lava flow pioneer species slowly colonize the rocks. First there’s moss and ferns. Then the rugged ohia trees sprout. Then coconut palms wash up on the newly formed black sand beach and take root. After two hundred years a dense forest is established.

Screen Shot 2015-05-25 at 3.42.25 AM

Screen Shot 2015-05-25 at 4.56.42 AM

Screen Shot 2015-05-25 at 4.01.41 AM

Screen Shot 2015-05-25 at 4.52.54 AM

Screen Shot 2015-05-25 at 4.52.20 AM

Screen Shot 2015-05-25 at 4.55.26 AM

Screen Shot 2015-05-25 at 4.26.57 AM

Screen Shot 2015-05-25 at 12.45.32 PM

Soon after the lava cools a new kind of pioneer species arrives to colonize the rocks. Before the lava flow the land had already been carved up into farms and subdivisions which were covered over. Once the lava cooled the old lots were resurveyed and sold off at bargain prices. Lots began at $1,000. When I asked one resident about the precarious nature of the location he explained, “You pay your dollar and you take your chances.” Then he asked me where I live. San Francisco. “Hmmm. Nothing dangerous about living on top of a massive earthquake fault is there?” We continued to talk. Seattle and Portland have volcanoes in their back yards too. Manhattan has seen terrorist attacks and super storms in recent years. Florida and Louisiana are directly in harm’s way when it comes to hurricanes. Entire towns in Kansas get swept away in tornadoes. There are 180 aging nuclear power plants all over the mainland. What could possibly go wrong there? Or you could live in New Jersey which has… New Jersey. His point was that people were more directly engaged with the danger on the lava flow. They live with the risk everyday and can’t let themselves forget what they’re dealing with. The lava could return tomorrow or it might be another 50 years. No one knows. Everyone enjoys life, but has a Plan B.

Screen Shot 2015-05-25 at 4.50.51 AM

Screen Shot 2015-05-25 at 4.11.37 AM

Screen Shot 2015-05-25 at 4.49.24 AM

Screen Shot 2015-05-25 at 4.25.39 AM

Screen Shot 2015-05-25 at 4.07.43 AM

Screen Shot 2015-05-25 at 3.43.38 AM

As I took these photos of the lava dwellers I was fascinated. It wasn’t so much the dramatic location or funky architecture, although they’re certainly worth exploring on those terms. Instead, I looked at these lava homes as a window into the past. Historically this is exactly how all towns and cities began including Rome, New York, London, and Toronto. There’s no city water supply. No complex sewer system was installed ahead of development. There are no paved roads. No banks have financed any of these buildings. No insurance company provided coverage. There are no building codes, zoning regulations, or government inspections. (Or more accurately, all those strictures exist, but they’re simply unenforced.)

Screen Shot 2015-05-25 at 1.45.25 PMGoogle

Screen Shot 2015-05-25 at 12.40.12 PM

Screen Shot 2015-05-25 at 4.06.18 AM

Screen Shot 2015-05-25 at 4.24.19 AM

Screen Shot 2015-05-25 at 4.02.46 AM

The average North American town gets 37 inches of rain per year. This part of Hawaii gets 148. That’s over 12 feet of water falling from the sky. The simplest way to supply an off-grid home with water in this location is to collect it from the roof and hold it in a tank. The water is generally clean enough to be used directly for things like washing, but the drinking water needs to be filtered or boiled. The climate is mild year round so there’s never a need for heating or cooling, particularly if a home is built with traditional techniques that provide shade and cross ventilation. A barbecue size tank of propane will keep a stove going for a very long time. A few solar panels and/or a small marine style wind turbine will keep the lights on, especially if they’re compact florescent or LED. Ten years ago people would have used gasoline generators, but these days solar is more cost effective, silent, safer, and more convenient. Toilets come in the same form that was used by Moses, Napoleon, and Abraham Lincoln. Dry composting toilets use no water and the waste quickly turns to soil so long as sawdust or other carbon rich material is added to neutralize the nitrogen.

Screen Shot 2015-05-25 at 12.41.01 PM

Screen Shot 2015-05-25 at 12.43.00 PM

Screen Shot 2015-05-25 at 4.04.40 AM

Screen Shot 2015-05-25 at 4.27.56 AM

A D9 bulldozer and driver can be rented for the day to do the work of a thousand men in a single afternoon. The rough lava is scraped flat enough to be passable by car. A few loads of cinder help smooth the way. The roads are only improved where and as needed in an incremental fashion. The value of individual vacant lots rises as ease of access improves so homes tend to be built in clusters along the cinder roads. This level of infrastructure is in keeping with the needs and budget of the community without involving higher levels of government.

Screen Shot 2015-05-25 at 4.01.11 AM

I’m not advocating building in this kind of environment and I’m not romanticizing counter culture off-grid communities. What I am saying is that in a country that prides itself on freedom and private property rights you shouldn’t have to move to the side of a volcano to escape the regulations and social constraints that make self built mortgage free homes illegal everywhere else. I know the arguments against this sort of thing. Shanty towns are dangerous and unhealthy. They will be populated by meth labs and crack whores. These people aren’t paying their fair share of taxes to society. This isn’t a wholesome environment for children, the elderly, or the disabled. This sort of thing will destroy nearby property values. The list goes on. My response is pretty straightforward. So… we don’t have unhealthy pockets of poverty, meth labs, and crack whores in places that were built entirely to code and heavily regulated?

I will say that in this kind of community there’s no need for “affordable housing”. Even the most cash strapped residents can provide shelter for themselves. It may not be the sort of home most middle class people aspire to, but living here is entirely voluntary within a community of like-minded self-selecting people. As time passes each of these makeshift structures is being improving and upgraded. The shanties are gradually evolving into more substantial and respectable homes in the same way the moss and ferns yield to ohia and palm trees. This is an extreme example, but the same principles can be applied selectively in other locations in a more intentional fashion. These lava homes provide a glimpse into what town building used to look like and could look like again if the banks, regulators, and Upright Citizens Brigade cut people a bit more slack. I’m not counting on that, but it’s good to see obscure demonstrations of the historical pattern playing out in forgotten corners to remind us of how things were done before the days of the production home builder, the master planned community, and the seventeen volume building code.

John Sanphillippo lives in San Francisco and blogs about urbanism, adaptation, and resilience at granolashotgun.com. He's a member of the Congress for New Urbanism, films videos for faircompanies.com, and is a regular contributor to Strongtowns.org. He earns his living by buying, renovating, and renting undervalued properties in places that have good long term prospects. He is a graduate of Rutgers University.

Malls Washed Up? Not Quite Yet

$
0
0

Maybe it’s that reporters don’t like malls. After all they tend to be young, highly urban, single, and highly educated, not the key demographic at your local Macy’s, much less H&M.

But for years now, the conventional wisdom in the media is that the mall—particularly in the suburbs—is doomed. Here a typical sample from The Guardian: “Once-proud visions of suburban utopia are left to rot as online shopping and the resurgence of city centers make malls increasingly irrelevant to young people.”

To be sure, there are hundreds of outmoded malls, long-in-the-tooth complexes most commonly found in working-class suburbs and inner-ring city neighborhoods. Some will never come back. By some estimates, something close to 10 to 15 percent of the country’s estimated 1,000 malls will go out of business over the next decade; many of them are located in areas where budgets have been very tight, with locals tending to shop at “power centers” built around low-end discounters such as Target or Walmart.

But the notion that Americans don’t like malls anymore is misleading. The roughly 400 malls that service more-affluent communities—like those typically anchored by a Bloomingdale’s or Nordstrom—recovered most quickly from the recession, and now appear to be doing quite well.

To suggest malls are dead based on failure in failed places would be like suggesting that the manifest shortcomings of Baltimore or Buffalo means urban centers are not doing well. Like cities, not all malls are alike.

Looking across the entire landscape, it’s clear the mall is transforming itself to meet the needs of a changing society but is hardly in its death throes. Last year, vacancy rates in malls flattened for the first time since the recession. The gains from e-commerce—6.5 percent of sales last year, up from 3.5 percent in 2010—has had an effect, but bricks and mortar still constitutes upwards of 90 percent of sales. There’s still little new construction, roughly one-seventh what it was in 2006, but that’s roughly twice that in 2010.

Shopping in stores, according to a recent study from A.T. Kearney, is preferred over online-only by every age group, including, most surprisingly, millennials, although many of them research on the web, then visit the store, and sometimes then order on line. The malls that are flourishing tend to be newer or retrofitted and are pitched at expanding demographic markets. These “cathedrals of commerce” in the past tended to reflect the mass sameness of mid-century America; those in the future focus on distinct niches—ethnic, income, even geographical—that are not only viable but highly profitable.

This leaves us with a tale of two kinds of malls. One clear dividing line is customer base. In the ’80s and before, malls succeeded fairly universally, notes Houston investor Blake Tartt. But now it’s a matter of being in the right place. “Everything has changed and you have to be with the right demographics,” he suggests. “It’s not so much about the mall but the location that matters.”

Old malls in declining areas, notes a recent analysis by the consultancy Costar, do truly face a “bleak future” and should look to be converted into apartments, houses, corporate headquarters, or churches.

In contrast, affluent urban areas are becoming an unexpected hotspot for malls—even outlet malls are opening open in the urban core. You now see gigantic malls in places like Manhattan: the Shops on Columbus mall in Manhattan, the world’s fifth-most profitable mall, looks inside like it was teleported from Orange County, California, or, god forbid, Long Island.

This is not unusual across the world. Malls are on the march in many of the world’s biggest cities, including Istanbul, Mumbai, Singapore, and Dubai. Today Asia is the site of seven of the world’s 10 largest malls, in places like Beijing, Dubai, and Kuala Lumpur.

In the developing world, malls grow as local shopping streets either gentrify or decay. This is particularly true in fast-growing developing countries where malls are often seen as an escape from hot, humid, dirty and even dangerous urban environments. Indian novelist and Mumbai blogger Amit Varma suggests that these folks like malls “because they are relatively clean and sanitized” as opposed to the city’s pollution-choked, beggar-ridden and often foul-smelling streets.

Ethnic Malls

Within the U.S., demographic change is creating opportunities for a new breed of mall-maker. Across the country, savvy investors and developers have been buying older malls, which tended to serve either Anglo or African-American customers, and shifting them instead to focus on fast-growing ethnic markets. Such malls can now be found in traditional Latino areas such as Southern California and Texas, but they also exist in Atlanta, Las Vegas, Oklahoma City, and Charlotte, places that have recently become major hubs for immigrants.

“We had a terrific recession,” notes Los Angeles-based mall maven Jose Legaspi, who has developed 12 such malls around the country. “You do well if you target specific niches that are growing. You can’t make it with a plain vanilla mall. We are creating in these places a Hispanic downtown.”

Fort Worth’s 1.2 million-square-foot La Gran Plaza, which Legaspi manages, epitomizes the advantages of such marketing. When investor Andrew Segal bought the mall in 2005, it was a failing facility that primarily serviced a working-class Anglo population. Barely 15 percent of the mall’s tenants were both open and paying rent.

Segal quickly recognized that the area around the mall—like much of urban Texas—was becoming more diverse, in this case largely Latino.

Segal and Legaspi redid the once prototypical plain vanilla mall to look more like a Northern Mexican town plaza, a design pattern developed by Los Angeles architect David Hidalgo. Latino customers are drawn to amenities like large and comfortable family bathrooms, an anchor supermarket, mariachi music shows, and even Catholic masses. There is also a “swap meet” that accommodates small vendors, something that Legaspi sees as essential to creating “a carnival of retail experiences.” By 2008, when the face-lift was complete, the mall achieved 90 percent occupancy. Today La Gran Plaza is effectively “full,” says Segal, who is considering a further expansion of the mall.

The viability of ethnic malls in hard times demonstrated their viability in better ones. When Dr. Alethea Hsu opened her Diamond Jamboree Center in Irvine, California, the state was reeling from the recession. Yet from the time she opened in 2008, her mall, which focuses on Orange County’s large and expanding Asian population, has been fully occupied. It includes various realty offices, hair salons, medical offices, a Korean supermarket, and a small Japanese department store, all primarily aimed at a diverse set of Asian customers. The biggest problem—for those interested in choosing among various kinds of Chinese, Vietnamese, Korean, or Japanese cuisine—is not that it’s deserted but that it’s often difficult to get a parking space.

Be sure of this: The ethnic mall is no flash in the pan, at least as long as immigrants pour into this country. By 2000, one in five American children already were the progeny of immigrants, mostly Asian or Latino; today they make up as much as one-third of American kids. These kids, and their own offspring, not to mention Anglo or African-American friends, have been brought up with food and fashion tastes that often originate in Mexico, Taiwan, Japan, Korea, or China. When I was a kid growing up in New York, you went to Chinatown or Little Italy for an ethnic infusion. Now you get in your car, park, and get options not so dissimilar than what you would find—usually in a mall—in Mexico City, Mumbai, or Singapore.

The World According to Rick

For most of America, says Los Angeles developer Rick Caruso, the future lies in replicating the function that Main Street once served. Rather than simply a center for instant consumption and transactions, the mall is a social meeting point, says Caruso, who has 10 developments under his belt. To make it all work means adding often unconventional amenities such as live entertainment or the lighting of Christmas trees and the Chanukah menorah.

This is part of a broader mall trend in which developers see their properities as community and entertainment centers, an approach adopted now by mainstream mall developers such as Westfield, whose projects are increasingly open-air and built around amenities such as health clubs and trendy restaurants and cafes.

The ultimate example may be the Caruso-owned Grove, a giant open-air mall that lies next to the Farmers’ Market, one of the oldest and beloved shopping areas in Los Angeles. The world’s eighth-most profitable mall, the Grove is laid out like a Disneyesque Main Street and is particularly appealing to families and tourists. Overall, the Grove now ranks among L.A.’s leading tourist attractions. This reflects both the development’s pleasant, pedestrian-oriented design as well as proximity to the Farmer’s Market, which remains, as has been traditional, largely a collection of small, idiosyncratic stalls.

A sense of place is what makes the Grove—and, to a lesser extent, Caruso’s other developments—work. Located in the Miracle Mile district of L.A., it attracts a huge urban population that includes old Jewish shoppers from the immediate area as well as the growing ranks of hipsters, tourists, and the rest of the vast diversity that is Los Angeles. Caruso’s other centers, like the Commons in suburban Calabasas and The Promenade in Westlake, may lack global appeal but they succeed as anchors of their communities. Without developed, large historic downtowns, these communities still need a central place, and for them, the malls, however imperfectly, come closest to delivering it.

In today’s environment, Caruso suggests, a mall has to offer something that online retailers, power centers, or catalogs cannot provide: a social experience. “You have to differentiate yours, offer a place for people to gather for holidays. People are yearning for a place to connect with each other. We are not building just town centers, but the centers of towns.”

Ironically these malls are fulfilling a role that some urbanists have denounced the suburbs for lacking. “What do most urbanists want?,” asks David Levinson, director of the Networks, Economics, and Urban Systems Research Group. “A lively, pedestrian realm, clean, free of automobiles, with a variety of activities, the ability to interact with others and randomly encounter friends and acquaintances. This is what the shopping mall gives.”

The New Town Center: With Suburban Revival, New Hope for Malls

The notion of dead malls has been connected to a similar idea about the inevitable demise of the suburbs, which appeared possible at the height of the recession, but has since been shown to be largely false. Suburbs may not be booming as in the ’90s, but they are now growing as fast as core cities, and constitute more than 70 percent of all new population and 80 percent of new job growth since 2010.

Surprisingly, the most recent numbers suggest that the outer suburbs and exurbs, once consigned to Hades by the new urbanist crowd, have begun to roar back. Millennials, as they get older, notes Jed Kolko, now seem to be moving to what he calls “the suburbiest” areas farther out on the periphery. 

It is in these areas that malls may have their greatest future. In communities like Irvine, where the Spectrum development has become the de facto downtown, or Sugar Land, a highly diverse outer suburb of Houston, the “town center” is essentially a mall in brick, made to look like an old Main Street but filled with chain stores and specialty restaurants. Many residents of fast-growing communities like Sugar Land, which has 83,000 residents, are relative newcomers, and for them such town centers are the focus of their communities.

It is time to dispense with the twin memes of mall- and suburb-bashing, and begin appreciating and improving how most Americans live and shop. The malls of the future indeed may be very different in many ways—more segmented by income and ethnicity, more entertainment- and experience-oriented. But they will continue to serve an important focus for most American communities. And at a time when many of our most celebrated cities have themselves become giant malls (is there any place on Earth more boring than the area around Times Square?), the future of malls may prove brighter, and even more transformative, than commonly imagined.

This piece first appeared at The Daily Beast.

Joel Kotkin is executive editor of NewGeography.com and Roger Hobbs Distinguished Fellow in Urban Studies at Chapman University, and a member of the editorial board of the Orange County Register. He is also executive director of the Houston-based Center for Opportunity Urbanism. His newest book, The New Class Conflict is now available at Amazon and Telos Press. He is also author of The City: A Global History and The Next Hundred Million: America in 2050.  He lives in Los Angeles, CA.

Photo: "Thegrove". Licensed under CC BY-SA 3.0 via Wikipedia.

Growth Concentrated in Most Suburbanized Core Cities

$
0
0

An analysis of the just-released municipal population trends shows that core city growth is centered in the municipalities that have the largest percentage of their population living in suburban (or exurban) neighborhoods.

Improved Urban Core Analysis

There is considerable interest in urban core population trends, both because of recent increases in the interest of urban planning orthodoxy to restore living patterns more akin to the pre-World War II era. At that time, urban areas were considerably more densely populated, commuting travel was much more focused on downtowns (central business districts or CBDs) and automobile use accounted for far less of urban travel than today.

Most previous analysis has equated historical core municipality (core city) data with the urban core. The core cities are generally the original settlements, as they have evolved by expanding their city limits. Around these core cities, suburbs and exurbs have developed, which combined with the core cities make up the metropolitan area. Metropolitan areas are the "economic" dimension of contemporary cities.

However, even the most cursory analysis demonstrates that equating core cities with the urban core is far from ideal. Historical core municipalities vary greatly in their percent of their population living in traditional high density neighborhoods. For example, in core cities like New York, Boston and San Francisco, nearly all people live in neighborhoods that can be classified as urban core. In others of the largest core cities, virtually all of the population lives in neighborhoods that are suburban or exurban, in view of their low densities and overwhelming automobile orientation. These include examples like San Antonio, Phoenix and San Jose. Even core cities perceived to have a strong urban core, such as Portland and Miami, have considerably less than 50% of their population in urban core neighborhoods.

Overall, historical core municipalities have little more than 40% of their population living in urban core neighborhoods. When non-core principal cities or primary cities are equated with core cities, there is even less association with the urban core. Overall, non-core principal cities have less than 10% of their population living in urban core neighborhoods.

This has changed in recent years, with the introduction of the annual American Community Survey and its small area data, such as for ZIP Code analysis zones (ZCTAs). Even so, the comprehensive publication of small area data tends to lag approximately three years behind population estimates. Thus, the small area data that would make it possible to compare population trends to 2014 by functional urban sector within core cities will not be released until 2017.

This article classifies 2010 to 2014 core city population growth by the percentage of urban core population according to the 2010 census. The classification was developed using my City Sector Model, which classifies every zip code in metropolitan areas as pre-War urban core (CBD and inner ring) or post-War suburban or exurban (Figure 1). Simplified, the City Sector Model classifies as urban core any small area with an employment density of 20,000 per square mile or more or a population density of 7,500 per square mile or more, with a transit, cycling and walking work trip market share of 20% or more (Note).

Growth by Extent of Urban Core Population

More than 50% of the growth between 2010 and 2014 has been in core municipalities that are more than 90% post World War II suburban or exurban (0 to 10% urban core). This growth share is nearly one-half higher than their population share of 35%.

These findings are based on the City Sector Model (Figure 1 and Note), which classifies small areas (zip code tabulation areas) principally using population density and commuting market share data that attempts to replicate urban areas as they functioned before World War II.

These most suburban of core cities grew the fastest, up 6.8% from 2010 to 2014. These municipalities had less than 10% of their population in urban core neighborhods, and include core cities that annexed substantial suburban or rural territory, such as Phoenix, San Jose, Charlotte, Tampa, Orlando and San Antonio. Those that were most heavily urban core in form grew 4,0 percent, which was slightly behind the national average of 4.7 percent. The core cities had less than 10% of their population living in urban core neighborhoods, and include New York, Buffalo, Providence, San Francisco and Boston (Figure 2)  

The functionally suburban and exurban areas accounted for approximately 58% of the population in the core cities. This leaves approximately 42% of the population living in areas that are similar to the urban areas as they functioned in 1940.

Approximately 70% of the growth was in the 33 historical core municipalities that are more than 60% suburban or exurban.

At the same time, the five core cities with the largest urban core percentages accounted for nearly 20% of the growth, compared to their 22 percent of the population. Approximately 80% of this growth was in New York, which is estimated to have added the largest population (316,000) among the core cities.

Ten Fastest Growing Core Municipalities

Six of the ten fastest growing core cities had urban core shares of less than 10%, including Austin, Orlando, Charlotte, Raleigh, Atlanta and San Antonio. A seventh, Denver was less than 15% urban by function. Two more had more than 50% in urban core population, Washington and Seattle (Table). Eight of the 10 fastest growing core cities were in the South, including Washington.


Table
Population Growth: 2010-2014
Core Municipalities in Major Metropolitan Areas
PopulationPopulation in Pre-War Functional Urban Core
RankHistorical Core MunicipalityMetropolitan Area20102014% ChangeHistorical Core MunicipalityMetropolitan Area
1AustinAustin, TX    790,637      912,791 15.5%4.8%2.2%
2New OrleansNew Orleans. LA    343,829      384,320 11.8%37.9%10.9%
3DenverDenver, CO    600,024      663,862 10.6%13.1%3.1%
4OrlandoOrlando, FL    238,304      262,372 10.1%0.0%0.0%
5CharlotteCharlotte, NC-SC    735,780      809,958 10.1%0.0%0.0%
6SeattleSeattle, WA    608,660      668,342 9.8%52.6%10.5%
7WashingtonWashington, DC-VA-MD-WV    601,723      658,893 9.5%83.7%16.5%
8RaleighRaleigh, NC    403,947      439,896 8.9%0.0%0.0%
9AtlantaAtlanta, GA    420,279      456,002 8.5%9.2%0.7%
10San AntonioSan Antonio, TX 1,327,605   1,436,697 8.2%0.1%0.1%
11MiamiMiami, FL    399,508      430,332 7.7%23.0%3.0%
12Oklahoma CityOklahoma City, OK    580,003      620,602 7.0%6.1%2.8%
13DallasDallas-Fort Worth, TX 1,197,833   1,281,047 6.9%1.1%0.5%
14TampaTampa-St. Petersburg, FL    335,709      358,699 6.8%0.0%0.0%
15HoustonHouston, TX 2,097,217   2,239,558 6.8%1.4%0.5%
16NashvilleNashville, TN    603,527      644,014 6.7%0.7%0.2%
17RichmondRichmond, VA    204,237      217,853 6.7%26.0%4.5%
18San JoseSan Jose, CA    952,562   1,015,785 6.6%0.1%0.2%
19MinneapolisMinneapolis-St. Paul, MN-WI    382,578      407,207 6.4%86.0%0.0%
20BostonBoston, MA-NH    617,594      655,884 6.2%90.4%35.5%
21PhoenixPhoenix, AZ 1,447,552   1,537,058 6.2%0.0%0.0%
22San DiegoSan Diego, CA 1,301,621   1,381,069 6.1%2.8%1.2%
23PortlandPortland, OR-WA    583,778      619,360 6.1%37.9%10.0%
24ColumbusColumbus, OH    788,577      835,957 6.0%12.0%5.0%
25OaklandSan Francisco-Oakland, CA    390,719      413,775 5.9%54.7%0.0%
26San FranciscoSan Francisco-Oakland, CA    805,235      852,469 5.9%94.4%0.0%
27Las VegasLas Vegas, NV    583,787      613,599 5.1%7.8%2.8%
28Stl PaulMinneapolis-St. Paul, MN-WI    285,068      297,640 4.4%38.7%0.0%
29SacramentoSacramento, CA    466,488      485,199 4.0%7.6%1.6%
30New YorkNew York, NY-NJ-PA 8,175,136   8,491,079 3.9%97.3%52.8%
31JacksonvilleJacksonville, FL    821,784      853,382 3.8%0.0%0.0%
32Los AngelesLos Angeles, CA 3,792,627   3,928,864 3.6%30.1%10.6%
33IndianapolisIndianapolis. IN    820,442      848,788 3.5%11.0%4.8%
34Grand RapidsGrand Rapids, MI    188,040      193,792 3.1%19.1%3.8%
35LouisvilleLouisville, KY-IN    597,336      612,780 2.6%17.8%8.7%
36San BernardinoRiverside-San Bernardino, CA    209,952      215,213 2.5%0.0%0.0%
37Kansas CityKansas City, MO-KS    459,787      470,800 2.4%19.8%5.4%
38Salt Lake CitySalt Lake City, UT    186,443      190,884 2.4%21.4%3.7%
39PhiladelphiaPhiladelphia, PA-NJ-DE-MD 1,526,006   1,560,297 2.2%86.1%25.8%
40MemphisMemphis, TN-MS-AR    646,889      656,861 1.5%3.7%1.8%
41NorfolkVirginia Beach-Norfolk, VA-NC    242,803      245,428 1.1%2.8%0.4%
42ChicagoChicago, IL-IN-WI 2,695,598   2,722,389 1.0%76.6%25.8%
43MilwaukeeMilwaukee,WI    594,740      599,642 0.8%55.4%23.6%
44ProvidenceProvidence, RI-MA    178,036      179,154 0.6%92.6%26.2%
45CincinnatiCincinnati, OH-KY-IN    296,950      298,165 0.4%54.2%10.1%
46BaltimoreBaltimore, MD    620,961      622,793 0.3%67.7%16.2%
47BirminghamBirmingham, AL    212,288      212,247 0.0%0.0%0.0%
48HartfordHartford, CT    124,775      124,705 -0.1%88.5%11.3%
49PittsburghPittsburgh, PA    305,702      305,412 -0.1%78.0%15.9%
50RochesterRochester, NY    210,512      209,983 -0.3%51.7%11.4%
51St. LouisSt. Louis,, MO-IL    319,294      317,419 -0.6%84.1%11.7%
52BuffaloBuffalo, NY    261,310      258,703 -1.0%96.0%29.2%
53ClevelandCleveland, OH    396,814      389,521 -1.8%80.1%22.2%
54DetroitDetroit,  MI    713,777      680,250 -4.7%32.1%6.5%
Data from:
US Census Bureau
City Sector Model (2015)


Austin has been the fastest growing historical core municipality over the four years. In 2010, Austin had 790,000 residents, and has increased 15.5% to 913,000.

New Orleans was the second fastest growing, adding 11.8%, continuing its recovery from the huge population loss after Hurricanes Katrina and the related flood control failures, which the Independent Levee Investigation Team concluded was the "single most costly catastrophic failure of an engineered system in history." New Orleans has now recovered more than 70% of its population loss between 2005 and 2006. In 2005, the population was 455,000, which fell to 209,000 in 2006, before recovering to the 2014 figure of 384,000.

The balance of the top five, Denver, Orlando and Charlotte also grew more than 10% between 2010 and 2014. The second five in population growth were Seattle, Washington (DC), Raleigh, Atlanta and San Antonio.

Slowest Growing Core Municipalities

Eight of the 10 slowest growing municipalities were in the Northeast and Midwest, including Detroit, Cleveland, Buffalo, St. Louis, Rochester, Pittsburgh, Hartford and Cincinnati. Two were in the South, Birmingham and Baltimore.

Eight core municipalities lost population. The largest loss was in Detroit, which fell 4.7% to 680,000. This is a continuation of the catastrophic losses from 1950, when Detroit had 1,850,000 residents. It may be surprising, however, that Detroit has become the core municipality with the greatest loss only this year. Until 2013, St. Louis had lost the largest share of its population from 1950 (when its population was 857,000). By 2014, Detroit had lost 63.2% of its 1950 population, compared to the 63.0% loss in St. Louis). St. Louis also continued its losses, dropping 0.6% between 2010 and 2014.

Cleveland and Buffalo had greater losses than St. Louis. Cleveland slipped 1.8% to 390,000, while Buffalo dropped 1.0% to 259,000. Losses of less than 0.5% were posted in Pittsburgh, Hartford and Birmingham.

More-than-a-Million Municipalities

The United States added its 10th municipality with more than 1,000,000 in the 2014 estimates. San Jose joins Los Angeles and San Diego as California's third more-than-a-million city. As a result, California now equals Texas, which had led the nation, with three cities with more than 1,000,000 residents in previous years (Houston, San Antonio and Dallas).

Texas, however, should soon reclaim the exclusive title. The city of Austin forecasts that its population will reach 1,000,000 population early in the 2020s, which would give Texas four more-than-a-million municipalities. This forecast, however, could be too conservative. If the Texas city continues to grow at its current rate, a population of more than 1,000,000 could be reached before the 2020 census.

Yet, the core municipalities with more than 1,000,000 – particularly the new entrants – are not particularly dense, but are virtually suburban in form, that is, auto-oriented and generally low density.  Three have less than one percent of their population in urban core neighborhoods, including Phoenix, San Antonio and San Jose, Dallas and Houston have less than two percent of their population in urban core neighborhoods, while San Diego has less than three percent. Even in Los Angeles only 30% of residents live in urban core neighborhoods. Only three of the largest municipalities have most of their population in urban core neighborhoods, New York, (97%), Philadelphia (86%) and Chicago (77%).  

Lower Density Growth Could be Dominant in Core Cities

The new population estimates provide little indication how much core city growth since 2010 is urban intensification versus low density suburban development. However, the concentration of growth where urban cores are smaller implies that growth has been stronger at lower in the suburban portions of core municipalities. To know for sure will require waiting for later small area data.

Related article: U.S. Population Estimate Accuracy: 2010

Note: The analysis is based on the City Sector Model (Figure 1), which classifies small areas (ZIP codes, more formally, ZIP Code Tabulation Areas, or ZCTAs) in major metropolitan areas based upon their behavioral functions as urban cores, suburbs or exurbs. The criteria used are generally employment and population densities and modes of work trip travel. The purpose of the urban core sectors is to replicate, to the best extent possible, the urban form as it existed before World War II, when urban densities were much higher and when a far larger percentage of urban travel was on transit or by walking. The suburban and exurban sectors replicate automobile oriented suburbanization that began in the 1920s and escalated strongly following World War II.

Wendell Cox is principal of Demographia, an international public policy and demographics firm. He is co-author of the "Demographia International Housing Affordability Survey" and author of "Demographia World Urban Areas" and "War on the Dream: How Anti-Sprawl Policy Threatens the Quality of Life." He was appointed to three terms on the Los Angeles County Transportation Commission, where he served with the leading city and county leadership as the only non-elected member. He served as a visiting professor at the Conservatoire National des Arts et Metiers, a national university in Paris. Wendell Cox is Chair, Housing Affordability and Municipal Policy for the Frontier Centre for Public Policy (Canada), is a Senior Fellow of the Center for Opportunity Urbanism and is a member of the Board of Advisors of the Center for Demographics and Policy at Chapman University.

Photo: Newest more-than-a-million US core city, virtually all-suburban San Jose by Robert Campbell [GFDL or CC BY-SA 3.0], via Wikimedia Commons

Not so Unequal America?

$
0
0

The extreme and rising inequality of income and wealth in the United States has been exhaustively reported and analyzed, including by me. Incomes are strikingly unequal just about everywhere, but not to the same degree. To discover a more egalitarian America, I used US Census American Community Survey data (2007-2011) estimates of the Gini coefficients of all US counties and equivalents. The Gini coefficient is a measure of the percent departure of a line of accumulated population versus accumulated income, from the lowest to the highest and the straight line if everyone had the same equal income. 

The index would be 0 if all were equal, 1.0 if only 1 person had all the income. The median US counties, dozens of them, have a Gini of .43, which is in fact pretty extreme, far higher than in 1974, when it was .37. But the overall US figure is .47 (.41 in 1975), because larger counties tend to be more unequal than smaller, skewing the average. Examples of a median .43 county are Winnebago, WI (Oshkosh!), Klamath, OR, and Arlington, VA, and a good example of the average US county is Jackson, MO (Kansas City!). The lowest Gini for the US is .33 (Yakutat, AK and Power, ID) and the highest is no surprise at .59, New York county (Manhattan). It is revealing and horrific that our lowest value of .33 is that of Sweden (and most of Scandinavia), Germany is only .35 and the lowest in the world is evidently Switzerland, despite those rich bankers, at .31.  

Is this a Great Country or What?

I mapped only the 208 counties with the lowest Gini indices, those under .39, in two ways, first by the Gini values and then by groups of these counties sorted by median incomes.  Only 10 have values below .35. In 1975, 11 counties had Ginis bellow .27.  States with the highest number or share of less unequal counties include Alaska, 10, Idaho, 11, Indiana, 15, Iowa, 10, Kansas, 18, Minnesota, 11, Nebraska, 17, Utah, 7, Virginia, 13 and Wyoming, 8. Except for Alaska, there is an evident north central bias: band of less unequal counties from Virginia to Idaho-Nevada, with epicenter at the junctions of Utah, Idaho and Wyoming. 

States without any qualifying as less unequal counties (with Ginis under .39)  are Alabama, Connecticut, Delaware, Hawaii, Louisiana, Maine, Massachusetts, New Hampshire, New Jersey, Rhode Island  and South Carolina. Large California has only one, as does New York, and large Texas only 7.    

Size of Counties

A problem with the data is that small population size of many of the counties render the ACS estimates somewhat uncertain.  Thirteen have fewer than 500 households, 25 have fewer than 1000. It is reasonable that smaller rural counties, e.g., in the Plains states, might have less inequality because of the homestead settlement history and the absence of slavery, but there is still uncertainty due to small sample size. Of the counties with under 1000 households, 8 are in NE, 5 in AK, 3 in KS, 2 in CO, MT and TX, and 1 in ID, N and WA.  

At the other end, 28 counties have more than 25,000 households, and 5 have over 100,000. The largest are an interesting set. All are suburban, or even exurban, and most are fairly high income, essentially homogeneously middle class. The six largest are Williamson, TX, King William, VA, St. Charles, MO, Anoka, MN, Loudoun, VA and Davis, UT. These are also among the richest counties on the list. 

It might be meaningful that some of these counties, as around Washington, DC, Baltimore and Austin, TX, have high levels of government employees, while their minority levels are quite low.

Lower inequality, but High in Minorities

This unlikely combination does occur, although only 7 of the 208 counties have minority shares (percentages) above .5: TX, 3, Kenedy, Moore and Reagan;  KS, 2, Ford and Seward; AZ 1, Greenlee, and AK, Aleutians 1. The TX, KS and AZ counties are all Hispanic, and high in energy development for TX and KS.  The AK county is Asian. No county has a black population majority. Surry county, VA, at 47% black, is highest share of black population, located and exurban between Richmond and Norfolk.  

The Lowest Ginis, Under .36

Thirty-one counties have Gini levels under .36 (Still high of course!) Only 10 are under .35. These vary in size from tiny Kenedy, TX (147 households) to Loudon, VA  with 105,000. The distribution by state is

VA 7:  King William, Prince George, Surry, Craig, Greene, Loudon, King and Queen

KS 4:   Meade, Wabaunsee, Wichita, Kearny

AK 3:  Yakutat, Bristol Bay, North Slope

UT 3: Morgan, Emery, Juab

NE 3:   Blaine, Stanton, Grant

TX 2: Kenedy and Carson.

Several states with one county: CA, Mono,  GA, Chattahoochee,  ID, Power,  IL, Kendall,  IN, Jasper,  IA,  Cedar, KY, Spencer, OH, Putnam, and WY, Lincoln.

These are distributed in a similar way to the 208 lower Gini counties, with the exception of the much larger number in VA, and not just in the WDC area!  UT and AK stand out, as do neighbor states of KS and NE.  The AK set is high in minorities (Native Americans, Asians), as is Kenedy, TX (Hispanic).  The VA set includes suburban Richmond and Washington DC counties, exurban to rural Chesapeake Bay counties, a tiny Allegheny mountain county and suburban Charlottesville. ID, UT, KY, KS, IL, IN and GA have suburban counties, KS and TX energy growth counties, and NE, WY, UT and CA fairly remote rural counties, the latter three recreational.

Less unequal counties by income level

Lower income counties: 27 counties have median household incomes below $40,000. By state these are

NE 5: Garfield, Hooker, Blaine, Grant. Hayes

ID 5: Idaho, Lewis, Power, Benewah, Clark

KS 4: Cloud, Norton, Trego, Rush

MI 2: Oscoda, Ontonagon        

WV 2: Grant, Monroe

WI 2: Adams, Florence

Several states with one county, including PA, Forest: TX, Kenedy: MT, Golden Valley:  IN, Jay;

IA, Osceola,;  ND, Griggs; and MO, Monroe,

The dominance of neighboring KS and NE is noteworthy, as is the large number and share in Idaho. Eight of the counties are small, with under 1000 households, and only 4 have over 40,000. Thus most of the counties are rural and small town, resource oriented, and often with small manufactures. The counties in upper Michigan and Wisconsin are similar in character.

Higher income counties at the other end comprise 28, with median household incomes above $67,000. By state these are:

VA 7: Loudoun, Stafford, Prince William, Spotsylvania, Manassas Park, New Kent, King George

AK 4: Juneau, Denali, Skagway, North Slope

MN 4: Scott, Sherburne, Anoka, Wright

MD 3: Calvert, Charles, Carroll 

WY 3; Campbell, Sublette, Sweetwater

TX 2; Rockwall,  Williamson

Several with one county: NM, Los Alamos: UT, Morgan; MO, St Charles; MI, Livingston; IL, Kendall

The 9 richest counties include 6 suburban or exurban around Washington DC and Baltimore, suggesting the importance of federal employment, and federal oriented Los Alamos, NM, Rockwall is suburban Dallas, Scott suburban Minneapolis.   Other suburban and exurban counties are in UT, MO, and MN (3 more!), VA (4 more), MI, IL, and TX. Higher income rural small town areas are in AK (4) and WY (3).

Middle Income Less Unequal Counties

The middle group of 52 counties with median household incomes between $49,000 and $57,000 are more varied and complex.  By state

IN 6: Jasper, Ohio, Putnam, Spencer, Tipton and Whitley

IA 5: Iowa, Lyon, Cedar, Mills, Benton                    

KS 3: Jackson, Wabaunsee, Jefferson

UT 3: Juab, Duchesne, Box Elder    

OH 4: Mercer, Henry, Auglaize, Putnam

WI 2: Kewaunee, Dodge, Columbia     

MN 2: Le Sueur, Nicollet

ID 2: Jefferson, Teton

MO, 2, Clinton, Lincoln

WY 2: Weston, Carbon,

KY, 2, Anderson, Bullitt

TX,  Reagan

GA 2: Pike, Effingham

VA 2: Surry, Greene  

NE 2: Hamilton, Kearny

AK, Aleutians, AR, Saline, CA, Mono, IL, Washington, MI, Lapeer

MT Lewis and Clark. OR, Hood River, PA, Perry, TN, Cheatham, NC Currituck

None have under 1000 households, and 21 have 10,000 or more. The largest, Saline, AR, has 41,000 (suburban Little Rock).

These tend to prevail across the north central states from OH west to UT, and include many small town and small city regional centers. Several are free-standing small town counties, a few are suburban to larger cities, such as Nashville and Little Rock, but the most are far suburban or exurban to smaller metro areas. 

The small map inset centered on Indiana illustrates these patterns.

Conclusions                 

The geography of these less unequal counties is unusual. Not one is a metropolitan core county, large or small. Not one is a majority black county. While there are many suburban counties, almost all are in a few clusters, VA-MD, ID-UT, or in the upper Midwest, especially MN. A large number are exurban, just beyond the official metro areas, mostly across the north, but with a few in the  south. And, most old-fashioned and reassuring, quite a number are freestanding small city and small town, micropolitan or smaller counties, most notably in the Northern Plains and Rocky Mountain states, and apparently doing well with a resource and small industrial economy.   

Contrasting the  Most Unequal Counties

OK, how different is the geography of the most unequal counties?  The US has 30 counties with Gini indices over .53, culminating in New York (Manhattan) at almost .6. These are indeed quite different, as race plays a dominant role, but not a universal one.

23 of the 30 are in the south, and 17 of these have high black population shares, including core metropolitan counties, the District of Columbia, Fulton (Atlanta). Orleans (New Orleans), and Richmond, VA. Outside the south, 6 of the 8 counties also have a high minority share, New York (Manhattan), Westchester, Essex, NJ (Newark), Sioux, SD (reservation), and Harding, NM (Latino), leaving only tiny Mineral CO (recreation), and  Fairfield CT (super rich suburban-exurban NY).

Six counties in the south do not have high minority shares,  Decatur, TN (west central on the Tennessee river), Baylor, TX , exurban Wichita Falls, Llano, TX , exurban Austin and tiny Borden, TX, Galax city, VA, far southwest, and Watauga, NC, home of Appalachian State University.

Race clearly is the most common basis for extreme inequality, but exurban counties close to rich metropolitan centers may also have high class differentials, as do some recreation dependent areas.    

Richard Morrill is Professor Emeritus of Geography and Environmental Studies, University of Washington. His research interests include: political geography (voting behavior, redistricting, local governance), population/demography/settlement/migration, urban geography and planning, urban transportation (i.e., old fashioned generalist).

Are Suburbs Causing Crime?

$
0
0

Reihan Salam, often an insightful critic, argues in Salon that poverty has come to the suburbs at a higher rate than it has grown in big cities because poorer service workers have followed the service jobs required in the suburbs. This has caused problems. Salam sees more civil strife in suburbs like Ferguson, Missouri today partly because the different kinds of family structures that have become so predominant, particularly those exhibited by the poor, cannot be accommodated in single-family, detached housing.

There’s clearly some truth here but overall the policies he suggests do not hold water. Households led by singles are up to over 20 percent of all households in the most highly populated metropolitan areas, two-parent families with the manpower to take care of suburban homes and lawns has fallen, and single parent households have grown. His solution:  to build smaller, high-density attached housing units, not so much because they are more affordable for the poor; many of the suburban poor already live in rental housing units, and overall high density is generally more expensive than lower density. Salam sees density and its concomitant higher property assessments as  generating more  tax revenue, thus reducing local government aggressiveness in  levying traffic and loitering fines (administered mostly through an often distrusted police force), which have grown to become an enormous burden for the poor in the suburbs.  

But Salam doesn’t seem to appreciate that much of the desperation for local tax dollars is driven by increases in the number of residents — all kinds of residents but including the poor — and especially the young and poor, who generate the demand for  expensive services like schools, special education, and law enforcement.  Salam is under the impression that higher density buildings produce more property tax revenue, but he doesn’t acknowledge that if these buildings are filled with more people per acre than a single family home, they will also require more services, and generate the need for more taxes.   One of the enduring political features of high-density urban areas is the lack of a tax base (or political willingness) to adequately fund big city school systems. By court order, New York State had to revamp its school aid formula in the early 2000s to channel billions in more funds to the New York City public school system, which State Supreme Court Justice Leland DeGrasse  ruled had for years neglected its constitutional obligation to ensure "the availability of a sound basic education to all children of the state."

In fairness, one of the most perplexing issues in urban planning over the decades has been whether or not certain types of housing pay more or less in property taxes than their inhabitants require in government services. This question has not been answered to anyone’s satisfaction.

There are broader questions raised by this article. If the poor (the majority of whom are single mothers) are poor at least in some respect to there being only one or no working adults in a household, wouldn’t a poor, single mother of three still be poor living in an attached apartment (as opposed to a basement of a single-family home)? If at least one social objective to alleviate poverty is to create two-income households, it is not clear how building smaller housing units would encourage this. As the University of Washington’s Richard Morrill  and others have repeatedly shown, our most densely populated areas (i.e. those with smaller housing units) exhibit the most severe forms of economic stratification.

Nor is it clear how Salam’s recommendation would address the aspirations of the poor, most of whom still seek one day to acquire a piece of property and a single-family home. A recent Redfin study found that 92 percent of “Millenials” (those born during the early 1980s and now in their late 20s and 30s) who don’t own a home want to buy one in the future. And according to figures from the 2008 Current Population Survey, as reported by Thomas Tseng in Newgeography.com, 44 percent of Millenials belong to some racial or ethnic category other than "non-Hispanic white." It’s an unfortunate reality of American life that even into the second decade of the 21st century a disproportionate number of the poor are racial minorities. One must assume that a goodly portion of these young aspirants to homeownership must be poor racial minorities.

How would forcibly filling the landscape with apartment buildings and crowding out single-family, detached homes (making them, therefore, more expensive) help the poor achieve that dream?

Salam’s remedy of building smaller living units might even exacerbate another problem that some suburbs (and the nation as a whole) face: the “birth dearth”, or the decline, especially in older suburbs, of family formation and birth rates. As opposed to the “nursery” for America’s next generation that many of America’s sprawl suburbs still remain, urban centers today are among the most “child free” ‑ whether in Manhattan, San Francisco, Chicago, or Boston. But even in the old-line suburbs, since the 2008 recession, the number of new children has plummeted. The largest declines in the 5 to 14 cohort since 2000 have almost all occurred in the large coastal metropolitan regions, including their suburbs, led by Los Angeles where the child population has dropped by 303,000, or 15.3%, since 2000. In the New York metro area, the number of 5- to 14-year-olds has fallen by 238,000. This includes the Nassau-Suffolk region, America’s “oldest suburb,” which has experienced a decline of 71,834 residents in the 0-14 population group between 2000 and 2013.

Today the number of households with children is 38 million, about the same as a decade ago, even as the total number of households has shot up by nearly 10 million. There are now more houses with dogs than houses with children.

The decline in the numbers of potential young suburban residents suggests not some great urban revival, but a drain in the population of future taxpayers and workers. As demographer Wendell Cox and others have shown, localities with higher densities have considerably lower birth rates than areas with lower densities. With the push for higher density, are the suburbs slated next to become “child free zones”?

Few would dispute that many suburban areas across the country lack sufficient housing options. But the seemingly ubiquitous assumption that high density housing will eradicate problems such as high taxes, increasing inequality, civil unrest, and lower birth rates may be invested with an unjustified sense of certainty.   

Seth Forman, Ph.D, AICP, is author of American Obsession: Race and Conflict in the Age of Obama and Blacks in the Jewish Mind: A Crisis of Liberalism, among other books. His work has appeared in publications that include National Review, Frontpagemag.com, The Weekly Standard, and The American. He is currently Research Associate Professor at Stony Brook University, and the Chief Planner for the Long Island Regional Planning Council. His opinions are not associated with any of these institutions. He blogs at www.mrformansplanet.com.

Smaller Stars: The Best Small And Medium-Size Cities For Jobs 2015

$
0
0

A look at job growth in America’s small and medium-size cities provides a very different, perhaps more intimate portrait of the ground-level economy across a wider swathe of the country than our survey last week of The Best Big Cities For Jobs. It takes us to many states that lack large cities, particularly in the Midwest and South. In contrast to our big city list, information technology is a driving factor in only a handful of smaller metro areas – grittier sectors like energy and manufacturing are the livelihood of a good many, as well as tourism for a surprisingly large number of thriving places that have become vacation meccas for the increasing number of affluent residents of major urban areas.

The 421 metropolitan statistical areas we evaluated in our rankings, ranging from large to small, account for 87.6% of all U.S. nonfarm employment.  Of them, the country’s small MSAs (those with less than 150,000 nonfarm jobs) and medium-sized ones (between 150,000 and 450,000 nonfarm jobs) account for just over a third of U.S. urban employment.  Job creation in these communities since 2000 has been roughly comparable to the nation’s larger metro areas — total nonfarm employment has increased 7.5% in small and medium-size MSAs compared to 7.8% for large ones.

Our rankings are based on employment growth over the short-, medium- and long-term, going back to 2003, and factor in momentum — whether growth is slowing or accelerating. (For a detailed description of our methodology, click here.)

The Slipstream Economies

A good number of our top-ranked smaller cities are posting strong job growth in the slipstream of larger economies. This is clearly the case with our top-ranked medium-size metro area, Provo-Orem, and its northern Utah neighbor, No. 7 Ogden-Clearfield. Both are located along the Wasatch Front not far from the somewhat bright lights of Salt Lake City (and more importantly its airport) and are heavily Mormon. Provo is home to Brigham Young University, the academic center of the Mormon universe with over 29,000 students. That group’s social cohesion, which translates into a high percentage of families with children, as well as emphasis on education and enterprise, underlay the success of these areas.

But what is most striking about these two metro areas is the diversity of their economic growth. Since 2009, for example, employment in the Provo-Orem area is up 23.5%, with gains in virtually every sector, paced by increases in construction and natural resources (60%), information (30.1%), business services (46.5%) and even manufacturing (16.4%). With the exception of information jobs, Ogden has showed a similar, albeit less spectacular pattern of widespread economic growth over the same time period.

Other slipstream economies that are thriving include our second-ranked small city. Greeley, Colo., slightly over an hour’s drive from the Denver airport. Greeley rose seven places from last year, powered largely by 114% employment growth since 2009 in construction and natural resources (oil and gas mostly) as well as solid expansions in business services (up 29.8%) and manufacturing (up 17.2%). As in the case of Provo and Ogden, Greeley benefits from being close to a dynamic large metro area, but can couple that with prized small town attributes like less traffic, good schools, relatively low housing prices and safe streets.

Energy Hot Spots: Not All Cold Yet

Until the recent tumble in energy prices, big oil towns reliably dominated our list. For all sorts of reasons, including fierce local opposition, big metro areas don’t tend to produce oil and natural gas, though the technical and business aspects are dominated by a few, notably Houston. The price plunge had not yet translated into heavy job losses in many energy towns by January 2015, which is as far as our data goes, although some clearly were already hurting.

Take our top-ranked small city, Midland, and nearby No. 3-ranked Odessa, which are in the oil-rich Permian Basin of West Texas. Employment grew 9.1% in Midland last year, the fastest pace of any metro area in the country. Since 2009 the west Texas town has logged almost insane 45.8% expansion in its job base, with a large boost not only in natural resources and construction (108.4% growth), but also manufacturing (up 72.2%), wholesale trade (80.6%) , professional business services (up 40%) as well as leisure and hospitality (likely rooms for the roughnecks). Odessa boasts similar, albeit somewhat less gaudy numbers.

But you don’t have to be in Texas to be an energy boomtown. Bakersfield, Calif., No. 6 on the medium-size list, has managed to retain a strong energy economy in a state that has all but declared war on fossil fuels. Bakersfield has been described as “little Texas,” and it has enjoyed strong, very un-Californian employment growth in such areas as manufacturing, up 17.8% since 2009, trade (19.8%) and natural resources and construction (40.8%). Blue collar employment may be suffering in much of California, but not down in this metro area, best known for country stars like Merle Haggard and highly resistant to the San Francisco-style economic post-industrial model that dominates the state.

Yet there’s no question that there are problems in the oil patch. Some of the biggest decliners on our list from last year are big energy towns, such as Lafayette, La., which slid 43 places to 48th on the mid-size cities list, and Anchorage, Alaska, down 25 places to 63rd. On our small city list, Bismarck, N.D., a major hub for that state’s shale boom, dropped from second last year to 19th this year, and Houma-Thibodaux, La., tumbled 61 places to 81st.

Playground Towns

Looking across the country, however, many of the small cities doing the best are not those that produce anything tangible like energy or cars. There’s been a strong resurgence in what may be considered playgrounds for the expanding ranks of the affluent residents of major urban areas, particularly on the West Coast, where Silicon Valley is minting many millionaires along with its famous billionaires, as well as along the East Coast, where second home and retirement-oriented communities are booming. Last year, vacation home sales broke the national record.

Among the playground areas that are prospering on our small cities are No. 4 Naples-Immokalee-Marco Island, Fla., where employment expanded 5.4% last year to 136,200 jobs, Napa, Calif. (eighth, with 15.6% job growth since 2009), and Redmond-Bend, Ore. (12th). On our mid-size list, Santa Rosa, Calif., (Sonoma County) ranks 12th and Santa Barbara- Santa Maria, Calif., 17th.

In some of these places, not surprisingly, leisure and hospitality are the largest industry — 19.6% of the workforce in Naples is employed in this sector. Economist Bill Watkins, who has studied these trends in California and Oregon, suggests that the growth of the playground cities reflects the emergence of America’s haute bourgeoisie. “The well-to-do go to these places,” he notes, fueling both their growth and, in hard times, their sometimes sharp declines. “They have second homes and can spend a lot of money.” Watkins’ analysis of Bend, Ore.’s economy, for example, shows that upwards of 80% of the volatility in its economy can be traced to what is occurring in California, notably the Bay Area.

Industrial Cities:Some Up, Some Down

For generations manufacturing in the U.S. has been moving to smaller cities, largely in the South, while Midwestern and northeastern industrial cities have been taking it on the chin. With a modest growth in manufacturing, some small and mid-size cities have done surprisingly well, although many continue to lag, and even fall further in the rankings.

Columbus, Ind., a manufacturing hub that is home to diesel engine maker Cummins, epitomizes the up and down nature of industrial economies. Right now Columbus, riding a new wave of investment from Cummins and other manufacturers, has risen to fifth on our small city list, and is at record high employment. Since 2009 the Indiana metro area’s job count has expanded 23.4% to 51,800, paced by an impressive 43.2% jump in manufacturing.

Sadly, this is not the case for many manufacturing towns. As with the large city list, many of the bottom dwellers are old industrial centers. On the mid-size list, take  91st place Youngstown-Warren-Boardman, Ohio-Pa., where employment is down 6.6% from 2003, or No. 85 Toledo, Ohio, off 5.4% from 2003. Among small cities furniture manufacturing center Rocky Mount, N.C., fell to 255th, down 4.4% since 2009, while old steel center Weirton-Steubenville, W.V.-Ohio, dropped to 254th place, with employment down 12.7% since 2003.

College Towns And The Future For Small Cities

The future of small city America depends heavily on how these areas adjust to changing economic times. Given that manufacturing and agriculture are becoming less labor intensive, to stay competitive, smaller cities will need to move more aggressively into knowledge-based fields like software, medical services and higher-end business services. Mid-sized college towns like No. 1 Provo, Boulder, Colo. (14th), Lexington, Ky. (19th), and Madison, Wisc. (20th), have experienced steady growth.

Diversification of the economy may be the best guide to future smaller city growth. Madison, for example, has a strong government and education employment base but also is home to growing number of technology firms, with information employment up an impressive 36.1% since 2009. Medical software maker Epic employs 6,800 at its sprawling campus in nearby Verona.

But perhaps the best example of successful small city growth may be Fargo, N.D., a long time butt of sophisto jokes, which ranks sixth on our small metro area list. Fargo, which is also home to North Dakota State University, may not have the cool factor of San Francisco or even Madison, but its economy is extraordinarily balanced, and not nearly as energy-dependent as other North Dakotan cities like Bismarck or Williston. It has posted double-digit employment growth since 2009 in everything from construction and manufacturing to business services and hospitality.

As many of America’s most prosperous metro areas become ever more expensive and highly regulated, notably in California and the Northeast, small-city America could enjoy a renaissance in coming years. But it will take determination on the part of local leaders and residents to begin expanding their economic strategy beyond any one niche, and instead develop a growth economy that can insulate themselves from the downturns that affect any single industry over time.

Joel Kotkin is executive editor of NewGeography.com and Roger Hobbs Distinguished Fellow in Urban Studies at Chapman University, and a member of the editorial board of the Orange County Register. He is also executive director of the Houston-based Center for Opportunity Urbanism. His newest book, The New Class Conflict is now available at Amazon and Telos Press. He is also author of The City: A Global History and The Next Hundred Million: America in 2050.  He lives in Los Angeles, CA.

Michael Shires, Ph.D. is a professor at Pepperdine University School of Public Policy.

Photo: "Provo Downtown Historic District" by Tricia Simpson - Own work. Licensed under CC BY-SA 3.0 via Wikimedia Commons.

Why We Should Nourish Strong Families

$
0
0

Every social, economic, and public policy issue can be seen, at its base, as a family issue. The data and evidence are overwhelming, and have been for decades: family structure is the principal variable in the entire list of economic and social indicators. Voluminous academic research confirms that strong family environments correlate highly with positive educational, economic and social outcomes, and inversely with negative outcomes: incidence of crime and imprisonment; inability to obtain and retain employment; the incidence and persistence of poverty; out-of-wedlock births; entitlement dependence; substance abuse and dependence; domestic violence; and others. Even income and wealth inequality — inequality of life’s outcomes — correlates closely with family structure.

Strong family structure is the single most powerful explanatory correlate in social science; stronger, even, than race. Two-parent black American families, for example, outscore single-parent white families by all measures of well-being. That’s why it is distressing that less than half of US kids live in a traditional family.

Where does inequality start? - Much has been made of income inequality in the US; it might even be one of the biggest issues in next year’s presidential election. But the biggest reason for income inequality is single parenthood. Research by Harvard economist Raj Chetty and his colleagues concludes that the single strongest correlate of upward economic mobility across geographic regions of America is the fraction of children that do not live in single-parent families.

Earlier this year, Our Kids: The American Dream in Crisis by Robert Putnam, attracted much attention. Putnam argues that access to the core institutions that foster the development of children – strong families, strong schools, strong communities – is increasingly separate and unequal. How did this happen? Putnam points to the usual suspects (the first being loss of manufacturing jobs), but his descriptions of life paths actually tell the American story of the past 50 years: great rewards go to those with human capital (skills, education, and determination), but not to those without. As it happens, those traits correlate closely with strong family structure. Hence, as family cohesion deteriorates, outcomes diminish for kids in those households.

When looking at social, cultural, and economic phenomena it is difficult to separate cause from effect. The retreat from marriage and the decline in men’s labor force participation rates have occurred simultaneously. But numerous studies have found that employment and participation rates have remained consistently higher for married fathers than for married men with no children and unmarried men with no children. Sadly, these effects persist across generations.

Family Fragmentation - Family fragmentation is the biggest domestic problem facing this country. So writes Mitch Pearlstein, head of the Center of the American Experiment and author of Broken Bonds: What Family Fragmentation Means for America's Future.

According to Pearlstein, about 40 percent of babies born in America these days are born outside of marriage. That’s true of about 30 percent of non-Hispanic whites, more than 50 percent of Hispanics, and more than 70 percent of blacks. Why does it matter? Because data show that children raised by their two biological (or adoptive) parents do substantially better in every respect in life than those who are not. They do better in school and in higher education; they do better at jobs and economically; and they develop more stable and lasting relationships personally. In other words, they are more likely to earn success, personal satisfaction and happiness.

According to Brookings Institution scholar Isabel Sawhill, family fragmentation is propelling a bifurcated society. Among the wealthiest 20 percent of whites, divorce rates and single parenthood have declined to 1950s levels. But among the poorest 30 percent of whites – and among much larger percentages of Hispanics and blacks – divorce and single parenthood have become a way of life.

What to do? - Strong, healthy families are conducive to a rich, safe, healthy, productive society, one with wide opportunities, social and geographic mobility, and cultural, moral and civic strength. Families lead to and are supported by an independent, self-reliant population. Do we not all agree these are worthwhile goals? And does that not suggest we should be promoting strong, healthy families?

The promotion of family is a cultural cause. What can we do? For one, those of us who see empirical evidence of the importance of family can disseminate the facts. For another, those of us who, through personal experience, are aware of the social and economic benefits of strong families, could preach what we practice, as suggested by Charles Murray in his book, Coming Apart.

Does this view devalue or stigmatize non-traditional families — single, same-sex, unrelated households, for example? No, the modern conception of family now includes those formations. And to those who say “check your privilege,” I say, share and spread the privilege.

Dr. Roger Selbert is a trend analyst, researcher, writer and speaker. Growth Strategies is his newsletter on economic, social and demographic trends. Roger is economic analyst, North American representative and Principal for the US Consumer Demand Index, a monthly survey of American households’ buying intentions.

Flickr photo by Sarah R: Moroccan-inspired vegetable soup


The California Dream has Moved Away

$
0
0

Southern California faces a serious middle income housing affordability crisis. I refer to middle income housing, because this nation has become so successful in democratizing property ownership that the overwhelming majority of middle income households own their own homes in most of the country.

Recently I had the privilege of participating in a forum on this subject sponsored by the Urban Land Institute, Los Angeles Housing Chapter in Century City. The forum also included a presentation from USC Professor Dowell Myers and was chaired by Ehud Mouchly, who chairs the Housing Chapter. This article is adapted from my presentation.

I am a native Angeleno, having been born near Temple and Alvarado, less than two miles from City Hall. I appointed to three terms on the Los Angeles County Transportation Commission (LACTC) by Mayor Tom Bradley, where I played a pivotal role in the establishment of the Los Angeles rail system. LACTC and SCRTD were the two predecessors to the current Los Angeles County Metropolitan Transportation Authority (MTA).

In addition, for 11 years, Hugh Pavletich of Christchurch, New Zealand and I have published the Demographia International Housing Affordability Survey. The latest edition was released in January and included median multiple data for 86 major metropolitan areas and nearly 300 smaller metropolitan areas in nine nations. Finally, I publish the most comprehensive annual review of world urbanization, providing population, land area and density for world urban areas with over 500,000 population (See World's 1,000 Largest Cities: World Urban Areas 2015 Edition).

All of this makes housing in Southern California and urban development particularly interesting to me.

The Imperative: A Rising Standard of Living and Less Poverty

The title of the forum was "The Changing Demographics of Southern California and Their Impact on Housing," however I think that the reverse is more significant --- the impact housing is likely to have on Southern California.

My perspective is neither ideological nor tied to any political party. It is a fundamentally pragmatic view that domestic policy should principally seek to better people's lives, by facilitating a rising standard of living and reducing poverty. These objectives were also referenced in the G20 nations communiqué in Brisbane and adopted a announcing a dedication to improving standards of living and eradicating poverty.

The issue is particularly ripe in California, where public policies relating to housing are having virtually the opposite effect. Housing costs have already increased poverty and reduced the discretionary income of middle-income households.

This is not an issue of suburbs versus the urban core. I could not be more pleased by the long overdue resurgence of downtown areas as residential locations, something made possible by the huge crime reductions that began with Mayor Rudy Giuliani's policies in New York City and similar efforts in cities like Los Angeles. It is important to recognize that a vibrant core no more needs dying suburbs then vibrant suburbs need a dying core. Both urban cores and suburbs can prosper, creating a stronger urban area.

The Housing Crisis

Southern California’s biggest crisis relates to housing. Housing is important to the standard of living and alleviating poverty. It is the largest element of household budgets. When housing more expensive, it leaves households with less discretionary income to purchase other goods and services. This will, other things being equal, reduce economic output from levels that would be otherwise attained.

This has been developing for more than four decades as house price to income ratios (such as the median multiple, the median house price divided by the median household income) have doubled and tripled above historical levels and well above those of other metropolitan areas. Attention is often focused on lower income affordable housing, a problem virtually everywhere, but most parts of the country do not suffer so severe a middle-income housing affordability problem. Low-income housing affordability is important and one of the best ways to minimize it is to ensure that there is middle-income housing affordability.

A bit of historical perspective is appropriate. For centuries nations had little or no property-owning middle class. Huge progress has been made in the last century and particularly since World War II. Following the war, housing development innovation, combined with transportation advances, led to the development of owned middle income housing in the suburbs. It started with Levittown on Long Island and spread across the nation. The most fabled Southern California example is Lakewood (see D. J. Waldie's Holy Land: A Suburban Memoir on this). The result was a massive increase in home ownership, rising from percentages from the low 40s to 65% in the final decades of the 20th century.

Similar progress was made in other countries, especially in Canada, Australia and New Zealand, where middle-income households purchased homes with sufficient space. In each of these nations, the median multiples were around or below 3.0 as late as 1995.

All of this represented progress toward what the late and renown British urbanist Peter Hall called the "ideal of a property owning democracy" (See: The Costs of Smart Growth Revisited: A 40 Year Perspective).

Sadly, affordability has diminished greatly in many metropolitan areas around the world.  House prices relative to incomes have doubled or tripled in virtually all of the metropolitan areas of Australia and New Zealand, some metropolitan areas in Canada as well as in some key metropolitan areas in the United States, with the worst in California. In each of these places, this house price escalation occurred after implementation of urban containment policies (also called smart growth or growth management), which seriously reduce the amount of land that can be used for new housing.

The Roots of Urban Containment Policy

Urban containment has its roots in the British 1947 Town and Country Planning Act. This act created green belts around British cities and is a proximate cause of the present housing shortage and crisis. The general philosophy of the 1947 Act is evident throughout urban planning in the United States and has been implemented in Oregon, part of Washington and California. Urban containment policy was also enacted in Florida. There, house prices had escalated at rates --- if not the price levels --- to near that of California during the housing bubble. However, legislators took the opportunity to repeal Florida's urban containment policies when housing prices dropped to historical median multiple levels.

A recent California Legislative Analyst's report indicated that much of the problem is California's strict land-use laws and regulations (See:  How the California Dream Became a Nightmare). A dense mesh of "urban containment" and "smart growth"  regulations have severely limited the land available for new housing, especially on the periphery, where cities grow organically. This destroys the competitive market for land, driving up its cost. This makes house prices escalate in relation to incomes.

California: 50% More Poverty Than Mississippi

Today, California house prices are far higher than in the rest of the nation. This is taking a toll on the standard of living and increasing poverty. The Census Bureau's supplemental poverty measure, which adjusts for housing costs shows California's poverty rate to be the highest in the nation. It should be of concern that California's poverty rate is 50% above that of perennial poverty leader Mississippi (Figure).

Because so much poverty is concentrated among minority ethnic populations, California's urban containment policy is particularly disadvantaging Hispanics and African-Americans. The Thomas Rivera Institute at USC published a detailed examination of California's land-use regulations and found that "Far from helping, they are making it particularly difficult for Latino and African American households to own a home."

The Need for Reform

The bad news is that things are likely to get much worse. Under the Sustainable Communities Strategies required under Senate Bill 375 (2008), it is likely to become nearly impossible to build traditional suburban single-family housing in California's metropolitan areas (See: California Declares War on Suburbia). Already, median multiples in San Francisco, San Jose, Los Angeles and San Diego are approaching the highs reached at the peak of the housing bubble. House prices are likely to continue rising relative to incomes, other things being equal.

Allowing Supply to Meet Demand

It is often asserted that diminishing land supply in California reflects not so much regulation, but physical limits. The state is sometimes seen as ‘built out’. Yet, in fact, there is plenty of land available for development. Despite its reputation for urban sprawl, the Los Angeles urban area is the most densely populated in the United States. It covers a bit more than one half the land area of the New York urban area. Like any urban area, the greenfield land that is available for development is on the periphery, which  includes areas like the northern Antelope Valley, the Victor Valley, and Southwestern California (Temecula to Hemet) and in some closer areas. Each of these areas is closer to the urban core than some parts of the New York commuter shed.

These areas could easily accommodate the additional population expected in the area by 2060, including the single family housing generally preferred among middle-income households. Households are not likely to raise children on high rise balconies.

Even so, the urban footprint would continue to be much smaller than that of New York. If sufficient land were opened to development, the city would expand geographically, but people would also have better access to middle class standards of living, and there would likely be a lot less poverty. The obvious choice would be to let the city expand, while improving real incomes and reducing poverty.

The California Dream is Now in Denver?

During the discussion period after my talk, perhaps the most prescient comment was made by an unidentified audience member said that the California dream is now in Denver. California's unjustifiably and artificially high housing prices are the cause. Between 1993 and 2010, there was net out-migration from California to 42 of the 50 states and the District of Columbia. Immigration to Los Angeles and Orange from abroad has also declined, as immigrants too look for more affordable alternatives. People seeking sun, glamour or a good time will continue to flourish in southern California, but it seems likely that more families, and middle class households, will continue to ebb out, seeking somewhere else the dream that was once so closely identified with Southern California.

Wendell Cox is principal of Demographia, an international public policy and demographics firm. He is co-author of the "Demographia International Housing Affordability Survey" and author of "Demographia World Urban Areas" and "War on the Dream: How Anti-Sprawl Policy Threatens the Quality of Life." He was appointed to three terms on the Los Angeles County Transportation Commission, where he served with the leading city and county leadership as the only non-elected member. He served as a visiting professor at the Conservatoire National des Arts et Metiers, a national university in Paris. Wendell Cox is Chair, Housing Affordability and Municipal Policy for the Frontier Centre for Public Policy (Canada), is a Senior Fellow of the Center for Opportunity Urbanism and is a member of the Board of Advisors of the Center for Demographics and Policy at Chapman University.

Photo: Central Los Angeles and the San Fernando Valley (by author)

Democrats Now the Party of Plutocracy

$
0
0

There’s more than a bit of cognitive dissonance in the merger of Democrats with plutocracy – rule by the wealthy. After all, the party’s brand is supposed to be “party of the people.” For Democrats, the allure of corporate cash – in campaign contributions and, later on, in of corporate patronage – may be overwhelming, but it does pose a threat to the party’s positioning.

To be sure, the Republicans are not exactly a primary vehicle for social democracy, but at least they generally don’t generally sell themselves this way. This differs from the almost comic attempt of Hillary Clinton to run as the candidate of the abandoned middle class. After all, this seems strange coming from a woman who gets six-figure fees for speeches to corporate groups, and whose family foundation may turn out to be one of the most egregious examples of quid pro quo fundraising since the money-grubbing days of the Nixon regime.

Yet the progressive establishment seems ready to accept Clinton’s recent transformation from corporate shill to class warrior; as the increasingly obsequious progressive mouthpiece the New Republic suggested “Clinton's movement to the left is unalloyed good news for liberals.” Rolling Stone, a noted stranger to credibility, as its now-discredited campus rape story suggests, also sees in her a kindred spirit in duplicity. Her “fake populism,” they declared, “is a hit.”

Read the entire piece at The Orange County Register.

Joel Kotkin is executive editor of NewGeography.com and Roger Hobbs Distinguished Fellow in Urban Studies at Chapman University, and a member of the editorial board of the Orange County Register. He is also executive director of the Houston-based Center for Opportunity Urbanism. His newest book, The New Class Conflict is now available at Amazon and Telos Press. He is also author of The City: A Global History and The Next Hundred Million: America in 2050.  He lives in Los Angeles, CA.

Photo: "US Secretary of State Hillary Rodham Clinton Meets Japanese Foreign Minister Seiji Maehara in Hawaii 101027-F-LX971-088" by Master Sgt. Cohen Young - https://www.dvidshub.net/image/1317097. Licensed under Public Domain via Wikimedia Commons.

Small Regions Rising

$
0
0

In the last 25 years there has been a huge change in the level of competitiveness of smaller urban areas – by which I mean the small end of the major urban scale, or metro areas of about one to three million people – that has put them in the game for people in residents in way they never were before.

I recently gave the morning keynote at the Mayor’s Development Roundtable in Oklahoma City and talked a bit about this phenomenon, as well as how these generally younger and sprawling areas ought to be thinking about their future.

If the video doesn’t display for you, click over to watch on You Tube (my segment starts at 4:36).


Aaron M. Renn is a senior fellow at the Manhattan Institute and a Contributing Editor at City Journal. He writes at The Urbanophile, where this piece first appeared.

The Cities Winning The Battle For Information Jobs 2015

$
0
0

We are supposed to be moving rapidly into the “information era,” but the future, as science fiction author William Gibson suggested, is not “evenly distributed.” For most of the U.S., the boomlet in software, Internet publishing, search and other “disruptive” cyber companies has hardly been a windfall in terms of employment. As jobs in those areas have been created, employment has shriveled in old media like newspaper, magazine and book publishing (these industries lost a net 172,000 jobs from 2009 through 2014). In the 52 largest metropolitan areas that we studied, information employment declined for roughly half from 2009 through 2014. Overall, in information industries (a sprawling sector that also includes movie and TV production, radio and another big job loser, telecom) employment has shrunken 4.2% since 2009 to 2.7 million jobs, while total nonfarm employment in the U.S. grew by 5.1%.

Yet looking at the information sector give us an important picture of how these changes have shifted jobs to certain regions and away from others. Our rankings are based on employment growth in the sector over the short-, medium- and long-term, going back to 2003, and factor in momentum — whether growth is slowing or accelerating. (For a detailed description of our methodology, click here.)

By far the biggest winners in the information sweepstakes are areas that developed a strong engineering base before the rise of the Internet. This has provided the platform for the rapid growth of web-based businesses, including in fields such as entertainment, media, hospitality and transportation (like Uber). It’s not surprising then that the metro areas that have posted the strongest information job growth over the past 11 years are San Jose-Sunnyvale-Santa Clara and San Francisco-Redwood City-South San Francisco.

The growth in these hot spots has been nothing short of spectacular: information employment rose 60.2% from 2009 through 2014 in the San Jose area to 70,900 jobs, 6.9% of total employment in the metro area, while the San Francisco area has seen a 51.3% surge over the same time span to 55,800 jobs, representing 5.4% of the total workforce there.

After the dot-com bubble burst, Silicon Valley tech employment declined consistently until 2010, since which the rebound has been dramatic. While San Francisco and areas in the northern end of Silicon Valley have not yet reached the peak employment levels seen during the bubble era, the southern end centered in San Jose and Santa Clara has easily outstripped its peaks of the early 2000s. And with information employment continuing to surge, it’s too early to say these areas have hit their “information” peak. Last year, the number of information jobs jumped 16.0% in San Jose while San Francisco experienced an 8.3% jump.

Other traditional tech centers that have thrived in the new era include No. 9 Seattle-Bellevue-Everett, Wash., where information employment has grown a healthy 9.2% since 2009 and No. 14 Boston, where employment is up 5.1% since 2009. Compared to the Bay Area, these regions appear less at the center of the web-based media and services industries, but their overall tech economies remain very strong.

The Rise Of Sun Belt Information Hubs

Some of the most rapid growth in information, however, is taking place not in the older established tech hotbeds but in the lower-cost metropolitan areas of the Sun Belt. Five of our top 10 ranked metropolitan areas are located in the belt that stretches from the Atlantic coast to Arizona, led by No. 3 Austin-Round Rock, Texas, where information employment has risen 30.8% since 2009 to 25,800 positions.

Some of this reflects a gradual movement of companies, notably from Silicon Valley, to the Texas capital. Smaller Bay Area firms such as digital advertising firm Marin Software have expanded there while Apple is expected to add 3,600 jobs there over the next few years.

Several other Sun Belt tech hubs also are high on our list. In fourth place is Raleigh, N.C., on the strength of a 13.8% jump in information employment since 2009. It’s followed in fifth place by No. 5 Charlotte-Concord-Gastonia, N.C., which boasts significant sources of venture capital, and No. 8 San Antonio-New Braunfels, Texas, which has seen the rise of locally based companies such as Execupay as well as large scale expansion of Bay Area firms such as Oracle that are flocking to the region.

One big advantage these economies have compared to the ultra-pricey Bay Area is lower home costs, something that matters to tech workers as they enter their 30s. But the biggest challenge for some of these up and coming areas, such as Phoenix, is the dearth of large locally headquartered companies that can help create a management talent base and some tech street cred.

The Battle Of The Bigs

One key battleground for information supremacy is in the country’s media centers. The clear winner has been No. 7 New York, which has recorded a 13.0% jump in information jobs since 2009 to 185,200 jobs – second most in the country behind the Los Angeles metro area. That came amid an 11.8% decline over the same timespan in all publishing jobs not involving the Internet (note that we don’t have the level of detail at the local level to separate out software publishing from that figure, but it’s safe to assume the bulk of the decline was in newspapers and book and magazine publishing). The 13% jump reflects strength in new media as well as motion pictures, TV and radio, more so than technology, a field in which New York remains very much an also ran, right in the middle of the pack in terms of creating STEM and tech employment. But boosters claim this is changing, pointing out that there are now 7,000 tech firms employing 100,000 people in the area.

Although New York is well behind the Bay Area in pace of growth, it is clearly outperforming its traditional media rivals in the rush towards digital media. Its growth dwarfs that of No. 29 Chicago, where information employment has ticked up 0.4% since 2009. The Los Angeles-Long Beach-Glendale metro area, still home to the largest number of information workers, has managed lackluster growth of 3.5% since 2009, including a 2.0% decline last year, which puts it 28th place on our list. For all the talk about L.A.’s emergence as a new media rival to the Bay Area, the numbers suggest this is more hope than reality. Over the past five years motion picture and television employment has not been hard-hit like traditional publishing but is only experiencing slow growth. No Facebook, Google or Apple equivalent has emerged in Southern California, although some hold out hope for L.A.-based Snapchat.

A decade or two ago there was talk about the nation’s capital challenging New York’s media dominance. But as has become evident over the past year, the Beltway’s appeal is dropping, even when it comes to producing sound-bites and punditry. The core Washington D.C.-Arlington-Alexandria metropolitan division places a mediocre 43rd, with a 3.9% decline in information employment since 2009. Other areas around the capital did poorly also, including 41st-ranked Northern Virginia and 46th-place Silver Spring-Frederick-Rockville Md. which also have lost information jobs since 2009.

Surprises And Up And Comers

Generally speaking manufacturing, energy and logistics-oriented economies do not do well in terms of information jobs. As of now there’s no Rust Belt version of Facebook or Google, and most factory towns do very poorly. But there’s one outstanding exception to this rule: Warren-Troy-Farmington Hills, Mich., which places 10th on our list. This area, sometimes referred to “automation alley,” is Michigan’s premier tech region. It is where software meets heavy metal, with a plethora of companies focusing on factory software and new computer-controlled systems for automobiles. It is home to engineering software firms like Altair, which has been expanding rapidly, and also where General Motors recently announced plans for a $1 billion tech center, employing 2,600 salaried workers.

If we are looking for future information hubs, one place to look would be our small and mid-sized metro area lists. Here the top ranks are dominated by college towns, including Baton Rouge, La., home to Louisiana State University, where information employment has surged 28.6% since 2009. It places third on our mid-size cities list, which also features such high-flying college towns as fourth place Provo-Orem, Utah (Brigham Young), No. 5 Durham-Chapel Hill (Duke, University of North Carolina), No. 6 Madison (University of Wisconsin), and No. 7 Ann Arbor (University of Michigan).

The information sector may not be a big job generator, but it does play a critical role in several of our most important economies, including the San Francisco, New York, Los Angeles and Austin metro areas. The clear shift we are seeing towards consolidation of media with tech – a la Apple, Netflix and Google — will likely underpin a movement of these coveted jobs from traditional media centers to the Bay. But  given the unfriendly business atmosphere in California, and the super-high prices for houses, it also makes sense to look at secondary information centers, both in the Sun Belt and among college towns, which may attract even more of these jobs in the years ahead.

Joel Kotkin is executive editor of NewGeography.com and Roger Hobbs Distinguished Fellow in Urban Studies at Chapman University, and a member of the editorial board of the Orange County Register. He is also executive director of the Houston-based Center for Opportunity Urbanism. His newest book, The New Class Conflict is now available at Amazon and Telos Press. He is also author of The City: A Global History and The Next Hundred Million: America in 2050.  He lives in Los Angeles, CA.

Michael Shires, Ph.D. is a professor at Pepperdine University School of Public Policy.

Stack and Pack vs. Smear All Over

$
0
0

I drove out to a distant suburb recently to attend to some business and I passed by a cluster of billboards on the side of the freeway that got me thinking. The general gist of the slogans asserted a conservative anti-government anti-urban rebellion. These are clearly people who don’t want density and public transit imposed on them by pointy headed liberal idiots. I have to admit I have some sympathy for this perspective, although probably not for the same reasons as the billboard people. Their knee jerk reaction makes clear what they don’t want, but offers no alternative response to the underlying difficulties faced by the inevitable urbanization of rural areas.

Screen Shot 2015-06-06 at 1.45.36 AM

Screen Shot 2015-06-06 at 1.44.07 AM

Screen Shot 2015-06-06 at 1.44.23 AM

Screen Shot 2015-06-06 at 1.43.24 AM

Screen Shot 2015-06-06 at 1.43.47 AM

Screen Shot 2015-06-06 at 3.07.22 AM

Screen Shot 2015-06-06 at 3.05.57 AM

Screen Shot 2015-06-06 at 3.05.27 AM

Screen Shot 2015-06-06 at 3.06.59 AM

Screen Shot 2015-06-06 at 3.06.43 AM

Here’s the fantasy of how this particular area should remain: bucolic landscapes, family farms, charming old homes, and delicate churches with little graveyards out back. But these are all part of a heritage park. School children are brought here to learn what the place was like in the 1850’s.

Screen Shot 2015-06-06 at 3.08.52 AM

Screen Shot 2015-06-06 at 3.11.23 AM

Screen Shot 2015-06-06 at 3.10.27 AM

Screen Shot 2015-06-06 at 3.08.27 AM

Screen Shot 2015-06-06 at 3.08.08 AM

Screen Shot 2015-06-06 at 3.13.18 AM

Turn the camera just slightly to the left or the right and the landscape is filled with gas stations, parking lots, drive-thru banks, and freeway traffic. And everywhere there’s new construction. Money (lots and lots of San Francisco Bay Area money) and a whole lot of people are inevitably going to be occupying what is now open space in these distant counties. No political force can stop it. There are two competing models for what that new growth is going to look like and neither is pretty as far as I’m concerned.

Screen Shot 2014-11-17 at 5.42.47 PM

Screen Shot 2014-11-17 at 5.43.17 PM

Screen Shot 2014-11-17 at 5.41.57 PM

Screen Shot 2014-11-17 at 5.42.34 PM

First, there’s the compact, dense, transit oriented development favored by regional planners. (This is precisely the kind of thing the billboard people are so pissy about.) Now… I live in a compact, dense, transit oriented neighborhood in San Francisco that I think is amazing. But when I look at what’s being built in the far flung suburbs I find nothing to love about any of it. The scale is overwhelming. Each of these complexes occupies a massive super block. And it’s not just the size per se that I don’t like. It’s the fact that these buildings have all the drawbacks of density without any of the compensating urbanism. Where are the shops on the ground floor? Where’s the corner grocery? Where are the cafes and nightclubs? Where are the intimate little restaurants and pocket parks? Where are the vibrant walkable places? There just aren’t any. These places are as lifeless as any cul-de-sac, minus the space and privacy provided by a tract house with a yard. It’s not a good combination.

Screen Shot 2015-06-05 at 5.43.30 PM

Screen Shot 2015-06-05 at 5.41.17 PM

Screen Shot 2015-06-05 at 5.38.59 PM

Screen Shot 2015-06-05 at 5.42.04 PM

Screen Shot 2015-06-06 at 2.54.54 AM

Screen Shot 2015-06-05 at 5.42.41 PM

Screen Shot 2015-06-06 at 2.55.35 AM

Screen Shot 2015-06-06 at 3.13.37 AM

Here’s the second option. Traditional American values brought to life in shiny new single family homes with three car garages as far as the eye can see. This is the alternative to big bad government and communist apartment blocks. Luxury homes chew up the countryside and load the freeway with an unmanageable amount of traffic. And by the way, these homes each cost $1.4M.

I compare this political situation with the dilemma the country faced in the early 1980’s when Reagan came to power. Conservatives hated the idea that the government operated halfway houses and insane asylums. They wanted no part of drug treatment programs either. At the same time liberals insisted that it was inhumane to lock people up against their will in underfunded and uncaring institutions where they were likely to be mistreated. So the two opposing elements of society conspired to shut down such institutions. The problem, of course, is that the mentally ill, drug addicted, and penniless segment of American society didn’t just disappear. They now live on our streets and fill our prisons. Both sides got what they wanted, but the problems persist in slightly different forms. So it is with the battles over land use regulation. Happenstance brings us a funky world and we all just muddle through some how.

John Sanphillippo lives in San Francisco and blogs about urbanism, adaptation, and resilience at granolashotgun.com. He's a member of the Congress for New Urbanism, films videos for faircompanies.com, and is a regular contributor to Strongtowns.org. He earns his living by buying, renovating, and renting undervalued properties in places that have good long term prospects. He is a graduate of Rutgers University.

Viewing all 3788 articles
Browse latest View live


Latest Images