Quantcast
Channel: Newgeography.com - Economic, demographic, and political commentary about places
Viewing all 3792 articles
Browse latest View live

Enterprising States 2014: Re-creating Equality of Opportunity

$
0
0

This is the executive summary for the U.S. Chamber of Commerce Foundation's 5th Annual Enterprising States report, authored annually by Praxis Strategy Group. View the interactive map with state-by-state data and download the full report here.

The growing skills gap is one of the most persistent challenges affecting thriving and lagging state economies—the disparity between the skills companies need to drive growth and innovation versus the skills that actually exist within their organizations and in the labor market. This disconnect, expected to grow substantially as the boomer generation retires, causes workers and companies to miss out on realizing their full potential. A sizable skills gap impacts virtually every aspect of the economy, thereby affecting our national competitiveness and, in turn, causing the economy to fall short of its potential.

The nature of the skills gap that employers face varies by geography. Each state has its own economic DNA with varying levels of growth and specialization for each industry. The energy-related skills gap in Texas or North Dakota, for example, is different from a manufacturing-driven gap in Michigan, aerospace in Washington, information technology in Utah, or the chemical industry in Louisiana.

Businesses and the public sector must work side by side to identify where there is a deficit of talent, reskill incumbent workers, and skill new entrants into the workforce to close the gaps within their communities. This is not a problem that can be solved quickly, but it can be solved. Strengthening America’s science, technology, engineering, and mathematics (STEM) and middle-skills pipeline will require public-private partnerships as well as collaborations across federal, state, and local governments.

States as a Focal Point for Action

States and their governors play a pivotal role in filling the talent pipeline, providing critical leadership to link businesses with the education, workforce, and economic development systems. Solutions will vary by state of course, but there is an emerging framework built on a foundation of both basic education and an employer-responsive workforce pipeline.

Economic development starts with strong schools focused on 21st century skills. For the past three decades, efforts by U.S. businesses, government, and educational organizations focused on retooling K–12 science, mathematics, and reading education and on addressing persistently high dropout rates in inner cities. Progress has been slow to remedy the looming skills shortage, but there is a growing sense of optimism that industry sector partnerships, greater attention to career pathways, and the implementation of integrated education and training will help to close the gap.

An employer-responsive talent pipeline requires aligning education, workforce development, and economic development. Postsecondary education institutions now get a considerably lower percentage of their funding from state sources than just a decade ago, but states continue to make significant financial investments in higher education. Yet, a common refrain is that postsecondary offerings—at both two- and four-year institutions—are not sufficiently aligned with the skills needed in the workforce. For years, knowledge creation, research and development, and technology transfer have dominated higher education’s economic development role. However, higher education’s most important contribution to state economic competitiveness in the future might be teaching and talent production because states with the most high-level talent will have a leg up in the future economy of decentralized global networks.

Investing in people is perhaps the most effective long-term economic growth strategy. Training and education offer the best chance for workers to find well-paying long-term employment, while providing businesses and employers in every sector with the talent they need to grow.

Coordinating education, workforce development, and economic development has proven to be challenging among the states because the three fields are historically separate systems, with separate cultures and perspectives. States that are successful in navigating program integration and facilitating collaboration between these traditionally separate institutions will put themselves in the forefront of meeting one of the primary challenges to building a 21st century economy.

Because of these complexities, a governor serves the issue best by playing a leadership role in forming partnerships – particularly between business and education – and creating the structure to ensure effectiveness and efficiency in a demand-driven education to workforce pipeline. Often this involves a decentralized approach so that more decisions can be made at the local level.

Enterprising States 2014

Now in its fifth edition, the Enterprising States study measures state performance overall and across five policy areas important for job growth and economic prosperity. Those five areas include:

  • Talent Pipeline
  • Exports and International Trade
  • Technology and Entrepreneurship
  • Business Climate
  • Infrastructure

The 2014 report relates these policies and practices to the need for collaboration between education, workforce development, and economic development to positively combat the nation's growing skills gap.  

Top Performers

Utah lands in the top 6 in each of the five policy categories and 3rd in overall economic performance. It is the only state to finish in the top 10 on all six lists.

Colorado appears on 5 top 10 lists, Texas on 4, and Washington is in the top 15 of five lists.

North Dakota is another strong performer, leading by a large margin in economic performance and ranking 1st in talent metrics and 9th in business climate.

Florida and Nevada rank well on many policy measures, a sign that the economies of those states may be ripe for a turnaround.

Virginia ranks 5th in technology and entrepreneurship, and talent metrics, helping it land just outside the top 10 in economic performance.

Minnesota ranks 10th in economic performance, partly due to its second place in talent pipeline. 

See how your state ranks by viewing our interactive map. Or view a PDF of the full report.

Enterprising States is authored by Praxis Strategy Group along with Joel Kotkin. Praxis Strategy Group is an economic research, analysis, and strategic planning firmJoel Kotkin is executive editor of NewGeography.com and author of the forthcoming The New Class Conflict.


New York, Legacy Cities Dominate Transit Urban Core Gains

$
0
0

Much attention has been given the increase in transit use in America. In context, the gains have been small, and very concentrated (see: No Fundamental Shift to Transit, Not Even a Shift). Much of the gain has been in the urban cores, which house only 14 percent of metropolitan area population. Virtually all of the urban core gain (99 percent) has been in the six metropolitan areas with transit legacy cities (New York, Chicago, Philadelphia, San Francisco, Boston, and Washington).

In recent articles, I have detailed a finer grained, more representative picture of urban cores, suburbs and exurbs than is possible with conventional jurisdictional (core city versus suburban) analysis. The articles published so far are indicated in the "City Sector Articles Note," below.

Transit Commuting in the Urban Core

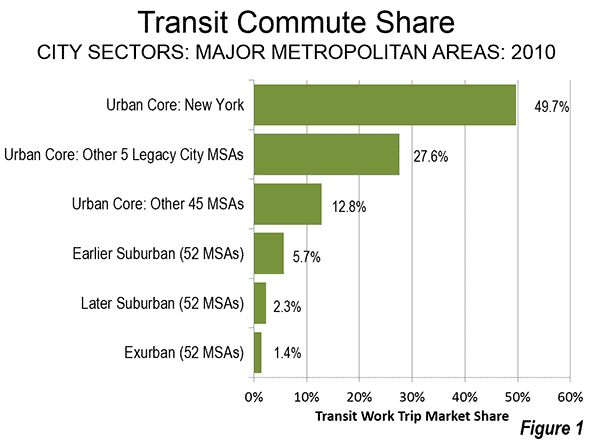
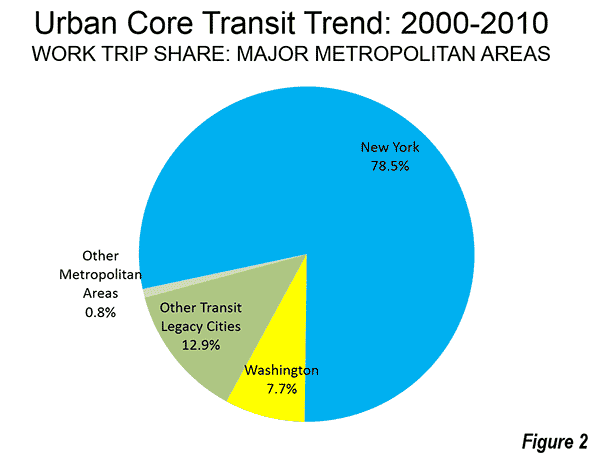
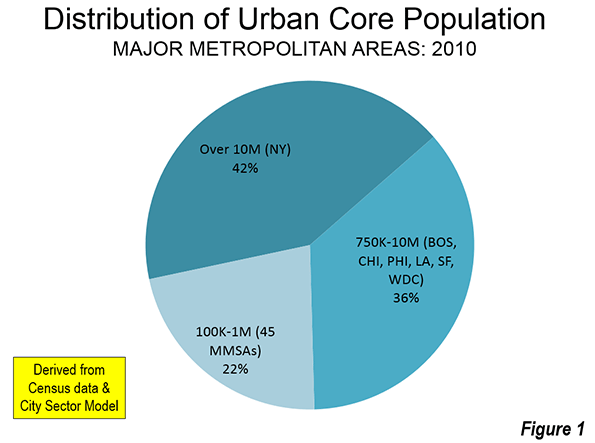
As is so often the case with transit statistics, recent urban cores trends are largely a New York story. New York accounted for nearly 80 percent of the increase in urban core transit commuting. New York and the other five metropolitan areas with "transit legacy cities" represented more than 99 percent of the increase in urban core transit commuting (Figure 1). This is not surprising, because the urban cores of these metropolitan areas developed during the heyday of transit dominance, and before broad automobile availability. Indeed, urban core transit commuting became even more concentrated over the past decade. The 99 percent of new commuting (600,000 one-way trips) by transit in the legacy city metropolitan areas was as well above their 88 percent of urban core transit commuting in 2000.

New York's transit commute share was 49.7 percent in 2010, well above the 27.6 percent posted by the other five metropolitan areas with transit legacy cities. The urban cores of the remaining 45 major metropolitan areas (those over 1,000,000 population) had a much lower combined transit work trip market share, at 12.8 percent.

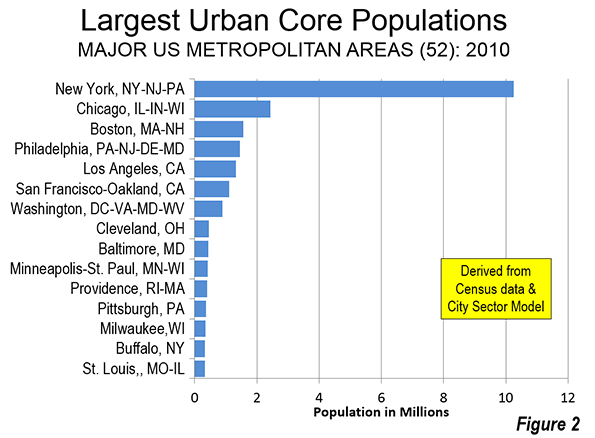
The suburban and exurban areas, with 86 percent of the major metropolitan area population, had much lower transit commute shares. The Earlier Suburban areas (generally median house construction dates of 1946 to 1979, with significant automobile orientation) had a transit market share of 5.7 percent, the Later Suburban areas 2.3 percent and the Exurban areas 1.4 percent (Figure 2).

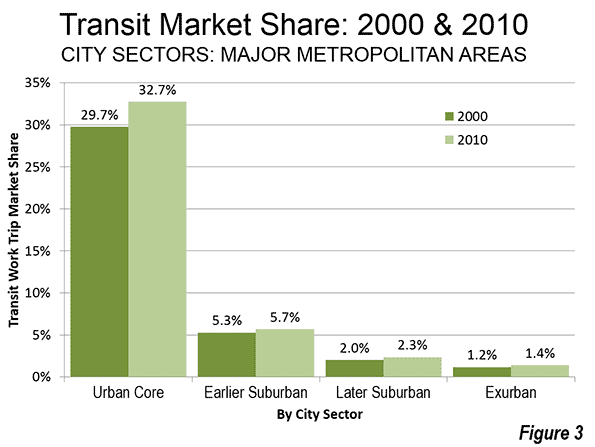
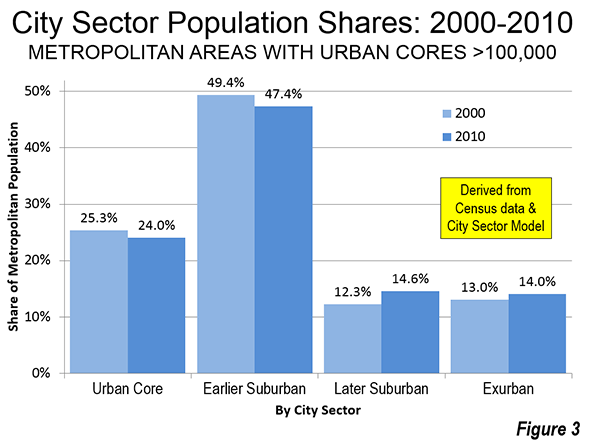
The 2000s were indeed a relatively good decade for transit, after nearly 50 years that saw its ridership (passenger miles) drop by nearly three-quarters to its 1992 nadir. Since that time, transit has recovered 20 percent of its loss. Transit commuting has always been the strongest in urban cores, because the intense concentration of destinations in the larger downtown areas (central business districts) that can be effectively served by transit, unlike the dispersed patterns that exist in the much larger parts of metropolitan areas that are suburban or exurban. Transit's share of work trips by urban core residents rose a full 10 percent, from 29.7 percent to 32.7 percent (Figure 3).

There were also transit commuting gains in the suburbs and exurbs. However, similar gains over the next quarter century would leave transit's share at below 5 percent in the suburbs and exurbs, because of its small base or ridership in these areas.

Walking and Cycling

The share of commuters walking and cycling (referred to as "active transportation" in the Queen's University research on Canada's metropolitan areas) rose 12 percent in the urban core (from 9.2 percent to 10.3 percent), even more than transit. This is considerably higher than in suburban and exurban areas, where walking and cycling remained at a 1.9 percent market share from 2000 to 2010.

Working at Home

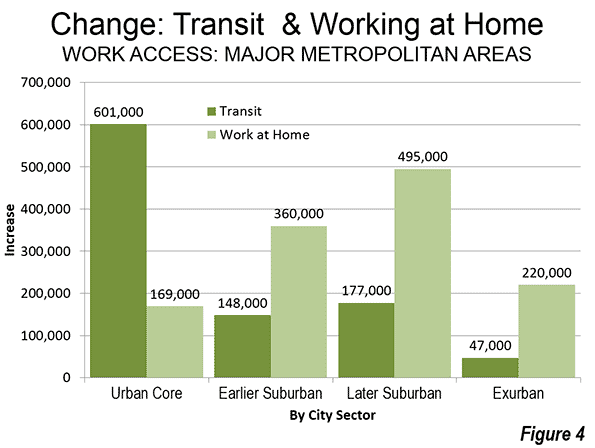
Working at home (including telecommuting) continues to grow faster than any work access mode, though like transit, from a small base. Working at home experienced strong increases in each of the four metropolitan sectors, rising a full percentage point or more in each. At the beginning of the decade, working at home accounted for less work commutes than walking and cycling, and by 2010 was nearly 30 percent larger.

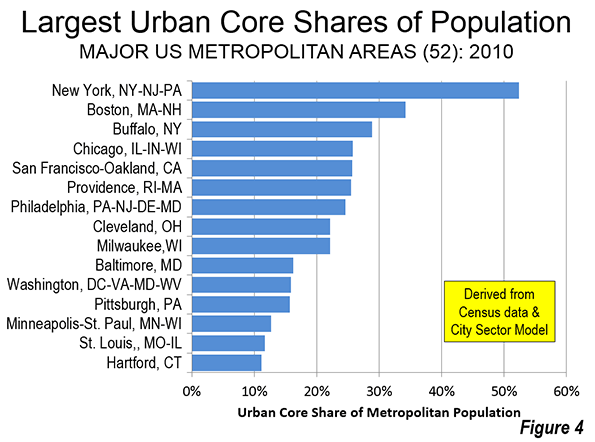
The working at home largest gain was in the Earlier Suburban Areas, with a nearly 500,000 person increase. Unlike transit, working at home does not require concentrated destinations, effectively accessing employment throughout the metropolitan area, the nation and the world. As a result, working at home's growth is fairly constant across the urban core, suburbs and exurbs (Figure 4). Working at home has a number of advantages. For example, working at home (1) eliminates the work trip, freeing additional leisure or work time for the employee, (2) eliminates greenhouse gas emissions from the work trip, (3) expands the geographical area and the efficiency of the labor market (important because larger labor markets tend to have greater economic growth and job creation, and it does all this without (4) requiring government expenditure.

Driving Alone

Despite empty premises about transit's potential, driving remains the only mode of transport capable of comprehensively serving the modern metropolitan area. Driving alone has continued its domination, rising from 73.4 percent to 73.5 percent of major metropolitan area commuting and accounting for three quarters of new work trips. In the past decade, driving alone added 6.1 million commuters, nearly equal to the total of 6.3 million major metropolitan area transit commuters and more than the working at home figure of 3.5 million. To be sure, driving alone added commuters in the urban core, but lost share to transit, dropping from 45.2 percent to 43.4 percent. In suburban and exurban areas, driving alone continued to increase, from 66.7 percent to 67.3 percent of all commuting.).

Density of Cars

The urban cores have by far the highest car densities, despite their strong transit market shares. With a 4,200 household vehicles available per square mile (1,600 per square kilometer), the concentration of cars in urban cores was nearly three times that of the Earlier Suburban areas (1,550 per square mile or  600 per square kilometer) and five times that of the Later Suburban areas (950 per square kilometer). Exurban areas, with their largely rural densities had a car density of 100 per square mile (40 per square kilometer).

Work Trip Travel Times

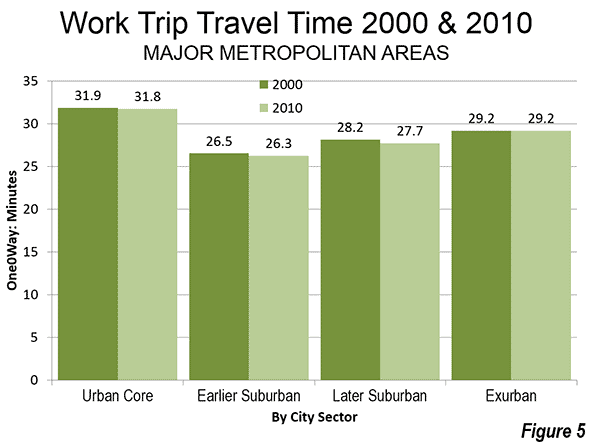
Despite largely anecdotal stories about the super-long commutes of those living in suburbs and exurbs, the longest work trip travel times were in the urban cores, at 31.8 minutes one-way. The shortest travel times were in the Earlier Suburbs (26.3 minutes) and slightly longer in the Later Suburbs (27.7 minutes). Exurban travel times were 29.2 minutes. Work trip travel times declined slightly between 2000 and 2010, except in exurban areas, where they stayed the same. The shorter travel times are to be expected with the continuing evolution from monocentric to polycentric and even "non-centric" employment patterns and a stagnant job market (Figure 5).

Contrasting Transportation in the City Sectors

The examination of metropolitan transportation data by city sector highlights the huge differences that exist between urban cores and the much more extensive suburbs and exurbs. Overall the transit market share in the urban core approaches nine times the share in the suburbs and exurbs. The walking and cycling commute share in the urban core is more than five times that of the suburbs and exurbs. Moreover, the trends of the past 10 years indicate virtually no retrenchment in automobile orientation, as major metropolitan areas rose from 84 percent suburban and exurban in 2000 to 86 percent in 2010. This is despite unprecedented increases is gasoline prices and the disruption of the housing market during worst economic downturn since the Great Depression.

----------------------------

Wendell Cox is principal of Demographia, an international public policy and demographics firm. He is co-author of the "Demographia International Housing Affordability Survey" and author of "Demographia World Urban Areas" and "War on the Dream: How Anti-Sprawl Policy Threatens the Quality of Life." He was appointed to three terms on the Los Angeles County Transportation Commission, where he served with the leading city and county leadership as the only non-elected member. He was appointed to the Amtrak Reform Council to fill the unexpired term of Governor Christine Todd Whitman and has served as a visiting professor at the Conservatoire National des Arts et Metiers, a national university in Paris.

Photograph: DART light rail train in downtown Dallas (by author)

----------------------------

City Sector Note: Previous articles in this series are listed below:

From Jurisdictional to Functional Analyses of Urban Cores & Suburbs

The Long Term: Metro American Goes from 82 percent to 86 percent Suburban Since 1990

Functional v. Jurisdictional Analysis of Metropolitan Areas

City Sector Model Small Area Criteria

Dallas: A City in Transition

$
0
0

I was in Dallas this recently for the New Cities Summit, so it’s a good time to post an update on the city.

I don’t think many of us realize the scale to which Sunbelt mega-boomtowns like Dallas have grown. The Dallas-Ft. Worth metro area is now the fourth largest in the United States with 6.8 million people, and it continues to pile on people and jobs at a fiendish clip.

Many urbanists are not fans of DFW, and it’s easy to understand why. But I think it’s unfair to judge the quality of a city without considering where it is at in its lifecycle. Dallas has been around since the 1800s, but the metroplex is only just now starting to come into its own as a region. It is still in the hypergrowth and wealth building stage, similar to where a place like Chicago was back in the late 19th century. Unsurprisingly, filthy, crass, money-grubbing, unsophisticated Chicago did not appeal to the sophisticates of its day either. But once Chicago got rich, it decided to get classy. Its business booster class endowed first rate cultural institutions like the Art Institute, and tremendous efforts were made to upgrade the quality of the city and deal with the congestion, pollution, substandard housing, and fallout from rapid growth, which threatened to choke off the city’s future success. At some point in its journey, Chicago reached an inflection point where it transitioned to a more mature state. One can perhaps see the 1909 Burnham Plan as the best symbol of this. In addition to addressing practical concerns like street congestion, the Burnham Plan also sought to create a city that could hold its own among the world’s elite. And you’d have to argue the city largely succeeded in that vision.

The DFW area is now at that transition point. They realize that as a city they need to be about more than just growth and money making. They need to have quality and they need to address issues in the system. Much like Burnham Plan era Chicago, this perhaps makes DFW a potentially very exciting place to be. It’s not everyday when you can be part of building a new aspirational future for a city that’s already been a successful boomtown. The locals I talked to were pretty pumped about their city and where it’s going.

How true this is I don’t know, but some people have attributed a change in mindset to the loss in the competition to land Boeing’s headquarters. Boeing ended up choosing Chicago over Dallas. In part this was because Chicago bought the business with lavish subsidies that far outclassed what Dallas put on the table. But it was also because Boeing saw Chicago as a more congenial environment for global company C-suite and other top executives to be, both from a lifestyle perspective and that of access to other globally elite firms and workers available in Chicago.

Meanwhile, the cracks in the DFW growth model were becoming apparent, especially in the core city of Dallas. Ten years ago the Dallas Morning News ran a series called “Dallas at a Tipping Point: A Roadmap For Renewal.” This series was underpinned by a report prepared by the consulting firm Booz Allen. This report is well worth reading by almost anyone today as it is a rare example of a city that was able to get insight and recommendations from the type of tier one strategy firm used by major corporations. Booz Allen was direct in their findings, though perhaps with a bit of hyperbole in the Detroit comparison:

Dallas stands at the verge of entering a cycle of decline…On its current path, Dallas will, in the next 20 years, go the way of declining cities like Detroit – a hollow core abandoned by the middle class and surrounded by suburbs that outperform the city but inevitably are dragged down by it.

….

If the City of Dallas were a corporate client, we would note that it has fallen significantly behind its competitors. We would warn that its product offering is becoming less and less compelling to its core group of target customers…We would further caution the management that they are in an especially dangerous position because overall growth in the market…is masking the depth of its underlying problems. We would explain that in our experience, companies in fast growing markets are often those most at risk because they frequently do not realize they are falling behind until the situation is irreversible.

Put into the language of business, we would note that Dallas is under-investing in its core product, has not embraced best practices throughout its management or operations, and is fast becoming burdened by long term liabilities that could bankrupt the company if the market takes a downturn.

The city responded in a number of ways, some of which were similar to Chicago at its inflection point. Many of these involve various urbanist “best practices” or conventional wisdom type trends.

By far the most important of these was adopting modern statistically driven policing approaches. As crime plummeted in places like New York during the 1990s, Dallas did not see a decline of its own. But with the expansion of police headcount and adoption of new strategies by new police chief David Kunkle in 2004 – and no doubt some help from national trends – crime fell steeply during the 2000s. The Dallas Morning News says that the city’s violent and property crime rates fell by a greater percentage than any other city with over one million residents over the last decade. In 2013, Dallas had its overall lowest crime rate in 47 years.

This is critical because nothing else matters without safe streets. I’ve had many a jousting match with other urbanists on discussion boards about where crime falls on the list of priorities. In my view it’s clearly #1 – even more so than education. It’s simply a prerequisite to almost any other systemic good happening in your cities. Students can’t learn effectively if they live and attend school in dangerous environments, for example. NYU economist Paul Romer made this point forcefully in his New Cities keynote, saying that fighting crime is the most important function of government and that if you don’t deliver on crime control your city will go into decline. Fortunately, Dallas seems to have gotten the message.

But there’s been attention to physical infrastructure as well. The area has built America’s largest light rail system (which was in the works since the early 1980s).


Dallas Area Rapid Transit (DART) light rail train. Source: Wikipedia

Both the city and region remain fundamentally auto-centric, however, and this is unlikely to change.

There’s been a significant investment in quality green spaces. A major initiative called theTrinity River Project is designed to reclaim the Trinity River corridor through the city as a recreational amenity. This is underway but proceeding slowing. Among the aspects of the project is a series of three planned signature bridges designed by Santiago Calatrava. The only one completed is the Margaret Hunt Hill Bridge.


The Margaret Hunt Hill Bridge in Downtown Dallas. Designed by Santiago Calatrava. Source: Wikipedia

The single bridge tower is quite an imposing presence on the skyline. However, the size of the bridge creates an awkward contrast with the glorified creek that is the Trinity River. It looks to me like they significantly over-engineered what should have been a fairly straightforward flood plain to span just so they could create a major structure.

Another green space project – and the best thing I saw in my trip to Dallas – is Klyde Warren Park, which is built on a freeway cap. About half the cost came from $50 million donations. I’ll be going into more detail on this in my next installment, but here’s a teaser photo:


Klyde Warren Park. Source: Wikipedia

The Calatrava bridge shows that Dallas has embraced the starchitect trend. This was also on display in the creation of the Dallas Arts District. Complementing the Dallas Museum of Art are a billion dollars worth of starchitect designed facilities including Renzo Piano’s Nasher Sculpture Center, IM Pei’s symphony center, Norman Foster’s Winspear Opera House, and OMA’s Wyly Theatre.


Dee and Charles Wyly Theatre. Designed by OMA’s Joshua Prince-Ramus (partner in charge) and Rem Koolhaas

This arts district – which naturally Dallas boasts is the world’s largest – along with the other major investments that were funded with significant private contributions show a major advantage Texas metros like DFW and Houston have: philanthropy. These are new money towns on their way up and local billionaires are willing to open their wallets bigtime in an attempt to realize world class ambitions, exactly the way Chicago’s did all those decades back.

By contrast many northern tier cities are dependent on legacy philanthropy, such as foundations set up in an era when they were industrial power houses. This is a dwindling inheritance. What’s more, what wealthy residents they do have are as likely to be taking money out of their cities through cash for cronies projects than they are to be putting it in. Thus they can be a negative not positive influence.

This shows the importance of wealth building in cities. Commercial endeavors can appear crass or greedy at times, and deservedly so. But without wealth, you can’t afford to do anything. There’s a reason Dallas could build America’s largest light rail system – it had the money to do so. Similarly with this performing arts district. To be a city of ambition requires that a place also be an engine of wealth generation.

I’m sure that Dallas’ moneyed elite are well taken care of locally and exert outsized influence on decision making. I don’t want to make them out to be puristic altruists. But they’ve shown they are willing to open their wallets in a serious way, something that’s not true everywhere.

This is a flavor of what Dallas has been up to. It’s too early to say whether the city will make the same transition Chicago did. Its greatest challenge also awaits some time in the future. When DFW’s hypergrowth phase ends and the city must, like New York and Chicago before it, reinvent itself for a new age, that’s when we will find out if DFW has what it takes to join the world’s elite, or whether it will fade like a flower as Detroit and so many other places did.

Toyota did just announce it’s moving 3,500 jobs to north suburban Plano. But corporations have long seen Dallas a place for large white collar operations. Boeing was what I call an “executive headquarters” – a fairly small operation consisting of only the most senior people. I haven’t seen Dallas win any of these as of yet.

The Dallas Morning News takes a somewhat mixed view on the city itself. They just did a special section called “Future Dallas: Making Strides, Facing Challenges,” the title of which sums it up. Dallas has put a lot of pieces on the board and made major progress on areas like crime, but it’s failed to make a dent in others, such as Booz Allen’s call to make the city more attractive to middle class families. Poverty is actually up since then, and the city is increasingly unequal in its income distribution. Dallas is not unique in that, but that’s cold comfort.

Despite gigantic regional growth, the city’s population has been nearly flat. Despite the vaunted Texas and DFW jobs engine, Dallas County has lost about 100,000 jobs since 2000. The core is clearly continuing in relative decline, and the Dallas County job losses are particularly troubling. I’m no believer in this idea that everybody is going to abandon the suburbs and head back to the city. But as former Indianapolis Mayor Bill Hudnut put it, you can’t be a suburb of nowhere. If the core loses economic vitality, the entire DFW regional will take a hit to its growth.

Aaron M. Renn is an independent writer on urban affairs and the founder of Telestrian, a data analysis and mapping tool. He writes at The Urbanophile, where this piece originally appeared.

Dallas photo by Bigstock.

The Cities Stealing Jobs From Wall Street

$
0
0

When we think about American finance, the default image is of a pinstriped banker on Wall Street. But increasingly financial services is shifting away from the traditional bastions of money.

In an analysis of recent and longer-term employment trends, we have identified the large cities –those with over 450,000 jobs – that are gaining jobs in financial services, a sector that employs 7.9 million people nationwide.  Overwhelmingly, the fastest growth has been in cities not associated with high finance, but largely low-cost Sun Belt cities, which account for seven of the top 10 large metro areas on our list.

View the Best Cities for Manufacturing Jobs 2014 List

In first place: Phoenix-Mesa-Glendale, Ariz., where financial employment has expanded 12.3% since 2008 and a remarkable 7.2% last year. Close behind in second through fourth are San Antonio-New-Braunfels, Texas, Austin-Round Rock-San Marcos, Texas, and Nashville-Murfreesboro-Franklin, Tenn. These metro areas have advantages beyond just warmer weather; all are places with affordable housing and no state income taxes.

The three metro areas outside the Sun Belt in our top 10 also enjoy lower levels of taxation and housing prices. St. Louis, Mo. (fifth), Salt Lake City (seventh), and Richmond, Va. (ninth), have begun to bulk up on financial jobs, largely to the detriment of the traditional money centers New York (44th), San Francisco (48th), Boston (55th), Los Angeles (57th) and Chicago (61st). Despite the current stock market boom, and good times for large banks, financial services employment in these cities has been stagnant in recent years. Since 2008, New York has lost 3.8% of all its finance-related jobs, while Los Angeles’ financial sector has shed 7% of its jobs and Chicago 6.7%.

Why Financial Services  Are Moving

Current financial trends—accelerated By TARP and “too big to fail” regulations—have ledto a growing concentration of banking and financial services in the six largest money-center banks.  In the first five years of the Obama administration the share of financial assets held by the top six banks soared 37% to account for two-thirds of all bank assets.

But as we have seen in other industries, that domination of market share don’t necessarily drive employment growth where the big banks are headquartered. Increasingly we are seeing the rise of what urban analyst Aaron Renn describes as the “executive headquarters,” where only elite employees and their support staff remain while the vast majority of jobs migrate to lower-cost places.

Given the advances in telecommunications technology, many of the core functions of banks can be conducted anywhere. Why have a midlevel salesperson or mortgage loan processor occupy expensive Manhattan office space when they could function as effectively from much cheaper space in Phoenix, Saint Louis or Richmond?

Pundits like to speak about “face to face” contact as critical in financial services. This may be true for putting together mergers or IPOs, or to concoct the latest derivative, but it doesn’t matter in taking care of customer questions, monitoring credit cards or administering offices in suburban strip malls.

The People Advantage

These smaller cities have advantages for both the financial institutions and their employees. For one thing, the cost of employees is much lower. According to salary reporting website Payscale.com, the median financial manager in New York or San Francisco costs $90,724 to $98,783, respectively; while one in Phoenix costs only $77,467.

But this is not just good for the companies. Employees who make less in St. Louis, Phoenix or Dallas often live far better than their counterparts who earn higher salaries in the traditional money centers. One big reason is housing costs, which are a third to half cheaper in the top cities on our list than in places like Boston (2013 median home price of $375,900) New York ($465,700), or San Francisco ($679,200).  Compare that to $183,600 in top-rated Phoenix or $171,000 in San Antonio-New Braunfels.  Even in Austin, with its surging growth in technology and its role as state capital and home to a huge public university, the median home costs a relatively affordable $222,900, according to the National Association of Realtors.

Sometimes it‘s not just lower costs. If you are servicing Spanish-language customers, for example, a location in San Antonio, Phoenix or Austin with their large Spanish-speaking workforces might prove convenient. If you are interested in trade finance, Texas, now the leading export state, might prove attractive. Firms concentrating on mortgages might also see advantages in locating in places like Nashville, Phoenix, Austin, Dallas and San Antonio, which are all expected to add many more households, according to a recent Pitney Bowes  survey, than much slower-growing locales in California or the Northeastern seaboard.

And then there is the unique case of Salt Lake, another emerging financial powerhouse. Mormons’ linguistic skills have attracted loads of big international companies, such as Goldman Sachs, who need people capable of conversing in Lithuanian, Chinese and Tongan. Goldman has 1,400 employees in Salt Lake City, making it the investment bank’s sixth largest location worldwide.

Future Trends

People tend to see the growth of the biggest banks as confirming the notion that economic opportunity will continue to be concentrated in our elite, expensive cities. Yet in reality urban growth patterns seem to suggest that these cities cannot easily accommodate mid-skill or middle-management jobs. So even as decision-making remains ensconced in New York,  Boston  or Chicago, the flow of the vast majority of financial jobs should continue to head outward.

This competition may become all the greater if, as Deloitte predicts, financial service employment begins to spike with a long-term economic recovery. Nor will the emerging financial states be satisfied long-term with the bottom end of the financial employment pool. Palm Beach, Fla., for example, has set up an office to lure hedge funds out of the New York area, touting warm weather and much lower taxes.

Increasingly, some New York financial institutions are starting movemore critical roles to lower-cost areas, like investment advisory and technology jobs. Places like St. Louis, where the industry has grownand approaches critical mass, seem to be in position to make a serious bid for higher-end  jobs.

Although no one expects Phoenix or Salt Lake City to overtake Manhattan as the financial center of the world, over time we can expect these cities to develop into important banking centers. Just as the move of automakers to the Southeast and tech companies to Austin, Salt Lake City and Raleigh remade the economic map of those industries, the shift of financial services to the new centers might eventually do the same in that sector as well.

View the Best Cities for Manufacturing Jobs 2014 List

This story originally appeared at Forbes.

Joel Kotkin is executive editor of NewGeography.com and Distinguished Presidential Fellow in Urban Futures at Chapman University, and a member of the editorial board of the Orange County Register. He is author of The City: A Global History and The Next Hundred Million: America in 2050. His most recent study, The Rise of Postfamilialism, has been widely discussed and distributed internationally. He lives in Los Angeles, CA.

Michael Shires, Ph.D. is a professor at Pepperdine University School of Public Policy.

Photo: robotography

Dawn of the Age of Oligarchy: the Alliance between Government and the 1%

$
0
0

When our current President was elected, many progressives saw the dawning of a new epoch, a more egalitarian and more just Age of Obama. Instead we have witnessed the emergence of the Age of Oligarchy.

The outlines of this new epoch are clear in numerous ways. There is the diminished role for small business, greater concentration of financial assets, and a troubling decline in home ownership. On a cultural level, there is a general malaise about the prospect for upward mobility for future generations.

Not everyone is suffering in this new age. For the entitled few, these have been the best of times. With ever more concentration of key industries, ever greater advantage of capital over labor, and soaring real estate values in swanky places such as Manhattan or San Francisco which , as one journalist put it, constitute “vast gated communities where the one percent reproduces itself." The top hundred firms on the Fortune 500 list has revenues, in adjusted dollars, eight times those during the supposed big-business heyday of the 1960s.    

This shift towards oligarchy well precedes President Obama’s tenure. It was born from a confluence of forces: globalization, the financialization of the economy, and the shift towards digital technology. Obama is not entirely to blame, it is more than a bit ironic that these measurements have worsened under an Administration that has proclaimed income inequality abhorrent.

Obama’s Oligarchs

Despite this administration’s occasional rhetorical flourishes against oligarchy, we have seen a rapid concentration of wealth and depressed conditions for the middle class under Obama. The stimulus, with its emphasis on public sector jobs, did little for Main Street. And under the banner of environmentalism, green cronyism has helped fatten the bank accounts of investment bankers and tech moguls at great public expense.

Wall Street grandees, many of whom should have spent the past years studying the inside of jail cells for their misbehavior, are only bothered by how to spend their ill-gotten earnings, and how not to pay taxes on it. The Obama Administration in concert with the Congress , have consented to allow  the oligarchy to continue paying capital gains taxes well below the income tax rate paid by poor schmuck professionals, small business owners and high-skilled technical types. 

In this, both political parties are to blame. Republican fealty to the interests of the investor class has been long-standing. But Obama and the Democrats are also increasingly backed in their “progressive” causes by the very people -- Wall Street traders, venture capitalists and tech executives -- who benefit most from the federal bailouts, cheap money, low interest rates, and low capital gains tax rates.   

Large financial institutions also have benefited greatly from regulations that guaranteed their survival while allowing for increased concentration of financial assets. Indeed in the first five years of the Obama Administration the share of financial assets held by the top six “too big to fail” banks soared 37%, and now account for two-thirds of all bank assets.  

“Quantitative easing,” the government’s purchase of financial assets from commercial banks, essentially constituted a “too big to fail” windfall to the largest Wall Street firms, notes one former high-level official. By 2011, pay for executives at the largest banking firms    hit new records, just three years after the financial “wizards” left the world economy on the brink of economic catastrophe. Meanwhile, as “too big to fail” banks received huge bailouts, the ranks of  community banks continues dropping to the lowest number since the 1930s, hurting, in particular, small businesspeople that depend on loans from these institutions.

This tilt towards of the financial elites, as Elizabeth Warren has noted, occurred during both the Bush and Obama Administrations. “The government’s most important job,” she remarks, “was to provide a soft landing for the tender fannies of the banks.”

Warren’s observation reflects the influence exercised by the oligarchs in both parties, a bipartisan alliance of the super-rich to buy government influence and protect theior wealth. A recent Mercatus Center report found that politically connected banks received larger bailouts from the Federal Reserve during the financial crisis than financial institutions that spent less or nothing on lobbyingand contributions to political campaigns. Another study by two University of Michigan economist found a strong correlation between receiving TARP assistance and a company’s degree of connectedness to members of congressional finance committees.

As well as they have done lately, Wall Streeters have not been the only oligarchs to thrive under Obama. The tech industry, once an exemplar of dynamic capitalism, has become increasingly dominated by a handful of firms and their venture capital backers. These tech fortunes are greatly enhanced by monopolistic control of key markets, whether in search (Google); computer operating systems (Microsoft); internet retail sales (Amazon); or social media(Facebook). All of the tech giants are incessantly trying to extend their dominion into control of people’s lives, whether by tying them to a device, like the newAmazon phone, or by re-selling people’s data to advertising.

These tech companies, which author Rebecca MacKinnon (labels) calls “the sovereigns of cyberspace,” all enjoy strong, even intimate, ties to the Obama Administration. They have little reason to fear anti-trust crackdowns or scrutiny of their increasingly gross violations of privacy from friendly government lawyers.

Of course, if thing ever soured with the Democrats, the oligarchs can always look for benefactors among Republicans legislators, as Facebook and Google are already doing,. After all, most Republicans, particularly in the Senate, embraced the bailout of the large financial institutions -- the very essence of the crony capitalism that favors large, well-connected institutions over smaller ones.

For the most part, the oligarchs have lined up with Obama from the start. Indeed, at his first inaugural, notes one sympathetic chronicler, the biggest problem for donors was to find sufficient parking space for their private jets. As an observer at the left-leaning Huffington Post put it, “the rising tide has lifted fewer boats during the Obama years -and the ones it's lifted have been mostly yachts.”      

The War Against Small Business

If Obama has proven a god-send for the oligarchs, he has been less solicitous of small business. Long a key source of new jobs, small business start-ups have declined as a portion of all business growth from 50 percent in the early 1980s to 35% in 2010. Indeed, a 2014 Brookings report, revealed small business “dynamism,” measured by the growth of new firms compared with the closing of older ones, has declined significantly over the past decade, with more firms closing than starting for the first time in a quarter century.

There are many explanations for this decline, including the impact of offshoring, globalization and technology. But much can be traced to the expansion of regulatory power. Small firms, according to a 2010 report by the Small Business Administration, spend one-third more per employee than larger firms on staff  who can help them meet with federal dictats. The biggest hit to small business comes from environmental regulations, which cost 364% per employee more for small firms than large ones. Small business owners and self-employed professionals also have also been among those most impacted, through the cancellations of their health care policies, by the Affordable Care Act.

The Politics of Oligarchy

To be sure, every society has its Oligarchs, those who take leadership and lay foundations for the future. Economically, the oligarchs are necessary as creators and investors in new economic potential. The great 19th century robber barons, though often exceedingly ruthless in their practices, left an enormous legacy in the form of industries such as steel, utilities and railroads that underpinned the industrial era. But only later, due to reforms and the further expansion of the economy, did the oligarch’s work translate into mass affluence.

The need to put limits on oligarchic power was clear to leaders such as Theodore Roosevelt who labeled his era’s moguls as “malefactors of great wealth.” In the early 20th century, many progressives and populists, as well as a growing socialist movement, rose to oppose oligarchy. But for most this was not so much an anti-capitalist, or even anti-market movement as a concern great power and wealth concentrated in the hands of the few. That seem fear of concentrated, anti-democratic power worried the founders, like Jefferson and Madison, who confronted a very different kind of oligarchy during the war for independence. 

“We can have democracy in this country, or we can have great wealth concentrated in the hands of a few,” Supreme Court justice Louis Brandeis once noted, “but we can't have both.”

These sentiments are still valid. Many, if not most Americans, recognize that our political economy is not working for the majority of the country. The vast majority recognize the reality of crony capitalism and understand that government contracts go to the politically connected. More troubling still, less than one third believe the country even operates under a free market system. Most suspect that the American dream is falling increasingly out of reach. By margins of more than two to one, Americans say they enjoy fewer economic opportunities than their parents, and that their offspring will have far less job security and disposable income.     

Today, Americans increasingly see the same threat Brandeis saw. American politics has ceased to function as a rising democracy and come to resemble an emerging plutocracy. These days, political choice is fought over by dueling groups of billionaires appealing to right and left to see who will best look after their interests. This can be seen in the emergence of conservative oligarchs like the energy billionaire Koch Brothers or the heirs to the Wal-mart fortune, who have emerged as the ultimate bêtes  noires for Democrats like Senate Majority Leader Harry Reid.

Yet Reid and other Democrats have less problem with their own oligarchs. Among the .01 percent wealthiest Americans who increasingly dominate political giving, the largest contributions besides the conservative Club for Growth went to Democrat aligned groups such as Emily’s list, Act Blue and Moveon.org. Seven of the ten Congressional candidates most dependent on the money of the ultra-rich were Democrats. In 2012, President Obama won eight of the country’s ten wealthiest counties, sometimes by margins of two-to-one or better. He also triumphed easily in virtually all the top counties with the highest concentrations of millionaires and among wealthy hedge fund managers.  

The Oligarchs pervasive influence buying from both parties undermines the very structure of the democratic system as well as a competitive economy. It allows specific interests -developers, Wall Street, Silicon Valley, renewable or fossil fuels producers - enormous  range to make or break candidates. As the powerful battle, the middle classes increasingly become spectators.  It’s not far off from the decadent phase at the end of Greek democracy or the late Roman Republic, examples that resonated with our classically educated founders.

Many Americans today are alarmed, and rightfully so, by this concentration of wealth and power. But right now this grassroots reaction mainly finds its expression from the political fringes. The Tea Party, for example, had its origins in opposition to the bank bailouts that followed the financial crisis. This, not surprisingly, has made some large bank executives as wary of this right-wing movement as they were of Occupy Wall Street.

In contrast, the oligarchs have little to fear from the mainstream of either party, though there are signs that smoke is wafting over the political horizon. The defeat of house majority leader Eric Cantor partly reflected concern over his incessant lobbying and cozying up to Wall Street. Similarly, nascent opposition to Hillary Clinton’s corporatist campaign is coming from at least some Democrats, notably Massachusetts Senator Elizabeth Warren. The recent shift leftwards of the Democratic Party, epitomized by New York’s Bill de Blasio but spreading nationwide testifies to growing unrest among the grassroots.

These voices, both right and left, are still far from the main corridors of federal power but they are getting closer. The oligarchs should not rest too comfortably. An observer of gilded age America may have also assumed that the oligarchic power of the robber barons and industrial magnates would continue to wax inexorably. Yet, there comes a time -- as occurred in the early years of the last century and again in the 1930s -- when the political economy so poorly serves the vast majority that it ignites a political prairie fire. We are not there yet, in either party, but if the corrupt bargain between the oligarchs and the political class goes unbroken, the wait may not be long.

This story originally appeared at The Daily Beast..

Joel Kotkin is executive editor of NewGeography.com and Distinguished Presidential Fellow in Urban Futures at Chapman University, and a member of the editorial board of the Orange County Register. His next book The New Class Conflict is now available for pre-order. He is author of The City: A Global History and The Next Hundred Million: America in 2050. His most recent study, The Rise of Postfamilialism, has been widely discussed and distributed internationally. He lives in Los Angeles, CA.

Barack Obama photo by Bigstock.

Energy Preferences to Play Big Role in November

$
0
0

The November election will be played out along all the usual social memes – from gay marriage, racism and immigration to the “war against women.” But what may determine the outcome revolves around one key economic issue: energy. This has all come to a boil now as President Obama has backed an Environmental Protection Agency effort to accelerate tougher emissions standards, something that could shutter hundreds of coal-fired power plants and slow fossil fuel development across the country.

The energy issue has become in our era what tariffs were in the 19th century: an increasingly insurmountable partition that separates Americans by region and class and which, ultimately, touches on the long-term economic trajectory of the country.

Of course, we have always had politics over energy – given regional variations in sources and kinds of supplies – but, until recently, both parties generally favored developing more oil and natural gas, largely because of the associated high-wage employment growth and potential for reducing the nation’s trade deficit. Now, energy increasingly has become a deeply partisan issue, with Democrats largely in opposition to fossil-fuel development and Republicans, fairly predictably, in support.

Reflecting this trend has been the rise of opposing sets of contributors whose primary concerns are wrapped around energy. On the Republican side, energy industry contributors, including the billionaire industrialist Koch brothers, have become increasingly dominant. More than 90 percent of campaign donations from the oil and gas industries in 2012 went to Republicans.

At the same time, environmentally focused Democratic contributors, led by hedge-fund manager Tom Steyer, have made being anti-fossil-fuel de rigueur for most candidates in the party. Steyer and his allies have become the favorite place to go for cash for Senate Majority Leader Harry Reid of Nevada and other top Democrats.

The Geography of Energy

The most-evident division – and most politically relevant – is geographic. A huge swath of the country, mainly along the Gulf Coast, Texas and the Great Plains, where shale-oil production has grown fourfold since 2007, is enjoying an energy boom that has created a surge in other high-wage, blue-collar fields such as manufacturing and construction. With the delays in approving the Keystone XL oil pipeline and looming new EPA emissions standards, Democratic senators and candidates from these states are, understandably, trying to distance themselves from their party’s increasingly anti-fossil-fuel policies.

More significant, over time, may be how energy plays out in the country’s major political battleground, the rust-belt states. Most of these states are highly dependent on coal for electricity, and some, such as Pennsylvania, Ohio and West Virginia, are seeking to develop new oil and gas finds. Policies that limit fossil-fuel development, may prove a tough sell in some districts and could cost the Democrats several additional Senate seats.

In contrast, the most fervent support for strict climate-change legislation comes mostly from states – notably, the Northeast – that produce little in the way of energy and use relatively little carbon to power their economies. These states need less power than other areas as they already have deindustrialized and have very little population growth.

Two other ultrablue bastions, California and the Pacific Northwest, also advocate a green energy position. The Northwest relies largely on hydro power for its robust industrial sector, lessening dependence on carbon-based energy for electricity. California, itself rich in fossil fuels, largely disdains its resources, and its leaders prefer, for ideological reasons, to subsidize expensive renewable energy. Roughly one-fourth of all energy used in California comes from out of state, much of it from coal. But since this “dirty” power comes from elsewhere, the progressives in places like Hollywood and Silicon Valley can still feel good about our state’s “enlightened” policies, whatever their real effect.

The Class Divide

Historically, Democrats have been big supporters of expanding the energy sector, which includes such things as dams, nuclear power plants and pipelines. But the growing influence of the green movement has reversed that. Green policies are widely embraced by largely Democratic crony capitalists in places like Silicon Valley. They also enjoy almost universal support in academia, where boycotts of fossil-fuel companies are increasingly common. The media, too, is an ally, as is the predictably progressive entertainment industry.

Rest assured, we will never see an HBO series that celebrates George Mitchell, the entrepreneur most responsible for developing fracking. But campus-climate scientists who diverge in any way from the party line on global warming are routinely excoriated as“deniers” of “settled” science, even in the face of 15 years of relatively stable global temperatures. The media has also become a fierce defender of climate orthodoxy. TheLos Angeles Times, as well as the website Reddit, have chosen to exclude contributions from skeptics.

Of course, many traditional Democrats, notably in the construction trades and manufacturing, oppose this drift. Construction unions are apoplectic about the president’s endless delays on Keystone XL, which has two-thirds support from the public. The United Mineworkers, not surprisingly, oppose the new EPA emissions limits, claiming they will cost upward of 75,000 mining jobs.

Some Ohio construction unions, incensed by green opposition to both Keystone and fracking, have shifted support to prodevelopment GOP Gov. John Kasich, despite his conflict with public employee groups. The only prominent national Democrat to identify as pro-fossil-fuel is former Montana governor Brian Schweitzer whose possible run for the presidential nomination seems a bit quixotic in a party increasing dominated by environmental activists and their gentry allies.

What Kind of America do we want?

Ultimately, the energy debate reflects a larger discussion about the future of the country and the economy. This is not merely about emissions and climate change, per se. California’s Draconian laws, even supporters admit, will have no appreciable effect on a global basis, particularly given the state’s already relatively low carbon footprint (largely a factor of the mild climate and the slow growth in its interior in recent years). Indeed, virtually all the world’s significant increases in CO2 are coming from developing countries; since 1990, China has increased its emissions almost threefold, while America’s have dropped. China now emits roughly twice as much greenhouse gas as the U.S.

Some of the steps taken by environmental and renewable-energy interests against natural gas development can even be seen as counterproductive. The U.S.’s better recordon reducing emissions reflects overwhelmingly the shift from coal to natural gas for generating electricity, which has helped the U.S. reduce its carbon emissions more than either Asia or Europe.

Fracking, like any energy technology – including wind and solar – clearly creates environmental problems. There should be strong rules to regulate fracking to make it safer, as Colorado’s Democratic Gov. John Hickenlooper has worked to pass in his state. In addition, major reductions can be achieved through a shift away from oil and coal and toward natural gas, as well as conservation efforts.

Progressives, in particular, need to focus far more on what effects an ultrahigh-cost energy economy would have on the middle and working class. More attention should be paid in accelerating the current spike in job-creating foreign investment into the country, attracted in large part by the development of low-cost, clean natural gas. In contrast, policies hostile to fossil fuels will drive industry to less-environmentally conscious countries, particularly in the developing world.

Sadly, none of this is necessary. America’s economic future is best guaranteed by marrying the successes of Silicon Valley and Hollywood with a robust blue-collar sector that includes fossil fuels, manufacturing, logistics and construction. Emissions can be cut, for the time being, by such steps as replacing coal for generating electricity, improving efficiencies, promoting telework and boosting the use of natural gas for transportation.

Dividing the country, and the electorate, into totally polarized camps over energy may benefit the consultants in both camps who feed off contentious and expensive election campaigns, but will do little to help the futures of most Americans.

This article first appeared in the Orange County Register.

Joel Kotkin is executive editor of NewGeography.com and Distinguished Presidential Fellow in Urban Futures at Chapman University, and a member of the editorial board of the Orange County Register. He is author of The City: A Global History and The Next Hundred Million: America in 2050. His most recent study, The Rise of Postfamilialism, has been widely discussed and distributed internationally. He lives in Los Angeles, CA.

Photo by gfpeck

The Evolving Urban Form: Chongqing

$
0
0

No city in the world is so misunderstood by analysts and the press. It is commonly asserted Chongqing is the largest city in the world. In reality it barely makes the top 50, ranking 47th.

Cities (Shi) in China are Regions and Mostly Rural

It is fundamentally a problem of semantics and a failure to comprehend the nuances of urban geography in China. The country is divided into provinces and their equivalents, which are in turn, divided into prefectures, most of which are "shi," "Shi" translates into English as "city." However, shi are completely different from any English conception of a city as "an inhabited place of greater size, population, or importance than or village" (per Merriam Webster).

There approximately 300 shis and other prefectures (sub-provincial jurisdictions) in China. In contrast, there are approximately 10 times as many sub-state jurisdictions (counties) in United States, which has a land area slightly larger than that of China. China's shi and other prefectures are thus very large. They are really more like regions in English. Virtually all shi are predominantly rural, rather than urban in their land use.

Reporters often marvel at the many cities in China of more than 1,000,000 population. Yet many of these are nothing more than broad expanses of rural areas without large urban settlements. Take, for example, Bazhong, a "shi" of 3.3 million residents in Sichuan province. The largest urban settlement occupies just 5 square miles (13 square kilometers), roughly the same land area as Goodland, Kansas (a city of fewer than 5,000 residents). Bazhong shi's population is spread across a virtually 100 percent rural landscape of 4,700 square miles (12,300 square kilometers).

Chongqing in Context

Chongqing is a shi, and is administered as a province by the national government, as also are Shanghai, Beijing and Tianjin. The province of Chongqing covers 32,000 square miles (82,500 square kilometers). This is nearly equal to the land area of Austria and more than the area of the state of Maine. No city in the world is as large as Austria.. The New York urban area comes the closest to Chongqing's size at 4,500 square miles (11,600 square kilometers), one-seventh the land area of Chongqing.

Not a Metropolitan Area

Nor is it appropriate to consider the province of Chongqing as a metropolitan area (labor market). It is simply too large for that. Commuters from the Chongqing's "Southeast Wing" would have to travel up to 5 hours, mainly on the China's 75 mile per hour (120 kilometer per hour) freeway system to reach work in the Chongqing urban area. From the outer reaches of Chongqing's "Northeast Wing," travel times could exceed 8 hours, again largely by 75 mile per hour freeway.

A Largely Rural, Not Urban Province

The province of Chongqing is predominantly rural yet The Guardian persists in telling us that "Chongqing is the fastest-growing urban centre on the planet. Its population is already bigger than that of Peru or Iraq." Not so. The 2010 Census of China placed the province of Chongqing's population at 28.8 million, smaller than both Peru and Iraq and with fewer people than in 1990. The urban center (genuine city) of Chongqing does not reach a quarter the size of either Peru or Iraq.

The Guardian is by no means alone. Time magazine cluelessly fawned"Virtually overnight, Chongqing has become the largest city not only in China, but in the world," Wired similarly misfired with indicating in a 2008 article that Chongqing (at 32 million population) was the "fastest-growing urban center on Earth." For all the supposed growth, not a soul was added to Chongqing province during the 2000s, as is described below.

Not all media outlets, however, have been captured by the same fallacy as The Guardian, Time, Wired and many others. To its credit, the BBC went to considerable lengths to correct this and similar errors about the population of Chongqing. An Atlanticarticle also parsed the issue well.

Losing Population

In reality Chongqing lost 1.7 million people between 2000 and 2010, 5.5 percent of its population. This is significant. By contrast, the municipality of Chicago lost 6.9 percent over the same period, a loss that was considered devastating. It is not surprising that Chongqing is losing population, given its principally rural nature. Much of rural China is emptying out, as people migrate to the cities for economic opportunity (which is the very purpose of cities), just as they have done in previous decades and the last two century throughout higher income nations. Every year over the past decade, the province experienced an annual decline of 170,000, not the half-million increase reported by The Guardian. The actual urban center (not the imaginary urban center reported on by The Guardian) is gaining in population, but nothing like "half a million" per year.

The Genuine City of Chongqing

There is, however, a genuine city of Chongqing. Surprisingly reminiscent of Pittsburgh, Chongqing is it nestled among elongated folded mountains that are near duplicates of those near the Pennsylvania city. The city is at the confluence to two rivers, the Yangtze and the Jialing. Like the Pittsburgh's Golden Triangle where the Allegheny and Monongahela Rivers meet, Chongqing's has an attractive open space at Chaotianmin where the two rivers meet. Finally, as in Pittsburgh, there is an impressive, high rise central business district behind the open space. This is the best example in China of a monocentric central business district typical of many US cities (downtown Shanghai and Nanjing are similar, but more spread out).


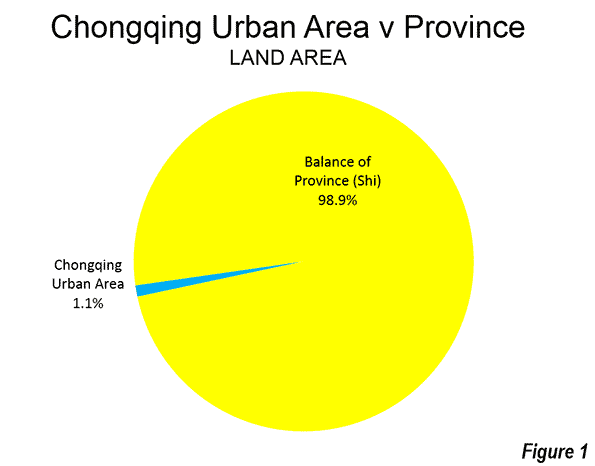
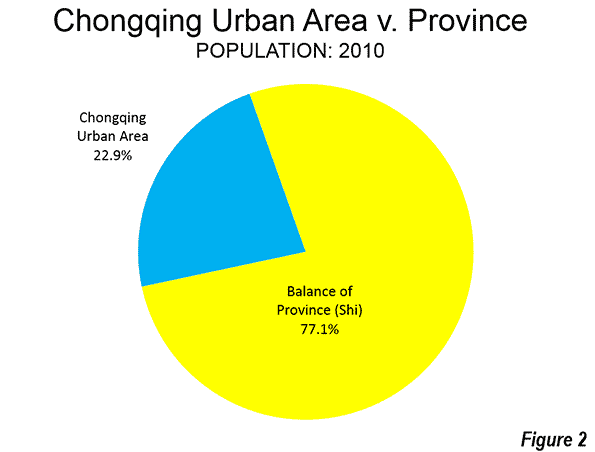
The Chongqing urban area covers little more than 1/100th of the province's land area (Figure 1) and contains less than one-quarter of the population (Figure 2). Yet the Chongqing urban area is still large. According to the 10th Annual Edition of Demographia Urban Areas, Chongqing has a 2014 population of 6.8 million living in a land area of 340 square miles (890 square kilometers). The urban population density is 19,600 per square mile (7,700 per square kilometer), which is about one third higher than the larger urban area average of 14,900 per square mile (5.700 per square kilometer) found across China. This is more than double the density of the Paris urban area, triple the density of the Los Angeles urban area and six times that of Portland.

The "One Hour Economic Circle:" The Future Metropolitan Area

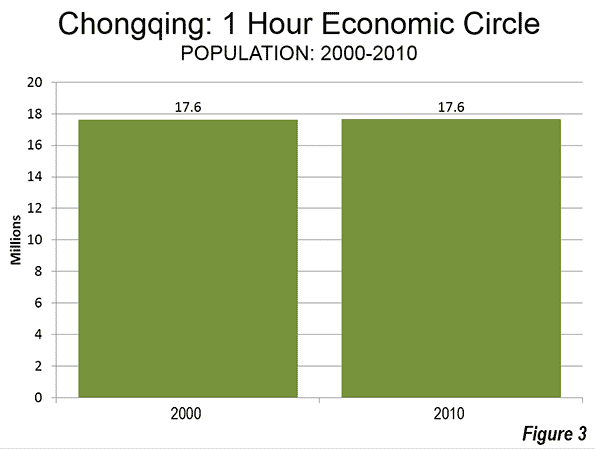
Chongqing's administration has a vision of a much larger city. The urban plan is concentrated on the "One Hour Economic Circle," defined as within "one hour's driving distance." This area includes 23 of Chongqing's 40 divisions (counties and urban districts, or qu's), with a land area of 11,000 square miles (28,600 square kilometers), more than 1.5 times the size of the Paris metropolitan area (aire urbaine) and slightly larger than New York. The 2010 census counted a population of 17.6 million in the One Hour Economic Circle, but most of it still rural. Outside the One Hour Economic Circle, in what is called the "Northeast Wing" and the "Southeast Wing," the rural influence is even greater.

The intent of the urban plan is to broaden the economic influence of the urban area. This would involve substantial increases in economic interchange (principally commuting) with the balance of the One Hour Economic Circle, now decidedly rural.

Within the One Hour Economic Circle, the large rural population suggests the potential for in-situ urbanization could also contribute to economic growth as migration, as rural residents are afforded opportunities to adopt urban lifestyles (as has occurred in Quanzhou and other urban areas, especially in the province of Fuzhou).

Population Trends 2000-2010

The divisions (qu) that encompass the urban area are growing, even though the core is losing (Yuzhong qu). In contrast, the metropolitan area had a population of 8.0 million in 2010, up 19 percent from 2000. This is not particularly rapid growth for China. Nearly 20 metropolitan areas grew twice as fast from 2000 to 2010. Nearby Chengdu, the capital of Sichuan, grew 2.5 times as fast as Chongqing.

Outside the metropolitan area, the One Hour Economic Circle experienced a population loss of 12 percent. As a result of this loss, the One Hour Economic Circle had only a negligible population increase of 0.1 percent between 2000 and 2010 (Figure 3).

The Future

At the presently projected United Nations growth rate, the Chongqing urban area would add nearly one quarter to its population by 2025. But under this pattern Chongqing will barely hold its own, but remain in the top 50 world urban areas. Yet, the city has grand plans. There are nationally and locally designated economic zones, and lower business costs encouraging commerce to move west in China. As a province and urban area directly administered by Beijing, Chongqing could be positioned for both strong population and economic growth. Yet, it remains an open question whether Chongqing will emerge as one of China's major growth centers.

----------------

Note: Shi are divided into county level jurisdictions, such as qu (urban districts), counties (rural districts) and count level shi.

-------

Wendell Cox is principal of Demographia, an international public policy and demographics firm. He is co-author of the "Demographia International Housing Affordability Survey" and author of "Demographia World Urban Areas" and "War on the Dream: How Anti-Sprawl Policy Threatens the Quality of Life." He was appointed to three terms on the Los Angeles County Transportation Commission, where he served with the leading city and county leadership as the only non-elected member. He was appointed to the Amtrak Reform Council to fill the unexpired term of Governor Christine Todd Whitman and has served as a visiting professor at the Conservatoire National des Arts et Metiers, a national university in Paris.

Photo: Downtown Chongqing (by author)

Urban Renewal Needs More than ‘Garden City’ Stamp to Take Root

$
0
0

Every few years the ideals of Ebenezer Howard’s garden city utopia are resurrected in an attempt by the UK government to create new communities, and address the country’s housing crisis. Sometimes this takes the form of new towns or eco-towns, and sometimes proposals for an actual garden city are put forward – as in the last budget.

Rather than just rolling out this romantic terminology, we should take a closer look at garden city ideals and how they can be adopted to make the proposed Ebbsfleet development a success.

Several years ago my colleague Michael Edwards presciently forecast the current problems in the Thames Gateway where Ebbsfleet falls, with a dominance of private development that does little to provide for local employment and walkable communities.


Ebenezer Howard’s utopian vision

He outlined the need to return to funding principles similar to the garden city model, where development trusts retain freeholds on the land. This model, based on investment in infrastructure and services, is a fundamental principle that shifts from short-term returns to a long-term relationship created between the collective or public landowner and local inhabitants.

Lessons From History

Despite the fact that the garden city was a highly influential model throughout the first half of the 20th century, ultimately leading to the establishment of some key settlements in the UK, US and elsewhere in the world, it has had few genuine successes. After World War II, similar utopian dreams of creating model communities, with decent housing surrounding a well-designed centre, met with the reality. British reformer William Beveridge famously summed them up for having “no gardens, few roads, no shops and a sea of mud”.

You’d be forgiven for thinking that past lessons would be applied to the next generation of housing. But, even the post-war housing plans – though inspired by the garden city movement of the interwar periods – failed to plan the new housing in relation to transport, employment and public services such as shops and schools. While UK government reports have tried to draw lessons from both their positive and negative aspects, they have also been criticised in more recent reports, for lacking a sense of community – although it should also be said that “community” takes time to develop and cannot be “designed” as such.

Many of the challenges of creating new communities are bound up in the spatial separation between newcomers and older inhabitants, a lack of social infrastructure, such as doctor’s surgeries and schools, and difficulties that stem from long commutes, such as lower net income and the strain this has on families. Ruth Durant found this in her 1939 study of Burnt Oak on the outskirts of London.

Early post-war new towns were similarly criticised for their very slow build-up of health services, higher schooling, cultural facilities and decent shopping facilities, although some did better with the provision of local employment, due to many people moving to the towns with a local job linked to their housing. With shifts in the industrial economy, such beneficial connections between home and work (one of the tenets of the garden city) reduced over time.

Modern Twist

The challenges today are slightly different, however. People live more mobile and fragmented lives and are arguably less likely to be tied to place as was the case for the primarily working-class (and manual labouring) communities of the past. This poses the risk that community will be lost because of how transient people can be.

But increased mobility and social interaction don’t have to be mutually exclusive. Indeed, a lack of mobility is the worst problem that can be imposed on a community: both work and leisure must be accessible to people. Plus, with the advent of the internet and grass-roots activism, connections can traverse space more easily. This has allowed movements such as the Transition Network, which brings communities together around sustainable issues, to blossom.

Adapting to Change

UCL’s EPSRC funded Adaptable Suburbs project has studied the evolution of London’s outer suburban towns over the past 150 years, providing some clues on what has made for the relative success of the original garden cities over other planned settlements. It is clear that their success has been dependent on excellent transport connections, coupled with the provision of local employment and access to employment at a commutable distance.

Also important is the provision of a mixed-use town centre, giving a destination for a wide variety of activities in addition to retail: community activities, schools, leisure and cultural uses. Centres work well when connected to the street network, accessible by foot, bicycle, public and private transport. This multi-functional design has helped even the smallest of centres to sustain themselves through the most recent economic recession.

A recent government report, “Understanding High Street Performance”, also found that successful town centres are “characterised by considerable diversity and complexity, in terms of scale, geography and catchment, function and form … [as] a result, the way in which they are affected by and respond to change is diverse and varied".

It is almost impossible to predict how society will change in the future, particularly as new technologies have the power to change how people connect and build community. But what is evident is that here lies another essential aspect of building successful communities: in allowing for places to adapt to change.

This needs to be a foundational aspect of the government’s new cities – simply invoking the phrase “garden city” is not enough. By building places with sufficient flexibility of buildings, infrastructure and uses, coupled with links that allow for local and wider-scale trips to take place, with the necessary long-term financial investment, we can start to create places that will successfully weather the future.

This article was originally published on The Conversation.

Dr Laura Vaughan is Professor of Urban Form and Society at the Bartlett, University College London. She has been researching poverty and prosperity in cities, suburbs and the space between them for the past dozen years using space syntax – a mathematical method for modelling social and economic outcomes. Her edited book ‘Suburban Urbanities’ is due to come out in UCL Press in 2015.

Photo: Which way are the flower beds? Matt BuckCC BY-SA


Sterling, the Clippers, and $2B of Monopoly Money

$
0
0

Is there a more crooked roulette wheel than the one that spins around in the circles of professional sports? I ask in the context of the punishment meted out to Donald Sterling, the in-limbo owner of the Los Angeles Clippers, who, for his commentaries about race in America, was banned from the league and might be “forced” to sell his team for $2 billion, about $1.5 billion more than it was worth before his girlfriend taped their tawdry talks.

On paper, let alone on the basketball court, the Clippers should be close to worthless—an inept franchise that has yet to win a championship in the 44 years of its existence, which began in Buffalo.

The magic of pro sports accounting, thanks to antitrust exemption from the US Congress, is that all team owners enjoy the perquisites of monopoly money, which entitles even the racist Sterling to billion-dollar pay days.

It makes sense that Sterling’s wife is trying to sell the Clippers to Steve Ballmer, the former CEO of Microsoft, who ought to know a thing or two about oligopoly.

Ballmer's bet is that the NBA’s cartel pricing will allow the team more revenue sharing from television, while paying less to the players, so that instead of paying 133 times earnings for a team earning about $15 million a year, he can reduce his paid premium to, say, 40 times earnings if the Clippers start earning $50 million annually.

Should the team acquisition simply be a rich man’s hobby, he can console himself for his losses by sitting court-side in Los Angeles with various starlets, although $2 billion is a lot to pay for a matchmaking subscription.

Nor is Ballmer alone among executives in celebrating the un-level playing fields of monopoly. The owners of major league teams in football and basketball have long understood that the points on the scoreboards are incidental to their business of collecting money, paid out by the cable television industry (another oligopoly), and from treating the workers as if they were (high-end) strip miners.

To be sure, many athletes in professional sports earn multimillion-dollar salaries. But they are paid as a coefficient of their ability to draw television ratings.
Few other businesses in a country theoretically devoted to free enterprise are allowed to allot franchises as though they were noble fiefs, and to treat workers as indentured servants.

Even now, it takes years for baseball and football players to become free agents, and leagues impose salary caps, in theory to equalize competition, although in practice to save money.

If the movie or insurance businesses conducted a draft of prospective employees, Congress would cry foul and enforce an open and free labor market.

Not only can the professional leagues allocate talent as if at a slave auction, but they enjoy the further subsidy that colleges and universities (in basketball and football) operate their minor leagues at no cost to the professional owners.

On average, big-time universities earn about $50 to $100 million a year on their sports programs—much of that from basketball and football—but then become indignant when players, such as those at Northwestern University, suggest forming a union or ask for long-term healthcare benefits when they leave school programs with permanent injuries. Aren’t worthless degrees in something like social media enough reward?

Best of all, few of the operating costs are passed on to the beneficiaries, the peers of Donald Sterling, who unwrap their golden tickets even if their teams are losing or they are degrading the fan base.

With so much monopoly money to spread around among relatively few pro teams, owners can throw multimillion dollar, multiyear contracts blindly at athletes, who often look more like lottery winners than stars.

In the last two years, for example, the bloated New York Yankees have lavished C.C. Sabathia, Mark Teixeira, Alex Rodriquez, Derek Jeter, Curtis Granderson, and others more than $100 million a year, even though they have played in only a fraction of the games, or poorly.

During the last off-season, the Yankees committed another half a billion dollars to new free agents, including catcher Brian McCann, who as I write is batting an anemic .226.

In 2013 the iconic team reported a loss of $9.1 million, although Forbes listed the worth of the franchise at $2.5 billion, with annual revenues of $431 million. A closer look at the numbers, however, suggests the Yankees are a cable network (jointly owned with FOX) with a team, not the other way around.

Only monopoly economics allows the dimwitted Yankees to stay in business. Thanks to deductible ticket purchases by spendthrift corporate clients, the average seat at Yankee Stadium runs about $50, although the good seats cost over $200. The price of a monthly cable sports package in New York, at least for those that want a Yankees TV fix, can be another $1000 a year.

Were pro sports in the interest of the community and worthy of an antitrust exemption, anyone with a video camera could broadcast the games as a news event. Instead, the games are the property of the major league cartels, whose officials, acting as though they were OPEC magnates, allocate the product.

As if the pro sports honey pot needed anymore sweeteners, think, too, how easily many owners have extorted new stadiums from their home markets, in exchange only for agreeing to keep the team in the city. Or they skip town as soon as they're promised millions elsewhere.

According to several studies, some $17 billion in tax-exempt public funding has gone into stadium construction in recent years, another reason it’s impossible to lose as a team owner.

For the fans, the new $1.5 billion Yankee Stadium feels the same as the old one. But owners lobby for new, tax-subsidized ballparks, especially in the NFL, so they can increase the number of skyboxes; that money drops straight to the owner’s bottom line, avoiding the pools of revenue sharing.

Are there risks to owning these golden franchises? Pro football leagues will be hit with endless class-action lawsuits, until they can indemnify all current and past players with long-term disability in exchange for their primetime tackles and concussions. But I doubt these lawsuits will turn the NFL into flag football.

Another threat to pro sports could come from an end to monopoly pricing in the cable television industry. Once every phone and iPad is a handheld TV, will customers really pay Time-Warner $90 every month for 500 channels? Will there be networks with enough subscribers to pay billions to the major leagues? Will audiences continue to watch baseball on television if the stadiums are empty, as many are now?

Of course the best response to loutish team owners—among whom I suspect Donald Sterling is par for the course—would be to end the antitrust exemption and let the teams compete with other, newer teams and leagues. Why must pro sports be a regulated industry? Are they the equivalent of nuclear power?

Why can’t even small and medium-sized cities have teams? The community-owned Packers have flourished in Green Bay, and the United States is a country of Green Bays. As in European soccer, the major leagues could simply be the most successful teams, with the poor performers each year getting relegated to lesser divisions. The University of Alabama would move up, and the Jacksonville Jaguars would go down.

By those standards, the Los Angeles Clippers would long ago have been demoted to the California league, and their owner, one Donald Sterling, would not today be looking forward to a $2 billion check.

Matthew Stevenson, a contributing editor of Harper's Magazine, is the author of Remembering the Twentieth Century Limited, a collection of historical travel essays. His new book, Whistle-Stopping America, was recently published.

Flickr photo by David Jones: The Los Angeles Staples Center on a good night for the Clippers; they beat the Miami Heat 111-105.

Watch 220 Years of U.S. State Population Growth

$
0
0

Around this time of year, some of us can’t help but think of the history of this great nation. What was life like back in the days of the founding fathers, and how have they changed in the decades since? Using the population data of every Census since the first, which occurred in 1790, at MyLife.com we’ve put together an animation showing the growth of every state’s population from then till now. The states are in order of the date they became admitted, and you may notice that some were being counted prior to statehood. These states were at the time either U.S. territories, or part of another state.

The graphic shows the interesting pace of change in the United States - California is now the most populous state, but there were some interesting changes in tempo over the years. At one point New York and Pennsylvania were neck and neck for most populous, only to be quickly outpaced by California and later on, Texas. The sheer velocity of California's growth is also interesting to watch, as the state saw growth of more than 15 million residents in the past 50 years.

Floridians might be surprised to learn that the during first 80 years of statehood, their population only grew to less than one million, while the next 80 years saw an increase of 15 million! It remains one of the fastest growing states today and may pass New York to become the third most populous state by the next Census.

You can see the graphic below or at full size here

One-party Rule is No Party in California

$
0
0

Forty years ago, Mexico was a one-party dictatorship under the Partido Revolucionario Institucional, hobbled by slow growth, soaring inequality, endemic corruption and dead politics. California, in contrast, was considered a model American state, with a highly regarded Legislature, relatively clean politics, a competitive political process and a soaring economy.

Today these roles are somewhat reversed, and not in a good way for the Golden State. To be sure, corruption remains endemic in Mexico, where the PRI ruled for some seven decades. But now, there is a vibrant, highly competitive political culture, with three strong parties and at least some movement toward economic reform. Thirty percent of Mexicans, according to Gallup, trust their federal government, a level not all that different than in the United States.

But if Mexico’s governance can be seen as at least gradually improving, it’s more difficult to reach that conclusion about the Golden State. California is now a one-party state, with increased corruption and little to no willingness to reform its creaky, scarily unbalanced economy. Californians, by a large margin, think things are getting worse, rather than getting better.

We can call this trend PRI-ization, and nowhere is it more evident than in our state’s increasingly torpid politics. As there is no real competition for power or for ideas, voter turnout, at both the local and state levels, has plummeted to the lowest levels on record. June’s primaries attracted barely 25 percent of the electorate, while the Los Angeles County turnout was just over 17 percent.

When I voted this month in my San Fernando Valley precinct, I brought my 9-year-old daughter, but she didn’t get to see democracy in action. She saw an empty church basement with a bunch of pleasant election workers sitting around with not much to do.

This lack of voter enthusiasm could be explained, in part, by a lack of competition between the parties statewide. But it goes deeper than that; even the nominally nonpartisan recent Los Angeles mayor’s race, while highly competitive, also broke modern records for low turnout.

Monopolistic mess

Let’s be frank. California’s democracy is fading, the result of one-party politics, a weak media culture and a sense among many that politicians in Sacramento (or city hall) will do whatever they please once in office. As under the old PRI in Mexico, a lack of competitive politics has also bred the kind of endemic corruption with which California, in recent decades, was not widely associated.

The case of state Sen. Leland Yee, the Bay Area crusading liberal now accused of being a wannabe gun-runner, was just the most extreme example. If Yee is convicted and sent to jail, he might be joined by two Senate colleagues, one convicted of voter fraud and the other of bribery. The scandals have damaged the Legislature’s approval ratings.

Republicans and conservatives tend to blame such embarrassments on Democrats, just as the long out-of-power outsiders linked Mexico’s corruption to the PRI monopoly. But, in many ways, it reflects the dynamic, also seen in Republican-dominated states, such asMississippi, or in Vladimir Putin’s Russia, of those who see no threat to their monopoly taking license to steal or otherwise abuse the law.

Arguably more disturbing than petty corruption is the inability of our politicos, as during the PRI’s heyday, to confront serious challenges facing the state. Low voter turnouts basically mean politicians don’t have to answer to middle-class or working-class voters; instead, they listen mostly to outside special interests such as public employee unions, environmentalists and social-issue lobbies. Union members have an incentive to show up at the polls to protect their pay and pensions, and issue activists will vote for those who support their line. It just seems that the rest of us have given up.

Perhaps the biggest shift in California’s balance of power is in the diminished role of business. In the days when California produced contending political giants – like the late Govs. Edmund G. “Pat” Brown and Ronald Reagan – businesses lined up on both sides of the aisle, albeit more on the Republican side – but there also was a strong contingent of “business” Democrats.

Today, California business operates solely for the purposes of accommodating the economic agenda of an increasingly left-oriented Democratic Party; supporting an opposing party – or even more moderate Democrats – increasingly is no longer an option to influence policy.

Mainstream doesn’t matter

Indeed, one of the negative products of one-party politics has been an ever greater shift away from the political mainstream. With turnouts tiny and business largely gelded, the “base” of the ruling party tends to get its way. So, California gets to try being the greenest state in the land, even as much of the state lives in a virtual permanent recession. In the process, politics becomes ever more marginal, and ever less responsive to what is happening to the citizenry.

We see much the same on the local level. Los Angeles, even much of its establishment admits, is becoming a “city in decline,” with the highest job losses, some 3.2 percent, of any of the 32 largest U.S. metro areas since 1990. But L.A. city and county leaders have little stomach for the reforms that would be necessary to turn the region around, in large part because it might offend their public employee paymasters. Fixing the potholes mightplease neighborhood residents, but since they mostly don’t vote, who cares?

So instead of a tough problem solver, we have a mayor who likes to take “selfies” to show how “with it” he is, and a City Council that thinks ultraexpensive solar energy projectsand subsidizing Downtown hotels will actually turn around a torpid municipal economy. But such largesse will reward the special interests who build these systems, the unionized workers at the new hotels and speculators in Downtown real estate.

None of this will do anything to help the Valley, East L.A., Watts or even the Westside.

Chances for rebound?

Sadly, it’s hard to see how this trend will turn around soon. Tax and regulatory policies are making the state toxic for many businesses and middle-class families. The number of poor, state-dependent voters grows, and business, outside of a few sectors, is stagnant or in decline. In the glory days of California politics, Democrats and Republicans vied for suburban middle-class voters; now, they don’t have to bother.

This is all made worse by the descent of the Republicans into near irrelevancy. The GOP barely escaped nominating for governor a nativist, Tim Donnelly, who accused his Hindu opponent Neel Kashkari of wanting to import Shariah law. It might have occurred to Donnelly that Hinduism is very different from – and often in serious conflict with – Islamic fundamentalism.

Until the Republicans develop some basic sense and offer a compelling social and economic message for an increasingly diverse state, they will remain bit players.

Oddly, unless this trajectory is reversed, we may look back at this time and wax nostalgic about the Jerry Brown years; Brown may be a bit over-the-top on some issues, such as his dodgy high-speed rail plan, but at least he’s not mindlessly ideological.

Just wait four years, when a full-bore true believer, the glamorous Attorney General Kamala Harris, could well become governor and tries to remake this amazing, diverse state into a more impoverished version of California’s real political capital, San Francisco. If business finds getting along with the somewhat mercurial Brown to be, literally, taxing, they will find the more pure-left regime that may follow him a far more onerous task.

Ultimately, the only hope may come when the grand delusions of our political elites – financed by the social media bubble, the stock market and high-end real estate speculation – finally come crashing down. When there is no one left to tax, and no way to borrow more, and the shift elsewhere of high-wage employment too obvious, perhaps then middle-class and working-class Californians will demand alternatives to the status quo. At that point they might even find reasons to go to the polls again.

This article first appeared in the Orange County Register.

Joel Kotkin is executive editor of NewGeography.com and Distinguished Presidential Fellow in Urban Futures at Chapman University, and a member of the editorial board of the Orange County Register. He is author of The City: A Global History and The Next Hundred Million: America in 2050. His most recent study, The Rise of Postfamilialism, has been widely discussed and distributed internationally. He lives in Los Angeles, CA.

Photo: Troy Holden

Confessions of a Rust Belt Orphan

$
0
0

How I Learned to Stop Worrying and Love Northeast Ohio

Go to sleep, Captain Future, in your lair of art deco
You were our pioneer of progress, but tomorrow’s been postponed
Go to sleep, Captain Future, let corrosion close your eyes
If the board should vote to restore hope, we’ll pass along the lie

-The Secret Sound of the NSA, Captain Future

As near as I can tell, the term “Rust Belt” originated sometime in the mid-1980s. That sounds about right.

I originated slightly earlier, in 1972, at St. Thomas Hospital in Akron, Ohio, Rubber Capital of the World. My very earliest memory is of a day, sometime in the Summer of 1975, that my parents, my baby brother, and I went on a camping trip to Lake Milton, just west of Youngstown. I was three years old. To this day, I have no idea why, of all of the things that I could remember, but don’t, I happen to remember this one. But it is a good place to start.

image

Image Source: Wikipedia: Change in total number of manufacturing jobs in metropolitan areas, 1954-2002. Dark red is very bad. Akron is dark red.

The memory is so vivid that I can still remember looking at the green overhead freeway signs along the West Expressway in Akron. Some of the signs were in kilometers, as well as in miles back then, due to an ill-fated attempt to convert Americans to the Metric system in the 1970s. I remember the overpoweringly pungent smell of rubber wafting from the smokestacks of B.F. Goodrich and Firestone. I recall asking my mother about it, and her explaining that those were the factories where the tires, and the rubber, and the chemicals were made. They were made by hard-working, good people – people like my Uncle Jim – but more on that, later.

When I was a little bit older, I would learn that this was the smell of good jobs; of hard, dangerous work; and of the way of life that built the modern version of this quirky and gritty town. It was the smell that tripled Akron’s population between 1910 and 1920, transforming it from a sleepy former canal-town to the 32nd largest city in America. It is a smell laced with melancholy, ambivalence, and nostalgia – for it was the smell of an era that was quickly coming to an end (although I was far too young to be aware of this fact at the time). It was sometimes the smell of tragedy.

We stopped by my grandparents’ house, in Firestone Park, on the way to the campground. I can still remember my grandmother giving me a box of Barnum’s Animals crackers for the road. She was always kind and generous like that.

Who were my grandparents? My grandparents were Akron. It’s as simple as that. Their story was Akron’s story. My grandfather was born in 1916, in Barnesboro, a small coal-mining town in Western Pennsylvania, somewhere between Johnstown, DuBois, and nowhere. His father, a coal miner, had emigrated there from Hungary nine years earlier. My grandmother was born in Barberton, in 1920. Barberton was reportedly the most-industrialized city in the United States, per-capita, at some point around that time.

They were both factory workers for their entire working lives (I don’t think they called jobs like that “careers” back then). My grandfather worked at the Firestone Tire & Rubber Company. My grandmother worked at Saalfield Publishing, a factory that was one of the largest producers of children’s books, games, and puzzles in the world. Today, both of the plants where they worked form part of a gutted, derelict, post-apocalyptic moonscape in South Akron, located between that same West Expressway and perdition. The City of Akron has plans for revitalizing this former industrial area. It needs to happen, but there are ghosts there…

My name is Ozymandias, King of Kings, 
Look on my works, ye Mighty, and despair!
Nothing beside remains. Round the decay 
Of that colossal wreck, boundless and bare 
The lone and level sands stretch far away.

-Percy Bysshe Shelley, Ozymandias

My grandparents’ house exemplified what it was to live in working-class Akron in the late 1970s and early 1980s. My stream-of-consciousness memories of that house include: lots of cigarettes and ashtrays; Hee-HawThe Joker’s Wild; fresh tomatoes and peppers; Fred & Lamont Sanford; Archie & Edith Bunker; Herb Score and Indians baseball on the radio on the front porch; hand-knitted afghans; UHF/VHF; 3, 5, 8, and 43; cold cans of Coca-Cola and Pabst Blue Ribbon (back when the pop-tops still came off of the can); the Ohio Lottery; chicken and galuskas (dumplings); a garage floor that you could eat off of; a meticulously maintained 14-year-old Chrysler with 29,000 miles on it; a refrigerator in the dining room because the kitchen was too small; catching fireflies in jars; and all being right with the world.

I always associate the familiar comfort of that tiny two-bedroom bungalow with the omnipresence of cigarette smoke and television. I remember sitting there on May 18, 1980. It was my eighth birthday. We were sitting in front of the TV, watching coverage of the Mount St. Helens eruption in Washington State. I remember talking about the fact that it was going to be the year 2000 (the Future!) in just twenty years. It was an odd conversation for an eight year old to be having with adults (planning for the future already, and for a life without friends, apparently). I remember thinking about the fact that I would be 28 years old then, and how inconceivably distant it all seemed. Things seem so permanent when you’re eight, and time moves ever-so-slowly.

More often than not, when we visited my grandparents, my Uncle Jim and Aunt Helen would be there. Uncle Jim was born in 1936, in West Virginia. His family, too, had come to Akron to find work that was better-paying, steadier, and (relatively) less dangerous than the work in the coal mines. Uncle Jim was a rubber worker, first at Mohawk Rubber and then later at B.F. Goodrich. Uncle Jim also cut hair over at the most-appropriately named West Virginia Barbershop, on South Arlington Street in East Akron. He was one of the best, most decent, kindest people that I have ever known.

I remember asking my mother once why Uncle Jim never washed his hands. She scolded me, explaining that he did wash his hands, but that because he built tires, his hands were stained with carbon-black, which wouldn’t come out no matter how hard you scrubbed. I learned later, that it would take about six months for that stuff to leach out of your pores, once you quit working.

Uncle Jim died in 1983, killed in an industrial accident on the job at B.F. Goodrich. He was only 47. The plant would close for good about a year later.

It was an unthinkably tragic event, at a singularly traumatic time for Akron. It was the end of an era.

Times Change

My friend Della Rucker recently wrote a great post entitled The Elder Children of the Rust Belt over at her blog, Wise Economy. It dredged up all of these old memories, and it got me thinking about childhood, about this place that I love, and about the experience of growing up just as an economic era (perhaps the most prosperous and anomalous one in modern history) was coming to an end.

That is what the late 1970s and early 1980s was: the end of one thing, and the beginning of a (still yet-to-be-determined) something else. I didn’t know it at the time, but that’s because I was just a kid.

In retrospect it was obvious: the decay; the deterioration, the decomposition, the slow-at-first, and then faster-than-you-can-see-it unwinding of an industrial machine that had been wound-up far, far, too-tight. The machine runs until it breaks down; then it is replaced with a new and more efficient one – a perfectly ironic metaphor for an industrial society that killed the goose that laid the golden egg. It was a machine made up of unions, and management, and capitalized sunk costs, and supply chains, and commodity prices, and globalization. Except it wasn’t really a machine at all. It was really just people. And people aren’t machines. When they are treated as such, and then discarded as obsolete, there are consequences.

You could hear it in the music: from the decadent, desperately-seeking-something (escape) pulse of Disco, to the (first) nihilistic and (then) fatalistic sound of Punk and Post-Punk. It’s not an accident that a band called Devo came from Akron, Ohio. De-evolution: the idea that instead of evolving, mankind has actually regressed, as evidenced by the dysfunction and herd mentality of American society. It sounded a lot like Akron in the late 1970s. It still sounds a little bit like the Rust Belt today.

As an adult, looking back at the experience of growing up at that time, you realize how much it colors your thinking and outlook on life. It’s all the more poignant when you realize that the “end-of-an-era” is never really an “end” as such, but is really a transition to something else. But to what exactly?

The end of that era, which was marked by strikes, layoffs, and unemployment, was followed by its echoes and repercussions: economic dislocation, outmigration, poverty, and abandonment; as well as the more intangible psychological detritus – the pains from the phantom limb long after the amputation; the vertiginous sensation of watching someone (or something) die.

And it came to me then 
That every plan 
Is a tiny prayer to Father Time

As I stared at my shoes
In the ICU
That reeked of piss and 409

It sung like a violent wind
That our memories depend
On a faulty camera in our minds

‘Cause there’s no comfort in the waiting room
Just nervous paces bracing for bad news

Love is watching someone die…

-Death Cab For Cutie, What Sarah Said

But it is both our tragedy and our glory that life goes on.

Della raised a lot of these issues in her post: our generation’s ambivalent relationship with the American Dream (like Della, I feel the same unpleasant taste of rust in my mouth whenever I write or utter that phrase); our distrust of organizations and institutions; and our realization that you have to keep going, fight, and survive, in spite of it all. She talked about how we came of age at a time of loss:

not loss like a massive destruction, but a loss like something insidious, deep, pervasive.

It is so true, and it is so misunderstood. One of the people commenting on her blog post said, essentially, that it is dangerous to romanticize about a “golden age”; that all generations struggle; and that life is hard.

Yes, those things are all true. But they are largely irrelevant to the topic at hand.

There is a very large middle ground between a “golden age” and an “existential struggle”. The time and place about which we are both writing (the late 1970s through the present, in the Rust Belt) is neither. But it is undoubtedly a time of extreme transition. It is a great economic unraveling, and we are collectively and individually still trying to figure out how to navigate through it, survive it, and ultimately build something better out of it.

History is cyclical. Regardless of how enamored Americans, in general, may be with the idea, it is not linear. It is neither a long, slow march toward utopia, nor toward oblivion. When I look at history, I see times of relative (and it’s all relative, this side of paradise) peace, prosperity, and stability; and other times of relative strife, economic upheaval, uncertainty, and instability. We really did move from one of those times to the other, beginning in the 1970s, and continuing through the present.

The point that is easy to miss when uttering phrases like “life is hard for every generation” is that none of this discussion about the Rust Belt – where it’s been, where it is going – has anything to do with a “golden age”. But it has everything to do with the fact that this time of transition was an era (like all eras) that meant a lot (good and bad) to the people that lived through it. It helped make them who they are today, and it helped make where they live what it is today.

For those that were kids at the time that the great unraveling began (people like me, and people like Della) it is partially about the narrative that we were socialized to believe in at a very young age, and how that narrative went up in a puff of smoke. In 1977, I could smell rubber in the air, and many of my family members and friends’ parents worked in rubber factories. In 1982, the last passenger tire was built in Akron. By 1984, 90% of those jobs were gone, many of those people had moved out of town, and the whole thing was already a fading memory. Just as when a person dies, many people reacted with a mixture of silence, embarrassment, and denial.

As a kid, especially, you construct your identity based upon the place in which you live. The whole identity that I had built, even as a small child, as a proud Akronite: This is the RUBBER CAPITAL OF THE WORLD; this is where we make lots and lots of Useful Things for people all over the world; this is where Real Americans Do Real Work; this is where people from Europe, the South, and Appalachia come to make a Better Life for themselves; well, that all got yanked away. I couldn’t believe any of those things anymore, because they were no longer true, and I knew it. I could see it with my own two eyes. Maybe some of them were never true to begin with, but kids can’t live a lie the way that adults can. When the place that you thought you lived in turns out not to be the place that you actually live, it can be jarring and disorienting. It can even be heartbreaking.

We’re the middle children of history, man. No purpose or place. We have no Great War. No Great Depression. Our great war is a spiritual war. Our great depression is our lives.

-Tyler Durden, Fight Club

I’m fond of the above quote. I was even fonder of it when I was 28 years old. Time, and the realization that life is short, and that you ultimately have to participate and do something with it besides analyze it as an outside observer, has lessened its power considerably. It remains the quintessential Generation X quote, from the quintessential Generation X movie. It certainly fits in quite well with all of this. But, then again, maybe it shouldn’t.

I use the phrase “Rust Belt Orphan” in the title of this post, because that is what the experience of coming of age at the time of the great economic unraveling feels like at the gut-level. But it’s a dangerous and unproductive combination, when coupled with the whole Gen-X thing.

In many ways, the Rust Belt is the “Generation X” of regions – the place that just doesn’t seem to fit in; the place that most people would just as soon forget about; the place that would, in fact, just as soon forget about itself; the place that, if it does dare to acknowledge its own existence or needs, barely notices the surprised frowns of displeasure and disdain from those on the outside, because they have already been subsumed by the place’s own self-doubt and self-loathing.

A fake chinese rubber plant
In the fake plastic earth
That she bought from a rubber man
In a town full of rubber plans
To get rid of itself

-Radiohead, Fake Plastic Trees

The whole Gen-X misfit wandering-in-the-Rust Belt-wilderness meme is a palpably prevalent, but seldom acknowledged part of our regional culture. It is probably just as well. It’s so easy for the whole smoldering heap of negativity to degenerate into a viscous morass of alienation and anomie. Little good can come from going any further down that dead-end road.

Whither the Future?

The Greek word for “return” is nostosAlgos means “suffering.” So nostalgia is the suffering caused by an unappeased yearning to return.

– 
Milan Kundera, Ignorance

So where does this all leave us?

First, as a region, I think we have to get serious about making our peace with the past and moving on. We have begun to do this in Akron, and, if the stories and anecdotal evidence are to be believed, we are probably ahead of the region as a whole.

But what does “making our peace” and “moving on” really mean? In many ways, I think that our region has been going through a collective period of mourning for the better part of four decades. Nostalgia and angst regarding the things that have been lost (some of our identity, prosperity, and national prominence) is all part of the grieving process. The best way out is always through.

But we should grieve, not so we can wallow in the experience and refuse to move on, but so we can gain a better understanding of who we are and where we come from. Coming to grips with and acknowledging those things, ultimately enables us to help make these places that we love better.

We Americans are generally not all that good at, or comfortable with, mourning or grief. There’s a very American idea that grieving is synonymous with “moving on” and (even worse) that “moving on” is synonymous with “getting over it”.

We’re very comfortable with that neat and tidy straight, upwardly-trending line toward the future (and a more prosperous, progressive, and enlightened future it will always be, world without end, Amen.)

We’re not so comfortable with that messy and confusing historical cycle of boom-and-bust, of evolution and de-evolution, of creation and destruction and reinvention. But that’s the world as we actually experience it, and it’s the one that we must live in. It is far from perfect. I wish that I had another one to offer you. But there isn’t one on this side of the Great Beyond. For all of its trials and tribulations, the world that we inhabit has one inestimable advantage: it is unambiguously real.

“Moving on” means refusing to become paralyzed by the past; living up to our present responsibilities; and striving every day to become the type of people that are better able to help others. But “moving on” doesn’t mean that we forget about the past, that we pretend that we didn’t experience what we did, or that we create an alternate reality to avoid playing the hand that we’ve actually been dealt.

Second, I don’t think we can, or should, “get over” the Rust Belt. The very phrase “get over it” traffics in denial, wishful thinking, and the estrangement of one’s self from one’s roots. Countless attempts to “get over” the Rust Belt have resulted in the innumerable short-sighted, “get rich quick” economic development projects, and public-private pyramid-schemes that many of us have come to find so distasteful, ineffective, and expensive.

We don’t have to be (and can’t be, even if we want to) something that we are not. But we do have to be the best place that we can be. This might mean that we are a smaller, relatively less-prominent place. But it also means that we can be a much better-connected, more cohesive, coherent, and equitable place. The only people that can stop us from becoming that place are we ourselves.

For a place that has been burned so badly by the vicissitudes of the global economy, Big Business, and Big Industry, we always seem to be so quick to put our faith in the Next Big Project, the Next Big Organization, and the Next Big Thing. I’m not sure whether this is the cause of our current economic malaise, or the effect, or both. Whatever it is, we need to stop doing it.

Does this mean that we should never do or dream anything big? No. Absolutely not. But it does mean that we should be prudent and wise, and that we should tend to prefer our economic development and public investment to be hyper-nimble, hyper-scalable, hyper-neighborhood-focused, and ultra-diverse. Fetishizing Daniel Burnham’s famous “Make no little plans…” quote has done us much harm. Sometimes “little plans” are exactly what we need, because they often involve fundamentals, are easier to pull-off, and more readily establish trust, inspire hope, and build relationships.

Those of us that came of age during the great economic unraveling and (still painful) transition from the Great American Manufacturing Belt to the Rust Belt might just be in a better position to understand our challenges, and to find the creative solutions required to meet them head-on. Those of us that stuck it out and still live here, know where we came from. We’re under no illusions about who we are or where we live. I think Della Rucker was on to something when she listed what we can bring to the table:

  • Determination
  • Long-game focus
  • Understanding the depth of the pit and the long way left to climb out of it
  • Resourcefulness
  • Ability to salvage
  • Expectation that there are no easy answers
  • Disinclination to believe that everything will be all right if only we do this One Big Thing

When I look at this list, I see pragmatism, resilience, self-knowledge, survival skills, and leadership. It all rings true.

He wanted to care, and he could not care. For he had gone away and he could never go back any more. The gates were closed, the sun was gone down, and there was no beauty but the gray beauty of steel that withstands all time. Even the grief he could have borne was left behind in the country of illusion, of youth, of the richness of life, where his winter dreams had flourished.

“Long ago,” he said, “long ago, there was something in me, but now that thing is gone. Now that thing is gone, that thing is gone. I cannot cry. I cannot care. That thing will come back no more.”

-F. Scott Fitzgerald, Winter Dreams

So, let’s have our final elegy for the Rust Belt. Then, let’s get to work.

This post originally appeared in Jason Segedy's Notes From the Underground on November 2, 2013.

Segedy is the Director of the Akron Metropolitan Area Transportation Study, the Metropolitan Planning Organization serving Akron, Ohio.  As a native of Akron, and as an urban planner, he has a strong interest in the future of places throughout the Great Lakes region, and in the people that inhabit them.

Dispersing Millennials

$
0
0

The very centers of urban cores in many major metropolitan areas are experiencing a resurgence of residential development, including new construction in volumes not seen for decades. There is a general impression, put forward by retro–urbanists (Note 1) and various press outlets that the urban core resurgence reflects a change in the living preferences of younger people – today's Millennials – who they claim are rejecting the suburban and exurban residential choices of their parents and grandparents.

There is no question that the millennial population has risen in urban cores in recent years. Yet the growth in the younger population in urban cores masks far larger increases in the same population group in other parts of major metropolitan areas and in the nation in general.

Functional Analysis of Metropolitan Areas

This article continues a series examining the 52 major metropolitan areas (those with more than 1,000,000 residents) using the City Sector Model, which allows a more representative functional analysis of urban core, suburban, and exurban areas, by using smaller areas, rather than using municipal boundaries. The City Sector Model thus eliminates the over-statement of urban core data that occurs in conventional analyses, which rely on historical core municipalities, most of which encompass considerable suburbanization.

The City Sector Model classifies 9,000 major metropolitan area zip code tabulation areas using urban form, density, and travel behavior characteristics. There are four functional classifications: the urban core, earlier suburban areas, later suburban areas, and exurban areas. The urban cores have higher densities, older housing and substantially greater reliance on transit, similar to the urban cores that preceded the great automobile oriented post-World War Two suburbanization. Exurban areas are beyond the built up urban areas. The suburban areas constitute the balance of the major metropolitan areas. Earlier suburbs include areas with a median house construction date before 1980. Later suburban areas have later median house construction dates (Note 2).

20-29s and the Urban Core

The age band best approximating millennials for the period of 2000 to 2010 is people of from 20 to 29 years of age.

Between 2000 and 2010, the total population of 20-29's living in the functional urban cores increased by 300,000, from 4.3 million to 4.6 million from 2000 to 2010. Yet, the share of 20-29s living in the urban cores actually declined over the decade.

In 2000, 20.2 percent of the major metropolitan area 20- to 29-year-old population was in the urban core. By 2010, it had dropped to 19.3 percent, a 4.4 percent share reduction. This happened because the 300,000 increase in 20-29s in the urban core was dwarfed by the overall 2.6 million increase in the same age group throughout the major metropolitan areas. As a result, only 12 percent of the 20-29 population growth was in the urban core, 40 percent below its 2000 share.

While 80 percent of the 20-29s lived outside the urban cores in 2000, 88 percent of the 20-29 population growth was outside the urban core between 2000 and 2010 (Figure 1). Overall, the suburban and exurban millennial population grew nearly 8 times than in the urban core.

The 20-29s and the Balance of Major Metropolitan Areas

The trend among the 20-29s also tended away from the areas adjacent to the urban cores. These tend to be   earlier suburban areas (generally with median house construction dates before 1980). Between 2000 and 2010, the share of 20-29s living in the earlier suburbs fell from 46.1 percent to 42.0 percent. This was double the urban core loss noted above (4.4 percent), at 8.9 percent.

At the same time, millennials, long said to hate suburbs, have embraced dispersion. The more recently built suburban areas saw their share of 20-29s rise from 20.6 percent to 24.4, an 18 percent gain. A smaller gain was registered in exurban areas, where the share of 20-29s rose from 13.2 percent to 14.3 percent; an 8 percent share gains (Figure 2).

The net effect from 2000 and 2010: a full five percent more of all 20-29s in major metropolitan areas lived in the later suburban and exurban areas, while 5 percent fewer lived in the urban cores and earlier suburbs. The later suburbs and exurbs added 1,500,000 more 20-29s than the urban core and earlier suburbs.

Millennials and the Nation

The numbers of 20-29s continued to increase in the rest of the nation’s small towns and cities, as well as rural areas. In 2000, approximately 44.6 percent of the 20-29 population lived outside the major metropolitan areas. In the next decade, these areas added 20-29s at a lower rate (40.9 percent of the increase), yet this was enough to keep the share of 20-29s at 44.2 percent. In 2010, more than four times as many 20-29s lived outside the major metropolitan areas as lived in the urban cores. Between 2000 and 2010, the growth in 20-29's living outside the major metropolitan areas was almost six times the growth in the urban cores (Figure 3).

Overall, only 7 percent of the growth in the 20-29 age group was in the functional urban cores between 2000 and 2010. That left 93 percent of the growth to be outside the urban core (Figure 4).

Consistency with Other Research

The trend among the 20-29s in the urban core may seem surprising. However, it is consistent with an analysis of 2000-2010 data by the US Census Bureau, which indicated that the population gains within two miles of the city halls of the largest cities were more than offset by losses in the ring between two and five miles from City Hall. While the gains in the course of the urban cores are impressive, they are much smaller when considered in the context of the entire urban core and even smaller in the context of the entire metropolitan area.

More recent data suggests the dispersion of Millennials is continuing. According to Jed Kolko, Chief Economist at Trulia.com Millennials located in larger numbers in suburban areas  than in the urban cores between 2012 and 2013 (more recent data for the city sector analysis is not yet available) 

Dispersing, But Not Quite as Quickly

Essentially what we see here is myopic prejudices of contemporary journalism. More than 300,000 new 20-29 residents in the urban cores was more than enough to be noticed by analysts and reporters, since that's where many of them spend much of their time. Moreover, the share of 20-29s living in urban cores dropped less than one-half the rate for all ages in the urban core.

Simply put, despite the conventional wisdom, 20-29s are not abandoning the suburbs and exurbs for the urban core. The data indicates that the 20-29s have been more inclined to choose the urban core than other age groups, but not enough to prevent their overwhelming numbers living in suburban and exurban communities. Nor has this inclination been sufficient to counter the continuing relative decline in the urban core among the 20-29s.

-------------

Wendell Cox is principal of Demographia, an international public policy and demographics firm. He is co-author of the "Demographia International Housing Affordability Survey" and author of "Demographia World Urban Areas" and "War on the Dream: How Anti-Sprawl Policy Threatens the Quality of Life." He was appointed to three terms on the Los Angeles County Transportation Commission, where he served with the leading city and county leadership as the only non-elected member. He was appointed to the Amtrak Reform Council to fill the unexpired term of Governor Christine Todd Whitman and has served as a visiting professor at the Conservatoire National des Arts et Metiers, a national university in Paris.

Note 1: The term retro-urbanist is applied to the currently popular strain of urban planning that favors urban cores over the rest of the urban area and metropolitan area (the suburbs and exurbs).

Note 2:. The previous articles in this series are:

From Jurisdictional to Functional Analyses of Urban Cores & Suburbs

The Long Term: Metro American Goes from 82 percent to 86 percent Suburban Since 1990

New York, Legacy Cities Dominate Transit Urban Core Gains

Functional v. Jurisdictional Analysis of Metropolitan Areas

City Sector Model Small Area Criteria

The California Economy: When Vigor and Frailty Collide

$
0
0

Part one of a two-part report

California is a place of extremes. It has beaches, mountains, valleys and deserts. It has glaciers and, just a few miles away, hot, dry deserts. Some years it doesn't rain. Some years it rains all winter. Those extremes are part of what makes California the attractive place that it is, and, west of the high mountains, California is mostly an extremely comfortable place to live.

Today, we have some new extremes. Some of our coastal communities are as wealthy as any in the world. At the other extreme, we have some of America's poorest communities. San Bernardino, for example, has America's second-highest poverty rate for cities with population over 200,000.

From the beginning, we've had the fabulously wealthy. For the first 140 years after gold was found, California was a place where people could find, or, more correctly, build, success. The new part is the poverty. It used to be that the poor were mostly newcomers, people who hadn't yet had time to show that they had what it takes. Today, our poverty is dominated by families who have been here a long time. While San Bernardino certainly has some newcomers, it is mostly a city of native Californians.

The change became visible in the early 1990s. Many analysts will tell you that the change was caused by the collapse of the Soviet Union and the resulting peace dividend, which led to a dramatic downsizing of America's defense sector, once a major component of California's economy.

I believe the way to think about this is that the downsizing of the defense sector exposed the weaknesses in California's economy, as opposed to causing them. Sure, the downsizing had an economic impact. California lost hundreds of thousands of jobs. But the defense sector eventually bounced back and again became a source of good jobs. The problem is that it bounced back someplace else. It didn't come back in California. In fact, it continues to decline in California.

The decline in California's economic opportunities began way before the 1990s. As the 1960s progressed, Californians, or at the least the ones making decisions, changed their priorities. California's spending for infrastructure had once consumed between 15 and 20 percent of the State's budget. It precipitously fell to five percent or below.

In the '50s and early '60s, governors Goodwin Knight and Pat Brown presided over a fabulous investment boom in universities, highways, water projects and the like. None of their successors has even attempted anything on that scale. The profound prosperity that accompanied and followed California's investment boom hid the impacts of subsequent policy changes for decades.

The decline in public capital spending wasn’t the cause of our changed priorities. It was the change in priorities that caused the change in spending. It is as if we decided that we were wealthy enough, and that future spending would be on social and environmental programs. If we weren't looking for economic growth, why invest?

At California Lutheran University's Center for Economic Research and Forecasting, we've created a vigor index. It's composed of net in-migration, job creation, and new housing permits, each equally weighted. It is quite sensitive to changes in economic opportunity. For example, in 2000, North Dakota had the nation's lowest score, 0.9, and Nevada led the nation with a score of 24.1. By 2013, North Dakota led the country with a score of 20.0, while Nevada had seen its index value fall to only 6.4.

In the following chart, we show California's index (red bars) compared to that of Texas, Oregon, and Tennessee, from 1980 through 2013.

California is apparently different than the comparison states. The Tennessee, Oregon, and Texas indexes have behaved more similarly to each other than to California since the late 1980s. Texas' index behaved uniquely in the early 1980s, because of its dependency on oil and the long-term decline in oil prices that occurred during the 1980s.

California appears to be different than the other states throughout the period, but the nature of the difference has changed. Prior to the late 1980s, California tended to outperform the others. For example, its score didn't decline nearly as much as the others during the early 1980s recession. Given California's resource endowment, we think this is natural.

Since 1990, though, California's vigor index has generally remained below those of Texas, Tennessee, and Oregon. Indeed, since 1990, California's score has rarely exceeded the score of any of the comparison states, and it has never led them all.

The index also shows that California's investment in infrastructure during the 1950s and 1960s helped drive economic opportunity for two decades. It took two decades without any investment before we saw the consequences of the decision to not invest.

Recently, California has seen budget surpluses and faster job growth than the average American state. The forces for the status quo now claim that this confirms the wisdom of their policies. They are wrong.

California's budget surpluses are a product of a temporary tax, and an incredible bull market in equities. Our dependence on a highly progressive income tax means that California's fiscal condition swings on the fortunes of a small group of wealthy individuals.

Equity markets have been amazing over the past few years. The Dow has increased by over 10,000 since it bottomed out on March 9, 2009, and it appears to be divorced from economic activity. It increases on good news and bad, propelled by an unprecedented monetary expansion. Right now, California's largest taxpayers are reaping huge profits in the stock markets, and California is reaping huge windfalls in its tax revenues.

Someday, the market gains will cease, or worse reverse. Someday, too, the temporary tax will expire. California's surpluses will wash away like sand on a beach. The state will face a new crisis, a result of a progressive tax structure where revenues swing on paper profits and losses, not on economic activity.

As for our job gains being better than the average state's, California should not be average.

Employment should be far higher than it is. Even the weak job growth we've seen is largely a legacy of a previous age. California has the world's best venture capital infrastructure, partly because of the investment previous generations of Californians made in the university system. It is also, in part, a result of chance.

An amazing period of innovation was initiated in Coastal California by a few incredibly talented individuals, who were funded by a few far-sighted capitalists. It was one of those rare coincidences that happen from time to time and change the world. The eventual result was the Silicon Valley and economic powerhouses such as Intel, HP, Apple, Yahoo, Google, Facebook, Twitter, and many more.

Another result was the creation of a private, capitalist, vibrant infrastructure. It takes time and vast sums of money before a new idea generates profits. Product design is just the first step. An organization needs to be created to produce and sell the product. Factories need to be designed. Marketing plans need to be put in place.

No inventor or entrepreneur can be expected to have all of the necessary skills or money to turn an idea into a profitable firm. So, an infrastructure appeared. The Silicon Valley's world-leading venture capital markets and the support structure to enable the fabulous innovation and economic value created there was not the result of any government program or initiative. It was the spontaneous result of lots of people driven to innovate and profit from those innovations. It was capitalism at its very best.

California's Silicon Valley became the place for talented young people to turn great ideas into reality. It was also the place to go if you had money and wished to invest in vibrant, risky new technologies, or if you knew how to design factories, how to market products, how to build organizations, or how to finance rapid growth. The infrastructure that arose is supporting California today. This amazing capitalist engine of jobs, innovation and wealth is the source of most of California's economic vigor. But it is a legacy that will eventually slip away, unless California changes its priorities.

This is the first part of a two-part report. Bill Watkins is a professor at California Lutheran University and runs the Center for Economic Research and Forecasting, which can be found at clucerf.org.

Flickr photo by mlhradio. A California extreme: Mountains on The Trona-Wildrose Road, at the edge of the Panamint Valley. One of the most remote deserts in North America, in one of the most remote corners of California; the salt flats of Panamint Valley to the west, and Death Valley to the east.

The California Economy: A Strength Vs Weakness Breakdown

$
0
0

Part two of a two-part report. Read part 1.

The problem with analyzing California's economy — or with assessing its vigor — is that there is not one California economy. Instead, we have a group of regions that will see completely different economic outcomes. Then, those outcomes will be averaged, and that average of regional outcomes is California's economy. It is possible, even likely, that no region will see the average outcome, just as we rarely see average rainfall in California.

California's Silicon Valley region continues to be a source of innovation, economic vigor, and wealth creation. But the Silicon Valley, named because silicon is the primary component of computer chips, no longer produces any chips. The demands for venture capital are also changing, with the demand for cash falling because new products often take the form of apps instead of something that is manufactured. This type of investing doesn't need the infrastructure that the Silicon Valley provides. Increasingly, other communities such as Boston, Northern Virginia, and Houston are becoming centers of technological innovation.

Workers recognize the changes. They may not know the reasons, but they know the impacts, and they are voting with their feet. Domestic migration — migration between states, — is a good measure of how workers see opportunity. California's domestic migration, in a dramatic reversal of a 150-year trend, has now been negative for over 20 consecutive years. That is, for over 20 years more people have left California for other states than have come to California from other states. Workers simply haven't seen opportunity in California. How can this be? Why would people be leaving when jobs are being created in the Silicon Valley?

The Silicon Valley jobs are rather specific. They require higher skill sets than most workers possess. One consequence is that the Silicon Valley's prosperity hasn't helped California's other workers much. We are left with a situation where California's tech firms search worldwide for workers, while California workers search for work.

It didn't have to be this way. High housing prices and environmental regulations, a result of state policies, have driven away the jobs that could be performed by typical California workers. Those jobs are now in Oregon, Texas, or China.

A short distance away, in California's Great Central Valley, there is poverty as persistent, deep, and widespread as anyplace in the United States. A recent report shows that California has three of the 20 fastest growing US cities in terms of jobs. It has four in the bottom 20.

For a while, at least, the differences between California's fastest growing regions and its slowest (or declining) areas will grow. In general, coastal areas will see more rapid economic growth than inland ones. Even within these broad regions, there will great heterogeneity. Bakersfield, boosted by a booming oil sector, will see stronger growth than Stockton. San Jose, with its thriving tech sector, will see far more growth than Santa Barbara or Monterey. Furthermore, the best performer among California's inland cities will probably see faster growth than the slowest growing coastal city.

On average, California's economic growth will be far below its potential. In most of the state it will be disappointingly low to dismal, as California's economy is held back by well-meaning but seriously flawed regulations. At the same time, a few super-performing cities may see spectacular growth, at least for a few years.

Eventually, even California's most vibrant economies will slow, gradually strangled by the lack of affordable housing and of an infrastructure necessary to move people from affordable housing to their jobs. People are willing to drive very long distances daily in pursuit of the twin goals of income security and the American dream of a home in the suburbs. The traffic on Highway 14 between Palmdale and Los Angeles reminds us of this twice every working day. But, they need roads, and affordable housing within commuting distance.

Different growth rates and different levels of economic vitality will exacerbate the vast gulf that exists between California's wealthiest communities and its poorest. Inequality will increase as California's fabulously wealthy become ever wealthier, and California's poor suffer in surprising silence, living on whatever aid we give them, denied the hope and the basic dignity that comes from a job.

Domestic outmigration will increase, but the people who leave won't be California's poorest. Instead, young middle-class people will lead the exodus, as they move to wherever opportunity is more abundant. This, of course, will further increase California's inequality and decrease its economic vitality.

We will also see an increase in consumption communities. Already, many of California's coastal communities are reflexively averse to any new activity that actually creates value, opting instead to become ever more exclusive playgrounds for the very rich. These communities will see rising home prices as they restrict new units, and will see rising demand, a result of ever greater concentrations of wealth worldwide and the unmatched amenities available in Coastal California.

By contrast, some inland areas will see declining home values and eventually declining populations, as the lack of opportunity drives potential home buyers to places like Phoenix and Houston.

For many of us, this is a depressing forecast, and it is fair to ask whether or not it is inevitable. It isn't. Few things are. At a statewide level, I hope that representatives of California's large and growing minority communities demand policies that support the opportunity that previous generations of Californians enjoyed. Absent such demands, California's policies are unlikely to change.

At a local level, cities would do well to eliminate all policies that contribute to economic stagnation. When a business is making locational decisions, it reviews lists of positive and negatives for the candidate communities. No place has only positives, and few places have only negatives. California cities are endowed with one huge positive: California is a wonderful place to live. That's not enough, though. A city would do well to minimize the list of negatives.

For businesses, an aggressive minimum wage is a negative, as it raises costs. Uncertainty and delay in a city's response to an economic proposal increases the risk and costs of proposals. It's a negative. So is unaffordable housing, as it increases wage demands and makes it harder for businesses to recruit top talent. The best way for a city to encourage the supply of affordable housing is to allow new-home development.

Finally, areas of economic blight increase crime, raise city costs, reduce city revenues, and are unattractive to businesses considering moving to or expanding in an area. Cities need to be flexible in responses to proposals for these areas. Our work at CERF convinces us that we will need less commercial space in the future. Therefore, almost any proposal for dealing with these areas is preferable to inflexible adherence to existing zoning or plans.

California cities are constrained by California policy. That doesn't mean that California cities are without tools for economic development. Almost any California city — no matter which region it is in — is a better place to live than almost any city in, say, Texas. If that can be leveraged by minimized costs, flexibility, and creativity in adapting to the needs of job-creating businesses, a California city, even today, can assist businesses creating opportunity for its citizens

This is the second part of a two-part report. Bill Watkins is a professor at California Lutheran University and runs the Center for Economic Research and Forecasting, which can be found at clucerf.org

Flickr photo by Aude Lising: The Central California Coast, viewed from the Pacific Coast Highway -- one of California's unmatched amenities.


There Will Be No Real Recovery Without The Middle Class

$
0
0

What if they gave a recovery, and the middle class were never invited? Well, that’s an experiment we are running now, and, even with the recent strengthening of the jobs market, it’s not looking very good.

Over the last five years, Wall Street and the investor class have been on a bull run, but the economy has been, at best, torpid for the vast majority of the population. Despite blather about our “democratic capitalism,” stock ownership is increasingly concentrated with the wealthy as the middle class retrenches. The big returns that hedge funds, real estate trusts or venture capitalist receive are simply outside the reach of the vast majority.

A recent study by the Russell Sage Foundation suggests these patterns of inequality, which have been developing over the last several decades, have become more pronounced in the post-Recession years. In 2013 the wealth of those at the 90th and 95thpercentiles was actually higher than 10 years ago. Everyone else is lower.

The labor market may be strengthening, with the unemployment rate falling to 6.1% last month, but too many of the new jobs are low wage or part time. They aren’t providing the kick the economy got in the last, more broad-based expansion from robust consumer spending.

Wage growth has been weak, rising 2.5% annually since 2009, according to Bloomberg, compared with a 4.3% annual rise from 2001 to 2007. Consumer spending, which makes up roughly 70% of the economy, has expanded an average 2.2% since the recession ended, behind the 3% advance in the prior expansion.

And many working-age people are still sitting discouraged on the sidelines – the labor force participation rate remains the lowest since 1979.

People in marginal or part-time jobs are not likely to drive consumer spending. Instead we have seen the emergence of a new, top-heavy consumer market. Since 1992 the top 5% of households have increased their share of total spending to almost 40%, up from 27% in 1992.

Former Citigroup economist Anjay Kapur has described this situation as a “plutonomy,” in which the economy is increasingly based on the global wealthy and their tastes and predilections.

Meanwhile broader consumer confidence remains weak. Last year some two-thirds of Americans polled by the Washington Post and the Miller Center said they felt life had become tougher over the last five years compared to just 7% who thought theirs had improved. Pollsters also have found almost two-thirds of parents felt their children would do worse in life, a stunning shift from far more optimistic readings back in 1999.

The Housing Market

Historically housing has been the primary asset held by the middle and working class. Despite government efforts to keep mortgages affordable, post-crash, growth has been slow, and much of the buying restricted to investors, including major financial interests. Particularly damaging, there has been a marked decline in the “trade up market” and even more so, sales to first-time buyers, whose share of the market has declined to under 30%, well below the historic average of 40%. This reflects the weak economy, tighter lending standards, and, for younger customers, the heavy burden of student loans.

Some on Wall Street hope to profit from a perceived shift in America to a “rentership society.” Housing more of the population in rental apartments would do little to improve social mobility, as people end up working not for their own equity but to pay the mortgage of their landlords. Nor can the economic payoff from apartment construction come close to that of single-family homes. According to the National Association of Home Builders, building 100 new single-family homes adds 324 jobs to the average metropolitan economy in the year of their construction and 53 jobs annually in the following years. This compares to 122 jobs per 100 new apartments in the year of construction and 32 in the following years. With home starts at less than a third their 2005 level, lack of construction employment also deals a body blow to one of the primary sources of higher-paying blue collar jobs.

The Emasculation Of Small Business

In previous recoveries, small businesses have provided much of the spark and job creation. Not so this time. Small business start-ups have declined as a portion of all business growth from 50% in the early 1980s to 35% in 2010, while its share of employment dropped down from 20% to 12%. Indeed, a 2014 Brookings report revealed that small business “dynamism,” measured by the growth of new firms compared with the closing of older ones, has declined significantly over the past decade, with more firms closing than starting for the first time in a quarter century.

Nor is the future prognosis too good. The rise of the regulatory state, including the Affordable Care Act and higher taxes, amplified in deep blue states such as California, has hit smaller businesses hard. The gradual culling of smaller banks, traditional lenders to entrepreneurs, and the growing concentration of assets in the “too big to fail” banks, historically unfocused on the needs of small companies or individual proprietors, suggests credit may remain tough for grassroots entrepreneurs.

Needed: A New Paradigm

The recession and the weak recovery have taught us you cannot have strong economic growth without the participation of the vast majority of Americans. We’ve run an experiment under Bernanke, Bush and Obama to pump up the economy from above, and what we’ve done is squash the aspirations of those middle orders, particularly small business and the self-employed.

This issue should be at the center of the political debate.  I would welcome suggestions from the right and left about how best to restart a broad-based economic recovery. The best ideas may come from across the spectrum, such as flatter taxes, supported by many conservatives, as well as new spending on major infrastructure projects as improved roads, rivers and ports that generally come from more liberal groups.

The good news is the fundamentals for a broader-based prosperity, including the creation of high-paying blue-collar jobs, remain in place. Progress is already evident in the energy and some manufacturing-oriented regions. Restarting the housing sector — particularly the single-family home component — would do wonders for middle and working class people in many regional economies, as can be seen, for example, in Houston, where more homes will be built this year than in the entire state of California. Nationwide, the gap between  between demand and potential housing, according to the NAB, is roughly 1 million homes, which translates into close to 3 million jobs.

How to drive growth to these and other productive sectors may require not only changes in government policy but also reacquainting the investor class with the virtues of long-term growth, productivity and the revival of the mass economy. Perhaps once they do investors might earn something other than intense dislike from the rest of the population.

This story originally appeared at Forbes.

Joel Kotkin is executive editor of NewGeography.com and Distinguished Presidential Fellow in Urban Futures at Chapman University, and a member of the editorial board of the Orange County Register. He is author of The City: A Global History and The Next Hundred Million: America in 2050. His most recent study, The Rise of Postfamilialism, has been widely discussed and distributed internationally. He lives in Los Angeles, CA.

Michael Lind's New Paradigm and the "End" of Social Conservatism

$
0
0

Michael Lind has released a new essay titled “The Coming Realignment” in The Breakthrough Journal, one of the most innovative magazines around today. He predicts that social conservatism as we know it will fade away, but that does not mean we will have political consensus; only that the terms of engagement may change.

Lind suggests will be two camps, one he calls “liberaltarian” based in the denser urban areas that he calls “Densitaria”; the other, “populiberalism,” will flourish in more  loosely settled suburban areas he calls “Posturbia.” He contends that Densitaria will be primarily occupied by wealthy urbanites and their poor, often immigrant servants, while Posturbia, being dominated by the single family home, will occupy the middle ground. It may not be accessible to the poorest, and not very desirable to the richest; but it will be, however, racially diverse. In many regions  already, suburbs are now more diverse than core cities.

Neither of these cultures will be hostile to the welfare state, but they will have different preferences about what to expect from it. Densitaria will support the means tested welfare programs that have been called “welfare” in American political discourse, but it will want to control their costs, and will want to put restrictions on things that damage the health of potential welfare clients, like smoking and getting fat.  The Posturbians will favor the type of welfare that comes out of the New Deal, which in American political discourse has not been called “welfare”; non-means tested programs like Social Security and Medicare and other forms of social insurance, public libraries and schools, and other government programs available to all and not just the “poor.” The Republican Party could actually become representative of either camp, depending on how things go.

I would remark that polls of Millennials seem to indicate that opposition to abortion and euthanasia continue to resonate, even as other forms of social conservatism, such as opposition to gay marriage fade; the effect of social liberalism will primarily mean that sexual abstinence will not be considered by future pro-lifers the ideal solution to unwanted pregnancy, and they will not be opposed to contraception. Hopefully, pro-lifers will not automatically link up with one of the two camps but will operate in both; but the Densitarian concern with controlling the costs of welfare may make them reluctant to accept restrictions on abortion and euthanasia.

On the other hand, if Posturbians develop an obsession with “overpopulation,” which is a very dated concern but still heard among some secular conservatives (perhaps because what growth we have is increasingly non-white), and are obsessed with keeping their neighborhoods from becoming Densitarian when it comes to school vouchers and tax credits, which I consider a matter of social justice. However, these reforms may actually have more appeal to Densitarians, depending on how the quality of government schools in Posturbia is perceived.

Lind says “the property-owning majorities of Posturbia are likely to be more sensitive to restrictions on what property owners can do with their property” than Densitarians, who will mostly rent or live in condos anyhow, and largely live off Finance, Insurance, and Real Estate industries. I am not so sure. In most of Posturbia, as opposed to small towns or rural areas, “property values” are set not by what you can do with your property, but from what surrounds it; and because of this, and because of not wanting to be densified, the Posturbians will probably favor stringent regulations on the use of their neighbors’ property. Also, they will not be abandoning the automobile, but they will want restrictions on the use of land to keep too many other cars from crowding the roads that they use.

But not everything about the Posturbians will be restrictive. They are expected to be a lot more open to fracking and to other things that will enable them to have the affordable energy supplies that they need. I think the class divisions in Posturbia will be a little greater than Lind thinks; the 1% will probably not be there, but fair numbers of the top 20% will be there, and if not the poorest of the poor, fair numbers of the bottom 40%. I personally believe that class hatred in America is not between the poorest and the richest – class resentment tends to be directed mainly at the classes (or income brackets, often misunderstood by Americans to be classes) just above and below one’s own. The desire to “soak the rich”, except among the near-rich, arises not from resentment but from fantasy, the belief that “the rich” have enough resources to bear most of the burden of society without raising taxes on the rest. They do not, although I admit they have more than they used to.

I’m not sure where I would end up in such an alignment. My preference will be swayed most by which alternative is better for the poor and for the marginalized among us.

Howard Ahmanson of Fieldstead and Company, a private management firm, has been interested in these issues for many years.

Growth, Not Redistribution the Cure for Income Inequality

$
0
0

Ever since the publication this spring of Thomas Piketty’s book “Capital in the 21st Century,” conservatives and much of the business press, such as the Financial Times, have been on a jihad to discredit the author and his findings about increased income inequality in Western societies. Some have even equated growing attacks on inequality with anti-Semitism, with at least one Silicon Valley venture capitalist, Tom Perkins, comparing anti-inequality campaigners to Nazis.

For their part, progressives have taken to embracing the book like acolytes who have found a new gospel for their talking points. Paul Krugman predictably describes the bookas “the most important economics book of the year – and, maybe, the decade.”

Piketty’s book is neither the Sermon on the Mount nor the “Communist Manifesto.” Its findings are, to be sure, far from conclusive, and may well have omitted some relevant points. The French economist’s solutions, as we will discuss, are also wanting. But conservatives, and business interests, should not see these shortcomings as a “get out of jail free” card on the pressing issues of class, inequality and reduced upward mobility.

Conservatives, Businesses Need to Wake Up

There are numerous measurements of reduced upward mobility from many other sources, notably the Federal Reserve, which are based on different data sets. Virtually all the conclusions are stark: The middle-class share of the economy is dropping as the vast majority of new dollars flow into the hands of a relative few.

During the recovery from the Great Recession, income among the three middle quintilesdropped by 1.2 percent, while those of the top 5 percent of incomes grew by over 5 percent. This represents the acceleration of a long-term trend. Overall, the middle 60 percent of Americans have seen their share of the national pie fall from 53 percent in 1970 to barely 45 percent in 2012.

More important, still, may be perceptions. Conservative economists can scoff at Piketty’s findings, but more and more Americans are alienated from the current economic system. For many, according to a 2013 Bloomberg poll, the American Dream seems increasingly out of reach. This opinion prevails by a 2-1 margin among Americans, rising to 3-1 among those making under $50,000 a year, but also is held by a majority earning over $100,000.

At the same time, Americans, by more than 2-1, believe they enjoy fewer economic opportunities than did their parents and feel they will experience far less job security and disposable income. They also see growing ties between powerful business interests and government, with the vast majority feeling that government contracts go to the well-connected. Less than one-third believe the country operates under a free-market system.

For business and for free-market conservatives these attitudes have consequences.Nearly 60 percent of the public, notes Gallup, favor some steps to increase the redistribution of wealth, almost twice as many who felt the current system was “fair.” Sentiments in this direction are even stronger among millennials, with some surveys suggesting that the majority are even sympathetic to socialism. Business needs to learn this lesson: Capitalism can only be sustained if it achieves a semblance of social democratic aims; without this, the system loses credibility and is seen as more oppressive than liberating.

Good news for Democrats

All this could be considered good news for Democrats, particularly the party’s left wing, which has gained growing sway over the party, particularly in urban areas. But there’s this problem with the Obama record: Rather than a shift to a more broad distribution of income, some 95 percent of the income gains during President Obama’s first term went to barely 1 percent of the population while incomes declined for the lower 93 percent of earners. As one writer at the left-leaning Huffington Post put it, “The rising tide has lifted fewer boats during the Obama years – and the ones it’s lifted have been mostly yachts.”

Leftist reaction to this failure has been building in recent years, not only during the Occupy movement, but in the increasingly open criticism of the Obama approach by populist – as opposed to gentry – liberals. Progressives, such as Massachusetts U.S. Sen. Elizabeth Warren, have made it clear that, on this issue, at least, the administration has had few, if any, answers.

Searching for Solutions

This leads us into what could be “terra incognita.” Over the past several decades, we have seen two basic approaches to economic policy. One approach can be called “trickle down,” with tax cuts designed particularly to provide incentives for investors.

Obama has tried a different approach, imposing higher taxes on upper-income professionals and small-business owners (while not touching the lower capital-gains rate for the very rich) as well as a regulatory regime particularly tough on firms without a strong lobbying presence.

The failure of the Obama approach convinces some of the Left that the solution lies with the expanded “social state” advocated by their new guru, Piketty, steps which, they hope, will forcibly redistribute wealth. Like Piketty, they seem to feel that economic growth, traditionally a prime source of social uplift, is little more than an “illusory” solution.

In reality, redistribution by the state would certainly help some, notably lower-income workers, but it’s doubtful it would improve material conditions for much of the middle class or the poor. Such a state is unlikely to increase upward mobility. The 50-year “war on poverty” in the United States, for example, initially helped reduce the percentage of the poor, but has achieved few gains since the 1960s.

Despite $750 billion spent annually on welfare programs, up 30 percent since 2008, a record 46 million Americans were in poverty in 2012. Indeed, racial and ethnic economic disparities have grown under Obama.

In much the same way, the European welfare state – held up as an exemplar by many progressives – has fallen on hard times, attracting the lowest levels of political support in several decades. Certainly, it holds little hope for young people, whose interests wane before a government increasingly focused on the growing ranks of pensioners. Overall unemployment rates in Europe are generally higher than in the U.S., and particularly for the young, where joblessness reaches 20 percent and higher in some countries. Indeed, much of the continent’s youth are widely described as “the lost generation.”

Pervasive inequality and limited social mobility have been well-documented in larger European countries, including France, which has among the world’s most-evolved welfare states. The same is true in Scandinavia, often held up as the ultimate exemplar of egalitarianism. The Nordic countries have much to recommend them, but they, too, face rapidly growing inequality. Indeed, over the past 15 years, the gap between the wealthy and other classes has increased in Sweden four times more rapidly than in the United States.

Ultimately, expanding welfare states, which can ameliorate class inequality, also depress economies and create the conditions for social stagnation. Indeed, as New Deal architect Franklin Roosevelt warned, a system of unearned payments, no matter how well-intended, can serve as “a narcotic, a subtle destroyer of the human spirit” by reducing people’s incentives to better their lives.

In contrast, significant gains in poverty reduction, among those employed, at least, have come when both the economy and the job market expand, as occurred during both the Reagan and Clinton eras. Clearly, as both of these presidents recognized, the best antidote to poverty remains a robust job market. As Mike Barone has pointed out, the best economic results for the middle class have come under either free-market leaders like Reagan or Margaret Thatcher, or moderate liberals, like Clinton or Tony Blair.

What we need, then, is a new focus on economic growth, accompanied by tax changes that both allow marginal rates to fall while equalizing capital gains with income taxes. This would lower the increasingly onerous burden on small businesses and middle-class families, and spark more grass-roots “up from the bottom” growth. It would also shift the economic paradigm away from speculative investment and toward rewarding work and enterprise. Critically, it could slow, perhaps reverse, the precipitous drop in labor force participation rates, particularly among young Americans, a harbinger of Europeanization in the worst sense.

We should neither dismiss the issue of inequality, as many conservatives might wish to, or take the wrong steps to address it. Americans need to have a serious debate on how to confront the most important issue of our times – the growing class divide – with not just ceaseless rhetoric from the political class that, for the most part, to recall Shakespeare’s “MacBeth,” “is full of sound and fury, signifying nothing.”

This article first appeared in the Orange County Register.

Joel Kotkin is executive editor of NewGeography.com and Distinguished Presidential Fellow in Urban Futures at Chapman University, and a member of the editorial board of the Orange County Register. He is author of The City: A Global History and The Next Hundred Million: America in 2050. His most recent study, The Rise of Postfamilialism, has been widely discussed and distributed internationally. He lives in Los Angeles, CA.

Success and the City: Houston's Pro-growth Policies Producing an Urban Powerhouse

$
0
0

David Wolff and David Hightower are driving down the partially completed Grand Parkway around Houston. The vast road, when completed, will add a third freeway loop around this booming, 600-square-mile Texas metropolis. Urban aesthetes on the ocean coasts tend to have a low opinion of the flat Texas landscape—and of Houston, in particular, which they see as a little slice of Hades: a hot, humid, and featureless expanse of flood-prone grassland, punctuated only by drab office towers and suburban tract houses. But Messrs. Wolff and Hightower, major land developers on Houston's outskirts for four decades, have a different outlook.

"We may not have all the scenery of a place like California," notes the 73-year-old Mr. Wolff, who is also part owner of the San Francisco Giants. "But growth makes up for a lot of imperfections."

A host of newcomers—immigrants and transplants from around the United States—agree. The city's low cost of living and high rate of job growth have made Houston and its surrounding metro region attractive to young families. According to Pitney Bowes,PBI +2.11% Houston will enjoy the highest growth in new households of any major city between 2014 and 2017. A recent U.S. Council of Mayors study predicted that the American urban order will become increasingly Texan, with Houston and Dallas-Fort Worth both growing larger than Chicago by 2050.

Houston's economic success over the past 20 years—and, more remarkably, since the Great Recession and the weak national recovery—rivals the performance of any large metropolitan region in the U.S. For nearly a decade and a half, the city has added jobs at a furious pace—more than 600,000 since early 2000, and 263,000 since early 2008.

The much more populous greater New York City area has added 103,000 jobs since 2008, and Los Angeles, Chicago, Phoenix, Atlanta and Philadelphia remain well below their 2008 levels in total jobs. Los Angeles and Chicago, like Detroit, have fewer jobs today than they did at the turn of the millennium.

Many of Houston's jobs pay well, too. Using Praxis Strategy Group calculations that factor in the cost of living as well as salaries, Houston now has among the highest, if not the highest, standard of living of any large city in the U.S. The average cost-of-living-adjusted salary in Houston is about $75,000, compared with around $50,000 in New York and $46,000 in Los Angeles.

Since 2001, the energy industry has been directly responsible for an increase of 67,000 jobs in Houston, and it now employs more than 240,000 people in the area. These include many technical positions, one reason the region now boasts the highest concentration of engineers outside Silicon Valley. The jobs should keep coming: University of Houston economist Bill Gilmer estimates that $25 billion to $40 billion in new petrochemical facilities is on its way to Greater Houston.

Houston also has seen a surge in mid-skills jobs (usually requiring a certificate or a two-year degree) in fields such as manufacturing, logistics and construction, as well as energy. Many of these jobs pay more than $100,000 a year. And according to calculations derived from the Bureau of Labor Statistics by the Praxis Strategy Group's Mark Schill, since 2007 Houston has led the 52 major metropolitan areas in creating these jobs, at a rate of 6.6% annually. In contrast, mid-skills jobs have declined by more than 10% in New York, Los Angeles, Chicago, and San Francisco, which have not been friendly to such industries.

Houston's growth is more than oil-industry luck; it reflects a unique policy environment. The city and its unincorporated areas have no formal zoning, so land use is flexible and can readily meet demand. Getting building permits is simple and quick, with no arbitrary approval boards making development an interminable process. Neighborhoods can protect themselves with voluntary, opt-in deed restrictions or minimum lot sizes.

The flexible planning regime is also partly responsible for keeping Houston's housing prices relatively low. On a square-foot basis, according to Knight Frank, a London-based real-estate consultancy, the same amount of money buys almost seven times as much space in Houston as it does in San Francisco and more than four times as much as in New York. Houston has built a new kind of "self-organizing" urban model, notes architect and author Lars Lerup, one that he calls "a creature of the market."

Housing-market flexibility has also benefited some of the city's historically neglected areas. The once-depopulating Fifth Ward has seen a surge of new housing—much of it for middle-income African-Americans, attracted by the area's long-standing black cultural vibe and close access to downtown as well as the Texas Medical Center. Rather than worry about gentrification, many locals support the change in fortunes. "In Houston, we don't like the idea of keeping an image of poverty for our neighborhood," explained Rev. Harvey Clemons, chairman of the Fifth Ward Community Redevelopment Corporation. "We welcome renewal."

Houston's explosive economic growth has engendered another kind of boom: a human one. Between 2000 and 2013, Greater Houston's population expanded by 35%—while New York, Los Angeles, Boston, Philadelphia, and Chicago grew by 4% to 7%. According to a 2012 Rice University study, Greater Houston is now the most ethnically diverse metro region in America, as measured by the balance between four major groups: African-American, white, Asian and Hispanic. "This place is as diverse as California," notes David Yi, a Korean-American energy trader who moved to Houston from Los Angeles in 2013. "But it is affordable, with good schools."

The growth-friendly attitude is what holds everything together in Houston, and it will be crucial whenever the next slowdown comes—when oil prices could drop, say, to below $100 a barrel. It remains to be seen whether a large influx of newcomers to Greater Houston from the ocean coasts will clamor, as they have elsewhere—notably, in Colorado—for a more controlled, high-regulation urban environment. For now, though, most Houstonians see the city as a place that works—for minorities and immigrants, for suburbanites and city dwellers—and few want to fix what isn't broken.

This article first appeared in the Wall Street Journal.

Joel Kotkin is executive editor of NewGeography.com and Distinguished Presidential Fellow in Urban Futures at Chapman University, and a member of the editorial board of the Orange County Register. He is author of The City: A Global History and The Next Hundred Million: America in 2050. His most recent study, The Rise of Postfamilialism, has been widely discussed and distributed internationally. He lives in Los Angeles, CA.

Tory Gattis is a Social Systems Architect, consultant and entrepreneur with a genuine love of his hometown Houston and its people. He covers a wide range of Houston topics at Houston Strategies - including transportation, transit, quality-of-life, city identity, and development and land-use regulations - and have published numerous Houston Chronicle op-eds on these topics.

Houston photo by BigStockPhoto.com.

Large Urban Cores: Products of History

$
0
0

Urban cores are much celebrated but in reality most of the population living in functional urban cores is strongly concentrated in just a handful of major metropolitan areas in the United States. This conclusion is based on an analysis using the City Sector Model, which uses functional characteristics, rather than municipal jurisdictions, to analyze urban core and suburban components of metropolitan areas.

Functional Classifications of Metropolitan Areas

The City Sector Model allows a more representative functional analysis of urban core, suburban and exurban areas, by the use of smaller areas, rather than municipal boundaries.

The nearly 9,000 zip code tabulation areas of major metropolitan areas are categorized by functional characteristics, including urban form, density, and travel behavior. There are four functional classifications, the urban core, earlier suburban areas, later suburban areas and exurban areas. The urban cores have higher densities, older housing and substantially greater reliance on transit, similar to urban cores that existed before the post-World War II automobile oriented suburbanization. Exurban areas are beyond the built up urban areas. The suburban areas constitute the balance of the major metropolitan areas. Earlier suburbs include areas with a median house construction date before 1980. Later suburban areas have later median house construction dates.

Concentrating in New York and A Few Other Areas

As is so often the case on dense urbanization, the statistics are dominated by New York urban core which accounts for 42 percent of the total urban core population for the whole country. The New York metropolitan area, with 19.6 million people represents roughly six percent of the country’s population but its urban core –some 10.2 million strong – is larger than the total population of every metropolitan area in the nation other than Los Angeles (12.8 million).

New York's dominance is not surprising, reflecting its unique history and development.  Four of the core city's five boroughs (Brooklyn, Queens, Manhattan, and the Bronx) have higher population densities than any municipality more than one-one hundredth its size in the United States. Significantly, unlike most major metropolitan areas, New York's functional urban core stretches well beyond the core city, and includes more than 2,000,000 residents outside New York City.

Another 36 percent of the nation’s urban core population is in six metropolitan areas, though none reaches a population close to that of New York (Figure 1). Chicago is second, with an urban core population of 2.4 million. Four other urban cores exceed 1,000,000 population, including Boston (1.6 million), Philadelphia (1.5 million), Los Angeles (1.3 million) and San Francisco (1.1 million). The seventh largest urban core is in Washington, at 900,000. These seven metropolitan areas include the six transit legacy cities (municipalities), which account for 55 percent of the transit work trip destinations and 99 percent of the increase in urban core transit commuting in the United States over the past 10 years.(Los Angeles is not classified as a transit legacy city).

After Washington, the size of urban cores drops off markedly with the next 45 largest metropolitan areas accounting for only 22 percent of the urban core population. Cleveland ranks eighth at 460,000, Baltimore is ninth at 440,000, and Minneapolis-St. Paul is 10th with 420,000 urban core residents. Perhaps surprisingly, Providence, which is the nation's 38th largest metropolitan area, ranks 11th in urban core population, at 410,000 residents. Pittsburgh, Milwaukee, Buffalo, and St. Louis round out the top 15, with between 320,000 and 370,000 urban core residents (Figure 2).

Another 9 metropolitan areas have urban core populations exceeding 100,000:Detroit, Seattle, Cincinnati, Portland, Hartford, New Orleans, Rochester, Kansas City, and Louisville.

Urban Cores over 100,000 Population

Approximately 97 percent of the urban core population lives in the 24 major metropolitan areas with more than 100,000 urban core residents. Between 2000 and 2010, the urban core populations in these areas dropped from 25.3 percent to 24.0 percent of their respective metropolitan populations. The continued decentralization of these metropolitan areas is illustrated by a loss in the earlier suburban areas and gains in the later suburban areas and exurban areas (Figure 3).

By comparison, only one percent of the population was in the urban cores of the other 28 major metropolitan areas (fewer than 100,000 residents in the urban core).

New York had by far the largest percentage of its total metropolitan population in the urban core, at 52 percent. Boston ranked second, with 34 percent of its population in the urban core. Buffalo, which was ranked only 47th in metropolitan area population, was third in urban core population share (29 percent). Chicago and San Francisco had 26 percent of their population in the urban cores, followed by Providence and Philadelphia at 25 percent (Figure 4).

Description of the Largest Urban Cores

There is substantial variation in the geographical extent of the largest urban cores relative to their corresponding historical core municipalities. This is described below and illustrated in the just published Demographia City Sector Model Metropolitan Area Maps.

As would be expected, New York's urban core includes nearly all of the city of New York. Virtually all of Brooklyn, Manhattan, the Bronx, and Queens are in the urban core, though only parts of Staten Island are included. The urban core extends into New Jersey, with nearly all of Hudson County (including Jersey City) included, the core of Essex County (including Newark) and the city of Elizabeth (in Union County). The urban core and extends into Long Island's Nassau County, including Hempstead, Valley Stream, Rockville Center and other areas. To the north, the urban core extends to parts of Westchester County (such as Yonkers, Pelham, Mount Vernon and New Rochelle). Interestingly, many of these areas, such as in western Nassau County, parts of Essex County and southern Westchester County are also suburban in form, but are classified as urban core because of high transit market shares, higher densities or pre-war development.

Chicago's urban core, the second largest, extends beyond but also excludes parts of the city of Chicago. The urban core extends into adjacent areas, such as older “suburban” Evanston, Oak Park and Cicero. There is also a significant urban core in northwestern Indiana, centered on East Chicago and Hammond.

Boston's urban core extends far outward from the city of Boston, including much of the area inside Route 128 (Interstate 95). This area also includes cities such as Cambridge, Everett, Somerville, Quincy, Medford, Waltham, and Lynn.

Philadelphia's urban core is largely confined to the city of Philadelphia, with extensions into Delaware County, Pennsylvania and Camden County, New Jersey.

The urban core of Los Angeles is principally in the area extending from Hollywood to parts of East Los Angeles and south to the Interstate 105 freeway. However, much more of the city of Los Angeles is not in the urban core. The urban core also includes parts of Beverly Hills, West Los Angeles, Pasadena and Glendale.

The urban core of San Francisco includes most of the cities of San Francisco and Oakland, as well as much of Berkeley, Albany, and Emeryville.

Washington's urban core includes most of Washington (the District of Columbia) and extends into Arlington and Alexandria in Virginia and has a large extension into Montgomery County, Maryland, including areas such as Bethesda and Silver Spring.

Urban Cores Compared to Historical Core Municipalities

A comparison of functional urban core populations to the populations of historical core municipalities indicates the problem of relying on jurisdictional (municipal) boundaries for urban core analysis. Functional urban core and historical core municipality populations vary significantly (Figure 5). The greatest differences are in Boston and Louisville. Boston's functionalurban core population is 2.52 times that of the historical core municipality (Boston). Louisville's functional urban core population is only one-sixth that of the historical core municipality (Louisville).

Providence is second to Boston in its ratio of urban core population to that of historical core municipality at 2.29. The city of Providence had only 178,000 residents in 2010. (Among historical core municipalities, only Hartford was smaller at 125,000). Washington has an urban core population 1.49 times that of the historical core municipality, while New York and Buffalo had urban cores 1.25 times the population of their historical core municipalities.

Among urban cores with more than 100,000 population Kansas City, Los Angeles, Portland, and New Orleans follow Louisville with the lowest ratios to historical core municipality populations (from 24 percent to 37 percent). In each of these cases, the urban core's low ratio is the result of substantial annexations or large areas or the settling of large rural territories that had been previously included in the municipal limits (such as Los Angeles and New Orleans).

Urban Cores: Products of History

Indeed, nothing distinguishes the major metropolitan areas with larger urban core populations from the rest than history, In1940, just before the great mobility and suburbanization revolution, there were 23 metropolitan areas in the United States with wore than 500,000 population. The major metropolitan areas with the 19 largest urban cores in 1940 were all among the 23 with more than 500,000 population in 1940. Out of the 24 major metropolitan areas with more than 100,000 urban core residents in 2010, 21had more than 500,000 population in 1940 (only Hartford, Rochester and Louisville had smaller populations).

Conversely, only two of the 28 major metropolitan areas in 2010 with fewer than 100,000 functional urban core residents had more than 500,000 residents in 1940, and they were among the smaller (Houston with 528,000 and Atlanta with 518,000).

Urban cores were not planned, but rather were the result of consumer trendsin a time of much lower household incomes and much more restricted personal mobility. Many of the very centers of urban cores are reviving, but overall core growth continues to lag behind that of metropolitan areas. Moreover, there are no significant new ones.Urban cores, as much as anything, are a product of history.

------------

Wendell Cox is principal of Demographia, an international public policy and demographics firm. He is co-author of the "Demographia International Housing Affordability Survey" and author of "Demographia World Urban Areas" and "War on the Dream: How Anti-Sprawl Policy Threatens the Quality of Life." He was appointed to three terms on the Los Angeles County Transportation Commission, where he served with the leading city and county leadership as the only non-elected member. He was appointed to the Amtrak Reform Council to fill the unexpired term of Governor Christine Todd Whitman and has served as a visiting professor at the Conservatoire National des Arts et Metiers, a national university in Paris.

------------

Illustration: Core of the New York metropolitan area (City Sector Model map)

Viewing all 3792 articles
Browse latest View live


Latest Images