Quantcast
Channel: Newgeography.com - Economic, demographic, and political commentary about places
Viewing all 3794 articles
Browse latest View live

Are America’s Rich More Generous?

$
0
0

In 2009, the two richest men in America organized a confidential dinner meeting of billionaires in New York City, hosted by David Rockefeller. Guests included George Soros, Michael Bloomberg, Ted Turner, and Oprah Winfrey. The topic of discussion was philanthropy. Each billionaire was asked to describe his philosophy of giving. CNN-founder Ted Turner told the story tale of how he had made a spur-of-the-moment decision to donate $1 billion, most of his future, to the United Nations. During this dinner, Bill Gates and Warren Buffet started the biggest fundraising drive in history. Setting examples though their own charity, Gates and Buffet initiated “The Giving Pledge”, a campaign encouraging billionaires to commit the majority of their wealth to philanthropic causes. So far around 113 billionaires have agreed to the pledge.

Billionaires are targeted because Gates and Buffet believe that only they have sufficient funds to make a dent into the world’s major problems. The United States was initially chosen in part because the nation has a stronger culture of donating. The social contract in the United States puts stronger emphasize on giving back something to society by those fortunate enough to have acquired wealth. Bill Gates has already donated close to $30 billion dollars of his own wealth. He has further pledged to donate his remaining wealth of about $60 billion (leaving his three children $10 million each). Omaha billionaire Warren Buffett was inspired by his friend Gates’ example and also pledged all of wealth to charity. Leaving only a small endowment to his children, Buffet stating “I want to give my kids just enough so that they would feel that they could do anything, but not so much that they would feel like doing nothing”.

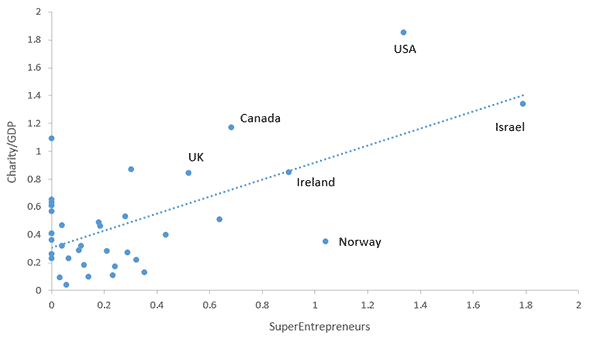
On average, the wealthy in the United States tend to donate a higher share of assets to charity than those in other countries. There also appears to exist an international correlation between charitable donations and billionaire entrepreneurship. The Johns Hopkins Comparative Nonprofit Sector Project cites data about cross-country differences in charitable donations. The 2004 book “Global Civil Society: Dimensions of the Nonprofit Sector” contains charitable donations as a share of GDP in 36 countries. According to this source Americans donated 1.9% of GDP to charity, compared to 0.3% of GDP in continental Europe.

In the publication “SuperEntrepreneurs – and how your country can get them” we recently examined the circa 1000 self-made men and women who have earned at least $1 billion dollars and who have appeared in Forbes magazine’s list of the world’s richest people between 1996 and 2010. There is a very strong correlation between the per capita number of SuperEntreprenures in different countries and donations to charity as a share of GDP. This relationship holds also when controlling for per capita GDP and tax rates. Other than the United States, countries with a high count of SuperEntreprenures and high charity as a share of GDP includes Israel (1.3 percent of GDP), Canada (1.2 percent) and the United Kingdom (0.8 percent). Several British Superentreprenurs have joined the Gates and Buffet Giving Pledge to donate half their wealth to charity, including Michael Anthony and Richard Branson.

It may be that the strong correlation between charity and the number of SuperEntreprenurs is not causal and reflects cultural differences, such as Anglo-Saxon countries donating more to charity and having more entrepreneurship. To some extent, there may be an interplay between Anglo-Saxon capitalist culture and Anglo-Saxon prescription for charity, especially for the fortunate. Tocqueville has argued that Protestant norms such as industry, frugality, charity and humility were important for American development. The Calvinist Puritan settlers brought with them strong norms of charity from England, which also influenced Canada and Australia. Interestingly, a similar norm towards expectations of charity from the wealthy exists in Jewish culture, which may in part account for the high rate of charity in Israel. The lower rates of charitable giving is found in poorer countries such as Mexico (0.04 percent of GDP) and India (0.09 percent) but also in Germany (0.13 percent) Austria (0.17 percent), Korea (0.18 percent) and Japan (0.22 percent).

American capitalism differs from other societies in its historical focus on both the creation of wealth and the reconstitution of wealth through philanthropy. In 1957, Historician Merle Curti argued that “philanthropy has been one of the major aspects of and keys to American social and cultural development”. The implicit social contract allows rich Americans to retain most of their wealth from taxation. In return, they voluntarily give much of it back to society, in projects of their choosing. The notion exists that wealth beyond a certain point should be invested back in society to expand opportunity for future generations. In this way John D. Rockefeller, the richest man in American history, gave back 95 percent of his wealth before he died.

The legitimacy of American capitalism has in part been upheld through voluntary donations from the rich. Social norms regulating donations differ markedly between Europe and the United States, not only for the rich. In the United States, around 2 percent of GDP is donated to charity each year; about ten times higher the ratio of European countries. Based on tax data, Fortune Magazine estimates that the 400 highest earning Americans donate $15 billion to charity each year, or around ten percent of their annual income. Compared to other donors, wealthy Americans are more likely to donate to education and the arts but less likely to donate to religion.

Much of the new wealth created historically has thus been given back to society. This has had several feed-back effects on capitalism. For one, the practice has limited the rise of new dynasties. Another positive feed-back mechanism is that the donations to research and higher education in particular has allowed new generations to become wealthy. In his lifetime, Rockefeller alone established many important institutions, including the University of Chicago, Spelman College, The General Education Board, National Bureau of Economic Research, Brookings Institution, and the Rockefeller Foundation. The University of Chicago is not the only great private research universities created through individual philanthropy. The same is true for Stanford, MIT, Johns Hopkins, Carnegie-Mellon, and Duke.

Lastly the practice of philanthropy creates legitimacy for capitalism among the public. Bill Gates, the richest man in America, accumulated his wealth using famously sharp elbows. Yet his is one of the most popular people in the country. In one public Pew poll, he was viewed favorably by 69 percent and unfavorably by only 15 percent of the public, the best numbers of any public person polled. Similarly according to Gallup Bill Gates in the most admired man in America who is not a current or former President.

Scholars Asc and Phillips have disused the “entrepreneurship-philanthropy nexus” at length, arguing that “[m]uch of the new wealth created historically has been given back to the community, to build up the great social institutions that have a positive feedback on future economic growth.” Asc and Phillips describe the importance of these norms in American economic history: “For Carnegie, the question was not only, ‘How to gain wealth?’ but, importantly, ‘What to do with it?’ The Gospel of Wealth suggested that millionaires, instead of bequeathing vast fortunes to heirs or making benevolent grants by will, should administer their wealth as a public trust during life”. Charitable instincts amongst highly successful entrepreneurs is relevant for economic development, in a time where there is global concern that rich dynasties will dominate capital ownership by investing inherited wealth. The combination of opportunities to create new wealth and philanthropy has so far ensured that Anglo-Saxon societies are characterized by new wealth, compared to countries such as France where inherited wealth plays an increasingly important part in the economy.

Dr. Nima sanandaji is a frequent writer for the New Geography. Dr. Tino Sanandaji is a full-time researcher at the Research Institute of Industrial Economics (IFN) in Stockholm. They have co-authored “SuperEntrepreneurs – and how your country can get them” (Center for Policy Studies) which has received considerable media impact during recent weeks.

Bill Gates photo by PauloHenrique. 


Acs, Z.J., and R.J. Phillips (2002). “Entrepreneurship and philanthropy in American capitalism”. Small Business Economics, 19;3:189-204.


Curti, M. (1957). "The History of American Philantropy as a Field of Research", The American Historical Review, 62;2:352-363. De Tocqueville, A. (1966), reprint from original 1835 publication. “Democracy in America”, New York, NY: HarperCollings.

Fortune Magazine and CNN Money (2010). "The $600 billion challenge", 2010-06-16. Blog post availiable on http://features.blogs.fortune.cnn.com/2010/06/16/gates-buffett-600-billion-dollar-philanthropy-challenge/ when last checked 2013-12-31.

Lester, S., W. Sokolowski and Associates (2004). “Global Civil Society: Dimensions of the Nonprofit Sector, Volume Two”, Bloomfield, CT: Kumarian Press.

Pandering to the Minority Vote

$
0
0

As they approach what could be a troublesome election season, Democratic party strategists have targeted two issues – inequality and race – as their primary means to prevent another shellacking in the mid-terms.

But given the growing dominance of wealthy and overwhelmingly white gentry liberals, the class issue could prove troublesome, particularly given the tepid performance of the economy.

In contrast, race appears to be the gift that keeps on giving. For Democrats, every day recalls the early civil rights struggle. Racially-tinged outbursts by people like Clippers owner Donald Sterling and Nevada rancher Cliven Bundy allow the progressives and the media to play the race card – a convenient way to boost minority turnout.

Clearly, any sizeable drop- off in minority turnout would benefit the Republicans, who, to date, have been largely unsuccessful in appealing to non-white voters.

A more relevant concern may be whether the overwhelming commitment minorities have to the Democratic Party actually works in their favor.

To be sure, under the current regime, well-educated, affluent and well-connected minorities stand at the pinnacle of power, including the presidency and attorney general’s office.

Culturally, the impact of African Americans and, increasingly, Hispanics has arguably never been greater.

But beyond the symbolic level, the picture is considerably less inspirational. However much some historically neglected minorities have thrived and excelled, the overall economic and social gains for most minorities have been paltry at best.

Despite the benefits of government programs such as affirmative action – something opposed by some other minorities, notably Asian Americans – African Americans have not expanded their share of the middle class in recent decades. Indeed, racial economic disparities are growing, with black unemployment more than double the white jobless rate and reaching 40 percent among youths.

Even more revealing, many of those areas under the most complete progressive control – New York, San Francisco and Chicago – also have among the worst disparities between black and white incomes, notes a recent National Urban League study.

It may well be that hyper-regulatory regimes in the left-leaning cities tend to chase away blue collar jobs and raise the price of housing so high that minorities simply leave. Many of those who stay pay an inordinate share of their income, often upwards of 50 percent, just to keep a roof over their head.

As Thomas Sowell has observed, the black population of San Francisco, the ultimate gentry city, is now half of what it was in 1970, even as the city has experienced an overall demographic resurgence.

To be sure, a primarily redistributionist approach may improve some material conditions, but it also seems to foster a permanent underclass of dependents.

This can be seen in the ability of the 50-year war on poverty to reduce levels considerably after the initial gains of the 1960s.

The biggest reductions in poverty have taken place not during periods of higher welfare spending, but during economic expansions such as those that occurred under Presidents Reagan and Clinton, both of whom, in different ways, opposed the expansion of traditional welfare programs.

This article first appeared in the Orange County Register.

Joel Kotkin is executive editor of NewGeography.com and Distinguished Presidential Fellow in Urban Futures at Chapman University, and a member of the editorial board of the Orange County Register. He is author of The City: A Global History and The Next Hundred Million: America in 2050. His most recent study, The Rise of Postfamilialism, has been widely discussed and distributed internationally. He lives in Los Angeles, CA.

Voter sign photo by Bigstock.

Are Law School Grads the Future's Paralegals?

$
0
0

According to recent figures, in the United Kingdom paralegals already make up (as a mean average) 44 percent of all fee earners in solicitors firms, and are on track to outnumber solicitors in firms within a decade. In the US, the Bureau of Labor Statistics projects a 16.7 percent growth in paralegal jobs between 2012 and 2022, adding 46,200 positions. Jobs for attorneys are expected to grow only about 10 percent during that period.

Before the recent economic downturn, paralegals were either employees looking for further work experience, recent graduates working as paralegals for a short period of time to improve their expertise, or those who specifically wished to pursue a long-term careers as paralegals. Now, a new type of candidate is beginning to emerge: that of the accomplished law graduate who cannot secure a permanent job as a lawyer due to the vast number of suitable candidates. Legal firms are motivated to employ these academically gifted candidates as paralegals, because it means they can get employees who will work diligently for a much lower rate than young lawyers.

Employment vacancies at legal firms are scarce in today's economic climate. A vast number of UK legal graduates now leave university without training contracts. These graduates often seek alternative jobs within the legal profession, such as paralegal work. The situation of US law school graduates improved in 2013, but not by much, says The Wall Street Journal, which reports that things are looking up for the class of 2014, too, though finding full-time work remains a challenge.

Many law school graduates have found themselves in this unfortunate employment predicament. For instance, Bar Professional Training Course graduate Georgina Blower described to The Guardian how "After finishing bar school without a pupillage in 2009, I got a paralegal job with a car manufacturer in a town outside London. I was one of the lucky ones, with most people on my course struggling to get any sort of legal-related work". Despite being unable to acquire a training contract, Blower highlighted the benefits of working as a paralegal, describing it as "… good general experience... All you can do is keep stacking things in your favour and hope it all pays off."

Fellow graduate Charlotte Dalley offers a similar viewpoint. She graduated from the University of Chester with a 2.1 Law (LLB) degree and since 2013 has been working as a Trainee Solicitor for Gillhams Solicitors. The position has enabled Dalley to assist seasoned partners and more senior associates "with all aspects of private client work including the preparation of wills, probate and the administration of estates," as well as gain "some valuable experience in dealing with residential and commercial property transactions". In this way, paralegal work offers graduates the opportunity to acquire beneficial legal skills from which they can profit in the future.

Even graduates who are fortunate enough to have secure routes to jobs as lawyers can see the benefits of paralegal work for boosting their long term career prospects. Leontia McArdle started working as a paralegal at international firm DLA Piper, despite having already secured a training contract at the firm. She found that; “When I was doing my application forms for training contracts, I thought it would really help if I had more experience in a law firm... I started applying for paralegal positions to confirm my interest and to show it was definitely the career I wanted".

By drawing on examples such as these, The Institute of Paralegals has been eager to demonstrate the benefits of working as a paralegal for law graduates. Legal firms, they say, prefer training contract candidates who have prior experience, "because the world of full-time, permanent work in a professional environment is something that most trainee solicitors have not previously experienced. They therefore sometimes need a "settling in" as they adjust to life as a worker and not a student. Paralegals have already had gone through that process - at somebody else's expense!".

Ultimately, due to these trends, more legal graduates are seeking paralegal work. So much so that research suggests the number of people working as paralegals may continue to increase in the UK by over 20 percent in the next four years. This is predominantly due to the fact that legal firms are reluctant to hire more junior lawyers, yet the number of law graduates seeking employment continues to increase. In these circumstances, gaining employment as a paralegal permits graduates to work within their chosen field, develop professional relationships with employers and clients, and consolidate their knowledge of various aspects of legal work. All of this can prove beneficial not just while entry-level recruitment is flat, but throughout their long term legal careers.

Bradley Taylor is a freelance writer from Derby, England. He enjoys writing across a variety of topics including law, travel and food. Follow Bradley on Twitter @BradleyTaylor84.

Flickr photo by Stephanie Pakrul.

From Jurisdictional to Functional Analysis of Urban Cores & Suburbs

$
0
0

The 52 major metropolitan areas of the United States are, in aggregate, approximately 86 percent suburban or exurban in function. This is the conclusion from our new City Sector Model, which divides all major metropolitan zip codes into four functional categories, based on urban form, population density and urban travel behavior. The categories are (1) Pre-Auto Urban Core, (2) Auto Suburban: Earlier, (3) Auto Suburban: Later and (4) Auto Exurban. It is recognized that automobile-oriented suburbanization was underway before World War II, but it was interrupted by the Great Depression during the 1930s and was small compared to the democratization of personal mobility and home ownership that has occurred since that time.

For decades there has been considerable analysis of urban core versus suburban trends. However, for the most part, analysts have been jurisdictional, comparing historical core municipalities to the expanse that constitutes the rest of the metropolitan area. Most core municipalities are themselves substantially suburban, which can mask (and exaggerate) the size of urban cores.

The Queen's University Research

The City Sector Model is generally similar to the groundbreaking research published by David L. A. Gordon and Mark Janzen at Queen's University in Kingston Ontario (Suburban Nation: Estimating the Size of Canada's Suburban Population) with regard to the metropolitan areas of Canada. Researchers used travel behavior (journey to work data from the 2006 census) and density for classifying metropolitan areas into four sectors, (1) Active Core, (2) Transit Suburbs, (3) Auto Suburbs, and (4) Exurbs. The active core was that portion of metropolitan areas with a high share of work trip travel by walking and cycling. I covered the research in a newgeography.com article last autumn.

Gordon and Janzen concluded that the metropolitan areas of Canada are largely suburban. Among the major metropolitan areas of Canada, the Auto Suburbs and Exurbs combined contain 76 percent of the population, somewhat less than the 86 percent we found in the United States.

The City Sector Model follows the same general approach as the Queens University research, although there are important differences. For example, the City Sector Model is principally aimed at identifying the Pre-Auto Urban Core component of the modern metropolitan area and does not identify an active core.

All US Major Metropolitan Area Growth Has Been Suburban and Exurban

Virtually all population growth in US metropolitan areas (as currently defined) has been suburban or exurban since before World War II (the 1940 census). The historical core municipalities that have not annexed materially and were largely developed by 1940 have lost population. As a result, approximately 110 percent of their metropolitan area growth has occurred in suburbs and exurbs. Further, among the other core municipalities, virtually all of the population growth that has occurred in annexed areas or greenfield areas that were undeveloped in 1940 (Figure 1).

Identifying the Pre-Auto Urban Core

The City Sector Model is not dependent upon municipal boundaries (the term "city" is generic, and refers to cities in their functional sense, metropolitan areas, or in their physical sense, urban areas). Not being constrained by municipal boundaries is important because core municipalities vary substantially. For example, the core municipality represents less than 10 percent of the population of Atlanta, while the core municipality represents more than 60 percent of the population of San Antonio. The City Sector Model applies data available from the US Census Bureau to estimate the population and distribution of Pre-Auto Urban Cores in a consistent manner.

At the same time, the approach is materially different from the Office of Management and Budget (OMB) classification of "principal cities." It also differs from the Brookings Institution "primary cities," which is based on the OMB approach. The OMB-based classifications classify municipalities using employment data, without regard to urban form, density or other variables that are associated with the urban core. These classifications are useful and acknowledge that the monocentric nature of US metropolitan areas has evolved to polycentricity. However, non-urban-core principal cities and primary cities are themselves, with few exceptions, functionally suburban.

The City Sector Model Criteria

Due to media and academic interest in the Pre-Auto Urban Core, a number of data combinations were used to best fit the modeled population to that of the core municipalities that have virtually the same boundaries as in 1940 and that were virtually fully developed by that time (the Pre-War & Non-Suburban classification in historical core municipalities). A number of potential criteria were examined, and the following were accepted (Figure 2).

The Auto Exurban category includes any area outside a principal urban area.

The Pre-Auto Urban Core category includes any non-exurban with a median house construction date of 1945 or before and also included areas with a population density of 7,500 per square mile (2,900 per square kilometer) or more and with a transit, walk and cycling journey to work market share of 20 percent or more.

The Auto Suburban Earlier category included the balance of areas with a median house construction date of 1979 or before.

The Auto Suburban Later category later included the balance of areas with a median house construction date of 1980 or later.

Additional details on the criteria are in Note 1

Results: 2010 Census

The combined Pre-Auto Urban Core areas represented 14.4 percent of the population of the major metropolitan areas in 2010 (2013 geographical definition). This compares to the 26.4 percent that the core municipalities themselves represented of the metropolitan areas, indicating nearly half of their population was essentially suburban.

The Auto Suburban: Earlier areas accounted for 42.0 percent of the population, while the Auto Suburban: Later areas had 26.8 percent of the population. The Auto Exurban areas had 16.8 percent of the population (Figure 3).

The substantial difference between US and Canadian urbanization is illustrated by applying an approximation of the Gordon-Janzen criteria, which yielded an 8.4 percent Pre-Auto Urban Core population. The corresponding figure for the six major metropolitan areas of Canada was 24.0 percent. This difference is not surprising, since major Canadian urban areas have generally higher densities and much more robust transit, walking and cycling market shares. Yet, the Gordon-Janzen research shows Canada still to be overwhelmingly suburban (Note 2).

Population Density: As would be expected, the Pre-Auto Urban Core areas had the highest densities (Figure 4), at 11,000 per square mile (4,250 per square kilometer). The Auto Suburban: Earlier areas had a density of 2,500 per square mile (1,000 per square kilometer), while the Auto Suburban: Later had a population density of 1,300 per square mile (500 per square kilometer), while the Auto Exurban areas had a population density of 150 per square mile (60 per square kilometer)).

Individual Metropolitan Areas (Cities)

The metropolitan areas with the highest proportion of Pre-Auto Urban Core population are New York (more than 50 percent), and Boston (nearly 35 percent), followed by Buffalo, Chicago, San Francisco-Oakland, and Providence, all with more than 25 percent (Table).


Table
City Sectors: 2010
Major Metropolitan Areas
City (Metropolitan Area)Pre-Auto Urban CoreAuto Suburban: EarlierAuto Suburban: LaterAuto Exurban
Atlanta, GA0.5%14.9%70.7%13.8%
Austin, TX1.8%15.7%62.5%20.0%
Baltimore, MD16.2%41.8%19.9%22.0%
Birmingham, AL0.0%42.1%24.6%33.3%
Boston, MA-NH34.2%49.7%3.2%12.9%
Buffalo, NY28.8%51.6%3.1%16.5%
Charlotte, NC-SC0.0%10.0%38.4%51.6%
Chicago, IL-IN-WI25.8%45.0%18.3%10.9%
Cincinnati, OH-KY-IN10.1%38.8%24.3%26.8%
Cleveland, OH22.2%46.8%10.5%20.6%
Columbus, OH5.0%28.7%37.5%28.9%
Dallas-Fort Worth, TX0.3%34.4%43.0%22.4%
Denver, CO3.1%42.9%42.4%11.6%
Detroit,  MI6.3%60.6%16.1%16.9%
Grand Rapids3.8%32.9%15.3%48.1%
Hartford, CT11.1%58.6%1.1%29.2%
Houston, TX0.3%34.2%48.9%16.6%
Indianapolis. IN4.6%28.0%41.8%25.6%
Jacksonville, FL0.0%26.4%48.2%25.4%
Kansas City, MO-KS5.4%37.6%26.3%30.6%
Las Vegas, NV2.4%17.5%76.7%3.5%
Los Angeles, CA10.4%76.4%5.2%8.0%
Louisville, KY-IN8.1%45.4%25.6%20.8%
Memphis, TN-MS-AR1.8%40.6%34.3%23.3%
Miami, FL1.4%51.4%44.8%2.4%
Milwaukee,WI22.1%52.0%10.4%15.5%
Minneapolis-St. Paul, MN-WI12.7%31.6%33.8%22.0%
Nashville, TN0.0%25.0%36.1%38.9%
New Orleans. LA10.6%49.9%7.0%32.4%
New York, NY-NJ-PA52.4%35.3%5.6%6.7%
Oklahoma City, OK2.5%35.1%31.6%30.8%
Orlando, FL0.0%16.1%50.5%33.4%
Philadelphia, PA-NJ-DE-MD24.6%51.1%15.1%9.2%
Phoenix, AZ0.0%29.4%51.7%18.8%
Pittsburgh, PA15.7%56.1%4.8%23.4%
Portland, OR-WA9.3%36.7%39.5%14.6%
Providence, RI-MA25.5%47.7%2.8%24.0%
Raleigh, NC0.0%7.5%54.4%38.1%
Richmond, VA4.5%38.8%38.0%18.8%
Riverside-San Bernardino, CA0.0%29.1%29.4%41.4%
Rochester, NY11.1%46.9%7.7%34.3%
Sacramento, CA1.6%38.0%40.2%20.1%
St. Louis,, MO-IL11.7%39.9%25.7%22.8%
Salt Lake City, UT4.6%47.9%38.4%9.1%
San Antonio, TX0.1%39.7%42.6%17.6%
San Diego, CA1.2%61.6%30.3%6.9%
San Francisco-Oakland, CA25.7%55.5%7.6%11.2%
San Jose, CA0.1%77.7%9.1%13.1%
Seattle, WA7.8%38.9%40.2%13.0%
Tampa-St. Petersburg, FL0.0%44.8%39.7%15.5%
Virginia Beach-Norfolk, VA-NC1.5%44.4%37.7%16.4%
Washington, DC-VA-MD-WV15.9%29.2%36.2%18.7%
Overall14.4%42.0%26.8%16.8%


It may be surprising that many of the major metropolitan areas are shown with little or no Pre-Auto Urban Core population. For example, five metropolitan areas have virtually no Pre-Auto Urban Core population, including Phoenix, Riverside-San Bernardino, Tampa-St. Petersburg, Orlando, Jacksonville, and Birmingham. By the Census Bureau criteria of 1940, two of these areas were not yet metropolitan and only Birmingham (400,000) had more than 250,000 residents.  Many of the newer and fastest growing metropolitan areas were too small, too sparsely settled or insufficiently dense to have strong urban cores before the great automobile suburbanization that followed World War II. Further, many of the Pre-Auto Urban Cores have experienced significant population loss and some of their neighborhoods have become more suburban (automobile oriented). Virtually no urban cores have been developed since World War II meeting the criteria.

Thus, no part of Phoenix, San Jose, Charlotte and a host of other newer metropolitan areas functionally resembles the Pre-Auto Urban Core areas of metropolitan areas like Chicago, Cincinnati, or Milwaukee. However, new or expanded urban cores are possible, if built at high enough population density and with high enough transit, walking, and cycling use. 

Examples of three differing metropolitan areas are provided. Philadelphia (Figure 5) is a metropolitan area with a strong Pre-Auto Urban Core, which is indicative of an older metropolitan area that has been among the largest in the nation since its inception, Seattle (Figure 6) is a much newer metropolitan area, yet exhibits a larger Pre-Auto Urban Core than most. Phoenix (Figure 7) may be the best example of a post-War metropolitan area, with virtually no Pre-Auto Urban Core. In 1940, the Phoenix metropolitan area had only 120,000 residents and could be 40 times that large by 2020. Virtually all of Phoenix is automobile-oriented. Even three years after opening its light rail line, 88 percent of Phoenix commuters go to work by car and only two percent by transit, virtually the same as in 2000.

Despite the comparatively small share of the modern metropolitan area represented by the Pre-Auto Urban Core in the City Core Model, the definition is broad and, if anything over-estimates the size of urban core city sectors. The population density of Pre-Auto Urban Core areas is below that of the historical core municipalities before the great auto oriented urbanization (11,000 compared to 12,100 in 1940) and well above their 2010 density (8,400), even when New York is excluded. The minimum density requirement of 7,500 per square mile (not applied to analysis zones with a median house construction data of 1945 or earlier) is slightly less than the density of Paris suburbs (7,800 per square mile or 3,000 per square kilometer) and only 20 percent more dense than the jurisdictional suburbs (suburbs outside the historical core municipality) of Los Angeles (6,400 per square mile or 2,500 per square kilometer). Some urban containment plans require higher minimum densities, not only in urban cores but also in the suburbs.

In describing the Canadian results, Professor Gordon noted that there is a tendency to “overestimate the importance of the highly visible downtown cores and underestimate the vast growth happening in the suburban edges.” That is true to an even greater degree in the United States. 

-----

Note 1:

The City Sector Model is applied to the 52 major metropolitan areas in the United States (over 1 million population). The metropolitan areas are broken into principal urban areas, with all other areas considered to be exurban. The principal urban areas also include the Concord urban area and the Mission Viejo urban area, which are adjacent to and included in the San Francisco and Los Angeles urban areas respectively. As a result, some smaller urban areas, such as Palm Springs (Riverside-San Bernardino metropolitan area), Lancaster (Los Angeles metropolitan area) and Poughkeepsie (New York metropolitan area) are considered exurban. Areas with less than 250 residents per square mile (100 per square kilometer) are also considered exurban, principally for classification of large areas on the urban fringe that have a substantial rural element.

The Pre-Auto Urban Core includes all non-– exurban areas in which is the median house (single-family or multi-family) was built is 1945 or before. Three density levels were considered, 10,000, 7,500 and 5,000 per square mile (4,000, 2,900 and 2,000 per square kilometer). The lower 5,000 per square mile was examined to test the extent to which such a low density would increase the urban core population. This density, less than the entire urban area (urban core and suburban) of the Los Angeles, San Francisco, San Jose and New York urban areas would have, at the most raised the urban core population to 21.5 percent of the metropolitan population, even with a modest 10 percent transit, walking and cycling market share (Figure 8)

The pre-auto urban core specification results in a 2010 population for the metropolitan areas with Pre-war and non-suburban historical core municipalities within one percentage point of the actual total, excluding the far higher density case of New York.

The analysis showed that a lower transit, walking and cycling market share at a 7,500 per square mile floor (2,900 per square kilometer) would substantially increase the Pre-Auto Urban Core category population, while diluting its urban core nature. More than one-half of the increase would be in Los Angeles which has added literally millions of residents in high density suburban areas that are as automobile oriented as suburbs elsewhere.

The analysis zones (zip codes) have an average population of 19,000, with from as many as 1,000 zones in New York to 50 in Raleigh.

Note 2:

An approximation based on the Gordon and Janzen approach would indicate an urban core population of only 8 percent in the major metropolitan areas of the United States. This approximation results in a modeled population for the metropolitan areas with pre-war and non-suburban historical core municipalities of less than one-half the actual 2010 population.

This Queen's University research comparison in Figure 8 is referred to as an approximation, since it applies an overall transit, walking, and cycling market share for the six major metropolitan areas, instead of a factor corresponding to each metropolitan area (the Gordon and Janzen approach).

The differences in transit market share relative to the US are substantial. This may be best shown by considering Calgary, which with a population of 1.2 million in 2011 would have ranked as the 47th largest metropolitan area if it were in the United States. Yet, Calgary would rank second only to the New York metropolitan area in transit market share if it were in the United States. Even so, Calgary is found to be the most suburban of Canada's major metropolitan areas in the Queen's University research and Statistics Canada data from 2011 indicates strong domination of urban travel by the automobile.

Wendell Cox is principal of Demographia, an international public policy and demographics firm. He is co-author of the "Demographia International Housing Affordability Survey" and author of "Demographia World Urban Areas" and "War on the Dream: How Anti-Sprawl Policy Threatens the Quality of Life." He was appointed to three terms on the Los Angeles County Transportation Commission, where he served with the leading city and county leadership as the only non-elected member. He was appointed to the Amtrak Reform Council to fill the unexpired term of Governor Christine Todd Whitman and has served as a visiting professor at the Conservatoire National des Arts et Metiers, a national university in Paris.

Photo: Los Angeles

Will the World’s Emerging Megacities Turn the Corner? For Most of Them, Probably Not

$
0
0

Two distinct expressions of urbanism, the global city and the mega city, are often conflated in the public’s mind. This can lead people to implicitly link the future fortunes of megacities (urban regions of more than 10 million people) with the success of global cities (defined roughly as a very important node at the high end of the global economy), especially as there’s overlap between the two types. They can then assume that the world’s emerging megacities will ultimately be successful, maybe even very successful. Places like São Paulo and Istanbul are held up as global cities in the making. Even more clearly struggling megacities like Jakarta and Lagos are sometimes portrayed as up and coming hip.

But in reality most emerging megacities likely will never turn the corner to developed status and achieve a decent standard of living and quality of life for their residents. They may be important national centers of aspiration, but most of them will never become influential global cities.  Their huge size and vast problems will leave them with perpetual entrenched poverty, poor infrastructure and public services, and low quality of life by global standards.

The general rule seems to be that a megacity can only achieve escape pervasive dysfunction if they are a major city in a country that is the world’s current rising economic (or historically imperial) power.

Rank

City

Population

1

Tokyo-Yokohama, Japan

37,555,000

2

Jakarta, Indonesia

29,959,000

3

Delhi, India

24,134,000

4

Seoul-Incheon, South Korea

22,992,000

5

Manila, Philippines

22,710,000

6

Shanghai, China

22,650,000

7

Karachi, Pakistan

21,585,000

8

New York, USA

20,661,000

9

Mexico City, Mexico

20,300,000

10

São Paulo, Brazil

20,273,000

11

Beijing, China

19,277,000

12

Guangzhou, China

18,316,000

13

Mumbai, India

17,672,000

14

Osaka-Kobe-Kyoto, Japan

17,234,000

15

Moscow, Russia

15,885,000

16

Los Angeles, USA

15,250,000

17

Cairo, Egypt

15,206,000

18

Bangkok, Thailand

14,910,000

19

Kolkata, India

14,896,000

20

Dhaka, Bangladesh

14,816,000

21

Buenos Aires, Argentina

13,913,000

22

Tehran, Iran

13,429,000

23

Istanbul, Turkey

13,187,000

24

Shenzhen, China

12,860,000

25

Lagos, Nigeria

12,549,000

26

Rio de Janeiro, Brazil

11,723,000

27

Paris, France

10,975,000

28

Nagoya, Japan

10,238,000

29

London, United Kingdom

10,149,000

Table 1: World’s Megacities, 2010, based on urban agglomeration size. Source: Demographia World Urban Areas, 10th Edition (May 2014)

This is the case with most developed world megacities. Moscow was the capital of the Soviet Empire. New York and Los Angeles came of age when America was the rising, and ultimately dominant, economic colossus. It’s the same for Paris and London, two borderline megacities, which rose as imperial capitals. London remains arguably the premier global city in the world.

But it’s also true of other megacities you might not consider. Tokyo only achieved its fully developed state when Japan was the rising power. Until fairly recently, much of Japan’s capital was backwards by developed world standards. For example, despite Japan’s famously high tech toilets, even in the inner 23 wards of Tokyo it was only in 1995 that 100% sewer service was achieved. In the second edition of Peter Hall’s landmark book The World Cities, he describes a 1970s Tokyo in which the night soil pickup industry was alive and well.  Only in an era of national economic hyper growth – culminating in the 1980s – was Japan able to fully modernize its urban infrastructure and clean up the massive environmental problems resulting from its rapid industrialization and urbanization. This was the time when Japan seemed destined to become the world’s leading economic power, and America was fretting as Japanese investors bought trophy assets ranging from Columbia Pictures to Rockefeller Center.


Image from 2011 presentation by Takatoshi Wako, “Night Soil Management and Decentralized Wastewater Treatment Systems in Japan”

We are witnessing the same today in China. It’s no accident that cities like Beijing and Shanghai are becoming fully modernized at the same time that China is the world’s rising economic power.  Even there, serious problems with social integration, pollution, and low quality development remain. China had best hope its economic growth continues until such time as it’s rich enough to solve those problems too.

Apart from the developed West, Japan, and China, only one world megacity has ever pulled off the transition to full modernity is Seoul. Seoul, however, followed a similar trajectory to Tokyo. Destroyed in the Korean War, it was rebuilt with the help of massive foreign aid. As dictatorship gave way to democracy, South Korea emerged as the leading “Asian Tiger” economy, a sort of mini-Japan. Yet it’s only recently that Seoul has begun to transcend its soulless apartment towers and focus on building a quality of life to match its advanced subways and broadband networks, for example, by uncovering a stream previously channeled underground into storm sewers to create an attractive greenway.


Cheonggyecheon stream in Seoul, daylighted in 2005. Image: Wikipedia

The world’s other megacities, sadly, are located in countries on a less positive trajectory.  Many of them are in impoverished developing countries in South and Southeast Asia and Africa. Others are in economies like the BRICs once touted as emerging powers, but many of which , have badly stumbled.  India and Brazil are not following the path of Japan and South Korea – not even that of China. Their economies are large and in a sense important, but face massive structural challenges.


Pavãozinho favela, Rio de Janeiro. Photo: Wikipedia

Brazil is planning a coming out party with the World Cup and Olympics. The city of São Paulo has even established its own foreign ministry to develop direct diplomatic and other ties with countries overseas to flex its global muscles.  Yet the social reality is less impressive: Paulistanos rioted last year in response to transit fare increases. Income inequality in São Paulo is stark, and public safety very questionable.  Rio has numerous favelas where military style units are trying to establish basic security, albeit with heavy handed tactics.  Rowers training for the Olympics have described Rio’s waterways as the most polluted they’ve ever seen, with one of them telling the New York Times, “I’ve never seen anything like this before.” In next door Argentina, once wealthy Buenos Aires continues to decay along with the nation, the consequences of lengthy misrule.


Dharavi slum, Mumbia. Photo: Wikipedia

But problems in Latin America’s megacities pale next to those elsewhere. In India’s financial and commercial capita of Mumbai, over half the population lives in slums. Delhi was recently noted as having the world’s worst air pollution. Dhaka, Bangladesh is both impoverished and has extreme flooding problems. Karachi, Manila, and Jakarta suffer severe poverty and infrastructure problems.  Large African cities like Lagos can’t overcome the basic development problems of the continent.


Shantytown in Manila. Photo: Wikipedia

Some argue that these megacities are actually opportunities zones for their country and even that their slums should be praised - or might eventually, as one article claimed, save the planet. After all, people are voting with their feet to move there. Perhaps that’s true in some sense, though some of the advantage of cities stems from a decline in the viability of rural life. 

But the problem is that there’s no clear path to prosperous maturity for these megacities.  They are so huge, and their problems so immense that they are difficult to even conceptualize, much less do something about.  The amount of needed infrastructure provision alone – water, sanitation, drainage, transport, telecom, electricity, parks, schools, etc. – is staggering. And that doesn’t even touch arguably more difficult problems like corruption and good governance. Absent national hyper growth – a la Japan or Korea – of a level that creates a plausible claim to being the world’s rising economic power, or the proceeds of empire, it seems unlikely any of these cities will ever succeed. By contrast, smaller cities have a much more addressable problem space.

Megacities may have their virtues and short term advantages, but unlike yesterday’s imperial or economic capitals like New York and Tokyo, today’s emerging world megacities will have a hard time even achieving the basics of urban quality of life, much less succeed in rising to join the world’s elite.

Aaron M. Renn is an independent writer on urban affairs and the founder of Telestrian, a data analysis and mapping tool. He writes at The Urbanophile.

Lead Photo: São Paulo City by Julio Boaro

Shaking Off The Rust: Cleveland Workforce Gets Younger And Smarter

$
0
0

In virtually every regional economic or demographic analysis that I conduct for Forbes, Rust Belt metro areas tend to do very poorly. But there’s a way that they could improve, based in large part on the soaring cost of living in the elite regions of California and the Northeast. And one of the rustiest of them appears to be capitalizing on the opportunity already: that perpetual media punching bag, Cleveland.

Between 2000 and 2012, the Cleveland metro area logged a net gain of about 60,000 people 25 and over with a college degree while losing a net 70,000 of those without a bachelor’s, according to a recent report from Cleveland State University. The number of newcomers aged 25 to 34 increased by 23 percent from 2006 to 2012, with an 11 percent increase from 2011 to 2012 alone. Most revealingly, half of these people came from other states. When it comes to net migration, Atlanta, Detroit, and Pittsburgh were the biggest feeders for those arriving with a bachelor’s degree, while Chicago, Manhattan, Brooklyn and Pittsburgh sent the most net migrants with a graduate or professional degree.

The picture of Cleveland that emerges from the Cleveland State University study is a very different one from that to which we are accustomed. Rather than a metro area left behind by the information revolution, Cleveland boasts an increasingly youthful workforce that is among the better educated in the nation. In 2009. notes University of Pittsburgh economist Chris Briem, some 15% of Cleveland’s workforce between 25 and 34 has a graduate degree, ranking the area seventh in the nation, ahead of such “brain centers” as Chicago, Austin and Seattle. Old Clevelanders as a whole will remain undereducated, but likely not the next generation.

What is driving this migration? Some of it has to do with a 25% expansion of STEM employment from 2003-13, much of it in health care tied to the region’s prestigious hospitals. This has helped spark a healthy increase in per capita income, from $33,359 in 2003 to $44,775 in 2012, a gain of 34%.

This growth has animated many neighborhoods, not only in the “cool” central cores but in a host of inner and outer ring neighborhoods. This process, note researchers Richey Piiparinen and Jim Russell, is even more evolved in a Rust Belt city that has been on the rise for some time now, Pittsburgh. Migration trends there first turned favorable in 2007 after decades of decline, and have remained positive.

The cost of living in Cleveland is considerably below the national average, not to mention that of the ultra-expensive coastal regions. Indeed, when cost of living is taken into account, per capita income in both Cleveland and Pittsburgh are now well above the national average.

Piiparinen and Russell also see a gradual movement of educated young people to other lower-cost, family-friendly places in the Rust Belt, including Indianapolis, St. Louis and Minneapolis.

These phenomena suggest that Rust Belt cities need to adopt new approaches to economic development. For years, civic boosters in places such as Cleveland fixed hopes on attracting the much ballyhooed “creative class” by building such things as the Rock and Roll Hall of Fame, art galleries, trendy restaurant and even a massive downtown chandelier. This tactic recalls the old lite beer commercials: everything you want in a city, but less.

Yet, as Piiparinen and Russell point out, this approach simply expands consumption opportunities, and when it comes to consumption, Cleveland, Detroit and Pittsburgh can never top the U.S. capitals of excess: Manhattan, San Francisco, Los Angeles, or even Seattle. It’s hard to see hipsters moving en masse to any of these places without some degree of economic opportunity.

Piiparinen sees the current migration trends as reflecting “the Rust Belt’s productive economy versus its consumptive economy.” He proposes the focus should be to accelerate talent migration based on economic advantages natural to the region, such as medical services, advanced manufacturing and logistics.

These industries have high economic impact. Manufacturing, he traditional core of the local economy, adds 50 cents of GDP for every dollar in output, considerably more than information employment and almost three times the multiplier for retail jobs.

Despite the hopes to emulate post-industrial Boston, New York or San Francisco, Rust Belt states remain dependent on manufacturing; it accounts for 18 percent of Ohio’s GDP and 14 percent of Pennsylvania’s, more than twice as much as in New York and well above that in California. Increasingly, manufacturing will not provide many jobs for unskilled workers, but rather for trained technicians, certified crafts workers as well as highly educated college graduates. Ohio has established an extensive network of skilled training facilities to fill this need.

Critical to the process are the current manufacturing rebound, in which Ohio has added 50,000 industrial jobs since 2009, and the energy boom tied to the development of shale in both Ohio and Pennsylvania. Since 2001, energy employment in Pennsylvania has more than doubled, with much of the action in western part of the state abutting Pittsburgh.

Does that mean that Cleveland, or Pittsburgh, are about to experience Houston-like growth? Don’t hold your breath. The weather is too harsh, and the cities too small to compete with the vast opportunities presented by the burgeoning Sun Belt economies. Nor do they rank high as destinations for foreign immigrants, who have provided a boost to many larger local economies but as of yet have not “discovered” the Rust Belt in large numbers.

Yet not achieving hyper-growth does not mean continued decline. As older, less educated workers retire or leave the region, often for warmer climes, there is an opportunity for the Rust Belt to replace its current labor pool with one more attuned to the emerging economy and enjoy strong boosts in GDP growth.

The key here is melding the “legacy” strengths of these regions with shifting demographic and economic forces. The region is not only home to abandoned steel mills, but also six of the country’s top top 20 graduate engineering programs, according to U.S. News & World Report. The intellectual capital is there.

And economic forces could soon make these cities more attractive to newcomers from the rest of the country and abroad. The “spiky” cities embraced by urban boosters such as Richard Florida – who famously dissed Pittsburgh on his way out of town — increasingly are too expensive for even the educated middle class. This is why we are seeing young people who flocked to the Bay Area leave in their 30s or 40s. Places like San Francisco and Manhattan are great to the well-educated (and well-heeled), but as you get older, and look to buy a house or start a family, they are not ideal, unless you are extraordinary successful or have the right parents.

In contrast, the Rust Belt offers a vastly better value proposition. Housing in Cleveland is about one-fourth the cost, based on income, as in San Francisco. Not only that, but the choices are fairly broad, from new and old suburban to charming, single-family dominated urban neighborhoods.

These choices are encapsulated by the turn of phrase “Pittsburgh rich,” which essentially means that people settling there simply have better options than in places like New York or San Francisco. “We have an old housing stock that is very affordable,” notes University of Pittsburgh’s Briem. “Places like Pittsburgh and Cleveland offer a lot of areas that are very attractive at a low cost.”

Of course, such a transition will require some major rethinking among regional leaders and the abandonment of their traditional wannabe approach. Rather than apologizing for not being San Francisco, they should look at the prospects for a revival of energy and manufacturing. It’s working out for Pennsylvania and Ohio, which were among the largest recipients of new investment in 2012, ranking third and fourth among U.S. states. They were behind Texas and Louisiana, but well ahead of both California and New York.

Over time, this transition in the Rust Belt could prove a boon for the entire country. It does little good for either the resurgent Sun Belt or the sophisto havens on the coasts to have to subsidize a region along the Great Lakes in permanent decline. The Rust Belt retains many natural resources — oil, gas and, perhaps most importantly, water — that position it to be a major contributor to national growth. If the opportunity is recognized by a new generation, the future could prove surprising bright in what has long been seen as a fading region.

This article first appeared at Forbes.com.

Joel Kotkin is executive editor of NewGeography.com and Distinguished Presidential Fellow in Urban Futures at Chapman University, and a member of the editorial board of the Orange County Register. He is author of The City: A Global History and The Next Hundred Million: America in 2050. His most recent study, The Rise of Postfamilialism, has been widely discussed and distributed internationally. He lives in Los Angeles, CA.

Creative Commons photo "Cleveland Skyline from the Flats" by Flickr.com user Erik Drost.

What We Earn

$
0
0

Discussions about housing affordability focus almost exclusively on the price of the real estate, movements in which are monitored by multiple organisations on a seemingly daily basis. There is comparatively little discussion about people’s incomes, which are equally as important as prices in determining what can and can’t be reasonably afforded. The income profile of what most Australian’s actually earn paints a sobering picture which could more often be taken into account in debates about housing and affordability.

It’s becoming fashionable again for business lobbies to complain about Australia’s high wage structure. It explains, they’ll argue, why we lost Holden, Ford, Toyota, and (almost) Qantas, among other things. And yes, Australia’s wages are high by competitor standards - but so are our costs. One of the most fundamental of needs, along with food and clothing, is shelter. And it’s the cost of shelter relative to incomes which has been stretched to beyond reach for a large proportion of young Australians.

Reducing minimum wages or reducing wage growth further, if at the same time allowing housing costs to further escalate, will only make this situation worse. Arguably, if we could substantially reduce the cost of supplying new housing, this would relieve upward pressure on wages and work towards improving our global competitiveness – along with repairing living standards for working and middle class families, rather than eroding them.

First, here are some of the facts on the infrequently discussed income side of the equation. (I am again indebted to the team at Urban Economics for making these available. These are top line numbers only: if you want more detailed analysis, please contact Kerrianne Bonwick).

Nearly two in three of all Australians earn less than $52,000 per annum. It doesn’t much matter whether it’s Brisbane, Sydney or Melbourne; the proportion is roughly the same.  It’s not much. Slightly more than another one in every eight earn from $52,000 to $78,000 per annum. Roughly eight in ten Australians earn less than $78,000 per annum.

Personal Incomes

Brisbane

Sydney

Melbourne

< $52,000

64.4%

62.8%

65.4%

$52,000-$78,000

15.0%

13.8%

14.1%

$78,000 to $104,000

7.0%

7.2%

6.4%

> $104,000

6.3%

8.2%

6.5%

Not Stated

7.2%

8.1%

7.7%

Source: Urban Economics

Problem? It is if you’re trying to buy into the housing market. Take a modest house of say $400,000 (very modest depending on location). A worker on $50,000 – and these represent nearly two thirds of all workers remember – is facing a price multiple which is 8 times their gross pre-tax income.  Basically, two thirds of us are stuffed in terms of affording even a modest $400,000 property if we weren’t already in the market. A more reasonable price multiple of say 5 times income would require an income of $80,000 per annum or more. But there are less than 15% of Australians who fit this category.

But wait, shouldn’t we count household, as opposed to personal, incomes? A good point, particularly for younger families and young couples, where dual incomes are the norm due to necessity.

But even based on combined household incomes, a third of all households earn less than $52,000 per annum. Another 14% to 15% earn between $52,000 and $78,000 and another 11% or 12% earn between $78,000 and $104,000. A reasonably healthy 30% of all households bring in a combined $104,000 per annum or more, but seven in ten bring in less than that.

Taking our modest $400,000 home again, and  roughly half of all household incomes fall short of the $80,000 mark required for a price-to-income multiple of five. For one in three of every households, their combined income means a price to income multiple of eight times. They are pretty much stuffed, still.

Household Incomes

Brisbane

Sydney

Melbourne

< $52,000

32.8%

32.2%

34.3%

$52,000-$78,000

15.5%

14.1%

15.5%

$78,000 to $104,000

12.3%

11.3%

11.8%

$104,000 - $156,000

18.1%

18.0%

17.1%

$156,000 - $208,000

7.7%

8.7%

7.3%

> $208,000

3.6%

5.5%

3.8%

Not Stated

10.1%

10.3%

10.4%


Source: Urban Economics

Hang on, isn’t it more relevant to focus on the demographic that’s more likely to be trying to get into the property market, because older people and retirees, who already own or are paying off homes, may skew the figures? Absolutely: this is the key demographic, especially if you’re a developer of new detached housing product - which is what this cohort mainly wants to buy to raise a family in (as opposed to the apartment they might rent while pre-children).

Personal income profiles of the 25-34 year old age group are pretty much in line with the Australia wide picture. More than half earn less than $52,000 and roughly eight in ten earn less than $78,000 per annum, which means eight in ten of this age group – who are at the peak of their family formation potential – would be faced with a price multiple of more than 5 times incomes on a $400,000 property, and more than half would be faced with a price multiple which is eight times their income, or more.

Personal Incomes 25-34 year olds


25-34year olds

Brisbane

Sydney

Melbourne

< $52,000

55.2%

52.9%

56.2%

$52,000-$78,000

23.1%

21.7%

22.9%

$78,000 to $104,000

9.3%

10.0%

8.4%

> $104,000

5.6%

7.4%

5.4%

Not Stated

6.8%

8.0%

7.0%


Source: Urban Economics

None of this is great news. For developers trying to provide affordable new housing in new greenfield estates in urban fringe locations, the reality of these income profiles can’t be escaped. I had the privilege of visiting one such estate in south east Queensland recently and what I saw was absolutely first class product at very good entry level prices in a very well designed environment. No ‘McMansions’ here – just quality new detached three and four bedroom homes, on small lots, priced from around $350,000 - and in some cases less.

But even at $350,000, only around 15% or so of the target 25 to 34 year old demographic could afford to get in with a price multiple of less than 5 times an individual’s income. That proportion would rise taking into account combined incomes for this age group, but it won’t rise beyond around a quarter or a third.  The reality is that more than half this age group would find an entry level $350,000 home would be six times their combined incomes or more. It would be tough going.

Granted, interest rates are currently very low and some governments are offering stamp duty and other concessions to first time buyers. But these are having next to no impact on this market. Rates of first home buyer activity are at generational lows.  And interest rates won’t stay this low forever. A significant rise in variable home loan rates could tip a substantial number of families in this age group from the ‘just making it’ basket into the ‘we’re stuffed’ basket.

Since the ‘do nothing’ policy approach doesn’t seem to be working, what could be done to turn the situation around? Basically, it’s a simple formula between incomes and prices. You either increase incomes or reduce prices. The first probably isn’t an option unless incomes can gradually creep up with inflation and with productivity gains over time.

But what could also happen is the cost of supplying new housing (not referring to existing stock) could be reduced. New housing is heavily taxed and over regulated (the same cannot be said of existing stock). Something like a quarter to a third of the cost of the new home in an urban fringe location is due entirely to various taxes, charges and compliance costs (which do not apply to existing stock). It is also affected by the rapid escalation in land costs due to policy induced supply constraints in areas of ample available land (the same can’t be said of existing stock in mostly built-out inner or middle ring areas). Most of these additional costs of supply owe themselves to policy changes made since the early 2000s – precisely the time when the affordability gap began to widen.

It does seem a compelling place to start.

We should aspire to a more competitive Australia but this policy effort cannot just focus on labour costs because our incomes, while high by competitor standards, are now generally insufficient to cover one of the basic necessities of life: shelter. We have made this happen because policy makers have deliberately increased the cost of delivering new housing with new taxes, charges and compliance costs, all justified on esoteric planning or sustainability principles but impossible to justify on social equity or economic grounds.

These policy changes were made to suit political agendas at the time: they were not needs-based or market-based policy changes. (It also has to be said the political agendas at the time were in the hands of Labor State governments, starting with Bob Carr in NSW but which spread rapidly to other jurisdictions. Why Labor Governments introduced policies which hurt people on working wages is as mystifying to me as to why Liberal Governments have continued to maintain the same policy positions, with minimal amendment).

The gap between the cost of supplying even relatively basic housing on the urban fringe, and the incomes of the people who in past generations could afford it, will continue to widen unless regulators and policy makers begin to grasp the wider economic consequences of policy-inflated costs for new housing supply.

Footnote: why a five times multiple? There is no strong reason. The authors of the global housing affordability report Demographia will argue that affordable housing should be around three times incomes. Moderately unaffordable they define as between 3 and 4, and between 4 and 5 is defined as ‘seriously unaffordable.’ The multiples of 7 or 8 times incomes, which we’re seeing in Australia, are off the scale. But for the purpose of argument, if even relatively high (by international standards) multiples of 5 times incomes seems like a utopian dream, it illustrates how far incomes need to rise or costs of new supply should fall before we get even close to the situation that prevailed for most of our history. It’s a big challenge.

Ross Elliott has more than 20 years experience in property and public policy. His past roles have included stints in urban economics, national and state roles with the Property Council, and in destination marketing. He has written extensively on a range of public policy issues centering around urban issues, and continues to maintain his recreational interest in public policy through ongoing contributions such as this or via his monthly blog The Pulse.

Watch What You Say, The New Liberal Power Elite Won’t Tolerate Dissent

$
0
0

In ways not seen since at least the McCarthy era, Americans are finding themselves increasingly constrained by a rising class—what I call the progressive Clerisy—that accepts no dissent from its basic tenets. Like the First Estate in pre-revolutionary France, the Clerisy increasingly exercises its power to constrain dissenting views, whether on politics, social attitudes or science.

An alliance of upper level bureaucrats and cultural elites, the Clerisy, for for all their concerns about inequality, have thrived, unlike most Americans, in recent years. They also enjoy strong relations with the power structure in Washington, Silicon Valley, Hollywood and Wall Street.

As the modern clerisy has seen its own power grow, even while the middle class shrinks, it has used its influence to enforce a prescribed set of acceptable ideas. On everything from gender and sexual preference to climate change, those who dissent from the official pieties risk punishment.

This power has been seen recently in a host of cancellations of commencement speakers. Just in the past few months Ayaan Hirsi Ali, former Secretary of State Condoleezza Rice, International Monetary Fund managing director Christine Lagarde, and former UC Berkeley Chancellor Robert Birgeneau, have been prevented from speaking by campus virtue squads whose sensibilities they had offended.

The spate of recent cancellation reflect an increasingly overbearing academic culture that promotes speech codes on what is permissible to say and even seeks to provide “trigger warnings” to warn students about the presence of nominally troubling subject matter in readings and discussions so they can avoid the elements of reality they find offensive. 

The very term Clerisy first appeared in 1830 in the work of Samuel Coleridge to described the bearers society’s highest ideals: the intellectuals, pastors, scientists charged with transmitting their privileged knowledge them to the less enlightened orders.  

The rise of today’s Clerisy stems from the growing power and influence of its three main constituent parts: the creative elite of media and entertainment, the academic community, and the high-level government bureaucracy.

The Clerisy operates on very different principles than its rival power brokers, the oligarchs of finance, technology or energy. The power of the knowledge elite does not stem primarily from money, but in persuading, instructing and regulating the rest of society. Like the British Clerisy or the old church-centered French First Estate, the contemporary Clerisy increasingly promotes a single increasingly parochial ideology and, when necessary, has the power to marginalize, or excommunicate, miscreants from the public sphere.

Of course, every society needs a clerical class, to instruct the young and maintain cultural standards. But in the past, at least in modern America, they tended to be a tolerance for fairly disparate views. Today’s Clerisy, by contrast, is increasingly homogeneous in its beliefs- despite pockets of conservative power such as the Heritage Foundation and most notably the media empire controlled by the Murdoch family.

The modern Clerisy’s homogeneity springs from their social conditioning. Educated along similar ideological lines at major universities, they tend to be geographically concentrated in wealthy, “progressive” places, where few dissent from the prevailing worldview. As such they breathe, as analyst Walter Russell Mead suggests, “within a cocoon.” Inside their urban cocoons they operate from a thoroughly internalized set of progressive tropes on such issues as the environment, urbanism, gender and race. In practical terms, such as in their support of President Obama and the Democratic Party, they are both broadly allied with centers of power and influence, much as the clergy was in Medieval and early modern times.

America’s Nomenklatura

The Clerisy has thrived during these hard times. Since 1990, the number of government workers has expanded by some five million to some twenty million. That’s four times the number who were employed by the government at the end of the Second World War, a growth rate roughly twice that of the population as a whole.

The upper bureaucracy have been among the greatest beneficiaries—along with Wall Street and the green crony capitalists —of the Obama Administration’s economic policy. The number of workers, particularly at the federal level, continued to rise even at the height of the great recession. Between late 2007 and mid-2009, the number of U.S. federal workers earning at least $150,000 more than doubled. The ranks of federal nomenklatura—combined with a host of related private contractors —- have swelled so much that Washington DC by 2012 replaced New York as the wealthiest region in the country .

The upper bureaucracy has evolved into a privileged and cossetted caste. In California, state workers are allowed such special privileges as having their Department of Motor Vehicle records kept confidential; a sensible precaution for those, like police, who deal with criminals but now expanded to cover a vast array of public servants, including social workers. Naturally, as beneficiaries of an expanded government, public sector unions have been among the strongest backers of regulatory growth and ever increased social services. Their political power has also been on the rise; since 1989, public sector unions accounted for two of the top three top ten donors to political candidates.  

More important still is the bureaucracy’s ability to control society through unelected agencies, something that grew even during Republican administrations, but has achieved unprecedented scale under President Obama. Increasingly, agencies such as the EPA and HUD, seek to shape community development patterns—for example on land use policies —- that traditionally fell under local control. With their power, the agencies have harassed unfriendly conservative organizations, as seen by the IRS, and monitored the populace’s private conversations, seen in the case of the NSA. But to some prominent members of the Clerisy, these power grabs haven’t gone far enough.

Leading figures of the Clerisy, like former Obama budget advisor Peter Orszag and Thomas Friedman, argue that power should shift from naturally contentious elected bodies—subject to pressure from the lower orders—to credentialed “experts” operating in Washington, Brussels or the United Nations. The popular will, according to the Clerisy and its allies, lacks the scientific judgment and societal wisdom to be trusted with power.

The Real College of Cardinals.

Like the upper bureaucracy, academia has also expanded rapidly in recent decades. In 1958 universities and colleges employed under 370,000 people; by 2014 that number had expanded to roughly 1.7 million. With universities now serving roughly twenty million full and part time students, academics have never exercise more influence over young Americans.

Ironically, despite its patina of egalitarian beliefs, the academic world now epitomizes the new hierarchical class order as much as any major institution. The roughly 1.4 million instructors in the University system, have experienced what one writer calls “the great stratification” between roughly 500,000 largely older tenured “alpha” Professors and a vast “beta” of low-paid teaching assistants, contingent faculty and those working in extension programs.

At the same time, the bureaucracy of the University, like that of the government, has exploded, even more at elite (and tax-favored) private schools than among public ones. Whereas there were about 250,000 administrators and professional staff members in 1975, about half the number of professors, by 2005 there were over 750,000, easily outnumbering tenure-tracked professors. As the University has gained in power, those in control have taken on ever more the trappings of an aristocracy whose primary mission is self-preservation—not unlike the Medieval European clergy.

The Creative Elite

The final element of the Clerisy’s triumvirate is the culture-based industries and their upper middle classes participants. Arnold Toynbee identified the “creative genius” as the historic leader and savior of society—an apt description of the self image held by many of the new tech and media elites.

Today, this “creative” element has grown ever more pervasive. Artists, writers, fashion designers and actors have achieved enormous status in our society; and a handful has become very wealthy. More important still has been the rise of media oligarchs, some tied to the tech establishment, who now rank among the wealthiest Americans. Indeed of the world’s 25 richest people, a majority come from either the information sector, the fashion industry or media. These new media elites, combined with the tech oligarchy, could well emerge as the dominant economic force of the 21st Century, surpassing fortunes made in energy, manufacturing, or housing.

The media itself is increasingly populated by the children of prominent politicians and by those who come from the ranks of the plutocracy. These include the offspring of the Reagans, GOP stand-bearer John McCain, various Kennedys, and Nancy Pelosi. In Hollywood, meanwhile, some of the new powerful producers come from the ranks of the ultra-rich, including heirs to the Pritzker fortune and the daughter of Oracle Founder Larry Ellison, one of the world’s ten richest men.

The Clerical Consensus

Today’s Clerisy attempts to distill today’s distinctly secular “truths”—on issues ranging from the nature of justice, race and gender to the environment—and decide what is acceptable and that which is not. Those who dissent from the accepted point of view can expect their work to be simply ignored, or in some cases vilified. In the Clerical bastion of San Francisco, an actress with heretical views, in this case supporting a Tea Party candidate, who was pilloried, and lost work for her offense.

The pattern of intolerance has been particularly notable in the area of climate change, where serious debate would seem prudent not only on the root causes and effects, but also what may present the best solutions. Climate scientists who diverge from the warming party line, even in a matter of degree, are routinely excoriated by the Clerisy as “deniers” of “settled” science even in the face of 15 years of relatively stable temperatures. The media also participates in this defense of orthodoxy. The Los Angeles Timesas well as the website Reddit have chosen to exclude contributions from skeptics.

The stifling orthodoxy from the technocrats and media elite is benign compared to the inquisitional behavior can be seen in institutions of higher education. It is nothing short of tragic, notes civil libertarian Nat Hentoff, that a 2010 survey of 24,000 college students found that barely a third thought it “safe to hold unpopular views on campus.”

Such attitudes seem natural in an environment where, according to various studies, liberals outnumber conservatives by between eight and fourteen to one. Whether this reflects natural preferences among the well-educated or is partially due to institutional discrimination remains arguable. But consider that 96 percent of all Presidential donations from the nation’s Ivy League schools went to Barack Obama, something more reminiscent of Soviet Russia than a properly functioning pluralistic academy. Nor is there any sign that this trend is slowing. Between 2007 and 2010, a University of California study revealed that “far left” and liberal views grew from 55 percent to almost 63 percent of full-time faculty while the conservative segment dropped from roughly 16 % to less than 12%. If the academic left simply waits long enough, it could look forward to a conservative-free faculty on many campuses.

A similar, if less uniform, clerical consensus suffuses the media culture, led by the television networks and the leading newspapers. In fact nearly half of all Americans consider the media too liberal, more than three times as many who see it as too conservative. Overall, reports Pew, the percentage who feel news is tilted to one side has grown dramatically from 53 percent in 1985 to 77 percent in 2011.

To be sure, there remain important exceptions to this rule, notably Fox News and talk radio, and the editorial pages of the Wall Street Journal. Yet the right’s hold on the major media is demonstrably weak, and likely to decline further once Murdoch himself is no longer on the scene. A detailed ++UCLA study found that of the twenty leading news outlets in the country, eighteen were left of center.

Despite the journalistic embrace of the idea of diversity, a recent Indiana University Study notes that journalists themselves have become increasingly homogeneous.  Journalists are far more likely to be college educated than they were in 1970, and less likely to be a racial minority than just a decade ago. But the biggest change has been an ideological one; barely seven percent in 2013 were Republican, compared to nearly a quarter in 1971.

Even Arnold Brisbane, the former ombundsman of the The New York Times, has noted the group-think that now overshadows objectivity, long cherished by that most important of America media outlets. Brisbane observed that, “so many share a kind of political and cultural progressivism—for lack of a better term—that this worldview virtually bleeds through the fabric of The Times.”

These positions are all reflected in almost lock-step media support for President Obama. Over sixteen prominent journalists joined the Obama administration, which was something of a record; in 2012 employees at the major networks sent President Obama almost eight times as much in contributions as they did his Republican opponent.

This consensus of views prevails as well in the electronic media. As the liberal author Jonathan Chait suggests, the media increasingly reflects not just commercial values, but “a vast left-wing conspirary.” He adds: “You don’t have to be an especially devoted consumer of film or television (I’m not) to detect a pervasive, if not total, liberalism.”

Will the Clerisy rule after Obama?

The fact that Republicans continue to maintain considerable power in both Washington and the states suggests that the Clerisy’s power is not yet determinative. And indeed after President Obama leaves office, the Clerisy’s reach may be temporarily diminished, but its ability to set the social and political agenda will likely persist and even grow given their influence to shape perceptions, particularly among the young.

The current atmosphere of ideological unanimity—in academia, the arts and much of the government bureaucracy—set the stage for the outrages of this commencement season, making painfully palpable the growing authoritarian spirit in so many of our leading institutions. They often see themselves as a liberating force in our society, but in their dislike of conflicting ideas and open debate, today’s  Clerisy increasingly resembles the closed-minded dogmatists of the Medieval church.

This article first appeared at The Daily Beast.

Joel Kotkin is executive editor of NewGeography.com and Distinguished Presidential Fellow in Urban Futures at Chapman University, and a member of the editorial board of the Orange County Register. He is author of The City: A Global History and The Next Hundred Million: America in 2050. His most recent study, The Rise of Postfamilialism, has been widely discussed and distributed internationally. He lives in Los Angeles, CA.


Inland California Needs to Get in the Zone

$
0
0

California’s dream is shrinking inexorably, and only radical steps can prevent the condition from becoming permanent. Compared with previous economic expansions, fewer state residents and communities are benefiting from this recovery, which has largely been restricted to the small coastal zone surrounding the Bay Area, as well as certain parts of western Los Angeles, Orange and San Diego counties.

As the economy has strengthened, what is called a “boom” in the mainstream media is really a story of one region. Some 300,000 jobs have been created as the recovery has strengthened over the past 15 months,but three-quarters of them have been concentrated along the coast, mostly in the San Francisco-San Jose corridor.

In contrast, much of the interior of the state, from the Inland Empire, where the poverty rate has doubled since 1990, to the Central Valley, is doing far less well. Unemployment has dropped to near 5 percent in the Bay Area, but remains above 8 percent in the Inland Empire, and above 10 percent in many interior communities, from Fresno and Modesto to Bakersfield. Viewed in the national media as some sort of permanent basket case, the inland regionbooming a decade ago, was recently compared by a UCLA economist to Appalachia.

Get in the ‘zone

California’s interior clearly needs a form of new deal that will allow it to participate in the state’s recovery. This plan starts with declaring the entire area an “enterprise zone” that allows communities to opt out from some of the harshest, coastally driven regulations.

Enterprise zones typically refer to economically ailing portions of cities where policies to encourage economic growth and development are implemented for businesses in the designated area. Such policies, on a regional scale, are needed in inland California.

Extraordinary controls on development, expensive “green energy” policies and high taxes on small enterprises may seem reasonable, or at least bearable, in a coastal economy fueled by soaring capital gains, with the prospect that the gentry rich can supply trickle-down service jobs to the hoi polloi.

But such policies are often disastrous for the state’s interior, which lacks the resources or appeal of the coastal havens. Take the issue of electricity prices, which have soared, in large part, because of the green-energy policies favored by influential residents along the coast. Energy costs for many California businesses are roughly twice those for consumers in the Pacific Northwest, Salt Lake City or Denver. Yet here’s the rub: The climate along the coastal strip requires less air conditioning or heating, unlike that of the interior regions, where temperatures rise and fall more severely.

Worse yet, there’s more pain to come: California’s recently enacted carbon “cap and trade” system could boost gasoline prices, already 55 cents per gallon above the national average, another dollar.

Unaffordable Coast

Many wealthier coastal residents can afford housing close to major job centers and, for that matter, more expensive gasoline. But the same pump prices are a dagger aimed at the finances of many middle- and working-class people who live in the interior and have to commute to employment. The gentry retort – that such people should move to the city – ignores the fact that most middle- and working-class people can’t afford to live decently in places like Los Angeles, much less San Francisco, given current prices.

People in recent decades have moved to the interior largely to improve conditions for their families, not to lower their quality of life. Rising gas prices won’t lead them “back to the city” but, more likely, will force many to cut back further, or consider moving elsewhere. There’s no discernible movement of people to the coastal counties from the interior; if anything, the pattern, although less marked than a decade ago, remains quite the opposite.

Despite a growing population, the long-term sustainability of the interior’s economy now is questionable. High energy costs, onerous regulatory burdens and land-use constraints imposed by Sacramento are systematically undermining industries that have traditionally driven growth in the state’s interior. These include construction, manufacturing, ranching and farming, along with logistics and business services, all of them employers of middle- and working-class Californians.

Creating an expansive enterprise zone would allow these businesses to compete more successfully with other states. It might encourage, for example, manufacturers leaving or expanding away from the coast to head to inland California instead of to another state, or propel builders to construct affordable housing, including single-family homes, in places like the Inland Empire, as opposed to in Texas or Arizona.

Why should the Bay Area oligarchy agree to such a step? One reason may be to avoid the soaring cost of supporting so many poor and needy people in the interior. When the tech bubble bursts, the state will face another cash crunch. Having a vast impoverished population then will mean even higher taxes and worse services, something that will affect all but the most high-end businesses.

Dreams, green or otherwise, take money, but our bifurcated economy relies increasingly on the fortunes of the few. California’s top 1 percent of earners paid 50 percent of state income taxes in 2012, up from 40 percent the year earlier. This is not surprising since so much of the state is either impoverished or stagnating. Once aspirational regions, proud contributors to the Golden State’s economic diversity, increasingly resemble dependent countries in the Third World.

Modern-day progressives respond to these realities by pushing for such things as raising the minimum wage, or imposing even more Draconian labor regulations. This may help some low-income workers, but it’s hard to see how it would boost the interior’s competitiveness. In contrast, the creation of an enterprise zone would give these areas at least a fighting chance.

Ultimately, what kind of California do we want for our children? Right now, the state is evolving into something of a neofeudalist society, consisting of an affluent few, concentrated in the coastal belt, a large and expanding poverty class and a struggling, shrinking middle class. There’s the California of the oligarchs with 111 billionaires, by far the most of any state, with personally held assets worth $485 billion. Together, they own more than the GDP of all but 24 countries in the world. At the other end of the scale is a state with the nation’s highest poverty rate (adjusted for housing costs) – above 23 percent – and roughly one-third of the nation’s welfare recipients.

This condition has been aptly labeled by one Central Valley writer as “liberal apartheid.”The well-heeled, largely white and Asian coastal denizens live in an economically inaccessible bubble – due to extremely high housing prices – while the largely poor, working class, heavily Latino communities eke out a meager existence in the state’s eastern interior.

To be sure, many forces beyond Sacramento’s control – globalization, immigration, the asset-oriented nature of the recovery – have contributed to this growing wealth gap. But gentry-led pubic policies have exacerbated the refeudalization. Young Californians, notes one study, already are now less likely to graduate from college than were their parents.

A Shrinking middle

Meanwhile, the middle class, the social and economic linchpin of the state, continues to decline, with a far more dramatic drop in state households earning $35,000 to $75,000, according to research from the California Lutheran University forecast project, than the national average. As late as the 1980s, the Golden State was about as egalitarian as the rest of the country, and roughly 60 percent of its population was middle class. But now, for the first time in decades, the middle class is a minority in California.

In fact, many Californians face a future as modern-day land serfs, renting and paying someone else’s mortgage. If they choose to start a family, they increasingly look to settle elsewhere, ironically, some to locations like Oklahoma and Texas, places that historically sent eager migrants to the Golden State, whose appeal combined economic opportunity, its milder climate and spectacular scenery.

The prospect facing California is not unlike that seen in other Democratic-dominated regions, such as New York, where a well-organized and savvy, affluent, urban minority can impose ever-greater restrictions on the relatively unorganized, inarticulate exurban populations. Like New York’s Appalachia-like upstate regions, interior California faces a dismal future that, over time, will lead to increasing demands on the middle and upper classes. Only by allowing the interior a decent chance can California truthfully claim that its economy has, indeed, turned around.

This article first appeared in the Orange County Register.

Joel Kotkin is executive editor of NewGeography.com and Distinguished Presidential Fellow in Urban Futures at Chapman University, and a member of the editorial board of the Orange County Register. He is author of The City: A Global History and The Next Hundred Million: America in 2050. His most recent study, The Rise of Postfamilialism, has been widely discussed and distributed internationally. He lives in Los Angeles, CA.

Photo by Altus via Flickr

Columbus, Know Thyself

$
0
0

What Is Your Ambition?

Columbus doesn’t have a powerful brand in the market outside of Ohio. Having said that, the city is growing rapidly in population and jobs, is extremely livable and improving day by day, and seems to make its residents very happy. Is there any reason the city has to be better nationally known in order to be complete or something?

I say No.  It’s a valid choice to simply stay with the status quo.

Many citizens may indeed feel that way, but much of the city’s leadership doesn’t. This was hammered home in a 2010 New York Times piece on the city’s rebranding efforts. That desire to be seen as a high caliber city at the national level clearly came through in my most recent trip, even from Mayor Coleman himself.

I also tend to be personally biased towards high ambition, particularly in a place where it’s obvious that the ambition can be realized.  Columbus is that place, in contrast to long troubled regions  like Detroit and Cleveland are really struggling to rebound from severe problems. And no matter what they do, they will never recover the national stature they once enjoyed.   

Columbus is both operating from a baseline of strength, and also at a point where it is still on the way up as a city.   Columbus has never been a larger, more important, more prominent city in the world than it is right now – and it has the potential to reach still higher  Not every city and not every generation is granted the opportunity that Columbus has right now.  

Finding Columbus’ Mojo

But assuming the answer is go for it, then what needs to be done? There is a need to go beyond the checklist.

The first thing  is to really be committed to change and going after the brass ring. This is not an easy journey to make. Some of the things you are going to have to do are really, really hard because they involve looking  closely at civic insecurities, and also questioning perhaps your most fundamental and cherished truths, especially the truth about what you’re best at.

It’s very hard for cities to admit where they are weak, but it can actually be even harder for them to admit where they are strong.

One of the sayings of the Greek oracle was “Know Thyself.” Sage wisdom, indeed. Knowledge of yourself is often the most difficult to come by but valuable of commodities. Because as the saying goes, “Without awareness there is no choice.”

Where does a city get knowledge of itself that’s useful for branding? I argue it very often comes from the past. Cities didn’t just take their present form overnight. They are the process of a long process of growth and change. In particular, the founding ethos of a place profoundly stamps its character, usually in a permanent way. The Dutch trading culture and spirit of openness of New Amsterdam is still present in contemporary New York, for example.

When a new creative director comes in to revive a failing fashion house, what’s the first thing he does? He goes to the archives. He investigates the history of the house. What does this brand stand for? Who were the people who founded it? How did they become who they were? What happened along the journey of that house?

To use a hackneyed phrase, that new creative director wants to understanding the “Brand DNA,” and the key to the brand DNA is in the past.

I think that’s as true of Columbus as anyplace. Columbus certainly had good luck in getting where it is today, but I’d argue there’s more to it. One of their historical keys to success was a fateful decision in the 1950s to pursue an aggressive annexation strategy. You can say that was one mayor’s choice, but I believe the fact that it happened in Columbus and not elsewhere in Ohio signaled  that there was something different about the city. What is it?

You need to start with an anthropological, archeological, historical deep dive into a city, its people and its culture. I’d suggest tapping into Ohio State’s cultural anthropology resources. There might even be a dissertation in it for someone.

Aspirational Narrative

One you have the mojo, you not only use it to build the future reality, you also sell it by telling the story of Columbus to the world. You need to create an aspirational narrative of the city that people can imagine themselves being a part of.

Think of the story of New York. TV shows like Friends, Sienfield, and Sex and the City have created a contemporary positive narrative of life in New York. People know what it’s about. If you can make it there, etc. (This wasn’t always the case. Escape from New York, Death Wish, and Fort Apache the Bronx told quite a different narrative in a previous era). Portlandia tells a story about the place where young people go to retire. Think about the Bay Area, LA, Miami, etc. and the stories come to our heads without much thinking.

What’s that story of life in Columbus? You create that story around the authentic mojo of the city.

What’s on your rap sheet?

Beyond finding the mojo, there’s another key task that goes along with the investigation. That’s finding the missing or defective genes in the civic DNA that could sabotage the city’s ambitions.

Everybody’s got a rap sheet. The only question is whether or not we know what’s on ours. When I was working in corporate America I knew if I was getting nothing but glowing feedback from my boss, if Ihad nothing I need to get better at, I was dangerously blind. If not, why was I not the CEO of the company? Clearly, there’s a reason why I am where I am and not the President of the United States.

So Columbus needs to understand not just checklist items it is missing like a major transit investment, but also cultural items that are holding the city back and what they are rooted in. Then it can attack them with a change program that can hopefully work, like the civic equivalent of therapy.

On a related note though methodologically different, the city needs to be willing to take a hard look in the mirror and realistic assess its assets and accomplishments and how compelling they are in the market. The cold reality is that while Columbus is a great city in many ways and has lots of great stuff, what it has doesn’t add up to a nationally or globally compelling story. You need to take the marketing glasses off and ask how people who aren’t in or from the city   see things.

That doesn’t necessarily mean you recategorize your assets as bad. But you have to understand that checklist items that lots of other cities are doing (e.g., bike infrastructure) are probably not going to set the city apart in the marketplace. If you don’t have it, you’re in trouble. But if you do, it doesn’t win the game. These things are just the new urban ante.

Illustrative Applied Examples

I want to give a quick examples – and let me stress this is provisional and speculative to some extent – illustrating these three points.

On the mojo front, the city’s previous branding effort that identified “smart” and “open” as two key civic attributes is right on in my view. It’s a good start. But why is Columbus open? That is, why is it easier for newcomers to acclimate, penetrate networks, accomplish things, etc. in Columbus than in many other places?

I speculate it’s rooted in being the state capital. I’ve seen a similar trait in other capitals. I speculate that because people from all over the state are coming to Columbus on political business, and because there’s always churn in elected office, civic networks don’t become closed and calcify in a sort of “Why the Garden Club Couldn’t Save Youngstown” effect.

For the missing gene example, I think it’s very possible that one reason Columbus didn’t create a compelling, unique product in the market is that it it’s just not in the civic DNA. One local leader I talked to speculated that the city’s values were shaped by those of Ohio State football and Woody Hayes. That is, the secret to success is to work relentlessly at the fundamentals and always be pounding the ball ahead with the running game – “three yards and a cloud of dust.” Not exactly the West Coast Offense. This may be too facile, but it is clear that Columbus excels at the fundamentals, the blocking and tackling of city stuff, but hasn’t thrown the civic equivalent of the long bomb.  

For the asset evaluation example, I think Columbus needs to be realistic about Ohio State’s stature. Ohio State is a great school, but it’s not Harvard or Stanford. I went to Indiana University and I’d say the same about them. Now, obviously you’d never come out in public and downplay Ohio State, which legitimately is a power house for the city. But you don’t want to mistakenly believe it’s doing to spawn the next Cambridge or Palo Alto without some major change either.

It’s Cow Town, Jake

To truly discover the secret of its mojo, Columbus needs to be willing to stare into the abyss of cow town.

Talk to people in Columbus and you’ll hear them claim that they are not a “cow town” anymore or how people used to refer to them as a “cow town.” I have seen this as an analogy to the case of Indianapolis and “naptown.” I’ve always doubted that hardly anyone outside of Indianapolis itself ever used the term Naptown historically as an insult. No one would ever have cared enough about the city to even bother insulting it.

Similarly, I’d never heard the term cow town until somebody from Columbus told me about it. I strongly doubt it’s ever really been a term of derision nationally, at least not outside Ohio. I know there’s a strain of Cincinnatian who loves heaping abuse on places like Columbus and Indy. As Columbus has grown while other cities in Ohio wandered in the wilderness, it’s easy for me to believe there’s been a lot of sniping. So while the market would never think of Columbus as cow town, there may be some legitimate in state reasons for them to be sensitive to the term.

The impression I get, again provisional based on my limited experience, is that in an attempt to rid itself of the stigma of being a cow town, Columbus has sheared off its past, in effect repudiating everything that happened before 1990 or 2000.

I observed to Mayor Coleman that Indianapolis in recent years has downplayed the 500 Mile Race. I asked him whether or not Columbus was similarly neglecting its greatest brand asset in the market by downplaying Ohio State football. He said, “No. There was a time in the 60s and 70s and the 80s, and even the 90s, where Columbus was nothing but Ohio State football. And I love the Buckeyes; I love the football team. It’s better than any professional team in the state of Ohio. And they’re still amateurs. That’s good. But having said that, Columbus is no longer just the Ohio State football team. We don’t view ourselves that way anymore [emphasis added].”

This seems consistent with what I hear from other people. There’s an embedded idea here that there’s little to nothing of value in the city’s past and in fact that past is something to be embarrassed about or outgrown. I have never heard anyone from Columbus brag about their city for anything related to the past, apart from historic architecture.   For example, the mayor went on to talk about the importance of Ohio State in terms of its contemporary research impact. I’m not sure I’ve ever heard a city talk less about its heritage.  That lack of historic rooting may be one reason why the city can come across as somewhat generic.

As I’ve noted before, this is normal for us to go through. When we go off to college, Mom puts our high school letter jacket up in the attic. We try as hard as we can to fit in at the new level, and treat the stuff we left behind as little kids stuff.

But eventually we become comfortable in our own skin. We learn who we are and what we stand for, and we stop becoming so concerned about what other people think of us. Of course we are social creatures and will never stop caring about others’ perceptions of us. We find a healthier balance.

The same is true of cities. Columbus is far enough along in its growth path to really be comfortable being itself, and acknowledging and embracing its past.

This doesn’t mean Columbus should be or ever was a cow town. What it does mean is that things from its past that Columbus   are actually its strongest brand assets and things to be proud of and build its future on.

Let’s give some examples. The Midwest has a history of local, low grade lager brands. Virtually all of these were abandoned and ceased production. The hip, cool thing to do was to drink microbrews, not even Bud or Miller Lite, to say nothing of Sterling (my dad’s brand).

Then one day the hipsters on the coasts started drinking Pabst Blue Ribbon, and all of a sudden back in the Midwest, we started drinking it too and now are re-launching or re-embracing all those old blue collar brands (including Sterling). The same thing happened with workwear clothing, which is now selling for quite a premium in some places and very popular among the Bearded Ones.

In effect, we had to re-import our own heritage after a bunch of other people elsewhere saw the value in it – the same heritage we rejected as “cow town.”

The clearest example of this is agriculture. The Midwest is all about ag. Ohio State is a huge ag power house. Columbus could have owned urban agriculture, farm to table, organics, etc. But it didn’t. And now it’s doing them, but it’s doing them as the follower, not the leader.   

This is one of the tragedies of the Midwest. We turned away from our heritage and a bunch of guys in Brooklyn bought it from a thrift store for a song.

The South avoided this. Look at Nashville. Did they turn their back on country music as “cow town”? No, they embraced it as central to their identity past, present, and future. Of course they are more than country. But they kept it front and center. But they also updated it. It’s not the old AM radio country. It’s not Hee Haw. They respect those people and institutions and see them as in continuity with today, but they have evolved. Today’s it’s glitzier, “Nashvegas.” Think Carrie Underwood, not Minnie Pearl.

This is what it means to know thyself and build the future out of the authentic mojo of the past. Columbus surely has many things in its past and in its historic civic character   of immense value. The question and the challenge to the city is being willing to find out what those are and own and embrace them and champion them as a key part of the mojo on which it will build its future reality and aspirational civic narrative.

I believe the potential is right there. The question is whether the city is ready and willing to step up and grab it.

Aaron M. Renn is an independent writer on urban affairs and the founder of Telestrian, a data analysis and mapping tool. He writes at The Urbanophile, where this piece originally appeared.

The Long Term: Metro America Goes From 82% to 86% Suburban Since 1990

$
0
0

The major metropolitan areas of the United States experienced virtually all of their overall growth in suburban and exurban areas between 2000 and 2010. This is the conclusion of an analysis of the functional Pre-Auto Urban Cores and functional suburban and exurban areas using the Demographia City Sector Model.

The City Sector Model

The City Sector Model classifies zip code areas in the major metropolitan areas based on urban form (Note 1). These include four classifications, one of which replicates the urban form and travel behavior typical of the pre-World War II urban cores. These areas were typically higher density and dependent on transit and walking. The City Sector Model has three other classifications, Pre-Auto Urban Core, Auto-Suburban: Earlier, Auto-Suburban: Later and Auto-Exurban.

For simplicity the City Sector categories are referred to as urban core, earlier suburban, later suburban and exurban. The City Sector Model is described in a previous article, and illustrated in Figure 1, which is also posted to the internet.

The model makes it possible to analyze metropolitan areas based on smaller area functional classifications, rather than on jurisdictional (historical core municipality) borders, which among other things, mask as core large areas of suburbanization.

Suburbanized Core Municipality Examples: San Jose and Charlotte

This suburbanization in the historical core municipalities is illustrated by examples like San Jose and Charlotte. The City Sector Model indicates that neither of these metropolitan areas has a pre-auto urban core. This is because neither metropolitan area has a large enough concentration of houses with a median construction date of 1945 or before or sufficient area of 7,500 population density per square mile (2,900 per square kilometer) with a transit, walking and cycling work trip market share of at least 20 percent. As a result, virtually all of both metropolitan areas is automobile oriented suburban, including virtually all of the core municipalities.

This is true in Charlotte despite its development of one of the most impressive new central business districts in the nation, with high employment densities. Yet at the same time the  core city of Charlotte itself is very low density (2010), at 2,500 per square mile (950 per square kilometer), less than the suburban area average for large US urban areas (2,600 per square mile or 1,000 per square kilometer). Charlotte, however, could develop the equivalent of a pre-auto urban core if its central population density rises enough and enough commuters use transit, walking and cycling.

The core city of San Jose is far more dense than Charlotte, at 5,800 per square mile (2,200 per square kilometer). However, it is less dense than the suburbs of Los Angeles (6,400 per square mile or 2,500 per square mile). Like Charlotte, the core city of San Jose is virtually all automobile oriented suburban and has a transit work trip market share a full third below the major metropolitan area average.

Overall Population Trend: 2000-2010

These phenomena reflect national trends, All major metropolitan area growth between 2000 and 2010 (100.9 percent) was in the functional suburbs and exurbs.

Between 2000 and 2010, the percentage of major metropolitan area population in the urban cores declined from 16.1 percent to 14.4 percent. The urban cores lost approximately 140,000 residents (a loss of 0.6 percent), despite strong gains very close to the centers of the historical core municipalities. Consistent with these findings, Census Bureau analysis showed that the focused gains in the cores of the urban cores were more than negated by losses in surrounding urban core areas (described in: Flocking Elsewhere: The Downtown Growth Story).

The earlier suburban areas gained only modestly, adding 280,000 new residents, for a 0.4 percent increase. These areas have median house construction dates between 1946 and 1979. The largest increase was in the later suburban areas, which added the most new residents, 11.4 million, for a gain of 33.4 percent. The later suburban areas have median house constructions of 1980 or later. Exurban areas added 5.0 million residents, for a gain of 21.3 percent. Exurban areas are located outside the principal urban areas (Figure 2).

Overall, the later suburban and exurban areas gained 16.4 million residents, compared to the combined gain of 130,000 in the urban cores and earlier suburban areas. Thus, more than 99 percent of the population growth in the major metropolitan areas was in the later suburban and exurban areas (Figure 3).

During the decade, the exurban areas overtook the urban cores in population, rising from 15.4 percent of the major metropolitan area population to 16.8 percent (Figure 4).

Contrast with 1990-2000 Population Trend

Despite all of the talk of an urban core renaissance, the 2000 to 2010 decade was less favorable for urban cores than the 1990 to 2000 decade. In the earlier decade, the urban cores (as defined in 2010) added 960,000 residents, for a growth rate of 4.0 percent. This compares to the 140,000 urban core loss between 2000 and 2010 (Note 2).

Virtually all of the difference was attributable to urban core population trend reversals in New York, Boston and Chicago, which combined experienced a drop in growth of 1.1 million. Between 1990 and 2000, the urban core of New York added 779,000 residents, far more than the 190,000 added between 2000 and 2010. Boston's 1990-2000 urban core growth was 296,000, but fell to 27,000 in the last decade. Chicago's urban core dropped from a gain of 139,000 to a loss of 175,000.

Over the past twenty years, the population of urban cores has diminished relative to that of major metropolitan areas. In 1990, the urban cores represented 18.1 percent of the population, but fell to 14.1 percent in 2010. Auto-oriented areas (suburban and exurban) have increased their combined share from 81.9 percent of the major metropolitan area population in 1990 to 85.6 percent in 2010 (Figure $$$).

Summary of Individual Metropolitan areas

In 30 of the 52 major metropolitan areas, all or more of the population growth was in suburban and exurban areas between 2000 and 2010. This includes the metropolitan areas that do not have Pre-Auto Urban Cores.

Chicago had the largest share of suburban and exurban population growth, at 148 percent. This occurred because of the substantial urban core population losses. The suburbs and exurbs of Providence captured 131 percent of its growth, slightly more than the 126 percent suburban and exurban share in St. Louis. Baltimore, Rochester and Milwaukee had more than 110 percent of their growth in the suburbs and exurbs. Cincinnati, Indianapolis, Louisville, and Kansas City rounded out the largest suburban and exurban growth shares, all over 105 percent.

Despite the substantial decline in its urban core growth in the last decade, New York had the lowest share of population growth in the suburbs and exurbs (meaning that it had the highest share of population growth in the urban core). The suburbs and exurbs of New York captured only 69 percent of the metropolitan area growth, well below second place, Virginia Beach – Norfolk (81 percent). Boston was next at 83 percent, followed by San Francisco – Oakland, at 88 percent. The bottom 10 in suburban and exurban growth share also included Seattle, Washington, Philadelphia, Richmond, Hartford and Portland. Even so, each of these six metropolitan areas had more than 90 percent of their growth in suburban and exurban areas (Figure 6).

Jurisdictional Analyses: Suburbs Masquerading in Cities

The functional analysis based on urban form and behavior reveals substantially different trends compared to the conventional jurisdictional analysis that compares historical core municipalities, principal cities or primary cities to the balance of metropolitan areas. For example a jurisdictional analysis shows that core municipalities added 1,290,000 residents between 2000 and 2010. In contrast, the urban cores, as indicated in the functional analysis, lost 140,000 residents. This indicates the extent of to which municipal boundaries can mislead in the analysis of urban form within metropolitan areas. The expansive city limits of most core cities masks the substantial automobile oriented suburbanization within their own borders.

----

Note 1: The City Sector Model is generally similar to the groundbreaking research published by David L. A. Gordon and Mark Janzen at Queen's University in Kingston Ontario (Suburban Nation: Estimating the Size of Canada's Suburban Population) with regard to the metropolitan areas of Canada. Gordon and Janzen concluded that the metropolitan areas of Canada are largely suburban. Among the major metropolitan areas of Canada, the Auto Suburbs and Exurbs combined contain 76 percent of the population, somewhat less than the 86 percent found in the United States.

Note 2: Changes in zip code definitions and boundaries could result in minor differences in comparability between the three censuses.

----

Wendell Cox is principal of Demographia, an international public policy and demographics firm. He is co-author of the "Demographia International Housing Affordability Survey" and author of "Demographia World Urban Areas" and "War on the Dream: How Anti-Sprawl Policy Threatens the Quality of Life." He was appointed to three terms on the Los Angeles County Transportation Commission, where he served with the leading city and county leadership as the only non-elected member. He was appointed to the Amtrak Reform Council to fill the unexpired term of Governor Christine Todd Whitman and has served as a visiting professor at the Conservatoire National des Arts et Metiers, a national university in Paris.

Photo:  Later Suburbs in New York Urban Area (Morris County, New Jersey), by author

Florida: When Density is Destructive

$
0
0

Brick streets, mature old oaks, and a sense of history imbue Winter Park, Florida with a sense of place that is the envy of many small cities and towns. The tony Park Avenue brings shoppers and visitors, who soak up its ambience and enjoy the street life of this quaint southern town. On the east side, bounded by blue lakes, lie gentrified historical mansions, while the west side is a neighborhood of smaller, affordable homes with multigenerational Winter Parkers. This community of little single-family homes is now endangered by developers that are gobbling up parcels two and three at a time, increasing the density threefold, and squeezing out residents in a new, “zoning for dollars” economic climate.

Affluence and affordability have always maintained an uneasy truce, and the balance between them has historically been protected by cities through planning policies and an understanding that the mission of a city is to be workable for all of its residents, not just the wealthiest. Unfortunately, this balance tilts when the density imperative drives land values up, and tips the scales in favor of half-million dollar townhomes. High density has become fashionable in Winter Park these days, as it has in many cities, and there are some benefits to this new style. The costs? Well, those will be counted later.

Density’s benefits look great on paper: a higher tax base, expensive new housing, walkable urbanity. When implemented well, these can make for positive changes. Advocates preach careful, sensitive ways to develop: don’t smash large and small buildings together; don’t mix uses on a street, and ramp up from low to high density across a gradient of a block or two. Advocates also preach a consensus-building process to avoid neighborhood clashes over growth issues. In places where this has happened, like Coral Gables in Miami, the story has mostly been a good one.

The west side of Winter Park, with its cottages and modest residences for families, dates back to the 1920s. Within the neighborhood are many small churches to which residents walk on Sundays. Playgrounds, parks, and a community center characterize the West Side’s tree-shaded streets, and its proximity to the downtown area means jobs for many of its residents. For the last ninety years, the city has evolved around this neighborhood, and many families go back several generations. Its diversity includes many African American families, mixing with whites. It carved out a niche in the city.

Today, the West Side is an older and less affluent neighborhood that happens to be close to a desirable address. The West Siders have already chosen their preferred building pattern and rhythm, infilling their blocks with new homes of similar size and scale, enlarging the tax base. They already live a walkable urban lifestyle, use mass transit, and evolve with slow and organic growth. In short, every urbanist’s dream.

Like many cities that have a working class enclave that butts up against a newly trendy one, Winter Park has encouraged dense, mixed-use development, while nominally protecting its existing neighborhoods. And this is where the density equation seems to fall apart. The residents who leave the area will no longer participate in the economy of Winter Park. The new residents of half-million-dollar townhomes probably won’t ride the bus, walk to the churches, or otherwise activate the local streets. So a natural piece of the city is lost forever. Urbanism, for all that has been written in favor of this ideology, is diminished for the sake of density.

West Siders protested in City Hall, asking the city not to upzone their neighborhood. While City Hall nodded to its citizens, it had already quietly allowed upzoning to take place, taking advantage of tired homeowners who decided to cash in. Half-million-dollar townhomes, which could be built in other areas, are instead being built here, to take advantage of low land values. Parking garages and midrise apartments now cast shadows on the adjacent small houses. Land values may rise on those parcels with new townhomes and midrise apartments, but immediately next door, the remaining adjacent little one-story cottages become particularly undesirable; the value of those homes becomes depressed. The owners' only hope is to sell off to a high-density developer. Step by step, high density becomes more and more inevitable as the only solution left.

The market forces at work in Winter Park have played out elsewhere across the country, with old neighborhoods eroding. This time around, with density all but institutionalized as the only acceptable way to grow, the deck seems to be stacked against entrenched locals. Cities are re-writing their development codes in favor of shiny new mid-rises and high-rises, ignoring existing residents who won’t be missed till they are gone.

When the market, an amoral institution without sentiment, threatens neighborhoods, it is the job of City Hall to provide a hedge that ensures balance and fair play. But citizens have to shout over the money in order to be heard, so local groups like the Friends of Casa Feliz have stepped in on their side. If “zoning for dollars” can work against this section of the city, groups fear, then no one is safe, and people are reminding City Hall of its duty as a guardian of its residents.

Density, on its own, is neither a good nor a bad thing. It can make a city more efficient and connected, and proponents tout its reputed health benefits and contribution to a thriving social life. When, in the process of allowing density, a city destroys the very values that it is supposed to promote, then the city ends up cannibalizing its neighborhoods for little benefit other than the one-time gain that the developers will realize from the sale of these newly built products. Income streams are put into mortgage-holders’ pockets, and, bit by bit, one more highly localized economy disintegrates.

City halls, so obsessed with petty regulations, would do well to recall their basic functions as protectors of their residents. If there were a “back to basics” movement for government, many ordinances written to benefit the few would be shed, and there would be a refocus of attention back to the public good. The current infatuation with density, like many fashionable ideas, may come and go, but if a multigenerational neighborhood goes, it won’t be replaced in our lifetime.

Richard Reep is an architect with VOA Associates, Inc. who has designed award-winning urban mixed-use and hospitality projects. His work has been featured domestically and internationally for the last thirty years. An Adjunct Professor for the Environmental and Growth Studies Department at Rollins College, he teaches urban design and sustainable development; he is also president of the Orlando Foundation for Architecture. Reep resides in Winter Park, Florida with his family.

Photo by Betsy Owens of the Friends of Casa Feliz: "Preserved 1920s Cottage on Lyman Street", Winter Park, Florida.

Bulgari to Taco Bell: Across China, Buyers Are the Target

$
0
0

I work for myself, and when I travel to China on business I have the “luxury” of sleeping on trains and in hostels, and getting around during the day by bicycle. This spring I made a circuit from Beijing to Chengdu (in western China), to Wuhan (right in the middle), and to Shanghai (east coast), before heading back to Beijing. Ostensibly I was there to hunt down consumer trends.

What I saw was:

  • Cars and smog are killing off the grace of the old cities
  • High-rise apartment towers have doomed more village markets than collectivization did
  • Much of China’s continuing economic boom is a currency sleight-of-hand, and
  • Chinese consumers are a lot less interested in Western brands than CEOs of multinationals would have us believe in their upbeat annual reports

Herewith, notes from the lower berth on many sleepers and the saddle of whatever Giant bicycle I could rent, by which means I covered 3,134 miles in less than two weeks:

Beijing: For grace and charm, nothing in China beats central Beijing. At night, the lights around Tiananmen Square glow like those along the grand canals of Venice. During the day, Beijing suffers from a carbon dioxide whiteout, China’s equivalent of London fog that has made the city a respiratory health disaster.

Beijing is also at the uncomfortable crossroads of a political system struggling to accommodate dialectical materialism with emerging consumer pleasures. But the means of production are distant from Beijing power brokers, a reminder of how Marx railed against absentee landlords.

The biggest contribution that the central bureaucracy has made to the Chinese economic miracle is to depreciate the renminbi to subsidize exports. With an exchange rate of ¥6.25 (yuan) to the US dollar, things that cost $150 in the West, such as a hotel room, are $24 in China.

That accounts for an economic boom on the export side, but limits the demand for imported western products. If you are a Chinese worker who earns, on average, $900 a month, are you going to spend $150 on imported Air Jordans?

The currency mismatch feeds the thriving market in Western knockoffs, but another reason for rip-off branding, I suspect, is that the idea of personal space is alien to Chinese daily life. Translated into consumer speak, that may explain why no one cares a fig about copyright laws, patents or trademarks.

Across China: My train ride to western China lasted more than 24 hours. From my window, beyond the miasma that is Chinese air, were countless high-rise towers, many forty or fifty stories high, where rural residents have been resettled. Someday, China will be the people’s republic of tenement housing. The next revolution will begin when enough elevators are out-of-order.

In the meantime, local shopping has become as centralized as once was the communist party. Big box stores — from Home Depot to the French supermarket Carrefour — are betting the ranch on making it alongside these brave new world housing complexes.

The do-it-yourself corporate entities — a big fixture of malldom — have not yet figured out that Chinese women, not men, drive the Saturday afternoon purchases, and that few Chinese have SUVs to haul the stuff home.

Chengdu: Yet another faceless city of the Asian miracle, Chengdu is clogged with late-model cars in traffic, and dotted with western boutiques and high-rise buildings.

Cartier and Bulgari are on the best corners, but what attracts local crowds is American fast food, the ideal combination of Asian, on-the-go convenience and international branding, held together with US trans fats. Shares in YUM! Brands — the Chinese franchise owners of KFC, Pizza Hut, and Taco Bell — are up 600% since 1999.

South of center city, I biked past the world’s largest building, the New Century Global Centre, about the size of four Astrodomes with the façade of an airport terminal. Part mall, part exhibition center, water park, university, iMax cinema, hotel, restaurant, and office complex, it's a consumption monolith. Still, it has the feel of an enormous recycling center where government money is, so to speak, washed (maybe at the artificial beach?) into the accounts of the new class. So much for the Chinese economy prospering only as the result of long work hours.

Wuhan: East of Chengdu, this Yangtze River city is a conglomeration of three Qing Dynasty districts into a modern juggernaut. It saw the first outbreak of the 1911 Revolution, remembered with a few Sun Yat-sen statues and museums (although he was in Hawaii when the first shots were fired).

Crossing the Yangtze on a ferry — new China as a slow passage through the heart of darkness — the river water was the consistency of crankcase oil, and smog obscured the far shores, no doubt the byproduct of all that Appalachian coal that gets exported to China on Warren Buffet’s trains and bulk carriers.

Doing my field research on Chinese consumerism in several superstores, including Walmart, and at Starbucks, I was fascinated at how little Western companies cater to Chinese tastes. It's not only that there’s no Dragon Latte at Starbucks. One of the sins of branding is to add Chinese characters to Western labels, so French supermarkets in China look just like those in Paris.

Maybe the centrally planned economy is alive and well, but it's living in exile in places like Arkansas or Seattle? At least I didn't hear anyone in Wuhan complaining about aisles full of junk made in China.

Shanghai: Its new reputation is as China’s New York City, a blend of high-rise glitz and coastal sophistication. But that’s if you are in expense-account Shanghai, eating in all those revolving restaurants. I got around on long marches to metro stops and by bus and taxis— China on five traffic-jams-a-day.

At a food services convention that I had travelled to attend, huge exposition halls were devoted to things like espresso machines and Italian gelato, the budding tastes of modern China.

From the view at the convention hall, China looks like a treaty port of Western desires, with Mao’s capitalist road running through it. I wonder, though, if shoppers will ever make the switch from street vendors to the Great Mall.

On the outskirts of Shanghai, a colonial-style shopping center had everything from Pizza Hut to Ben and Jerry’s ice cream. It was awash with French wines, English clothing, American cosmetics, Spanish fashions, and Swiss pharmaceuticals, but, when I was there, few customers. It felt like an ultra-upscale military PX, although the shoppers were as listless as terra cotta warriors. Build it and they will come?

Wandering the aisles of China's consumption centers, I came to the conclusion that Western sales representatives (with their sample bags) are the new missionaries. They've come to the East to preach salvation, based on new packaging for old products, but they're as rigid in sticking to the gospels of Home Depot as they once were about peddling the Book of Mormon.

As André Malraux wrote in1933, as prescient about the Chinese revolution as he was about 2014 consumers, “Europeans never understand anything of China that does not resemble themselves.”

Matthew Stevenson, a contributing editor of Harper's Magazine, is the author of Remembering the Twentieth Century Limited, a collection of historical travel essays. His new book, Whistle-Stopping America, was recently published.

Flickr photo, in Beijing's Oriental Plaza shopping mall, & caption by Ming Xia, The Coca Cola Store: "China is a very receptive market to brand extension programs - Playboy clothing and Pepsi sneakers are ubiquitous in the PRC… this looks to me as if it is a test unit."

California's Choice - Growth or Decline

$
0
0

I’ve been friends with Charlie Sena for almost two decades. Charlie, a longtime entrepreneur, Democratic political operative and fundraiser for former Gov. Gray Davis, recently chided me about what he sees as my “negativity” about California and its future. My response was that, given its natural advantages, this region should not be in such a weakened condition. Decline, I suggest, is not an imperative here, but largely a choice.

Last week, I decided to confront this issue over lunch at Citrus Grille in Orange, just down the block from Chapman University, where I teach. Charlie noted that the negative points I was making were correct, but I owed it to the readers to “write a piece on why California can be, and should be, a state with the right climate for business growth.”

So, we sat in the restaurant, working on a list of positive things for California to build on. We centered on working with our population, including many immigrants and entrepreneurs, reinforcing our connections to Asia and Mexico and, finally, taking advantage of our climate. “The great strength of California,” Charlie suggests, “is people – people who go out and make it on their own.”

Immigrant Edge

The first group Charlie pointed to are immigrants, a group for which California long has been a lure. Twenty percent of Californians are foreign-born, and one of four immigrants nationally lives in our state. Amidst a general downturn in overall entrepreneurial activities, notes a recent study, the foreign-born have continued to expand their business footprint. In 2011, notes the Kaufmann Foundation, immigrant start-up rates were twice those of the native-born.

Attitudes are important here. To succeed in a highly regulated, expensive state like California, you need to have more than usual perseverance.

Asians, for example, according to the Pew Research Center, are far more likely than other Americans to believe that “hard work” pays off. Not surprisingly, they also tend to have higher levels of education, income and business success than other Americans.

But equally important has been the entrepreneurial growth among Latinos, who became the state’s largest ethnic group in 2014, according to demographers, and could be close to 50 percent of the population by 2050. Indeed, a recent study of Latino business found that Hispanic entrepreneurs have more than tripled since 1990, from 577,000 to more than 2 million. Not only did this growth outpace that of the overall population increase among Hispanics, but at a rate of increase far above the national average.

Anyone who drives out into the vast expanses of the state can see these businesses – new markets, countless restaurants, small factories, farms, local banks and scores of smaller service firms. California’s new commercial signature is not the traditional mall or luxury shopping street, but, rather, multiethnic commercial areas, like the Diamond Jamboree center in Irvine.

Rise of Self-employed

But there’s also signs of greater growth in the ranks of self-employed people across the population. The self-employed proprietor is the one entrepreneurial category that has grown since the recession. This may well represent a pragmatic choice by business people who wish to make money, but avoid the ever-increasing regulations here that make having employees increasingly difficult.

This growth is particularly vibrant in the Riverside-San Bernardino area, notes a recent study by the economic modeling firm EMSI Inc. The inland region expanded its sole-proprietor ranks by 11.8 percent since 2008, second to booming Houston and more than twice the growth rate of either the Bay Area or Los Angeles-Long Beach. All these key California areas greatly outperformed such competitors as Denver, Greater Washington, D.C., Chicago or Atlanta.

Foreign connections

California also has enjoyed a unique connection to the fast-growing economies of the Pacific Rim and Mexico. Texas succeeded in luring Toyota, as Tennessee did with Nissan, but neither state possesses the intense cultural and historic ties California enjoys with Japan and other Pacific Rim countries. To be sure, places like Plano, outside Dallas, and around Houston’s Bellaire Road look increasingly like the San Gabriel Valley or Garden Grove in their ethnic flavor, but they are at least a generation – and an order magnitude – behind.

Where Texas eats our lunch, says Charlie, who lived in Houston years ago, is in forging ties with Mexico. Many Californians – particularly on the right but also on the “green” left – tend to regard Mexico as something of a threat to our social and ecological order. But supposedly less-enlightened Texas, where business is king, has developed a powerful passion for closer ties to Mexico, with a growing partnership between the Lone Star State and Mexico, which, for example, is already Houston’s foremost trading partner.

Political dilemma

So, why is California not taking advantage of these assets? One main reason lies with the regulatory and tax agendas of Charlie’s own party, something he is quick to acknowledge. “The Democratic Party,” he suggests, “is on a collision course with reality. They don’t realize that you need a broadly growing economy to support or expand social services.”

This is the dilemma that progressives need to confront in California. An over-regulated, overtaxed economy slows business growth and forces companies to look elsewhere to expand, particularly outside of very high-end functions. Superhigh income tax rates deprive small-business owners of the capital they need to reinvest and grow their enterprises. Under the current regime, many of them, particularly the young, may find starting a business in Colorado, Nevada, Utah or Texas easier and more financially rewarding.

Back to Pat?

Like Charlie, I admire many of the things we created during the great expansion of the Gov. Pat Brown era, a half-century ago – the higher education system, the freeways, the water projects, to name three. All these were paid for by broad-based economic growth, and contributed to accelerating that growth over time. Our success made California a model for other states – including Texas and North Carolina – which wanted to leave behind their feudal, and deeply racist, pasts.

Now, these people are essentially beating us at our own game, and unless we respond, they will continue to attract not only large businesses, such as Toyota and Occidental, but also talented people critical to the grass-roots economy.

Politicians in Sacramento, and many city halls across this state, seem to have little notion of, or even interest in, economic growth beyond serving the interests of public employees and crony capitalists, whether in subsidized “green energy” boondoggles or among rent-seeking developers. These kind of policies are simply transfers of resources from neighborhoods, suburban or urban, to the well-placed; they have not been significant economic drivers.

Charlie’s last point – climate – remains critical. This region is never going to become Detroit, no matter how misguided is our political class, simply because of its weather and topography. People and businesses will want to come here if they can make a decent living and enjoy the option of housing, largely single-family homes, that remains the ultimate goal of most upwardly mobile people, particularly immigrants.

So, if maybe sometimes I get too negative about California, it’s in large part because we squander opportunities and seem determined to ignore all the basic economic data. In this shortcoming, the media, notably the Los Angeles Times, has been particularly gratuitous, acting as if the loss of key companies, such as Occidental and Toyota, was largely irrelevant and, indeed, inevitable.

This is not, in my mind, the California I moved to four decades ago. That we do things differently here is not a negative – it’s why many of us are here – but we need to recognize that you cannot support an ever-expanding welfare state or do much of anything about climate change simply by chasing people and individuals elsewhere. We need to start developing policies that exploit our advantages and not rest on our glorious past. We need to see, as Charlie would say, that decline is not inevitable, but only a choice that too many in the state seem determined to embrace.

This article first appeared in the Orange County Register.

Joel Kotkin is executive editor of NewGeography.com and Distinguished Presidential Fellow in Urban Futures at Chapman University, and a member of the editorial board of the Orange County Register. He is author of The City: A Global History and The Next Hundred Million: America in 2050. His most recent study, The Rise of Postfamilialism, has been widely discussed and distributed internationally. He lives in Los Angeles, CA.

Photo illustration by krazydad/jbum.

The Ugly City Beautiful: A Policy Analysis

$
0
0

When it comes to the future, Detroit and San Francisco act as poles in the continuum of American consciousness. Detroit is dead and will continue dying. San Francisco is the region sipping heartily from the fountain of youth. Such trajectories, according to experts, will go on indefinitely.

Harvard economist Ed Glaeser has a grim outlook for the Rust Belt. “[P]eople and firms are leaving Buffalo for the Sunbelt because the Sunbelt is a warmer, more pleasant, and more productive area to live,” he writes in City Journal.

Glaeser echoes this sentiment in a recent interview with International Business Times, saying “[s]mart people want to be around other smart people”, and the Rust Belt has a long slog ahead given that “post-industrial city migration is dominated by people moving to warmer climes”.

But is this true? Is there a “brain drain” from the Rust Belt to the Sun Belt and Coasts? In a word: no. But Rust Belt leaders have bought this narrative hook line and sinker, and the subsequent hand-wringing has led to wasteful public investment.

“Michigan’s cities must retain and attract more people, including young knowledge workers, to its cities by making them attractive, vibrant, and diverse places,” reads a 2003 memo from the National Governor’s Association about Michigan’s “Cool Cities” campaign.

But the campaign struggled. “Government can’t mandate cool,” reflected Karen Gagnon, the former Cool Cities director. “As soon as government says something is cool, it’s not.”

What’s worse, “cooling you city” with talent attraction expenditures can exacerbate economic disparities on the ground. Cities, like Chicago, are increasingly becoming bifurcated cities based on faulty assumptions that “trickle down urbanism” works. That said, the challenge of the day—for not only Rust Belt cities, but all cities—is not “brain drain”, but “brain waste”. Those cities who can best rebuild middle class communities tied to emerging markets will be the future of investment, like they were in the past.

Through Rust-Colored Glasses

When a people fall from grace, the sentiment of decline tends to stick. The Rust Belt’s demise is cemented. Meanwhile, the future is elsewhere. Like toward the sun. For instance, from 2000 to 2010, the Sun Belt metros of Houston, Dallas, Atlanta, Riverside, Las Vegas, Miami, Orlando, and Phoenix experienced the largest population growth. The biggest losers? It’s a “who’s who” of Rust Belt metros, led by Detroit, Cleveland, Pittsburgh, and Buffalo.

America is a country governed by growth: big cars, big belt buckles, big houses, and big populations. Shrinkage is weakness. It is a sign of place failure. The problem here is that population growth is an ineffective, broad-brush measure when trying to understand regional underlying dynamics. A new study by Jessie Poon and Wei Yin in the journal Geography Compass called “Human Capital: A Comparison of Rustbelt and Sunbelt Cities” details exactly that.

In it, the authors compare human capital levels between the Sunbelt metros in California (including San Francisco and L.A.), Nevada, New Mexico, and Arizona with Rust Belt metros in Michigan, Ohio, Indiana, Pennsylvania, and upstate New York. When it comes to share of population with a college degree, the authors find that the Rust Belt is experiencing a brain gain equal to their Sun Belt peers from 1980 to 2010. Poon and Wei also found that skill ratios of immigrants is higher in the Rust Belt than Sunbelt. The authors note that despite population decline, the Rust Belt continues “to be important sites of human capital accumulation”.

The study coincides with recent work out of the Center for Population Dynamics that shows Greater Cleveland’s number of 25- to 34-year olds with a bachelor’s or higher increased by 23% from 2006 to 2012, as well as Pittsburgh economist Chris Briem’s work that shows the metros of Pittsburgh, Detroit, and Cleveland rank 1st,, 6th, 7th in the country respectively when it comes to the number of young adults in the labor force with a graduate or professional degree.

Beyond human capital, the Rust Belt continues to produce and export wealth at a massive pace. The “Chi-Pitts” mega-region, which mirrors the Rust Belt boundaries with the addition of Minneapolis, generates $2.3 billion in economic output, second only to the “Bos-Wash” mega-region that makes up the Northeast Corridor.

Also, using IRS migration data from the 2009-2010 period, a team of researchers led by Michal Migurski showed that Los Angeles County, New York County, and Cook County sent the most people and money to the rest of the United States. Detroit’s Wayne County was fourth. Cleveland’s Cuyahoga County was 9th, one spot ahead of San Francisco County. Speaking to Esquire, which published the work in a visual called “Where Does the Money Go”, Migurski explains the findings:

"We realized that if you look at the biggest 'losers,' essentially what you're looking at are the biggest cities in the U.S.," Migurski says. One of those losers: New York County, which lost $1,306,548,000 and 15,100 people. "But does that actually mean New York is a big loser?" Migurski asks. "One of our ideas was that, you're not a loser if you're losing money. You're an exporter." The sort of exporter, he says, that boosts the rest of the U.S. economy. Traditional Sun Belt retirement areas comprise the gainers; areas like South Florida and Southern California in particular, create what Migurski calls "money sinks."

Still, the notion of “loser” for Wayne and Cuyahoga County sticks, despite evidence to the contrary. But why? Why the constant “poor post-industrial people” sentiment, if not a low-grade captivation that comes with “ruin porn” rubbernecking?

Well, if an ideal exists—you know, the experts beckon: be the “new” city, the “hot” city, the “creative” city—then a study in contrasts is necessary. The Rust Belt, with its connotations of smoke stacks and demographic decline, fits the bill.

“[Richard] Florida suggests that Rustbelt cities’ high concentration of less creative blue-collar workers also produces unhappy residents,”Poon and Wei conclude in their Rust Belt/Sun Belt study. “We suggest that such a doom and gloom picture of urban and regional development for the uncool industrial Rustbelt needs to be tempered with a trend of brain gain that is growing across cities in the region.”

But for this tempering to happen a clearer understanding of the importance of accumulating human capital needs to be ascertained. More exactly: Is it to put your city to work, or to “live-work-play”?

Build it and they will…what?

In his 1921 work Economy and Society, social scientist Max Weber details a city’s raison d'etre. Cities can be producer cities, wherein importance is derived from industries that demand national and international trade. Think Detroit and cars. Additionally, cities are consumer cities, in which growth is tied to how much is spent consuming goods and services in the local economy. Think eating, drinking, and buying houses.

The cities that are the most economically robust have wealth generated from global production, which in turn enables local consumption. San Francisco’s tech economy drives it real estate market and artisanal toast scene. That is, if the question was “What came first, the farm-to-table chicken or the egghead?” The answer is “the egghead”, hands down.

But this logic—i.e., in order to go to a restaurant, you need a job, and your job prospects are tied to the viability of your region’s global industries—is often turned on its head in economic development. Here, the goal is growth, no matter the rhyme or reason.

“Like in many Sun Belt cities,” writes a Seattle Times columnist and Sun Belt expat, “Phoenix’s economic plan devolved into merely adding people, no matter the enormous long-term costs”. The columnist goes on to note that while the population has boomed, the city lags on most measures, such as per capita income (see Figure 1 below).

Moreover, the Phoenixes of the world exist partly because of retired Baby Boomers and the disposable income that comes with it. The Sun Belt feeds off the legacy of production in the Northeast and Midwest. Other cities, like Portland, are fed by a not dissimilar dynamic. But it’s not the retired who come, rather the pre-retired.

“The Portland metro area's young college-educated white men are slackers when it comes to logging hours on the job,” lead’s a piece in the Oregonian about a study conducted last year, “and that's one reason people here collectively earn $2.8 billion less a year than the national average.” Figure 1 demonstrates Portland’s sluggish income gains compared to Rust Belt peers Pittsburgh and Cleveland.

Similarly, in a paper circulated by the Federal Reserve Bank of Atlanta, the author analyzed the top 86 “brain gain” metros in the nation to determine whether or not a region’s increase in human capital was paying off in terms of per capita income, labor force participation, poverty rate, and unemployment. The author found Portland was one of twelve metros that experienced zero economic outcomes. Pittsburgh scored 4 for 4. The authors suggest that talent attraction and retention—when untethered to production capacity—“may be largely inefficient, a kind of traditional economic development ‘buffalo hunting’”.

Portland is perhaps America’s consummate lifestyle city. No doubt, the city has experienced a significant brain gain over the last decade. Portland is a talent attraction model. But it is not a talent producing or refining model. Rather, Portland is producing a scene that is run by the consumption of the scene’s aesthetic. Writes one young worker who left:

“I can’t stay too long because I know if I stayed a day too long in Portland, I’d suddenly be happy to embrace the slow pace of the city and stop working... I’d end up getting sleeping real late every day, drink some coffee, maybe write some poetry on my porch (or not), and then find a part time job selling cigars like I had in college.”

The lesson is that accumulating talent is not enough. There has to be something for the talent to do, or a context that fosters “doing”. It is also a warning for cities investing in the lifestyle game. Spending on creative class amenities ensures nothing. Creating a field of dreams won’t pay the bills. But it will run up the tab.

The Ugly City Beautiful

In 1998, the Chicago Sun-Times ran a piece called “Building the City Beautiful”. “The mayor of the city of Chicago, Richard M. Daley, is a big admirer of Martha Stewart,” it begins, before describing Daley’s plans to begin the "Martha Stewart-izing" of Chicago. The article goes on to quote a University of Illinois at Chicago professor who said Chicago is turning from a producer city to a consumer city. "The producer city was the industrial city -- the smoke and the noise and the industrial jobs,” noted the professor. “The consumer city is the city of Starbucks, boutiques and so forth.”

The professor was only partly right. By the 1990s, Chicago was indeed becoming brainier. But its emerging knowledge economy was an outgrowth of its “big shouldered” manufacturing base. Columbia University professor Saskia Sassen recently noted that pundits overlook this when examining the city’s transformation, with the bias being that “Chicago had to overcome its agro-industrial past, [and] that its economic history put it at a disadvantage”. Notes Sassen:

[I]n my research I found that its past was not a disadvantage. In fact, it was one key source of its competitive advantage. The particular specialized corporate services that had to be developed to handle the needs of its agro-industrial regional economy gave Chicago a key component of its current specialized advantage in the global economy.

Similar economic transformations from legacy cost to legacy asset are found throughout the whole of the Rust Belt. Pittsburgh, for instance, no longer provides the muscle for steel making, but it does act as the “brain center” for the world’s steel frame. How this came about is detailed in the article“Pittsburgh's evolving steel legacy and the steel technology cluster”.

With the arrival of the new economy also came “new economy” tastes. Sassen noted that when she arrived in to study in Chicago in the 90s she was greeted by “old lofts transformed into beautiful restaurants catering to a whole new type of high-income worker—hip, excited, alive.”

In other words, local consumption patterns began setting up around the emergent worker demand. Going was the Italian Beef and arriving was pickled beets. This demand also impacted housing, with the attraction to urban living setting the stage for gentrification. This, in a nutshell, is the dynamic driving the transformation of urban neighborhoods nationwide: a new economy demands new workers which in turn demand a new kind of lifestyle. The problem, though, is that leaders have the causality backward, or that creating a new lifestyle will incur new worker supply and then poof: new industries. But as we see with Portland, it is not that easy. The industrial DNA and social history of your city matters more than the cosmetics atop the topography.

Still, from a policy and strategy standpoint, it is easier just to make your city “cool”. And that’s exactly what Chicago has been doing at a significant pace. In a recent piece entitled “Well-healed in the Windy City”, author Aaron Renn details Mayor Rahm Emanuel’s policy of using tax-increment financing (TIF) to create geographic “winners” and “losers” across Chicagoland. “The true purpose of Chicago’s TIF districts—which now take in about $500 million per year,” writes Renn, “appears to be tending to high-end residents, businesses, and tourists, while insulating them from the poorer segments of the city.”

The strategy was spelled out explicitly by Mayor Emanuel during a recent ribbon cutting for a bike path in Chicago’s Loop. Said Emanuel: “I expect not only to take all of their [Seattle and Portland's] bikers but I also want all the jobs that come with this, all the economic growth that comes with this, all the opportunities of the future that come with this.”

Notwithstanding the faulty logic in the strategy—e.g., if Portland lacks the jobs for its residents, how can it supply jobs for Chicagoans—the real problem is the costs associated with such bifurcated investment. In West and South Chicago, the byproducts of the City Beautiful approach are downright ugly. But they are not unexpected. They are the long-documented economic and social effects of concentrated poverty and segregation. Continues Renn:

Safety levels in Chicago can no longer be plotted on a single bell-shaped curve for the entire city. Today, that curve is split into two—one distribution for the wealthy neighborhoods and one for the poor ones. A lack of resources is part of the problem: the police department is understaffed… While the city budget is tight, failing to increase police strength during a murder epidemic is a profound statement of civic priorities.

Urban priorities flow from a perception of what is at stake. For long, the push for human capital accumulation has pitted city versus city amidst the backdrop of an urban popularity contest in which the “winner” is assured nothing outside of popularity. But victory in the vanity game is fleeting. The young and the restless are exactly that, and many people who come to New York or San Francisco, or for that matter Portland, leave as they get older and seek out affordable places to raise a family. What remains on the ground is the reality of brain waste. Without the prioritization of equitable, integrated middle-class neighborhoods a city’s progress will be always be disparate, if not illusory. Talent attraction is but part of a redevelopment process. So is talent refinement for those arriving and talent production for those in place. After all, neighborhoods are factories of human capital. Building people, not places, is what a successful city is all about.

But to know this is to “know thyself”. The Rust Belt has been dying for some time now, so say the experts. The region has absorbed the projections, and given that desperate times call for desperate measures investment has been wasted. “[Creative class theory] is bad because it distracts from what's important,” says Sean Stafford, author of Why the Garden Club Couldn’t Save Youngstown.

Regaining focus entails removing the rust-colored glasses. Rust Belt leaders will see there are assets to work with, not to mention feel the freedom that comes with no longer being a study in contrast for those touting a future that really isn’t.

Richey Piiparinen is Senior Research Associate at the Center for Population Dynamics at the Maxine Goodman Levin College of Urban Affairs at Cleveland State University. TheCenter for Population Dynamics at Cleveland State University’s Maxine Goodman Levin College of Urban Affairs aims to help partner organizations competitively position the region for economic and community development. It will do so through the lens of migration, applied demography, and culture.

Lead photo courtesy of bctz Cleveland


Let’s Make Kalamazoo’s Promise America’s Promise

$
0
0

In 2005, in order to boost their city’s economy, a small group of donors in the city Glenn Miller made famous created the Kalamazoo Promise. It  offered any graduate of the city’s public schools a four-year scholarship covering all tuition and mandatory fees at any of Michigan’s public colleges or universities, provided those students maintained a 2.0 grade average in college and made regular progress toward a degree.

The offer had an immediate and noticeable effect on public school enrollments and home construction within the city as families moved back in to take advantage of the chance to boost their children’s higher education opportunity. Enrollments in the public schools rose initially by 17.6% even as high school dropout rates fell by half. Residential construction permits within the district rose from 30% within the overall metropolitan area to 50%.  The program’s success caused other cities across the country as disparate as El Dorado, Arkansas and Tulsa, Oklahoma to adopt similar programs.

Now a recent national study of the results of such initiative has documented the positive impact such promise programs can have on increasing educational attainment, while encouraging more students to attend a wide range of colleges.  University of Pittsburgh professors, LeGower and Walsh found that programs offering scholarships to all students regardless of merit, and to the widest range of two and four year colleges and universities, saw the biggest gains in enrollment. Their research published in a National Bureau of Economic Research working paper, documented enrollment gains in Kalamazoo and other identical programs.

With these compelling results in hand, it’s time to make Kalamazoo’s promise America’s promise. A bi-partisan proposal from the non-profit Redeeming America’s Promise seeks to do just that by creating a federal American Promise Scholarship program that would pay the cost of tuition for every academically capable and personally determined high school student in America from families earning $180,000 or less. The plan would offer two year scholarships for high school graduates of $2500 per year, and four year scholarships worth on average $8500 per year to students graduating with a 2.75 GPA. These rates represent the current average cost of in state resident tuition at our public community colleges and universities. States would need to agree to accept such scholarships in lieu of any tuition payments from the families of APS students and at a minimum maintain their current level of support for their institutions. Additional incentives would be provided to encourage them to do even more to make sure a college education is both accessible and affordable for their residents. According to the Bipartisan Policy Center, there is $52 billion in current expenditures which can be used to fund the American Promise Scholarships by redirecting the money the federal government currently spends on tuition tax credits as well as by integrating the Pell Grant program into this new form of support.

Other parts of the plan, which can be downloaded in its entirety at redeemingamericaspromise.org, would provide additional support for students who are the first in their family to attend college and reward college completion as well as post-graduation service to community or country. Money for these programs can be found by reducing the level of profits the government currently makes on student loans and ending other college support programs which have not proven their effectiveness.  

The current system of financing higher education is unsustainable.  Student loan debt, which is not dischargeable in bankruptcy, now exceeds one trillion dollars—more than all the credit card debt in the country. The burden is felt disproportionately by lower and middle income families and is a severe drag on the desire of members of the Millennial Generation (born 1982-2003) to start a family, buy a house and have children. Furthermore, there is no historical precedent for placing such a burden on our youngest citizens.

Since the country’s founding, education has been a key component of the promise of upward economic mobility. This has been true in every era, beginning with the Northwest Ordinance setting aside land for one room schoolhouses to the institution of mandatory, free primary education in all states at the time of the Civil War. The expansion of educational opportunities continued in the 20th Century as our growing Industrial Age economy required workers with a high school education for our factories and offices. Government funds in every state and community were set aside to provide a free, public high school education for boys and girls to respond to these new demands. Later in the century, after WWII, the GI Bill of Rights and then the Higher Education Act 0f 1965 were enacted to further encourage college enrollment, thereby establishing the educational foundation for our rapidly expanding middle class. It is only in this century that we have asked a generation, Millennials, to self-finance the education they need, and our country needs, to be economically successful.

This wrong-headed inter-generational and economically disastrous policy needs to end before America loses its global competitive edge for good. The current system is creating a skills gap.

America needs to make Kalamazoo’s Promise a promise every American can count on and that can address the growing skills gap in many parts of the occupational spectrum.  By joining with the Democrats and Republicans, young and old, who are already supporting Redeeming America’s Promise’s plan to make college tuition free we can ensure that day arrives sooner rather than later.

Morley Winograd is co-author of the newly published Millennial Momentum: How a New Generation is Remaking America and Millennial Makeover: MySpace, YouTube, and the Future of American Politics and fellow of NDN and the New Policy Institute.

Graduation photo by Bigstock.

Composite Traffic Congestion Index Shows Richmond Best

$
0
0

It is important that traffic congestion be controlled sufficiently to facilitate a more competitive metropolitan economy. Each year, three organizations produce traffic congestion reports, Tom Tom, INRIX and the Texas Transportation Institute of Texas A&M University (TTI). These reports use  different methods to estimate the excess time lost in traffic congestion during peak travel periods (morning and evening week day "rush hours").   

The excess travel time is estimated relative to the travel time that would be expected if there were no congestion (if all traffic were free flowing). Economists caution that achieving free flow conditions at all times would require excessive investment. Yet, the standard metric used by the three indexes are useful for comparing the intensity of traffic congestion between metropolitan areas even without knowing the level at which economic efficiency is optimized.

There is generally strong correlation between the three indexes, though there are important differences. For example, the TTI report uses data from INRIX, yet agrees with INRIX on only six of the most congested 11 US major metropolitan areas (over 1 million population). The most substantial difference is in San Francisco, which INRIX (and Tom Tom) ranked as the second most congested major metropolitan area, far worse than the TTI ranking of 20th.

The findings from the three traffic congestion indexes are synthesized into a composite congestion index in this article. Because the TTI's latest index is 2011, composite index covers 2011 through 2013 (for methodology, see Note 1).

Worst Traffic Congestion in 2011-2013

The "10 worst traffic congestion" list includes some of the largest metropolitan areas, those with the highest urban population densities and a few smaller metropolitan areas with special traffic congestion inducing conditions (Figure 1).

Los Angeles has the worst traffic congestion in each of the three indexes (44.4% excess travel time). This is consistent with the now 30 year history of TTI, which has typically shown Los Angeles to have the worst traffic congestion. This is not surprising, since Los Angeles is the densest urban area in the nation, ahead of second place San Francisco by 10 percent and New York by 30 percent. Traffic congestion has been made worse by cancellation of planned freeways and freeway segments in the Los Angeles area, such as the Beverly Hills Freeway, the Slauson Freeway, the Reseda Freeway, the La Cienega Route 170 freeway, the South Pasadena "missing link" and others (Note 2).

Austin ranked second in traffic congestion (34.5%). This may be surprising, since Austin is not among the largest major metropolitan areas, though it is among the fastest growing. In the middle 1950s, when the final plans for the interstate freeway system were completed, Austin was much smaller and only a single interstate route was justified. Later, opposition to freeway development led to increased congestion. In more recent years the Austin freeway system has been augmented by new toll roads, though roadway improvements have not been sufficient to deal with the rapidly rising demand.

Not surprisingly, San Francisco (34.4%), with the second highest urban density among major metropolitan areas, ranked third in traffic congestion. New York (33.4%), with its higher than average density and dense core area ranked fourth in traffic congestion. Seattle ranked fifth (32.4%), despite its somewhat lower urban density. Seattle's long and relatively narrow north-south urban form and modest north-south freeway capacity is an important contributor to its intense traffic congestion. As in the case of Los Angeles, some planned freeways were canceled, which has also exacerbated traffic congestion.

San Jose is a smaller major metropolitan area, yet has the sixth worst traffic congestion in the nation (32.2%). There are two principal contributing factors, its proximity to much larger San Francisco and the third highest urban density of the major metropolitan areas, 10 percent above New York.

Washington (31.3%) and Boston (29.7%) have the seventh and eighth worst traffic congestion respectively. In each case, core areas have little freeway capacity (in part because of freeway cancellations in both cities).

Houston, which had the worst traffic congestion the nation during the middle 1980s, now ranks much better, at ninth (28.3%). Houston's improvement has occurred because of the roadway expansions opened concurrent with some of the fastest population growth in the high income world over the past three decades.

Portland, like San Jose and Austin is not among the larger major metropolitan areas. Yet Portland ranked 10th in traffic congestion (28.2%). Portland's policies, such as densification, have contributed to this; these include a cancelled freeway and a preference for light rail over highway capacity expansion. According to the TTI index, Portland has seen its peak period congestion ranking rise from 47th worst (out of 100) in the middle 1980s to 6th worst in 2011.

Least Traffic Congestion in 2011-2013

The major metropolitan areas with lower levels of congestion tend generally to be smaller and to have lower urban population densities (Figure 2).

Richmond is the least congested major metropolitan area in the nation (8.7%), and has experience growth since 2000 that is greater than average. Kansas City had the second least traffic congestion (10.9%), while nearly stagnant growth Rochester (11.5%) and Cleveland (12.9%) ranked third and fourth. Faster growing Salt Lake City ranked fifth (13.3%). Population losing Buffalo ranked sixth (13.5%) edged out seventh ranked and slow growing St. Louis (13.5%). Faster growing Oklahoma City ranked eighth (13.7%), while slower growing Memphis ranked ninth (14.1%). Indianapolis (14.4%), one of the few Midwestern metropolitan areas growing faster than average, has the 10th lowest traffic congestion level.

Traffic Congestion and Density

The connection between higher levels of traffic congestion and higher urban population densities has been documented in various analyses (also here). The traffic congestion index confirms that metropolitan areas with higher urban densities generally have more intense traffic congestion (Figure 3). Obviously, there are other factors that contribute to traffic congestion, not least the sufficient provision of highway capacity. This is evidenced by growing Dallas-Fort Worth and Phoenix, where state and local officials have provided substantial increases in highway capacity. Traffic congestion index shows Dallas-Fort Worth to have only the 16th worst traffic congestion and Phoenix to have the 33rd worst traffic congestion (out of the 52 major metropolitan areas). Greater employment dispersioncan also be an important factor. The data for each of the major metropolitan areas is in the Table.


Composite Traffic Congestion Index: 2011-2013
Excess Travel Time: Peak Periods
Rank  
1Los Angeles44.4
2Austin34.5
3San Francisco34.4
4New York33.4
5Seattle32.4
6San Jose32.2
7Washington31.3
8Boston29.7
9Houston28.3
10Portland28.2
11Miami27.8
12Chicago26.9
13Philadelphia25.8
14Atlanta25.7
15Denver25.3
16Dallas-Fort Worth23.7
17San Diego23.3
18Baltimore23.1
19Nashville22.9
20Minneapolis & St. Paul22.7
21Tampa-St. Petersburg22.6
22Charlotte20.9
23New Orleans20.5
24Orlando20.3
24Virginia Beach20.3
24Riverside-San Bernardino20.3
27Pittsburgh20.2
28Sacramento19.4
29Sacramento19.0
30Hartford18.7
31Cincinnati17.9
32Las Vegas17.7
33Phoenix17.2
33Detroit17.2
35Providence17.1
36Columbus16.8
37Milwaukee16.3
38Jacksonville15.7
39Birmingham15.2
40Raleigh14.9
41Louisville14.6
42Indianapolis14.4
43Memphis14.1
44Oklahoma City13.7
45St. Louis13.5
45Buffalo13.5
47Salt Lake City13.3
48Cleveland12.9
49Rochester11.5
50Kansas City10.9
51Richmond8.7
Derived from Tom Tom, INRIX and Texas Transportation Institute data


Traffic Congestion and Economic Growth

While there are different interpretations of the appropriate standard for traffic congestion, there is no question but that less traffic congestion benefits a metropolitan area's competitiveness. Because traffic congestion increases travel times, it necessarily reduces the share of a metropolitan area's (labor market) jobs that can be reached by the average employee. A considerable body of research associates greater access (measured in time) with improved economic performance and job creation.

-----

Note 1: The 2011 – 2013 index represents the average excess travel time estimate of the three sources. For each source, each metropolitan area's excess travel time is converted to a percentage of the metropolitan area with the worst excess travel time. These percentages are then averaged and the final excess travel time estimate is calculated by applying this percentage to the average worst excess travel time for the three sources. But these estimates are based on the TTI travel time index, and the peak hour excess travel time percentages from INRIX and Tom Tom (the Tom Tom figure is obtained by averaging data from the morning and evening peak period).

Note 2: I have a personal attachment to the Long Beach Freeway "missing link" in South Pasadena. In the early 1960s my great aunt and her husband were forced to sell their home taken to the California Highway Department for the imminent construction of the roadway. This was the beginning of a decades-long fight to keep the freeway from splitting the city of South Pasadena. In the early 1980s, as a member of the Los Angeles County Transportation Commission I was appointed to a special committee chaired by County Supervisor Peter F. Schabarum to make a final route selection between the Caltrans "Meridian" route and the South Pasadena preferred "Westerly Route." Our decision, the result of submittals and hearings, confirmed the Caltrans route, but did nothing to alleviate the South Pasadena opposition. Now, there is the possibility of building a tunnel, which would minimize surface disruption.

----

Wendell Cox is principal of Demographia, an international public policy and demographics firm. He is co-author of the "Demographia International Housing Affordability Survey" and author of "Demographia World Urban Areas" and "War on the Dream: How Anti-Sprawl Policy Threatens the Quality of Life." He was appointed to three terms on the Los Angeles County Transportation Commission, where he served with the leading city and county leadership as the only non-elected member. He was appointed to the Amtrak Reform Council to fill the unexpired term of Governor Christine Todd Whitman and has served as a visiting professor at the Conservatoire National des Arts et Metiers, a national university in Paris.

Photo: Richmond (major metropolitan area with the least traffic congestion) by CoredestayChiKai

America's New Industrial Boomtowns

$
0
0

David Peebles works in a glass tower across from Houston’s Galleria mall, a cathedral of consumption, but his attention is focused on the city’s highly industrialized ship channel 30 miles away. “Houston is the Chicago of this era,” says Peebles, who runs the Texas office of Odebrecht, a $45 billion engineering firm based in Brazil. “In the sixties you had to go to Chicago, Cleveland and Detroit. Now Houston is the place for new industry.”

With upward of $35 billion of new refineries, chemical plants and factories planned through 2015 for Houston and the surrounding Gulf Coast, companies like Odebrecht, which runs chemical plants and is working on a new freeway in the area, have converged on the nation’s oil and gas capital. They are part of the reason why the Texas metropolis ranks first on our list of the best large cities for manufacturing.

Houston, with 255,000 manufacturing jobs, is not yet the country’s largest industrial center; it still lags behind the longtime leaders Los Angeles, with 360,000 manufacturing jobs, and Chicago, home to 314,000. But it is clearly on a stronger trajectory. Since 2008, Houston’s manufacturing workforce has expanded 5% while Los Angeles has lost 13% of its industrial jobs and Chicago’s factory workforce has shrunk 11%.

View the Best Cities for Manufacturing Jobs 2014 List

Why Manufacturing Matters

Whether America is on the path to a sustainable industrial expansion or is just seeing a weak bounce back has been widely debated, but the recent numbers are impressive. Since 2010 the U.S. has added 647,000 manufacturing jobs. New energy finds have led to the construction and expansion of pipelines and refineries, and has sparked foreign industrial investment reflecting electricity costs that are now well below those in Europe or East Asia. Besides Houston, also ranking high on our big cities list are two other energy towns, No. 5 Oklahoma City and No. 10 Ft. Worth, Texas. Our mid-sized cities list is led by Lafayette, La., with nearby Baton Rouge in 11th place.

Evangelists of the “information economy” may think that industrial jobs are passé, as epitomized by a recent Slate article that recommended that working-class people from places like Detroit should move to areas like Silicon Valley or Boston where they can make money cutting the hair and walking the dogs of high-tech magnates. But the notion that U.S. manufacturing is doomed, and that the jobs are of lower quality than those in high-tech centers, is largely bogus; even in Silicon Valley the majority of new projected jobs are expected to pay under $50,000 annually. In contrast manufacturers pay above-average wages, in some cases due to unionization, but in many others because of the increasing sophisticated skills required by today’s factories.

Although we will likely never see a boom in factory employment on the scale experienced in the last century, the demand for blue-collar skills is projected to increase in future years. Among all professions for non-college graduates, manufacturing skills are most in demand, according to a study by Express Employment Professionals. By 2020, according to BCG and the Bureau of Labor Statistics, the nation could face a shortfall of around 875,000 machinists, welders, industrial-machinery operators, and other highly skilled manufacturing professionals.

Southern Comfort

Our research suggests that much of this growth will be in metro areas in the South and the Great Plains that are known for friendly business climates. New industrial investment is tending to go to places that are largely non-union, and feature lower taxes and light regulation. Epitomizing this trend is the No. 2 city on our large metro area list, Nashville-Murfreesboro-Franklin, Tenn., where manufacturing employment is up 6% since 2008. Nashville has become a hotbed for foreign investment in manufacturing, with the expansion of the Nissan facilities in nearby Smyrna, as well as a host of suppliers.

This is occurring, in part, because some large companies are shifting production to America from China in response to rising Chinese wages as well as sometimes unpredictable business conditions there.

Investment inflows, both from overseas and domestic companies, have boosted other standout southern industrial hubs, as well as the smaller metro areas on our mid-sized city list, notably Mobile, Ala. (third place), with its expanding industrially oriented port, and No. 14 Charleston-North Charleston-Summerville, S.C., which has been a beneficiary of major new foreign investment as well as the expanded presence of U.S. aerospace giant Boeing. The South also is home to our No. 1 small manufacturing city, Florence-Muscle Shoals, Ala.

The Resurgence of the Rust Belt

The progress is not confined to the Sun Belt. The resurgence of the U.S. auto industry has revived the economy of Warren-Troy-Farmington Hills, Mich., also known as “automation alley.” The home to many parts suppliers, engineering and tech support for the car industry, this area has enjoyed an impressive 12.7 percent growth in manufacturing jobs since 2008, placing it third on our big cities list.

Detroit, the center of the auto industry, ranks a respectable 16th on our big city list, but the big improvements in the Rust Belt are occurring in mid-sized cities such as Lansing-East Lansing, Mich. (eighth), Grand Rapids (ninth) and Ft. Wayne, Ind. (10th).

But arguably the strongest Rust Belt recovery has occurred in Elkhart-Goshen, Ind., third on our small cities list. Since 2008 Elkhart’s industrial employment — much of it in the recreational vehicle industry — has expanded 30%, one of the most dramatic employment turnarounds of any place in America. Unemployment has fallen to 5% from a recession high of 20.2%.


Western Exposure

The South and the Great Lakes may be America’s industrial heartland, but there are several strong pockets in the West. One region that is doing particularly well is the Pacific Northwest, led by Seattle-Bellevue-Everett, which has experienced 11% manufacturing employment growth since 2010.

Boeing is key here, but the Pacific Northwest’s industrial expansion has also been fueled by low electricity rates, largely due to the area’s strength in hydroelectricity. Portland-Vancouver-Hillsboro OR-WA (11th) is usually associated more with hipsters, but manufacturing growth has taken off, particularly with the expansion of Intel’s large semiconductor facility in suburban Hillsboro.

Another Western industrial hotspot is Utah, a state with low energy costs and business friendly regulation. Salt Lake City, 12th on our large metro area list, has enjoyed a 5.7% increase in industrial jobs since 2010. Growth has been even stronger in two other Utah cities, Provo -Orem and Ogden-Clearfield, which rank fifth and seventh, respectively, on our mid-sized cities list.

One surprising place where manufacturing is making a mild comeback is in the Bay Area, which for years has exported high-tech manufacturing jobs to places like Utah as well as the rest of the world. Despite ultra-expensive electricity, high labor costs and some of the world’s most demanding environmental laws, San Jose (13th on our big metros list) San Francisco-San Mateo-Redwood (15th) have posted solid industrial growth after years of decline. Yet both remain below their 2008 levels, and may find new growth difficult once the current tech bubble collapses.

Laggards

Two of the worst performers on this list are the big metro areas that have for decades been the country’s largest industrial hubs, Los Angeles-Long Beach-Glendale (55th) and Chicago-Joliet-Naperville (56th). It appears they lack the cost competitiveness and specialized focus of America’s ascendant industrial regions.

Another clear loser is the Northeast, which accounts for seven of the eight lowest ranked big metro areas. Since 2008, Philadelphia (62nd) has lost 21% of its once-large industrial job base, while New York City, which has been losing industrial jobs for decades, ranks 45th. Here, too, high costs and regulation are a factor, as well as the loss of industrial know-how resulting from long-term erosion of their manufacturing bases.

Of course, some information age enthusiasts may argue that losing such jobs is something of a badge of honor, since “smart” regions do not focus on the gritty business of making things. Yet if you look across the country, you can see that many of the strongest local economies, from Houston and Nashville to Seattle, have taken part in the U.S. industrial resurgence. It seems this is one party more worth joining than avoiding.

View the Best Cities for Manufacturing Jobs 2014 List

This article first appeared at Forbes.com.

Joel Kotkin is executive editor of NewGeography.com and Distinguished Presidential Fellow in Urban Futures at Chapman University, and a member of the editorial board of the Orange County Register. He is author of The City: A Global History and The Next Hundred Million: America in 2050. His most recent study, The Rise of Postfamilialism, has been widely discussed and distributed internationally. He lives in Los Angeles, CA.

Houston skyline photo by Bigstock.

Is Brazil Still the Country of the Future?

$
0
0

Not long ago, Brazil was riding high. It was feted as one of the “BRIC” nations destined to be the next world economic powers. The commodities boom had its natural resources and agricultural sectors humming. The press – for example, Monocle magazine’s swooning over Brazil’s push to boost its diplomatic presence – was adoring. And Rio was awarded the 2014 World Cup and the 2016 Olympics, two events that were intended to both serve as a catalyst for further development, and also as a coming out party of sorts for the country.

The World Cup is underway, but otherwise things haven’t quite worked out as Brazil thought they would. The average citizen of the country is upset at the vast sums being spent on international events that don’t benefit them. The last two years have featured riots, strikes, and various other expressions of unrest. Economic growth in the country has collapsed. In a special section last September, the Economist asked, “Has Brazil Blown It?

Late last month the McKinsey Global Institute issued a major report on the country called “Connecting Brazil to the World: A Path to Inclusive Growth.” At 104 pages, it’s massive, but a must read for anybody interested in South America’s giant.

And it’s a somewhat depressing read as well. Though there are immense strengths and opportunities for the future, Brazil has big problems too, most of them longstanding, and which hobble its aspirations.

Brazil is the 7th largest economy in the world and the 7th leading destination for foreign direct investment. But it’s 95th in per capita GDP, 114th in the quality of its infrastructure, and 124th in its level of ease in trading across borders. Its export sector is also heavily commodity dependent, particularly oil. Ranked only 43rd in global connectedness on McKinsey’s index, they estimate a potential boost of 1.25% (presumably percentage points) to annual GDP growth from improvements on that measure alone.

Three particular items jumped out at me from the study. One is the “custo Brasil” – the Brazil cost, so notorious it gets its own Wikipedia entry. A variety of factors from bureaucracy to the tax regime to an uncertain legal climate, poor infrastructure, crime, and corruption make the cost of doing business in Brazil very pricey indeed.

The second is the very low rate of investment in the economy. Brazil’s gross investment rate as a percentage of GDP is 18%, compared with 26% in Chile, 29% in Mexico, 40% in India, and 49% in China. Conversely, government consumption is at 22% in Brazil vs. 12% in Chile and Mexico, 13% in India, and 14% in China. Private consumption is similar in the countries except for China, which is notably lower. This probably helps explain the poor state of the infrastructure in the country.

The third is something I have personal experience with, namely protectionist trade barriers designed to create and sustain domestic industries in sectors like autos and computers. I suspect these rules were modeled on Japan, and more lately China, which used rules and business practices to build successful local champions. But in Brazil this has rendered its industry sclerotic. In effect, cars sold in Brazil have to be made in Brazil, ditto for computers, etc. This is where my personal experience comes in. When we were doing global PC procurement, Brazil was always a special case and our vendors had to have special Brazil made PCs for domestic use. This may not be an actual rule, but tariffs produce a de facto barrier. While this technique may have worked in Japan, it’s clear that it failed in Brazil. As the exception that proves the rule, McKinsey uses the example of regional jet manufacturer Embraer as a counterfactual. That company was privatized and opened to global competition. The result is that its got tough itself and is now an industrial champion for Brazil.

There are tons of statistics in the study that are worth scanning just to see. Brazil is consistently benchmarked against Chile and Mexico in Latin America, as well as fellow BRICs India and China. The comparisons aren’t pretty.

Reading a lot about the country in the last year, I put its problems into three categories: poor governance, geographic disadvantage, and scale disadvantage.

1. Poor Governance

Most of the issues pointed out by McKinsey fall squarely under the heading of poor governance. The contrast with nearby Chile could not be more plain across every dimension: corruption, the rule of law, investment, public sector debt, tax burden, infrastructure, regulation, etc.

Latin America seems to prefer two sorts of governments these days. One is a right wing nationalist heir to the military juntas of the past, best exemplified by the Kirchner regime in Argentina. The other are left wing populist-nationalist movements like Venezuela that tend to feature a streak of anti-Americanism. Both of these have produced pitiful results.

Brazil is a sort of lite version of the latter. Lula da Silva was a charismatic labor activist who led strikes and was jailed by the previous military dictatorship in his youth. Post-democratization, he went into politics. After moderating some of his more radical views, he was elected president on a reform agenda. While he had some success and was arguably and improvement on his predecessors, he ultimately failed to deliver on material changes in governance. His hand picked successor Dilma Rousseff has not been as effective and is in an electoral struggle for another term.

In line with the nationalist streak of this governing type, one of Da Silva’s primary concerns was Brazil’s amour-propre. As one of the world’s largest countries, he found it self-evident that Brazil should be treated as a great power. He lobbied for Brazil to have a permanent seat on the UN Security Council. He and others responded in kind to any affront to the nation’s pride, such as requiring American and only American visitors to be finger printed after the US imposed a fingerprinting requirement on foreign visitors. He sought out diplomatic coups where ever he could find them, which included cozying up to unsavory characters like Mahmoud Ahmadinejad who thinks Israel should be destroyed and that Iran has no gays (presumably because he has them executed when he can find them).

Da Silva forgot that there’s more to being a great power than being a big country – you’ve got to earn it. And as a very popular politician he did not seize his moment of opportunity to truly grasp the nettle of reform.

Meanwhile nearby Chile is one of the Latin American governments that’s followed a different model. It’s been run by center-left governments more or less the entire time since the restoration of democracy, and they’ve delivered on a good governance model that has taken them to effectively developed country status. Chile is now even a member of the OECD. Chile is basically the Minnesota of Latin America, and the results demonstrate it. This should show Brazil the size of the prize if the get their act together.

2. Geographic Disadvantage

Brazil is simply a long way from major developed markets. This puts it at a geographic disadvantage versus many other countries. Current airplanes cannot make a non-stop flight from Brazil to East Asia, arguably the most important emerging part of the world. It’s even a long haul from the United States, with relatively few gateway cities vs. say major European capitals. Brazil is time-zone advantaged with the US, however. It also speaks Portuguese instead of Spanish, which imposes a linguistic handicap.

3. Scale Disadvantage

Brazil is a big country, geographically and in population. Size can be an advantage, but it also makes reform difficult as it’s hard to turn a battleship. Brazil’s population of 200 million is more than ten times that of Chile.

Brazil’s two principal cities, São Paulo and Rio de Janeiro, are also megacities. São Paulo in particular is huge, and at north of 20 million people (more than the entire country of Chile) is the 10th largest city in the world. I recently wrote that it’s unlikely the world’s emerging megacities will turn the corner in eliminating dysfunction. Their problems are just too huge and their national growth rate too low. Though I’d consider this more hypothesis than conclusion at this point, my rule of thumb is that a megacity can only achieve escape velocity from pervasive dysfunction if they are a major city in a country that is the world’s current rising economic (or historically imperial) power.

Brazil is not that country, and two mega cities will be a drag on growth. Although São Paulo is an important emerging global city – 23rd in the world in a forthcoming report I helped create – I’m told that both São Paulo and Rio are growing more slowly than secondary cities in the country. A previous McKinsey study threw cold water on the idea that megacities are an advantage, noting their under performance by saying:

It is a common misperception that megacities have been driving global growth for the past 15 years. In fact, most have not grown faster than their host economies, and MGI expects this trend to continue. Today’s 23 megacities—with populations of 10 million or more—will contribute about 10 percent of global growth to 2025, below their 14 percent share of global GDP.

In contrast, 577 middleweights—cities with populations of between 150,000 and 10 million, are seen contributing more than half of global growth to 2025, gaining share from today’s megacities.

So I’m not surprised that it’s Curitiba, not one of the megacities, that’s where the innovative BRT revolution was begun. If I were looking to invest in Brazil, I’d be looking at this next tier of cities. Nor is it surprising that Santiago, Chile (population 5.4 million) has had great success in modernizing given its more moderate size.

Plain and simple the degree of difficulty is higher in Brazil because of the size.

Brazil is also a very racially diverse country with a number of challenges resulting from its history of oppression. Brazil had more slaves than any other country in the world and was the last New World colony/nation to abolish it. If slave reparations are on the agenda in the United States, how much more so similar issues in Brazil? Again, contrast with Chile, which never had very many slaves and abolished slavery in 1818. With the exception of a relatively few indigenous peoples on reservations, Chileans largely perceive themselves as ethnically homogenous, though with some skin tone based status (moderately sized…historically racially homogenous…Minnesota?)

Which is to say that it’s tough to entirely fault Brazil for not living up to the example of Chile. Its degree of difficulty is much higher. And its geography hamstrings its global interaction.

Nevertheless, solving the governance challenges to address the real issues Brazil faces remains the top agenda item. McKinsey has laid out a number of good suggestions, the real question is whether or not Brazil’s socio-political system can produce the ability to implement them.

Aaron M. Renn is an independent writer on urban affairs and the founder of Telestrian, a data analysis and mapping tool. He writes at The Urbanophile, where this piece originally appeared.

Photo: Ponte estaiada Octavio Frias - Sao Paulo by Marcosleal

European Style Going Out of Fashion at Ballot Box

$
0
0

The recent political earthquake in Europe has great implications for the United States, both internationally and domestically. The unpopularity of European Union institutions produced record-breaking votes for a motley assortment of anti-establishment parties across the Continent, suggesting it’s time to stop looking across the Atlantic for role models as Europe’s dismal prospects have inspired the lowest levels of political support in several decades.

Many of the parties that did best in the May 25 multinational balloting for the European Parliament – from Greece’s Far Left Syriza party to Britain’s oddball United Kingdom Independence Party and France’s historically racist National Front – are hardly ideal candidates for responsible governance. Yet, despite their many blemishes, these and other anti-EU parties fed on growing distaste for the 28-nation EU’s sprawling, largely unaccountable bureaucracy blamed for, in the words of one British group, “undermining” liberal democracy in these countries.

This suggests that it’s time for Americans to stop looking across the Atlantic for role models. For decades, American gentry liberals have seen the EU as a superior mode of governance. Jeremy Rifkin’s 2005 book, “The European Dream” – and a host of similar tracts that all assert European superiority – now may seem absurd on their faces, but it’s doubtful many EU boosters, here and abroad, will let facts get in their way.

The Urge to Merge

The bigger loser in the May elections was the notion that more concentration of power leads to better results. Many American intellectuals and policy wonks favor handing ever-greater control to the “best and brightest” who run academia, much of the media and the bureaucracy. Figures, such as former Obama budget adviser Peter Orszag and New York Times columnist Thomas Friedman, argue that power should shift from naturally contentious elected bodies – subject to pressure from the lower orders – to credentialed “experts” operating in Washington, Brussels or the United Nations. This notion suggests the popular will is too lacking in scientific judgment and societal wisdom to be trusted with real authority.

Yet, as the EU parliamentary elections suggest, people object to having details of their lives controlled from a great distance. Beyond the Right, many on the Left also nowoppose the Brussels-based EU for imposing austerity measures on several struggling economies. The British website Socialist Alternative saw the vote not just as a shift to the right but “a revolt against the capitalist establishment,” which remains, like the bureaucracy and media, devotedly pro-EU.

In the United States, there is also mounting resistance to centralization. The 2010 congressional elections reflected a reaction to attempts by President Obama and his Democratic Party to put more of our lives under Washington’s control. Even now, less than two years after the president’s re-election, opposition to an extended federal role is, if anything, even stronger. Less than one in five Americans trust the federal government, and barely two in five see it as even capable of reversing the inequality. There may be a groundswell of support for the social democratic goals of the Great Depression’s New Deal, but likely not for the reimposing of its highly centralized policy prescriptions.

Energy and Economy

Pundits, such as the New York Times’ Paul Krugman, routinely describe Europe’s approach to economic, environmental and social policy as far more enlightened than that in the U.S. Wherever possible, progressives push European style in areas such as energy, with strong attempts to force a rapid conversion to “green” energy.

Yet, there’s not much to cheer for in Europe’s energy policy. The attempt to turn the Continent into a renewable-energy superpower has been hampered by soaring prices. The policy has increased dependence on unreliable and expensive renewable power – as well as Russian natural gas – forcing some European countries, including Germany, to boost their use of coal, certainly not much of a victory against climate change.

Ultimately, the consequences of high energy prices tend to fall, as they do here, on the middle and working classes, who see their electricity bills soar, along with the cost of gasoline. Some Europeans, in fact, may see their jobs threatened as employers look for lower-cost alternatives, including moving to energy-rich parts of the USA.

Addressing Inequality

In seeking out economic models that promote greater equality and upward mobility, many pundits look to Europe as a model. French economist Thomas Piketty’s influential book, “Capital in the Twenty-First Century,” argues that the only way to confront increasing income inequality and prevent deeper social fracturing is to expand the “social state” that forcibly redistributes wealth. In his mind, economic growth, traditionally a prime source of social uplift, is little more than a “illusory” solution.

Like many American progressives, Piketty looks to governmental action as the sole force for greater equality. Financed by taxes on wealth, the “social state” would curb the rich, but would also empower the bureaucracy and other parts of the rising clerisy with unprecedented power.

Yet recent European experience also provides little support for the benefits of redistribution, given the persistently high rates of unemployment across most of the EU. This is particularly true for much of the Continent’s youth, who are widely described as “the lost generation.”

Just as in the United States, pervasive inequality and limited social mobility have been well documented in larger European countries, including France, which has among the world’s most evolved welfare states. This is true even in historically egalitarian Sweden, where, over the past 15 years, the gap between the wealthy and other classes has increased four times more rapidly than in the United States. As Europe’s population ages, and its economies stagnate, demands for redistribution may well increase, but the ability to pay will surely decline.

Issue of Immigration

Concern over immigration has been a key driver in mounting anti-EU sentiment. Immigration has always been a more contentious issue for Europeans, who generally belong to a single ethnic group and prefer something closer to homogeneity than to the kind of rolling ethnic evolution that characterizes the United States. This nativism has been painfully evidenced in recent decades in from everything from the violent breakup of Yugoslavia and the far more civilized dismantling of Czechoslovakia to France’s recent campaign against the Roma, Catalonia’s attempts to divorce from Spain, and even the upcoming vote on Scottish independence from the United Kingdom.

During the boom times of the 1950s and ’60s, many European countries – France, Germany, Netherlands and the U.K. – invited hundreds of thousands of foreign workers, many from outside Europe. But with European labor markets far weaker, such an infusion seems to many middle- and working-class voters as a threat to their economic futures as well as to their identities.

Immigration played a role in UKIP’s victory in Britain’s voting for European Parliament.Diversity in London, by some counts home to the world’s largest concentration of immigrants, thrills London’s media and business communities but stirs resentment, particularly among more working- and middle-class voters. The fact that as many as 87 percent of new jobs generated in the recovery go to immigrants has not warmed their sentiments.

Future of the ‘nation-state’

As we look to how to reform our own less-than-perfect union, adopting the European approach seems, at best, misguided. One does not have to share the Tea Party’s reflexively hostile view of government to see that attempts to expand control from Washington could, in the long run, create the very stagnation and often-ugly political reactions that we see in Europe today.

More to the point, the drift toward an EU-like state works against the very structure of the American political community, designed to disperse power among various levels of government and varied constituencies. The tendency of administrations to rule through executive orders, or regulatory agencies, has been growing, particularly during the Obama years; a centralized state also could pose a threat to progressive Americans and their values under conservative rule.

For America, this may be the biggest takeaway from Europe’s crisis. Our political culture, for all its problems, was designed to allow localities greater leeway in determining their own fates. There are many areas – water, air quality, arterial road infrastructure – that require cooperation along regional lines, but, for the most part, the best approach, whenever possible, is to allow localities to control their fates. It is a decentralized, bottom-up system that, for the most part, has performed far better over time than the dysfunctional blunderbuss that is the European Union.

This article first appeared in the Orange County Register.

Joel Kotkin is executive editor of NewGeography.com and Distinguished Presidential Fellow in Urban Futures at Chapman University, and a member of the editorial board of the Orange County Register. He is author of The City: A Global History and The Next Hundred Million: America in 2050. His most recent study, The Rise of Postfamilialism, has been widely discussed and distributed internationally. He lives in Los Angeles, CA.

Viewing all 3794 articles
Browse latest View live


Latest Images