Quantcast
Channel: Newgeography.com - Economic, demographic, and political commentary about places
Viewing all 3795 articles
Browse latest View live

Special Report: America's Emerging Housing Crisis

$
0
0

This is the executive summary from a new report, America’s Emerging Housing Crisis, published by National Community Renaissance, and authored by Joel Kotkin and Wendell Cox. Download the report and the supplement report below.

From the earliest settlement of the country, Americans have looked at their homes and apartments as critical elements of their own aspirations for a better life. In good times, when construction is strong, the opportunities for better, more spacious and congenial housing—whether for buyers or renters—tends to increase. But in harsher conditions, when there has been less new construction, people have been forced to accept overcrowded, overpriced and less desirable accommodations.

Today, more than any time, arguably, since the Great Depression, the prospects for improved housing outcomes are dimming for both the American middle and working classes. Not only is ownership dropping to twenty-year lows, there is a growing gap between the amount of new housing being built and the growth of demand.

Our still-youthful demographics are catching up with us. After a recession generated drought, household formation is again on the rise, notes a recent study by the Harvard Joint Center for Housing Studies. In some markets, there isn’t an adequate supply of affordable housing for the working and middle classes. Overall, according to the research firm Zelman and Associates, the country is building barely one-third the number needed to meet the growth in households. Overall inventories of homes for sale are at the lowest level in eight years.

The groups most likely to be hurt by the shortfall in housing include young families, the poor and renters. These groups include a disproportionate share of minorities, who are more likely to have lower incomes than the population in general. This situation is particularly dire in those parts of the country, such as California, that have imposed strong restrictions on home construction. California’s elaborate regulatory framework and high fees imposed on both single- and multi-family `housing have made much of the state prohibitively expensive. Not surprisingly, the state leads the nation in people who` spend above 30 percent, as well as above 50 percent, of their income on rent.

Sadly, the nascent recovery in housing could make this situation even more dire. California housing prices are already climbing far faster than the national average, despite little in the way of income growth. This situation could also affect the market for residential housing in other parts of the country, where supply and demand are increasingly out of whack.

Ultimately, we need to develop a sense of urgency about the growing problem of providing adequate shelter. As a people we have done this many times — with the Homestead Act, and again, after the Second World War, with the creation of affordable “start-up” middle- and working class housing in places like Levittown (Long Island), Lakewood (Los Angeles), the Woodlands (Houston) and smaller subdivisions, as well as large scale cooperative apartment development in places like New York. Government policy should look at opportunities to create housing attractive to young families, which includes some intelligent planning around open space, parks and schools. It is important to ensure that a sufficient supply of affordable housing is allowed throughout metropolitan areas, for all income groups.

Nothing speaks to the nature of the American future more than housing. If we fail to adequately house the current and future generations, we will be shortchanging our people, and creating the basis for growing impoverishment and poor social outcomes across the country.

Joel Kotkin is executive editor of NewGeography.com and Distinguished Presidential Fellow in Urban Futures at Chapman University, and a member of the editorial board of the Orange County Register. He is author of The City: A Global History and The Next Hundred Million: America in 2050. His most recent study, The Rise of Postfamilialism, has been widely discussed and distributed internationally. He lives in Los Angeles, CA.

Wendell Cox is principal of Demographia, an international public policy and demographics firm. He is co-author of the "Demographia International Housing Affordability Survey" and author of "Demographia World Urban Areas" and "War on the Dream: How Anti-Sprawl Policy Threatens the Quality of Life." He was appointed to three terms on the Los Angeles County Transportation Commission, where he served with the leading city and county leadership as the only non-elected member. He was appointed to the Amtrak Reform Council to fill the unexpired term of Governor Christine Todd Whitman and has served as a visiting professor at the Conservatoire National des Arts et Metiers, a national university in Paris.


Stop Favoring Investors, Speculators over Middle Class

$
0
0

I, like most members of the middle class, particularly in California, just paid a tax bill that seemed less like my fair share than a shakedown by the Mafia. Increasingly, for people who run small businesses or earn a decent income, the tax bite is becoming ever more like in Europe, with total bills in high-tax states like ours reaching upward of 40 percent. It’s like paying the bill for a big dinner without eating the food – we get hammered like Swedes but without the free education, health care and other benefits of a more conventional welfare state.

Most galling is that, while the middle class has endured ever-higher taxes, those who have benefited most from the Bernanke-Obama “recovery” continue to get the biggest tax breaks. This is largely the investor class, who have been able to reap the benefits of the stock-market boom and, in some areas, including coastal California, the steep rise in real estate prices.

Of course, the rich and corporations have all sorts of ways to avoid taxation – like offshore accounts – but the real class divider is capital gains. Today, long-term capital gains are taxed at the federal level at a maximum 20 percent, while the small-business owner, writer, consultant or professional, if they do relatively well, are stuck with income tax rates up to 39.6 percent, approaching twice that level.

Generation gap

Overall, you don’t have to be super-rich to be hit. The portion of the tax burden absorbed by the top 20 percent of earners has grown – a California family with an income of $150,000 would qualify – from 65 percent to 90 percent. Even worse off are younger families, which generally have less to invest and have been stuck with a tepid job market; from 2007-10, households of people under age 40 have seen their net worth drop, while older Americans have now recovered most of their losses from the economic downturn.

In the past, this differential in tax rates often was furiously justified – usually by conservatives – as sparking investment and job creation that would benefit younger and poorer Americans. This argument is increasingly specious; the recent massive stock-market boom has been characterized by relatively low investment in plant and equipment, meager job growth and, by the way, ever-increasing inequality. In 2009, due largely to lower taxes on capital gains, the 400 highest-earners, with gross incomes above $200 million, paid an effective tax rate well below even those in the top 1 percent, which includes many small-business owners and professionals.

Defenders of the tax break will also cite “democratic capitalism” and point out the fact that so many people depend on the stock market. But, in reality, stock market capitalism is becoming less democratic: Stock ownership has become more concentrated, with the percentage of adults Americans owning stock the lowest since 1999 and a full 13 points lower than in 2007.

Depression-era inequality

As the hard-pressed middle class has withdrawn from the market, due to mistrust or lack of resources, the very rich have been having a veritable feast. To be sure, the top 10 percent gained half of all reported income, but the top 1 percent accounted alone for halfof that. This is one reason why inequality is now greater than at any time since the Great Depression.

Increasingly, then, the benefits of the plutocratic tax break are ever more thinly shared. I am sure we all are happy that when the 50 or so lucky insiders at WhatsApp collect their $19 billion from Facebook, they will pay taxes on that windfall at well below the rates paid by the salaried upper-middle class professional or small-business owner. Yet their product, although no doubt cool, is unlikely to produce many jobs, or even boost productivity.

The biggest beneficiaries, besides the insiders, will be sellers of luxury homes and vehicles, and the high-end restaurants and shops in the already saturated, overpriced Silicon Valley market.

Where’s the left?

Clearly, something needs to change, and, ironically, one wonders where the class warriors of the Left are on this. They have become increasingly bold (or honest) in stating that we should continue raising taxes on the middle and upper-middle classes, as a recent New Republic piece suggests, but seem less than vehement about equalizing taxes on capital gains and other income.

This may have something to do with the shift in backing for “progressive” causes coming from the very people – Wall Street traders, venture capitalists and tech executives – who benefit most from the capital gains scam. The confluence of big money and populist rhetoric is epitomized by New York’s powerful senior senator, Charles Schumer, who has made a career of both raising money from Wall Street financiers and defending preferential treatment for their outsized profits. Their growing power over the party of ever-expanding government leaves only one place to finance Democrats’ ambitious plans – the middle and upper-middle classes.

I don’t hold all that much hope that reform will be pushed by most Republicans either, since they for far longer have been the party of accumulated wealth. But, as far as I can see, it is mainly conservatives, such as retiring Congressman Dave Camp, who seem ready to embrace the notion that taxes should be equalized between income and investment within the context of a flatter revenue system.

SPotty support

But too many Republicans remain in love with lower taxes on investment, with some conservatives placing a similar faith in the positive effects of low capital gains as progressives do on the need don hair shirts to reverse global warming. Rand Paul’s proposal for a flat tax addresses some of these ideas, although Paul still seems to think capital gains should be taxed at a lower rate than normal income. This proposal may be better than the current system, but progressives rightly predict it would not address the fundamental inequality in the tax code.

All this is distressing, given that it is clearly time to reform the tax code to stop favoring investors and speculators over middle-income earners. This may prove the best way to slow the dangerous accumulation of financial assets by the few, notes author Charles Morris. He also adds that such reform could have many positive effects on the economy. Cutting the top 1 percent’s share of Americans’ total income to 14 percent or 15 percent, still higher than the pre-1980 norm, he calculates, could allow us to spend about $1 trillion for middle-class tax relief, relief for the poor, health care, education and infrastructure.

The need to jettison the capital-gains advantage has also been endorsed by Larry Summers, former Treasury Secretary under President Clinton and a former Obama adviser. Even Bill Gross, the head of Newport Beach-based bond giant Pimco, has suggested that, given the perverse effects of the tax system, that capital gains income should now be taxed at the same rate as regular income. Gross admits his investors did not like the idea since such changes are not in their immediate financial interest.

With some leading conservatives, business leaders and liberal economists on board, perhaps this is still an idea whose time has come. Clearly, the current tax regime is not working, having just created a shallow “recovery” largely enjoyed primarily by the very richest members of society. It is time for people on both right and left to admit that such a recovery is not socially sustainable or congruent with the fundamental notion of democracy. It is time to reform the tax code, so that it works not only for the rich and well-placed, but the rest of us, as well.

Joel Kotkin is executive editor of NewGeography.com and Distinguished Presidential Fellow in Urban Futures at Chapman University, and a member of the editorial board of the Orange County Register. He is author of The City: A Global History and The Next Hundred Million: America in 2050. His most recent study, The Rise of Postfamilialism, has been widely discussed and distributed internationally. He lives in Los Angeles, CA.

Wall Street bull photo by Bigstockphoto.com.

Tambora vs. Krakatoa: Which was Worse?

$
0
0

An April 27 Wall Street Journal book review by Simon Winchester descends into a petty squabble about whether the volcanic eruptions on Mount Tambora (1815) and Krakatoa (1883), both located in Indonesia, was more significant. After a few positive paragraphs reviewing Gillen D'Arcy Wood's Tambora: The Eruption That Changed the World, Winchester takes exception to Wood's comparison of the Tambora eruption with that of Krakatoa. Winchester writes:

"I have one argument. Mr. Wood's intention in writing the story of Tambora, in time for its bicentenary, is to stake the eruption's claim for global primacy—to knock Krakatoa off its long-held pedestal. The celebrity of [Krakatoa's] more modest eruption in 1883 seems undeserved,' he writes. 'Only the historical accident of the telegraph's invention allowed news of it to travel instantly across the world.'"

Which is the More Significant?

Winchester introduces his defense of Krakatoa, admitting that he has a "dog in the fight," as author ofKrakatoa: The Day the World Exploded: August 27, 1883. He claims that Krakatoa "was the biggest volcanic explosion in what one may call fully recorded human history." He then spends a third of the article seeking to prove that the Krakatoa eruption was the more significant than that of Tambora.

Winchester describes the Krakatoa eruption and how the rapid communications that had recently become available amplified its significance in  the decades that followed. He points out that there were more than 40,000 fatalities and that Krakatoa generated the most extensive tsunami ever generated by a volcano. Finally, he claims that Krakatoa "contributed to the creation of the Republic of Indonesia."

I have long asked the same question that Woods poses and concluded that history had slighted Tambora. So, I spent some time the other evening reacquainting myself with the subject, using Internet sources (such as Wikipedia), which do not rise to academic standards, but certainly paint a picture supporting Woods' position.

As for the 40,000 fatalities, there appears to be no question but that fatalities from Tambora were nearly twice as great. It is not really surprising that Krakatoa is a more extensive tsunami than Tambora, since Krakatoa was a fairly modest mountain (less than 3,000 feet or 1,000 meters) sitting in the Sunda Strait between Java and Sumatra. Much of the volcano collapsed into the sea, which will obviously produce a larger tsunami than when the mountain is at least 10 miles (16 kilometers) from the sea and principally collapsed upon itself, rather than the sea.

The claim that the Krakatoa eruption was instrumental in creating the Republic of Indonesia is bizarre. Krakatoa surely did not provide any incentive to the Dutch to rule longer, or for the Indonesians to extend colonial rule. Indonesia was among the first to shake off colonialism following World War II (1945). Nor is it likely that an unexploded Krakatoa would have advanced independence to before the War.

Fully Recorded History as of 1981: St. Helen's Exceeds Krakatoa

Winchester overreaches in noting that Krakatoa was the "biggest volcanic explosion "in

fully recorded human history." Fully recorded human history is in the eye of the beholder. Yet, the Krakatoa eruption was not recorded by motion pictures or video, which were not yet invented and did not thus occur in "fully recorded history" as we know it.

For example, in 1981, a few months after Washington's Mount St. Helen's blew its side out, it would have been fair to characterize its 1980 eruption as being more significant than Krakatoa, by virtue of having been captured on video (and thus in "fully recorded history” at them time). Certainly, scientists have learned much from Mount St. Helens. However, its greater significance due to its capture on video was a function of technology, not volcanism.

Tambora's Significance

By any measure, Tambora was a substantially larger volcanic eruption that Krakatoa. It is Volcanic Explosive Index (VEI) was 7, the only confirmed rating of that intensity since the Lake Taupo eruption in New Zealand 1,600 years before. By comparison, Krakatoa earned a VEI of only 6. Further, Tambora spewed a far greater volume, at 38 cubic miles (160 cubic kilometers). By comparison, Krakatoa's volume was less than one-third that of Tambora, at 11 cubic miles (45 cubic kilometers). Both ejected far greater volumes than the 1980 eruption of Mount Saint Helens (less than one quarter cubic mile or one cubic kilometer), which had a VEI of 5.

Moreover, Tambora set off the "year without summer" in 1816, when a June snow storm dumped six to twelve inches (15 to 30 centimeters) on northern New England and snow drifts of two feet (60 centimeters) in the ville de Quebec.

Indonesia's Disasters

Interestingly, neither the Tambora nor the Krakatoa eruption ranks as the largest in Indonesian history (or perhaps more properly, pre-history). The Lake Toba eruption on Sumatra occurred 75,000 years ago and is reputed to have been the most intensive in the world in the last 2 million years. Lake Toba ejected approximately 675 cubic miles (2,800 cubic kilometers) of material. This is 17 times the Tambora volume and more than 60 times the Krakatoa volume. But none of the three killed as many people (230,000) as the Boxing Day tsunami (December 26, 2004), which was set off by a 9.0 earthquake off Sumatra. Population had exploded between 1883 and 2004, which drove the Boxing Day tsunami fatalities far above those of the Krakatoa tsunami.

Tambora v. Krakatoa: Volcanism v. Telecommunications

Winchester confuses technology with history. Woods is exactly right. But for the historical accident of the telegraph, Krakatoa might have been as largely forgotten, not unlike another VEI-6 event --- the 1912 Novarupta volcanic eruption in Alaska. Had the telecommunications of 1815 been equal to those of 1883, no one would remember Krakatoa. Telecommunications explains its prominence, not volcanism.

-----------------

Wendell Cox is principal of Demographia, an international public policy and demographics firm. He is co-author of the "Demographia International Housing Affordability Survey" and author of "Demographia World Urban Areas" and "War on the Dream: How Anti-Sprawl Policy Threatens the Quality of Life." He was appointed to three terms on the Los Angeles County Transportation Commission, where he served with the leading city and county leadership as the only non-elected member. He was appointed to the Amtrak Reform Council to fill the unexpired term of Governor Christine Todd Whitman and has served as a visiting professor at the Conservatoire National des Arts et Metiers, a national university in Paris.

Photo: Tambora: Depiction of 1815 Eruption (from http://cdn-2.vivalascuola.it/o/orig/scienze-classificazione-vulcanica_b2a5e9a592a9ff2585850e6b6006f595.jpg

Replay: Are States an Anachronism?

$
0
0

Obviously states aren’t going anywhere anytime soon, but a number of folks have suggested that state’s aren’t just obsolete, they are downright pernicious in their effects on local economies.

One principal exponent of this point of view is Richard Longworth, who has written about it extensively in his book “Caught in the Middle” and elsewhere. Here’s what he has to say on the topic:

In the global era, states are simply too weak and too divided to provide for the welfare of their citizens…The reason is a deep, intractable problem. Midwestern states make no sense as units of government. Most Midwestern states don’t really hang together – politically, economically, or socially. In truth, these states and their governments are incompetent to deal with twenty-first century problems because of their history, rooted in the eighteenth and nineteenth centuries.

Longworth expounds upon this to identify a series of specific issues, which I’ll put into my own terms.

1. States do not represent communities of interest. With some exceptions, states consist of cities, rural areas, and regions that have very distinct histories, geographies, economies, and and event cultures. As a result, it is incredibly difficult for legislators and leaders from various parts of the state to find common cause.

Here’s how Longworth describes Illinois:

Illinois, like Indiana, is three states, and for the same reasons. The southern third, again south of I-70, is a satellite of the South – more give to conservative religions, gun racks in pickup trucks, and a deeply conservative Republicanism….Most of the rest of the state is called Downstate to differentiate it from Chicago, even though some of it, such as Rockford, is actually north of the city. It is an unfocused place…what unites this heterogeneous region is a dislike of the third region, Chicago. Chicago dominates Illinois – politically and economically…If the rest of Illinois obsesses about Chicago, Chicago gives the impression – an accurate one, in fact – of never thinking about the rest of Illinois.

Additionally, I might add my observation that this creates a situation where the policies which are right for one area may be wrong for another. Since it is the nature of governments to promote uniform rules, this often leaves one or even all regions of a state with suboptimal rules. In fairness, there are are often some types of flexibility, such as that provided by different classes of cities. But important macro policies remain one size fits all.

Consider Illinois. It’s a combination of a global city core in Chicago, a Rust Belt hinterland, and a southern fringe region. State policy is set by the Chicago elite as a general rule, and predictably it follows a big city, global city favorable model: strong home rule powers for large municipalities, a high tax/high service type model, strong public sector unions, etc. This pretty much works for Chicago, but for downstate it puts their communities in a major economic vice since they don’t benefit from global city friendly policies and are competing against other places that have optimized in other ways.

Indiana being one example. It is pretty much the opposite. Its largest city region is only about 25% of the state’s population, meaning Indiana is dominated by rural and small city constituencies. As a result, Indiana has optimized for a “Wal-Mart” strategy such as through its low-service/low-tax approach, weak environmental rules, and very weak (I’d argue nearly non-existent) home rule powers for even its largest municipalities. This is great if you are a small manufacturing city trying to beat out Ohio, Michigan, and Illinois for low wage manufacturing and distribution jobs (which sounds bad but is realistically the best short term play these places have). But it’s pretty terrible if you are Indianapolis and trying to fight to have a place in the global economy, attract choice talent, build biotech and high tech business clusters, etc.

2. Arbitrary state lines encourage senseless border wars. With limited exceptions, the major cities of the Midwest (and often elsewhere around the country) were founded on major bodies of water like rivers, lakes, or an ocean. These were often boundaries of states, thus major cities are frequently at the edge, not the center of states. This means not infrequently you find multi-state metro areas, which creates structural conflicts of interest. The logical economic unit is the metro area, but it matters from a local fiscal point of view (i.e., the ability to collect income, sales, and property taxes) where particular businesses locate. Thus we frequently see the case where localities spend tons of money on incentives simply to get businesses to relocate within the same metro area. You can have bidding wars without multiple states (such as neighboring suburbs competing over a Wal-Mart), but these seldom involve major state level incentives.

Longworth again summed this up masterfully in a recent blog post called “The Wars Between the States” where he documents the incentives being doled out to convince companies to move back and forth across the state border in the Kansas City metro area:

It would seem impossible for Midwestern states to get any sillier and more irrelevant, but they’re trying. In a time of continuing recession and joblessness, with crunching budget problems, failing schools, crumbling infrastructure and no real future in sight, these states have decided to solve their problems by stealing jobs from each other.

The most recent example is the so-called “border war” between Kansas and Missouri, as the two states compete to see how much money they can throw at businesses to move from one state to the other. The focus of this war is Kansas City — both the Kansas one and the Missouri one, basically a single urban area divided not only by an invisible line down the middle of a street but by a mindless hostility that keeps its two parts from working together.


Competition with “Europe, India, China and the rest of the world” has nothing to do with this juvenile job-raiding. In fact, this “border war” keeps Missouri and Kansas from competing globally — indeed, robs them of the tools they need to compete globally. Some rational thought shows why. It’s precisely these states’ inability to compete globally that causes them to declare war on the folks next door. In a global economy, Kansas and Missouri aren’t competing with each other, any more than Illinois, Indiana and Wisconsin are competing with each other. The real competition is 10,000 miles away and all Midwesterners know that we’re losing it.

[ Update 5/5/2014: It looks like Missouri and Kansas may be about to declare a truce in their border war ]

3. Many state capitals are small, isolated, and cut off from knowledge about the global 21st century economy. In some states the state capital is a large city that is well-connected to the global economy – Atlanta, Indianapolis, St. Paul, and Nashville come to mind. But often state capitals were selected because they were in the geographic center of the state, not because they were major centers in their own right. Some, like Indianapolis, managed to grow into major cities. But many others did not. Think Springfield, Jefferson City, Frankfort, etc. This means that the state capital of many states is not very large, and often not very plugged into the global conversation. Longworth again captures the implications of this:

There is another reason why state governments are botching the economic needs of their states. Some 150 to 200 years ago, state capitals were picked not for economic reasons, but for geographic ones. Many of them remain in this isolated irrelevance today, far from the real action of any of the territories they are meant to govern…In this era of globalization, with overnight shipping and instant communications, this shouldn’t make any difference. In fact, it does. Global cities such as Chicago depend on face-to-face contact, and isolated state capitals live out of earshot of this conversation. The winds of globalization are transforming state economies and generating new thinking about state futures, but the news takes a long time to get to the state houses and legislatures.

4. Metro areas are the engines of the modern economy, but the rules for municipal and regional governance are set by states, and often in a manner that is directly contrary to urban interests. In this Longworth channels the Brookings Institution, which has tirelessly documented the importance of metro area economies to the nation as well as all the ways states, frequently controlled by non-urban legislators who are actively fearful of cities, have often imposed enormous burdens on those metro areas by tying them down with a morass of Lilliputian rules. Again Longworth:

States set the boundaries of urban jurisdictions and decide whether or how they can merge. They tell cities who they can tax and how, whether this helps cities or not. State governments help finance local infrastructure and dictate, from miles away, how that money is spent. State priorities on education and workforce programs leave city residents incompetent to deal with the global job market. Highway funds go to rural areas, not to cities that need them more; job creation money goes to wealthy areas, not to the core of battered cities.

Some urban regions have more or less given up any hope that their state will ever change or be a positive partner, such as Kansas City, as Longworth notes:

When the Greater Kansas City Community Foundation issued a report on the city’s future, it pretty much told the state to get out of the way. “Nations and states still matter,” it said. “They particularly can do their cities harm. But cities have to take the lead. San Diego did not become San Diego by looking to Sacramento, not Seattle to Olympia.” When the authors talked about Sacramento and Olympia, one felt their really meant Jefferson City.

I’d probably go even further than Longworth. I think that historically states imposed rules on cities deliberately designed to hobble their growth. For example, the laws that restricted branch banking in most states until recently had the effect of keeping big city banks from buying up rural and small town banks around the state. The end game of course is that when deregulation occurred, the banks in most big cities were so small because of these rules, they were easy prey to out of state acquirers. Thus most states saw basically their entire indigenous banking industry swallowed up.

Also, states seem to more or less treat their urban regions like ATM machines. Every study I’ve seen documents how, contrary to popular belief, cities actually are net exporters of tax dollars to their state government. Marion County, Indiana for example (Indianapolis), sends a net of about $400 million a year to the state – enough to cover the entire public safety budget of the city.

I actually don’t have a problem with some redistribution as cities are generally economic engines and more efficient to boot, so they should be expected to be donors at some level. On the other hand, when states proceed to starve those cities of the critical funds they need stay healthy and strip them of the powers they need to manage their own affairs, this is like sticking a knife in the golden goose.

Again I can use Indianapolis as an example. As part of a tax reform package the state took over all operating educational funding for K-12. So far so good. But they also imposed a funding formula that severely disadvantaged growing suburban districts by denying them equal per pupil funding. The net result was a major funding problem for the best suburban Indianapolis districts like Carmel, Fishers, etc. Many of these districts had to go to referendums to raise local taxes to make up the difference (which was no doubt the state’s plan all along – it simply outsourced the unpleasantries of a tax increase to localities). Here is a state that claims it wants to be in the biotech business, the high tech business, etc, yet it singles out the school districts where the labor force you are trying to attract for those industries is likely to live for outsized cuts. That hardly seems like a winning strategy.

Indiana also keeps its cities on a tight leash, with some of the weakest home rule powers around. Indianapolis basically can’t do much without legislative approval (a transit referendum, for example, will require specific legislative authorization). And the legislature seems to like it that way. Indiana’s property tax caps, which I support generally from a percentage of assessment perspective, include a lot of poorly advertised gotchas. For example, regardless of assessed value, the total tax levy can only grow at a rate equal to the average personal income growth over the last six years. I’ll caveat this by saying I haven’t studied this in detail and thus may be a bit off base, but the levy cap appears to be a de facto spending cap at current levels regardless in growth of tax base. This may be ok for some, but not others that are growing say their commercial office space base at a rapid clip and need to expand infrastructure and services to support it.

Clearly many of these policies have no real benefit to the Indianapolis region, which is more or less being asked to be the economic engine of the state and finance state government without being given the tools to do that job property.

The list goes on but that should give you a flavor. Similar things occur around the country.

To this list I’ll add one of my own, which has also been richly illustrated by Jim Russell. Namely,

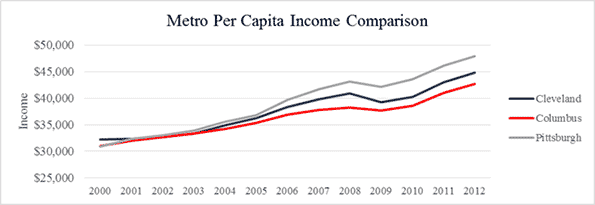
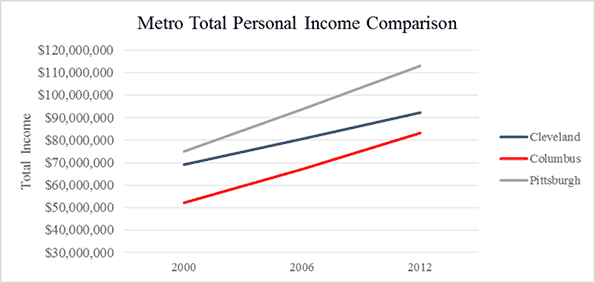
5. States can’t to much to help, but they can do a lot to hurt. A lot of the national debate seems to center on whether the “red state” or “blue state” model makes the most sense. But to a great extent, policy almost doesn’t matter. In Ohio, with one set of state policies, Columbus thrives while Cleveland struggles. Tennessee is a right to work state with no income tax, but Nashville booms while Memphis stagnates. Texas is doing great with its red state model, but Mississippi and Alabama not so much. And even within Texas, there are plenty of places that are hurting badly.

While good policy can set the stage for growth, it can’t guarantee local economies will prosper. But bad policies can hurt regions that otherwise would thrive. Extremes of either the blue or red model seem to lead to problems. Witness California, for example, which seems to be holding up a sign to business saying, “Get lost.”

This puts states in the difficult position of being almost being able to aspire at best to being a neutral influence on their own economy. But it’s easy for them to screw things up.

This piece first appeared at The Urbanopihle on July 11, 2011.

Aaron M. Renn is an independent writer on urban affairs and the founder of Telestrian, a data analysis and mapping tool. He writes at The Urbanophile, where this piece originally appeared.


States map image by Bigstock.

Ukraine Watch: Kiev in the Media Center Spotlight

$
0
0

This spring I traveled from St. Petersburg to Kiev, by way of southern Russian and eastern Ukraine. The newspapers were filled with reports of American policymakers gushing over how mobs in Kiev deserved the inalienable rights of freedom fighters and self-determination. Mobs of Russian mercenaries in Eastern Ukraine, who set up automobile tire and sandbag roadblocks, were condemned for threatening world peace.

I took trains and mini-vans, and crossed the Russian-Ukrainian border between Belgorod (Russia) and Kharkiv (Ukraine), where, at least in the Western press, there are large concentrations of Russian forces getting ready to pounce on Ukrainian independence (I did not see any).

As I travelled (with my 18-year-old son), I came to view the crisis less in geopolitical terms and more as opportunities for what the Soviets used to call agitprop, from “agitation and propaganda.” Like the agitprop theatricals of the 1920s, this war serves as the extension of public relations by other means.

Ukraine is tailor-made for show business: it's a folk opera, one of those performances in native dress you have to endure on package tours around Europe. The storyboards of an evil Vladimir Putin play well, even to an American electorate unsure if Donbas is a region or a dress designer.

From any microphone in the world, President Obama can threaten “additional sanctions” against the Russian oligarchy. Vice President Biden can jet into Kiev with messages about how “the American people stand with the people of Ukraine, ” while Secretary of State John Kerry intones high moral dudgeon.

For Putin, saber-rattling over Ukraine is a better media opportunity than even the winter games. It’s a chance to dominate the world stage and be taken seriously without having to put up another Olympic village for $51 billion.

Day-to-day in the Kremlin, Putin presides over an empire in decline. For Russian men — awash in tobacco and vodka — the average life expectancy is about 64, and Potemkin’s village is now the glitter around Moscow, covering up the grim reality of the provincial cities.

Economically, Russia’s trade zone with Belarus and Kazakhstan cannot compete with Europe, and China’s economic boom makes Russia, by comparison, look like a collective farm. For that reason, it's doubtful that Putin needs to annex another coal region with high unemployment, although he’s happy to claim it if local militants drop it in his sphere of influence.

As the avenger of the 1854 Crimean War, Putin can, at least, lay claim to Empress Catherine-like greatness, although the word on the Moscow street is that he took Yalta and Sebastopol so that Russian oligarchs can cash in on the bourgeois pursuits of gambling and casinos.

Even the provisional government in Kiev has an interest in using the crisis to promote its competency. It came to power not through elections, but from street demonstrations, which were funded by sources as diverse as local oligarchs, nascent political parties, foreign intelligence agencies, the Catholic church, and neo-fascist elements. Each tent represents a marker in the great game.

The freedom fighters still encamped around Kiev’s main city square, Maidan, look less like Jeffersonian democrats exchanging copies of Montesquieu’s treatises and more like those second-amendment militias in Montana, to whom all governments are evil.

Dozens of tents are pitched in the square. The occupants, many dressed in thrift shop army fatigues, have the angry, down-and-out look of the 1890s Coxey’s Army of the unemployed, rather than of delegates to the Continental Congress.

The Kiev protesters overthrew one government and are standing by—chopping wood, grilling sausages, listening to music, stacking bricks—to see what happens in the May 25 presidential election. To be clear, the February martyrs of the Maidan (about 110 were killed), whose pictures line makeshift altars around the square, were not paid to give their lives in political opposition.

They took to the streets against the government of Viktor Yanukovych, which they saw as corrupt, dictatorial and ready to consign Ukraine to a Putin revival of the Warsaw Pact and Comecon. But in the chess culture of Ukraine, knights and bishops go forward with different goals than pawns.

The Kiev government is struggling and divided. About 20 candidates have declared for the presidency, and at least eight parties are represented in the parliament. What could be more uplifting for them than solidarity phone calls from President Obama or pep talks from the US vice-president?

The problem with the American embrace is that it validates the Russian belief that NATO, the EU, and the United States want Ukraine in their sphere of influence. Otherwise, why would the director of the CIA have come to Kiev during the recent crisis? Imagine the American reaction if an interim government in, say, Quebec welcomed the head of the Russian secret service, the FSB.

The extent to which the crisis is being waged by the media can be seen in Kiev’s Hotel Ukraine, a dreary Intourist relic of the Soviet era overlooking the Maidan that, during the street demonstrations, allegedly rented out rooms to government snipers. Now that tourists rarely visit Kiev, the hotel is headquarters for something called Ukraine Crisis Media Center, a slick public relations operation where journalists can stop by for a quick coffee and a quote.

On paper, the group is staffed with patriotic volunteers, there to keep alive the martyrdom of the Maidan and to warn about the evils of Russian aggression. In practice, the “media center” has the look of serious American front money.

The day I was there it featured short, introductory remarks by the US ambassador to Ukraine and a press conference from the ranking minority member of the Senate Committee on Foreign Relations, Bob Corker (R-Tennessee).

For these thirty minutes, Ukrainians, like homespun Tennessee constituents, were simple, hardworking folks who needed American support to throw off the Russian yoke. Yes, there was the local problem of corruption, but that was “a remnant of the Soviet-era,” much like the plumbing, I guess.

Corker explained that he had come to Kiev to “show support for the people of Ukraine” and to applaud their courageous right to “self-determination”. For its aggression, he said, Russia and its president needed to “pay a price.”

At no point was any mention made of other causes of the current crisis: NATO designs to push its military frontiers to Ukraine and Georgia, despite earlier assurances from President Bush (Sr.) not to advance NATO east of a reunited Germany; the US seeing Ukraine as a fertile market, not just for its intelligence services, but for its gas exports and energy companies; Ukraine’s kleptocracy that has left the post-Soviet economy stillborn since 1991; and elements of the non-elected government having spoken with the same reverence about fascism that earlier citizens accorded their Nazi liberators in 1941.

In Washington’s press releases, the masked men in the East are Russian proxies in a renewed Cold War. To Moscow, the encampments around the Maidan are the spiritual heirs of the army of the Bay of Pigs.

My own view is that that the liberators of Eastern and Western Ukraine, despite having different ideological mentors, are the homegrown dissidents of a failing state, one with high employment, cornered markets, governments with Italian-like instabilities, and few profits that have trickled down to ordinary citizens.

Before leaving Kiev, we thought about visiting the vacated house of the former President Yanukovych, who departed in a hurry for his Russian exile, leaving behind his gilded furniture and private zoo. We were told the house is being transformed into a Museum of Corruption. Admission costs 20 Ukrainian hryvnia, although you can also get in by paying 10 hryvnia to one of the guards.

Matthew Stevenson, a contributing editor of Harper's Magazine, is the author of Remembering the Twentieth Century Limited, a collection of historical travel essays. His new book, Whistle-Stopping America, was recently published. He first traveled to the former Soviet Union in 1975, and over the years has been to many of its then-constituent parts.

Photo by the author: Tents in the Maidan.

Urban Core Jurisdictions: Similar in Label Only

$
0
0

The fortunes of U.S. core cities (municipalities) have varied greatly in the period of automobile domination that accelerated strongly at the end of World War II. This is illustrated by examining trends between the three categories of "historical core municipalities" (Figure 1). Since that time, nearly all metropolitan area (the functional or economic definition of the city) growth has been suburban, outside core municipality limits, or in the outer rings of existing, core municipalities.   

Approximately 26 percent of major metropolitan area population is located in the core municipalities. Yet, many of these municipalities include large areas of automobile orientation that are anything but urban core in their urban form. Most housing is single-detached, as opposed to the much higher share of multi-family in the urban cores, and transit use is just a fraction of in the urban cores.

Even counting their essentially suburban populations, today's core municipalities represent, with a few exceptions, a minority of their metropolitan area population. The exceptions (San Antonio, Jacksonville, Louisville, and San Jose) are all highly suburbanized and have annexed land area at a substantially greater rate than they have increased their population.

According to the 2010 census, using the 2013 geographic definitions, core cities accounted for from five percent of the metropolitan area population in Riverside-San Bernardino to 62 percent in San Antonio (Figure 2).

International Parallels

These kinds of differences are not limited to the United States. For example, the city (municipality) of Melbourne, Australia has little more than two percent of the Melbourne metropolitan area population. Indeed, the city of Melbourne is only the 23rd largest municipality in the Melbourne metropolitan area and has a population smaller than a single city council district in Columbus, Ohio.

These virtually random variations in core city sizes lead to misleading characterizations. For example, locals sometimes point out that San Antonio is the 6th largest city in the United States. True, San Antonio is the 6th largest municipality in the United States, but the genuine, classically defined city – the broader metropolitan area that is the urban organism– ranked only 26th in size in 2010. The suburbs and exurbs, as defined by municipal jurisdictions, are smaller than average in San Antonio, but the city itself stretches in a suburban landscape up to more than 15 miles (24 kilometers) beyond its 1950 borders.

Core municipality mayors have been known to travel around the as representatives of their metropolitan areas. In some cases core municipality mayors represent constituencies encompassing the entire metropolitan area (such as Auckland or soon to be major metropolitan Honolulu). Others have comparatively small constituencies. For example, the mayor of Paris presides over only 18 percent of the metropolitan area population, the mayor of Atlanta 8 percent, the mayor of Manila 6 percent, Melbourne 2 percent and Perth, Australia just 0.5 percent (Figure 3).

Core Municipalities in the United States

A remnant of U.S. core urbanization is evident within the city limits of municipalities that were already largely developed in 1940 and have not materially expanded their boundaries. These are the Pre-World War II Core & Non Suburban category of core municipalities. Between 1950 and 2010 these core municipalities lost a quarter of their population, dropping from 24.5 million residents to 19.3 million (Figure 4). All but Miami lost population. Despite improved downtown population fortunes, the last decade saw a small further decline of 0.2 percent overall. Only two legacy cities, New York and San Francisco, now exceed their peak populations of the mid-20th Century.

Again, this is the typical pattern internationally. Throughout the high-income world, the urban cores that have not expanded their boundaries and had little greenfield space for suburban development have had declining in population for years. My review of 74 high income world core municipalities that were fully developed in the 1950s and have not annexed materially showed that only one had increased in population by 2000 (Vancouver). Since that time, a few that had experienced more modest declines have recovered to record levels, such as Munich and Stockholm. Most others, such as London, Paris, Milan, Copenhagen and Zurich remain below their peak populations.

In the United States, most of the strong growth has taken place in the "Pre-World War II & Suburban" classification, doubling from 10.1 million residents to 20.4 million since 1950. These include core cities with strong pre-war cores, but which have either annexed large areas or already contained large swaths of rural territory at that time (like Los Angeles, with its San Fernando Valley, which was largely agricultural) that later became heavily populated.

Many of these core cities experienced population declines within their 1950 boundaries (such as Portland, Seattle and Nashville between 1950 and 1990). Los Angeles, however, has been the exception. The more highly developed central area (as defined by the city Planning Department) within the city limits has increased in population by one-third since 1950, although population outside the downtown area has actually decline in the central parts of the city. The continuing suburbanization of the city of Los Angeles, however, is indicated by the fact that the central area's share of city population has fallen from 68 percent to 47 percent.

The "Post-World War II & Suburban" core cities are much smaller and their metropolitan areas are nearly all suburban. These include metropolitan areas like Phoenix and San Jose. The population of these metropolitan areas has increased more than seven fold, from 700,000 to 5.2 million.

Land Area: The differences between the three historical core municipality classifications are most evident in land area. Among the "Pre-World War II & Non-Suburban" cores, land areas were almost unchanged from 1950, with much of the difference reflected in Chicago's O'Hare International Airport annexation. In contrast, the "Pre-World War II & Suburban" cores more than tripled in size, adding an area larger than Connecticut to their city limits. The percentage increase was even larger in the "Post-World War II & Suburban" cores which covered 10 times as much land in 2010 as in 1950 (Figure 5).

Population Density: Over the 60 year period, the population density of the "Pre-World War II & Non-Suburban" cores dropped from 15,300 per square mile to 11,400 (5,900 per square kilometer to 4,400). The "Pre-World War II & Suburban" and "post-World War II & Suburban" cores started with much lower densities and then fell farther. The core city densities in these municipalities are approximately one-half the population densities of Los Angeles suburbs (Figure 6).

The Need for Caution

All of this indicates the importance of caution with respect to core versus suburban and exurban comparisons. For example, Atlanta, which represents only 8 percent of the urban organism (metropolitan area) in which it is located is not comparable to San Antonio, with its 62 percent of the metropolitan population. These distinctions are important when we talk about different regions.

Wendell Cox is principal of Demographia, an international public policy and demographics firm. He is co-author of the "Demographia International Housing Affordability Survey" and author of "Demographia World Urban Areas" and "War on the Dream: How Anti-Sprawl Policy Threatens the Quality of Life." He was appointed to three terms on the Los Angeles County Transportation Commission, where he served with the leading city and county leadership as the only non-elected member. He was appointed to the Amtrak Reform Council to fill the unexpired term of Governor Christine Todd Whitman and has served as a visiting professor at the Conservatoire National des Arts et Metiers, a national university in Paris.

Chicago photo by Bigstock.

The Best Small And Midsize Cities For Jobs 2014

$
0
0

In the classic television show “The Honeymooners,” many jokes were wrung out of bus driver Ralph Cramden’s membership in the International Brotherhood of Loyal Raccoons, headquartered in Bismarck, North Dakota. When Ralph mentioned in one episode to his wife, Alice, that among the privileges is that they could be buried at the “Raccoon National Cemetery” in Bismarck, Alice’s reply was that it made her not know “if I want to live or die.”

That’s worth a chuckle, but perhaps it’s time to reconsider Bismarck, which ranked first out of the 398 metro areas we considered for our annual roundup of The Best Cities For Jobs. A metro area of 120,000 located in the country’s fastest-growing state and near the vast Bakken oil fields, the number of jobs in Bismarck is up 3% over the last year and a sizzling 32.4% since 2002. You might not want to be buried there, but at least you can get a job before that.

Bismarck’s growth, although remarkable, is mirrored in many smaller places. When we look at economic growth in America, we tend to focus on large metropolitan areas (we draw the bar at 5 million people and up). However over 40% of Americans live outside these big cities and their much more populous suburbs, notes demographer Wendell Cox. They reside in smaller cities and towns, the destination of choice for many of the domestic migrants fleeing the largest metropolitan areas for the better part of the last decade.

View the Best Cities for Jobs 2014 List

These places are often seen by pundits as economic backwaters, but in fact small and mid-sized metro areas take up 16 of the top 20 spots of our overall list of The Best Cities For Jobs. For the most part, it is the smaller markets with under 150,000 jobs that are growing the fastest, but several mid-sized cities (between 150,000 and 450,000 nonfarm jobs) also are outperforming, including Boulder, Colo., which ranks first on our medium-sized cities list, and Provo-Orem, Utah, which ranks second. These areas are as varied as America. Some fit the resource-dominated archetype often associated with smaller cities and towns but others are driven by industry and even tech growth.

The Energy Hubs

As we saw with our large cities list, metro areas that are connected to the energy economy have been peak performers. Beyond Bismarck, our list of the Best Small Cities For Jobs includes Greeley (fifth) and Ft. Collins (17th), both located near the oilfields of northern Colorado; and near the west Texas oilfields, the cities of Midland (sixth), San Angelo (11th), Odessa (15th) and Lubbock (16th).

Energy jobs pay an average of about $80,000 a year according to BLS data. But this wealth is not only for geologists or those with oil stains on the hands. The money brought into these communities has also sparked strong growth in such fields as manufacturing, construction and business services in virtually all these towns. In Midland, for example, natural resources and construction employment has surged 50% since 2008, but wholesale trade, manufacturing, business and financial services have also expanded strongly.

Manufacturing Comeback Cities

Plenty of old industrial cities are at the bottom of the 240 MSAs we ranked for our small cities list, including 238th place Danville, Ill., which has lost 6% of its jobs since 2008, and second from last, Michigan City-La Porte, Ind., where employment has dropped 6.8% over the same span. But some of the highest fliers are also industrial towns. This includes second-ranked Elkhart-Goshen, Ind., which rose a remarkable 63 places from last year on our list, and from 233rd back in 2010. The recreational vehicle manufacturing hub suffered steep job losses during the Recession, but industrial employment has risen 24% since 2010.

Like energy, industrial jobs tend to pay more than most, and have a strong effect on other sectors. Since 2010 in the Elkhart-Goshen area, employment in wholesale trade and business services has expanded at double-digit percentage paces, while retail employment has shot up a healthy 7.4%. In Grand Rapids-Wyoming, Mich., which ranks third on our list of the Best Midsize Cities For Jobs, manufacturing employment is up almost 14.7% since 2010 while job growth has also been strong in medical services, education, and business services. Grand Rapids has 4.9% more jobs now than in 2002, a far sight better than larger industrial metro areas like Detroit, where employment has declined 16.2% over the same period.

But most of the comeback industrial towns are not in the Midwest but the Southeast, which has gotten the bulk of new investment from foreign automakers and steelmakers. This includes Auburn-Opelika, Ala., No. 7 on our small cities list, where there has been a surge in employment by auto parts suppliers. The home of 25,000-studentAuburn University, it has also seen strong growth in business services and hospitality. Two South Carolina metro areas, Anderson (12th) and Spartanburg (13th), have also benefited from the industrial resurgence in the region.

College Towns

We may be approaching the end of a “higher education bubble,” as Glenn Reynolds and others have suggested, but at least for now many college towns in the Midwest, the southeast and the Intermountain West continue to show strong job growth.

In Columbia, Mo., home to the 35,000-student University of Missouri, employment has expanded 9.7% since 2008 and 4% in 2013, placing it third on our small cities list. In ninth-place College Station, Texas, the presence of Texas A&M (56,000 students) has sparked growth in the information and business services sectors, in which employment has expanded 18.2% and 14.2%, respectively, since 2008, while leisure and hospitality employment is up 29.5% over the same period. Higher education has continued to be a strong and growing industry for these small towns, although its long-term sustainability may be hampered by a lethargic economy and burgeoning student debt.

Places For The Rich And Famous

In this most unequal of recoveries, some of the biggest winners are cities that cater to the rich and aging baby boomers. People over 55 control upward of three-quarters of the country’s wealth and more than half all discretionary dollars. And unlike the millennials and Xers who follow them, this generation has generally profited more from the recent jump in equity and property prices.

Fourth on our small cities list is St. George in scenic southwestern Utah, a fast-growing community for retirees, where employment shot up 5.38% in 2013. Naples-Marco Island, Fla. (eighth), long a major lure to northern snowbirds, is home to a fast-growing economy built around hospitality and construction. Napa, Calif. (18th), has emerged as a major beneficiary of spending by wealthy retirees from the booming San Francisco Bay Area.

The Future For Smaller Cities

Big city mayors are wont to proclaim that they’re on the cutting edge of economic life. Big cities are where “the action is,” Atlanta’s Karim Reed said at a recent confab in Chicago. But as our roundup of the cities with the strongest employment growth shows, many of the hottest economies in the country are in places that most urbanistas would write off as the boondocks. Some of them, may only do well as long the energy and agriculture booms continue, but many other will benefit as boomers continue to seek out comfortable, less congested, and often less expensive, places to retire. These smaller places may also benefit as millennials start seeking to buy homes and raise families. And with the expansion of communication technology, they may find it increasingly easy to perform sophisticated work from smaller places. America’s economy may still remain dominated by its giant metro areas, but it would be inaccurate to discount the role of smaller places in the evolving American economy.

View the Best Cities for Jobs 2014 List

This story originally appeared at Forbes.

Joel Kotkin is executive editor of NewGeography.com and Distinguished Presidential Fellow in Urban Futures at Chapman University, and a member of the editorial board of the Orange County Register. He is author of The City: A Global History and The Next Hundred Million: America in 2050. His most recent study, The Rise of Postfamilialism, has been widely discussed and distributed internationally. He lives in Los Angeles, CA.

Michael Shires, Ph.D. is a professor at Pepperdine University School of Public Policy.

Boulder, CO photo by Phil Armitage.

Thinking About Housing in the Northwest

$
0
0

With one of the most successful economies in the nation, the real estate news in the Pacific Northwest is positive and gives hope for a housing sector recovery, albeit at different rates in different markets. CNNMoney reports that from the third quarter in 2012 to the third quarter in 2013, the median home price in the Seattle-Bellevue and Everett area increased by 13.7%. The forecast for changes from the third quarter in 2013 to the third quarter in 2014 is another 5.2%. Tacoma’s (Pierce County) housing prices did not grow as quickly, with an increase of 9.3% from 2012 to 2013, but it is expected to witness a sharper increase in 2014, with a healthy 8.6% change from the third quarter of 2013 to 2014. 

As rosy as the real estate picture is, we should also remember that in the second quarter of 2013, as housing values began to climb in both markets, median family incomes were already too low compared to median home prices. In Seattle, the ratio of median home prices to median family income was 4.7, and in Tacoma it was 3.6. That made Tacoma a relatively affordable city. However, an expected increase of 8.6% in home values, without a corresponding increase in median family incomes will not do much for its affordability.

Without a major change in its employment structure that might lead to higher incomes for current and future residents of Tacoma, the differential in home prices could make Tacoma a residential destination for Seattle employees finding this city comparatively more affordable. Living half an hour from work, but paying significantly less for housing, is a great incentive, especially for young, single or double income, and childless families. For them, a two-bedroom condo with a view of Commencement Bay may do the job. For Tacoma residents whose median family income is about $20,000 less than their Seattle counterparts, rising home values may prove to be a challenge that cannot be easily overcome without a higher number of well-paying jobs that keep pace with rising home values.

Regional patterns of housing affordability

It is no longer news to anyone that most unaffordable cities rely on their less costly neighbors to house their working populations. The city of Los Angeles relies on the vast sprawl of its own suburbs and the Inland Empire. San Francisco does the same by having people commute from the larger urban region, all the way from the San Joaquin Valley.

The relationship between Seattle and other cities in King and Pierce Counties already follows the same script. Morning commutes into Seattle and afternoon rush hour traffic heading out of Seattle do not require statistics. The numbers are felt by anyone driving during those hours. However, two maps will help paint a vivid picture of the regional urban dynamics created by the unholy triangle of housing market price differentials, economic development patterns, and the resulting spatial mismatch between home and work places. 

Maps for median housing values and commuting patterns in King and Pierce Counties clearly show that a good number of people who work in unaffordable regions of King County (including Seattle) rely on more affordable housing elsewhere. As the map of commuting patterns illustrates, for Pierce County, this starts right at the county border, where housing prices are lower (compared to median household incomes). This has already turned certain portions of Pierce County into bedroom communities, feeding economic growth elsewhere. In other words, job-rich areas are resolving their housing problems by pushing their employed populations to other areas, where home prices are more affordable. However, will the growth of housing demand in areas outside employment centers translate to increased housing values in previously affordable regions and push long-time residents out of the housing market?

To answer this question, we need to engage in a more detailed level of analysis.


Micro-geographies of affordability

In order to get a better sense of housing affordability patterns, we can rely on a simple indicator called median multiples (the ratio of median housing value to median household income). While this measure has its critics, it is easily understandable. The basic premise is that when median housing value exceeds median household income more than three fold, an area becomes unaffordable.

A few years ago, Wendell Cox used this method to identify the least affordable cities in the nation. He used the following table to classify various cities in the U.S.:

Demographia

Housing Affordability Ratings

Rating

Median Multiple

Severely Unaffordable

5.1 & Over

Seriously Unaffordable

4.1 to 5.0

Moderately Unaffordable

3.1 to 4.0

Affordable

3.0 or Less

Median Multiple: Median House Price divided by Median Household Income


The map of median multiples for King and Pierce Counties reveals a pattern of housing affordability that indicates a looming problem as the housing market recovers. As of Census 2012, almost all Seattle and Bellevue areas were unaffordable, with median multiples exceeding 5. Comparatively speaking, Tacoma has had more affordable housing areas (with more census tracts with median multiples ranging from 3 to 4).  Between Tacoma and Seattle, areas such as Federal Way have more affordable housing for the income levels found there. Tacoma’s North East community, adjacent to Federal Way, has higher housing values matching residents’ income levels. Given the commuting patterns, this region is clearly home to many who work elsewhere, earn better incomes, and spend a smaller portion of it on their homes.


In some areas, where median multiples exceed 5, current residents may have purchased their houses when prices were lower. In other words, at one point in time, the median multiple had a lower value. Under such conditions, residents have accumulated substantial equities, allowing them to sell in a more expensive market. However, the next group of occupants will need substantially higher incomes to afford these houses. With the potential arrival of a sellers’ market, any transition in the composition of homeowners will also coincide with a shift to higher socioeconomic status.  

Given the overall housing affordability patterns, it is clear that with the looming hike in home prices, the last of the semi-affordable housing pockets in the region extending from Seattle to Tacoma could vanish quickly. Clearly, the well-paid employees in King County could choose to live in Pierce County, enjoy the views, but struggle with traffic up and down I-5. They could even benefit from a publicly funded transportation system. But this won’t resolve the growing traffic and the emerging spatial mismatch between housing and employment. At this point the entire urban region from Seattle to Tacoma should focus on job-housing balance, where the quantity and cost of housing are comparable to employment volume and average salaries paid. To be truly ‘green,’ decision makers need to think regionally. Passing housing or employment problems to neighboring cities is not the best approach to sustainability.

As for Tacoma, like any other urban region on the fringes of a major metropolitan area, the city has a few options moving forward. First, it could act as a satellite city and build more houses for people who work in the larger urban region. Second, it could imagine itself as a major urban center with little interest in being a “second city.” In that case, it needs to focus on economic development, bringing more well-paying jobs that are suitable for its current and future residents, and build houses that are affordable for the types of incomes generated in the area. This strategy requires coordination between housing and economic development that reduces the spatial mismatch between housing and employment and improves the job-housing balance. This will help both housing and transportation conditions. That will also keep Tacoma affordable and make it unpretentiously ‘green.’

The National Association of Home Builders ranks Tacoma 103rd for housing affordability on a list of 224 cities. Spokane ranks 62 and Seattle 202 on the same list. Tacoma should aspire to appear on the list of the top 50 most affordable cities by 2020, and be recognized for the quality of life and employment opportunities it offers to current and future residents.

Ali Modarres is the Director of Urban Studies at University of Washington Tacoma.  He is a geographer and landscape architect, specializing in urban planning and policy. He has written extensively about social geography, transportation planning, and urban development issues in American cities.


Connecting Citizens to Economic Opportunity

$
0
0

I recently received an email from the folks behind the Meetings of the Minds conference asking if I’d participate in a group blogging event they were doing by writing a post on the topic of “How can cities better connect all their residents to economic opportunity?” As this is a topic I personally care quite a bit about, I was happy to do so. They will be linking to responses to other people’s answers should you be interested.

Firstly, what is economic opportunity? Simply put, I’ll define it as a) a job, b) a better job, or c) an opportunity to start a business. There are a number of possible avenues one could suggest for making one of these outcomes more likely: better education, better transportation, migration assistance (which I’ve written about before), and more.

But many of those are difficult to implement, uncertain in their result, long term to realize benefits, and require money that we don’t have. That doesn’t mean we shouldn’t tackle them, but I can’t help but ask: what can we do that would be relatively fast to implement, provide jobs and entrepreneurship opportunities where people already are (particularly those who are lacking a decent job today), and which has a relatively high likelihood of payoff?

In my view overwhelmingly the number one thing we can do that fits this is to pare back the local regulatory burden on small business. I say local because affecting federal or state regulations involves making change at levels of government that are hard to move. Local regulations are mostly within the control of local political leaders. Changing them doesn’t require spending a lot of money. In fact, eliminating regulations might actually save the government money. Change a regulation and it’s changed immediately, and without a lag. It seems intuitive that lighter touch regulation would help small businesses launch and thus have some benefit.

There always are possibilities of unforeseen problems, of course, which should be watched for. And actually, significant improvement can be made without implementing some “anything goes” environment. The goal isn’t necessarily to have low standards. Rather, we can have high standards. But they have to operate objectively, transparently, and predictably, and in a timely fashion. And they have to be things businesses can realistically be expected to do without seeking special exemptions.

Why focus on small businesses? Because starting a small business is fastest path to the middle class in many of our cities today, cities that are often places where the middle class is getting killed. As the NYT recently put it, the King can’t even afford Queens anymore. What we’re seeing in cities is a bifurcated economy with lots of high end jobs and lots of low end service class jobs, but shrinking middle class employment prospects. Major large scale manufacturers aren’t coming back, so the idea of traditional work at the plant is largely gone.

So what’s left in the middle? There are basically three things: 1) government employment (which is shrinking because we’re in a fiscal squeeze 2) skilled trades (a viable path more people probably should follow, but sometimes with its own limits such as having a connection to get you into the union) 3) start a business to create your own opportunity.

Regulatory change is targeted right at #3. Let’s make it easy for people to start businesses and support the best path to the middle class we have. And also the best path to creating traditional employment in city neighborhoods where high end banks and internet companies and such aren’t setting up shop. Many of these neighborhoods have seen their job base obliterated. By reducing the barriers to entry and success in business, we are helping people create their own jobs – and maybe to create jobs for others down the road.

There’s only one major challenge to local small business regulatory relief – political will. Change isn’t necessarily financially difficult, it’s politically difficult. But how many mayors are championing small business? Next to none. Compare how much effort big city mayors put into improving their business climate for traditional small businesses vs. say select segments like tech, and you see right away where the priorities are.

The stories of the insane difficulties small businesses have to go through in places like New York, Chicago, and San Francisco are incredible and widely known but rarely feature in the urbanist discourse unless it’s a hip establishment like a frozen custard stand, a high end shared kitchen, etc. When even a guy like Matthew Yglesias experiences pain trying to set up his one man shop, imagine how hard it must be for everybody else? We have no clue what lower income, minority, and immigrant entrepreneurs must be going through to pursue their dream of starting a business.

What we need is for America’s mayors to stand up and make it a priority to start whacking away at this stuff. Waive fees for the first year for most permits (easy to do by charging in arrears). So many small businesses don’t even make it a year. Let’s give them at least that long to survive before we start socking them. Create a single point of contact for permit checklists and safe harbor protections for businesses that do what this office tells them. A true one stop shop would be best, but that’s likely harder than we think given the different agencies involved, but why not start by at least having someone who authoritatively tells you want agencies you do need to talk to and which permits you do need? Price permits at the cost of administering the permitting and compliance system. Hold management accountable for timely actioning. Use electronic forms wherever possible. The list goes on.

Part of this is simply resisting the urge to pile on one regulation after the next. For example, a recent urbanist darling is banning plastic bags. The impact on the environment will be almost precisely zero, but it’s just one more thing businesses have to deal with. As Rhode Island Builder’s Association Executive Director John Marcantonio put it, “It’s not one specific regulation, it’s death by a thousand paper cuts.” Before adding on a new regulation, we should be sure there’s an absolute, bona fide need to. Because if we don’t, then over time we’ll accrete an absolute mess that makes it way too difficult to do things we actually want people to do.

I’d go so far as to that that if you’re a mayor who isn’t putting a serious focus on improving the regulatory climate for small business, you’re not serious about retaining or building a middle class and stopping the development of a two tier economy. Especially in big cities this is a huge, well known need. There’s no excuse for mayors of either conservative or progressive bents not putting a major push behind making it happen.

Aaron M. Renn is an independent writer on urban affairs and the founder of Telestrian, a data analysis and mapping tool. He writes at The Urbanophile, where this piece originally appeared.

Self employment photo by BigStockPhoto.com.

May the (Insidious) Force Be With You

$
0
0
Google Earth pic to the left of the boundary between Detroit and suburban Grosse Pointe Park, MI. Alter Road (cutting from upper left to lower right) is the boundary between the two. Take note of the differences in vacant land between Detroit (on the left) and Grosse Pointe Park (on the right).

Too many people think today’s “de facto” segregation in metro areas is the result of personal preferences expressed by individuals, when the fact is that public policy has created the conditions we live with today.  In fact, I see the demise of Jim Crow through the Civil Rights Act and the Voting Rights Act corresponding with the immediate rise of an insidious, “non-racist” racism that shapes our metros today.  Our metro areas have never dealt with this.

In the aftermath of the Donald Sterling controversy (which, if you aren’t aware of, you truly are under a rock), the Atlantic’s Ta-Nehisi Coates posted an on-spot critique of how racism is viewed and how racism is really working in today’s society.  It is a truly beautiful piece on the perception of racism versus its realities — the perception being that racism is the purview of dunces like Sterling (and Cliven Bundy before him) who get caught making inelegant statements that shed light on their true feelings, and a reality that is far more insidious and receives far less attention.  Coates describes how “elegant racism”, that insidious force, shapes where we live, what jobs are available to us, how we’re educated, and who is incarcerated and who isn’t:

“Elegant racism is invisible, supple, and enduring. It disguises itself in the national vocabulary, avoids epithets and didacticism. Grace is the singular marker of elegant racism. One should never underestimate the touch needed to, say, injure the voting rights of black people without ever saying their names. Elegant racism lives at the border of white shame. Elegant racism was the poll tax. Elegant racism is voter-ID laws.”

And to better describe how “elegant racism” works, he cites Chicago as its key implementer:

“Throughout the 20th century—and perhaps even in the 21st—there was no more practiced advocate of housing segregation than the city of Chicago. Its mayors and aldermen razed neighborhoods and segregated public housing. Its businessmen lobbied for racial zoning. Its realtors block-busted whole neighborhoods, flipping them from black to white and then pocketing the profit. Its white citizens embraced racial covenants—in the ’50s, no city had more covenants in place than Chicago.

If you sought to advantage one group of Americans and disadvantage another, you could scarcely choose a more graceful method than housing discrimination. Housing determines access to transportation, green spaces, decent schools, decent food, decent jobs, and decent services. Housing affects your chances of being robbed and shot as well as your chances of being stopped and frisked. And housing discrimination is as quiet as it is deadly. It can be pursued through violence and terrorism, but it doesn’t need it. Housing discrimination is hard to detect, hard to prove, and hard to prosecute. Even today most people believe that Chicago is the work of organic sorting, as opposed segregationist social engineering. Housing segregation is the weapon that mortally injures, but does not bruise.”

(Let’s parenthetically stop here for a second; the symbolism in that last sentence is incredible.  The implication is that victims of elegant racism “die” from internal injuries, which are often believed to be sustained from a lifetime of poor personal choices.  But elegant racism made those choices for them.  Absolutely incredible).

I don’t know if Chicago was the innovator of this type of racism, but I do believe it was something created in Northern industrial cities — i.e., the Rust Belt.  I suspect it has its seeds in the antebellum North, whose cities had small African-American populations prior to the Civil War and immediately afterwards.  I imagine at that time, when blacks comprised maybe less than five percent of, say, Buffalo’s population, it was relatively easy to isolate blacks without necessarily singling them out, as in the Jim Crow South.

But the Great Migration changed everything.  The need for industrial labor in the North, and rapidly declining conditions in the Jim Crow South, pushed African-Americans into Northern cities.  Once there they encountered competition for jobs and housing from both longtime “nativists” and more recent European immigrants.  The ten years from 1910-1920 were fraught with racial conflicts in Northern cities, culminating with the Red Summer of 1919.

But Northern cities did something that Southern ones did not.  They sought to limit and stigmatize the places where blacks lived, instead of limiting or stigmatizing the people themselves.  Out of this a whole set of policies emerged.  Racial covenants.  Redlining emerges during the New Deal.  Blockbusting came about as a tool to clear room for a growing black population, accelerate suburban expansion, and enrich real estate speculators.  Public housing was concentrated where blacks lived, and infrastructure investments ground to a halt.  Investments in education fell behind that of suburban schools, or couldn’t keep up with growing social challenges.  “Tough-on-crime” measures like mandatory sentencing and the “War on Drugs” were effective in removing potential workers from the workforce, reducing competition.  Taken together, these “non-racist” racist policies, often grounded in sound, rational economic thinking, created deeply ingrained patterns within metros that shape them today.

This position is further buffeted by research done by Nancy DiTomaso, a business professor at Rutgers University in New Jersey.  In her book, The American Non-Dilemma: Racial Inequality Without Racism, she says this:

“Because whites disproportionately hold jobs with more authority, higher pay, more opportunities for skill development and training, and more links to other jobs, they can benefit from racial inequality without being racists and without discriminating against blacks and other nonwhites. In fact, I argue that the ultimate white privilege is the privilege not to be racist and still benefit from racial inequality.”

There are other strong claims made by DiTomaso in that interview; it (and the book, which I loved) is worth your attention.

In my opinion the practice was perfected in the Rust Belt but has spread everywhere.  Milwaukee Journal-Sentinel is doing a series on political segregation in southeastern Wisconsin, and found that its roots are in the state’s residential segregation legacy.  Lee Atwater’s famous quote about the abstraction of racial policies, uttered in 1981, possibly signaled to Southern metros that there was a way to accomplish the separation that Jim Crow had earlier provided.  I see a correlation between the number of blacks within a metro area, and the impact of insidious policies on residential and job patterns.  In some metros, the impact, while there, is not as strong (New York, Boston), because of lower relative numbers of blacks.  In some Sun Belt metros, Jim Crow likely enforced similar patterns but subsequent post-War growth and the new policies altered things a little (Atlanta, Charlotte, Nashville).  In other Sun Belt metros with more recent growth the numbers of blacks has hardly been enough for full-on “elegant racism” implementation (Phoenix, Las Vegas).  But insidious racism is a critical feature of today’s Rust Belt cities.

This is in part why I’m skeptical of new calls from urbanists to increase affordable housing in cities, when I see vast neighborhoods that have suffered from policies that simply removed them from the consciousness of the majority of the housing market.  I’d prefer to address yesterday’s mistakes before creating new ones.

Plus, I keep thinking about that saying that the only thing necessary for evil to prosper is for good people to do nothing…

This post originally appeared in Corner Side Yard on May 9, 2014.

Pete Saunders is a Detroit native who has worked as a public and private sector urban planner in the Chicago area for more than twenty years.  He is also the author of "The Corner Side Yard," an urban planning blog that focuses on the redevelopment and revitalization of Rust Belt cities.

Population Growth as the Cure for the Incredible Shrinking City?

$
0
0

The 1957 sci-fi classic The Incredible Shrinking Man reads like a Rust Belt city script. In it, the lead actor is afflicted with the anti-natural: shrinkage in a world of growth. The rest becomes existential. From the movie review blog“Twenty Four Frames”:

He hates being a scientific experiment and a spectacle for the media. He is no longer the everyday 1950′s image of the middle class, white picket fenced American man. Instead, he now fights for survival in his own house where everyday objects are now the enemy to his existence. Finally, he must face the biggest question of all. If he continues to shrink, will he eventually even exist?

Such is the mood behind revitalization efforts in shrinking city America, particularly the Rust Belt. There, population decline has been occurring for decades. It still occurs. The Cleveland metro lost nearly 83,000 people from 2000 to 2012. The Pittsburgh metro lost over 67,000. This is in contrast to the region’s “greenfield economies”—defined as “the set of conditions that flow from building on new territory or exploiting new markets vs. the redevelopment of old places”. For example, the geographically-expanding Columbus metro added 260,000 people from 2000 to 2012. The top feeder region into Columbus was Greater Cleveland.

The dynamics behind these demographic patterns are fairly intuitive. Population gains and losses are a factor of a region’s employment picture. Cleveland Fed economist Joel Elvery explains:

Urban economists like to divide a regional economy into two sectors: tradable and nontradable. The tradable sector produces goods and services that are sold outside of the region; the nontradable sector produces goods and services for use in the region…If the industries that make up the tradable sector are growing nationally, then the region will most likely grow. If the tradable sector is struggling, eventually the region will also struggle.

In the case of Cleveland, one of the region’s main tradable sectors is manufacturing. That said, technological advances in manufacturing means it takes less people to make a product. In the 1950s an auto worker made on average seven cars per year. A worker can make 28 today. The effect of the increased productivity is a loss of jobs. The effect of job loss is a declining population.

Put a fork in the Rust Belt, right?

Not exactly. Figure 1 shows the metro per capita income for Cleveland, Pittsburgh, and Columbus. The metros’ incomes were even around 2003, but then Pittsburgh and Cleveland began diverging from Columbus around 2005. Of importance here is that Pittsburgh and Cleveland have had higher per capita income growth than Columbus despite their declining population. This goes against the grain of traditional urban development thinking in which growth is god.

Figure 1: Source, US Bureau of Economic Analysis via Telestrian


Looking at real per capita income at purchasing power parity (PPP), or income adjusted for inflation and how far a dollar goes in a given metro, the trends hold. The map below shows the real per capita income (PPP) for all metros for the United States. Notice Greater Cleveland and Greater Pittsburgh stand out, with values at or above $42,000 a year. In fact, in ranking the nation’s largest metros (over 1 million people), the highest real per capita metros were Hartford, Boston, and San Francisco, followed by Pittsburgh 6th and Cleveland 11th. Not bad for “dying” metros. Columbus clocked in at 28th, while peer Rust Belt metro Detroit was 44th out of 51.

Map: Map of real per capita personal income adjusted for inflation (in 2005 chained dollars) and regional purchasing power. In thousands of dollars (2011). Source, U.S. Bureau of Economic Analysis via Telestrian.


Why is greater per capita income growth happening in the Rust Belt compared to Columbus? We have to keep in mind that a rising per capita income is not necessarily associated with a robust economy, particularly for regions that have flat or declining populations. Specifically, a metro, such as Cleveland, can gain in per capita income simply due to a significant out-migration of low- and middle-income workers. Such a scenario could prove problematic if the area’s total personal income is decreasing across time, because then the overall economy is contracting.

But this is not the case. Figure 2 shows the total personal income for the three metros from 2000 to 2012. Both Cleveland’s and Pittsburgh’s total personal income levels increase despite declining populations. This effect has been called “growth without growth” by the Brookings Institution, and it occurs when a workforce is becoming more educated and productive at the same time overall population declines.

Figure 2: Source, US Bureau of Economic Analysis

This is what is happening in the Cleveland metro. Data from a new study I co-authored with Jim Russell out of the Center for Population Dynamics at Cleveland State University showed that from 2000 to 2012, Greater Cleveland gained over 63,000 educated residents, while simultaneously losing nearly 74,000 residents without a college degree. Over two-thirds of this brain gain occurred between 2006 and 2012. The fastest growing cohort was for college-educated Greater Clevelanders 65 and plus—a 30% increase. The number of Greater Clevelanders with a college degree aged 25 to 34 increased by 23%. Conversely, the vast majority of the out-migration was made by people aged 35 to 44 without a 4-year degree.

This population dynamic is partly the result of Cleveland’s restructuring from a labor- into a knowledge-based economy. Specifically, growing tradable industries, like STEM and health care employment—which have driven job growth in Cleveland—are able to attract and retain skilled residents, whereas slower-growth industries are “pushing” less skilled workers elsewhere. Many of these non-degreed workers find a better return on investment in areas that are gaining in population, particularly if they are employed in the local consumer economy. Think laborers and much of the service class. This notion is supported by the fact that from 2000 to 2011, the average income of a person that moved from Greater Cleveland to Greater Columbus was $38,000 a year. Such a re-positioning of less-educated workers partly explains that while the Columbus metro is gaining on Greater Cleveland in total income, it is not the case with per capita income. Notes the Cleveland Fed: “Per capita income growth [in Columbus] is under increasing pressure to continue rising as population growth exceeds income growth”.

So yes, Cleveland shrinks. But it is not about brain drain, but about rational choice theory. And while population loss is troubling for any city, it is in many respects a necessary demographic result as a region like Greater Cleveland transitions from brawn- to brain-intensive work.

Think of this as a “one step at a time” approach to the existential plight that is the incredible shrinking city—meaning Cleveland’s migration needs are currently about quality, not quantity. This is because economic growth is not likely to be achieved through an increase in local consumption. Local jobs are created from emerging tradable industries, not vice versa—five service jobs are made for every new high-skill job in fact. And emerging industries are created via human capital, not consumer demand.

“Consumer demand does not necessarily translate into increased employment,” writes John Papola in Forbes. “That’s because ‘consumers’ don’t employ people. Businesses do.”

So where does Cleveland go from here?

It needs to look to Pittsburgh. The sister Rust Belt city has had a human capital formation that has been nothing short of astonishing. University of Pittsburgh economist Chris Briem calculated that the metro ranked fifth in the nation when it came to the percentage of young adult workers with a bachelor’s degree, behind only Boston, San Francisco, D.C., and Austin. What’s more, Greater Pittsburgh ranked first for the highest concentration of young adult workers with a graduate or professional degree.

“Change in the Pittsburgh economy is reflected in many ways,” writes Briem, “but probably no more profoundly than in the educational attainment of its workforce”.

Greater Cleveland doesn’t perform too shabbily either, ranking 17th in the nation in the number of young adult workers with a bachelor’s degree, and 7th in the nation for young workers with a graduate or professional degree, ahead of knowledge hub darlings Seattle and Austin.

In other words, Cleveland’s got something to build on: the quality of its young adult workforce. So instead of dumping money on brain drain boondoggles, or expending significant public expenditure on things like hotels and casinos that intend to drive economic growth from consumption on up, the region needs to pull out all the stops on growing a critical mass of talent. Because, as my colleague Jim Russell puts it, “talent is the new oil”.

Eventually, once the region’s new economy sectors are revved up, then job growth for both skilled and less skilled work will increase, making the region amenable to population gain. This is the case in Pittsburgh, where population loss has recently turned into a slight gain after decades of decline (See Figure 3).

Figure 3: Source, American Community Survey, Bureau of Economic Analysis


But until that growth happens the Rust Belt will be stubbornly mired in its existential crisis. Shrinking, struggling, and wishing on silver bullets and outdoor chandeliers. But maybe there is room for measured hope. More exactly, we shrink therefore we are?

"I was continuing to shrink, to become... what? The infinitesimal? What was I? Still a human being?,” wonders the incredible shrinking man in the film’s closing monologue. “Or was I the man of the future?”

Well, considering what the cost of living is doing to the coasts, maybe the notion of Pittsburgh as the city of the future isn’t so farfetched. The Clevelands of the world would be wise to wager so, and then model accordingly.

Richey Piiparinen is a Senior Research Associate who leads the Center for Population Dynamics at the Levin College of Urban Affairs at Cleveland State University. His work focuses on regional economic development and urban revitalization.

Top image: Courtesy of Universal Pictures

Reversing American Decline

$
0
0

Across broad ideological lines, Americans now foresee a dismal, downwardly mobile future for the country’s middle and working classes. While previous generations generally did far better than their predecessors, those in the current one, outside the very rich, are locked in a struggle to carve out the economic opportunities and access to property that had become accepted norms here over the past century.

This deep-seated social change raises a profound dilemma for business: Either the private sector must find a way to boost economic opportunity, or political pressure seems likely to impose policies that will order redistribution from above. It is doubtful the majority of Americans will continue to support an economic system that seems to benefit only a relative few. Looking at our unequal landscape, one journalist recently asked: “Are the bread riots finally coming?”

By 2020, according to the Economic Policy Institute, almost 30% of American workers are expected to hold low-wage jobs, with earnings that would put them below the poverty line to support a family of four. The combination of high debt and low wages has some projections suggesting millennials may have to work until their early 70s.

But our new pessimism and widening class divide stems not only from the concentration of wealth and power, but from the persistence of weak economic growth.

Neo-populist groups on the left and the right have risen to employ political pressure to try and assure a decent quality of life. Ideologically robust liberals, like New York Mayor Bill de Blasio, have emerged as national symbols of a movement in which cities have pushed strong moves like a $15 minimum wage (Seattle) and benefits for workers. Ironically, these are often the same places where wealth is most intensely concentrated and where the middle class has shrunk as a newly dominant, Obama-aligned Clerisy of public employee unions, government officials, academics and artists has gained the preponderance of political power.

The same sense of limited opportunity that drives the new progressives also motivates the popularity of libertarian and Tea Party activism on the right. Instead of state intervention, these groups have been attracted to the notion that removing barriers to economic growth will increase social mobility more effectively than redistribution by political fiat.

But these economic arguments that could generate more widespread support have been married with increasingly unpopular, often backward-looking social agendas that have allowed the Clerisy to portray them as fringe movements.

This has allowed Obama, de Blasio and others shape a new conversation centered on inequality, rather than growth. Oddly enough, it’s a model that relies on Europe’s example even as the continent’s own economic prospects appear dismal, and mainstream political parties there are registering their lowest levels of popular support in decades.

Though it can help some in the short run, there is little reason to think that more redistribution by the state would improve material conditions over the long term for our working and middle classes, let alone expand them. Rather, it might end up expanding our underclass of technological obsolete and economically superfluous dependents. The 50-year War on Poverty, for example, has achieved few gains since the 1960s despite fortunes spent. Instead, the only significant gains in poverty reduction, at least among those working, have come when both the economy and the job market expand, as they did during the Reagan and Clinton eras.

Clearly, as both those Presidents recognized, the best antidote to poverty remains a robust job market.

Yet even this progress has not helped the poorest of the poor, many of whom are marginally, if at all, connected to the workplace. Since 1980, the percentage of people living in “deep poverty”-with an income 50% below the official poverty line — has expanded dramatically. Despite now spending $750 billion annually on welfare programs, up 30% since 2008, a record 46 million Americans were in poverty in 2012.

It is possible that, as Franklin Roosevelt warned, a system of unearned payments, no matter how well intended, can serve as “a narcotic, a subtle destroyer of the human spirit” and reduce incentives for recipients to better their own lives.

The activist welfare-based philosophy, following the European model, would likely include not only historically poor populations, but part-time workers, perpetual students, and service employees living hand to mouth, who can make ends meet largely only if taxpayers underwrite their housing, transportation and other necessities. This trend towards an expansive welfare regime could be bolstered by our falling rates of labor participation — now at its lowest level in at least 25 years, and showing no signs of an immediate turnaround.

And the European model shows little evidence of the benefits of redistribution given the persistently high rates of unemployment, particularly among the young, across most of the EU; indeed much of the continent’s youth are widely described as a “lost generation.” Pervasive inequality and limited social mobility have been well-documented in larger European countries, including France, which has one of the world’s most evolved welfare states. It is even true in Scandinavia, often held up as the ultimate exemplar of egalitarianism, but where the gap between the wealthy and other classes have increased in Sweden four times more rapidly than in the United States over the past 15 years.

To be sure, progressive, or even ostensibly socialist approaches can ameliorate the worst impact of economic decline on lower-income people. But under left-wing governments — Socialists in France, New Labour in Britain and the Obama Administration in the U.S. — class chasms have increased markedly under leaders who insist their policies will reduce inequality. Much the same has occurred in countries with more conservative approaches.

In the absence of a focus on growing economies more rapidly and broadly, both political philosophies fall short.

But maintaining the prospect of upward mobility is central to the very idea of America. For generations, the surplus working class populations of the world have flocked here in search of opportunities unavailable in their home countries. In contrast, there remain few places for America’s aspirational classes to go.

Fortunately, the capitalist system, particularly under democratic control, allows for the possibility of reform. Take Great Britain, the homeland of the industrial revolution. In response to mass poverty and serious public health challenges during the 19th century, social reform movements led by the clergy and a rising professional class organized to address the most obvious defects caused by economic change. It is one of history’s great ironies that at the very time that Karl Marx was composing Das Kapital in the library at the British museum, life was rapidly improving for the British working class. Far from having “exhausted its resources” and precipitating all-out class war, the inequality so evident in mid-19th Century Britain began to narrow through natural economic forces and the growing power of working-class organizations. The working-class revolution in Britain, which Friedrich Engels insisted “must come,” never did.

Similarly, the Depression, brought on by what Keynes called “a crisis of abundance,” was addressed more by measures to spur mass demand than relying on redistribution. The New Deal, and then the Second World War, expanded government support for public works, education and housing, as well as infrastructure and research and development. Programs enacted then and after the war also encouraged widespread property ownership.

This state expansion was generally aimed at increasing economic opportunity-for example, by developing technologies that could stimulate new industrial sectors, new firms, and create new wealth. Today’s, on the other hand, is simply transferring income from one group to another.

Whatever criticisms can be made of mid-century America, during this period the nation transformed what had been a strongly unequal country into one where the blessings of prosperity were more broadly shared. In the 1950s, the bottom 90% held two-thirds of the wealth here. Today they barely claim half.

Sparking beneficial economic growth requires a shift in priorities, and thus presents a challenge to the new class order dominated by Wall Street, the tech oligarchy and their partners in the Clerisy. It is not enough merely to blame the so-called 1%, but to shift the benefits of growth away from the current hegemons, notably in the very narrow finance and high-tech sectors, and towards those involved in a broad array of productive enterprise.

The American economy’s capacity for renewal remains much greater than widely believed. Rather than a permanent condition of slow growth, the United States could be on the cusp of another period of broad-based expansion, spurred in part by its rapidly growing natural gas and oil production — a once-in-a-lifetime opportunity as cheap and abundant natural gas is luring investment from manufacturers from Europe and Asia, and providing good-paying American jobs.

This, along with growth in manufacturing, could spark better times for the middle class, as would the re-igniting of single-family home construction.

If America really wants to confront its growing class divide, it needs to spark such broad-based economic growth, rather than simply feathering the nests of the already rich, privileged and well-connected.

This story originally appeared at New York Daily News..

Joel Kotkin is executive editor of NewGeography.com and Distinguished Presidential Fellow in Urban Futures at Chapman University, and a member of the editorial board of the Orange County Register. He is author of The City: A Global History and The Next Hundred Million: America in 2050. His most recent study, The Rise of Postfamilialism, has been widely discussed and distributed internationally. He lives in Los Angeles, CA.

Unemployed photo by BigStockPhoto.com.

Taking a Back Seat to Texas

$
0
0

The most important news recently to hit Southern California did not involve the heinous Donald Sterling, but Toyota’s decision to pull its U.S. headquarters out of the Los Angeles region in favor of greater Dallas. This is part of an ongoing process of disinvestment in the L.A. region, particularly among industrially related companies, that could presage a further weakening of the state’s middle class economy.

The Toyota decision also reflects the continued erosion of California’s historic economic diversity, which provided both stability and a wide variety of jobs to the state’s workers. We have seen this in the collapse of our once-burgeoning fossil-fuel energy industry, capped this year by the announced departure from Los Angeles of the headquarters of Occidental Petroleum. Blessed with huge fossil fuel reserves, California once stood as one of the global centers of the energy industry. Now, with the exception of Chevron, which is shifting more operations out of state, all the major oil companies are gone, converting California from a state of energy producers to energy consumers, and, in the process, sending billions of dollars to Texas, Canada and elsewhere for natural gas and oil that could have been produced here.

As did the oil industry, the auto industry, and, particularly, its Asian contingent, came to Southern California for good reasons. Some had to do with proximity to the largest port complex in North America, as well as the cultural comfort associated with the large Asian communities here. Back in the 1980s, the expansion of firms like Honda, Toyota and Nissan seemed to epitomize the unique appeal of the L.A. region – and California – to Asian companies. Today, only Honda retains its headquarters in Los Angeles (Nissan left in 2005), while Korean carmakers Hyundai and Kia make their U.S. homes in Orange County.

Retaining these last outposts will be critical, as Southern California struggles to retain its once-promising role as a true global city. With the exception of the entertainment industry – itself shifting more production out of town – our region is devolving toward marginality, largely as a tourist and celebrity haven.

Still, I’m concerned less about the region’s reputation than about the economic trajectory of its middle and working classes. The Toyota relocation from Torrance will eliminate 3,000 or more generally high-wage jobs, something that usually accompanies the presence of headquarters operations. It will cost the region, most particularly, the South Bay, an important corporate citizen, as, over time, the carmaker will likely shift its philanthropic emphasis toward Texas and its various manufacturing sectors.

Perhaps more disturbing are the fundamental reasons behind the Toyota move. According to Toyota’s U.S. chief, James Lentz, they weren’t even courted by Texas, which has fattened itself on California’s less-competitive business climate.

Some of Toyota’s reasoning is geographical. The port link is less essential now since close to three-quarters of Toyota’s vehicles sold in the U.S. are built here, up from 58 percent in 2008. At the same time, the growth of the “Third Coast” ports – Houston, Mobile, Ala., New Orleans and Tampa, Fla. – buoyed by the widening of the Panama Canal, makes it increasingly easy to ship components or cars in and out of the central U.S.

More troubling still is the logic, both on the part of Nissan and Toyota, linking headquarters operations – with their marketing, design and tech-oriented jobs – closer to their industrial facilities in the south and Midwest. Toyota, for example, has a large truck plant in San Antonio as well as auto assembly plants throughout the mid-South. Honda, now the last major Japanese carmaker with a Southern California headquarters, last year also moved a number of executives from Torrance to Columbus, Ohio, closer to the company’s prime Marysville, Ohio, production hub.

This pattern contradicts the notion, popular in both the Jerry Brown and Arnold Schwarzenegger administrations, that California’s massive loss of industrial jobs over the past decade can be offset by the creative industries, notably Hollywood and Silicon Valley. Since 2010, California has managed to miss out on a considerable industrial boom that has boosted economies from the Rust Belt states to the Great Plains and the Southeast. Los Angeles and Orange counties, the epicenter of the state’s industrial economy, have actually lost jobs. Since 2000, one-third of the state’s industrial employment base, 600,000 jobs, has disappeared, a rate of loss 13 percent worse than the rest of the country.

But, the prevailing notion in California’s ruling circles seems to be, if you have Google and Facebook, who needs dirty, energy-consuming factories or corporate operations filled with middle managers? Silicon Valley crony capitalists and urban developers who support our political class, and are willing participants in various subsidized green energyschemes, have little interest in traditional manufacturing, regardless the damage inflicted on blue-collar workers, whom progressives are happy to subsidize (and thus gain their unending support) outside the labor force or keep severely underemployed.

The deindustrialization of California was one reason behind the withdrawal of both Nissan and Toyota. Each automaker has established strong manufacturing operations in the mid-South and wanted to integrate technology, production, sales, marketing and design as a way to keep an edge in the competitive global industry. An area that seems determined to let its industrial base wither is not likely to attract companies whose basic business is building things.

What is too rarely understood is the link between production skills and high-end jobs. The Toyota jobs that are leaving L.A. County are largely white-collar and skilled. Toyota engineers will be headed to Texas, and many also to Michigan, where, despite the travails of the past few decades, the engineering base is already very deep – roughly twice as strong per capita as formerly engineer-rich Los Angeles.

This link between manufacturing and higher-end technical jobs is rarely appreciated among our political class. As President Clinton’s Board of Economic Advisors Chairman Laura D’Andrea Tyson points out, manufacturing is only about 11 percent of gross domestic product, but it employs the majority of the nation’s scientists and engineers, and accounts for 68 percent of business research and development spending, which, in turn, accounts for about 70 percent of total R&D spending.

Of course, neither Jerry Brown nor any other reigning political figure would cavalierly dismiss manufacturing jobs, or even those at a major port. Yet, as we move toward ever-higher energy prices – likely aggravated by California’s “cap and trade” regime against global warming – industrial firms seem increasingly reluctant, at least without massive subsidies, to move to or expand in California. And, contrary to arguments offered in Sacramento, and reflected in much of the media, there are never going to be enough “green” jobs to make up the difference.

Indeed, even Elon Musk, head of electric-car maker Tesla, though a primary beneficiary of California crony capitalism, is not considering the state for a proposed $5 billion battery plant, which would employ upward of 6,500.

In its nonresponse to the Toyota move, the Governor’s Office stressed the state’s role as the epicenter of the “new electric, zero-emission and self-driving” vehicle industry. Nevertheless, even as devout a “green” company as Tesla will likely locate its battery factory in Nevada, Arizona, New Mexico or Texas. California, reportsgreentechmedia.com “didn’t make the short list because of the potential for regulatory and environmental delays.”

For a state that has built its future vision on “green” industry, this is both ironic and tragic. It may not bother the Legislature, whose welfare state is now being propped up by windfall tech profits, but it leaves many localities outside the Silicon Valley exposed to more job and company losses. Think of Torrance Mayor Frank Scotto, who concedes the struggle to keep companies around is becoming ever more difficult. “A company can easily see where it would benefit by relocating someplace else,” Scotto said.

Even so, it is unlikely that Toyota’s leaving will impact the state’s leftward political trajectory. After all, if the New York Times regularly describes the California economy – fattened by stock market and real estate gains of the very rich – as “booming,” why should Gov. Brown, about to run for re-election, say otherwise, proclaiming to anyone who will listen that “California is back.”

True, California may not be in a Depression, as some conservatives contend, but it’s hardly accurate to proclaim the Golden State as back from the brink. But, if having among the country’s highest unemployment rates, the worst poverty levels, based on living costs, and being home to one-third of all U.S. welfare recipients can’t persuade the gentry about California’s true condition, Toyota’s move certainly won’t.

This article first appeared in the Orange County Register.

Joel Kotkin is executive editor of NewGeography.com and Distinguished Presidential Fellow in Urban Futures at Chapman University, and a member of the editorial board of the Orange County Register. He is author of The City: A Global History and The Next Hundred Million: America in 2050. His most recent study, The Rise of Postfamilialism, has been widely discussed and distributed internationally. He lives in Los Angeles, CA.

Photo: Toyota Corolla by Paulo Keller

China's Ascent in World Transport

$
0
0

After years of closing the gap with the United States, China built enough freeways in 2013 to amass the greatest length of freeways in the world. Between 2003 and 2013, China expanded its national expressway system, with interstate (motorway in Europe) standard roadways from 30,000 to 105,000 kilometers (18,000 to 65,000 miles). This compares to the 101,000 kilometers (63,000 miles) in the United States in 2012. China's freeway system is also longer than that of the European Union, which was 70,000 kilometers in 2010 (43,000 miles) and Japan (8,000 kilometers or 5,000 miles) as is indicated in Figure 1 (Note 1). The ascent of China is evident across the spectrum of transport data, both passenger and freight.

A review of transport statistics in the four largest world economies (nominal gross domestic product) shows considerable variation in both passenger and freight flows. It also reflects the rapid growth of China. Generally comparable and complete data is available for the European Union, the United States, China and Japan.

Passenger Travel

All four of the world's largest economies rely principally on roads for their passenger transport. The United States continues to lead in road volume (in passenger kilometers, see Note 2) by a substantial margin, followed by the European Union. In the United States, automobiles account for 83 percent of domestic passenger travel, which compares to 76 percent in the European Union and 58 percent in Japan. China's combines automobile and bus data, which makes it impossible to obtain automobile comparisons with the other three economies.

Road travel increased more than 150 percent between 2003 and 2013 in China. Yet roads have barely held their market share as China has built new world-class airports, such as Capital City in Beijing, Baiyun in Guangzhou and many others. Over the same 10 years air travel has increased 350 percent. Meanwhile, China has built the world's most extensive high-speed rail system and has experienced healthy rail travel growth. Yet, despite this, passenger rail's market share has dropped from 35 percent to 29 percent over the period (Figure 2).

China is dominant among the four economies in passenger rail volumes, with its 1.05 trillion annual passenger kilometers (0.65 trillion passenger miles) accounting for more than 2.5 times the rail travel in both the European Union and Japan. US rail travel is no more than 1/20th that of China (equal to the road travel volume in the state of Arkansas).

The United States continues to lead in a domestic airline travel, with a volume approximately 60 percent greater than those of the European Union and China. China trails the European Union by only two percent and with its growth rate seems likely to assume the second position before long (Figure 3).

Passenger travel market shares are indicated in Figure 4.

Freight Transport

After having led the world in rail freight volumes in recent decades, the United States has recently yielded the title to China. In 2013, China moved nearly 3 trillion tonne kilometers (Note 3) of freight by rail, compared to the US total of 2.5 trillion (2012). It may be surprising to find out that Europe, with its extensive passenger train system moves so little of its freight by rail. However, the European Union moved approximately 60 percent less of its freight by rail. However, much of the capacity of the EU's rail system is consumed by passenger trains, leaving little for freight.  This is despite a policy commitment in the EU to substantially increase the rail freight market share relative to trucks. As a result, in Europe, the freight trains are "on the highway" (see Photo below). China has been uniquely successful among the world's economies in developing both a world class freight rail system and a world class passenger rail system. One of China's early objectives in developing its high speed rail program was to free space for its large freight train volumes.


Caption: Trucks on the A7, north of Barcelona (by author)

Among other nations, only Russia can compete with China and the United States in rail freight, having moved approximately 2.2 trillion tonne kilometers in 2012.

Rail freight remains by far the most important in the United States compared to the other three largest economies. Rail freight continues to carry more tonne kilometers in the United States than trucks. The situation is much different in Europe, where trucks carried four times the volume of freight rail. Rail freight is even less significant in Japan, where trucks carry more than 15 times the volume of rail freight.

One possibly surprising fact lies with the substantial increase in China's truck volumes over the last decade. China now has a volume of truck traffic that is four times that of trucks in either the European Union or the United States.

In 2003, trucks carried 60 percent less of the nation's metric tonne mileage than freight rail. By 2013, that had been reversed with tracks carrying 130 percent more volume than freight rail.

However China's dominance is even greater in water borne freight, at nearly 6 times the European Union volume and more than 10 times the volume of the United States (Figure 5). Even so, China's largest freight volumes are carried on waterways, such as the Yangtze River. Over the past 10 years waterway volumes tripled. It is even expected that there will be a significant increase in shipping on the ancient Grand Canal (Figure 6).

Freight market shares among the major modes are shown in Figure 7.

India

Another of the world's largest economies, India, also relies heavily on roads. According to the World Bank 65 percent of the freight and nearly 90 percent of passengers are carried by roads in India, though late detailed data is not available. Yet India also has the largest passenger rail usage in the world. Only China is close, and the two nations have been near equal, at least over the last decade. In 2003, China trailed India by seven percent in passenger kilometers by train. Complete Indian Railway data for 2013 is not yet available. However, if the average trip length in 2013 was the same as in 2012, China will have moved to within two percent of India's passenger rail volume. Both nations are far above Japan and the European Union, ranked third and fourth, and almost 90 percent above Russia, which has a reputation for high passenger rail volumes.

The Future

With economic growth in China slowing (though still at rates that would satisfy virtually any other nation) its transport growth of the past decade seems likely to moderate. On the other hand, the other large emerging economy, India, which has substantially trailed China, could assume a Chinese trajectory. The newly elected Bharatiya Janata Party (BJP) government is committed to economic advance and infrastructure development. Market facilitating policies like those that have propelled China (see the late Noble Laureate Ronald Coase and Ning Wang, How China Became Capitalist), could lead to a similar story about India in a decade or two.

------

Note 1: The latest data on international transport varies by year, even within nations (such as the United States). This analysis compares the latest data, which is 2012 (Europe and Japan), 2013 (China) and the United States (2011, with some 2009). This latest years available permit comparing the general scale of differences and, particularly in the United States, changes from the earlier data are likely to have been modest, as a result of the Great Financial Crisis and the great economic malaise that has followed. The principal data sources are the Bureau of Transportation Statistics in the United States, the National Bureau of Statistics in China and Eurostat for the European Union and Japan.

Note 2: A passenger kilometer (or passenger mile) is the distance traveled times the number of passengers. Thus, a car going 5 kilometers with one passenger produces 5 passenger kilometers. With two passengers, there are 10 passenger kilometers.

Note 3: A tonne kilometer is a metric tonne (2.204 pounds or 1,000 kilograms) of freight times the number of kilometers traveled. The US ton (short ton) has 2,000 pounds or 907 kilograms.

----

Wendell Cox is principal of Demographia, an international public policy and demographics firm. He is co-author of the "Demographia International Housing Affordability Survey" and author of "Demographia World Urban Areas" and "War on the Dream: How Anti-Sprawl Policy Threatens the Quality of Life." He was appointed to three terms on the Los Angeles County Transportation Commission, where he served with the leading city and county leadership as the only non-elected member. He was appointed to the Amtrak Reform Council to fill the unexpired term of Governor Christine Todd Whitman and has served as a visiting professor at the Conservatoire National des Arts et Metiers, a national university in Paris.

Photograph: Grand Canal in Suzhou (by author)

Is Something Wrong With Chicago’s Suburbs?

$
0
0

I previously talked about Connecticut becoming a suburban corporate wasteland as well as the rise of the executive headquarters in major global city downtowns. What we see is that high end functions have shown anecdotal signs of re-centralizing, while the more bread and butter – though still often well-paying – jobs are heading to less expensive suburban locales in places like Austin, Charlotte, and Salt Lake City. These leaves expensive and business hostile suburbs around global cities, like most of those in Connecticut, in a tough spot.

Suburban Chicago isn’t as expensive or business hostile as say Connecticut or New Jersey, but there are so many stories about businesses leaving it that I can’t help but wonder if something is seriously wrong there.

First, downtown Chicago has attracted a number of marquee executive headquarters locations like Boeing, MillerCoors, and now ADM. The suburbs have only picked up a handful of smaller operations, like Mead Johnson Nutritionals.

Second, a number of suburban companies have relocated (or announced relocations of) headquarters to downtown. This includes a Sara Lee spinoff, the old Motorola cell phone division, United Airlines, and Gogo Internet. What distinguishes this from the executive headquarters relocations is that some of these involved big numbers of jobs. I believe there were about 3,000 United Airlines employees and about 2,500 Motorola ones.

Third, even companies that haven’t moved their headquarters have opened downtown offices or relocated operations there. Walgreens moved its e-Commerce operations to the Loop and BP relocated some employees, for example.

Fourth, some suburban based companies have simply abandoned the Chicagoland area outright. Office Max comes to mind, which is moving 1,600 jobs to Boca Raton. Sears is having a slow-motion going out of business sale.

Two recent news articles this week reinforce to me the lack of competitiveness of Chicago’s suburbs. First, when Toyota announced it was relocating its headquarters from Los Angeles and Cincinnati to suburban Dallas, Greg Hinz at Crain’s Chicago Business asked why Chicago wasn’t even on the list of candidate cities for this operation.

I believe Toyota wanted to be in the South. But if you look at where they located, namely the suburb of Plano, you’ll see that this is why Chicago is off the list. Chicago’s suburbs have been losing these types of corporations, not gaining them. If you’re going to choose a suburban location, why would you pick Schaumburg over Plano? You probably wouldn’t unless you had a major reason to be in Chicagoland, such as having a primarily Midwest presence or if your company was founded in the area.

What this shows is that while Chicago’s stellar Loop environment is great for executive headquarters type operations, the suburbs lack appeal to people looking to build a greenfield operation from out of town. This hurts the region’s ability to attract large scale employers like Toyota.

Then yesterday Crain’s reported that Walgreens is looking at relocating its entire headquarters downtown in the old Main Post Office building. This isn’t a done deal by any means, but the fact that a company I’d always considered dyed-in-the-wool suburban would consider this is incredible. (Investors have been pressuring Walgreens to move its HQ overseas, but like Aon’s re-domicle to London, even if it happened it might not involve many jobs, especially since the pharmacy business in the United States is so radically different from that in the rest of the world).

So unlike in even other global cities, Chicago’s suburbs can’t even seem to hang on to large scale employers within the region. I don’t want to overstate a trend here, but this would be at least the third company moving thousands of jobs downtown. That’s huge and I don’t see it happening anywhere else at this scale.

Which raises the question of what might be wrong with Chicago’s suburbs. They can’t seem to be competitive for greenfield operations like Toyota, and they are losing some marquee established employers. I took a quick peek at suburban vacancy rates, and it looks like at first glance every major sub-market is over 20% and there was net negative absorption last year (do some further research before quoting me on that). Is there a big problem going on out there?

I’ve long observed that while Chicago has some great residential suburbs, its business suburbs are weak. Places like Schaumburg and Oak Brook are just generic, unattractive edge cities of a typology that, like the enclosed mall, appears falling out of favor. Chicago seems to lack the kind of suburb that combines residential appeal with a strong business presence and a significant regional amenity draw. Only Naperville would seem to fit the bill here.

So while Chicago’s suburbs are not super-high cost by global city standards, and Illinois isn’t the worst when it comes to taxes and a poor business climate by any means, those suburbs appear to have a serious competitiveness issue. It’s a major concern that regional suburban business centers should look to address. As other edge city environments around the country like Stamford (one part of Connecticut I would say has significant strengths) and Tyson’s Corner upgrade themselves, Chicago’s suburbs are only going to fall further behind.

Aaron M. Renn is an independent writer on urban affairs and the founder of Telestrian, a data analysis and mapping tool. He writes at The Urbanophile, where this piece originally appeared.

Photograph: Outer suburbs of Chicago (by Wendell Cox)


From Anecdotes to Data: Core & Suburban Growth Trends 2010-2013

$
0
0

According to the Wall Street Journal, there are "Signs of a Suburban Comeback." This is a turnaround from the typical media coverage of US population estimates in recent years, which have more often than not heralded a "return to the cities" generally more rooted in anecdote than data.

There were always at least two problems with the "return to the city" thesis. First of all, most people who live in the suburbs came from areas outside metropolitan areas and they couldn't return to where they had never lived (see Cities and Suburbs: The Unexpected Truth). More importantly, in every year for which there is data, the net inward migration to suburbs has been far greater than to the core counties, which have nearly always had net outward migration (see Special Report: 2013 Metropolitan Area Population Estimates. Under these conditions, there could not have been net migration from the suburbs to the core municipalities.

Historical Core Municipalities: The Differences

I have classified historical core municipalities based on their extent of automobile oriented suburbanization (Figure 1). The break point is World War II, after which the great automobile suburbanization occurred in the United States. There had been automobile oriented suburbanization before 1940. During the 1920s, annual rates of suburban growth exceeded five percent in the 14 metropolitan areas with more than 500,000 population. The decade of the Great Depression (1930 to 1940) saw annual growth rates drop three quarters (Note). By the end of World War II, transit had seen its motorized urban travel market share restored to 35 percent, equal to early 1920s levels, a figure that has since fallen to under two percent. 

Historical Core Municipalities: Improving Trends

Even so, in recent years, the core municipalities have done better than in the past. The nightmare that occurred between 1970 and 1990 seems to be over in many places. This has made it feasible for an increase in core living by many Millennials and singles. However, even this has been exaggerated by anecdotal research that dominates the media. More than 80 percent of Millennials live outside the core municipalities, where they are less visible to the anecdote-driven media.

On a percentage basis, the historical core municipalities of the 52 major metropolitan areas (more than 1,000,000 population) managed to grow 3.4 percent between 2010 and 2013, more than the suburban rate of 3.1 percent. This is probably the first time this has occurred in any three year period since the end of World War II.

But the core municipalities now contain such a small share of major metropolitan area population that the suburbs have continued to add population at about three times the numbers of the core municipalities (Figure 2). Indeed, if the respective 2010-2013 annual growth rates were to prevail for the next century,  the core municipalities would house only 28.0 percent of the major metropolitan area population in 2113 (up from 26.4 percent in 2013).

Despite the publicity to the contrary, only six core municipalities added more population than suburbs in the same metropolitan areas between 2010 and 2013. These were New York, San Antonio, Columbus, San Jose, Austin, and New Orleans, all except New York with substantial suburbanization within their city limits. The core municipalities did better in percentage gains, with 19 gaining faster than the suburbs, compared to 33 suburban areas growing faster than the core municipalities.

Core Municipality Growth

Most of the 2010 to 2013 core growth occurred in municipalities with a larger suburban component. The core municipalities that have little suburban development ("Pre-War & Non-Suburban") had 43 percent of the core population in 2010. Yet they attracted only 27 percent of the growth (Figure 3). The two other categories, which include large areas of functional suburbanization (low density and strong automobile orientation) attracted 73 percent of the core population (Figure 3). These include suburbanized pre-War core municipalities, such as Los Angeles, Seattle, and Atlanta. They also include cores that are nearly all suburban, with nearly all of their population growth having occurred during the great automobile suburbanization (such as Austin, Sacramento, Phoenix, and San Jose).

Core Municipalities: Top Gainers

New York led the core municipalities by adding 230,000 new residents between 2010 and 2013. This was 56 percent of the population growth among the "Pre-War & Non-Suburban” core municipalities. The core municipality accounted for 60 percent of the population growth in the metropolitan area. However, domestic migrants continued to move away from New York City. Core municipality losses were 215,000 from 2010 to 2013, while the suburbs, with more than 55 percent of the population, lost less than a third as many (70,000).

Houston gained 96,000 new residents between 2010 and 2013, followed by Austin (95,000), Los Angeles (92,000), and San Antonio (82,000).  Houston, Los Angeles, and San Antonio each have large suburban areas within their city limits, while the core municipality of Austin is virtually all automobile-oriented. The sixth through 10th positions were taken by Phoenix, Dallas, San Jose, Denver, and San Diego, all with substantial suburbanization.

The largest core municipality population gains were in Austin (12.0 percent), still recovering New Orleans (10.1 percent), Denver (8.3 percent), Washington (7.4 percent), and Orlando (6.1 percent). Seattle, Raleigh, Atlanta, San Antonio and San Jose rounded out the top ten. Among the 10 fastest growing core municipalities, all but Washington have large automobile-oriented suburban components.

There was also bad news. Detroit continued its population slide, now down to 689,000 from its 1950 peak of 1,850,000. This 62.76 percent loss, however, is not the worst among major US core municipalities. St. Louis still holds that title, having fallen from 857,000 in 1950 to 318,000 in 2013, a loss of 62.84 percent. However, one more year of losses at the 2010-2013 rates will transfer this dubious title to Detroit.

Suburban Areas: Top Gainers

The largest suburban gains were in Dallas-Fort Worth (325,000), Houston (296,000), Washington (269,000), Miami (245,000) and Los Angeles (211,000). Atlanta, which had virtually set the world standard for suburbanization before the Great Financial Crisis, managed to re-emerge with the sixth fastest largest suburban increase (208,000).

Measured on a percentage basis, Texas dominated the suburban gains. The suburbs of Houston added 7.8 percent to their population between 2010 and 2013. Austin added 7.7 percent, San Antonio added 6.6 percent, and Dallas-Fort Worth 6.2 percent. The only non-Texas entry in the top five was Raleigh, which, like Austin, posted a 7.7 percent increase.

The metropolitan area and historical core municipality data is summarized in the Table.


Table: Metropolitan Area & Historical Core Municipality Population: 2010-2013
Metropolitan AreaHistorical Core Municipality
RankMetropolitan Area20102013% Change20102013% Change
1New York, NY-NJ-PA19.56619.9502.0%8.1758.4062.8%
2Los Angeles, CA12.82913.1312.4%3.7933.8842.4%
3Chicago, IL-IN-WI9.4619.5370.8%2.6962.7190.9%
4Dallas-Fort Worth, TX6.4266.8116.0%1.1981.2585.0%
5Houston, TX5.9206.3136.6%2.0992.1964.6%
6Philadelphia, PA-NJ-DE-MD5.9656.0351.2%1.5261.5531.8%
7Washington, DC-VA-MD-WV5.6365.9505.6%0.6020.6467.4%
8Miami, FL5.5655.8284.7%0.3990.4184.6%
9Atlanta, GA5.2875.5234.5%0.4200.4486.6%
10Boston, MA-NH4.5524.6842.9%0.6180.6464.6%
11San Francisco-Oakland, CA4.3354.5164.2%1.1961.2444.0%
12Phoenix, AZ4.1934.3994.9%1.4461.5134.7%
13Riverside-San Bernardino, CA4.2254.3813.7%0.2100.2141.8%
14Detroit,  MI4.2964.2950.0%0.7140.689-3.5%
15Seattle, WA3.4403.6105.0%0.6090.6527.2%
16Minneapolis-St. Paul, MN-WI3.3493.4593.3%0.6680.6954.1%
17San Diego, CA3.0953.2113.7%1.3071.3563.7%
18Tampa-St. Petersburg, FL2.7832.8713.1%0.3360.3535.1%
19St. Louis,, MO-IL2.7882.8010.5%0.3190.318-0.3%
20Baltimore, MD2.7112.7712.2%0.6210.6220.2%
21Denver, CO2.5432.6976.1%0.6000.6498.2%
22Pittsburgh, PA2.3562.3610.2%0.3060.3060.0%
23Charlotte, NC-SC2.2172.3355.3%0.7870.8234.5%
24Portland, OR-WA2.2262.3154.0%0.5840.6094.4%
25San Antonio, TX2.1432.2786.3%1.3271.4096.1%
26Orlando, FL2.1342.2686.3%0.2380.2557.2%
27Sacramento, CA2.1492.2163.1%0.4660.4802.8%
28Cincinnati, OH-KY-IN2.1152.1371.1%0.2970.2980.2%
29Cleveland, OH2.0772.065-0.6%0.3970.390-1.7%
30Kansas City, MO-KS2.0092.0542.2%0.4600.4671.6%
31Las Vegas, NV1.9512.0283.9%0.5840.6033.4%
32Columbus, OH1.9021.9673.4%0.7870.8234.5%
33Indianapolis. IN1.8881.9543.5%0.8200.8432.8%
34San Jose, CA1.8371.9204.5%0.9460.9995.6%
35Austin, TX1.7161.8839.7%0.7900.88512.0%
36Nashville, TN1.6711.7585.2%0.6010.6345.5%
37Virginia Beach-Norfolk, VA-NC1.6771.7071.8%0.2430.2461.4%
38Providence, RI-MA1.6011.6040.2%0.1780.1780.0%
39Milwaukee,WI1.5561.5700.9%0.5950.5990.7%
40Jacksonville, FL1.3461.3953.6%0.8220.8432.5%
41Memphis, TN-MS-AR1.3251.3421.3%0.6470.6531.0%
42Oklahoma City, OK1.2531.3205.3%0.5800.6115.3%
43Louisville, KY-IN1.2361.2622.1%0.5970.6102.1%
44Richmond, VA1.2081.2463.1%0.2040.2144.8%
45New Orleans. LA1.1901.2414.3%0.3440.37910.1%
46Hartford, CT1.2121.2150.2%0.1250.1250.2%
47Raleigh, NC1.1301.2157.4%0.4040.4326.9%
48Salt Lake City, UT1.0881.1404.8%0.1860.1912.5%
49Birmingham, AL1.1281.1401.1%0.2120.212-0.1%
50Buffalo, NY1.1361.134-0.1%0.2610.259-0.9%
51Rochester, NY1.0801.0830.3%0.2110.210-0.1%
52Grand Rapids, MI0.9891.0172.8%0.1880.1922.3%
Total169.512174.9423.2%44.73946.2583.4%
In Millions: Data from US Census Bureau


Normalcy Knocks?

Ken Johnson, the frequently quoted University of New Hampshire demographer told the Wall Street Journal, "The slowing growth in these urban cores and the increasing gains in the suburbs may be the first indication of a return to more traditional patterns of city-suburban growth." These patterns are of long standing. Nearly all urban population growth since World War II has been suburban, whether within or outside the core municipalities. It should not be surprising that suburban growth dropped during the second greatest economic decline in a century and has been slow to recover during the Great Recession and the Great Malaise that has followed. The one-quarter suburban growth rate drop was more modest than during the Great Depression, but still substantial. Should genuine prosperity return, it will likely be accompanied by a renewal of more robust suburban growth.

Note: Core municipality growth also dropped in the 1930s, as the high rate of migration from rural to urban areas in the 1920s was interrupted due to the economic reversal.

Wendell Cox is principal of Demographia, an international public policy and demographics firm. He is co-author of the "Demographia International Housing Affordability Survey" and author of "Demographia World Urban Areas" and "War on the Dream: How Anti-Sprawl Policy Threatens the Quality of Life." He was appointed to three terms on the Los Angeles County Transportation Commission, where he served with the leading city and county leadership as the only non-elected member. He was appointed to the Amtrak Reform Council to fill the unexpired term of Governor Christine Todd Whitman and has served as a visiting professor at the Conservatoire National des Arts et Metiers, a national university in Paris.

Three-headed Democratic Party

$
0
0

As they face the midterm elections with the wind in their faces, Democrats increasingly stake their collective political future on the issue of inequality. The topic has great resonance, given the economy’s vast preponderance of benefits to the very rich and the almost obsessive focus on the issue by the mainstream media.

But if raising the class-warfare flag gives Democrats at least hope for avoiding a 2010-style shellacking, it also threatens to open up huge, and potentially irreconcilable, differences within the party. Unlike with social issues, where the party is relatively united, class divides threaten party unity by pitting its different constituencies against each other.

Today we can speak really of three Democratic parties, each with a separate class interest. Their divisions are as deep, perhaps more so, as that between the mainstream Republican Party and the Tea Party. As the Republicans are divided between Main Street grass-roots activists and the corporate “moderate” wing, the Democrats face potential schisms over a whole series of policies, from policing Wall Street to the environment, monetary policy and energy.

The Gentry Liberals

This group currently dominates the party, and have the least reason to object to the current administration’s performance. All in all, the gentry have generally done well in the recovery, benefiting from generally higher stock and real estate prices. They tend to reside in the affluent parts of coastal metropolitan areas, where Democrats now dominate.

The liberal gentry have been prime beneficiaries of key Obama policies, including ultra-low interest rates, the bailout of the largest financial institutions and its subsidization of “green” energy. Wall Street Democrats also profit from the expansion of government since, as Walter Russell Mead points out, so many make money from ever-expanding public debt.

What most marks the gentry, particularly in California, is their insensitivity to the impact of their policies on working-class and middle-class voters. They may support special breaks for the poor, but are in deep denial about how high energy and housing prices – in part due to “green” policies – are driving companies and decent-paying jobs from the state. The new “cap and trade” regime about to be implemented figures to push up gasoline and electricity prices for middle-income consumers, who, unlike the poor, have little chance of getting subsidies from Sacramento. High energy prices, one assumes, have less impact on the Bay Area or West Los Angeles Tesla- and BMW-driving oligarchy than to people living in the more extreme climate and spread-out interior regions.

The gentry liberals’ power stems from their dominion over most of the key institutions – the media, the universities, academia and high-tech – that provide both cash and credibility to the current administration. The gentry impact is epitomized by hedge-fund billionaire and environmentalist Tom Steyer, an increasingly influential figure in Democratic circles, as well as nanny-state billionaire Michael Bloomberg and financier George Soros. It is largely the gentry who are pushing climate change as the party’s big issue, even though the voters, notes Gallup, rank it as among the least-important issues.

The Populist Progressives

Many more traditional left-leaning members of the Democratic Party – whom I would call the populist progressives – recognize that the Obama years have been a disaster for much of the party’s traditional constituencies, notably, minorities. Although the nation’s increasingly wide class divides and stunted upward mobility has been developing for years, they have widened ever more under Obama, as the wealthy and large corporations have enjoyed record prosperity.

Although too loyal to openly abandon the first black president, and perhaps too terrified of the Republicans, the populist Left sees Barack Obama as unnecessarily timid in pursuing the war against the hated “1 percent.”

As Massachussetts U.S. Sen. Elizabeth Warren has noted, the priorities in both Congress and the administration after the financial crisis was not to help the millions damaged by the Great Recession. “The government’s most important job,” she remarks, “was to provide a soft landing for the tender fannies of the banks.”

In the future, particularly as President Obama fades from view, the new populists will inevitably have conflicts with their party’s key gentry backers. The campaign by Minnesota U.S. Sen. Al Franken against the Comcast merger with Time Warner – uniting two huge firms tied to the gentry – could prove a harbinger of this evolving tension.

Standing up to the oligarchs could make Warren, as the New Republic noted recently, a potential “nightmare” for the expected presidential run of Hillary Clinton and Clinton’s phalanx of insiders, Wall Streeters and 1 percenters. But the populists’ often-blunderbuss redistributionist tendencies – seen most notably in deep blue big cities – could alienate many middle-class voters who, for good reasons, suspect that this redistribution will come largely at their expense.

The Old Social Democrats

Ironically, the weakest part of the Democratic Party is also the last bastion of traditional American liberalism. The old Democrats are the remnants of the great political party that produced the likes of Andrew Jackson, Harry Truman, and, to some extent, even Bill Clinton. Unlike the other party factions, this group can appeal consistently to the middle and working classes, including the famous “Bubba” vote. Unlike the gentry, or the coastal new populists, they tend to be relatively moderate on social issues.

This group is the most closely associated with private-sector labor, manufacturing and areas dependent on fossil-fuel production. Long dependent on white working-class voters, they are the most threatened by the increasingly hostile attitudes among them to President Obama and his gentry liberal regime. Already, some building trade unions in Ohio, angry about delays on the Keystone XL pipeline and other infrastructure projects, have even shifted toward the GOP.

These shifts directly threaten the last redoubts of the Old Democrats in such conservative states as Louisiana, Arkansas, Montana, Alaska, West Virginia and even purplish Colorado. Although Old Social Democrat senators tend to support fossil fuel development, they and their private-sector union backers increasingly find themselves outbid by green gentry Democrats. Steyer has pledged more money to the party this year than Keystone backers, such as the Laborers Union, have given since 1989.

How these divides can play themselves out

Clearly, there’s potential for some serious class warfare here. A party that represents both the tech oligarchs and the environmental lobby does not share the same concerns of, say, aspiring suburban homeowners or unionized energy workers. Steyer and Co. may not be able to remove the Old Democrats through primaries yet, but their approach is helping to erode working-class support, which could cost them both House and Senate seats.

As the prime beneficiaries of the economic recovery, the gentry are vulnerable to attacks from the populists, who, rightly, see the wealthy’s outsized gains as anathema in an economy that has done precious little for the working and middle class.

Here, the old Democrats would tend to make common cause with the new populists. But such a shift to the economic left, as opposed to the green or cultural left, risks support over time from companies like Google, who may be encouraged further to step up their efforts to gain influence among conservatives.

To win nationally, the party needs to make room for all three kinds of Democrats. But the issues of class and inequality threaten to undermine any hope for comity.

Just as it has increasingly become the case with the GOP, the most vicious Democratic struggles won’t be against their political opposition, but between each other.

This article first appeared in the Orange County Register.

Joel Kotkin is executive editor of NewGeography.com and Distinguished Presidential Fellow in Urban Futures at Chapman University, and a member of the editorial board of the Orange County Register. He is author of The City: A Global History and The Next Hundred Million: America in 2050. His most recent study, The Rise of Postfamilialism, has been widely discussed and distributed internationally. He lives in Los Angeles, CA.

The Cities Winning The Battle For Information Jobs 2014

$
0
0

In the town of Verona on the rural fringes of Madison, Wisc., there’s a Google-like campus that houses one of the country’s most rapidly growing tech companies, and one of the least well known. Founded in 1979, the medical software maker Epic has grown to employ 6,800 people, most of whom work at its 5.5 million-square-foot headquarters complex, which sprawls over 800 acres of what was farmland until the early 1990s.

Despite annual revenue estimated at $1.5 billion, the company is congenitally publicity shy, a characteristic associated with its founder and CEO, Judy Faulkner. Yet in its quiet, unassuming way, Epic is emblematic of the expansion of the information industry in the Madison area. Employment in the metropolitan area’s information sector is up 28% since 2008, among the fastest growth in the country over that period. This has occurred despite the city’s reputation for left-wing, often anti-business politics—a culture that its left-leaning mayor (and Epic booster), Paul Soglin, describes as “76 square miles surrounded by reality.”

To come up with our list of the cities with the fastest-growing information sectors, we zeroed in on the 55 metropolitan statistical areas that have at least 10,000 information jobs, which includes software, publishing, broadcasting and telecommunications services. We used the same methodology as for our overall ranking of the Best Cities for Jobs: we ranked the MSAs based on job growth in the sector over the long-term (2002-13), mid-term (2008-13) and the last two years, as well as recent momentum.

View the Best Cities for Information Jobs 2014 List

Our top 10 is dominated by large metro areas renowned as tech hubs – Madison, at No. 5,  is the smallest by far. In first place is Silicon Valley — San Jose-Sunnyvale-Santa Clara — followed by San Francisco-San Mateo-Redwood City, which together employ over 110,000 information workers. Both have been primary winners in the latest high-tech bubble. Since 2008 information employment is up 23% in San Jose and 27% in San Francisco.

They’re followed by Boston-Cambridge-Quincy in third place, and Austin-Round Rock-San Marcos, Texas in fourth. The foundation built in previous tech booms — including venture capital, educational institutions, corporate headquarters, and skilled workers — has helped many of the strongest tech regions become even more so this go around.

But there are some surprising places on our list, including a few Sun Belt metro areas that were hard hit in the housing bust. Take Atlanta-Sandy Springs-Marietta, Ga., which ranks sixth on our list, with a 7.7% expansion in information employment since 2010. Less expensive than the West Coast hotbeds or Boston, Atlanta could be emerging as a player in the sector. Last year General Motors opened a software facility in suburban Roswell, with plans to create over 1,000 new jobs.

Phoenix-Mesa-Glendale, Ariz., ranks ninth with 11% growth in information employment since 2008. In 2013, the metro area added as many information jobs, roughly 2,000, as the Bay Area, according to an Arizona State University study.

The Big Players

Historically, information jobs have clustered in the nation’s largest metropolitan areas. Los Angeles still leads the nation with 201,000 information jobs, while New York is No. 2 with 182,000.

Yet the fortunes of the biggest players appear to be changing. New York ranks a respectable 13th on our list of the fastest-growing cities for information jobs, with a 7.7% expansion since 2008. This reflects not only the growth of the city’s relatively small tech sector but also its robust film, television and media industries. Los Angeles-Long Beach-Santa Ana, however, has not fared nearly so well, ranking a middling 27th, on our list. This reflects, in part, the erosion of the region’s once dominant entertainment industry. This is particularly true of feature films, where production has dropped 50% from 1996 levels. Since 2000, L.A. has lost 9,000 entertainment industry jobs, leaving it with 132,000.

With tech companies such as Apple and Google targeting content, and the massive shift of readers over to the web, the preeminence of New York and Los Angeles could continue to erode over time.

This shift can be seen in the growing forays of the Valley into film and television production through companies such as Netflix and Google’s YouTube, as well as in the already longstanding decline of the music industry — undermined by both legal and illegal forms of music distribution online.

Information Jobs Set To Disperse

For New York, a more worrisome development is the massive decline of newspaper, magazine and book industry employment. At a time when Google alone reaps more advertising revenues than the entire newspaper business, it’s not surprising that media growth is shifting toward the Left Coast. Since 2001, the book publishing industry, dominated by New York, has contracted nationally by 17,000 jobs. Newspapers lost 190,000 positions and magazines 50,000 in that same span. But internet publishing, dominated by the Bay Area, expanded by 77,000 jobs during the same window.

In many ways, the recent tech boom, with its emphasis on social media, has been a blessing to high-cost areas such as Silicon Valley, San Francisco and even New York. Yet at the same time, as we have seen in our other jobs lists, the information sector is expanding most rapidly in some fairly unexpected places. Some of the fastest growers on a percentage basis are still minor players– Janesville, Wisc., Lansing, Mich., and Flint Mich. –  and are tied largely to the up and downs of the manufacturing sector.

But some, like Madison, are heading toward critical mass. Provo-Orem, Utah, for example, with some 9,800 information jobs, did not make the 10,000 job cut for our list, but should soon given its 21% growth since 2008. Others are in regions just outside the main information hubs, including Santa Barbara-Santa Maria-Goleta, north of Los Angeles, and San Luis Obispo, south of San Jose, as well as Bridgeport-Stamford-Norwalk, north of New York, and Durham-Chapel Hill, N.C., just outside Raleigh-Cary. There has also been rapid information job growth in Huntsville, Ala., a tech center that built up around NASA, and Baton Rouge, La., which has benefited from growth in energy and manufacturing along the lower Mississippi.

Ultimately, price pressures, particularly on housing, are likely to feed growth in some of these emerging regions. In this way, what is happening in Madison foreshadows the growth of a whole series of new information hotbeds. These may not challenge Silicon Valley, New York or Hollywood in the near future, but they are likely to make their presence known as information jobs continue to spread to fast-growing and more affordable regions.

View the Best Cities for Information Jobs 2014 List

This story originally appeared at Forbes.

Joel Kotkin is executive editor of NewGeography.com and Distinguished Presidential Fellow in Urban Futures at Chapman University, and a member of the editorial board of the Orange County Register. He is author of The City: A Global History and The Next Hundred Million: America in 2050. His most recent study, The Rise of Postfamilialism, has been widely discussed and distributed internationally. He lives in Los Angeles, CA.

Michael Shires, Ph.D. is a professor at Pepperdine University School of Public Policy.

Madison, Wisconsin photo by Patrick43470.

Know Your City's Marketplace Leverage

$
0
0

I’ve noticed so often that urbanist policy suggestions or case studies are treated as universals. That is, with a presumption that a good idea or policy can be replicated pretty much anywhere. Clearly, there are a number of items like bike lanes and trails that would appear to be widely applicable, and for which the best practice standards would appear to work without much modification in most places. On the other hand, this isn’t true of everything.

Where do most urban progressive policy ideas come from? From what I’ve seen, these tend to get wide currency when the come from one of the major urbanist citadels like London, New York, Washington, San Francisco, or Portland. This doesn’t always mean that was the place that came up with the idea, but it often is. But these cities are very different from your average, workaday type place.

One problem with our analysis of these things is that they seldom take into account the amount of marketplace leverage a particular place has. Let’s take New York, for example. That’s a city with immense marketplace leverage, meaning that people and businesses are willing to put up with enormous cost and hassles to live, work, and do business there. In particular, the finance industry, which remains heavily centralized in New York as one of the two top global finance centers, generates tons and tons of cash. Most places don’t have that. It’s similar for tech in the Bay Area, government in Washington, DC, etc. These places have high value industries that are bound to the geography they are located and generate immense wealth and tax revenue. That means these places can get away with a lot of things other cities can’t. They’ve got a cash register that never stops ringing.

One current case study is Seattle’s raising of the minimum wage to $15. First the small city of SeaTac raised its minimum wage to that level. SeaTac has 27,000 residents, but also includes SeaTac airport as the name implies. Airports employ a large service class who can benefit from a minimum wage increase. And most airport service businesses don’t have the luxury of moving off airport. That gave SeaTac marketplace leverage to raise the minimum wage significantly without huge risk to its employment base. SeaTac airport isn’t going anywhere.

The city of Seattle itself has followed suit with a graduated increase to $15/hr. Again, Seattle is, like San Francisco, a city of the elite or on its way. The cost of doing business there is such that most businesses that are cost sensitive are already gone or on their way out the door. The coffee shops and other establishments with lower paid workforces mostly can’t move without losing their customer base. So in my view Seattle also has more leverage than your average city in setting this policy.

It would be tempting to look at the Seattle case and say that other cities should raise their minimum wage. But for places without the concomitant marketplace leverage, it could prove to be economically disastrous.

So understanding that degree of marketplace leverage you have is critical to evaluating local policies where the result could affect competitive positioning. Cities with greater marketplace leverage will have more flexibility to have local specific policies that might otherwise disadvantage them by raising costs, regulatory hurdles, etc. They can afford to be in the vanguard of policy experimentation.

Places that fail to take stock of this do so at their peril. One place that has clearly done that is Rhode Island. It has basically acted like it’s entitled to put into place the same sorts of policies as next door Massachusetts and Connecticut, but without the captive high value industries to finance it. Massachusetts has the global power of greater Boston with its unmatched universities, tech, and biotech clusters. Connecticut has access to New York money. Rhode Island doesn’t have anything like this.

Unfortunately for the Ocean State, it doesn’t seem to get it. I think in part that’s because the state’s intellectual elite – its cultural 1%, so to speak – live in a different reality. Many of them have lived and worked elsewhere like Manhattan and chose to move to Providence for lifestyle. Or they are affiliated with Brown or RISD, two atolls of actual competitive advantage in the state. They look around and see that they are in Rhode Island and they can compete at the global level, so they push for the same sorts of ideas that they used to have back when they actually did live in Manhattan or wherever, without realizing that the other 99% of Rhode Island can’t compete at that level.

Back in early 2013, I summed it up like this:

The basic problem of Providence (and by extension the rest of Rhode Island) becomes obvious: it is a small city, without an above average talent pool or assets, but with high costs and business-unfriendly regulation. Thus Providence will neither be competitive with elite talent centers like Boston, nor with smaller city peers like Nashville that are low cost and nearly “anything goes” from a regulatory perspective.

One reason it’s unlikely they’ll escape from this dilemma is that in my view they aren’t ready to face up to the reality of where they stand in the market competitively.

Acting like you have leverage when you don’t can be a serious problem, but you can also “leave money on the table” when you do have leverage and fail to take advantage of it. Just as one example, Indianapolis has a “beggar’s mentality” when it comes to development. It just so happens that because of the tourism/sports business and the locals penchant for chain dining that upscale national chains have some of their best locations anywhere in downtown Indianapolis. It’s literally one of the most profitable places in the country for that kind of business – not that you’d know it from the way the city treats them.

As one example, a BW-3 was built on Washington St. downtown a couple years back. As it turned out, they built something contrary to their approved plans and which violated numerous design guidelines of the city. Did the city make them fix it? Nope. So BW-3′s insult to streetscape humanity was allowed to stand. The city had a lot of marketplace leverage in this case, but didn’t recognize it or wasn’t willing to use it.

The lesson here is that you need to take stock of the amount of marketplace leverage you have, and tailor your approach accordingly. This is part of coming up with an urban solution set that is right for a specific place and not just a bunch of imported ideas from elsewhere pursued without thought.

Also, cities should also be asking what they can do to add to their marketplace leverage. Hopefully over time as they continuously improve, their intrinsic attractiveness will go up, which will accrue leverage benefits right there.

Aaron M. Renn is an independent writer on urban affairs and the founder of Telestrian, a data analysis and mapping tool. He writes at The Urbanophile, where this piece originally appeared.

Top Photograph: Downtown Seattle from the Space Needle (by Wendell Cox)

California’s Green Bantustans

$
0
0

One of the core barriers to economic prosperity in California is the price of housing. But it doesn’t have to be this way. Policies designed to stifle the ability to develop land are based on flawed premises. These policies prevail because they are backed by environmentalists, and, most importantly, because they have played into the agenda of crony capitalists, Wall Street financiers, and public sector unions. But while the elites have benefit, ordinary working families have been condemned to pay extreme prices in mortgages, property taxes, or rents, to live in confined, unhealthy, ultra high-density neighborhoods. It is reminiscent of apartheid South Africa, but instead of racial superiority as the supposed moral justification, environmentalism is the religion of the day. The result is identical.

Earlier this month an economist writing for the American Enterprise Institute, Mark J. Perry, published a chart proving that over the past four years, more new homes were built in one city, Houston Texas, than in the entire state of California. We republished Perry’s article earlier this week, “California vs. Texas in one chart.” The population of greater Houston is 6.3 million people. The population of California is 38.4 million people. California, with six times as many people as Houston, built fewer homes.

And when there’s a shortage, prices rise. The median home price in Houston is $184,000. The median price of a home in Los Angeles is $530,000, nearly three times as much as a home in Houston. The median price of a home in San Francisco is $843,000, nearly five times as much as home in Houston. What is the reason for this? There may be a shortage of homes, but there is no shortage of land in California, a state of 163,000 square miles containing vast expanses of open space. What happened?

You can argue that San Francisco and Los Angeles are hemmed in by ocean and mountains, respectively, but that really doesn’t answer the question. In most cases, these cities can expand along endless freeway corridors to the north, south, and east, if not west, and new urban centers can arise along these corridors to attract jobs. But they don’t, and the reason for this are the so-called “smart growth” policies. In an interesting report entitled “America’s Emerging Housing Crisis,” Joel Kotkin calls this policy “urban containment.” And along with urban containment, comes downsizing. From another critic of smart growth/urban containment, economist Thomas Sowell, here’s a description of what downsizing means in the San Francisco Bay Area suburb Palo Alto:

“The house is for sale at $1,498,000. It is a 1,010 square foot bungalow with two bedrooms, one bath and a garage. Although the announcement does not mention it, this bungalow is located near a commuter railroad line, with trains passing regularly throughout the day. The second house has 1,200 square feet and was listed for $1.3 million. Intense competition for the house drove the sale price to $1.7 million. The third, with 1,292 square feet (120 square meters) and built in 1895 is on the market for $2.3 million.”

And as Sowell points out, there are vast rolling foothills immediately west of Palo Alto that are completely empty – the beneficiaries of urban containment.

The reason for all of this ostensibly is to preserve open space. This is a worthy goal when kept in perspective. But in California, NO open space is considered immediately acceptable for development. There are hundreds of square miles of rolling foothills on the east slopes of the Mt. Hamilton range that are virtually empty. With reasonable freeway improvements, residents there could commute to points throughout the Silicon Valley in 30-60 minutes. But entrepreneurs have spent millions of dollars and decades of efforts to develop this land, and there is always a reason their projects are held up.

The misanthropic cruelty of these polices can be illustrated by the following two photographs. The first one is from Soweto, a notorious shantytown that was once one of the most chilling warehouses for human beings in the world, during the era of apartheid in South Africa. The second one is from a suburb in North Sacramento. The scale is identical. Needless to say, the quality of the homes in Sacramento is better, but isn’t it telling that the environmentally enlightened planners in this California city didn’t think a homeowner needed any more dirt to call their own than the Afrikaners deigned to allocate to the oppressed blacks of South Africa?

The Racist Bantustan

201402_Soweto-500px


Soweto, South Africa  -  40′ x 80′ lots, single family dwellings

When you view these two studies in urban containment, consider what a person who wants to install a toilet, or add a window, or remodel their kitchen may have to go through, today in South Africa, vs. today in Sacramento. Rest assured the ability to improve one’s circumstances in Soweto would be a lot easier than in Sacramento. In Sacramento, just acquiring the permits would probably cost more time and money than doing the entire job in Soweto. And the price of these lovely, environmentally correct, smart-growth havens in Sacramento? According to Zillow, they are currently selling for right around $250,000, more than five times the median household income in that city.

The Environmentalist Bantustan

201402_Sacramento-500px


Sacramento, California  -  40′ x 80′ lots, single family dwellings

When you increase supply you lower prices, and homes are no exception. The idea that there isn’t enough land in California to develop abundant and competitively priced housing is preposterous. According to the American Farmland Trust, of California’s 163,000 square miles, there are 25,000 square miles of grazing land and 42,000 square miles of agricultural land; of that, 14,000 square miles are prime agricultural land. Think about this. You could put 10 million new residents into homes, four per household, on half-acre lots, and you would only consume 1,953 square miles. If you built those homes on the best prime agricultural land California’s got, you would only use up 14% of it. If you scattered those homes among all of California’s farmland and grazing land – which is far more likely – you would only use up 3% of it. Three percent loss of agricultural land, to allow ten million people to live on half-acre lots!

And what of these lots in North Sacramento? What of these homes that cost a quarter-million each, five times the median household income? They sit thirteen per acre. Not even enough room in the yard for a trampoline.

There is a reason to belabor these points, this simple algebra. Because the notion that we have to engage in urban containment is a cruel, entirely unfounded, self-serving lie. You may examine this question of development in any context you wish, and the lie remains intact. If there is an energy shortage, then develop California’s shale reserves. If fracking shale is unacceptable, then drill for natural gas in the Santa Barbara channel. If all fossil fuel is unacceptable, then build nuclear power stations in the geologically stable areas in California’s interior. If there is a water shortage, than build high dams. If high dams are forbidden, then develop aquifer storage to collect runoff. Or desalinate seawater off the Southern California coast. Or recycle sewage. Or let rice farmers sell their allotments. There are answers to every question.

Environmentalists generate an avalanche of studies, however, that in effect demonize all development, everywhere. The values of environmentalism are important, but if it weren’t for the trillions to be made by trial lawyers, academic careerists, government bureaucrats and their union patrons, crony green capitalist oligarchs, and government pension fund managers and their partners in the hedge funds whose portfolio asset appreciation depends on artificially elevated prices, environmentalism would be reined in. If it weren’t for opportunists following this trillion dollar opportunity, environmentalist values would be kept in their proper perspective.

The Californians who are hurt by urban containment are not the wealthy elites who find it comforting to believe and lucrative to propagate the enabling big lie. The victims are the underprivileged, the immigrants, the minority communities, retirees who collect Social Security, low wage earners and the disappearing middle class. Anyone who aspires to improve their circumstances can move to Houston and buy a home with relative ease, but in California, they have to struggle for shelter, endlessly, needlessly – contained and allegedly environmentally correct.

Ed Ring is the executive director of the California Policy Center.

Viewing all 3795 articles
Browse latest View live


Latest Images