Quantcast
Channel: Newgeography.com - Economic, demographic, and political commentary about places
Viewing all 3795 articles
Browse latest View live

Focusing on People, Not Sprawl

$
0
0

For seven decades urban planners have been seeking to force higher urban population densities through urban containment policies. The object is to combat "urban sprawl," which is the theological (or ideological) term applied to the organic phenomenon of urban expansion. This has come at considerable cost, as house prices have materially increased relative to incomes, which is to be expected from urban containment strategies that ration land (and thus raise its price, all things being equal).

Smart Growth America is out with its second report that rates urban sprawl, with the highest scores indicating the least sprawl and the lowest scores indicating the most (Measuring Sprawl 2014).

Metropolitan Areas and Metropolitan Divisions

For the second time in a decade Smart Growth America has assigned a "sprawl" rating to what it calls metropolitan areas. I say "what it calls," because, as a decade ago, the new report classifies "metropolitan divisions" as metropolitan areas (Note 1). Metropolitan divisions are parts of metropolitan areas. This is not to suggest that a metropolitan division cannot have a sprawl index, but metropolitan divisions have no place in a ranking of metropolitan areas. Worse, metropolitan areas with metropolitan divisions were not rated (New York, Los Angeles, Chicago, Dallas-Fort Worth, Philadelphia, Washington, Miami, San Francisco, Detroit, and Seattle).

This year's highest rating among 50 major metropolitan areas (over 1,000,000 population) goes to part of the New York metropolitan area (the New York-White Plains-Wayne metropolitan division) at 203.36. The lowest rating (most sprawling) is in Atlanta, at 40.99. This contrasts with 2000, when the highest rating was in part of the New York metropolitan area (the New York PMSA), at 177.8, compared to the lowest, in the Riverside-San Bernardino PMSA portion of the since redefined Los Angeles metropolitan area, at 14.2. Boston is excluded due to insufficient data (Note 2)

Rating Sprawl

The sprawl ratings are interesting, though obviously I would have done them differently.

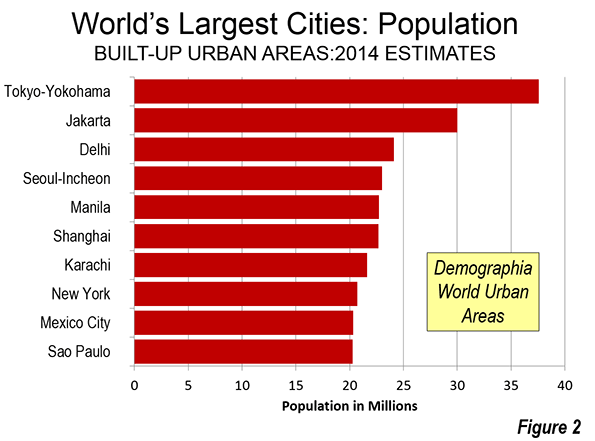
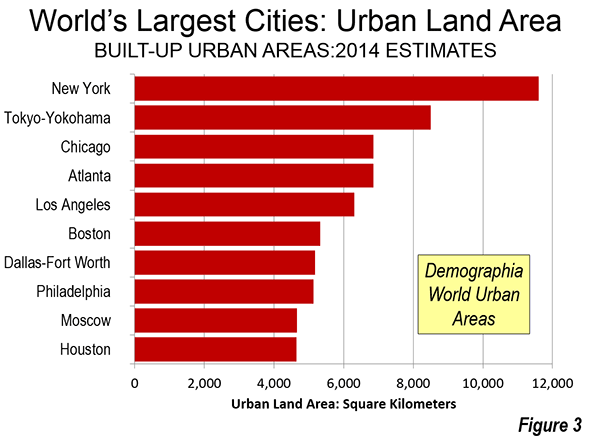
Overall urban population density would seem to be a more reliable indicator (called urbanized areas in the United States, built-up urban areas in the United Kingdom, population centres in Canada, and urban areas just about everywhere else). For example, the Los Angeles metropolitan area (combining its two component metropolitan divisions), has an index indicating greater sprawl than Springfield, Illinois. Yet, the Los Angeles urban area population density is about four times that of Springfield (6,999 residents per square mile, compared to 1747 per square mile, approximately the same as bottom ranking Atlanta). The implication is that if Los Angeles were to replicate the individual ratings that make up its index, and covered (sprawled) over four times as much territory, it would be less sprawling than today.

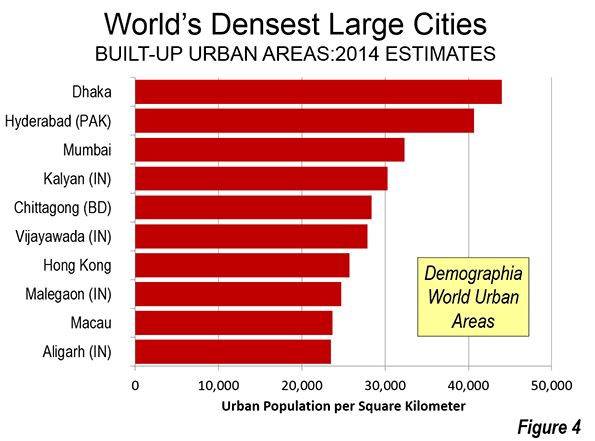
This case simply illustrates the fact that sprawl has never been well defined. Indeed, the world's most dense major urban area, Dhaka (Bangladesh), with more than 15 times the urban density of Los Angeles and 65 times the urban density of Springfield, has been referred to in the planning literature as sprawling.

Housing Affordability

The principal problem with the report lies with its assertions regarding housing affordability. Measuring Sprawl 2014 notes that less sprawling areas have higher housing costs than more sprawling areas (Note 3). However, it concludes that the lower costs of transportation offset much more all of the difference. This conclusion arises from reliance the US Department of Housing and Urban Development (HUD) and US Department of Transportation (DOT) Location Affordability Index, which bases housing affordability for home owners on median current expenditures, not the current cost of buying the median priced home. Nearly two thirds of the nation's households are home owners, and most aspire to be.

HUD-DOT describes its purpose as follows:

"The goal of the Location Affordability Portal is to provide the public with reliable, user-friendly data and resources on combined housing and transportation costs to help consumers, policymakers, and developers make more informed decisions about where to live, work, and invest." 

Yet, a consumer relying on the Location Affordability Index could be seriously misled. The HUD-DOT index (Note 4) does not begin to tell the story to people seeking to purchase homes. The costs are simply out of pocket housing costs, regardless of whether the mortgage has been paid off and regardless of when the house was bought (urban containment markets have seen especially strong house price increases).An index including people who have no mortgage and people who have lower mortgage payments as a result of having purchased years ago cannot give reliable information to consumers in the market today.

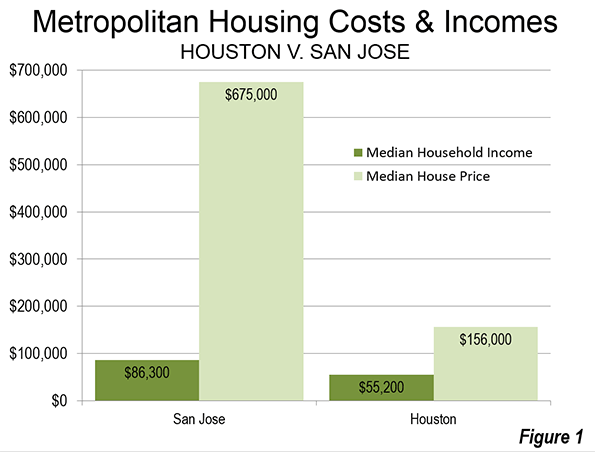
A household relying on this source of information would be greatly misled. For example, comparing Houston with San Jose, according to HUD-DOT, owned housing and transportation consume virtually the same share of the median household income in each of the two metropolitan areas. In Houston, 52.5 percent of income is required for housing and transportation, while the number is marginally higher than San Jose (52.9 percent).

But the HUD-DOT numbers reflect nothing like the actual costs of housing in San Jose relative to Houston. The median price house in Houston was approximately $155,000, 2.8 times the median household income of $55,200 (this measure is called the median multiple) during the 2006-10 period used in calculating the HUD-DOT index. In San Jose, the median house price was approximately $675,000, 7.8 times the median household income of $86,300 (Figure 1).

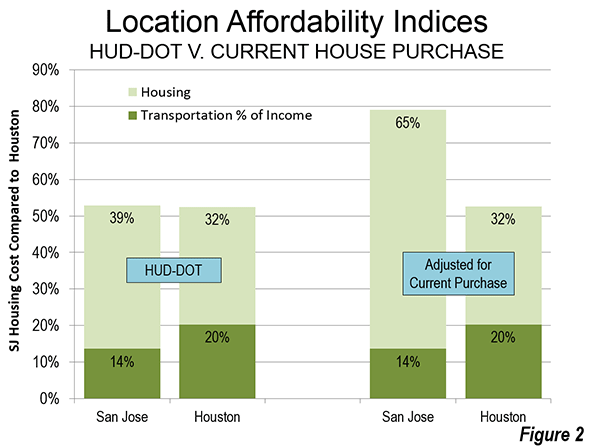
If the Location Affordability Index reflected the real cost for a prospective home owner (HUD-DOT costs including a market rate mortgage for the house), a considerable difference would emerge between San Jose and Houston. The combined San Jose Location Affordability Index for home owners would rise to 85 percent of median household income, a full 60 percent above the Houston figure, rather than the minimal difference of less than one percent indicated by HUD-DOE (Figure 2).

Under-Estimating the Cost of Urban Containment

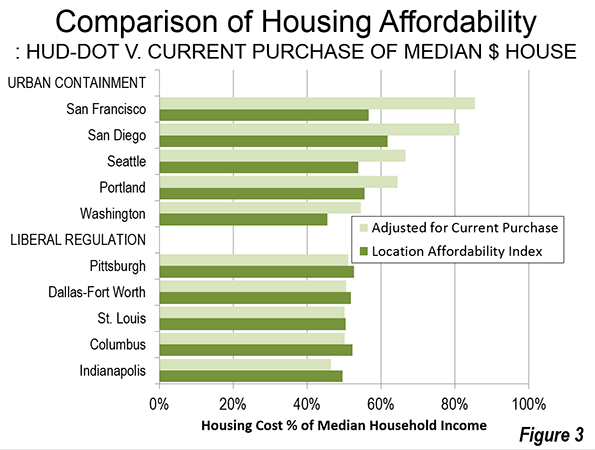
There is a substantial difference between the HUD–DOT housing and transportation cost and the actual that would be paid by prospective buyers. Five selected urban containment markets indicate a substantially higher actual housing cost than reflected in the HUD–DOT figures. On the other hand, in the selected liberally regulated markets (or traditionally regulated markets), the HUD–DOE figure is much closer to the current cost of home ownership (Figure 3). This is a reflection of the greater stability (less volatility) of house prices in liberally regulated markets. Overall, based on data in the 50 major metropolitan areas, owned housing costs relative to incomes rise approximately 6 percent for each 10 percent increase in the sprawl index – that is, less sprawl is associated with higher house prices relative to incomes (Note 6).

The increasing impacts of urban containment’s housing cost increases have been limited principally to households who have made recent purchases. The effect will become even more substantial in the years to come as the turnover of the more expensive housing stock continues.

Granted, the 2006 to 2010 housing data includes part of the housing bubble and its higher house prices. However, house prices relative to incomes have returned to levels at or above that recorded during the period covered by Measuring Sprawl 2014 in "urban containment" markets, such as San Francisco, San Jose, Los Angeles, San Diego, Seattle, Portland, and Washington.

Economic Mobility and Human Behavior

Another assertion requires attention: economic mobility is greater in less sprawling metropolitan areas. The basis is research by Raj Chetty and Nathaniel Hendren of Harvard University and Patrick Kline and Emmanuel Saez of the University of California, Berkeley. However, the realities of domestic migration suggest caution with respect to the upward mobility conclusions, as is indicated in Distortions and Reality About Income Mobilityand in commentary by Columbia University urban planner David King.

Virtually all urban history shows city growth to have occurred as people have moved to areas offering greater opportunity. Jobs, not fountains, theatres and art districts, drive nearly all the growth of cities. This means that there should be a strong relationship between the cities net domestic migration and the economic mobility conclusions of the research. The strongest examples show the opposite relationship.

Domestic migration is strongly away from some metropolitan areas identified in the research as having the greatest upward income mobility also had substantial net domestic migration losses. For example, despite claims of high economic mobility New York, Los Angeles and the San Francisco Bay area, each lost approximately 10 percent of their population to net domestic migration in the 2000s. On the other hand, some metropolitan areas scoring the lowest in upward economic mobility drew substantial net domestic migration gains. For example, low economic mobility Charlotte and Atlanta gained 17 percent and 10 percent due to net domestic migration in the 2000s. Thus, the results of the economic research appear to be inconsistent with expected human behavior (Note 7).

Sprawl: An Inappropriate Priority

The new sprawl report is just another indication that urban planning policy has been elevated to a more prominent place than appropriate among domestic policy priorities. The usual justification for urban containment is a claimed sustainability imperative for its densification and anti-mobility policies. Yet, these policies are hugely expensive and thus ineffective at reducing greenhouse gas emissions, and thus have the potential to unduly retard economic growth (read "the standard of living and job creation"). Far more cost-effective alternatives are available, which principally rely on technology.

There is a need to reverse this distortion of priorities. Little, if anything is more fundamental than improving the standard of living and reducing poverty (see Toward More Prosperous Cities). Housing is the largest element of household budgets and policies of that raise its relative costs necessarily reduce discretionary incomes (income left over after paying taxes and paying for basic necessities). There is no legitimate place in the public policy panoply for strategies that reduce discretionary incomes.

London School of Economics Professor Paul Cheshire may have said it best, when he noted that urban containment policy is irreconcilable with housing affordability.

---------

Note 1: The previous Smart Growth America report used primarily metropolitan statistical areas (PMSAs), which have been replaced by metropolitan divisions. The primary metropolitan statistical areas were also subsets of metropolitan areas (labor market areas). This is problem is best illustrated by the fact that the Jersey City PMSA, composed only of Hudson County, NJ, is approximately one mile across the Hudson River from Manhattan in New York. Manhattan is the world's second largest central business district and frequent transit service connects the two. Obviously, Jersey City is a part of the New York metropolitan area (labor market area), not a separate labor market.

Note 2: Because of incomplete data, Boston is not given a sprawl rating in Measuring Sprawl 2014. A different rating system in the previous edition resulted in a Boston rating among the least sprawling. Yet, the Boston metropolitan area is characterized by low density development. Outside a 10 mile radius from downtown, the population density within the urban area is slightly lower than that of Atlanta (same square miles of land area used).

Note 3: Higher house prices relative to household incomes are more associated with policies to control urban sprawl (such as urban growth boundaries and other land rationing devices), than with the extent of sprawl. More compact (less sprawling) urban areas do not necessarily have materially higher house prices. For example, in 1970, the Los Angeles urban area was one of the most dense in the United States, yet it was within the historical affordability range (a median multiple of less than 3.0). The emergence of Los Angeles as the nation's most dense urban area in the succeeding decades (and 30 percent increase in density) is largely the result of a change in urban area criteria. Through 1990, the building blocks of urban areas were municipalities, which meant that many square miles of San Gabriel Mountains wilderness were included, because it was in the city of Los Angeles. Starting in 2000, the building blocks or urban areas became census blocks, which are far smaller and thus exclude the large swaths of rural territory that were included before in some urban areas.

Note 4: The transport costs from the Location Affordability Index are accepted for the purposes of this article.

Note 5: The current purchase housing cost is based on the average price to income multiple over the period of 2006 to 2010, relative to the median household income (calculated from quarterly data from the Joint Center for Housing Studies of Harvard University, State of the Nation's Housing 2011). It is assumed that the buyer would finance 90 percent of the house cost at the average 30 year fixed mortgage rate with points over the period. The 10 percent down payment is allocated annually in equal amounts over the 360 months (30 years). The final annual cost estimate is calculated by adding the monthly mortgage payment and down payment allocation to the median monthly housing cost in each metropolitan area for households without a mortgage.

HUD-DOT uses the "selected monthly owner cost" from the American Community Survey (ACS) for its cost of home ownership. According to ACS, “Selected monthly owner costs are calculated from the sum of payment for mortgages, real estate taxes, various insurances, utilities, fuels, mobile home costs, and condominium fees."

Note 6: This is based on a two-variable regression estimation (log-log) with the sprawl index as the independent variable and the substituted housing share of income as the dependent variable for the 50 largest metropolitan areas (excluding Boston), It is posited that most of the variation in housing costs is accounted for by variation in land costs. Other significant factors, such as construction costs and financing costs in this sample vary considerably less. A sprawl index for each metropolitan areas represented by metropolitan divisions (not provided in the sprawl report) is estimated by population weighting.

Note 7: Another difficulty with that research is that it measured geographic economic mobility at age 30, well before people reach their peak earning level. This is likely to produce less than reliable results, since those who achieve the highest incomes as well as the most educated such as medical doctors and people with advanced degrees) are likely to have larger income increases after age 30 than other workers.

Wendell Cox is principal of Demographia, an international public policy and demographics firm. He is co-author of the "Demographia International Housing Affordability Survey" and author of "Demographia World Urban Areas" and "War on the Dream: How Anti-Sprawl Policy Threatens the Quality of Life." He was appointed to three terms on the Los Angeles County Transportation Commission, where he served with the leading city and county leadership as the only non-elected member. He was appointed to the Amtrak Reform Council to fill the unexpired term of Governor Christine Todd Whitman and has served as a visiting professor at the Conservatoire National des Arts et Metiers, a national university in Paris.

Suburban neighborhood photo by Bigstock.


Ukrainian and Russian: The Geo-Politics of Language

$
0
0

The Russian-speaking population of Ukraine has been at a disadvantage since the collapse of the Soviet Union. In the Ukrainian parliament, this occasionally erupts in violent brawls caught on YouTube; for average citizens, it is a humanitarian problem. Early on in this conflict the Peace Corps instructed its volunteers in Ukraine to avoid speaking Russian whenever possible. This almost certainly stoked the tensions that have now, years later, destabilized the country.

In the fall of 1997, just after graduating from college with a degree in English and Russian Studies, I completed Peace Corps training in the city of Cherkassy, then was sent north to Chernigov, my placement city. I then spent several weeks in Kiev before “early terminating” – that’s Peace Corps jargon for leaving your assignment before completing the customary two years of volunteer service.

The cities where I clocked time in Ukraine are all situated along the northern section of the Dnieper River, which serves as a dividing line between the Ukrainian-dominant west and the Russian-speaking east. Most of the people I met in this central region preferred conversing with me in Russian, or lapsing into Surzhik, the cozy colloquial hodge-podge of both languages. Yet Peace Corps maintained a rather adamant policy that Ukrainian was the preferred language for all our interactions with the Ukrainian public in this part of the country. Ukrainian had become the country’s only official language after the collapse of the Soviet Union.

This never sat well with me. Peace Corps Ukraine volunteers were instructed to side with a single language in a bilingual country. Now that Russia has annexed Crimea and is threatening a military invasion of eastern Ukraine, I can’t help but see the Peace Corps’ approach as evidence of America’s interference in a cultural conflict in which it should never have been a player.

Other volunteers told me that in its early years, Peace Corps taught everyone Ukrainian, even the volunteers who were placed in Crimea and the far eastern cities like Donetsk, Kharkov, and Lugansk, where almost all of the locals spoke little or no Ukrainian. Eventually, Peace Corps conceded that these volunteers were better off learning Russian, when it became clear that they were being sent into the field woefully unprepared to communicate.

In the central part of the country, where both languages were relevant, we were told that we needed to be role models for the citizens who knew Ukrainian but were more comfortable speaking Russian. These people were complacent, they told us; lazy, even. They only spoke Russian because the Soviet Union had forced it on them in school for several generations. If they heard Americans speaking Ukrainian better than they did, they would feel ashamed of themselves, and that was a good thing (or so we were told).

We were also warned to keep an eye out for that ugly plague of Surzhik, and not to let it infect our use of either language. And Surzhik was everywhere – on the trolleys, in the stores, on the local television news. Even the intelligent mother and daughter I lived with during training used it to speak with each other. They had been warned by the Peace Corps about modeling sloppy language for us, though, so they mostly spoke to me in clean Russian, except for a few days when we made a token effort to converse in Ukrainian after somebody from Peace Corps scolded them for letting me speak so much Russian.

As somebody with an academic interest in linguistics and language history, I knew that forcing a language on a population, even a language that may have been at one time forced out of them, was an age-old recipe for discontent and conflict. I even had a hard time thinking ill of Surzhik, though I could hear it corrupting both languages as people spoke. Much as we may try to pin down correct usage with grammatical rules, dictionaries, and textbooks, language is ultimately democratic, its evolution driven by the people who speak it. It may have been ugly to some people’s ears, but from a linguistic point of view Surzhik was a perfectly natural development for speakers torn between two rival languages.

Mine wasn’t necessarily a majority view of the country’s language politics. Plenty of Peace Corps volunteers believed they were benefitting the country by speaking textbook Ukrainian, even when people struggled to converse with them. These folks would respond with friendly scorn when I expressed a preference for speaking Russian because it was easier for me to communicate with people and forge relationships. There were other language problems, too: One woman assigned near the border in southwestern Ukraine told me most people in her town spoke Romanian. Other parts of the west had strongly Polish-influenced dialects.

The more urgent stories of language oppression, though, came from Ukrainians themselves: a university student during the Soviet Union collapse, for example. She considered herself Ukrainian, but her family and friends only ever spoke Russian. The Ukrainian language was a minor academic requirement for her in school; she never learned to speak it with any fluency. When Ukraine gained its independence and Ukrainian was declared the official language, she and other Russian-speaking students suddenly found themselves in classes conducted strictly in Ukrainian.

Of course, Ukrainians in the western part of the country had plenty of legitimate complaints about being forced to learn Russian when Ukraine was part of the Soviet Union, and about the disadvantages they faced in the many communities where Ukrainian was and still is the primary or even sole language. Neither side of the country has had an easy linguistic ride over the last century.

What I was witnessing, though, looked like a regulatory pendulum swing from one extreme position to another, not a benevolent policy change aimed at benefitting the population as a whole. I found myself in an awkward position — the language I’d studied for years turned out to be as frowned upon as it was useful. I remember looking up chess terminology, memorizing the phrase “politicheskaya peshka”, so I could explain in Russian, if the need arose, that I — because of the language I spoke — felt like a political pawn.

Flickr photo by Dieter Zirnig: Ukraine, 2010

Since her brief stint in the Peace Corps, Andrea Gregovich earned an M.F.A. in Creative Writing from University of Nevada Las Vegas and has been honing her skills as a translator of Russian literature.

Guess What? The Parties are About Even!

$
0
0

I’ve written extensively about American presidential elections, trying to understand the nature of Democratic success in 2008 and 2012. Many pundits use these elections and changing demographics and public attitudes to write off the future of the Grand Old Party. But this would be a mistake, because we also know that Republicans have a majority in the House of Representatives and in the state legislatures. They also could well get a majority in the US Senate in 2014. Hardly a death spiral.

Certainly, gerrymandering played a role, and Democrats won a majority of the popular vote for Congress, but the majority was smaller than the margin for president, which was not as large as widely believed, and considerably less than in 2008. Given this confusion it is worth trying to make a more accurate assessment of the D and R balance.  It turns out that there is a peculiar geography of the electorate at all levels and across states, that tends to help Democrats at the statewide level, due to concentrated block voting and concentrations in cities while Republicans, who hold sway over a wider geographic area, at sub-state levels. Obama won 332 electoral votes, 61%, far above his 52% share of the national vote. Democrats won 51 % of the total vote for Congress but won only 200 seats, 46 % of 435, a shortfall of up to 21 seats.

Besides the votes for president and the House of Representatives in 2012, we can look at the latest result for all 100 Senate seats, for governors of the states, and for all state legislators, in order to get a more honest assessment of Red and Blue America. What states are truly blue or red, and how many are actually more balanced than we might have thought?  Finally it may be useful to compare the actual votes with opinion polls, which seem to show a country somewhat less “liberal” than electoral results. Perhaps voters are a little more liberal than they admit, but let’s see what the fuller set of data show.

President

Democrats won 332 electoral votes, 52 or 10% more than their “fair share” of 280  (52% of 538 electors).  The reason for the imbalance is simply that the peculiar geography in 2012 gave the Democrats small margins in some critically large states. For Obama, CA, 55 electoral votes, FL, 29, NY, 29, IL, 20, PA 20, OH, 18, and MI, 16, versus for Romney, TX, 38, GA, 16 and NC, 15. If Romney had carried just the close OH, FL, and PA, he would have won the election!  No wonder Republicans became interested in adopting the Maine and Nebraska allocation of electors by congressional district! However there is no logical basis for allocation by congressional districts, an unrelated office. Rather there is a rational and logical argument to allocate simply by the party shares of the popular vote in states. Table A shows the effect. Obama would have won but by the small margin of 275 to 263 electoral votes, reflecting the actual close division in the electorate.


Table A
Electoral Votes 2012Electoral Votes 2012
 Actual D Electoral VotesActual R Electoral VotesD If Allocated by Statewide Vote SharesR If Allocated by Statewide Vote Shares
AL936
AK312
AZ1156
AR624
CA553322
CO954
CT743
DE321
DC330
FL291514
GA1679
HI431
ID312
IL20128
IN1156
IA633
KS624
KY835
LA835
ME422
MD1064
MA1174
MI1697
MN1055
MS633
MO1046
MT312
NE523
NV633
NH422
NJ1486
NM532
NY291811
NC1578
ND312
OH1899
OK725
OR743
PA201010
RI431
SC945
SD312
TN1147
TX381622
UT615
VT321
VA1376
WA1275
WV523
WI1055
WY312
Total332205275263


House

The situation is quite different for Congress (the House), where Republicans won 235 seats to the Democrats 200, while according to the total popular vote, the Democrats would gain a small majority based on their 50.8% share of the total vote,  of 221 to 214 seats (Table B) .  A lot has already been written about this, including charges of theft by gerrymandering. But if we analyze the peculiar geography again carefully, we will find that the net additional seats for the Democrats, if the seats in each state reflected the actual vote, would only be 15, not enough for a majority, simply because so many D votes are “wasted” in safe districts. In 17 states, Democrats won more seats than their share of the vote, 23, but Republicans won 38 “extra” seats in the other 33 states. 


Table B
Actual and ideal seats in the House of Representatives
StateSeats in stateIdeal D (according to vote share)Actual DDifferenceDem %
CA533338562%
NY271821365%
MA979275%
IL181012255%
MD857265%
CT535266%
NH212152%
AZ945146%
RI212159%
ME212162%
HI212167%
WA1056154%
OR534158%
MN855056%
NM322055%
DE111066%
VT111076%
16510012423
NV422050%
MT100045%
IA422052%
WV311040%
WY100026%
AK100031%
UT411033%
CO733049%
SDS100043%
ND100043%
LA611024%
MS411037%
ID210134%
NJ1276156%
GA1465141%
KS410121%
WI843151%
NE310136%
AR410132%
TN932137%
KY621140%
MO832143%
AL731236%
OK520232%
SC731242%
IN942246%
MI1475253%
TX361412240%
VA1153249%
NC1374351%
FL271310347%
OH1684448%
PA1895451%
US270119773849%


Note that 54 Democrats won by over 75%, compared to 34 for Republicans. Still, this does leave  probably 8 or 9 districts won by Republicans because of clever gerrymanders, sometimes proudly proclaimed, as in OH and PA, 2 each, and one each in FL, MI, NC,VA and WI, more than offsetting the likely D gerrymander against Republicans in IL. But Democrats would still have lost if there had been no gerrymandering, and the net implication is that the peculiar geography of the Democrat vote means   that it takes at least a 53% total Democratic plurality to win enough of the relatively few close seats to win a majority of the House.

Senate

At 2 seats per state regardless of population, Republicans have an inherent advantage to obtain a majority of senators (or governors), since they dominate a majority of states, and Democrats are over-concentrated in a few larger states. The fact that Democrats currently hold 52 of seats plus the support of independents in VT and ME, is a consequence of the timing of Senate elections and perhaps reflects the extremism of some Republican candidates, who alienated enough middle road, independent voters to swing races to the Democrats. It is also significant that in 15 states voters clearly chose to have senators from both  major parties, indicating either that polarization is not so extreme as proclaimed, or that there are a number of closely divided states, that can vote R or D depending on  issues, personalities, and timing. Please see the summary table C for a listing by strength of the D or R votes for senators across the states. The highest D shares (both seats) were in VT, RI, and NY, for Republicans in WY, TN, SD, and ID.

Governors  

Republicans hold 29 of the 50 governors, perhaps an underlying indicator of a Republican majority. Yet, from the table you will see that Democrats elected governors in several states that lean Republican overall e.g., MO, AR, MT, and WV, and that there are Republican governors in several states won by Obama, e.g., MI, NV, NM, ME, and NJ. This ambivalence undermines any simple and strict Red versus Blue dichotomy. Many voters are not as utterly polarized as proclaimed. The most extreme Republican votes were in WY, NE, UT LA, and TN, and the highest Democratic shares in DE, NY and yes, AR, which voted only 38% for Obama.

Legislatures  

Legislatures are controlled by Republicans in a majority, 26, of states, with Democrats in control in 20 states, with four state divided: Iowa, Kentucky, New Hampshire and Virginia (almost), and even Washington (de facto). The legislatures are overall the most Republican-leaning of the elections analyzed. But even here, the average share of Democrats in legislatures is a respectable 46 percent. The most extremely Republican legislatures are in WY, UT, ID, KS, TN, and SD and the most extremely Democratic are, predictably, in HI, RI, MA, VT and MD. Again in recognition that a simple red and blue dichotomy is not that certain is the fact that in four states, KY, IA, VA, and NH, the legislative houses are split between the parties.

So what is the best estimate of the real division between Red and Blue America?

Table C ranks the states by my composite average index based on the races for president, the House of Representatives, state legislatures, US senators and governors. The numbers (percents) are the Democratic share of the vote for president, for the US house, for US senators and for governors, but for state legislatures, the percent shares of legislators who are Democrats. The final column Is a simple average of these five values. In this way I can distinguish those states which are consistently Democrat or Republican, from those which really are less polarized and more balanced.


TABLE C: Summary of Democratic-Republican Voting Record
Electoral VotesPresident %DCongress %DState LegislaturesSenators %DGovernors %DNumber of D WinsComposite Index
Sen %DHouse %DLegis Ave.Type
WY328.825.713.313.313.32527024.0R++
UT625.433.417.218.718.034.7534029.1R++
KS638.920.922.526.424.533.2536030.7R++
ID433.633.917.118.617.933.539031.6R++
OK733.232.425.028.726.93540033.5R++
TN1139.636.821.227.624.43435034.0R++
SD340.842.620.024.322.131.2538.5035.0R++
NE538.935.84227035.9R+ 
ND339.943.228.324.526.436.7535.5036.3R+ 
AL938.836.025.537.131.335.642036.7R+ 
LA841.323.941.042.941.947.534037.7R+ 
AK342.730.935.037.536.338.2541037.8R+ 
MS644.236.936.547.942.240.338040.3R
GA1646.040.832.133.332.741.7546041.5R
TX3842.040.038.736.737.743.2545041.6R
SC944.742.039.137.738.438.2548042.3R
IN1144.845.826.031.028.547.2548.2042.9R
AZ1145.445.643.340.041.743.2545044.2R
FL2950.447.035.038.336.740.549.3144.8R
MO1045.243.329.432.531.049.555.5144.9R
KY838.540.040.055.047.545.756145.5R
NC1549.050.936.035.835.948.544.5145.8R
OH1851.547.930.339.434.84749.5146.2R
239
AR637.832.340.049.044.559.7564.5247.8BalR
MT343.044.546.037.041.56250.5248.3BalR
WI1053.550.845.539.442.450.547348.8BalR
PA2052.750.846.045.845.951.545.5349.3BalR
IA653.051.552.047.049.548.645249.5BalR
WV536.340.170.654.062.357.552349.6BalR
50
MI1654.852.731.646.439.061.542350.0BalD
VA1352.049.050.032.041.05950.8350.4BalD
NH452.852.245.855.350.545.2554451.0BalD
NV653.449.852.464.358.350.546351.6BalD
39
CO952.748.654.356.955.652.2556453.0D
NM555.355.259.555.757.656.546.4454.2D
ME457.961.760.056.758.346.549354.7D
WA1257.654.451.056.153.656.551.5554.7D
OR856.358.053.357.655.554.7550.4555.0D
MN1053.956.358.254.556.358.2550.5555.1D
NJ1459.055.660.060.060.05846455.7D
IL2058.655.467.860.264.059.550.5557.6D
CT758.865.561.164.963.055.2550.3558.6D
CA5561.962.068.470.069.258.2553560.9D+
MD1063.365.574.569.572.061.2556563.6D+
NY2964.364.852.470.561.467.2562564.0D+
DE359.465.861.965.963.962.7570564.4D+
RI464.059.084.292.088.16953566.6D++
MA1161.874.990.081.985.96052566.9D++
VT368.275.676.767.672.16951567.2D++
HI471.767.596.086.391.169.358571.5D++
DC395.0         
211


Overall 23 states with 239 electoral votes lean fairly strongly Republican across the 5 measures, despite Obama carrying FL and OH, and six more states were somewhat balanced, but leaning moderately Republican, with 50 electoral votes. Of these Obama won 3, WI, PA, and VA, but none of the 5 Obama-carried states in these sets can be considered safely Democratic. Seven states had composite indices less than 35% D, a fairly extreme set. Five states were quite Republican with indices 35 to 40 Democratic, and a larger number, 11, were less strongly or consistently Republican (indices 40 to 46}. The six marginally Republican states, with indices 47.8 to 49.6, all have a mixed pattern of Democratic and of Republican majority percents. AR, MT and WV are an interesting subset, with a less “urban liberal” kind of Democratic tradition.

Seventeen states (plus the District of Columbia) have Democratic indices over 53. With four (RI, VT, HI, MA) and DC in the over 65 set, 4 in the moderately strong D set, 60 to 65, CA, MD, NY, and DE, and then  9 is the group with D indices from 53 to 60.  But note that 4 of these had a Republican majority in some category. The remaining 4 states with indices from 50 to 52, are only marginally D, and indeed are quite mixed across the categories, almost a classic definition of balance. What all the 21 D leaning states have in common is that Obama won them in 2012.

In summary Republicans are stronger overall in 29 states with 289 electoral votes, to Democrats in 21 states (+DC) with 249 electoral votes. Democrats can overcome this territorial Republicanism only by the peculiar geography of their huge urban vote, which can enable them to carry marginally Republican states.

Thus, as to the presidential election in 2016, is there hope for the Republicans? I am convinced that there is now a national consensus that the time has come for a woman president, and that Hilary Clinton can match or even beat Obama’s lopsided 2008 victory, because potentially millions of women will defy their husbands and desert their otherwise moderate conservatism and vote for Clinton. Otherwise the Democrats would be in a desperate situation.

But 2014 is an entirely different proposition. If we ignore the first column (presidential), Republicans are in a very strong position for the Senate, the House, governors, and legislatures.  This outcome is likely, despite the demographic transition from domination by older white males to younger, more liberal, more urban generations. But moderately conservative folk remain the majority, as attested to by the latest national polls. For example, Gallup polls show conservatives at 38%, liberals at 23 (the highest ever but still unimpressive) and moderates at 34%. The Republican failure to take advantage of this inherent moderate majority reflects the problem with reactionary conservatism that enables Democrats, and liberals (not coincident) to thrive beyond their numbers.

Richard Morrill is Professor Emeritus of Geography and Environmental Studies, University of Washington. His research interests include: political geography (voting behavior, redistricting, local governance), population/demography/settlement/migration, urban geography and planning, urban transportation (i.e., old fashioned generalist).

No Joke: It Couldn't Get Much Better In Fargo

$
0
0

This week the coastal crowd will get another opportunity to laugh at the zany practices of those living in the frozen reaches of the Great Plains. The new television series “Fargo,” based on the 1996 Coen brothers movie, will no doubt be filled with fearsome violence mixed with the proper amount of Scandinavian reserve and wry humor — the very formula that made the original such a hit.

Yet how much will “Fargo” the series resemble the real places? Probably not much. For one thing the series only uses Fargo as a kind of marker; the action actually takes place in Bemidji, Minn., a small town of 12,000 over two hours away. I know distances are seen differently in the northern Plains, but the whole idea seems a bit of a stretch. Located in forest and lake country, many locals would not even consider the Minnesota town part of the Plains.

Less known to the sophistos who will watch the show is that Fargo, a metro area with over 200,000 people, and the state of North Dakota have been enjoying a sustained boom for a decade. This resurgence — in demographics, economics and real estate — follows decades of relative decline and an almost sullen sense of isolation that drove many people out of the state.

In a state where the unofficial motto seems to be “it could be worse” — not a bad notion given the often miserable weather — things couldn’t be much better. North Dakota leads the nation in virtually every indicator of prosperity: the lowest unemployment rate, and the highest rates of net in-migration, income growth and job creation. Last year North Dakota wages rose a remarkable 8.9%, twice as much as Utah and Texas, which shared honors for second place, and many times the 1% rise experienced nationwide.

The once dreary predictions of demographic decline — epitomized by the proposal two New Jersey academics to turn the area into a “Buffalo Commons” — have been reversed. North Dakota now lures many college graduates from out of state and keeps more of its own as well. Today more than half of North Dakotans aged 25-44 have post-secondary degrees, among the highest percentages in the nation, and well above the roughly 40% number for the rest of the country.

Many will ascribe the state’s rise primarily to the energy boom. To be sure the fastest growth in North Dakota and other Plains states has been in the areas closest to the oil and gas finds. But over the past decade, the population of the Plains has expanded by 14%, well above the national average and far faster than the Midwest, the Northeast or California.

This Plains resurgence is taking place even in areas far from energy development. Fargo, for example, is six hours hard driving from Williston, the center of the Bakken range. Yet despite this the area’s population has been growing, up 20% in the last decade, twice the national average. Since 2010, over 8,000 more people have come to the Fargo metro area, which extends to the Minnesota city of Moorhead, than have left. In fact, the small cities of the Dakotas have been growing faster than the nation for well more than a decade, before the recent energy boom took off.

The growth in Fargo has come not so much from energy, but an expanding industrial and technology sector. STEM employment is up nearly 40% since 2001, compared to 3% nationally. It also leads all other U.S. metro areas in the growth in the number of mid-skilled jobs, providing good wages to people with two-year or certificate degrees. Between 2009 and 2011, mid-skilled employment grew 5%, roughly 10 times the national average. No surprise then that the population with BAs in Fargo has grown 50% in the last decade, well above the 40% rate for the rest of the country.

Yet perhaps nothing illustrates the dramatic changes in Fargo better than its downtown area. Twenty years ago, when I first visited the city, downtown was torpid on a good day. Storefronts were old, funky and often empty. The local hotels ranged between acceptable to sorry.

But in the past decade downtown Fargo has seen a crush of new investment; property values have more than doubled since 2000. Mid-range apartment complexes are sprouting up, all pitching themselves to millennial professionals who value a more pedestrian-oriented environment. The founder of Great Plains Software, now Microsoft Business Systems, Doug Burgum, has proposed to build a 23-story office tower downtown. Not surprisingly, it would be the tallest building in the state.

Some are rightfully skeptical about some of these ambitious plans given the low cost of development on the periphery and the region’s basically non-urban mindset. But the feel has certainly changed, with several high-end restaurants, huge numbers of bars (befitting the German and Scandinavian roots of the area’s population), offering a rising number of local brews. There’s even a boutique hotel, the Donaldson, founded by Burgum’s ex-wife Karen, decorated with Plains art, and run by a friendly, highly professional staff.

The people even look different than a decade or two ago. The bars and restaurants now host a more attractive group of young professionals and meandering divorcees. The change is so striking that I have been pitching friends in L.A. to produce a North Dakota version of the “Real Housewives” reality series.

None of this is likely to be revealed in the new “Fargo” TV show. After all, the place has one of the lowest crime rates in the country, a full third below the national average; with only 11 murders since 2000, it’s hardly the Baltimore of the “Wire” or “Treme.” But murder sells better than contentment, or at least makes for more riveting entertainment about the place, unless I can find buyers for my “Housewives” idea. But unlike in the past, Fargo residents don’t have to cringe about this latest Hollywood assault and its impact on their image. Things are good enough that they can afford to laugh; it certainly could be a lot worse.

Joel Kotkin is executive editor of NewGeography.com and Distinguished Presidential Fellow in Urban Futures at Chapman University, and a member of the editorial board of the Orange County Register. He is author of The City: A Global History and The Next Hundred Million: America in 2050. His most recent study, The Rise of Postfamilialism, has been widely discussed and distributed internationally. He lives in Los Angeles, CA.

Hotel Donaldson photo By jeffreykreger

Don't make big-city mayors regional rulers

$
0
0

Given the quality of leadership in Washington, it’s not surprising that many pundits are shifting focus to locally based solutions to pressing problems. This increasingly includes many progressives, who historically have embraced an ever-more expansive federal government.

In many ways, this constitutes an extraordinarily positive development. Political decentralization is built into the very framework of American democracy, as Alexis de Tocqueville, among others, recognized. If Paris dominated France and London dominated England, in America, he noted, “intelligence and power is dispersed abroad.”

Yet, there’s a problem with how the decentralist argument is taking shape. Increasingly, it is becoming a movement to create ever more powerful regional governments, which tend to be dominated by large cities, their mayors and their power blocs, whether unions, bureaucracies or politically connected developers. The notion of mayors running the world has been endorsed by writers such as Benjamin Barber, and has had the strong backing of Bruce Katz of Brookings, who appears to have lost sight of his long-held faith in the federal government.

Not surprisingly, Katz and other have found a new way to press their agenda: regional governments as essentially extended cities. Like many progressive decentralists, he likes handing more power to big-city mayors, themselves generally presiding over one-party (Democratic) systems.

This notion of mayors uber alles was recently celebrated at an event in Chicago where mayors such as Atlanta’s Karim Reed, Eric Garcetti of Los Angeles, New York’s Bill de Blasio and Chicago’s Rahm Emanuel claimed that big cities were the future and, where, as Reed put it, “the action is.”

It’s hard to underestimate the hubris of this assessment. Despite the slowing down from the Great Recession, the vast majority of American demographic growth and job growth continues to go either into the suburban rings or to low-density sprawling regions, such as Houston, Phoenix and Dallas-Fort Worth, where urban areas and their peripheries are more similar than different.

U.S. suburbs now account for 2.7 times the population of core cities. High-density migration, much-heralded by the urban decentralizers, remains a distinctly minority phenomena, while the largest outmigration tends to be from big, dense cities and to suburbs, less-dense and smaller cities and towns.

Nor can we see in the mayors some sort of archetype for greater governance. Chicago, under Rahm Emanuel, is hardly an exemplar of efficiency or good fiscal management. The city’s credit rating is among the worst of any municipality, while the economy remains “sub-par,” as a recent bank analyst report shows. Chicago schools are almost bankrupt, and the city’s murder rate is higher than during the Prohibition years.

In fact, the city, whose debt load is now the heaviest of any large American city other than Detroit, has now experienced repeated downgrades, and estimated debt now exceeds, by some estimates, more than $60,000 per household.

Yet despite this, Emanuel is still hailed, most recently in a Financial Times profile, as “Mayor America” and even touted as a presidential candidate. Emanuel’s backers can note that many of these problems stem from the more than two-decade Daley regime. Yet, Emanuel was, and remains, part of the Daley machine, and even got his start as a Daley fundraiser. To consider him primarily a tough reformer – outside his often foul-mouthed manner – is patently ludicrous.

Much the same can be said about L.A.’s Eric Garcetti, who, although certainly an upgrade from Antonio Villaraigosa, was a member, even president, of the same City Council that has driven the city to the brink of financial ruin.

Much of the problem stems from union power: the city is spending 18 percent of its budget on pensions, three times the level a decade ago. Los Angeles has among the nation’s weakest urban economies – 28 percent of residents are considered poor – and its unemployment rate of roughly 10 percent is well above both the county and statewide averages and twice that of San Francisco.

In many ways, Atlanta’s Reed is barely qualified to speak for his region, as his city constitutes not even 10 percent of the area’s population. Nor is it a particularly successful locale, suffering among the highest crime rates of any big city in the country and, according to one recent study, the most severe inequality of any U.S. core city.

Generally speaking, big-city leaders chant a populist rap, but generally it’s the densest urbanized places – San Francisco, Washington D.C., Boston, New York, Miami and, sadly, Los Angeles – that are also the most unequal places.

Perhaps the only real potential reformer in the group is New York City’s de Blasio, who took office a few months ago. While de Blasio wants to shake things up, his tendency seems to be making things worse. Certainly his attempt to shut down charter schools, which offer an alternative to traditional public schools, particularly for poorer families, hardly represents a step forward. He may be the people’s choice, but it’s likely he will serve, first and foremost, public employee interests, who have been his main political backers.

This story originally appeared at The Orange County Register.

Joel Kotkin is executive editor of NewGeography.com and Distinguished Presidential Fellow in Urban Futures at Chapman University, and a member of the editorial board of the Orange County Register. He is author of The City: A Global History and The Next Hundred Million: America in 2050. His most recent study, The Rise of Postfamilialism, has been widely discussed and distributed internationally. He lives in Los Angeles, CA.

City Hall photo by Flickr user OZinOH.

The Rise of the Executive Headquarters

$
0
0

Headquarters were once a defining characteristic of urban economic power, and indeed today cities that can still brag of the number of entries they boast on the Fortune 500 list of largest American firms. Yet as urban centers increasingly lost headquarters, boosters started to downplay them as a metric, particularly with the rise of the so-called “global city” concept. Today the HQ is back into the urban mix, but increasingly as what I would call the “executive headquarters” which brings bragging rights to a city but not much in terms of middle class jobs.

The corporate headquarters in a downtown skyscraper took a beating during the 70s, 80s, and 90s as America’s inner cities went into decline. Why locate in a decaying, lawless, dysfunctional urban setting that seemed destined for the scrap heap when the shiny suburbs beckoned?  Indeed, companies increasingly vacated downtowns for massive suburban office campuses, frequently in idyllic, pastoral settings where employees would exist in a cocooned bubble without any but approved distractions such as on site gyms, dry cleaning, cafeterias, and daycare.

Tom Wolfe, writing of the early 90s recession in New York, presciently pointed out the one thing that continued to hold urban allure for many CEOs, namely the lavish lunch:

Eight years before 9/11, financial services and commercial real estate were superseded as driving forces in the New York economy by the restaurants appearing in boldface in Zagat’s. The exodus of corporations from New York during the near-depression of 1992-95 was stanched by a single thing: lunch. The C.E.O.’s would do anything rather than give up the daily celebrations of their eminence at eateries in the town where the wining and dining were as good azagats. (I know, I know; just read it out loud.) The case could be made that any post-9/11 federal appropriations to prop up business in New York should go first to the places where you can get Chilean sea bass with a Georgia plum marmalade glaze on a bed of mashed Hayman potatoes laced with leeks, broccoli rabe and emulsion of braised Vidalia onions infused with Marsala vinegar.

Many CEOs might prefer to be close to home, but others enjoyed hobnobbing with their peers and getting treated like royalty at the Four Seasons.

Yet even as many corporate headquarters were leaving and as Time magazine published its “Rotting of the Big Apple” cover in 1990, it was clear major change was already afoot. The cleanup had begun in the mid-1980s and by the 90s Americas biggest cities were on the way back.

How could the urban center be coming back while headquarters bled away? The answer was the rise of the global economy and the services based “global city”. Saskia Sassen and other writers pioneered the analysis of this new entity.  In this world the complexities of the global economy generated demand for new forms of financial and producer services needed to manage and control the far flung networks of the global corporation. These highly specialized services providers were subject to clustering economics and concentrated in large urban centers like New York, London, and Chicago where they provided a new type of urban economic vitality.

Sassen specifically says, “The key sector specifying the distinctive production advantages of global cities is the highly specialized and networked intermediate economy rather than corporate headquarters. In developing this argument, I am responding to a very common notion that the number of headquarters is what specifies a global city.”

This not only provided an explanation for why urban centers could economically rebound while simultaneously losing headquarters, but from a civic marketing perspective it provided a justification for pooh-poohing the loss of HQs as much ado about nothing.  Headquarters were yesterday’s news anyway.

Except that they weren’t. In recent years we’ve seen increasing evidence of the return of the corporate headquarters to the global city, a phenomenon I identified in 2008.  Today the “back to the city” theme for corporations is much written about, and the headquarters is once again conveniently seen as a signifier of urban strength.

But in most cases this is not the old monolithic headquarters of yore, with their thousands of employees. Rather this takes the form of an “executive headquarters.” That is, a headquarters consisting largely of the C-suite and a small number of other very senior leaders and support staff.

These have been around for a while, but traditionally existing to serve the desire of the CEO to live in a particular city. Men’s Wearhouse established headquarters in Fremont, CA for example, but most of the corporate employees are located in Houston. Lincoln National moved its executive headquarters to Philadelphia from Ft. Wayne, IN but the distribution of employment was barely affected. Both were CEO living preference driven.

The people in “executive headquarters” are precisely those who most need proximity to the global city service providers that increasingly form a key part of company operations. Also, recruiting executive talent and proximity to airports play a role. And when companies want to think in a totally global manner, they can want to have their main office physically separate from any particular operating location.

There are numerous examples. In Chicago alone, MillerCoors moved its top staff from Milwaukee. Mead Johnson Nutrionals established an executive headquarters in the suburbs away from its main Evansville, IN base. Boeing’s move to Chicago from Seattle can be seen in the same light. And just recently agribusiness giant ADM announced it was moving its HQ from Decatur, IL to Chicago.

The Mead Johnson case is instructional. According to press reports at the time:

Working in a large city will make it easier to conduct business throughout the world. Mead Johnson makes Enfamil and similar products and about half of its sales come from overseas. Having offices near Chicago, for instance, will place executives in close proximity to global-business consultants, leaders in the field of nutrition and an international airport.


Between 40 and 60 people will work in the corporate offices, most of them in new positions. Evansville will retain the company’s operations in research and development, U.S. sales and marketing and information management, as well as a bulk of the finance and human-resources departments, Paradossi said. Mead Johnson’s liquid products will continue to be made in Evansville, he said.

Note the stated reasons for the move, as well as the small number of people involved.  The ADM move is similar, with only about 100 jobs initially. This suggests that while headquarters are in some cases coming back to the global city, they aren’t brining many jobs.  Also, many second tier business centers like Indianapolis continue to see their downtown job base hollowed out apart from hot sectors like technology.

The executive headquarters is one more example of the increasing bifurcation of America’s elite cities. A handful of top executives gather in America’s capitals of capitalism while the good paying core of the old headquarters – including many upper middle class positions – remain in more workaday cities. This but one example of the “growth without growth” model in which cities dispense with “old fashioned” notions like population and job growth in favor of higher per capita GDP and income in which parts of cities thrive by becoming downtown versions of the exclusive gated subdivision.

A few cases have gone beyond this, with even more wholesale moves back to the core. United Airlines moved 3,000 to the Chicago Loop from Elk Grove Village. And Google is moving 2,500 people from Libertyville as a result of the Motorola Mobility purchase. (This unit is already being sold to Lenovo, however). These more substantial moves could bring more bread and butter jobs.

But as a recent column in the Economist noted, investors are putting huge pressures on companies to slim down bloated overheads. This does not bode well for bringing middle-skilled jobs to expensive headquarters locations. Additionally, the rise of telecommuting the and 1099 economy, just in time offices, co-working spaces, etc. are transforming the way people work and putting further pressure on the traditional HQ.  Office floor plates are expensive, and increasing numbers of people no longer want to spend their days toiling away in the salt mines of cubicle farms anyway.

Where does this lead?  If there’s one thing the last few decades have shown it’s that the only constant is constant change.  With unpredictable market dynamics and various iterations of the cycle of reincarnation (centralizing vs. decentralizing, etc), even the shift to selected downtowns may bring fewer benefits to the urban economy than imagined, and could ultimately accelerate the bifurcation between a small elite population and largely poor communities around them.

Aaron M. Renn is an independent writer on urban affairs and the founder of Telestrian, a data analysis and mapping tool. He writes at The Urbanophile.

Boeing Chicago photo by J. Crocker.

Why Some Nations Succeed

$
0
0

Why is it that some nations, such as Switzerland, respond quickly to the need for reform – improving railroads, health care systems and schooling – even before the systems break down? And why do other nations, such as Italy and France, wait until major crises are upon them before introducing institutional change? Some, such as Daron Acemoglu and James Robinson, take a deterministic stance. The acclaimed writers of  Why Nations Fail  believe that cultural and geographical differences, or even historical accidents, put countries on to different trajectories of institutional development which are more or less conducive to growth. Although clearly relevant, this view is incomplete. There are often courageous individual leaders launch far reaching reforms that are initially unpopular, and gain acceptance first after they yield visible results.

Take Canada as an example. The country was in very bad shape when a new left-liberal government took over power in 1993. Newly appointed Prime Minister Jean Chrétien and minister of finance Paul Martin worked on introducing an ambitious reform agenda. The administration made the difficult choice of market reforms, focusing on liberalizations and reduced spending through action such as abolishing transport subsidies for farmers. These measures were not popular amongst interest groups, the general public, or within the liberal party itself. The new government even introduced higher taxation initially, in order to deal with the deficit and massive public debt. Although each of these steps on their own were anything but popular, voters acknowledges that they would together benefit the country in the long term. The Liberal party was re-elected, and continued with reformist policies. In the coming years, reductions in government spending were used both to deal with the debt and to reduce the tax burden. After yet another successful re-election, Paul Martin took over the reins and won a fourth consecutive term. Later conservative governments have built upon the same policies. Canada is now North America’s new free market role model, but combines this with more generous and effective social policies than its larger neighbor country.

In spite of ideological differences, experts often roughly agree on what reforms are needed to move forward. In Canada during the early 1990s, it was rather clear that a move towards more limited government and better business climate could boost job creation and entrepreneurship. At the same time it was also clear that similar changes were needed in countries such as Italy, France and Greece. Yet, only many years later, after experiencing stagnant growth and deep recessions, are the latter three countries grudgingly moving in this direction. One explanation might be that market reforms are less appealing in some nations than others due to ideological differences. Another is that structural changes overall are more difficult to introduce in some parts of the world. Jean-Claude Juncker, a likely candidate for the EU-presidency after two decades as Luxemburg’s Prime Minister, famously lamented “We all know what to do, we just don’t know how to get re-elected after we’ve done it.” What does it take for the general public to accept structural reforms, or even demand them?

In our new book “Renaissance for Reforms” we discuss the concept of “reform threshold”, the point at which a people demand change in response to a perceived problem or challenge. Switzerland is clearly a country with a low reform threshold. Swiss governments have reformed continuously without the catalyst effect of deep crises. According to the reform barometer compiled by the think tank Avenir Suisse, Switzerland has reformed slightly more deeply than Germany since the turn of the century. Germany reformed extensively for a few years between 2002 and 2005 as a response to high unemployment, Switzerland, without such an outside stimulus, has reformed steadily and slowly, and always from a position of economic success.

One example is that the Swiss made the unemployment insurance system stricter in order to incentivize people to find a new job. The reform in itself is not uncommon amongst developed countries. What sets Switzerland apart is that the change was introduced before dependency of unemployment insurance had reached high levels. In countries with a higher threshold for reforms, it would have been difficult to pass new rules in absence of an unemployment crisis. We believe that gradual and continuous reforms are in many ways a more advantageous approach, both from an economic and a social perspective, than major reforms following downturns. If the Swiss had opted to retain the previous system, a future crisis may have forced sudden and dramatic cut backs.

Canadians, much like the Swiss, have shown an interest in reforms that can boost growth, although the two nations already have amongst the best business climates in the world. One explanation is that previous positive experience has raised the appetite for change. Focus is more on how to expand economic and social opportunities in society overall, compared to France, Italy and Greece where the debate centers on how existing resources can be distributed.

Reducing the resistance to reform is easier said than done in most countries. What is needed is long-term commitment to change combined with an evidence-based approach where each reform is objectively studied by researchers in order to map its effects. Institutional competition is another key element. The Swiss test many ideas in their Cantons before introducing them on federal level. If the general public believes that changes are not introduces on a whim, but rather can be shown to have certain effects, support for change will likely increase. In the long-run, we believe that the low threshold for gradual institutional change that exists in Switzerland and Canada is a key for good governance. Perfect political systems are impossible to achieve, but it is still possible to adapt routinely to a changing world. And for each good policy, hopefully the threshold for introducing the next one can be lowered. 

Dr. Nima Sanandaji is a frequent writer for the New Geography. Stefan Fölster is Professor of economics at the Royal Institute of Technology in Sweden and director of the Reform Institute. The authors are upcoming with the book ”Renaissance for Reforms” which is co-published by Timbro and the Institute of Economic Affairs.

The New Downtown Los Angeles

$
0
0

There was a time when downtown Los Angeles was the commercial center of Southern California. According to Robert Fogelson, writing in his classic Downtown: Its Rise and Fall (1880-1950)"nearly half" of Los Angeles residents went downtown every day in the middle 1920s. A time traveler from 1925 might think that to still be the case, with the concentration of tall buildings, and the frequent press reports about downtown’s resurgence.  

Downtown LA got a late start with high-rises. Until the middle 1960s, there were few buildings exceeding the 13 story height limit repealed in 1958 by city of Los Angeles. The most important exception is City Hall, opened in 1928, which is 454 feet tall (137 meters). By 1989, the city's tallest building, Library Tower (First Interstate Tower), had been opened, topping out at 1,018 feet (310 meters). The under-construction Wilshire-Grand Tower will soon rise 80 feet (25 meters) above Library Tower. From the flight path to Los Angeles International Airport (above) and many ground vistas, the vertical profile of downtown Los Angeles will continue to stand tall over the city.

Yet, far less understood is that downtown has declined in metropolitan importance for decades. Now, downtown has only 2.4 percent of employment the metropolitan area (Los Angeles and Orange Counties).  Between the 2000 Census and the 2006-2010 American Community Survey, employment in the central business district dropped approximately five percent. At least four other employment areas, all freeway oriented with lower employment density, equal or exceed downtown's employment (these include the Airport-El Segundo area and nameless employment areas straddling the Santa Ana Freeway in Los Angeles County, the Harbor and San Diego Freeways in the South Bay and the Costa Mesa Freeway in Orange County). More important still, approximately two-thirds the metropolitan area's employment is not in a large employment area at all. This dispersion of employment is one reason why Los Angeles –despite its reputation for horrendous traffic – has the shortest one-way commute time of any world megacity for which there is data.

Shifting Downtown

Following World War II, the heart of downtown Los Angeles shifted west from Broadway, Hill and Spring Streets, leaving a large stock of quality commercial buildings vacant. This was well before the end of their useful lives, yet decades of disuse followed. Most of these buildings rose to the 13 floors height limit, though one, the 18 story United California Bank headquarters at 6th and Spring, was completed not long before its competitors hired moving vans to move west. Soon after, the United California Bank built the UCB Tower (now Aon Tower) on Hope Street, with 62 floors (1973), which at the time was the tallest building in the world outside New York and Chicago.

Adaptive Reuse

The UCB Building and many more on the now more residential east side of downtown been converted to apartments and condominiums under the city's creative "adaptive reuse" ordinance, which facilitates conversions from office to residential use. According to the city of Los Angeles, the ordinance has facilitated conversion of downtown commercial space into more than 3,000 residential units. Another 7,000 are either under construction or being considered.  

The conversion of office buildings to residential has spread to post war structures, such as the Mobil Oil Building (now the Pegasus Apartments). This building, on Flower Street, was one of the earliest examples of the more modern styles that were to proliferate throughout the downtown areas of the nation. The Signal Oil Building, also one of the first to exceed the 13 story limit has also become residential (1010 Wilshire). This building had been the subject of an unusual 1980s remodeling that enlarged the footprint and the floors, while materially changing the outside angles and the decor. Another nearby office building (1100 Wilshire) sat empty for two decades after construction, before being converted to residential use.

The shift to residential makes sense given that most downtown office buildings are having difficulty filling their space. Downtown's glutted office market is indicated by a 19.2 percent vacancy rate in the fourth quarter of 2013. This is better than such market laggards as downtown Detroit or downtown Dallas, both over 20 percent, but higher than the Los Angeles suburban office vacancy rate, at 15.9 percent. Downtown’s vacancy rate is also approximately double or more those of dynamic downtowns such as San Francisco, Boston, New York, and Houston, which are all under 10 percent (Figure 1).

It appears likely that the Crocker Citizens Plaza, opened as the city's tallest building in 1969 (42 floors), is slated for conversion to residential. After Crocker Bank moved to its new Crocker Center (now Wells Fargo Center) on Bunker Hill, Crocker Citizens Plaza became the AT&T Building. AT&T vacated the building and moved to the earlier 1960s Transamerica Building, which urban legend indicates was built well south of downtown because consultants convinced the developers that this would be the center of an even larger downtown. The Transamerica, now AT&T, is even more divorced from the commercial core than when it was built. By the time Crocker Citizens Plaza (now "611 Place") is converted to residential, it could be the third tallest mixed use building in downtown.

The second tallest mixed use tower could well be the prestigious Library Tower, which stands half-empty. There are rumors that the new owners may convert a large part of the structure to condominiums and a hotel. No major office skyscraper has opened in downtown Los Angeles in the last 20 years. Nor will that change when the Wilshire Grand Tower is completed. Wilshire-Grand will only be partially an office tower and will include a hotel. Only 30 of the 73 floors will be offices. This is a climb-down from the original design, which included two buildings – a 60 story office tower and a 40 floor hotel and condominium project. The new building is little of an endorsement of downtown's office demand.

Transitioning from Adaptive Reuse?

This conversions may be the tail end of trend. DT News reports that it has become more economical for many developers to construct new residential buildings, rather than to convert empty commercial buildings. As demand has increased, so have prices of existing buildings, which makes adaptive reuse   less attractive. Further, many of the structures on Broadway, which casual observation might indicate have potential for conversion, but the density of development may make offering enough natural light difficult for residences.

Ups and Downs of Downtowns

As employment has dispersed throughout the Los Angeles area, there has been less of a need for a central business district. Among the nation's larger downtowns, only downtown Los Angeles has undertaken wholesale abandonment of its commercial core and built a new one. Perhaps this is, in part, because the 13-story height limit rendered the older buildings uneconomic for the second half of the 20th century.

New York (Manhattan), south of 59th Street also has seen its ups and downs. But New York did not abandon large swaths of development, only to move elsewhere. Downtown Chicago expanded northward along Michigan Avenue, but little if any of the Loop was ever abandoned and it has undergone continuous renewal. The West Coast's premium downtown areas, San Francisco and Seattle, have interspersed new development along with the old, and remain more important to their metropolitan areas than downtown Los Angeles, accounting for from four to six times its employment share (though still less than 15 percent). Even Houston, which most resembles Los Angeles in its post war downtown rebuild, managed its transformation without abandoning the historic core. And, at the same time, all are enjoying increasing residential demand, like downtown Los Angeles.

Rising Demand

Downtown interests are rightly proud of the rising residential population. This has occurred in many downtowns across the nation. Between 2000 and 2010, areas within 2 miles of City Hall gained 206,000 residents in the major metropolitan areas (over 1 million population). However, within in the next ring, from 2 to 5 miles from City Hall the decline in population more than compensated for the core gains (minus 272,000).

The situation was the same in Los Angeles, where the Census Bureau reports that population within 2 miles of City Hall rose 12,000, while it declined 23,000 between 2 and 5 miles. The growth of downtown Los Angeles is impressive in part because it was stagnant for so many decades. In context, however, it is no "game-changer." Overall in the last decade all growth in the Los Angeles metropolitan area was outside the 5 mile ring, and 75 percent of that was more than 20 miles from City Hall (Figure 2).

A New Species is Born

It would be a mistake to characterize the emerging downtown Los Angeles as reasserting any economic primacy. Its former function is beyond revival. This was indicated by UCLA Anderson Forecast economist David Shulman, who indicated that he was "not bullish on Downtown Los Angeles." The report by public radio station KPCC continued:

"That view runs counter to the impression that downtown L.A. is staging an urban comeback. But the resurgence is more about sports and entertainment venues, restaurants and bars, loft conversions, and hotels than it is about companies that need a lot of floors in tall buildings. Nightlife and streetscapes trump florescent light and cubicles."

This refers to the new entertainment venues, such as the Staples Center, the Walt Disney Concert Hall and "LA Live," which may be joined by a new football stadium for a proposed National Football League franchise.

The transformation of downtown Los Angeles is not so much a renaissance of a business core, but a shift into a new, and different, function. The new downtown resembles serves a function similar to that of Wilshire Boulevard’s more heavily residential high-rise district. But it's not likely to ever resemble the Upper East Side or Upper West Side in New York, not only because its residential base will remain  small, but because downtown is hardly an ascendant business center. Downtown’s recovery as a residential district – with a population roughly equivalent to the suburb of Diamond Bar – is indeed impressive, but its role as a vital urban economic center remains relatively small. 

-------

Photo: Downtown Los Angeles toward the Hollywood Hills and the San Fernando Valley (by author)

Wendell Cox is principal of Demographia, an international public policy and demographics firm. He is co-author of the "Demographia International Housing Affordability Survey" and author of "Demographia World Urban Areas" and "War on the Dream: How Anti-Sprawl Policy Threatens the Quality of Life." He was appointed to three terms on the Los Angeles County Transportation Commission, where he served with the leading city and county leadership as the only non-elected member. He was appointed to the Amtrak Reform Council to fill the unexpired term of Governor Christine Todd Whitman and has served as a visiting professor at the Conservatoire National des Arts et Metiers, a national university in Paris.


Fracking, Youngstown and The Right to the City

$
0
0

What happens when the Chamber of Commerce, labor leaders, and government officials, most of whom live outside the city, are pitted against a small yet influential group of community and university activists? That's what's going on right now in a debate over a ballot initiative that would prevent gas extraction by hydraulic fracturing — fracking — in Youngstown, Ohio. The proposed ordinance, Community Bill of Rights (CBR), is modeled on similar anti-drilling legislation in other Ohio communities that would largely block drilling, as well as shale gas extraction and injection wells, especially in urban areas.

This is the third attempt during the last two years to pass such legislation in Youngstown, and the vote has become closer each time. In the most recent try, 45 per cent supported the ordinance and 55 per cent opposed it. Supporters hope to shift the balance this time.

The underlying legal issue is whether local community restrictions can preempt Ohio’s legal framework for gas and oil drilling. Ohio is a home rule state where municipalities have authority "to exercise all powers of local self-government and to adopt and enforce within their limits such local police, sanitary and other similar regulations, as are not in conflict with general laws”. As proponents of the Youngstown ordinance point out, there is no exception in the Constitution for the oil and gas industry.

The Constitution would seem to give Youngstown the right to regulate fracking on the local level, but in 2004, the Ohio legislature passed a bill HB 278 explicitly denying that right. The bill was largely written by the oil and gas industry, which recruited support for it by flooding both Republicans and Democrats with campaign contributions, according to former Ohio Attorney General Marc Dann. This happened before the industry expanded drilling in the Marcellus and Utica Shale regions of Eastern Ohio, suggesting that the industry knew it would encounter local resistance.

Resistance to fracking reflects concerns about the well-documented relationship between fracking and earthquakes, both nationally and in Youngstown, and related health concerns. But what makes the Youngstown fight so remarkable is the setting: a community with a long history of economic struggle.

Youngstown has been the poster child for deindustrialization and disinvestment since 1977. The city has lost over 30 per cent of its population in the last quarter century, and it has demolished over 3000 properties in the last five years. The average sale price for a home is $21,327. Other challenges include a median household income of $24,880 and a 36 per cent poverty rate. It’s also home to several prisons; one of every 20 residents is a prisoner. Alan Mallach, an urbanist and senior fellow of the National Housing Institute, notes that economic development efforts have not sufficiently addressed these problems, pointing out that “… factories or warehouses that the city has attracted usually move to the nearby suburbs, and four out of five jobs in the city are filled by people who commute from out of town.”

Those opposing the Community Bill of Rights capitalize on these difficulties. They have spent large sums to set up phone banks in black urban churches, promoting the idea that fracking will create jobs. Yet there is very little evidence that African Americans have benefited from the fracking industry, except as precarious laborers.

Many of those who are pushing for fracking don’t live in the city, and won’t have to live with its problems. These include Chamber members, labor unionists (especially the skilled trades), and city government employees who are exempted from local city residency requirements – a policy that contributed to the flight of middle-class white residents and the hollowing out of the city.

The difference between the influence of these non-residents and the less well-financed voices of those who live in the city has not been lost on Community Bill of Rights supporters. CBR leaders Ray and Susie Beiersdorfer, city residents and Youngstown State University geologists, recognize that the blitz of advertising by the oil and natural gas industry, promising future jobs, appeals to the largely working-class, mostly black residents who are most affected by the city’s high levels of poverty and unemployment. But as a group of YSU academics noted in a letter to a Youngstown newspaper, “The same can be said for the manufacturing of cigarettes, alcohol, drones, high-range missiles, and nuclear warheads.”

Youngstown, of course, is especially susceptible to the promise of jobs, even at the expense of the environment and health, and that has led some on the political left to either stay out of the fight or to oppose the CBR. Younger, environmentally-conscious city residents, including proponents of urban farming and sustainability, support the CBR. Other community groups think that the ban is too localized, and want to work on statewide fights. They argue that, because of the 2004 legislation, the local CBR is unenforceable and largely symbolic. Many local Democratic Party leaders also are visibly and vocally opposing the CBR. Democratic voters see their local leadership standing arm and arm with the many of same people who have attempted to undermine unionism and voting rights in Ohio.

The proponents of the ban have been particularly troubled by the role of the city’s largest institution, Youngstown State University, and the resources it has accepted from the oil and gas industry. The impact of the university’s support of fracking has been powerful. YSU has downsized or abolished Humanities and Arts programs, while expanding its STEM (science, tech, engineering and math) college and trumpeting its training programs for promised oil and gas industry jobs that have yet to materialize in any significant degree. Some educators, like Deborah Mower, have argued that this should not be the role of the University: “Instead of merely responding to the industry need and ignoring the problems of fracking that have plagued the industry for decades, the university could create an epicenter for redressing their problems…. Perhaps lost in this discussion is the nature of education.”

CBR proponents agree with that sentiment, but they might also point out that what is really at stake is, as the organizers of an upcoming international conference phrase it, the “right to the city” versus the influence of non-residents (disclosure: I'll be speaking in May on so-called "smart shrinkage" at The Right to the City in an Era of Austerity (1973-2014) .

The oil and gas industry has spent over $100,000 to defeat the CBR, and proponents have been sued to keep it off the ballot. Meanwhile, the Beiersdofers and other CBR organizers increasingly believe that public health, science and the ballot box are being overpowered by money. But they won’t let that happen in Youngstown without a fight.

John Russo is a visiting research fellow at the Metropolitan Institute of Virginia Tech, and former co-director of the Center for Working-Class Studies / professor (emeritus) in the Williamson College of Business Administration at Youngstown State University. He is a board member of the Mahoning Valley Organizing Collaborative (MVOC) (Youngstown-Warren), and the co-author, with Sherry Linkon, of Steeltown U.S.A.: Work and Memory in Youngstown.

Flickr photo by Don O'Brien, Red, White and Blue: In Ohio, 100-barrel tanks used to contain crude oil from gas wells.

The Spread of 'Debate is Over' Syndrome

$
0
0

The ongoing trial involving journalist Mark Steyn – accused of defaming climate change theorist Michael Mann – reflects an increasingly dangerous tendency among our intellectual classes to embrace homogeneity of viewpoint. Steyn, whose column has appeared for years on these pages, may be alternatingly entertaining or over-the-top obnoxious, but the slander lawsuit against him marks a milestone in what has become a dangerously authoritarian worldview being adopted in academia, the media and large sections of the government bureaucracy.

Let’s call it “the debate is over” syndrome, referring to a term used most often in relationship with climate change but also by President Barack Obama last week in reference to what remains his contentious, and theoretically reformable, health care plan. Ironically, this shift to certainty now comes increasingly from what passes for the Left in America.

These are the same people who historically have identified themselves with open-mindedness and the defense of free speech, while conservatives, with some justification, were associated more often with such traits as criminalizing unpopular views – as seen in the 1950s McCarthy era – and embracing canonical bans on all sorts of personal behavior, a tendency still more evident than necessary among some socially minded conservatives.

But when it comes to authoritarian expression of “true” beliefs, it’s the progressive Left that increasingly seeks to impose orthodoxy. In this rising intellectual order, those who dissent on everything from climate change, the causes of poverty and the definition of marriage, to opposition to abortion are increasingly marginalized and, in some cases, as in the Steyn trial, legally attacked.

A few days ago, Brendan Eich, CEO of the web browser company Mozilla, resigned under pressure from gay rights groups. Why? Because it was revealed he donated $1,000 to the campaign to pass Proposition 8, California’s since-overturned ballot measure defining marriage as between one man and one woman.

In many cases, I might agree with some leftist views, say, on gay marriage or the critical nature of income inequality, but liberals should find these intolerant tendencies terrifying and dangerous in a democracy dependent on the free interchange of ideas.

This shift has been building for decades and follows the increasingly uniform capture of key institutions – universities, the mass media and the bureaucracy – by people holding a set of “acceptable” viewpoints. Ironically, the shift toward a uniform worldview started in the 1960s, in part as a reaction to the excesses of Sen. Joseph McCarthy and the oppressive conformity of the 1950s.

But what started as liberation and openness has now engendered an ever-more powerful clerisy – an educated class – that seeks to impose particular viewpoints while marginalizing and, in the most-extreme cases, criminalizing, divergent views.

Today’s clerisy in some ways resembles the clerical First Estate in pre-revolutionary France, which, in the words of the historian Georges Lefebvre, “possessed a control over thought in the interests of the Church and king.” With today’s clerisy, notes essayist Joseph Bottum, “social and political ideas [are] elevated to the status of strange divinities ... born of the ancient religious hunger to perceive more in the world than just the give and take of ordinary human beings, but adapted to an age that piously congratulates itself on its escape from many of the strictures of ancient religion.”

To be sure, there remains a still-potent camp of conservative ideologues, many associated with think tanks, such as the Heritage Foundation, and a host of publications, most notably the media empire controlled by the Murdoch family. But, for the most part, today’s clerisy in media and academia tilts in one basic direction, embracing a fairly uniform set of secular “truths” on issues ranging from the nature of justice, race and gender, to the environment.

Those who dissent from the “accepted” point of view may not suffer excommunication, burning at the stake or other public rituals of penance, but can expect their work to be vilified or simply ignored. In some bastions of the new clerisy, such as San Francisco, an actress with unsuitable views can be pilloried, and a campaign launched to remove her from a production for supporting a Tea Party candidate.

Nowhere is this shift more evident than in academia, as evidenced in Mann’s civil action against Steyn. The climate change issue, one of great import and worthy of serious consideration, is now being buried by the seemingly unscientific notion that everyone needs to follow orthodoxy on an issue that – like the nature of God in the Middle Ages – is considered “settled,” and those who do not agree deserve to be pilloried.

But climate change is just one manifestation of the new authoritarian view in academia. On many college campuses, “speech codes” have become an increasingly popular way to control thought at many campuses. Like medieval dons, our academic worthies concentrate their fire on those whose views – say on social issues – offend the new canon. No surprise, then, as civil libertarian Nat Hentoff notes, that a 2010 survey of 24,000 college students found that barely a third of them thought it “safe to hold unpopular views on campus.”

This is not terribly surprising, given the lack of intellectual diversity on many campuses. Various studies of political orientation of academics have found liberals outnumber conservatives, from 8-to-1 to 14-to-1. Whether this is a reflection of simply natural preferences of the well-educated or partially blatant discrimination remains arguable,but some research suggests that roughly two of five professors would be less inclined to hire an evangelical or conservative colleague than one more conventionally liberal.

Political uniformity is certainly in vogue. A remarkable 96 percent of presidential campaign donations from the nation’s Ivy League faculty and staff in 2012 went to Obama, a margin more reminiscent of Soviet Russia than a properly functioning pluralistic academy.

This story originally appeared at The Orange County Register.

Joel Kotkin is executive editor of NewGeography.com and Distinguished Presidential Fellow in Urban Futures at Chapman University, and a member of the editorial board of the Orange County Register. He is author of The City: A Global History and The Next Hundred Million: America in 2050. His most recent study, The Rise of Postfamilialism, has been widely discussed and distributed internationally. He lives in Los Angeles, CA.

Turn Of The Screwed: Does The GOP Have A Shot At Wooing Disgruntled Millennials?

$
0
0

Over the past five years, the millennial generation (born after 1983) has been exercising greater influence over the economy, society and politics of the country, a trend that will only grow in the coming years. So far, they’ve leaned Democratic in the voting booth, but could the lousy economic fate of what I’ve dubbed “the screwed generation” lead to a change?

Just look at these numbers. Since 2008, the percentage of the workforce under 25 has dropped by 13.2%, according to the Bureau of Labor Statistics, while that of people over 55 has risen by 7.6%. Among high school graduates who left school in 2009-11, only 16% had full-time work in 2012, and 22% worked part time although most sought a full-time job.

These trends are likely to continue and could worsen, according to the U.S. Department of Labor, particularly for workers between 20 and 24. Today even a college degree guarantees increasingly little in terms of social uplift. Tuition debt is nearing $1 trillion; the percentage of 25-year-olds with school debt has risen from 25% in 2004 to close 40% in 2012. Average indebtedness amongst borrowers has grown 70% from $15,000 to nearly $25,000.

A record one in 10 recent college borrowers has defaulted on their debt, the highest level in a decade. With wages for college graduates on a downward slope, one has to wonder how many more will join them.

Over 43% of recent graduates who are employed are working at jobs that don’t require a college education, according to a recent report by the Heldrich Center for Workforce Development. Some 16% of bartenders and almost the same percentage of parking attendants had a bachelor’s degree or higher, notes Ohio State economics professor Richard Vedder.

Besides a tepid economy, the millennials confront paying off huge public debts, much of it due to the generous pensions of boomer public employees. This constitutes what economist Robert Samuelson has labeled “a generational war” in which the young are destined to be losers in the “withering of the affluent society.” As he puts it: “For millions of younger Americans—say, those 40 and under—living better than their parents is a pipe dream. They won’t.”

Not surprisingly, the young, who are traditionally optimists, are becoming far less so. According to a Rutgers study, 56% of recent high school graduates feel they would not be financially more successful than their parents; only 14% thought they’d do better. College education doesn’t seem to make a difference: 58% of recent graduates feel they won’t do as well as the previous generation. Only 16% thought they’d do better.

According to Pew Research, up to half of millennials lean Democratic, compared to barely a third who favor the Republicans. The actue generational chronciclers Morley Winograd and Mike Hais suggest that this will continue and that hard times may even strengthen millennial support for what they describe as “economically activist government.” They cite a 2011 Pew poll that found millennials preferred a larger government that provided more services over a smaller one by a 54% to 35% margin. By contrast, 54% of boomers (born 1946-1964) and 59% of the silent generation (born 1925-1945) favored a smaller government.

Critically, they maintain, these political views are likely to remain in place throughout their lifespans. The “Greatest Generation,” those born before 1925 who grew up during the Depression, never lost their enthusiasm for government.

But it may be premature for Democrats to presume they have a lock on millennials’ loyalty.

In 2008, twice as many millennials identified as Democrats or leaned Democratic (58%) as identified with the GOP or leaned Republican (29%), according to Pew. Cut to 2014, and the Democrats’ advantage among millennials has narrowed to 16 percentage points (50% to 34%).

Although barely a a quarter of those under 35 said they had positive feelings toward the Republican Party in the last Wall Street Journal/NBC News poll, in a poll earlier this year, support for the Democrats has also dropped from roughly half to barely a third. Last year, a majority of 18- to 29-year-olds polled in a Harvard study no longer approved of the president’s performance.

This suggest that like boomers under Jimmy Carter, who then shifted to Reagan, the millennials are not to be taken for granted. To attract them, though, Republicans will need to change many of their positions.

Millennials, for example, are far more heavily minority, and descended from recent immigrants; they are likely to be far more permissive on immigration reform than earlier generation. At the same time, they embrace significantly more liberal views on issues like gay marriage and legalization of marijuana than older generations. Republicans right now are not competitive on these issues.

Some conservatives rest their hopes not on attracting millennial voters but on the possibility that they’ll stay home during the mid-term elections. In 2010, 18- to 24-year-olds turned out at half the rate of the rest of electorate. But this can’t go on forever; the millennial share of the vote, even with poor turnouts, will continue to go up and will eventually overwhelm a party that depends on older voters to prop them up. In 2012 millennials accounted for roughly a quarter of the electorate; by 2020 they will be about 36%.

Simply put, Republicans have no choice but to engage this population. To do so, they must focus primarily on economic growth, where the Democrats don’t have much to recommend themselves. Issues where the GOP could make up ground include reform for boomer pensions, as well as policies to spark job and income growth.

To win over a significant share of millennials, Republicans don’t so much need a new Reagan as a program that inspires more confidence in the economic future.

Although I am not fond of either party, a more competitive political environment among millennials would be useful, not only for conservatives also for the generation itself. As African Americans should have learned by now, being taken for granted does not guarantee better service from the political class. Under the country’s first black president, conditions for African Americans have declined rapidly.

The evolution of the boomer generation suggests that such a change of fortune could happen. Between 1990 and today, the percentage of boomers identifying with the Democratic Party has dropped from 31% in 1990 to 25%. Much of this stemmed from reaction to the failures of the Carter presidency.

This suggests that, although the formative years are critical, people do change their views as they age, experience life as adults and, most importantly, become parents. Many may not become Republicans, but could easily shift towards independent status. It may not happen this year, but perhaps later in the decade.

Over time, even the self-absorbed boomers will have to give way to the needs of the new generation. The challenge for both parties is to develop policies that will allow the millennials to rise as have previous American generations. Whether these ideas come from the right or left seems less important than that the debate be engaged, open and focused more on the future than the past.

This piece originally appeared in Forbes.

Joel Kotkin is executive editor of NewGeography.com and Distinguished Presidential Fellow in Urban Futures at Chapman University, and a member of the editorial board of the Orange County Register. He is author of The City: A Global History and The Next Hundred Million: America in 2050. His most recent study, The Rise of Postfamilia

Unemployed photo by BigStockPhoto.com.

Largest World Cities: 2014

$
0
0

The recently released 10th edition of Demographia World Urban Areas provides estimated population, land area and population density for the 922 identified urban areas with more than 500,000 population. With a total population of 1.92 billion residents, these cities comprise approximately 51 percent of the world urban population. The world's largest cities are increasingly concentrated in Asia, where 56 percent are located. North America ranks second to Asia, with only 14 percent of the largest cities (Figure 1). Only three high income world cities are ranked in the top ten (Tokyo, Seoul and New York) and with present growth rates, Tokyo will be the lone high-income representative by the middle 2020s.

Demographia World Urban Areas is the only regularly published compendium of urban population, land area and density data for cities of more than 500,000 population. Moreover, the populations are matched to the urban land areas where sufficient data is available from national census authorities.

The City

The term "city" has two principal meanings. One is the "built-up urban area," which is the city in its physical form, encompassing virtually all of the land area encircled by rural land or bodies of water. Demographia World Urban Areas reports on cities as built-up urban areas, using the following definition (Note 1).

An urban area is a continuously built up land mass of urban development that is within a labor market (metropolitan area or metropolitan region). As a part of a labor market, an urban area cannot cross customs controlled boundaries unless the virtually free movement of labor is permitted. An urban area contains no rural land (all land in the world is either urban or rural).

The other principal definition is the labor market, or metropolitan area, which is the city as the functional (economic) entity. The metropolitan area includes economically connected rural land to the outside of the built-up up urban area (and may include smaller urban areas). The third use, to denote a municipal corporation (such as the city of New York or the city of Toronto) does not correspond to the city as a built-up urban area or metropolitan area. This can – all too often does –   cause confusion among analysts and reporters who sometimes compare municipalities to metropolitan areas or to built-up urban areas.

A Not Particularly Dense Urban World

Much has been made of the fact that more than one-half of humanity lives in urban areas, for the first time in history. Yet much of that urbanization is not of the high densities associated with cities like Dhaka, New York, or even Atlanta.

The half of the world's urban population not included in Demographia World Areas lives in cities ranging in population from the hundreds to the hundreds of thousands (see: What is a Half-Urban World). In the high income world, residents of large urban areas principally live at relatively low densities, with automobile oriented suburbanization accounting for much of the urbanization in Western Europe, North America, Japan and Australasia. This point was well illustrated in research by David L. A. Gordon et al at Queen's University (Kingston, Ontario), released last year which concluded that the metropolitan areas of Canada are approximately 80 percent suburban.

Population

There are now 29 megacities, with the addition in the last year of London. London might be thought of as having been a megacity for decades, however the imposition of its greenbelt forced virtually all growth since 1939 to exurban areas that are not a part of the urban area, keeping its population below the 10 million threshold until this year (Demographia World Urban Areas Table 1).

The largest 10 contain the same cities as last year, though there have been ranking changes. Tokyo, with 37.6 million residents, continues its half century domination, though its margin over growing developing world cities is narrowing, especially Jakarta. Manila became the fifth largest urban area in the world, displacing Shanghai, while Mexico City moved up to 9th, displacing Sao Paulo (Figure 2).

Land Area

Often seen as the epitome of urban density, the urban area of New York continues to cover, by far, the most land area of any city in the world. Its land area of nearly 4,500 square miles (11,600 square kilometers) is one-third higher than Tokyo's 3,300 (8,500 square kilometers). Los Angeles, which is often thought of as defining low-density territorial expansion ranks only fifth, following Chicago and Atlanta, with their substantially smaller populations (Figure 3). Perhaps more surprisingly is the fact that Boston has the sixth largest land area of any city in the world. Boston's strong downtown (central business district) and relatively dense core can result in a misleading perception of high urban density. In fact, Boston's post-World War II suburbanization is at urban densities little different than that of Atlanta, which is the world's least dense built-up urban area with more than 3 million population. Now, 29 cities cover land areas of more than 1,000 square miles or 2,500 square kilometers (Demographia World Urban Areas Table 3).

Urban Density

All but two of the 10 densest cities are on the Indian subcontinent. Dhaka continues to lead in density, with 114,000 residents per square mile (44,000 per square kilometer).  Hyderabad (Pakistan, not India) ranks a close second. Mumbai and nearby Kalyan (Maharashtra) are the third and fourth densest cities. Hong Kong and Macau are the only cities ranking in the densest ten outside the subcontinent (Figure 4). Despite its reputation for high urban densities, the highest ranking city in China (Henyang, Hunan) is only 39th (Demographia World Urban Areas Table 4).

Smaller Urban Areas

Demographia World Urban Areas Table 2 includes more than 700 additional cities with fewer than 500,000 residents, mainly in the high income world. Unlike the main listing of urban areas over 500,000 population, the smaller cities do not represent a representative sample, and are shown only for information.

Density by Geography

Demographia World Urban Areas also provides an average built-up urban area density for a number of the geographical areas. Africa and Asia had the highest average city densities, at 18,000 per square mile (7,000 per square kilometer), followed by South America. Europe was in the middle, while North America and Oceania have the lowest average city densities (Figure 5).

Some geographies, however, had much higher average urban densities. Bangladesh was highest, at 86,800 per square mile (33,000 per square kilometer), nearly five times the Asian average. Other geographies above 30,000 per square mile (11,500 per square kilometer) included Pakistan, the Democratic Republic of the Congo, the Philippines, India and Colombia, the only representative from the Western Hemisphere (Demographia World Urban Areas Table 5).

Wendell Cox is principal of Demographia, an international public policy and demographics firm. He is co-author of the "Demographia International Housing Affordability Survey" and author of "Demographia World Urban Areas" and "War on the Dream: How Anti-Sprawl Policy Threatens the Quality of Life." He was appointed to three terms on the Los Angeles County Transportation Commission, where he served with the leading city and county leadership as the only non-elected member. He was appointed to the Amtrak Reform Council to fill the unexpired term of Governor Christine Todd Whitman and has served as a visiting professor at the Conservatoire National des Arts et Metiers, a national university in Paris.

----------------------

Note 1: Urban areas are called also called "population centres" (Canada), "built-up urban areas" (United Kingdom, "urbanized areas' (United States), "unités urbaines" (France)  and "urban centres" (Australia). The "urban areas" of New Zealand include rural areas, as do many of the areas designated "urban" in the People's Republic of China, and, as a result, do not meet the definition of urban areas above.

Note 2: Demographia World Urban Areas is a continuing project. Revisions are made as more accurate satellite photographs and population estimates become available. As a result, the data in Demographia World Urban Areas is not intended for comparison to prior years, but is intended to be the latest data based upon the best data sources available at publication.

Photograph: Slum, Valenzuela City, Manila (by Author)

Insights into Planning for the Future From Long Island

$
0
0

Recently, Long Island-based Foggiest Idea launched an all-new feature called The Foggiest Five, which asks influential Long Islanders five questions regarding the future of the region. The first participant was Andrew Freleng, who serves as Suffolk County's Chief Planner. Freleng's experience and dedication to the field made for the perfect first featured guest.

The Foggiest Idea was started in 2010 as a dedicated effort to make land use and development issues approachable and understandable to the general public. Since its creation, the site has been used by journalists, policymakers and residents in order to research and understand the issues that shape their community. The Foggiest Five serves to present different viewpoints and perspectives on development issues, while at the same time adhering to strict urban planning principles often forgotten in the name of simplifying the issues for quick consumption.

The feedback to the feature has been positive, with the first round of answers by Suffolk County’s Chief Planner Andrew Freleng generating much discussion on the Nassau and Suffolk’s future. Freleng’s segment can be read here.

What makes Freleng's commentary so compelling is that despite his entrenchment in the milieu of Long Island's development scene, his instinct for and adherence to following sound planning principles is not only intact, but heightened. The questions presented were simple:

1. What is your favorite part of living on Long Island?

2. What is our greatest regional challenge?

3. What is an easy first step to solving this challenge?

4. What has been the biggest change that you've seen on Long Island during the course of your career?

5. What do you think Long Island will be like in 20 years?

The answers reflected greater undertones that showed an underlying frustration with the way land use planning is conducted on Long Island, and a sense of optimism that we can always improve.

What was most compelling about Freleng’s answers was that he touched upon many aspects of regional development now often ignored. Those engaged with the issues forget that development issues are complex, and cannot solely be captured by buzzwords or agendas.

In recent years, the conversation regarding the future of America's definitive suburb has been dominated by involved stakeholders, "advocates" and politicians. All of these groups have something to gain when it comes to the successful promotion of hard, aggressive solutions that push for infrastructure improvements and increasing density yield. To have developers dictating the terms and conditions of the regional debate on housing is akin to having Oil Barons from Texas singularly dictating energy policy – it just doesn't make sense. On Long Island, it truly is a case of the foxes watching the hen house when it comes to urban development.

Long Island, like so many other regions nationwide, is a victim of its own success. The rapid expansion of both Nassau and Suffolk overwhelmed the municipalities preference for home-rule community building, allowing development to run rampant on any vacant lot from Elmont to Riverhead with very limited regulation until it was proven necessary by groundwater studies. These federally funded studies, conducted in the late 1970s through mid-1980s, provided the scientific justification for the county to pursue its nationally trailblazing open space preservation efforts and employ stricter land use controls.  

In recent years, the solution to high cost of living, lack of affordable housing and limited economic opportunity has been clustered development in various downtown centers across Long Island, a concept backed by valid planning principles. However, the excellence is in execution, with developers taking the once-valid planning terms "walkable", "sustainable" and "mixed-use", and using them to justify large increases of density without the appropriate infrastructure upgrades to support it – all in the name of Smart Growth that lately has been anything but.

The lessons learned from Nassau and Suffolk Counties can be applied broadly across the United States. First and foremost, planning is a mixture of public education, participation, and implementation. The minute any one of these aspects are forgotten by the municipality or developer looking to increase their yield, the legitimacy of their endeavor is compromised. Nationwide, the smart growth movement has been used to justify anything from storefront apartments to roundabouts. What is needed is a focus that doesn't dumb down the concepts, but rather, presents them in an approachable manner.

Overall, Freleng’s responses capture two distinct needs that get lost in the zeal to build “smart growth mixed-use walkable communities” to “plug the brain drain”: the need for further utilization of Transfer of Development Rights (TDR) in conjunction with increased efforts to preserve open space. These important land use tools, paired with the proper use of home-rule authority that maintains the distinct “sense of place” that Freleng mentions in his favorite part of living on the Island, can help Long Island not only be fiscally and environmentally sustainable, but help the region grow in future decades.

As Chief Planner for the County, Freleng has worked on a multitude of projects both large and small, allowing him a unique perspective to the issues that many don’t share. When asked what Long Island’s greatest regional challenge is, Freleng succinctly responded:

“…to recognize that there is a carrying capacity/saturation population to our island.  In that respect, finding a model for sustained economic growth is a huge challenge.”

It’s very telling for a planner to state that the greatest challenge we face as a region is admitting that we have limits. He did not say that we need more development, nor did he claim that more growth is needed to capture millennials, as countless others have said when asked the same question. Those answers would serve as the easy way out. Unfortunately, many opt for that path. Development and growth is needed, but in the right places, and offset by equal (if not more) preservation.

Freleng chose to point out the fact that despite what stakeholders and others claim, our land use decisions are determined by environmental factors first and economic interests second. For Long Island to remain competitive in the coming decades, we must start planning for the needs of our environment, not doing so as an afterthought. To be blunt, we as an Island cannot build our way to a solution to many of our regional challenges.

Often, I write that the key to planning is maintaining the balance between Long Island’s environment, economy and social equity. In recent years, the tone and pace of the conversation regarding our approach to critical regional issues has been determined by involved stakeholders (housing groups, environmentalists and builders), and invested policymakers more concerned about the election cycle and maintaining their fiefdoms.

Despite the stacked odds, Long Island must always have prevailing sense of optimism. Freleng's final response noted that the Long Island of the future will have room for all generations, which is an encouraging sign we may finally be able to diversify our housing stock. Suffolk County Government seems to be optimistic that the Island's carrying capacity can be increased thanks to advanced wastewater treatment techniques and traffic congestion management, two key factors that limit the Island's growth. Advances in both would help ease the burdens of growth, but sound planning now is necessary for both to be successful.

Now, more than ever, we must properly lay the foundation for a stronger, sustainable Long Island. If we just throw density at the issue, we’ll have a whole host of other problems that are far more extensive and expensive to deal with.

Richard Murdocco writes regularly on land use, planning and development issues for various publications. He has his BA in both Political Science and Urban Studies from Fordham University, and his MA in Public Policy from Stony Brook University, and studied planning under Dr. Lee Koppelman, Long Island's veteran planner. You can follow Murdocco on Twitter @TheFoggiestIdea, Like The Foggiest Idea on Facebook, and read his collection of work on urban planning at TheFoggiestIdea.org.

Silicon Valley’s Giants Are Just Gilded Age Tycoons in Techno-Utopian Clothes

$
0
0

Silicon Valley’s biggest names—Google, Apple, Intel and Adobe—reached a settlement today in a contentious $3 billion anti-trust suit brought by workers who accused the tech giants of secretly colluding to not recruit each other’s employees. The workers won, but not much, receiving only a rumored $300 million, a small fraction of the billions the companies might have been forced to pay had they been found guilty in a trial verdict. 

The criminality that the case exposed in the boardrooms the tech giants, including from revered figures like Steve Jobs who comes off as especially ruthless, should not be jarring to anyone familiar with Silicon Valley.  It may shock much of the media, who have generally genuflected towards these companies, and much of the public, that has been hoodwinked into thinking the Valley oligarchs represent a better kind of plutocrat—but the truth is they are a lot like the old robber barons.

Starting in the 1980s, a mythology grew that the new tech entrepreneurs represented a new, progressive model that was not animated by conventional business thinking. In contrast to staid old east coast corporations, the new California firms were what futurist Alvin Toffler described as “third wave.” Often dressed in jeans, and not suits, they were seen as inherently less hierarchical and power-hungry as their industrial age predecessors.  

Silicon Valley executives were not just about making money, but were trying, as they famously claimed, to “change the world.” One popularizing enthusiast, MIT’s Nicholas Negroponte, even suggested that “digital technology” could turn into “a natural force drawing people into greater world harmony.”

This image has insulated the tech elite from the kind of opprobrium meted out to their rival capitalist icons in other, more traditional industries. In 2011, over 72 percent of Americans had positive feelings about the computer industry as opposed to a mere 30 percent for banking and 20 percent for oil and gas. Even during the occupy protests in 2012, few criticisms were hurled by the “screwed generation” at tech titans. Indeed, Steve Jobs, a .000001 per center worth $7 billion, the ferocious competitor who threatened “war” against Google if they did not cooperate in his wage fixing scheme, was openly mourned by protestors when news spread that he had passed away.

But the collusion case amply proves what has been clear to those watching the industry: greed and the desire to control drives tech entrepreneurs as much as any other business group. The Valley is great at talking progressive but not so much in practice. In the very place where private opposition to gay marriage is enough to get a tech executive fired, the big firms have shown a very weak record of hiring minorities and women. And not surprisingly, firms also are notoriously skittish about revealing their diversity data. A San Jose Mercury report found that the numbers of Hispanics and African Americans employees in Silicon Valley tech companies, already far below their percentage in the population, has actually been declining in recent years. Hispanics, roughly one quarter of the local labor force, account for barely five percent of those working at the Valley’s ten largest companies. The share of women working at the big tech companies - despite the rise of high profile figures in management—has also showed declines.    

In terms of dealing with “talent,” collusion is not the only way the Valley oligarchs work to keep wages down.  Another technique is the outsourcing of labor to lower paid foreign workers, the so called “techno-coolies.” The tech giants claim that they hire cheap workers overseas because of a critical shortage of skilled computer workers but that doesn't hold up to serious scrutiny. A 2013 report from the labor-aligned Economic Policy Institute found that the country is producing 50% more IT professionals per year than are being employed. Tech firms, notes EPI, would rather hire “guest workers” who now account for one-third to one half of all new IT job holders, largely to maintain both a lower cost and a more pliant workforce.

Some of this also reflects a preference for hiring younger employees at the expense of older software and engineering workers, many of whom own homes and have families in the area.  

 “I want to stress the importance of being young and technical," Facebook's CEO Mark Zuckerberg said at an event at Stanford University in 2007. "Young people are just smarter. Why are most chess masters under 30? I don't know. Young people just have simpler lives. We may not own a car. We may not have family. Simplicity in life allows you to focus on what's important."

Of course what’s really “important” to Zuckerberg, like moguls in any time and place, is maximizing profits and raking in money, both for themselves and their investors. The good news for the bosses has been that employees are rarely in the way.  Unlike the aerospace, autos or oil industries, the Valley has faced little pressure from organized labor, which has freed them to hire and fire at their preference.  Tech workers wages, on the other hand, have been restrained both by under the table agreements and the importation of “technocoolies.”

Rather than being a beacon of a new progressive America, the Valley increasingly epitomizes the gaping class divisions that increasingly characterize contemporary America.  Employees at firms like Facebook and Google enjoy gourmet meals, childcare services, even complimentary house-cleaning to create, as one Google executive put it, “the happiest most productive workplace in the world.” Yet, the largely black and Hispanic lower-end service workers who clean their offices, or provide security, rarely receive health care or even the most basic retirement benefits. Not to mention the often miserable conditions in overseas factories, notably those of Apple.

It’s critical to understand that the hiring restrictions exposed by Friday’s settlement, reflect only one part of the Valley’s faux progressiveness and real mendacity. These same companies have also been adept at circumventing user privacy and avoiding their tax obligations.

One might excuse the hagiographies prepared by the Valley’s ever expanding legion of public relations professionals, and their media allies,  but the ugly reality remains. The  Silicon Valley tech firms tend to be  every bit as cutthroat and greedy as any capitalist enterprise before it. We need to finally see the tech moguls not as a superior form of oligarch, but as just the latest in long line whose overweening ambition sometimes needs to be restrained, not just celebrated.

This story originally appeared at The Daily Beast.

Joel Kotkin is executive editor of NewGeography.com and Distinguished Presidential Fellow in Urban Futures at Chapman University, and a member of the editorial board of the Orange County Register. He is author of The City: A Global History and The Next Hundred Million: America in 2050. His most recent study, The Rise of Postfamilialism, has been widely discussed and distributed internationally. He lives in Los Angeles, CA.

Should Middle Class Abandon the American Dream?

$
0
0

Over the past few years, particularly since the bursting of the housing bubble, there have been increasing calls for middle-class Americans to “scale down” from their beloved private homes and seek a more constrained existence. Among these voices recently was Michael Milken, for whom I have worked and have enormous respect. He suggested Americans would be better off not buying homes and living smaller, for the sake of their own economic situations, families and the environment.

To some extent, the Great Recession has done much to make downsizing a reality, just as Milken and others propose. Homeownership in America, which peaked in 2002 at nearly 70 percent, dropped, according to the U.S. Census Bureau, to 65 percent in 2013, the lowest level in 15 years. Some of this may be seen as correcting the excesses of the housing bubble, but the trajectory suggests – and many analysts agree – that ownership may continue to fall in years ahead.

The question now is, do we want Americans to abandon homeownership, leave the less-crowded periphery for congested areas, adopting the chock-a-block lifestyle much as many of their grandparents did? This poses an easier proposition for the ultrarich, who already live far larger than the average American and whose biggest real estate worry more likely involves which pied a terre or country house they want to purchase next.

This is very different than the reality of the average middle-class family, whose concerns are more prosaic, such as finding room for home offices, deciding how few bathrooms a family can accommodate without armed conflict and if it is even feasible to afford the close-in communities their betters want them to inhabit.

Unable to play the stock game on the scale of gain like those who invest in private equity, hedge funds or venture capital, for the middle classes the home remains the one place where they can gain equity and, perhaps more importantly, some sense of autonomy. For many, it is the only large investment they can afford, since at least it provides a place to live and offsets the rent that they would have to pay otherwise.

The recovery has been sweet for the rich, in large part because they have the extra money to invest in stocks. They have 24 percent of their wealth in homes, compared with 40 percent for middle-income families.

And, since the rich can afford to send their kids to elite schools, where degrees increasingly are the last ones to produce much value at the high end of the job market, to such people, the investment in education urged by Milken may seem like a good bet. Investing more in conventional education, however, is no panacea for many middle-class and working-class families, whose kids are often saddled with debt and attend the second-tier schools whose returns on income are far less attractive, say, than those who can send their kids to Harvard.

This is not to say that many larger homes seem foolhardy investments. But there are many legitimate reasons why people may need larger spaces. Among the most prominent is the growing tendency for people to work at home – most metro areas have far more telecommuters than transit commuters – as well as the increasing numbers of multigenerational households, which, after falling for decades, have risen from 12 percent of total households to 16 percent since 1980.

The phenomena of some among the rich calling for the middle class to scale back represents one of the least-attractive aspects of the current gentry liberal ascendency. In one remarkable piece, Dave Zahniser, writing for the LA Weekly, went to the homes of L.A.’s “smart growth” advocates, most of whom want ever more density and multifamily apartments as opposed to houses. And where did they live? Almost all in large houses, often in gated communities, far from any bus line. Zahnhiser’s headline captured the hypocrisy: “Do what we say, not what we do.”

Cloaked in sensible rhetoric, the current drive to discourage middle-class homeownership really represents a kind of class warfare, albeit unacknowledged, waged by wealthy people upon the middle class, who, the wealthy suggest, should live smaller even as they indulge ever-expanding luxury. Talk about adding insult to injury: Middle-income groups have fared far worse during the recovery than the rich or, in relative terms, the poor.

Some advocacy for middle-class downsizing is brazenly self-interested. The Wall Streetadvocates of a “rentership” society see a great opportunity for profit as Americans are deprived of their aspirations by the weak economy. As the dream of some autonomy fades, more families are forced to become renters in apartments or houses that such hedge funds as Blackstone have collected from distressed former owners.

In the process, a huge portion of the population is being transformed from property owners to renting serfs; money that might have gone to building a family nest egg ends up paying the mortgages for the investor class. In this neofeudalist landscape, landlords replace owner-occupants, perhaps for as long as the next generation.

“There is the possibility that Wall Street and the banks and the affluent 1 percent stand to gain the most from this,” said Jack McCabe, a real estate consultant based in Deerfield Beach, Fla. “Meanwhile, lower-income Americans will lose their opportunity for the American Dream of building wealth through owning a home.”

Other wealthy folks – notably some in Hollywood and Silicon Valley – also support a California planning regime that makes difficult the purchasing and construction of family-size homes, largely as a means to reducing the dreaded human “carbon footprint.” Yet they, too, are often unconsciously hypocritical, as many of them live in palatial houses, and often fly on private jets, one of the quickest ways to boost one’s carbon emissions. Google’s top executives, among the most reliable allies of the middle-class-destroying green and urban-planner lobby, famously have a fleet of planes based at San Jose Airport.

Others, like the environment magazine Grist, embrace a more idealistic vision of a new generation that rarely owns and doesn’t embrace conventional ambitions. They see the current millennial generation, facing limited economic prospects and high housing prices, as “a hero generation,” rejecting the material trap of suburban living and work that engulfed their parents.

This story originally appeared at The Orange County Register.

Joel Kotkin is executive editor of NewGeography.com and Distinguished Presidential Fellow in Urban Futures at Chapman University, and a member of the editorial board of the Orange County Register. He is author of The City: A Global History and The Next Hundred Million: America in 2050. His most recent study, The Rise of Postfamilialism, has been widely discussed and distributed internationally. He lives in Los Angeles, CA.


The Best Cities For Jobs 2014

$
0
0

As the recovery from the Great Recession stretches into its fifth year, the locus of economic momentum has shifted. In the early years of the recession, the cities that created the most jobs — sometimes the only ones — were either government- or military-dominated (Washington, D.C.;  Kileen-Temple-Fort Hood, Texas), or were powered by the energy boom in Texas, Oklahoma and the northern Great Plains.

Now the recovery has shifted to a new group of cities that have benefited from the boom on Wall Street and the parallel IPO surge in Silicon Valley — call them asset inflation cities. Last year the S&P 500 clocked its biggest rise since 1997, helped by aggressive monetary easing by the Federal Reserve and a return to the stock market by investors who had retreated to the sidelines after the financial crisis. The high times have brought on a surge in IPOs: 2013 was the busiest year for public offerings in over a decade, and the pace has if anything quickened this year, with healthcare and technology offerings leading the way. M&A has also surged, with some very impressive valuations in the tech sector, such as Facebook’s $19 billion purchase of 50-person What’s App. The biggest beneficiaries employment-wise: the Bay Area, Silicon Valley and New York City.

View the Best Cities for Jobs 2014 List

Our rankings are based on short-, medium- and long-term job creation, going back to 2002, and factor in momentum — whether growth is slowing or accelerating. So the top of our list includes both cities that have had the most striking comebacks since the Great Recession as well as those that have consistently created jobs over the long haul. We have compiled separate rankings for large cities (nonfarm employment over 450,000), which are our focus this week, as well as medium-size cities (between 150,000 and 450,000 nonfarm jobs) and small cities (less than 150,000 nonfarm jobs) in order to make the comparisons more relevant to each category. (For a detailed description of our methodology, click here.) Small cities, as a rule, show more volatility than their larger counterparts since the decision of one major business to expand or contract can have an enormous effect on a relatively tiny employment base. (Check back next week for our ranking of mid-size and small cities).

Big Money, Big Gains

Yet even among the largest metropolitan areas, shifts in the economy can have a dramatic impact. This is clearly the case with the two metro areas that top our list this year, first-place San Jose-Sunnyvale-Santa Clara, Calif. (aka Silicon Valley), where the number of jobs surged 4.3% last year, and San Francisco-San Mateo-Redwood City, where employment expanded 3.6%. Before the current tech boom, largely centered on social media companies, these metro areas were lagging badly. In 2010, San Jose ranked 47th on this list out of the 66 metro areas with more than 450,000 nonfarm jobs and San Francisco was 42nd.

The information sector has driven this remarkable change in fortunes. Since 2008, the number of information jobs in the San Jose area has risen 37% to 60,800, while in San Francisco, employment in that category has grown 28% to 52,300 jobs. This has been accompanied by strong increases in such high-wage fields as professional and business services, where Silicon Valley has clocked 10% growth, and San Francisco twice that, adding 42,500 jobs, since 2008.

The housing bubble helped to launch New York City from its doldrums a decade ago (it rose from 54th on our list of the Best Cities For Jobs in 2005 to 22th in 2008). In recent years, New York has been well served by Washington’s bailout of the financial sector, which accounts for roughly 15% of the metro area GDP — the Big Apple climbed to 10th place in our ranking in 2010 and to seventh this year. This is in good part a result of asset inflation; the number of finance jobs in New York has actually declined in recent years, but with a lot of extra spending money in the pockets of the city’s relatively high concentration of wealthy people, some jobs are being created. Most of the growth has been in hospitality, health and education and retail, fields that do not generally offer top salaries. New York City has also seen steady growth in information jobs — although at only a third the rate of Silicon Valley — as well as professional and business services.

Bring On The Usual Suspects

Many of the other metro areas at the top of our 2014 list have been adding jobs consistently over the past decade. Some are also beneficiaries of the high-tech boom, though mostly as a result of big West Coast companies deciding to site new offices in these attractive locations. In third place is perennial high-flyer Austin-Round Rock-San Marcos, Texas, where the number of jobs grew 4.1% last year, and 13.7% since 2008. Raleigh-Cary N.C. places fourth (3.9%/7.2% over the same time spans). These metro areas routinely attract people and companies from California and the Northeast with lower taxes and real estate costs that, on an income basis, are as much as half those in the asset-rich areas.

Unlike the asset-based economies, which ebb and flow with the markets, these and the other usual suspects have a record of consistent growth not only in jobs but also population. This reflects the more blue-collar economic foundation of many of these cities, based on energy, manufacturing and logistics — sectors that tend to create higher-paid blue- and white-collar jobs. Growth has continued in these areas throughout all the changes in the economy, which has encouraged long-term migration and investment.

Viewed over the last five years, for example, fifth-place Houston has expanded its total employment by 218,000 jobs, growing at the same rate as both the San Francisco and San Jose metro areas—an impressive feat given that it is almost 20 percent larger than the two Silicon Valley cities combined. But an arguably bigger difference can be seen in demographics. The Houston metro area’s population has grown over 50% faster since 2010 than the Bay Area regions, and roughly twice as fast as New York. Houston is on track this year to build more new housing units than the entire state of California. This combination of rapid population and job growth – the former itself a major source of jobs in construction and services — can be seen in places such as No. 6 Nashville-Franklin-Murfreesboro, Tenn.; No. 10 Denver-Aurora-Broomfield, Colo.; and No. 14 Charlotte-Gastonia-Round Hill, N.C.

The Sun Belt Bounces Back

Perhaps the biggest surprise on this year’s list is the resurgence of the Sun Belt metro areas that were hardest hit by the housing bust. Ever since, the Northeast-centric pundit class has been giddily predicting these cities’ demise. Strangled by high energy prices, cooked by record droughts, rejected by a new generation of urban-centric millennials, the Atlantic proclaimed this vast southern region to be where the American dream has gone to die.

But the data show that many of these metro areas are in the midst of a powerful comeback. Take Orlando-Kissimmee, Fla., ranked eighth this year, up 23 places from last year. Similarly Phoenix has risen 17 places from last year to 22nd and is way up from its 51st place ranking in 2010.


Perhaps even more surprising  is the resurgence of 17th-place Riverside-San Bernardino, Calif., which ranked near the bottom of the big city table at 63rd in 2010. Now foreclosures have dropped and job growth has picked up. In fact, the Inland Empire is now doing considerably better in job creation than Southern California’s older urban regions, including Los Angeles-Long Beach (37th), Santa Ana-Anaheim-Irvine (34th) and San Diego-Carlsbad-San Marcos (32nd).

Bringing Up The Rear

Many large cities continue to lag. Philadelphia, despite being close to New York and its considerable urban amenities, ranks 51st, with paltry 0.9% job growth since 2008. Not much better off, despite its connections to the Obama White House, is Chicago, which places 47th. Not only is the Windy City not adding many jobs (0.5% growth since 2008) but every county in the area, according to recent Census numbers, is losing migrants to other parts of the country.

But Chicago is certainly doing better than the host of old industrial cities that continue to dominate the nether reaches of our survey. These include last-place Camden, N.J.; second to last Detroit-Livonia-Dearborn, Mich.; Cleveland-Elyria- Mentor, Ohio (62nd), Kansas City, Mo. (61st), Newark-Union, N.J. (60th), and St. Louis (59th). All these cities, apart from Kansas City, have occupied the bottom of our list for nearly a decade now, and seem unlikely to move up in the immediate future.

View the Best Cities for Jobs 2014 List

What’s Next

It seems clear that as long as the tech and financial sectors retain their momentum, New York and the Bay Area should continue to fare well. But if asset growth slows, these areas could slip quickly.

The Texas cities and the other usual suspects are probably a better bet to continue to generate new jobs, but they too face challenges. If the economy slows down energy prices will follow, hampering growth in energy meccas like Houston, Dallas and San Antonio. A surge in interest rates could undermine the comeback of the Sun Belt cities, which remain highly dependent on housing and construction-related economic activity.

But overall, for reasons ranging from housing costs to business climate, we expect the usual suspects to remain high on our list of the best cities for jobs for years to come, in part due to their growing populations. What remains unknown is how the evolving industrial structure of the economy will affect the slower-growing cities along the coasts whose fortunes have tended to ebb and flow in recent years.

This story originally appeared at The Orange County Register.

Joel Kotkin is executive editor of NewGeography.com and Distinguished Presidential Fellow in Urban Futures at Chapman University, and a member of the editorial board of the Orange County Register. He is author of The City: A Global History and The Next Hundred Million: America in 2050. His most recent study, The Rise of Postfamilialism, has been widely discussed and distributed internationally. He lives in Los Angeles, CA.

Michael Shires, Ph.D. is a professor at Pepperdine University School of Public Policy.

Photo: Market Street, San Francisco by Wendell Cox.

The New Brooklyn: Girls Vs Ebbets Field?

$
0
0

So much spit has flown on the topic of gentrification in New York City that it seemed at best superfluous and at worst suspicious for New York Times chief film critic A.O. Scott to say anything at all about the subject. But Scott couldn’t resist. In "Whose Brooklyn Is It, Anyway?" last month, Scott stuck a toehold into the debate sparked by film director Spike Lee, whose 7-minute rant against gentrification recently went viral. Lee compared the influx of white New Yorkers into the south Bronx, Harlem, Bedford-Stuyvesant, and Crown Heights to “motherfuckin’ Christopher Columbus,” and decried the pricing out of renters and the wholesale takeover of neighborhoods, whose schools and streets, he claimed, received few resources before the white interlopers arrived.

Among the responders to Lee’s tirade was journalist Errol Louis, who accused Lee of hypocrisy. The filmmaker may have grown up in Fort Greene, Brooklyn, but the $32 million Upper East Side brownstone he just sold (or, as Louis argues, “flipped”), marked him as merely confused.

Scott gets a lot wrong in his attempt to wade into this discussion, but he gets one thing right: “culture, rather than politics,” can be a fruitful area of investigation if “labor, wealth and power” are your lenses of choice. There is, of course, ample research on economic restructuring and gentrification, real estate and global capital, and spatial injustices in the history of the city. But sticking with culture—including popular culture—is also important. Scott’s headline indicated that he was “tracing urban change,” from Welcome Back Kotter to Girls. In his analysis, as waves of demographic changes occur television representations shift.

He complicates this a touch by introducing the global branding of Brooklyn, but it isn’t quite clear how that branding is actually deployed. Through the ubiquity of artisanal shops? Scott’s partial answer is that this “New Brooklyn” found in “restaurants, real estate, and retail” is, in turn, seen—glorified? exaggerated? — on TV shows like Girls and 2 Broke Girls. In these shows, the borough “figures as a playground for the ambitious but not quite disciplined, broke but not really poor, mostly white, college-educated young.”

But while Scott seems somewhat dubious of the images of Brooklyn represented by these shows, he ultimately writes as if he believes that TV or film can perfectly double reality, and, further, be trusted: “Girls” reflects a reality, but also popularizes a small sliver of experience as a global brand, and—here’s the nasty part—even is reality. Things have changed, he writes, as one can see in the development battles over Atlantic Yards: “the old Brooklyn mourned the loss of Ebbets Field, historic home of the Dodgers; the new Brooklyn reacted with ambivalence to the construction of Barclay’s Center, where the Nets now play.”

Scott isn’t interested in how a show like Girls might change, absorb, or reinforce communities and/or realities. And he isn’t so much interested in what it might leave out. For Scott, the relationship between television shows and gentrification is fairly pat. This pits the “Old Brooklyn” against the new, as Scott trots out well-worn examples like the Honeymooners and Saturday Night Fever and The Squid and the Whale. Never mind that he could have easily chosen very different movies and TV shows—The Warriors or The Jeffersons or Willie Dynamite-- but then the relationship would have been considerably less pat; the images and representations might have complicated his understanding of New York at a certain time, his simplistic vision of the Old Brooklyn of working-class aspiration and the New Brooklyn of handlebar moustaches.

When we think of certain films or TV shows as “capturing” their time, we usually mean that they tap into an anxiety, a flavor, an aesthetic. TV shows, in their goofy approximations of urban life — think here the fake skyline of Friends—clearly remind us that cultural producers pick and choose symbols that they use to construct — represent, if you will — a certain reality. To what end? Pleasure, entertainment, authentication, maybe documentation. But these can be contested, too, and Scott’s insistence on ignoring the cultural sphere as its own field in which struggles for power take place (the power conferred by image and by representation) is troubling.

In his tepid response via Twitter to Lee’s grouchy self-defense, Scott described his article as “reportage.” He identifies a correlation between a cheese store on his block and a cheese store in Girls and understands one as reflecting the other, yet longs for artists and writers to “discover” another Brooklyn, one that looks more like it did in Lee’s film Crooklyn, or Jonathan Letham’s novel Fortress of Solitude, when residents lived in “close, sometimes uncomfortable proximity to people in very different circumstances.” But he’s gotten himself into a pretzel here. Discontent with the world outside his window, he’s also vaguely discontent with the world on his TV.

Coincidence? Like any representation, Girls might help us recognize something about ourselves; might deliver a particular kind of pleasure to a particular kind of audience. But there are brutalities and deceptions to be found in any artistic or cultural representation of a city, and Scott’s decision to switch hats from critic to commentator suggested something a little provocative: the potential for actual public debate related to representation and power and wealth.

There’s a long history of artists protesting the way the Times evaluates and represents the outer borough neighborhoods of New York. In 1971, Robert Macbeth of the New Lafayette Theater in Harlem chided Times theater critic Mel Gussow for referring to a production at his theater as “defiantly parochial.” Although Gussow penned a glowing review, Macbeth took exception to the suggestion that the theatre company

should have been something other than what they were…. Gussow, it seems, is saying that Black artists can and will and should only achieve full presence in his view when they are performing in his theatre, for him and his audience, like it was during slavery time…. Then he would be spared the long journey to the “narrow province” of Harlem. Harlem would come to him. And the artists of the province would insure that a transistorized translator would interpret their petty offerings for his “more universal” intelligence.

In 2014, many critics still long for universal intelligence; it’s much easier than thinking about the particular, or what actual reportage on wealth, labor, and power in the Arts & Leisure section might be. All of the cultural elements at play here called for a rough and tumble sociology of culture approach, but in the end, we were left with a battle of wills (and egos). Lee and Scott engaged in a duel of authenticity: can Lee really speak as a victim of gentrification, or has the great leveler of wealth rendered him a gentrifier, in spite of his own self-identifications? Today’s duel of choice rages on at the expense of other questions: the lived experience of neighborhood in relation to cultural access, and the actual reach of cultural products.

Rather than reflect on Girls as a true “copy” of the city, it would behoove Scott to demystify it. Why this curious game of pretending Girls is not the fruit of creative and commercial choices made in order to shape a particular urban experience? Why ignore labor issues and embedded assumptions about wealth and representation, in an article that purports to look at “labor, wealth, and power”? Perhaps the terrifying thing for Scott would be to question where the pleasure in watching Girls comes from-- for him, and for audiences.

Hillary Miller is Lecturer in the Program in Writing and Rhetoric at Stanford University, where she teaches in the Immersion in the Arts: Living in Culture program. Her current book project, "Drop Dead: Crisis and Performance in 1970s New York City," looks at theater and community identity during the 1975 fiscal crisis.

The "new" Brooklyn: Flickr photo by Matthew D. Britt, Barclays Center, Brooklyn, New York.

The Evolving Urban Form: Philadelphia

$
0
0

Philadelphia was America's first large city and served as the nation's capital for all but nine months between the inauguration of George Washington is the first president in 1789 and the capital transferred to Washington, DC in 1800.

Before the early 1900s, the United States Census Bureau had not developed a metropolitan area (labor market area) concept. However, the website peakbagger.com has attempted to define earlier metropolitan areas based on concepts similar to those used today. In the case of Philadelphia, this is important, because it was somewhat unique in having virtually adjacent, highly populated suburbs that make comparisons of municipal populations (the only population data available) misleading.

The Nation's Largest City

According to municipal population data, New York had become the largest municipality in the United States by the time of the first census, in 1790. Philadelphia was ranked second. However, a list of the top 24 urban places in 1790 shows two Philadelphia suburbs, Northern Liberties and the Southwark district. When peakbagger.com includes these suburbs, Philadelphia rises as the largest city (metropolitan area) in the nation in the 1790 and 1800 censuses. The New York metropolitan area is shown as rising to number one in 1810, a position it is held for 200 years and may last for much longer in light of the much slower growth rate recently for Los Angeles.

Soon the Nation's 9th Largest City?

Those were the glory days. In the years since 1800, Philadelphia has been falling in population rank. The Philadelphia metropolitan area was displaced first by Chicago in 1900, according to the metropolitan district estimates of the US Census Bureau. In 1940, Philadelphia was demoted to fourth place by Los Angeles. Philadelphia held fourth position until 2006, when Dallas-Fort Worth raced past it. Then just a few years later (2010), Houston knocked Philadelphia down to 6th place. The downward trend could accelerate rather quickly. At current growth rates (2010 to 2013), Philadelphia would be passed by Washington and Miami by the time of the 2020 census. The Atlanta metropolitan area would also pass Philadelphia if its population growth rate is restored to pre-Great Recession rates. Philadelphia should start the next decade as either the 9th or 10th largest metropolitan area in the nation.

Population Growth in the Philadelphia Metropolitan Area

The Philadelphia metropolitan area is unusual in being divided between four states. The core city of Philadelphia is located in Pennsylvania. Directly across the Delaware River are the suburban counties of New Jersey. Wilmington, formerly the largest metropolitan area in Delaware has been incorporated into the Philadelphia metropolitan area (New Castle County). Maryland's Cecil County is also included in the metropolitan area.

All of Philadelphia's population growth since 1950 has been in the suburbs. In that year, the city of Philadelphia peaked at 2,072,000 residents. This was a healthy increase from the 1,930,000 in the 1940 census. However, this represented a decline from 1,951,000 in 1930 and shadowed massive population losses that would follow after 1950 (Cleveland and St. Louis also lost population between 1930 and 1940).

By 2000, the city’s population had dropped 27 percent to 1,518,000. This could prove its modern low, as the population recovered to 1,526,000 in the 2010 census and was estimated by the Census Bureau at 1,553,000 in 2013.

The suburbs of the metropolitan area as presently defined added nearly 2.6 million residents between 1950 and 2013. However, the metropolitan area only grew by 2.1 million residents because of the more than 500,000 loss in the city of Philadelphia. The inner ring suburbs, counties abutting Philadelphia County in Pennsylvania and New Jersey gained 1.8 million residents, while the outer suburbs gained nearly 800,000 residents (Figure 1).

Domestic Migration

Philadelphia has continued to lose domestic migrants to other areas of the country. Between 2010 and 2013, approximately 50,000 net domestic migrants left the Philadelphia area. Of this, 22,000 left the city of Philadelphia and 28,000 left the suburbs. The rate of domestic migration loss was 0.8 percent in the metropolitan area, 1.4 percent in the city of Philadelphia and 0.6 percent in the suburbs (Figure 2).

Employment

Within the metropolitan area, the commercial primacy of the core city of Philadelphia also has been reduced. Philadelphia has long been known for having one of the largest central business districts in the United States. The most recent census tract data from the CTPP indicates that Philadelphia has the sixth largest business district in the United States, with approximately 240,000 jobs. This represents only 8.7 percent of the metropolitan area employment, a figure slightly above the 8.4 percent average of the 52 major metropolitan areas (those with more than 1 million residents).

The development of Philadelphia's "center city" business district may have been stunted by city regulations that prohibited buildings to exceed the height of City Hall, topped off by a statue of city founder William Penn. At nine floors and approximately 550 feet (165 meters), City Hall was briefly the tallest building in the world in the early 1900s. City Hall remained a dominant feature of the skyline until the late 1980s, when One Liberty Place, with its 61 floors rose to 945 feet (290 meters). There are now 8 buildings taller than City Hall. Construction will soon begin on a new office and hotel tower , which at 1,120 foot tall (340 meters), 59 floor building would be the tallest building in the United States outside New York and Chicago (and taller, by 20 feet than Wilshire Grand now under construction in Los Angeles).

Transportation

I have described the city of Philadelphia as a "transit legacy city," which along with New York, Chicago, San Francisco, Boston, and Washington account for 55 percent of all the transit commuting destinations in the United States. This is nearly 10 times the share of jobs that are located in these six municipalities (not metropolitan areas).

Philadelphia, like the other five other transit legacy cities has an extensive urban rail system. Philadelphia has commuter rail lines extending outward to suburban locations in Pennsylvania, New Jersey and Delaware. There are also two Metro lines (subway lines) and electric trolley lines. This transit system delivers 44 percent of commuters to "center city" jobs. This represents more than 40 percent of the transit commuting in the Philadelphia metropolitan area. Transit's market share to work locations outside downtown is relatively small at 6.0 percent.

The nation's first long intercity tollway (the Pennsylvania Turnpike) passes through the Philadelphia metropolitan area. This route, in connection with the New Jersey Turnpike, the Ohio Turnpike, the Indiana Toll Road and the Chicago Skyway provided freeway equivalent access between the New York, Philadelphia, Pittsburgh, Cleveland and Chicago metropolitan areas in the middle 1950s, before the interstate highway system was authorized.

Philadelphia's stagnant population growth is typical for the Northeast, which continues to lose domestic migrants to the rest of the nation. It seems likely to continue. In the two decades following 2020, Phoenix and Riverside-San Bernardino are projected by the US Conference of Mayors to pass Philadelphia. This would push Philadelphia down to 12th place, compared to the 4th ranking it had at the beginning of the 21st century. Quite a ride down for the City of Brotherly Love, and its surrounding region.

Wendell Cox is principal of Demographia, an international public policy and demographics firm. He is co-author of the "Demographia International Housing Affordability Survey" and author of "Demographia World Urban Areas" and "War on the Dream: How Anti-Sprawl Policy Threatens the Quality of Life." He was appointed to three terms on the Los Angeles County Transportation Commission, where he served with the leading city and county leadership as the only non-elected member. He was appointed to the Amtrak Reform Council to fill the unexpired term of Governor Christine Todd Whitman and has served as a visiting professor at the Conservatoire National des Arts et Metiers, a national university in Paris.

Photo: Philadelphia City Hall by Max Binder

The Hyping of “Big Data”

$
0
0

Worship at the altar of what is labelled big data is rampant in both corporate and large not-for-profit settings. And while there is some general sense that big data arrives at warp-speed and involves huge datasets from very diverse sources and methodologies, there is no consensus and little discussion of what comprises meaningful and valid “big” datasets.

It is part of the American DNA that that bigger means better, so the alchemy of big data can appear enticing. Moreover, big data naturally appeals to many data geeks, high-priced consulting firms, and IT professionals. These are the very people who have a vested interest in proffering big data solutions – even if they only have a shallow understanding of what the data represent. In those circles there is a tendency to think that if the data sets are large enough, sophisticated algorithms can somehow smooth out flaws in the data. Yet the old truism still holds: garbage in garbage out.

Huge numbers, per se, may awe the innumerate and methodologically challenged, but honest social scientists have long recognized that quality and critical understanding are what really counts. For example, a relatively small scientific survey, a tight, well-designed experimental design, or a rigorous, clearly defined accounting process provide validity that a conglomeration of user reviews and click data cannot deliver. Why so?

Let’s first look at what much of big data is based on. For sure, some data are obtained via valid techniques with clearly defined outcomes and caveats. Unfortunately, those methodologies can be expensive, so they are often supplanted by cheaper, less rigorous approaches. One such approach is what is known as a convenience or opt-in survey. Typically conducted online, these surveys appear in the form of a pop-up or as an embedding link.1

These unscientific approaches typically lack basic validity. Rather, the findings reflect an amorphous aggregation of people who happen to be visiting a given web page at a particular time. Google surveys, for one, are very quick, inexpensive and beloved by techno geeks, but, in the end, you get what you pay. A legitimate sample should represent a given population based on sampling frame and response rate, which opt-in surveys cannot provide.

The key here is to sample a representative audience, rather than people who happen to be on-line, or like to air their opinions or have an ax to grind. In addition, the response rates for pop-up surveys are absurdly low, so it’s hard to evaluate how representative their findings may be. As Butch said to Sundance, the client should ask their consultants, “Who ARE those guys?” Opt-in surveys, at best, may crudely identify major trends – providing that the client is willing to foot the bill for a tracking study – and also can also suggest there is a major issue worth exploring more rigorously.

How about user reviews? Note that they are usually based on customer ratings elicited right after purchase. The most relevant issues of usability and product reliability are not even factored into the equation. The purchaser also is typically comparing a brand new product with a much older and often poorly performing model. (My new 42” Sanyo TV may seem great compared to my old six year old 34” Toshiba.) That is why product user reviews tend to be so positively skewed.  Finally, and this no small problem, many reviews are bogus, provided by outside firms for a fee. Vendors claim to scrutinize these reviews, but, like NSA’s protocols, one ultimately needs to take them at their word. User reviews sometimes provide the best data one can find (e.g., Trip Advisor for non-chain hotels or restaurant), but one may be safer viewing them for specific comments rather than for their summary ratings.

Other metrics involve click data on a website, which may be more indicative of placement on a web site than anything else. If a link is prominently and explicitly featured, it will get more page hits. If a page requires complex navigation to reach, it will garner fewer hits, especially if the search tool is flawed. Here’s a real life example from my experience at Consumer Reports. Many non-product ratings (supermarkets, airlines, insurance, etc.) attained exceptionally high readership scores. On the website, ConsumerReports.org, these stories are buried and invisible to many potential readers. Note that when those stories briefly appeared on the home page they were extremely popular. Rather than look at the pattern analytically, the big data decision was to focus on IT-based metrics such as click data, which were seen as both “objective” and “real time” despite their obvious flaws.

Another popular yet overrated methodology is the focus group, a moderated discussion among selected participants on a particular topic. Focus groups are usually comprised of people selected for some basic demographics and a roughly defined unifying theme such as in the market to buy a car or does online research on health care. Note that these are people have both the time and inclination to spend a couple of hours on a topic for a small fee and a meal. Second, unless the moderator is very adept, the prejudices of the moderator or highly opinionated participants often exercise undue influence. Clients often latch onto the opinions of participants with whom they agreed, thereby drawing suspect conclusions.2 One valid use of focus groups is to help clarify issues for later quantitative work. Another valid use of focus groups is when the participants possess true expertise or other qualifications. For example, I conducted a focus group with electric engineers on microchips and another among senior directors and VPs at commercial banks on issues involving online banking.

Number crunching – a la big data – without appropriate history or solid methodology has very limited utility. Human behavior is not akin to physics, and numerical positivism is often fatally flawed. Too much analysis is largely ahistorical. “Real time data” is another data cliché much lauded today as the holy grail of research. Yes, up-to-date data are invaluable, but good data analysis requires thought and perspective. What does one make of the number of tweets or Face Book posts for Justin Bieber in March 2014?

Even scientific survey research needs to acknowledge historical precedents. I recall an ongoing Gallup survey that asked were the biggest concerns Americans were facing.  Most of the time various economic issues were volunteered; however, when issues like drugs, HIV, or crime dominated the news, those issues which seemed paramount at the time quickly faded in the public’s eye. Thus “real time data” without context can be both shallow and misleading.   

Another key point: Watch for bias. One reason that people highly rate expensive new purchases is that they don’t want to admit that they may have made a mistake (cognitive dissonance in social science parlance). Sometimes ideology obscures opinion. Careful question creation will avoid many of the pitfalls. Questions posed in terms of “consumer protection” will tell a different story than questions framed as “government regulation”. It is often assumed that “anyone can write a survey”, but such naiveté will provide bad results.

Different data tell different stories. What are the strength and limitations of each dataset? Blind number crunching obscures reality, and no amount of sophisticated statistical techniques can produce valid conclusions unless the data collection methods are evaluated and found sound. If two different analyses tell different stories, the object is to see why. Are they measuring the same thing?

At Consumer Reports we found sometimes a car model’s rating from lab tests did not jibe with the survey results. Both methods are valid, but the former are predicated on measurement of performance based on lab test while the survey reliability is based on respondents reporting that product broke within a given time frame. Both measures had strength and weaknesses. A product can perform very well, yet have undistinguished reliability, and vice versa. Both sets of data are presented, but not aggregated. Doing so may delight the wonks by providing a “simple” measure, to do so will obscure reality and will do the client/audience a major disservice.

Another example: A number of years ago I was asked to represent Consumer Reports at a health care conference sponsored by Kaiser Family Foundation.  Most of the major health care research firms as well as several major employers attended. One of the goals was to ascertain whether a basic metric evaluating health care would be possible. The general consensus was that goal was illusory because the data were far too complex and multivariate to do so. In the most simplistic terms, you can’t have red and blue and say the answer is purple.  So while big data may contain reams of information, it cannot be boiled down to simplistic conclusions.

So here’s my advice. All datasets, large and small, have strengths and limitations.  Bigger does not necessarily mean better. You will learn more from a well-constructed small set of data than from a less robust but large one. And while sloppy data analysis can obscure the value of even the best data, even the most sophisticated data analysis cannot rescue meaningless data. Statisticians and web wonks are not members of a priesthood. Don’t assume they have all the answers. Like the patient who is told that surgery is necessary, you may want to get a second opinion. After all, it’s your business and you should not hand over key decisions to number-crunchers who might have little understanding of your industry, its dynamics, or your customers.

Mark Kotkin, PhD, retired from Consumer Reports after 27 years. He worked in their survey division, most recently as Director. He was responsible for all published survey-based content and served as a methodologist on several organizational teams. He managed the Annual Questionnaire, the largest US survey outside the Census.  Previously he had conducted market research on major corporations for a major research firm based in NYC. He currently consults for private clients.

Photo by Fernanda B. Viégas


1 Note that scientific surveys can be done online provided there is an appropriate methodology.  Consumer Reports and GfK are two organizations who have done so. 

2 A related approach—in-depth interviews—avoids some of those pitfalls, but not the issue of representativeness.

Florida: How Fine Art Became Local

$
0
0

Fine art resides not only in the cosmopolitan cities. It lived, as we saw in the recent movie “The Monument Men”, in the many villages of Europe. Right now, we are seeing it living on the periphery of Orlando, Florida.

Home to Stetson University, DeLand is forty minutes north of the regional core of downtown Orlando. It is one of those delightful, off-the-beaten-path towns that tourists love to stumble upon and explore; the largely intact, century-old strip along Woodland Boulevard is vibrant, bohemian, and alive. Florida’s archipelago of cities compete for the hip and the cool, and it is easy to dismiss places like DeLand. Cities and towns in this state have, for the most part, yet to grow the kind of institutions that speak of maturity, sophistication, and worldliness. The draw of DeLand is not sidewalk urban hipsters sipping lattes; instead, it speaks of a new age of curiosity, individuality, and appreciation for experience outside of the roaring din of the city. The newly re-named Museum of Art – DeLand signifies a powerful future for this part of Central Florida.

Formerly called the Museum of Florida Art, the museum’s new name – no qualifiers, no excuses – befits a mission that brings world-class art to its patrons. “First and foremost, we serve our community,” said George Bolge, the Museum of Art - DeLand’s Chief Executive Officer. Bolge, retired from the Boca Raton Museum of Art, was asked to head up this museum and expand its scope and its reach. “At the same time, we are participating in the broader conversation about what art is, and where it is going. Our voice is being heard loud enough that people in New York are talking about what we are doing.”

In the first half of 2014, Bolge’s exhibition run includes veteran Florida artist Jill Cannady, whose evolving career has stayed one step ahead of her critics. “This is important for people to see, and she is right here under our noses in DeLand, Florida,” said Bolge. Recent exhibitions like “Forging an Identity: Contemporary Latin American Art” drew patrons to exciting international artists who have helped shape Florida’s cultural and social ideas.

In the official story of urban triumphalism, a museum executive should take his victory lap in Manhattan or Paris. Bolge, however, chose not to follow the herd. He was beckoned to DeLand by the opportunity to take an arts institution from good to great. The museum has its own building, a tan, prismatic form just north of downtown. Its exterior is a windowless enigma which belies a wonderful, light-filled volume within, one suited for showing world-class art. Its multifunction lower level has an atrium space and gallery, and an upper level gallery and classrooms. It's a flexible facility that does its job by putting the art first, staying in the background, and being accessible to all.

Even more interesting is the Museum of Art – DeLand’s downtown satellite, at the corner of Woodland and New York, six blocks south of the main gallery. This space, with a wood-floor and the rough-brick feel of a Chelsea loft gallery, recently exhibited “Small Masterworks” borrowed from the Butler Institute of American Art. Ascending the stairs, one is greeted by a free-flowing series of galleries which take you from a sunlit-filled reception area to a deep, introspective space that cleverly maximizes the art viewing experience. From Benjamin West, an American-born colonial artist, to Warhol, Lichtenstein, Motherwell, and others in the late 20th century, “Small Masterworks” provides sensitive and moving documentation of the evolving American art scene. DeLand, the quintessential American town, seems to be a perfect setting for it.

This is the new story of Florida which is just now being written. While local art lovers are enriched by such an institution, it is drawing more and more attention from the surrounding metropolitan areas. With this museum, DeLand is now exporting culture to the city, in a reversal of the trend, signifying a maturation of the Florida arts scene.

The Butler, in Ohio, is another example of this reversal. Nearly a century old with multiple locations today, The Butler is a solid institution with an international reputation. Something interesting is happening. As we have become used to mobility and flexibility, our world is no longer limited to where we live and work. With the internet, we are becoming increasingly connected. This favors DeLand, and places like it, with a new equity of distance – cutting-edge ideas are now a few clicks away. People in far-flung areas are less isolated.

DeLand has a college vibe — a built-in art appreciation population — and with the rise of retiree enrollment, expect this population to go up. It’s affordable, walkable, and fun, with few of the big-city evils like crime and congestion that can scare away newcomers. No longer a tropical wilderness out of which man once carved a crude existence, Florida may now be settling down and becoming a more civil and aesthetic experience for its citizens. Towns like DeLand offer something that big cities like Orlando and Miami cannot: a high quality, human-scale lifestyle.

“In DeLand,” Bolge stated, ”I’ve noticed that people have a pretty high opinion of their town… there is a spirited investment into making its art museum into a great institution.” Bolge sees this museum is a conduit to channel the story of Florida art into the broader flow national artistic energy. “We’re going to be showing what the Florida art patron likes, too,” he said, “so later this year, you will have a chance to see what a Floridian does with a world-class collection of artists." “We are here for the local community,” says Bolge, “but it doesn’t hurt that we have a profile outside the community as well.”

Richard Reep is an architect with VOA Associates, Inc., and an artist who has been designing award-winning urban mixed-use and hospitality projects, domestically and internationally, for the last thirty years. He is Adjunct Professor for the Environmental and Growth Studies Department at Rollins College, teaching urban design and sustainable development, and is president of the Orlando Foundation for Architecture. He resides in Winter Park, Florida with his family.

Photo by Lisa Habermehl: Downtown satellite location of The Museum of Art - DeLand

Viewing all 3795 articles
Browse latest View live


Latest Images