Quantcast
Channel: Newgeography.com - Economic, demographic, and political commentary about places
Viewing all 3770 articles
Browse latest View live

Work Access in the Non-centered San Francisco Bay Area

0
0

The San Francisco Bay Area (San Jose-San Francisco combined statistical area or CSA) has a superior access to work systems, including its important work at home element. The freeway system provides primary access between all points, importantly supplemented by arterial streets, and accounts for nearly 70 percent of all work trips. There are more types of transit than in other metropolitan regions (metro, street car, commuter rail, light rail, ferry, and cable car) and generally with a higher level of service. The Silicon Valley virtually defines information technology and is behind the huge increase in working at home, much of it telecommuting.

The recently released American Community Survey five-year file provides the opportunity to examine state of employment access in all Bay Area municipalities

Employment Access by Car

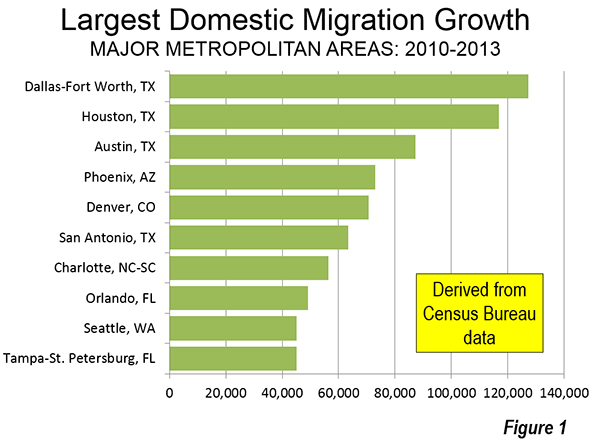
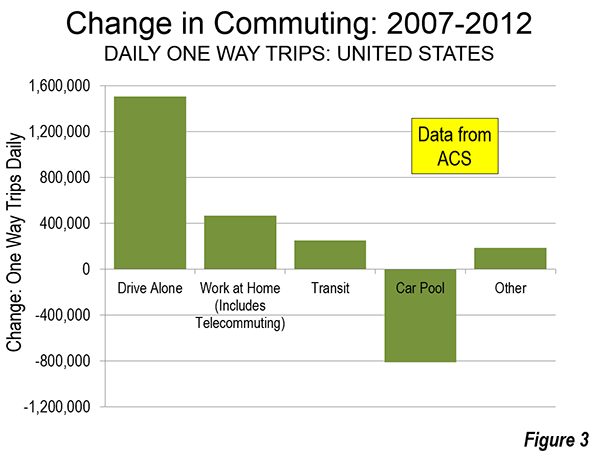
Like every major metropolitan area in the United States, more people use cars or light trucks (for simplicity called "cars" in this article) to get to work than any other mode of transport. In the Bay Area, 68 percent of commuting is by car. Cars provide the overwhelming majority of work access to jobs in 11 of the Bay Area's 12 counties. This ranges from 80 percent in Alameda County (secondary core municipality Oakland is the county seat) to 91 percent in San Joaquin County, which was recently added to the San Jose-San Francisco CSA (Figure 1). In the 12th county, San Francisco, cars provide work access for nearly equal to that of transit, walking and cycling combined (both approximately 46 percent).

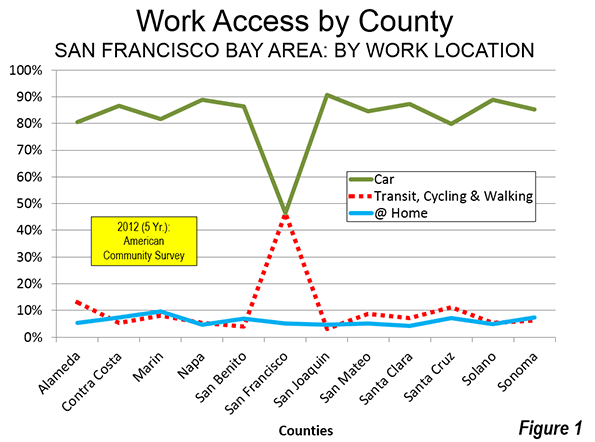
Employment Access from Home

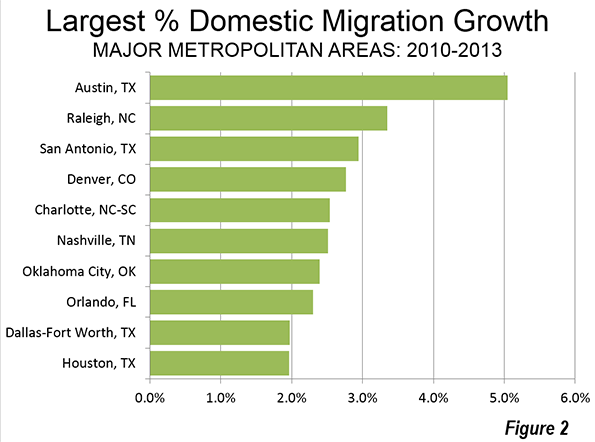
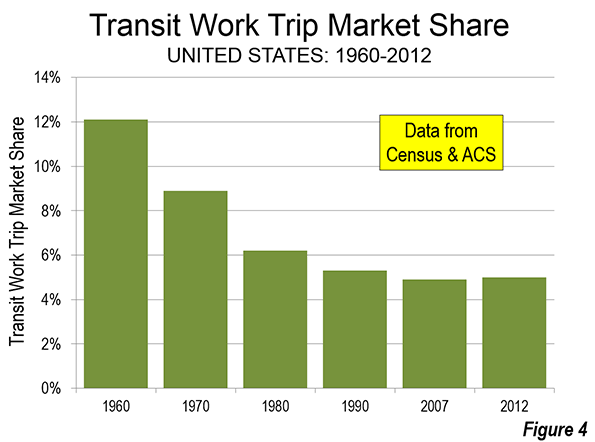
Working at home continues to grow and, to an even greater extent than car travel, is relatively evenly distributed throughout the 12 Bay Area counties. The highest percentage is in Marin County, at 9.6 percent. The combination of a technology friendly regional environment and horrific traffic on the primary commuting routes to most of the Bay Area (US-101 and the Golden Gate Bridge) probably drive this figure higher. Contra Costa County and Santa Cruz County also have a high work at home shares, at 7.3 percent and 7.1 percent respectively. This is than 50 percent above the national rate.

Most surprisingly, however, the lowest work at home share in the Bay Area is in Santa Clara County, the very heart of Silicon Valley. This is slightly less than the national average. Another surprise is counties on the periphery of the Bay Area also have small work at home shares. Sonoma, Napa and San Joaquin counties have work at home shares of under 5.0 percent.

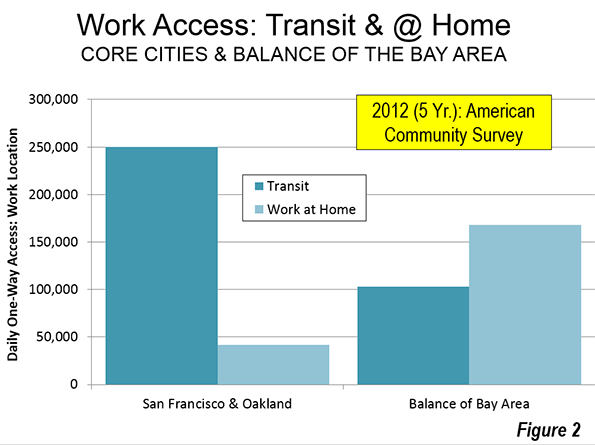
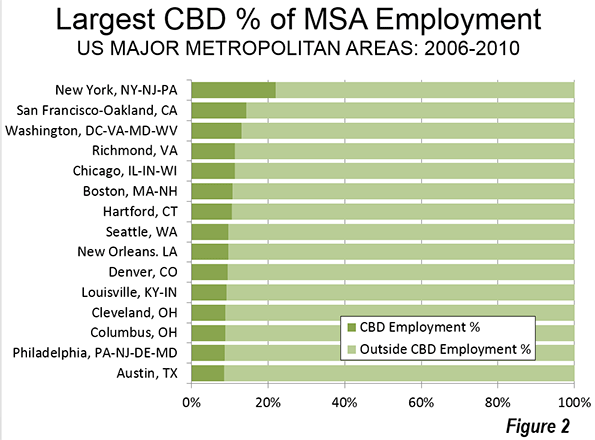
Outside the core cities of San Francisco and Oakland, more than 1.5 times as many employees work at home (including telecommuting) than access work by transit (Figure 2).

Employment Access by Transit

The Bay Area remains monocentric only in aerial photographs and transit market share. San Francisco is served by one of the nation's busiest metro (subway or underground) systems in the nation, Bay Area Rapid Transit (BART), which carries over 400,000 one-way rides daily. BART was the first of the major post-World War II rapid transit systems in the United States and was followed by other fully grade separated Metro systems in Washington and Atlanta and individual lines in Los Angeles.

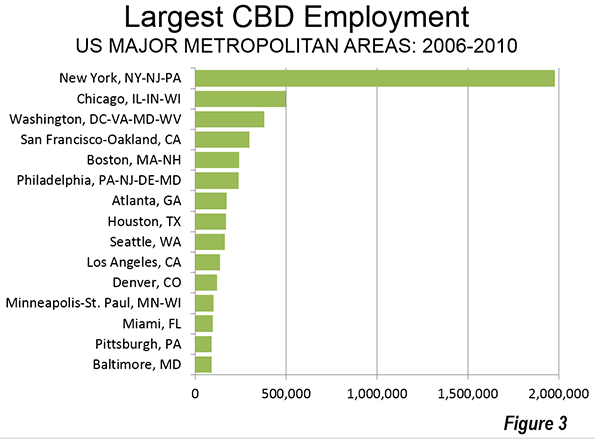
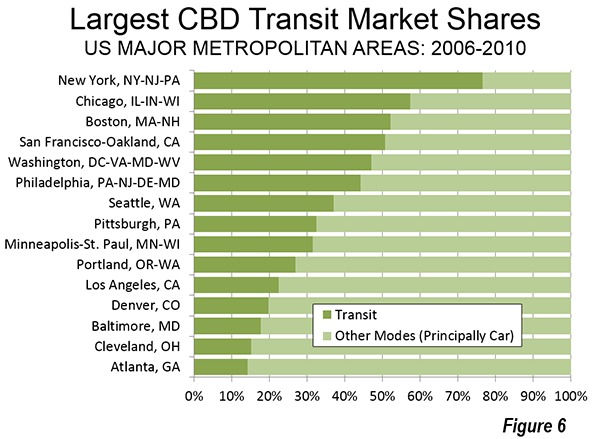
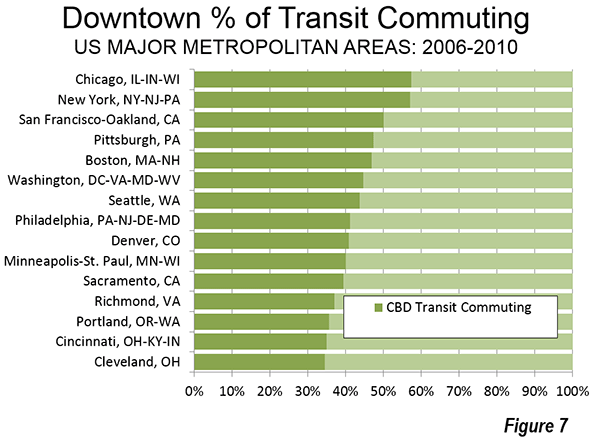
As we indicated in Transit Legacy Cities, most of the transit commuting (55 percent) in the United States is to just six core municipalities, New York, Chicago, Philadelphia, Boston, Washington, and San Francisco. Approximately 60 percent of commuting to those cities is to the downtown areas, which are also the largest in the United States. Yet these legacy cities, with a majority of the nation's transit commuting, account for only six percent of the nation's employment.

Nearly two-thirds of Bay Area transit commuters work in the city of San Francisco and that figure rises to more than 70 percent, including the city of Oakland, with its strong downtown. Yet, these two core cities have only 21 percent of employment in the Bay Area. The downtowns of both core cities are well served by transit, including BART and radial surface transit systems. Buses serve downtown Oakland, while buses, trolley buses (electric buses), street cars and cable cars are focused on downtown San Francisco.

The Non-Centered Metropolis

Even with a regional Metro system, the Bay Area has developed in a strongly dispersed and polycentric form. Polycentricity is represented by edge cities (suburban office centers) such as Walnut Creek (with a BART station), the San Francisco Airport office area (not generally walkable from any rapid transit) and in the Silicon Valley (San Mateo and Santa Clara counties). Even more, however, employment is dispersed well beyond even these nodes.  Authors Robert Lang and Jennifer LeFurg have called this phenomenon "edgeless cities," though their other term, the "non-centered metropolis," says it better.

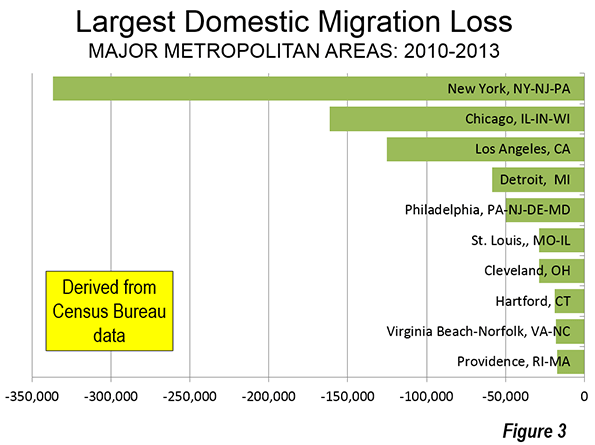
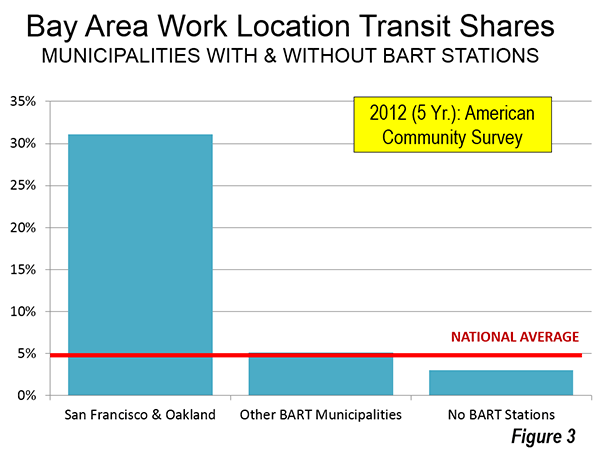
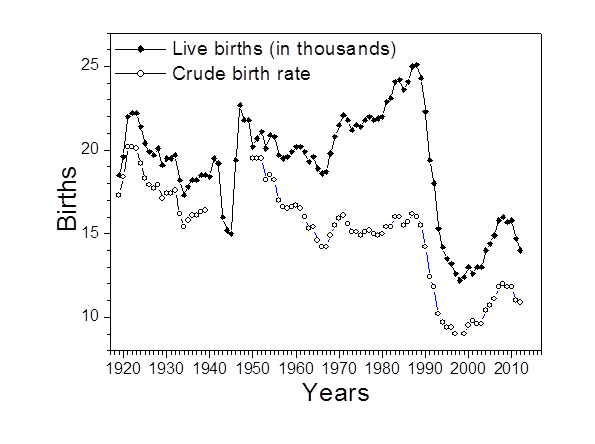
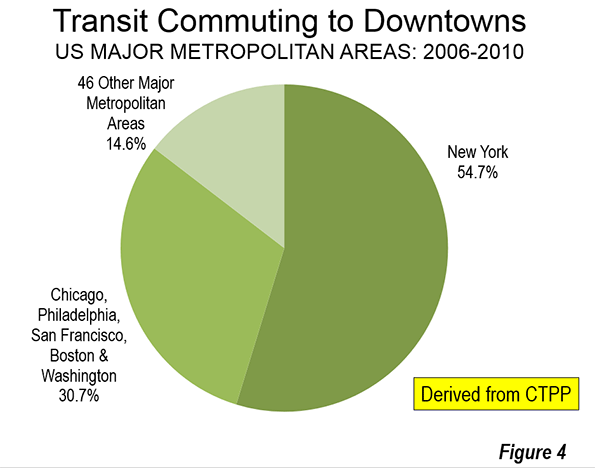
Outside the San Francisco-Oakland core, the commuting pattern in the Bay Area is little different than in the rest of the nation (as is also the case in New York, outside the urban core). Nearly 80 percent of the Bay Area's jobs are outside the cities of San Francisco and Oakland, however only 4.0 percent of commuters use transit to jobs located outside these cores. Among municipalities other than San Francisco and Oakland with BART stations, work access by transit is 5.1 percent, only slightly higher than the national average (which includes all urban and rural areas). Commuting by transit is even lower (3.0 percent) to jobs in outside municipalities with BART stations (Figure 3).

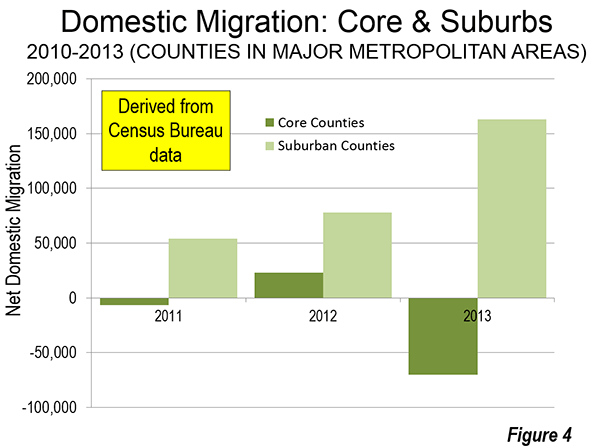
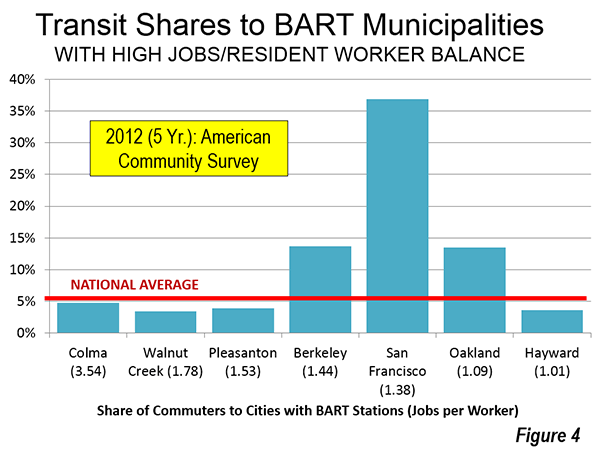
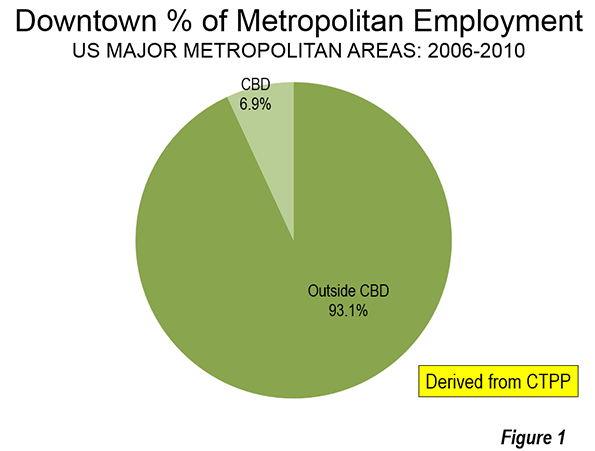
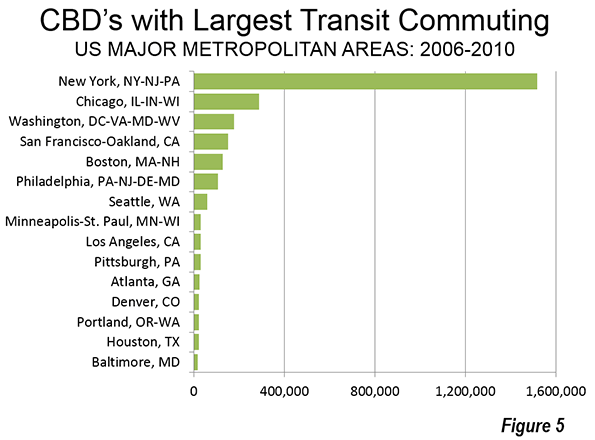
Among the municipalities with BART stations and favorable "jobs-housing balances," only San Francisco, Oakland and Berkeley (home of the University of California) attract more transit commuters than the national average. Walnut Creek illustrates the problem of regional transit commuting to suburban locations. Walnut Creek has a strong suburban office center and a stronger jobs-housing balance than all BART municipalities but much smaller Colma. Yet, only 3.5 percent of commuters who work in Walnut Creek used transit to get to work (Figure 4).

Overall, outside the core cities of San Francisco and Oakland, approximately 20 times as many people commute to jobs by car as by transit.

The Illusion of Monocentricity

With transit's failure to carry large numbers of workers to jobs throughout the Bay Area (not just to the two older core municipalities), planners have switched strategies. Now the focus is on urban villages (transit oriented development), by which people and jobs will be located close together, reducing the need for long automobile commutes. The adopted regional plan, "Plan Bay Area" imagines people living in transit oriented developments and walking, cycling or using transit to get to employment. However, former principal planner of the World Bank Alain Bertaud says that this "urban village model exists only in the mind of urban planners" and worse, that "it contradicts the economic justification of large cities:  the efficiency of large labor markets." (see: Urban Planning 101) That means a lower standard of living and more poverty.

The reality for the Bay Area and for metropolitan areas around the world is that transit is structurally incapable of replacing the automobile for the bulk of the workforce. The fundamental problem is that no transit system can attract drivers to jobs by offering travel times competitive with the automobile (Note). Transit can compete to some downtowns, but downtowns have only a small minority of employment. Outside of those, trip patterns are simply too dispersed for transit to serve as well as cars. Monocentric cities, to duplicate Bertaud's logic, exist "only in the mind of urban planners."

Wendell Cox is a Visiting Professor, Conservatoire National des Arts et Metiers, Paris and the author of “War on the Dream: How Anti-Sprawl Policy Threatens the Quality of Life.

--------------

Note: In 2003, I issued a challenge to identify an existing or proposed transit system design that would achieve automobile competitiveness throughout a metropolitan area of more than 1,000,000 in Western Europe or the United States (see: Smart Growth Challenge: Transportation Choice for All, Not Just a Few[Automobile Competitiveness]). No complete responses were received. This is not surprising. In 2007, Professor Jean-Claude Ziv and I authored a paper for the 11th World Conference on Transport Research (2007 WCTRS) that estimated such a system could cost as much as the total gross domestic product of any such metropolitan area each year).

Photo: Bart A car Oakland Coliseum Station


East of Egan: Success in California is Not Evenly Distributed

0
0

The New York Times ran a Timothy Egan editorial on California on March 6.  The essay entitled Jerry Brown's Revenge was reverential towards our venerable Governor.  It did, however, fall short of declaring Brown a miracle worker, as the Rolling Stone did last August.  These and other articles are part of an adoring press's celebratory spasm occasioned by the facts that California has a budget surplus and has had a run of strong job growth.

Egan at least pauses in his panegyrical prose to mention that all is not perfect in California:

Without doubt, California has serious structural problems, well beyond the byzantine hydraulic system that allows the state to flourish. For all the job growth, the unemployment rate is one of the highest in the nation. It has unsustainable pension obligations, a bloated public-employee sector led by the prison guard union. And it is so expensive to live here that clashes over the class divide are threatening to get nasty.

That's not the worst of it.  Before going there, though, let's consider Brown's most celebrated achievement, a budget surplus. 

California has a budget surplus because of a temporary income tax on its highest earning citizens and because of large capital gains reaped during an amazing year for stocks.  The S&P 500 was up almost 30 percent last year, an event unlikely to be repeated.  California's tax revenues are excessively dependent on a relatively few wealthy tax payers.  This makes revenues extremely volatile.  When these tax payers do well, Sacramento is flush with cash.  When the high end tax payers don't do well, Sacramento has very serious problems.

By increasing California's reliance on a few wealthy tax payers, Brown's tax increase made California's revenues more volatile.  The ongoing bull stock market would have generated higher tax revenues for California without the tax increase.  It generated even more with the tax increase.  When a bear market comes, the state will again face deficits.  This is one reason that Standard and Poors ranks California's credit as second worst in the country, only above Illinois.

So far, to his credit and in stark contrast to what we saw in the dot-com boom under Gray Davis, Jerry Brown has, with the exception of his pet project, the high-speed train, effectively resisted the legislature's knee-jerk impulse to increase long-term spending commitments.  What he has not done is perhaps more important: addressing California's other financial issues, the ones that are contributing to California's dismal credit rating.

California has had several quarters of stronger-than-the-nation job growth, but is still 113,500 jobs below the level in 2007; in contrast Texas is 844,300 jobs above that number.  

Nor can it be sure that growth will continue. Unfortunately, the day after Egan's celebratory essay, California's Economic Development Department announced that the state had lost 31,600 jobs in January.  That's an initial estimate, and it will be changed, but it's hard to tell which direction.  The data released with that estimate appear to be a bit of a mess and are internally inconsistent.  We've asked for some clarification.

Regardless of the most recent data point, California's job performance has been better than expected, and we should all be thankful for that.  However, comparison with the United States average is not the only metric.  Comparison with California's potential is the correct metric, and there California is underperforming in a big way.  Given all of its advantages, California should be leading the nation in job creation and opportunity.

California has been averaging about 27,000 new jobs a month over the most recent 12 months for which we have data.  It should be averaging at least 40,000.  This would be slightly more than Texas' average of 33,900,.  But, it still represents only 3.2 percent job growth, well below Texas' 3.7 percent job growth rate.

The state is sitting over estimated oil reserves that are about four times as large as the Bakken Shield, a major contributor to North Dakota's boom.  Any serious effort to tap that resource would generate huge numbers of jobs.  Many of those jobs would be high wage positions for less educated workers who were hurt the most by the recession.

California has many advantages over North Dakota, or Texas for that matter, besides oil.  These are well known and include location between Pacific Rim producers and the world's largest consumer market, ports, workforce, and climate.  Even without oil, we should be doing better.  Policy though, particularly environmental policy, is restraining the state's job creation.

Egan makes a big deal of migration.  Here is his first paragraph (emphasis is his):

Let’s review. Just a few years ago California was a punching bag for conservative scolds — a failed state, profligate with its spending and promiscuous with its ambition. Ungovernable. And everybody’s leaving.

Later, he returned to the topic:

Third, the great exodus never happened. Since the dawn of the recession, the state has added about 1.5 million people — almost three Wyomings. And yes, 67,702 people moved from California to Texas in 2012. But 43,005 people moved from Texas to California. (Population growth is not necessarily a good thing, especially in this overstuffed state, but that’s another topic).

This is really curious.  A whopping 57 percent more people moved from California to Texas than moved from Texas to California, which was the case for decades.  This is an argument that people aren't leaving California?  California's population is up 1.5 million?  California's population growth is mostly a result of California's fertile young people.  Census data show that California's domestic migration has been negative for over 20 consecutive years.   It may not be The Great Exodus, but it's a reversal of about a 150 year of migratory trend.

Then there is poverty and unemployment.  Poverty, unemployment and lack of opportunity are why California's domestic migration data is negative.  Lack of opportunity may be hard to measure, but we have lots of data on unemployment and poverty.   Some examples:

  • San Bernardino has the second highest poverty rate of any major U.S. metropolitan areas.  Only Detroit is worse.
  • California, with about 12 percent of the U.S. population, has 34 percent of U.S. welfare recipients.
  • Two California counties, the geographically separated Colusa and Imperial, have unemployment rates over 20 percent.
  • Thirty-one of California's 58 counties have unemployment rates in double digits.

The geographic distribution of California’s poverty is one reason many people fail to understand California.  Most of California’s poverty is concentrated in regions where the political class ---or wayfaring editorialists --- seldom venture.  It's mostly inland, not where most of California's elite live or travel.  If you stay on the 101 corridor, or hug scenic Route 1, it’s easy to avoid.  You can find it, but you have to have eyes that are open to it, and it helps if you get off the beaten path. 

Egan wrote his piece in Santa Barbara, where life can be as good as it gets, particularly for the affluent and boomers who bought their homes decades ago.  But, the city of Guadalupe in Santa Barbara County could give him a taste of how the other half lives. Just take a look sometime: it’s about as hardscrabble a town as the Texas town in the movie “The Last Picture Show”.

California's poverty is harder to ignore along the 99, but is even more evident in roads like 33 which winds along the eastern side of the coastal range.  Go there, and you will find it hard to believe that you are still in the United States, much less California.  There you will find grinding, hopeless poverty more reminiscent of the Third World than the center of the economic jobs.

A high speed train won't help these people.  Neither will Silicon Valley tech jobs, even if they don’t shrink in the inevitable social media shakeout.  Neither will Sacramento, apparently.  Until we start doing something for the state's huge and struggling working and middle class, and that means creating opportunity for them, we should refrain from congratulating ourselves and each other for our good work.

Bill Watkins is a professor at California Lutheran University and runs the Center for Economic Research and Forecasting, which can be found at clucerf.org. A slightly different version of this story appeared in CLU Center for Economic Research and Forecasting's September, 2013 California Economic Forecast.

Taking the Main Street Off-ramp

0
0

To some, the $19 billion paid by Facebook for the Silicon Valley start-up What's App represents the ultimate confirmation of the capitalist dream. After all, these riches are going first and foremost to plucky engineers whose goals are simply to make life better for the public. Got a problem with that?

Yes, actually. Sure, people should be rewarded, even lavishly, for their innovations. But $19 billion for 50-something people in a company with no profits and no prospects of having any, at least in the short term? Is this app worth more than Southwest Airlines, or Sony, or scores of other companies with thousands of employees and decades' worth of profits? Put another way, the $19 billion makes Vladimir Putin's now-defunct bailout of Ukraine seem puny. Ukraine, the homeland of What's App's CEO, if you don't remember, is a country of 46 million people.

Yet, this is the form of capitalism that we now have, one tilted so heavily to the few well-connected souls, whether on Wall Street or among the chummy “directors club” keiretsu of Silicon Valley. But the heart and soul of free enterprise – small and medium-size companies – remain in the doldrums. They are producing jobs at rates lower than those before the most-recent recession. According to the Bureau of Labor Statistics, firms with less than 50 employees are adding jobs at rates well below 2007 levels. Drivers of the recovery early in the prior decade, they have become laggards as larger firms have expanded modestly.

Indeed, by 2013, smaller firms, those with less than 100 employees, added far fewer jobs than in the decade before. In previous recoveries, small firms led the way, but in the post-2007 recovery, these grass-roots companies continued to lose ground. In 1977, Small Business Administration figures show, Americans started 563,325 businesses with employees. In 2009, they started barely 400,000.

This is not just a story of clueless mom-and-pops left behind by progress. Business start-ups, long a key source of new jobs – as a portion of all businesses – have declined from 50 percent in the early 1980s to 35 percent in 2010.

Many people who once had decent incomes and may have owned, or hoped to start, a business have slipped to the economic lower rungs. Their decline is not widely mourned in the academic, financial or media worlds. Last year, one Financial Times columnist contended that the middle class, “after a good run” of some two centuries, now faces “relative decline” and even extinction. Not that this trend disturbed the author, who noted that “classes come and classes go” and that, when the middle orders disappear, about the only ones sorry to see them go might be the “middle classes themselves. Boo hoo.”

Like the yeoman farmer, the artisan and the shopkeeper during the 19th century's Gilded Age or in Victorian England, millions of smaller business entrepreneurs are threatened with what I call “proleterianization,” that is, a descent from the relatively secure, property-owning class to the permanently insecure masses, living paycheck to paycheck. This process is driven largely by powerful economic forces, such as technological change and globalization, but has been exacerbated by the actions of the political class.

Much of the blame starts with Federal Reserve policy, which has been totally designed to favor high-risk investments – like What's App – at the expense of the more modest savers along Main Street. The winners in the era of low interest rates and the Fed's bond-buying binge have been venture capital firms, hedge funds and Wall Street investment banks. Capital has not been flowing to consumers, or smaller firms, noted one top former manager. The Fed has lost “any remaining ability to think independently from Wall Street,” asserts Andrew Huszar, who managed the Federal Reserve's $1.25 trillion agency mortgage-backed security purchase program.

Fed policy, through TARP, bailed out the big banks, which generally are loath to loan money to small businesses, but has done little for smaller banks, who generally do make such loans, and which have continued to contract. The rapid decline of community banks, for example, down by half since 1990, has hit small-business people most directly, as those institutions have been a traditional source of small-business loans.

All these problems have been made worse by a tide of new regulations, notably the Affordable Care Act, which, like most top-down systems, most hurts the middle class. When Obamacare took effect in 2013, it was the small-business owners and the self-employed who suffered the brunt of health insurance cancellations and higher premiums. In addition, the ever-growing net of regulations, covering everything from labor to the environment, has placed a far greater burden on smaller firms than their larger counterparts.

2010 SBA report found that federal regulations cost firms with less than 20 employees more than $10,000 a year per employee, while bigger firms paid roughly $7,500 per employee. The biggest hit to small business is environmental regulations, which cost small firms 364 more percent than large ones. Small companies spend an average $4,101 per employee on such regulations, compared with $1,294 at medium-size companies (20 to 499 employees) and $883 at the largest companies. This has come over a period when many of the key costs faced by the business-owning middle class – house prices, health insurance, utilities and college tuition – have all soared.

Given these conditions, it's not surprising that small-firm owners are about the most alienated large constituency in America, according to Gallup. Yet, their once-considerable clout has faded, particularly among Democrats, who have found new allies within Silicon Valley, much of Wall Street and, most of all, a growing, connected clerisy of government workers, academics, high-end professionals and much of the media.

Progressive theorists, such as Ruy Teixeira, have suggested that, in the evolving class structure, the rise of a mass “upper-middle class” consisting largely of professionals, tech workers, academics and high-end government bureaucrats, allows Democrats to win without the support of shopkeepers or even industrial workers.

Such people may turn to the GOP, or elements of the Tea Party, but neither of those groups really addresses their needs. Mainstream Republicans remain fundamentally loyal to those big-business and the money powers that still tolerate them. The Tea Party, sadly, now captive to the well-financed hard Right, has diverted its attention from crony capitalism to tired social issues like gay marriage and immigration. In doing so, the Tea Party has unwittingly alienated many small businesses, notably those owned by minorities, women and gays.

This political calculus is devastating to the interests of smaller firms. Main Street may remain the symbol of the American Dream, and it represents “the human face” of capitalism. It is roughly three times as popular as unions, big business, banks and, of course, the political class itself.

Yet, for all its popularity, Main Street increasingly is in danger of becoming an off-ramp from the American Dream. It may be celebrated in countless political speeches, but, for the most part, gets ignored in the legislative process, being unable to compete against better-organized, and better-funded, business, labor and issue-oriented lobbies.

Main Streeters, to preserve themselves and provide for their children, need to develop, for lack of a better word, a kind of class consciousness. They must understand that, in today's world, what's good for Facebook, Google or General Electric may not necessarily be good for them. Indeed, policies that encourage shoving billions into the hands of the few – whether pinstriped Wall Street sharpies or hoodie-wearing techies – will not leave much on the table for those small-scale entrepreneurs now finding themselves increasingly on the fringe of American capitalism, looking in.

This story originally appeared at The Orange County Register.

Joel Kotkin is executive editor of NewGeography.com and Distinguished Presidential Fellow in Urban Futures at Chapman University, and a member of the editorial board of the Orange County Register. He is author of The City: A Global History and The Next Hundred Million: America in 2050. His most recent study, The Rise of Postfamilialism, has been widely discussed and distributed internationally. He lives in Los Angeles, CA.

Facebook photo by BigStockPhoto.com.

The Reinvention of Sanford, Florida

0
0

Sanford, Florida was in the midst of reinventing itself. Then the calamity of Trayvon Martin’s violent death turned this sleepy Florida town into a poster child for everything that's wrong with the state. Now that the media frenzy has moved on to other troughs, the residents must sweep up the mess. As is often the case, compassion and healing have been operating quietly in the background. Two years after the tragedy, this healing process is being highlighted through a grant by Ashoka University to document the lives and faces of the people of this small, historical town. The Sanford Project was begun by a group of students and artists to capture the unique culture and character of the city, and to turn around perceptions of Sanford.

Led by Olivia Zuk, a recent graduate of nearby Rollins College, The Sanford Project recently exhibited its results at 'Say It Loud', a pop-up gallery space in nearby Orlando. “The media willfully misinterpreted Sanford,” she said, “and we decided that it was critical to overcome the passing controversy and focus on the true nature of this Central Florida town”. During an internship last summer in New York City, total strangers, Europeans as well as Americans, approached her about its lurid reputation. Ms. Zuk’s eyes flashed as she added, “I had had enough. This is my backyard and it needs to be properly defined, and this ugliness put behind us.” When she returned from New York, she received a grant to create a media circus, this time of her own design.

The Sanford Project quickly attracted eight other students. A startling photographic odyssey captured humanistic portraits of the town’s residents, overcoming its caricature status and reminding viewers of Sanford's real people. Seeking to go out of their comfort zone, the collaborators accepted invitations into churches homes, businesses and communities, gathering intimate stories and the personal reflections of Sanford’s residents, including memories of the celery-farming days of the 1940s and before.

While the individual stories and images are remarkable, what is more remarkable is that these students, on their own, chose to reach out to collaborate with Sanford’s residents. And even more remarkable than this gesture is the fact that they were most often greeted with pride and acceptance. “We did not force it,” explained participant Destiny Deming, “but as the project progressed we all felt more at home in a city that several of us aren't even natives of.”

Lauren Cooper, another participant, said, “I didn't get turned down to speak with a single person, or hear any outcry to critique our cause. That silence, ironically, speaks.” The quality of this small town is probably not unique, and belies the illusion that our big cities are our greatest triumph. Olivia Zuk and her students found, instead, a triumph in the humanity that came out of this effort to re-connect with the small town.

The project's images, video, and documentary will be coming home to Sanford later this spring. Building solidarity built between the city and the small, peripheral town must be done to rebuild a state of compassion and shared ownership out of the ashes of our greed-driven, cynical culture. The Sanford Project takes the necessary first step, and although the pathway is long, the first step is the hardest.

Participant Aaron Harriss described The Sanford Project as “suburban white kids from Orlando interested in historic African American communities”. The sardonic, self-deprecating comment belies his generation’s interest in localized connectivity over and above the “official” storyline of a community. Rocked by charges of racism, and guilty by association, Central Floridians were stung by the Trayvon Martin publicity. Few rose to speak, or set the story straight, however, until Olivia Zuk and her Sanford Project team stepped in.

“Being from the millennial generation, most of us working on the project learned about the segregation of white people and black people pretty early on,” reflected Ms. Zuk after interviewing a Sanford resident. Segregation was a story told like a history lesson, at arm’s length, and for many suburban white kids this might be close enough. But Zuk took with her a multiracial team of Lauren Cooper, Destiny Deming, Christopher Garcia, Leila Gray, Aaron Harriss, Angelica Milan, Victor Rollins and Lauren Silvestri.

They sat with African-Americans, heard stories of racism, participated in the African-American culture of Sanford, and supported the local Martin Luther King Day parade. They learned more about the city than many of the region's occupants knew: Sanford’s history, like that of many small towns, conceals some darker episodes, such as the story of Goldsboro, an African-American town that was forcibly incorporated into the larger town of Sanford in 1911. But it has many joyful tales, also, stories of beating the odds. The surrounding celery and orange fields have been eclipsed by the theme parks, but Sanford sustains itself as a town with a desirable quality of life.

Lingering in the twilight of its agricultural boom, Sanford today is off Central Florida's beaten path; it's about a 40 minute ride from downtown Orlando. Its historic downtown and surrounding residential community is beautiful, but its population has struggled to grow.

A reinvention was long overdue. Then, in stepped the media, reinventing Sanford in the wake of young Martin’s tragic death: small southern town, fill in the rest of the blank. This condemnation, inevitable in today’s city-worshipping culture, seems all too pat. Caught off guard, perhaps, Sanford was unable to push back at a media framework in which you are either a darling or a pariah, but never anything in between.

The millennial generation’s nonhierarchical view of society, symbolized by The Sanford Project, is a pathway out of the good-or-evil, red-and-blue polarization that we continually encounter. Increasingly, however, these black-and-white cartoons ring hollow and empty, unable to withstand scrutiny.

Is this cycle unbreakable? The students and artists who have captured Sanford’s character through images and stories have started the hard work to do just that. Millennials, like the generations that preceded them, may someday come to accept this either/or view of the world. For now, however, efforts like the Sanford Project — efforts that are not profit-driven, but rather socially driven — are rebuilding our squandered moral capital.

Richard Reep is an architect with VOA Associates, Inc., and an artist who has been designing award-winning urban mixed-use and hospitality projects, domestically and internationally, for the last thirty years. He is Adjunct Professor for the Environmental and Growth Studies Department at Rollins College, teaching urban design and sustainable development, and is president of the Orlando Foundation for Architecture. He resides in Winter Park, Florida with his family.

Photo by Destiny Deming of children outside of their Sanford home.

City of Villages

0
0

Los Angeles is unique among the big, world-class American cities. Unlike New York, Boston, or Chicago, L.A. lacks a clearly defined core. It is instead a sprawling region made up of numerous poly-ethnic neighborhoods, few exhibiting the style and grace of a Paris arrondissement, Greenwich Village, or southwest London. In the 1920s, the region’s huge dispersion was contemptuously described—in a quotation alternately attributed to Dorothy Parker, Aldous Huxley, or H. L. Mencken—as “72 suburbs in search of a city.” Los Angeles’s lack of urbane charm led William Faulkner to dub it “the plastic asshole of the world.” But to those of us who inhabit this expansive and varied place, the lack of conventional urbanity is exactly what makes Los Angeles so interesting. My adopted hometown is the exemplar of the modern multipolar metropolis: less a conscious city than a series of alternatives created by its climate, its diversity, and a congested but still-functional system of freeways that historian Kevin Starr calls “absolute masterpieces of engineering.”


PHOTOGRAPHS BY TED SOQUI


Transplants from the East Coast make great sport of belittling Los Angeles as an adolescent New York or a second-rate Chicago. Developers and city boosters, eager to counter that image, placed their hopes on big projects such as the region’s ultraexpensive rail system. Yet billions of investment dollars have done almost nothing to increase the L.A. Metro’s ridership, which remains stuck at 6 percent of city population. By contrast, a majority of New Yorkers and about a quarter of Chicagoans use their cities’ public transportation. Critics also (rightly) depict the downtown residential revival as a misguided attempt to create a mini-Manhattan. That’s not in the cards: downtown L.A.’s 50,000 or so residents—about on par with San Fernando Valley neighborhoods such as Sherman Oaks and suburban areas such as San Bernardino County’s Eastvale—are a drop in the bucket for a region of some 18 million people. And despite billions in direct and indirect public subsidies, downtown boasts barely 3 percent of the region’s jobs. In the minds of most Angelenos, the only reason to go downtown is for jury duty or the occasional sporting or cultural event.


626 Night Market, at the Santa Anita track

The “real” L.A., as experienced by most residents, exists at the neighborhood level. Spread across the region, a multiplicity of neighborhoods offers an unusual variety of housing options in a great global city. Gardener Aurelio Rodriguez and his family choose to live in Sylmar, where he keeps a lush half-acre filled with fruit trees, tropical plants, and aging farm equipment, while remaining within the Los Angeles city limits. It’s the kind of place where pedestrians need to keep an eye out for more than just cars. Like Juan, some residents amble through the narrow streets on horseback.


Juan on horseback in Sylmar

Los Angeles’s myriad little villages are enjoying a new surge of interest. City politics are at a low ebb—with voter turnout in 2013 the tiniest ever for a contested citywide election—yet neighborhood groups proliferate, including some 90 neighborhood councils. People may not be passionate about what goes on at City Hall, but they care deeply about where they live.

I live in Valley Village, a tree-lined corner of Los Angeles made up of single-family houses built on lots that range from 5,000 to 20,000 square feet. Enclosed between four major thoroughfares, my part of Valley Village manages to be both diverse and highly cohesive—a city within a city. Crime tends to be limited to petty thefts from cars. Monthly neighborhood-watch meetings draw middle-class families as well as gay and childless couples. Armenians and orthodox Jews live side by side. The local markets have an ethnic flavor. At the Cambridge Farms supermarket on Burbank Boulevard, signs are posted in English and in Hebrew. Oxnard Boulevard has an Armenian feel, with a functioning lavash bakery and restaurants selling kabobs.

“We fell in love with the neighborhood once we got settled in,” says Grettel Cortes, who lives in a modest house several doors down with her husband, Efraim, and her three young children, Gaea, Eva, and Benjamin. “There’s a great family feeling here. If I need something, I ask Patty across the street. It’s a great place for kids to grow up.” Cortes manages the neighborhood’s heavily trafficked Shutterfly site. A recent article about a coyote devouring a local cat was big news for weeks.

The hot topic in Valley Village these days is the rise of the McMansions. New homes are going up on a scale that feels out of sync with the neighborhood’s low-rise character. One of the larger parcels has sprouted a gigantic, two-and-a-half-story monstrosity that neighbors have christened “the hotel.” During construction, the property’s owner chopped down several trees, some of which may have been protected by city ordinances. Only relentless protests from the locals kept him from further destruction.

“We love the neighborhood but hate the mansionization,” notes Tim Coffey, a 30-year resident whose wife, Chary, led the fight to save the trees. “To us, chopping down trees ruins what this place is all about.”

Despite the McMansions, Valley Village has remained mostly unchanged since I moved here over a decade ago. The area’s appeal lies in the quality of its private spaces—backyards, front yards, gardens—and its neighborliness: people actually say hello to strangers on the street. The many trees also provide an ecosystem for a vast array of birds, from hawks to hummingbirds, as well as various mammals, including raccoons, opossums, and, as we now know, the occasional coyote.

As neighbors, we share a fierce determination to protect and preserve our shaded enclave. Yet the people here are not your stereotypical suburbanites. Chary, for example, sells her own line of lingerie. Grettel is a website developer. Many others work in the entertainment industry. Studios such as Disney, CBS Radford (where Seinfeld was produced), NBC, Universal, and Warner Brothers are all a ten- to 15-minute drive away. Many of my neighbors work from home, including a voice-over artist, a scriptwriter, several actors and musicians, and even a magician. It turns out that Hollywood people want many of the same things from a neighborhood that the rest of us do.


Grettel Cortes’s neighbor Patty


Blind Melon guitarist Brad Smith


Native Mississippian Brad Smith, a successful songwriter and performer with the band Blind Melon, sees Valley Village as a refuge from the insanity of the entertainment business. Brad and his wife, Kim, a Michigan native, like the homey and familiar feel. They have lived here since 2000 and are raising a young daughter, Frankie. They have a dog and a trampoline out back. “In L.A., a lot of places seem like you can live there but never leave the car,” he says as he strums a tune in his backyard. “But here, it’s different. You come home from tour, and you come to a neighborhood with dogs, cats, and kids. It makes living in the big city far more palatable, even for someone from a small town.” This is one of L.A.’s enduring charms: the option to live in a quiet neighborhood in the heart of an important city.

Los Angeles is constantly reinventing itself, combining and recombining people and neighborhoods from the ground up. Out of its crazy quilt of ethnic enclaves, new districts arise all the time, often spontaneously, notes Thomas Tseng, a native of the suburban San Gabriel Valley and a student of urban planning. Take the neighborhood now known as “Little Osaka,” which follows along Sawtelle Boulevard in West Los Angeles. Forty years ago, when I lived there, the area was home mostly to working-class Japanese and Mexican families. The few modest restaurants were far from fashionable, mostly offering ethnic home-style cuisine. But over the past few years, Tseng says, many of the old families—as well as investors from Korea, Taiwan, and China—have opened new restaurants, bars, and clubs in the neighborhood. Far from the downtown hotspots and the Hollywood scene, Little Osaka’s streets bustle with young people, a majority of them Asian. Many live in the area or attend nearby UCLA. “There was nothing planned,” says Tseng, who has been getting his hair cut and belly filled in the area for years. “It just happened.”


Little Osaka


Little Osaka


Even more impressive is the 626 Night Market in the parking lot of the Santa Anita Track. Every month, some 160 food vendors descend on the place. You can get everything from preserved fertilized eggs to sea-urchin rice balls (my favorite), lamb skewers, stinky tofu, and grilled squid. Up to 40,000 people gather in this monthly celebration of L.A.’s entrepreneurial grassroots food scene. After all, Los Angeles invented the food truck—the perfect analogy for a city perpetually on the road and spanning hundreds of neighborhoods.

Los Angeles may lack the kind of dynamic urban core that we associate with traditional great cities. But to most of its residents, the city is an urban feast on a gourmet scale. We wouldn’t trade it for the world.

This story originally appeared at The City Journal.

Joel Kotkin is executive editor of NewGeography.com and Distinguished Presidential Fellow in Urban Futures at Chapman University, and a member of the editorial board of the Orange County Register. He is author of The City: A Global History and The Next Hundred Million: America in 2050. His most recent study, The Rise of Postfamilialism, has been widely discussed and distributed internationally. He lives in Los Angeles, CA.

No Fundamental Shift to Transit: Not Even a Shift

0
0

The American Public Transportation Association (APTA) is out with news of higher transit ridership. APTA President and CEO Michael Melaniphy characterizes the new figures as indicating "a fundamental shift going on in the way we move about our communities.” Others even characterized the results as indicating "shifting consumer preferences." The data shows either view to be an exaggeration.

1935 and 2013

This is hardly a reliable time for making judgments about fundamental shifts or shifts in consumer preferences. Economic performance has been more abysmally abnormal only once in the last century –during the Great Depression – than at present.

The last year, 2013, is the sixth year in a row that total employment, as reported by the Bureau of Labor Statistics was below the peak year of 2007 (Figure 1). This run of dismal job creation was exceeded only between the Great Depression years of 1929 and 1936 in the last 100 years (Note 1). From World War II until the Great Recession, the maximum number of years that employment fell below a previous peak was two, following the 9/11 terrorist attacks (2001 to 2003). The Great Recession may have ended, according to the National Bureau of Economic Research, but the Great Malaise continues as the economy is performing well below historic levels. Judgments about fundamental shifts and consumer choice today are not more reliable than they would have been in the Great Depression year of 1935.

Transit's Market Share: Stuck in Neutral

But more importantly, there is no shift to transit.  APTA is right to point out that transit ridership has grown faster than vehicle travel in the United States since 1995. Nonetheless, transit's share of urban travel has barely budged, because its 1995 share of travel was so small. This is indicated by Figure 2, which compares the overall market share of transit to that of cars and light trucks from 1995 to 2013. Indeed, the top of Figure 2 (the 100 percent line) is virtually indistinguishable from the personal vehicle share over the entire period. The bottom of the chart (the zero percent line) is virtually indistinguishable from the transit share. This is not the stuff of fundamental shift.

Commuting: The Story is Not Transit

A similar pattern of little or no change is indicated by the commuting (work access) data from the Census Bureau's American Community Survey.

Over the past five years, as with virtually all the years since such data has been collected, the overwhelming majority of new commuters have driven alone (Figure 3). Indeed, transit has not taken a single net automobile off the road since 1960, and not in the last five years. Between 2007 and 2012, 93 percent of the additional commuters drove alone (Note 2). The drive alone market, which might have been thought to be saturated, actually rose from 76.1 percent to a 76.3 percent market between 2007 and 2012.

The biggest change has been the continuing loss in carpool use, which dropped from 10.4 percent to 9.7 percent from 2007 to 2012. It is estimated that nearly 450,000 passengers left carpools (excluding drivers), approximately 1.8 passengers for each additional commuter using transit (250,000).

The largest gain from 2007 to 2012 was in working at home, including telecommuting. Working at home increased from 4.1 percent to 4.4 percent. In actual numbers, working at home added 1.9 times the increase in transit commuting. Its change in market share was greater than that of transit in 42 of the 52 major metropolitan areas. Surprisingly, this includes New York, with its incomparable transit system (by US standards).

Transit's share of commuting inched up only 0.1 percentage points between 2007 and 2012. This is so small that if this rate of annual increase were sustained for 50 years, transit's commute market share would  edge up to only 6 percent (Figure 4), approximately transit's 1980 market share (doubling to 10 percent would require 130 years). The latest data indicates both gains and losses for transit, with market shares up in 28 major metropolitan areas and down in 24.

Transit Losses

In Atlanta, with the nation's second largest Metro (subway) system built since 1975, a declining overall employment base was accompanied by a loss of 13,000 transit commuters, at the same time that there was an increase in working at home of 19,000.

In Portland, considered by many around the world to be an urban planning Utopia, the data is hardly favorable. Since 1980, the last year with data before the first of five light rail lines and one commuter rail line opened, transit's market share has dropped from 8.4 percent to 6.0 percent. While spending billions of dollars on rail, working at home – which involves little or no public expenditure – increased by triple the number of people drawn to transit. And things have not changed materially, even during the claimed "fundamental shift." In the last five years, the working at home increase is more than double that of transit.

In Los Angeles, ridership at the largest transit agency continues to languish below its 1985 peak, despite having opened 9 light rail, Metro, and rapid busway lines and adding more than 1.5 million residents. Even this decline may be under-stated because of how transit counts passengers. Each time someone steps on a transit vehicle, they are counted (as a boarding). A person who transfers between two or three buses to make a trip counts as two or three boardings, which is what the APTA data reports.

When rail is added to a transit system, bus services are reconfigured to serve the rail system. This can mean many more boardings from transfers without more passenger trips. This potential inflation of ridership is likely to have occurred not only in Los Angeles, but in all metropolitan areas that added rail systems.

Transit Gains

At the same time, gains are being made in some metropolitan areas. Ridership has risen more strongly in transit's six "legacy cities," the municipalities (not metropolitan areas) of New York, Chicago, Philadelphia, San Francisco, Boston, and Washington. Between 2007 and 2012, 68 percent of the additional transit commuting occurred to employment locations in these six municipalities. This is higher than the 55 percent of national transit commuting that these areas represented in 2012. The much larger share being attracted by these areas in the last 5 years is an indication that transit ridership, already highly concentrated in just a few places, is becoming even more concentrated.  Further, 50 percent to 75 percent of commuters to the corresponding six downtowns reach work by transit.

Rational Consumer Behavior

Even when the nation finally emerges from the Great Malaise, only vain hope will be able to conceive of a large scale consumer preference driven shift toward transit. The rational consumer will not choose transit that is slower or less convenient than the car. Where transit access is impractical or impossible, people will use cars. This is the case for most trips in all US metropolitan area, as the Brookings Institution research cited below indicates

The Brookings Institution research indicated that the average employee in the nation's major metropolitan areas are able to access fewer than 10 percent of jobs in 45 minutes. This is not only a small number of jobs, but it is a travel time that is approximately twice that of the average employee in the United States (most of whom travel by car).

More funding for transit cannot solve this problem. The kind of automobile competitive transit system needed to provide rational consumer choice between cars and transit would require annual expenditures rivaling the total personal income in the metropolitan area, as Jean-Claude Ziv and I showed in our 2007 11th World Conference on Transport Research paper (2007). It is no wonder that not a single comprehensive automobile competitive transit system exists or has been seriously proposed in any major US or Western European metropolitan area (Note 3).  Transit is about the largest downtowns and the largest urban cores.

Unbalanced Coverage

All of this appears to have escaped many media outlets, which largely parroted the APTA press release. For example, The New York Times, CBS News, the Washington Post, and the Chicago Tribune were as parish newsletters commenting on a homily by the priest, for their failure to report both sides. A notable exception was USA Today, whose reporter consulted outsider Alan Pisarski (who has written for newgeography.com). Pisarski placed the APTA figures in historical context and expressed reservations about restoration of the transit commuting share numbers of 1980 or before. 

Wendell Cox is principal of Demographia, an international public policy and demographics firm. He is co-author of the "Demographia International Housing Affordability Survey" and author of "Demographia World Urban Areas" and "War on the Dream: How Anti-Sprawl Policy Threatens the Quality of Life." He was appointed to three terms on the Los Angeles County Transportation Commission, where he served with the leading city and county leadership as the only non-elected member. He was appointed to the Amtrak Reform Council to fill the unexpired term of Governor Christine Todd Whitman and has served as a visiting professor at the Conservatoire National des Arts et Metiers, a national university in Paris.

Photograph: DART light rail train in downtown Dallas (by author)

---------------------

Note 1: Current Employment Statistics Survey data, 1939 to 2013. 1913 to 1938 estimated from data in Historical Statistics of the United States: Bicentennial Edition.

Note 2: The source for the commuting data is the American Community Survey of the Census Bureau, which indicates an employment level in 2012 that is higher than in 2007. The Current Employment Statistics Survey of the Bureau of Labor Statistics indicates a decline.

Note 3: I would be pleased to be corrected on this. In 2004, we issued a challenge on this subject, and while there were some responses, none met the required criteria (see http://demographia.com/db-challenge-choice.htm). The criteria are repeated below:

To identify an actual system or propose a system that provides the following in an urban area of more than 1,000,000 population:

· Transit choice (automobile competitive public transport service) for at least 90 percent of trips and passenger kilometers in the particular urban area.

· Automobile competitiveness is defined as door to door trip times no more than 1.5 times automobile travel time.

The description of any system not already in operation should also include an estimate of its cost, capital and annual operating.

The Great Skills Gap Myth

0
0

One of the great memes out there in trying to diagnose persistently high unemployment and anemic job growth during what is still, I argue, the Great Recession is the so-called “skills gap”. The idea here is that the fact that there are millions of unfilled job openings at the same time millions of people can’t find work can be chalked up to a lack of a skills match between unemployed workers an open positions. To pick one random example out of many, here’s the way US News and World Report put it last year:

Some 82 percent of manufacturers say they can’t find workers with the right skills. Even with so many people looking for jobs, we’re struggling to attract the next generation of workers. The message about the opportunities in manufacturing doesn’t seem to be reaching parents and counselors who help guide young people’s career ambitions.

We face two major problems – a skills gap and a perception gap. Today’s modern, technology-driven manufacturing is not your grandparents’ manufacturing, yet for many, talk of the sector evokes images from the Industrial Revolution.

What’s interesting about this is that the “skills gap” continues to have tremendous resonance in public policy discussions I come across although it’s very easy to find many mainstream press articles that challenge it. So I want to take my shot at the problem.

Is there a skill gap? In select cases I’m sure there’s a mismatch in skill, but for the most part I don’t think so. I believe the purported inability of firms to find qualified workers is due largely to three factors: employer behaviors, limited geographic scope, and unemployability.

Employer Behaviors

Let’s be honest, it’s in the best interest of employers to claim there’s a skills gap. The existence of such a gap can be used as leverage to obtain public policy considerations or subsidies. So there’s a self-serving element.

But beyond that, several behaviors of present day employers contribute to their inability to hire.

1. Insufficient pay. If you can’t find qualified workers, that’s a powerful market signal that your salary on offer is too low. Higher wages will not only find you workers, they also send a signal that attracts newcomers into the industry. Richard Longworth covered this in 2012. He explains that companies have refused to adjust their wages due to competitive pressures:

In other words, Davidson said, employers want high-tech skills but are only willing to pay low-tech wages. No wonder no one wants to work for them….So why doesn’t GenMet pay more? In other words, why doesn’t it respond to the law of supply and demand by offering starting wages above the burger-flipping level? Because GenMet is competing in the global economy. It can pay more than Chinese-level wages, but not that much more.

In other words, this company in question doesn’t have a skill gap problem, they have a business model problem. They aren’t profitable if they have to pay market prices for their production inputs (in this case labor). It’s no surprise firms in this position would be seeking help with their “skill gap” problem – it’s a backdoor bailout request.

2. Extremely picky hiring practices enforced by computer screening. If you’ve looked at any job postings lately, you’ll note the laundry list of skills and experience required. The New York Times summed it up as “With Positions to Fill, Employers Wait for Perfection.” Also, companies have chopped HR to the bone in many cases, and heavily rely on computer screening of applicants or offshore resume review. The result of this automated process combined with excessive requirements is that many candidates who actually could do that job can’t even get an interview. What’s more, in some cases the entire idea is not to find a qualified worker to help legally justify bringing in someone from offshore who can be paid less.

3. Unwillingess to invest in training. In line with the above, companies no loner want to spend time and money training people like they used to. I strongly suspect most of those over 50 machinists and such we keep hearing about learned on the job. Why can’t companies simply train people in the skills they need? When I started work at Andersen Consulting in 1992, we weren’t expected to have any specific skill. Instead, they were looking for general aptitude and spent big to train us in what we needed to know. In a sense, outside of some professional services fields, today’s companies, despite their endless talk about talent, don’t actually recruit talent at all. They are recruiting people with specific skills and experience. That’s a very different mindset.

4. Aesthetic hiring. This one I think is specific to select industries, but in some fields if you don’t have the right “look”, you’re going to find it difficult. For example, the NYT Magazine just today has a major piece called “Silicon Valley’s Youth Problem” talking about this very issue. Hip, cool startups see their working environment and culture as critical to success. And that’s true, but those cultures aren’t very inclusive, which is why many Silicon Valley firms are continuously under fire for various forms of discrimination. When they’re trying to be the hot new thing, the last thing an app startup wants is some 55 year old dude with a pocket protector cramping their style, no matter how much of a tech guru he might be.

Limited Geographic Scope

You frequently see the skills gap phrased in terms of specific geographies. For example, a state. Rhode Island has X number of unemployed people and Y number of unfilled jobs. So what do we do to match them up?

This type of thinking is too limited. I attended an hour brainstorming session on the Rhode Island skills gap a while back and not once did anyone suggest anything that crossed the state boundary. One person mentioned these technical high schools in Boston that produce grads with exactly the skills the market is needing. His idea was that Rhode Island needed to create these types of institutions. Not a bad idea, but I was struck that nobody thought about sending these Rhode Island employers who can’t find workers on the one hour drive to Boston to go hire some of those grads directly out of Boston’s high schools. Problem solved. And maybe while bringing some young, fresh blood into the state to boot.

Similarly, no one ever suggested that an unemployed person in Rhode Island might seek work out of state. Realistically, America has often solved unemployment problems through migration. People need to be willing to move to where the job opportunities are. In fact, if you look at the highly educated people who might say telling people to move in order to find work is evil awful, they are actually the most mobile people there are. Clearly the highly skilled see the value in pursuing opportunity through migration. We need to extend the same opportunity to those who are currently stuck in place.

Unemployability

A third problem is that a significant number of adults in this country are simply unemployable. If you’re a high school dropout, a drug user, etc. you are going to find it tough slogging to find work anywhere, regardless of skills required.

Watching the Chicagoland documentary and seeing what kids in these inner city neighborhoods face, a lack of machine tool or coding skills is far from the problem. Similar problems are now hitting rural and working class white communities where the economic tide has receded. Heroin, meth, etc. were things that just didn’t exist in my rural hometown growing up – but they sure do now.

These aren’t skill problems, they are human problems. And the answer isn’t simply job training. These problems are much, most more complex and they are incredibly difficult to solve. They need to be tackled by very different means than a job skills problem.

If you want more info that documents that there is no skills gap, google around and find plenty of economists crunching the numbers to show that’s the case. But I hope this gives you a sense of some of the trends that explain why there can be persistent unemployment with many job openings without recourse to a skills gap to explain it.

Aaron M. Renn is an independent writer on urban affairs and the founder of Telestrian, a data analysis and mapping tool. He writes at The Urbanophile, where this piece originally appeared.

Auto manufacturing photo by BigStockPhoto.com.

Where Inequality Is Worst In The United States

0
0

Perhaps no issue looms over American politics more than worsening  inequality and the stunting of the road to upward mobility. However, inequality varies widely across America.

Scholars of the geography of American inequality have different theses but on certain issues there seems to be broad agreement. An extensive examination by University of Washington geographer Richard Morrill found that the worst economic inequality is largely in the country’s biggest cities, as well as in isolated rural stretches in places like Appalachia, the Rio Grande Valley and parts of the desert Southwest.

Morrill’s findings puncture the mythology espoused by some urban boosters that packing people together makes for a more productive and “creative” economy, as well as a better environment for upward mobility. A much-discussed report on social mobility in 2013 by Harvard researchers was cited by the New York Times, among others, as evidence of the superiority of the densest metropolitan areas, but it actually found the highest rates of upward mobility in more sprawling, transit-oriented metropolitan areas like Salt Lake City, small cities of the Great Plains such as Bismarck, N.D.; Yankton, S.D.; Pecos, Texas; and even Bakersfield, Calif., a place Columbia University urban planning professor David King  wryly labeled “a poster child for sprawl.”

Demographer Wendell Cox pointed out that the Harvard research found that commuting zones (similar to metropolitan areas) with less than 100,000 population average have the highest average upward income mobility.

The Luxury City

Most studies agree that large urban centers, which were once meccas of upward mobility, consistently have the highest level of inequality. The modern “back to the city” movement is increasingly less about creating opportunity rather than what former New York Mayor Michael Bloomberg called “a luxury product” focused on tapping the trickle down from the very wealthy. Increasingly our most “successful cities” have become as journalist Simon Kuper puts it, “the vast gated communities where the one percent reproduces itself.”

The most profound level of inequality and bifurcated class structure can be found in the densest and most influential urban environment in North America — Manhattan. In 1980 Manhattan ranked 17th among the nation’s counties in income inequality; it now ranks the worst among the country’s largest counties, something that some urbanists such as Ed Glaeser suggests Gothamites should actually celebrate.

Maybe not. The most commonly used measure of inequality is the Gini index, which ranges between 0, which would be complete equality (everyone in a community has the same income), and 1, which is complete inequality (one person has all the income, all others none).  Manhattan’s Gini index stood at 0.596 in 2012, higher than that of South Africa before the Apartheid-ending 1994 election. (The U.S. average is 0.471.) If Manhattan were a country, it would rank sixth highest in income inequality in the world out of more than 130 for which the World Bank reports data. In 2009 New York’s wealthiest one percent earned a third of the entire municipality’s personal income — almost twice the proportion for the rest of the country.

The same patterns can be seen, albeit to a lesser extent, in other major cities. A 2006 analysis by the Brookings Institution showed the percentage of middle income families declined precipitously in the 100 largest metro areas from 1970 to 2000.

The role of costs is critical here. A 2014 Brookings study showed that the big cities with the most pronounced levels of inequality also have the highest costs: San Francisco, Miami, Boston, Washington, D.C., New York, Oakland, Chicago and Los Angeles. The one notable exception to this correlation is Atlanta. The lowest degree of inequality was found generally in smaller, less expensive cities like Ft. Worth, Texas; Oklahoma City; Raleigh, N.C.; and Mesa, Ariz. Income inequality has risen most rapidly in the bastion of luxury progressivism, San Francisco, where the wages of the 20th percentile of all households declined by $4,300 a year to $21,300 from 2007-12. Indeed when average urban incomes are adjusted for the higher rent and costs, the middle classes in metropolitan areas such as New York, Los Angeles, Portland, Miami and San Francisco have among the lowest real earnings of any metropolitan area.

Rural Poverty

But cities are not the only places suffering extreme inequality. Some of the nation’s worst poverty and inequality, notes Morrill, exist in rural areas. This is particularly true in places like Texas’ Rio Grande Valley, Appalachia and large parts of the Southwest.

Perhaps no place is inequality more evident than in the rural reaches of California, the nation’s richest agricultural state. The Golden State is now home to 111 billionaires, by far the most of any state; California billionaires personally hold assets worth $485 billion, more than the entire GDP of all but 24 countries in the world. Yet the state also suffers the highest poverty rate in the country (adjusted for housing costs), above 23%, and a leviathan welfare state. As of 2012, with roughly 12% of the population, California accounted for roughly one-third of the nation’s welfare recipients.

With the farm economy increasingly mechanized and industrial growth stifled largely by regulation, many rural Californians particularly Latinos, are downwardly mobile, and doing worse than their parents; native-born Latinos actually have shorter lifespans than their parents, according to a2011 report. Although unemployment remains high in many of the state’s largest urban counties, the highest unemployment is concentrated in the rural counties of the interior. Fresno was found in one study to have the least well-off Congressional district.

The vast expanse of economic decline in the midst of unprecedented, but very narrow urban luxury has been characterized as “liberal apartheid. ” The well-heeled, largely white and Asian coastal denizens live in an economically inaccessible bubble insulated from the largely poor, working-class, heavily Latino communities in the eastern interior of the state.

Another example of this dichotomy — perhaps best described as the dilemma of being a “red state” economy in a blue state — can be seen in upstate New York, where by virtually all the measurements of upward mobility — job growth, median income, income growth — the region ranked below long-impoverished southern Appalachia as of the mid-2000s. The prospect of developing the area’s considerable natural gas resources was welcomed by many impoverished small landowners, but it has been stymied by a coalition of environmentalists in local university towns and plutocrats and celebrities who have retired to the area or have second homes there, including many New York City-based “progressives.”

Where Inequality Is Least Pronounced

According to the progressive urbanist gospel, suburbs are doomed to be populated by poor families crowding into dilapidated, bargain-priced former McMansions in the new “suburban wastelands.” Suburbs, not inner cities, suggests such urban boosters as Brookings Chris Leinberger, will be the new epicenter of inequality, even though the percentage of poor people, as shown above, remained far higher in the urban core.

Yet , according to geographer Morrill, in comparison with urban cores, suburban areas remain heavily middle class, with a high proportion of homeowners, something rare inside the ranks of core cities.The average poverty rate in the historical core municipalities in the 52 largest U.S. metro areas was 24.1% in 2012, more than double the 11.7% rate in suburban areas. Between 2000 and 2010, more than 80% of the new population.

in America’s urban core communities lived below the poverty line compared with a third of the new population in suburban areas, although the majority of poor people lived there, in large part because they are also the home to the vast majority of metropolitan area residents.

An analysis by demographer Wendell Cox of American Community Survey Data for 2012 indicates that suburban areas suffer considerably less household income inequality than the core cities. Among the 51 metropolitan areas with populations over 1 million, suburban areas were less unequal (measured by the Gini coefficient) than the core cities in 46 cases.

The Racial Dynamic

There is also a very clear correlation between high numbers of certain groups — notably African Americans but also Hispanics — and extreme inequality. Morrill’s analysis shows a huge confluence between states with the largest income gaps, largely in the South and Southwest, with the highest concentrations of these historically disadvantaged ethnic groups.

In contrast, Morrill suggests, areas that are heavily homogeneous, notably the “Nordic belt” that cuts across the northern Great Lakes all the way to the Seattle area, have the least degree of poverty and inequality. Morrill suggests that those areas dominated by certain ethnic backgrounds — German, Scandinavian, Asian — may enjoy far more upward mobility and less poverty than others.

Some, such as UC Davis’ Gregory Clark even suggest that parentage determines success more than anyone suspects — what the Economist has labeled “genetic determinism.” None of this is particularly pleasant but we need to understand the geography of inequality if we want to understand the root causes of why so many Americans remain stuck at the lower ends of the economic order.

This story originally appeared at Forbes.com.

Joel Kotkin is executive editor of NewGeography.com and Distinguished Presidential Fellow in Urban Futures at Chapman University, and a member of the editorial board of the Orange County Register. He is author of The City: A Global History and The Next Hundred Million: America in 2050. His most recent study, The Rise of Postfamilialism, has been widely discussed and distributed internationally. He lives in Los Angeles, CA.


Era of the Migrant Moguls

0
0

Southern California, once the center of one of the world's most vibrant business communities, has seen its economic leadership become largely rudderless. Business interests have been losing power for decades, as organized labor, ethnic politicians, green activists, intrusive planners, crony developers and local NIMBYs have slowly supplanted the leaders of major corporations and industries, whose postures have become, at best, defensive.

Increasingly, a search for inspiration about the region's future must focus, first and foremost, on immigrants. As major companies disappear, merge or shift more of their operations elsewhere, the foreign-born represent a significant asset for our grass-roots economy. With many of the region's legacy industries – from oil and gas to aerospace and entertainment – stagnating or declining, the area desperately needs new blood to avoid ending up like the older cities of the slow-growth Northeast or Midwest, albeit with much better weather.

Amid a graying and, increasingly, marginal generation of regional business leaders, there have emerged new foreign-born dynamic figures. Some great examples: South African native and Tesla founder Elon Musk, who lives in Los Angeles and runs SpaceX, headquartered in Hawthorne and with more than 2,000 employees, and John Tu and David Sun, owners of Fountain Valley's Kingston Technology, a leading independent memory-chip manufacturer founded in 1987 and now employing 4,000 people worldwide.

Our new moguls increasingly are minted abroad. Pharmaceutical entrepreneur Patrick Soon-Shiong, the son of Chinese immigrants from South Africa, is now widely considered the richest man in Los Angeles, according to the Los Angeles Business Journal. But he's not alone; five of the 13 richest people in the City of Angels are immigrants; in 1997 there was one, Australia's Rupert Murdoch.

Why are these immigrants so bright when much of our business leadership is dark grey? Part of it has to do with the nature of people who risk everything to migrate to another country. Overall they account for one out of every five U.S. business owners. They are three times as likely to start a new business than non-immigrants; in 2010 they accounted for almost one-in-three new firms, twice their share in 1995. Roughly 40 percent of the engineering-based firms started in Silicon Valley, notes the Kauffman Foundation, had at least one immigrant founder.

Whether in high-tech, pharmaceuticals or running the local coffee shop, immigrants tend both to innovate and take risks. That's because, as Kingston's John Tu explained to me, they don't have a choice. “The key thing about being an immigrant makes you flexible,” he said. “IBM, Apple and Compaq were inflexible. They told the memory customers to take it or leave it. We thought about the customer and the relationship with the employees. I guess we didn't know any better.”

Rise of the ethnoburb

Most of the growth being generated by Southern California's immigrants is taking place in suburban communities – what geographer Wei Li describes as ethnoburbs. Despite the hopes that more Southlanders can be lured into high-density, high-rise rental housing, immigrants, particularly Asians, here and elsewhere, continue to move further from the city core to areas where they can live with a degree of privacy and quiet virtually impossible in their homelands.

This can be seen in the migration numbers. As foreign-born numbers have dropped in expensive and crowded Los Angeles and Orange County, the big growth has taken place in other areas, notably in fast-growing Texas cities such as Dallas and Houston, as well as numerous low-cost, pro-business states in the Southeast. The one Southland area that has continued to see a boom in foreign-born residents – the Inland Empire – has the lowest population density and house prices in the region.

According to demographer Wendell Cox, the Inland Empire's immigrant population has swelled by more than 50 percent, or more than 300,000 people, since 2000, roughly three times the increase in actual numbers seen in Los Angeles and Orange counties. Much of this growth is taking place not in the older cities such as Riverside and San Bernardino, as might be expected, but in generally more affluent, newer suburbs such as Rancho Cucamonga, whose foreign-born population soared a remarkable 61.6 percent over the past decade. Even Moreno Valley, on the edge of the urbanization, has more foreign-born residents than does San Bernardino.

Even within the coastal counties, much of the growth in the Asian population, now the largest source of immigrants to the U.S., has been outside the densest, more-urbanized parts of the region. As the immigrant share of the population has declined in traditional immigrant strongholds such as the city of Los Angeles (down 5 percent) and Santa Ana (more than 11 percent), Cox notes, the immigrant population is shifting to more upscale suburbs. In Glendale, a major destination for both Armenian and Asian immigrants, more than 56 percent of the population is foreign-born, up 4 percent since 2000.

Other popular immigrant destinations include once-heavily white suburban communities, such as Irvine, which is now more than 38 percent foreign-born, up almost 19 percent since 2000. Fullerton, like Irvine, favored largely by Asian migrants, saw its foreign-born population increase by 21 percent since 2000, now accounting for more than one-third of the city's total.

Other places that seem to be attracting immigrants include Santa Clarita, Palmdale and Lancaster, all communities further out on the periphery of the region.

Harnessing entrepreneurial energy

If Southern California's future lies largely in the hands of newcomers and their offspring, how can we best respond to their needs? One way is by maintaining a large supply of single-family houses or townhomes. Today's immigrants, particularly Asians, favor settling in ethnoburbs more than the dense Chinatowns, Little Indias and barrios that may strike many other Americans as somehow more colorful. Now, the best place to encounter immigrant food and culture is frequently at the strip malls of Monterey Park, the Hispanicized shopping complexes like Plaza Mexico, Irvine's Diamond Jamboree Center or the amazing 626 Night Market at Santa Anita Park in Arcadia.

Of course, immigrants are less interested in providing neighbohoods with local color than in moving to places with good schools, safe streets and parks – as most middle-class families prefer. This preference runs afoul of the kind of extreme land-use regimen being imposed on the region, including the Inland Empire, planning that seeks to promote the construction of high-density housing that, to be honest, many immigrants, particularly Asians, could enjoy at home, with far more amenities.

Planners and some developers seem keen on this shift, thinking it will appeal to young childless couples and empty-nesters. What they ignore is that, without plentiful, and at least somewhat affordable, single-family houses, immigrants will continue to shift to other parts of the country, notably, the Southeast and Texas, where they can afford them.

Perhaps even more important may be the economy. Immigrants are the ultimate canaries in the coalmine – they tend to gravitate toward opportunity. When Southern California's economy was burgeoning in the 1970s and 1980s, immigrants also flocked here, buying homes and starting businesses. Few immigrant entrepreneurs reached the level of a John Tu or an Elon Musk, but many have launched small manufacturing firms that supported larger firms, engaged in international trade and started small service businesses.

Unfortunately, the business climate in Southern California increasingly makes such enterprise ever more difficult, and may lead these entrepreneurs to relocate or expand where their efforts may be more appreciated. Not helping these businesses is an L.A. political climate dominated by a crony capitalist regime – not at all friendly to plucky startups of any kind – or by a Republican Party that still seems unable to make peace with the demographic realities of our region.

The good news is, however, that these immigrants, and their kids, are still here. They have many reasons to stay, including the presence of ethnic media, churches, schools and shops not likely to be remotely as well-developed in places like Las Vegas, Phoenix, Atlanta or Nashville. But this does not mean they can be taken for granted. We need to recognize that they are our greatest asset, and, if we can appeal to their aspirations, they could help fashion a resurgence in this region.

This story originally appeared at The Orange County Register.

Joel Kotkin is executive editor of NewGeography.com and Distinguished Presidential Fellow in Urban Futures at Chapman University, and a member of the editorial board of the Orange County Register. He is author of The City: A Global History and The Next Hundred Million: America in 2050. His most recent study, The Rise of Postfamilialism, has been widely discussed and distributed internationally. He lives in Los Angeles, CA.

Photo by LHOON

Freedom and its Fruits: Fertility Over Time in Estonia

0
0

Estonians and Latvians are the only independent nations in Europe with fewer people now than at the beginning of the 20th century. It is written in The White Book, 2004, about losses inflicted on the Estonian nation by occupation regimes. During the whole period (1940-1991) nearly 90,000 citizens of the Republic of Estonia perished, and about the same number of people left their homeland forever. It happened in a nation with a population number of about one million. Another nation, through centuries, gradually perished and disappeared from this territory: the Livonians. Their leader, Caupo, in 1203 was received with honor by Roman Pope Innocent III. Interestingly, at least three regions in America are named after Livonians. They are Livonia in New York State, Livonia in Pennsylvania, and Livonia in the Michigan. Do the inhabitants of these Livonias have any connection to the Livonians at the Baltic Sea?!

The growth of the number of Estonians in 45 postwar years till 1990 was about 100 thousand. This was caused by natural increase, decrease of mortality, return of ethnic Estonians from Russia. The fertility rate of Estonians was below the replacement level for 40 years, but from 1970 to 1990 was at or above the replacement level. At the same time, the foreign-born population experienced a rate of fertility beneath the replacement level: 1.64 - 1.72.

The time between 1983 and 1988 was a positive period, with a crude birth rate (the number of births per 1000 people per year) of about 16.0. It is interesting that this situation arose during the so-called “stagnation era”. The stagnation period – life without radical changes – was probably fruitful for fertility growth. The same trend was noted for Russia. Perhaps this increase was caused by the decision of the Soviet government in 1981 to increase the birth rate “About Measures of Public Support to Families Having Children”. In 1989, the peak of fertility was over.

The French demographer Adolphe Landry (1874-1956) defined genuine demographic revolution as the situation in which use of contraceptives and abortions by women becomes universal. This revolution detaches fertility from social control and transfers it to the interests of individuals. For Estonia, this period arrived at the beginning of nineties, when plenty of contraceptives became available, in addition to abortions continuing to be permitted.

In 1991, the crude birth rate fell to 12.4, and the total fertility rate (number of children per woman during her lifetime, which characterize the necessary replacement level of 2.1) to 1.80. The year of 1991 was the first year of two decades of continuing decrease. Remarkably, fall of the birth rate at the beginning of nineties was much worse than it was during WW II. The population of about one million had 19.5 and 19.2 thousand births respectively in 1941 and 1942 during the war, but in 1993, when conditions were clearly better, only 15.3 thousand children were born to a population of one and a half million. The genuine demographic revolution had truly arrived!

The reasons, in addition to the availability of contraceptives and abortions, were the decline of religion, economic uncertainty regarding the future, the opening of the world with a variety of lifestyle choices and career paths. Almost thirty decrees regarding the family benefits of the Soviet period that had been made by that government were cancelled in 1992. In the liberal market economy of the nineties, population policy was left largely to chance. Public attention to the issue was narrowly limited to family benefits and integration programs.

The Parental Benefit Act passed in 2003 tried to attain the birth rate. According to the Act, persons have the right to receive parental benefits for 435 days from the day following the final day of maternity leave. The amount of the parental benefit received is calculated on the basis of the Social Tax paid during the previous year. If the parent didn’t work, the parental benefit is paid at the designated benefit base rate, which is 290 euros in 2013. The upper limit of the amount of the parental benefit is three times the average salary earned during the year before last, which – in 2013 – is 2,234 euros.

If we take the birth rate of the years 2002 and 2003 – 13,000 births – as the plateau (base rate) and eliminate all other factors pertaining to reproductive behavior, then natality during the 2004-2012 period resulted in about 18 thousand additional births. This speaks to the effectiveness of the parental benefit. However, even this was insufficient for attaining positive natural increase. The total maximum fertility rate obtained was 1.65, but later, in 2011, it decreased to 1.52. In 28 countries of European Union the mean value of the total fertility rate was 1.58 in 2012, for euro area it was 1.56. However in France, which has perhaps the oldest experience in field of demography and demographic research, this indicator was 2.01. In contrast, Singapore's total fertility rate steadily dropped from 1.6 in 2000 to a record low of 1.16 in 2010. It bounced back to 1.2 in 2011, and further to 1.29 in 2012, but last year slipped again to 1.19. 

The government aims, by 2015, to achieve a birth rate that is higher than the death rate, meaning an increase of the total birth rate to 1.70. (Action Program of the Government of the Republic 2011-2015). This seems unattainable. Poverty and migration worsen the situation. The at-risk-of-poverty rate in Estonia in 2011 was 17.6% on the average. The parent benefit and family benefits together constituted 1,7% of GDP in 2011 ( the same figure in Sweden and Finland was 3%).  

One key cause, ironically, is freedom to move that came with the fall of the Soviet Union. Handling the population decrease we described first of all the birth rate, but last years has been intensified external migration. Migration that took place in 2011 decreased the population of Estonia in 2012 by 6,600 inhabitants. The trend continued. In external migration, there was an increase in both immigration and emigration in 2012. Over 4,000 persons immigrated to and almost 11,000 persons emigrated from Estonia. The main destination countries for emigrants are Finland and the United Kingdom. Most of the immigrants are in fact returnees, mostly from Finland. The second place is held by Russia, but the immigrants from Russia are mainly new immigrants.

Despite numerous attempts to boost birth rate, the years from 1991 to 2013 are characterized by a birth rate under the replacement level. The lowest point arrived in 1998, with a total fertility rate of 1.28. After that it began to rise, reaching 1.65 in the year of 2008, only to decrease again later. At the same time, the population figure decreased by 14%. Problems caused by decreasing population entail a threat to the survival of the Estonian national culture, issues with sustainable economic development and difficulties with the sustainability of the social infrastructure. 

How to avoid the fate of Livonians? Is there a force majeure against the small nation? Or it is a problem of insufficient national steering without any specialized institution responsible on population?

Jaak Uibu, a Phd. in human micro ecology, was former Deputy Minister of Health of Estonia and advisor to Minister of Population. 

Oleviste photo by E. Kanash.

The Part-Time, Freelance, Collaborative Economy

0
0

Are we becoming a part-time economy? Maybe. A collaborative economy? Possibly. A freelance economy? Definitely. Here's the evidence:

The Part-Time Economy- Involuntary part-time work is at a historic high, and the workforce participation rate is at a near-historic low. The number of unemployed people is higher, and the number of jobs in the economy is lower, than five years ago. During this weak recovery, more people have left the workforce than have started a new job, and a high percentage of the jobs that are being created are low-wage and part-time.

This is a catastrophic situation, both in personal and in national terms. On the personal level, people need work to pay the bills, save some money for their non-working years (if they ever arrive) and, I would argue, to stay connected to society by being and feeling useful. It has long been noted that Americans are prone to defining themselves in terms of their work, through which they find a sense of identity, purpose and self-worth.

On the national level, the country needs more citizens working more hours to pay taxes and to start to alleviate our unsustainable debt and unfunded liabilities.

For this miserable state of affairs, some blame the Affordable Care Act. Others say it is a temporary phenomenon, due to the lousy economy and low economic growth. Still others blame technology and/or globalization for displacing jobs, or the rising share of profits that go to capital instead of to labor. And finally, some say the shift to part-time is a myth.

According to a report from the Federal Reserve Bank of San Francisco, recessions always drive up part-time work, but what is different this time is that the part-time employment rate has remained higher for many more months than in past recessions. Also, states the report, the US labor market has recovered only about three-fourths of the jobs lost during the recession and its aftermath. In other words, general labor market slack is the key factor keeping part-time employment high.

My conclusion? Many more people would be working, and working more hours, if not for the four horsemen of recession/depression: high taxes, overregulation, a weak currency and political (policy) uncertainty. When things crashed some five years ago, I wrote that the effects would be with us for years: slow growth at best, high unemployment and underemployment, underinvestment by businesses, and an overhang of debt. Sorry to say I was right, and that what I most feared has come to pass: a “recovery” that leaves tens of millions behind.

How are millions coping?

The Collaborative Economy- A modern version of the “pooled resources” strategy practiced through the ages by affinity groups -- families, tribes, etc. -- has been updated for the 21st century through the use of technology. Those outside of traditional economies once banded together to survive, and then thrived, becoming part of new mainstreams. This is happening again today. We are seeing peer-to-peer sharing not only of content, but of goods and services, transportation, space and money.

Platforms that are hallmarks of this new economy include well known sites like Etsy, eBay, Craigslist, Kiva, and Kickstarter, as well as Rent the Runway, Lyft, Uber, and Airbnb. Apps and the internet are the new middle men of collaboration, connecting individuals. This economy also empowers entrepreneurs and hobbyists.

Sharing is the New Buying, a report by CrowdCompanies.com and VisionCritical.com, breaks individuals down into three categories, based on their level of participation in the collaborative economy. A shrinking majority of us (61% of Americans) are still in a category the report calls “non-sharers,” not yet having dipped into this realm. A smaller portion (23%) are “re-sharers,” using some of the more popular and more established services like eBay and Craigslist. But then there is a smaller, rapidly emerging group (16%) known as “neo-sharers.” These are the people who are early adopters of sites like Etsy, Lyft, and Kickstarter, engaging in more niche forms of collaboration.

The poor employment environment is one of the engines driving this trend, but once people become engaged in it, they may never go back to the traditional ways of doing things.

The Freelance Economy- One in three Americans, roughly 42 million, are estimated to be freelancers. By 2020, freelancers are expected to make up 50% of the full time workforce. Independent work is becoming more common across all generations.

As Jeff Wald writes in Forbes, the freelance economy is exploding at exactly the same moment that businesses are undergoing a major shift. Talent is moving from a fixed cost (and one that’s historically been one of the largest of a business) to a variable cost, with companies staffing up and down as needed.

The booming online staffing industry is also accelerating the growth of the freelance economy. This $1 billion industry grew 60% last year.

The online work marketplace oDesk recently announced that it hit $1 billion in work brokered between businesses -- many of them small -- and solopreneurs, freelancers who moonlight, and in many cases earn their entire living, online.

While it’s unlikely the majority of businesses will ever become completely freelance or remote — core staff need to work in proximity at any company of a certain size; local service-based businesses need people on site, though those can be freelancers — it's entirely plausible that more than half of the American workforce will one day log in or show up every day as independent contractors.

A surprisingly large percentage of working freelancers have day jobs to supplement their incomes. And for many, it's soon going to be the only option. By 2020, more than 40% of the US workforce will be so-called contingent workers, according to a study conducted by software company Intuit.

***

Following the recent economic downturn, the employment rate has recovered at a frustratingly slow pace, except in one area: temporary, contingent, and independent workers. Between 2009 and 2012, according the Bureau of Labor Statistics, the number of temporary employees rose by 29%. A survey of the 200 largest companies found that temporary workers represented, on average, 22% of their workforce. Workers from all different industries, not just tech, are discovering that they’re able to be productive outside of the corporate office and without a long-term employer.

Even with the economy and hiring improving, freelancing is likely to become a much bigger part of the employment landscape, regardless of what workers prefer. Employers like having the flexibility to expand and contract their workforce, and the supply of available workers currently exceeds demand in many fields. Elance, one of many online freelance hubs that matches freelancers with clients, recently announced that hiring by businesses through its site increased by 60% last year.

Keep all this in mind every month when employment numbers are released by the Bureau of Labor Statistics; they’re missing the big story -- the part-time, collaborative and freelance economy. This is what explains how the workforce can shrink while the unemployment rate also declines. Sure, a lot of people are retiring or collecting some sort of disability, but the big trend is that there is tremendous growth in freelance and independent contracting work, part-time work, and collaborative types of work that fly under the radar.

Of the many repeating patterns I have discerned from decades of social and economic trend analysis, these are two of the most powerful: 1) what is outside the mainstream, if necessary or desirable, becomes mainstream, and 2) what is past is prologue.

Dr. Roger Selbert is a trend analyst, researcher, writer and speaker. Growth Strategies is his newsletter on economic, social and demographic trends. Roger is economic analyst, North American representative and Principal for the US Consumer Demand Index, a monthly survey of American households’ buying intentions.

Flickr photo by Antony Mayfield, Working in Intelligensia: Settled down to work in a coffee shop in Venice, California.

New Central Business District Employment and Transit Commuting Data

0
0

Photographs of downtown skylines are often the "signature" of major metropolitan areas, as my former Amtrak Reform Council colleague and then Mayor of Milwaukee (later President and CEO of the Congress of New Urbanism) John Norquist has rightly said. The cluster of high rise office towers in the central business district (CBD) is often so spectacular – certainly compared with an edge city development or suburban strip center – as to give the impression of virtual dominance. I have often asked audiences to guess how much of a metropolitan area's employment is in the CBD. Answers of 50 percent to 80 percent are not unusual. In fact, the average is 7 percent in the major metropolitan areas (over 1,000,000) and reaches its peak at only 22 percent in New York (Figure 1), which sports the second largest business district in the world (after Tokyo).

Only seven of the 52 major metropolitan areas have CBDs with 10 percent or more of employment. Some are much lower. For example, Los Angeles and Dallas have had some of the nation's tallest skyscrapers outside New York or Chicago for decades, yet these downtowns have only 2.4 percent and 2.3 percent of their metropolitan area employment respectively (Figure 2).

This and similar information has been summarized in the third edition of Demographia Central Business Districts, which is based on the 2006-2010 Census Transportation Planning Package, a joint venture of the Census Bureau and the American Association of State Highway and Transportation Officials (AASHTO). The two previous editions of the report summarized data from the 1990 and 2000 censuses.

The Declining Role of Downtown

Downtowns have become far less important than before World War II, when a large share of American households did not have access to automobiles and when employment was far more concentrated than today. Indeed, the highly concentrated American downtown area is "unique," as Robert Fogelson indicates in Downtown: Its Rise and Fall: 1880-1950, and could be easily located as the destination of the "street railways." Downtown was a product of transit and remains transit's principal destination today. The concentrated US style CBD form is really quite rare outside other new world nations, such as Canada, Australia, South Africa and New Zealand. Some, but only a few Asian cities have also followed the example, most notably Shanghai, Hong Kong, Nanjing, Chongqing, Singapore, and Seoul.

The US, however, for all its role as originator of the downtown paradigm has also led the world in employment dispersion. This reflects the dominance in the US of automobiles. Dispersion is more amenable to mobility by the car, which dominates motorized mobility in virtually all major metropolitan areas of North America and Western Europe. This has led in the US to generally shorter work trip travel times and less traffic congestion, according to Tom Tom and Inrix. The continuing expansion of working at home could improve the situation even more.

New York has the largest CBD in the nation by far, with nearly 2,000,000 jobs. Chicago's CBD (the Loop and North Michigan Avenue) has about one-quarter as many jobs (500,000) and Washington approximately 375,000. San Francisco, Boston and Philadelphia, also ranked among the nation’s transit "legacy cities," have between 200,000 and 300,000 jobs. Automobile oriented Houston and Atlanta are the largest otherwise, with Houston's downtown being much more compact than Atlanta's. Atlanta's downtown has expanded strongly (and less densely) to the north and includes "Midtown" (Figure 3)

Transit is About Downtown

Transit is about downtown. Approximately 55 percent of transit commuting in the United States is to jobs in just six municipalities (not to be confused with metropolitan areas), which I have called transit's "legacy cities." Most of that commuting is to the six downtown areas. Of course, the city of New York is dominant, which alone accounts for 55 percent of the country’s CBD transit commuting (Figure 4), with much of the balance in the other five legacy cities (Figure 4). Only 14 percent of the CBD commuting is to the other 46 smaller downtowns.

More than 1.5 million transit commuters converge on jobs in Manhattan every day. In the other five legacy cities, the figure ranges from 100,000 to 300,000 daily. All of the other central business districts draw fewer than 100,000 daily commuters. Seattle ranks 7th, at 60,000, and has double or more the CBD transit commuters of any of the other 44 CBDs (Figure 5). 

New York has by far the highest transit commuting share of any downtown in the nation. Approximately 77 percent of people who work in the New York central business district commute by transit. The other legacy cities post impressive market shares as well, though well below those of New York. The CBDs in Chicago, Boston, and San Francisco draw between 50 percent and 60 percent of their commuters by transit. Downtown Philadelphia and Washington attract more than 40 percent of their commuters by transit (Figure 6).

Transit is About Downtown II

The importance of downtown to transit is also indicated by its predominance in transit commuting destinations. In the New York metropolitan area, with a transit market share of approximately 30 percent, 57 percent of all transit commuting is to downtown jobs. Chicago's transit commuting is concentrated in downtown to a slightly greater degree than in New York. One half of all the transit commuting in the San Francisco metropolitan area is to downtown. The CBDs of Boston, Philadelphia, and Washington account for between 40 percent and 50 percent of all transit commuting in their downtown areas. Seattle and Pittsburgh also are in this range (Figure 7). Seven of the eight metropolitan areas with the largest transit market shares have a CBD commuting dominance of 40 percent or more (Pittsburgh is the exception).

The 52 major metropolitan area CBDs combined have less than five percent of the nation's jobs. Elsewhere, downtowns and otherwise, the other 95 percent of American commuters use transit at only a three percent rate.

Other Employment Centers

In a new feature, Demographia Central Business Districts also provides data for selected employment centers other than the principal central business districts. These also include some surprises. For example, downtown Brooklyn, long since engulfed by the expansion of New York, has the second highest transit market share of any employment center identified other than New York, at 60 percent. Across the river, the Jersey City Waterfront area achieves a transit market share of more than 50 percent, greater than the downtowns of legacy cities Philadelphia and Washington.

Data on supplemental employment center and corridor data is selected and therefore not representative. It is notable that some employment corridors and centers have employment totals that dwarf those of the principal downtown areas in their respective metropolitan areas, such as Los Angeles, Portland, Dallas, and Kansas City.

With a few exceptions, the transit commuting shares for most of these selected centers and corridors is modest. Many are served by new rail systems, which are simply not up to the task of providing mobility to these dispersed centers. Nor can they provide the radial, high quality service that makes transit such a success in the six legacy city downtowns. For example, the Dallas light rail system provides service along virtually the entire US-75 corridor from north of downtown to Plano. Transit's share of commutes in this corridor is only 2 percent, far below the downtown Dallas share of 14 percent and the legacy city downtown average of 65 percent.

Wendell Cox is principal of Demographia, an international public policy and demographics firm. He is co-author of the "Demographia International Housing Affordability Survey" and author of "Demographia World Urban Areas" and "War on the Dream: How Anti-Sprawl Policy Threatens the Quality of Life." He was appointed to three terms on the Los Angeles County Transportation Commission, where he served with the leading city and county leadership as the only non-elected member. He was appointed to the Amtrak Reform Council to fill the unexpired term of Governor Christine Todd Whitman and has served as a visiting professor at the Conservatoire National des Arts et Metiers, a national university in Paris.

Sunday Night Dinner in Indianapolis

0
0

Urban culture varies radically from city to city. Yet to a great extent the culture of the usual suspects type of places tends to get portrayed as normative. In New York, for example, with its tiny apartments, the social life is often in public, in many cases literally on the streets of the city, which pulse with energy. As the ne plus ultra of cities, the street life of New York is often seen as what every place should aspire to. There’s a body of literature which attributes all sorts of positive effects to this New York style urbanism, such as the notion of “collisions” and “serendipitous encounters”. But while New York’s street life and social scene may indeed be engaging, how often does one actually strike up a conversation with someone random on the street or in a coffee shop there that turns into something meaningful? The only collisions I’ve ever had there were literal.

New York is the most well known and championed style of interaction, though hardly the only one. Think of San Francisco and something clearly distinct will come to mind, albeit with some similarities. LA has its own mythos. The TV show Portlandia does a great job of capturing our idea of the quirky urban life of that city.

Cities that lack the cachet of an NYC, SF, or Portland can often find their own urban culture lacking in comparison. To be taken seriously, the logic goes, they must measure up to the yardstick defined by others. But while I do not subscribe to the idea of value free cultural comparisons, I do believe cities need not judge themselves as wanting just because they don’t function like New York City. Rather, they should seek to be the best they can be on their own terms. Since few cities are anything like New York, aspiring to that kind of urbanism would only be a case study in frustration anyway.

Indianapolis cultural commentator David Hoppe once said something to the effect that “the social life of Indianapolis happens in back yards.” And this is true. Unlike a New York City, Indianapolis does not wow you just by walking down the street. While I believe in trying to contextualize the facts on the ground in the most positive way possible for moving forward, that doesn’t mean reclassifying genuine defects as virtues. In the case of Indianapolis, the generally poor impression left by its built environment and lack of street life can’t be denied. There are plenty of great places to go, but you generally need someone to point you in the right direction.

But there are countervailing virtues as well, ones generally under appreciated. Unlike New York, Indy has a far more robust social life in private spaces like houses and back yards. This produces a qualitatively different type of social capital, one with its own unique set of strengths.

One example of this is the emergence of community based Sunday dinners. This was an organic movement and as a result lacks a fancy name, but in keeping with the generally low key and unpretentious character of the city, let’s just call it Sunday Night Dinner.

Sunday night dinners are a type of intentional community in which 6-8 families in a neighborhood decide to get together for dinner every Sunday night on a rotating basis. This originated in 2006 on Pleasant St. in the Fountain Square neighborhood when a group of neighbors decided to start getting together regularly for dinner. Here’s how Tonya Beeler, one of the founding members, describes it:

When most of us talk about it, we just call it Sunday Night Dinner. It’s unassuming, I know – but that’s what Sunday Dinner is to us. We’ve had it consistently for almost 8 years – having only cancelled dinner a handful of times. The majority of the families on the original list are still regular participants and we’ve added and lost a few through the years.

What is Sunday Night Dinner to us? In this stage in our lives, its sometimes difficult to physically connect to your neighbors, but we know that each Sunday we’re going to see our friends. It’s also a good time to have newcomers to the neighborhood connect with some of us old timers. We’ve also had visits from Mayor Ballard (before he was elected) and Melina Kennedy (when she was running) and I still have a fond memory of John Day sitting down to sup with us. But what is it mostly? Just a day in the week where we meet to take a breath, sit down, and eat together. It’s my favorite day of the week.

I used to be part of a quarterly dinner club in Chicago. Given the frequency, our idea was to make each dinner “special” in the sense that we went all out with super high-quality food, etc. In Indy, while good food is certainly part of the equation, the regular weekly cadence means it’s as much about friends and neighbors as it is special ambiance. It’s about regular life lived in the city. In the picture at the top it’s paper plates and plastic cups all the way – and that’s just fine. Can’t stay for some reason? No worries, bring some tupperware, grab some food, and run. In a sense, it’s the Kinfolk Magazine ethic (motto: doing things simple sure is complicated – and expensive) in genuine form, shorn of Portland pretense.


Sunday night dinner in the Beeler’s backyard in Fountain Square, Indianapolis, Easter 2012. Photo: Cindy Ragsdale

Oh, and typically with children, which actually exist in abundance in Indianapolis.

The idea spread and now there are Sunday night dinner groups all over the city. I’m told there are three in Herron-Morton Place alone, which I can’t quite wrap my head around given how small the area is.

I can’t help but notice the similarity of these dinner groups to religious small group gathering. In the last couple decades, Evangelical churches have moved away from mid-week services in favor of small group gathering during the week (sometimes called home groups or other names). The idea is to promote more actual community than is possible in a larger assembly format. These dinner groups are in effect secular small groups, ones that help provide the sense of connectedness, regularity, and rootedness that’s so often missing from our contemporary world.


Outdoor fun on Sunday night isn’t just for summer in Herron-Morton Place, Indianapolis. Photo by Amanda Reynolds.

These groups aren’t just walled garden cliques, however. The host generally invites guests to attend. So there’s a type of brokered introduction which in my experience is the real source of “serendipitous” encounters of genuine value. An arranged guest invite is one way to get people connected in their neighborhood, or even to help people who are deciding whether or not to take the plunge into city living to get a feel for what life lived in a particular neighborhood is actually like.

In fact, if you are visiting Indianapolis on a Sunday night, or live there and want to check it out, email the City Gallery at the Harrison Center For the Arts and they will set you up. The email address is citygallery@harrisoncenter.org

I don’t want to suggest that Indianapolis invented the concept of the dinner club or is the only place such events occur. For all I know, lots of places do this. (Heck, as big as it is, odds are that includes New York City). And as with all traditions, this particular instantiation will likely die off at some point (though it’s still growing eight years after starting on Pleasant St). Yet the prevalence of this type of cultural phenomenon is part of the explanation for why Indianapolis has consistently managed to punch above its weight class in so many areas. Although the type of obvious assets and strength evidenced by super-cool buildings or crowds on the street may be lacking in Indianapolis vis-a-vis some other places, the city contains deep reservoirs of cultural capital that aren’t as visible and may never be fully understood or mapped, but nevertheless are of profound importance. This is the real secret sauce of the city.

Copying this idea, locally or anywhere, is definitely welcomed. Should you be interested, here are the “Indianapolis Rules” for Sunday night dinners, courtesy of Tonya Beeler:

1. Dinner is every Sunday night, with six to eight families, each hosting on a rotating basis.

2. The host is responsible for preparing all of the food for everyone. (Work? Yes, but it also means seven weeks of not having to do anything but show up).

3. The host is responsible for inviting all guests. Do not invite guests without checking with the host first.

4. If you’re not coming, tell the host as far in advance as possible.

5. At the very beginning of the dinner, the host makes sure all the guests know of any rules for the house (no one allowed upstairs, kids can’t eat in the living room, toilet handle needs to be held down for 3 seconds, whatever).

6. If your family will not be coming for dinner, but you still want food, there’s no need to let the host know, just stop by early in the meal (so you don’t miss anything, food goes fast!!!) with some tupperware and fill it to go.


Sunday night dinner in Fountain Square, Indianapolis. Painting by Kyle Ragsdale.

Aaron M. Renn is an independent writer on urban affairs and the founder of Telestrian, a data analysis and mapping tool. He writes at The Urbanophile, where this piece originally appeared.

Lead photo: Sunday night dinner in Herron-Morton Place, Indianapolis. This is one of three dinner groups in that neighborhood. Photo by Amanda Reynolds (check out the mirror!)

Crimea and Ukraine: What Putin Could Learn from Yugoslavia

0
0

While American government officials respond to the Russian Anschluss in Crimea by mobilizing their Twitter feeds and making the rounds of the Sunday morning meetings of the press, the Moscow government of Vladimir Putin reinforced its occupation forces around Simferopol and Sebastopol, perhaps at some point passing out small Russian flags to local sympathizers, who can wave them gratefully when the symbolic gates between Russia and Crimea are thrown open.

To paraphrase a quote that circulated in the 1930s: “The West likes to spend its weekends in the country, while the Russians prefer to take their countries in a weekend.”

The reason the Russians have chosen this moment to move against Ukraine and its Western patrons is not difficult to reconstruct. Since the fall of the Soviet Union in the early 1990s, the United States, NATO, and most recently the European Union have treated Russia as little more than a Grand Duchy of Lithuania.

The moment it could, when the Soviet Union was in liquidation and Russia was weak, NATO pushed its military frontiers into Poland, the Baltic States, Slovakia, and even Georgia. At international conferences such as the G7, it sat Russian presidents at the children’s tables. In the Middle East, the United States and its allies blew away Russia’s man in Baghdad — Saddam — and is now doing the same with Assad in Syria.

In Libya, despite giving Russia assurances that the no-fly zone was there to protect citizens trudging to markets with their donkeys, it was expanded to justify killing Qaddafi and reserving the sweetheart oil contracts for western corporations. No wonder Russia had its doubts when the US and the EU started hinting that Ukraine’s president, Viktor Yushchenko, had stolen more than was necessary.

More immediately, Putin felt humiliated when the Western press comically treated his Olympics as though he was Comrade Kane, staging a $51 billion snow opera for his girlfriend.

Putin did not become president-for-life of Russia by giving fundraisers in Napa Valley or interviews to Esquire. By nature intensely competitive, he still smarts from the dissolution of the Soviet Union, especially the loss of Ukraine.

Short of reviving the 1854 Crimean War coalition (Britain, France, and Turkey, with Austro-Hungary and Prussia neutral) and besieging Sebastopol, there isn’t much that the West can do, or will want to do, to evict Russian troops from Crimea. Will Russia now take up the fallen mantle of the Soviet empire? Will it work?

By invading or partitioning the Ukraine, Russia sets itself up as the Yugoslavia of the 21st century—Russoslavia? Like Slobodan Milosevic before him, Putin is a former Communist war horse who champions the nationalist cause of disenfranchised Russians cut adrift after the dissolution of the Soviet Union — Yugoslavia on a grander scale, with the same hodgepodge ethnicity. Ukraine becomes the Bosnia of the 21st century.

Yugoslavia was a 19th century political ideal, to pull together a number of smaller, vulnerable Balkan states from the encroachments of the Austro-Hungarian Empire to the north and the Ottomans to the south. It came into being at the end of World War I, although by that time neither the Austro-Hungarians nor the Turks were powers in southwest Europe.

Almost immediately, without the common threats, the countries of the Yugoslav federation fell out, although the country lasted, officially anyway, until the 1990s. To be a Serb living in Bosnia or Croatia was fine until those republics went for the exits of Yugoslavia, when to be Serb became to be a symbol of a failed central government or, worse, a second-class citizen living in a new country.

Russia’s role in the Soviet Union was not unlike the position of Serbia in Yugoslavia. It had the largest population, was the seat of the central government, and, later, had the most to lose when constituent states of the federation decided to secede and take with them large blocs of Russian citizens.

With the Soviet devolution, Russians became a lost tribe of the Cold War, stranded with few rights and much contempt in places like Ukraine, Moldova, Kazakhstan, Uzbekistan, Belarus, and Latvia.

When I have traveled in Russia or the ex-Soviet Union, I have met many who say, for example, “My father was from Moldova and my mother was Russian, but during the war we were moved to Uzbekistan, although later I went to school in Riga.”

Putin is their archangel, much as the writer Aleksandr Solzhenitsyn was their philosopher-king, writing in 1995, "Russia has truly fallen into a torn state: 25 million have found themselves 'abroad' without moving anywhere, by staying on the lands of their fathers and grandfathers. Twenty-five million — the largest diaspora in the world by far; how dare we turn our back to it?? Especially since local nationalisms (which we have grown accustomed to view as quite understandable, forgivable, and 'progressive') are everywhere suppressing and maltreating our severed compatriots."

While there is a rationale for Putin speaking up for the lost rights of the Russian diaspora, the last thing he needs, in exchange for the liberation of Donetsk, is a Muslim Risorgimento in Tatarstan, Chechen agitation, a separatist movement in Siberia, or rebellion from the two million Ukrainians living inside Russia.

Like Yugoslavia, Russia has a lot it can lose in playing the nationalist card, because it risks a series of border wars if it tries to impose Greater Russia not just on gleeful former citizens, but on less enthusiastic minorities, who want nothing to do with a Russian restoration.

In its attempts to hang on to its cordon sanitaire in the past, Russia became the patron of bizarre breakaway republics, such as Transnistria (a Russian enclave between Ukraine and Moldova), Abkhazia and South Ossetia in Georgia, and Nagorno-Karabakh in Armenia. An Autonomous Republic of Crimea, run by shady commissars flitting around in SUVs, would fit well with these no-man’s lands, dressed up for the Kremlin masquerade.

Most likely the Ukraine crisis will end with the same vagueness that has characterized so much of international diplomacy since the end of the Cold War. In most cases, Moscow has ended up as the guardian of a series of rump states, the latest of which might be Crimea.

Matthew Stevenson, a contributing editor of Harper's Magazine, is the author of Remembering the Twentieth Century Limited, a collection of historical travel essays. His new book, Whistle-Stopping America, was recently published. He first traveled to the former Soviet Union in 1975, and over the years has been to many of its then-constituent parts, usually by train.

This post is a different version of a longer analysis at NYTimes eXaminer.

Flickr photo by Alexxx Malev: Sevastopol 187

Good Jobs Often Not Matter of Degrees

0
0

If there's anything both political parties agree upon, it's that our education system is a mess. It is particularly poor at serving the vast majority of young people who are unlikely either to go to an elite school or get an advanced degree in some promising field, particularly in the sciences and engineering.

Historically, education has been a key driver of upward mobility and progress in our society. But, increasingly, its impact on boosting incomes has slowed, or even reversed, and, for many, the attempt to get a four-year degree ends in debt and widespread unemployment or underemployment. Worse still, many don't make it. Indeed, according to a 2010 report by the Public Policy Institute of California, young adults in California are less likely to graduate from college than were their parents.

These failures make things even worse for workers with only a high school education, as they must compete for even low-wage jobs with people who either have been in college or have graduated. So, we now see college graduates working in jobs as humdrum as barista or even janitor. This has even led to some pretty dubious lawsuits against schools by disgruntled graduates who feel they were misled by post-graduate employment claims.

The worst performance is at the grade-school and high school levels, particularly in California. Blame funding, teachers unions or demographics, but our state's basic education system has been deteriorating for decades. California was ranked 48th in 2009 for high school attainment. In 2000, it ranked 40th. In 1990, it was tied with Illinois for 36th place.

Clearly, if we are to advance as a state, and a country, we need to develop a new perspective on education. It's not just a matter of money, as progressive journalists,teachers unions, education lobbyists and advocates for various ethnic and political causes all insist. Money should be spent but more emphasis needs to be placed on how it is spent. After all, America boosted per-pupil spending on public elementary and secondary education by 327 percent from 1970-2010 (adjusted for inflation) with no rise in student test scores.

As for the effectiveness of college, a recent Rutgers University report found that barely half of college graduates since 2006 had full-time jobs. And it's not getting better: Those graduating since 2009 are three times more likely to not have found a full-time job than those from the classes of 2006-08. Since 1967, notes one 2010 study, the percentage of underemployed college graduates has soared from roughly 10 percent to more than 35 percent.

What we need to do is rethink the notion, supported by President Obama and others, that the solution to our education woes primarily is “more.” More what? What are the job prospects for the new crop of ethnic-studies majors, post-modern English graduates and art historians, for example, particularly those from second-tier institutions? These kind of liberal-arts degrees are, as the New York Times recently reported, that tend to earn graduates the least, while those degrees that pay the most are largely offered by schools aimed at technology, mining and other “hard skills.”

First, we need to understand that educational differences and capabilities exist and cannot be easily adjusted simply by forever lowering standards. Our most competitive institutions need to make sure that people leave with the highest degree of critical skills. Grade inflation at Harvard may not produce unemployables, but it does weaken the value of the degree and, even worse, suggests that one can not expect too much knowledge, or reasoning capacity, from graduates. Indeed, many employers complain about the lack of “soft skills,” such as communication and critical thinking, as much as they do about applicants' lack of harder skills such as math and science.

This suggests that even those of us who teach at more selective universities cannot just rest on laurels. Schools have to focus more on developing actual skills – notably in presentation and research – even among the brightest students. Instead, all too often, as the Manhattan Institute's Heather McDonald has pointed out, political education – usually, but not always, tending toward the progressive left – actually predominates over learning how to think critically and express ideas coherently.

More important is the need to put greater effort in lifting students who may not be ideal for a classical liberal four-year education. This may include a greater emphasis on skills with practical applications, such as nursing, rehabilitation, technical and scientific areas of specialization. It also includes expanding innovative programs, such as at LaGuardia College in New York, that helps high school dropouts to get their diplomas.

Although some of these students will still seek four-year degrees, for many, the best opportunities for employment do not require more than a two-year degree, or simply a certificate. This may be particularly critical for the roughly 40 percent of students who attend college but don't finish.

These include many fields where employment has been growing, notably, in energy, manufacturing and – with the resurgence of the housing market – construction. But the biggest shift may be as a result of the current energy revolution, which, notes the president of the engineering and electronics conglomerate Siemens, Joe Kaeser, “is a once-in-a-lifetime moment.” Cheap and abundant natural gas, in particular, is luring investment from European and Asian manufacturers and sparking demand not only for geologists and engineers but also machinists, rig operators and truck drivers.

The workforce in many of these fields is rapidly aging, and the demand for new, updated skills, particularly involving computers, has soared, leaving manufacturers desperate for necessary workers.

There is already, notes a recent Boston Consulting Group study, a shortfall of some 100,000 skilled manufacturing positions. In this respect, millennials – which I have called “the screwed generation” – may have finally caught a break. By 2020, according to the consultancy BCG and the Bureau of Labor Statistics, the nation could face a shortfall of about 875,000 machinists, welders, industrial-machinery operators and other highly skilled manufacturing professionals.

This already is the case in parts of the country now enjoying the energy and manufacturing renaissance. In training facilities in the New Orleans area, where some of the new trade school students have migrated after receiving four-year degrees, and near Columbus, Ohio, you can see many young people preparing for positions not only in medical fields, but as technicians, machinists, plumbers and electricians.

Businesspeople almost everywhere decry such labor shortages, but rarely lament a lack of English post-modernist scholars. As I saw on a recent trip to Houston – in many ways the country's most economically dynamic city – developers enjoy high demand by are stymied by a lack of skilled labor. In some cases, companies are beginning to invest not only in community colleges but also looking to recruit high school students into these professions.

This practical approach may offend people to whom it seems reminiscent of the infamous “tracking” system, which was used to steer even the most academically gifted minority students into manual professions. Still, stuffing more students into a system that, in the end, fails to prepare young people for the future, and lands them in debt, makes little sense. Today a record 1-in-10 recent college borrowers has defaulted on student debt, the highest level in a decade. And, with wages for college graduates on a downward slope, one has to wonder how many more will join them.

Some “progressives” believe the solution lies in subsidizing even more the current system. In reality, such an approach will only continue the current failures, with fewer students graduating with needed skills and more years of wasted effort. Shifting the financial burdens from parents and students and onto business and the taxpayer does not seem the best way to boost public support for education.

Instead of bailing out the current system, we need to find ways to change our educational focus from the elite level to the certificate program, in ways that serve the needs of both the economy and the next generation. For the talented students I so often encounter at Chapman, this means greater rigor, more serious reading and opening themselves to conflicting ideas. But, for many others, the focus should be on practical skills that can lead to middle-class jobs. We have to learn to appreciate that there's nothing wrong with a son or daughter, rather than aspiring to become a doctor or lawyer, instead, earning a good living as a plumber.

This story originally appeared at The Orange County Register.

Joel Kotkin is executive editor of NewGeography.com and Distinguished Presidential Fellow in Urban Futures at Chapman University, and a member of the editorial board of the Orange County Register. He is author of The City: A Global History and The Next Hundred Million: America in 2050. His most recent study, The Rise of Postfamilialism, has been widely discussed and distributed internationally. He lives in Los Angeles, CA.

Graduation photo by Bigstock.


Special Report: 2013 Metropolitan Area Population Estimates

0
0

The 2013 annual metropolitan area population estimates by the US Census Bureau indicate a continuing and persistent dominance of population growth and domestic migration by the South. Between 2010 and 2013, 51 percent of the population increase in the 52 major metropolitan areas (over 1 million population) was in the South. The West accounted for 30 percent of the increase, followed by the Northeast at 11 percent and eight percent in the North Central (Midwest).

Components of Population Change: Major Metropolitan Areas

The dominance of the South was even greater when we turn to net domestic migration between Census Bureau regions. Nearly 785,000 more people moved to the major metropolitan areas of the South from other parts of the country than left. A much smaller 170,000 net domestic migrants moved to major metropolitan areas in the West. At the same time the Northeast lost 485,000 net domestic migrants and the Midwest lost 280,000.

Perhaps even more remarkable, the South, long a laggard as an immigrant destination, even led in net international migration (666,000 for a 1.2 percent over three years), though the Northeast added 546,000, for a 1.0 percent rate). Net international migration to the West was about the same, some 454,000 for a 1.0 percent rate. The Midwest had the lowest net international migration in the country and well below any other region (280,000, for a 0.6 percent rate), as is indicated in Table 1.

There was a substantial gap in the natural increase (births minus deaths) between the regions as well. The West (2.1 percent relative to the 2010 population over the three years) lead the South (2.0 percent) slightly in rate. Both were well ahead of the Midwest at 1.5 percent and especially the Northeast, at 1.2 percent (Table 1).


Table 1
Components of Population Change by Region
Major Metropolitan Areas
 TotalNatural Growth (Births Minus Deaths)Net Domestic MigrationNet International Migration
Northeast             546,742              434,872             (434,029)             545,899
South          2,555,304           1,105,631              783,438              666,235
North Central             398,536              472,017             (280,022)             206,541
West          1,543,319              917,852              171,444              454,023
Change Compared to 2010 Population
Northeast1.5%1.2%-1.2%1.5%
South4.6%2.0%1.4%1.2%
North Central1.2%1.5%-0.9%0.6%
West3.5%2.1%0.4%1.0%
From Census Bureau Data


Population Growth

The New York metropolitan area continues to hold the top position, having added nearly 400,000 residents since 2010 to rise to a population of 19,950,000 residents. At its current rate of growth, New York will exceed a population of 20 million in 2014. There was a time that many expected second-place Los Angeles to overtake New York. However, since 1990 the New York population advantage over Los Angeles has expanded from 6.1 million to 6.8 million, including a further 80,000 advantage built up since 2010 (present geographical definitions). Part of this because much of the growth has been pushed to the more distant Riverside-San Bernardino area.

Los Angeles and Chicago continued to retain the second and third positions, which they seem likely to maintain for decades. Population projections by the National Conference of Mayors indicates strong growth in Dallas-Fort Worth and Houston over the next three decades could have them by pass Chicago by 2050. The challenge could be even more immediate, since Chicago's growth rate over the first three years of the decade is approximately one half the annual rate projected by the US Conference of Mayors between 2012 and 2042.

Late in the last decade, Dallas-Fort Worth passed Philadelphia to become the fourth largest metropolitan area. Then, Philadelphia was passed by Houston in 2011. The result is that, for the first time since the nation's founding, two of the five largest cities (which are functionally defined as metropolitan areas) are in a single state (Texas).

Philadelphia seems likely to fall further. The strong growth rate of seventh ranked Washington suggests that this nearby rival may also pass Philadelphia as early as 2015. Eighth ranked Miami is growing fast enough that it also could drop Philadelphia a position, to 8th place the 2020 census.

But Philadelphia is not the only metropolitan area in relative decline. Detroit started the decade as the nation's 12th largest metropolitan area, but has since fallen to 14th. Detroit has been passed by both Riverside-San Bernardino and Phoenix. Phoenix rose 14th to 12th, passing Riverside-San Bernardino (which remained in 13th position) in the process.

Among the 52 major metropolitan areas, Austin has grown at the greatest percentage rate since 2010 with Raleigh was the second fastest growing. Houston was the third fastest growing major metropolitan area over the three year period. Orlando ranked 4th in growth from 2010, while San Antonio was the fifth. The top ten was rounded out by Denver, Washington, Dallas-Fort Worth, Charlotte and Oklahoma City. Thus, among the 10 fastest-growing major metropolitan areas, nine were in the South and one (Denver) was in the West (Table 2).


Table 2
Major Metropolitan Area Population: 2010, 2012 & 2013
Metropolitan Areas2010201220132010-132012-13
Atlanta, GA      5,304,197       5,454,429       5,522,942 4.12%1.26%
Austin, TX      1,727,784       1,835,110       1,883,051 8.99%2.61%
Baltimore, MD      2,715,312       2,753,922       2,770,738 2.04%0.61%
Birmingham, AL      1,129,096       1,134,915       1,140,300 0.99%0.47%
Boston, MA-NH      4,564,054       4,642,095       4,684,299 2.63%0.91%
Buffalo, NY      1,135,314       1,133,767       1,134,115 -0.11%0.03%
Charlotte, NC-SC      2,223,635       2,294,990       2,335,358 5.02%1.76%
Chicago, IL-IN-WI      9,470,335       9,514,059       9,537,289 0.71%0.24%
Cincinnati, OH-KY-IN      2,117,344       2,129,309       2,137,406 0.95%0.38%
Cleveland, OH      2,075,690       2,064,739       2,064,725 -0.53%0.00%
Columbus, OH      1,906,243       1,944,937       1,967,066 3.19%1.14%
Dallas-Fort Worth, TX      6,452,758       6,702,801       6,810,913 5.55%1.61%
Denver, CO      2,553,829       2,646,694       2,697,476 5.62%1.92%
Detroit,  MI      4,291,400       4,292,832       4,294,983 0.08%0.05%
Grand Rapids, MI         989,196       1,005,493       1,016,603 2.77%1.10%
Hartford, CT      1,214,014       1,214,503       1,215,211 0.10%0.06%
Houston, TX      5,948,689       6,175,466       6,313,158 6.13%2.23%
Indianapolis. IN      1,892,323       1,929,207       1,953,961 3.26%1.28%
Jacksonville, FL      1,349,095       1,378,040       1,394,624 3.37%1.20%
Kansas City, MO-KS      2,013,691       2,038,690       2,054,473 2.03%0.77%
Las Vegas, NV      1,953,106       1,997,659       2,027,868 3.83%1.51%
Los Angeles, CA    12,844,070     13,037,045     13,131,431 2.24%0.72%
Louisville, KY-IN      1,237,851       1,251,538       1,262,261 1.97%0.86%
Memphis, TN-MS-AR      1,326,595       1,340,739       1,341,746 1.14%0.08%
Miami, FL      5,581,524       5,763,282       5,828,191 4.42%1.13%
Milwaukee,WI      1,556,549       1,566,182       1,569,659 0.84%0.22%
Minneapolis-St. Paul, MN-WI      3,355,167       3,422,417       3,459,146 3.10%1.07%
Nashville, TN      1,675,945       1,726,759       1,757,912 4.89%1.80%
New Orleans. LA      1,195,757       1,227,656       1,240,977 3.78%1.09%
New York, NY-NJ-PA    19,596,183     19,837,753     19,949,502 1.80%0.56%
Oklahoma City, OK      1,257,883       1,297,397       1,319,677 4.91%1.72%
Orlando, FL      2,139,372       2,223,456       2,267,846 6.01%2.00%
Philadelphia, PA-NJ-DE-MD      5,971,397       6,019,533       6,034,678 1.06%0.25%
Phoenix, AZ      4,208,770       4,327,632       4,398,762 4.51%1.64%
Pittsburgh, PA      2,356,658       2,360,989       2,360,867 0.18%-0.01%
Portland, OR-WA      2,232,177       2,289,038       2,314,554 3.69%1.11%
Providence, RI-MA      1,601,798       1,601,160       1,604,291 0.16%0.20%
Raleigh, NC      1,137,351       1,188,504       1,214,516 6.78%2.19%
Richmond, VA      1,210,015       1,232,954       1,245,764 2.95%1.04%
Riverside-San Bernardino, CA      4,244,089       4,342,332       4,380,878 3.22%0.89%
Rochester, NY      1,080,081       1,082,375       1,083,278 0.30%0.08%
Sacramento, CA      2,154,417       2,193,927       2,215,770 2.85%1.00%
St. Louis,, MO-IL      2,789,893       2,796,506       2,801,056 0.40%0.16%
Salt Lake City, UT      1,091,452       1,123,943       1,140,483 4.49%1.47%
San Antonio, TX      2,153,288       2,234,494       2,277,550 5.77%1.93%
San Diego, CA      3,104,182       3,176,138       3,211,252 3.45%1.11%
San Francisco-Oakland, CA      4,344,584       4,454,159       4,516,276 3.95%1.39%
San Jose, CA      1,842,076       1,892,894       1,919,641 4.21%1.41%
Seattle, WA      3,448,425       3,552,591       3,610,105 4.69%1.62%
Tampa-St. Petersburg, FL      2,788,961       2,845,178       2,870,569 2.93%0.89%
Virginia Beach-Norfolk, VA-NC      1,680,120       1,698,410       1,707,369 1.62%0.53%
Washington, DC-VA-MD-WV      5,664,789       5,862,594       5,949,859 5.03%1.49%
Major Metropolitan Areas  169,898,524   173,253,232   174,942,425 2.97%0.97%
From Census Bureau Data


Domestic Migration

Net domestic migration is, not surprisingly, dominated by the major metropolitan areas of the South, especially Texas and Florida. Dallas-Fort Worth and Houston led the nation with more than 100,000 net domestic migrants (Figure $$$). Austin placed third in San Antonio was sixth. Charlotte ranked seventh, while the Florida entries Orlando stood at eighth and Tampa-St. Petersburg at 10th. The West had three big domestic migration lures, Phoenix (4th), Denver (5th), and Seattle (9th).

Austin also led in the percentage of net domestic migration gain relative to its 2010 population. Again, nine of the top gainers were in the South, with one entry from the West, Denver (Figure 2).

The largest net domestic migration losses were more dispersed across the country, with metropolitan areas from every region represented. New York lost the most net domestic migrants (more than 300,000) and was joined by Philadelphia, Hartford, and Providence from the East. Chicago lost the second most domestic migrants (more than 150,000) and was joined by Detroit, St. Louis and Cleveland from the Midwest. Los Angeles ranked third in the bottom 10, losing more than 100,000 net domestic migrants, the only western metropolitan area to suffer a significant migration loss. The South's only representative in the bottom 10 was Virginia Beach-Norfolk (Figure 3).


Table 3
Major Metropolitan Area Net Migration: 2010 to 2013
Metropolitan AreasNet Domestic MigrationChange Relative to 2010 PopulationNet International MigrationChange Relative to 2010 Population
Atlanta, GA     44,433 0.84%        49,375 0.93%
Austin, TX     87,189 5.05%        15,685 0.91%
Baltimore, MD         (121)0.00%        24,366 0.90%
Birmingham, AL      (2,918)-0.26%          3,585 0.32%
Boston, MA-NH          101 0.00%        70,356 1.54%
Buffalo, NY      (7,774)-0.68%          7,341 0.65%
Charlotte, NC-SC     56,478 2.54%        14,590 0.66%
Chicago, IL-IN-WI  (161,558)-1.71%        69,041 0.73%
Cincinnati, OH-KY-IN    (16,893)-0.80%          9,703 0.46%
Cleveland, OH    (28,780)-1.39%        10,837 0.52%
Columbus, OH     11,425 0.60%        13,752 0.72%
Dallas-Fort Worth, TX   127,315 1.97%        57,403 0.89%
Denver, CO     70,668 2.77%        14,160 0.55%
Detroit,  MI    (58,343)-1.36%        30,281 0.71%
Grand Rapids, MI       4,594 0.46%          3,290 0.33%
Hartford, CT    (18,979)-1.56%        15,206 1.25%
Houston, TX   116,956 1.97%        74,817 1.26%
Indianapolis. IN     13,698 0.72%        12,031 0.64%
Jacksonville, FL     16,932 1.26%          9,760 0.72%
Kansas City, MO-KS      (3,738)-0.19%          9,162 0.45%
Las Vegas, NV     17,419 0.89%        19,041 0.97%
Los Angeles, CA  (125,037)-0.97%      145,101 1.13%
Louisville, KY-IN       4,874 0.39%          6,530 0.53%
Memphis, TN-MS-AR    (13,723)-1.03%          4,868 0.37%
Miami, FL     31,750 0.57%      152,998 2.74%
Milwaukee,WI    (14,282)-0.92%          6,547 0.42%
Minneapolis-St. Paul, MN-WI       2,664 0.08%        30,341 0.90%
Nashville, TN     42,090 2.51%        10,201 0.61%
New Orleans. LA     20,721 1.73%          8,727 0.73%
New York, NY-NJ-PA  (336,566)-1.72%      372,651 1.90%
Oklahoma City, OK     30,086 2.39%          6,759 0.54%
Orlando, FL     49,244 2.30%        43,230 2.02%
Philadelphia, PA-NJ-DE-MD    (49,564)-0.83%        51,244 0.86%
Phoenix, AZ     72,985 1.73%        24,885 0.59%
Pittsburgh, PA       7,564 0.32%          8,129 0.34%
Portland, OR-WA     30,244 1.35%        15,350 0.69%
Providence, RI-MA    (17,253)-1.08%        13,365 0.83%
Raleigh, NC     38,088 3.35%        10,875 0.96%
Richmond, VA     10,777 0.89%          9,542 0.79%
Riverside-San Bernardino, CA     18,321 0.43%        14,997 0.35%
Rochester, NY    (11,558)-1.07%          7,607 0.70%
Sacramento, CA       6,922 0.32%        17,662 0.82%
St. Louis,, MO-IL    (28,809)-1.03%        11,556 0.41%
Salt Lake City, UT       3,367 0.31%          7,560 0.69%
San Antonio, TX     63,391 2.94%        10,778 0.50%
San Diego, CA          455 0.01%        35,199 1.13%
San Francisco-Oakland, CA     37,157 0.86%        68,510 1.58%
San Jose, CA      (6,245)-0.34%        41,207 2.24%
Seattle, WA     45,188 1.31%        50,351 1.46%
Tampa-St. Petersburg, FL     45,071 1.62%        28,621 1.03%
Virginia Beach-Norfolk, VA-NC    (17,944)-1.07%        15,650 0.93%
Washington, DC-VA-MD-WV     32,749 0.58%      107,875 1.90%
Total   240,831 0.14%   1,872,698 1.10%
From Census Bureau Data


Migration Gains in the Suburbs, Losses in the Core

This year was notable for the virtual absence of the customary "return to the city" stories. In recent years, historical core municipalities have done better in population growth than in the past. In previous decades, some lost large amounts of their population. However, an improving urban environment, not least because of better crime control, has led to something of a residential resurgence, especially in the immediate area of downtowns, though inner core populations (within five miles of City Hall) have continue to decline (see Flocking Elsewhere: The Downtown Growth Story).

Specious claims of a net suburban movement to the cores have been refuted by the domestic migration data. Net domestic migration is reported by the Census Bureau only at the county level. Thus, any analysis of domestic migration between the cores and the suburbs must be county-based. During the Great Recession, domestic migration declined substantially, as is to be expected when the economy is depressed.

Yet, in each of the three years of this decade, suburban counties have experienced net domestic migration gains and in each year have substantially led the core counties. In only one year, 2012, was there a net domestic migration gain in the core counties. The most recent 2013 data shows that core counties experienced a 70,000 net domestic migration loss, while the suburban counties gained 163,000 net domestic migrants. This difference of 233,000 was approximately four times the demographic gains made by the suburbs in both of the previous years Figure 4).

Returning to Normalcy?

With the economy still depressed, it would be premature to declare that the more typical results of the last year presage a return to normalcy. Any such reliable judgment must await restoration of broad-based, job and salary driven – as opposed to asset-based– economic growth. However, the trends of the last year indicate more than anything that the basic patterns of at least the past quarter century – with higher suburban growth and a shift towards the South – to be reasserting themelves.

Wendell Cox is principal of Demographia, an international public policy and demographics firm. He is co-author of the "Demographia International Housing Affordability Survey" and author of "Demographia World Urban Areas" and "War on the Dream: How Anti-Sprawl Policy Threatens the Quality of Life." He was appointed to three terms on the Los Angeles County Transportation Commission, where he served with the leading city and county leadership as the only non-elected member. He was appointed to the Amtrak Reform Council to fill the unexpired term of Governor Christine Todd Whitman and has served as a visiting professor at the Conservatoire National des Arts et Metiers, a national university in Paris.

Photo: Downtown Houston (by author)

Leadership and the Challenge of Making a City Visible

0
0

Cities of varying sizes struggle with two related, but seemingly opposing, global and local forces. At one level, every city would like to benefit from the global flow of capital and the emerging landscapes of prosperity seen in “other” places. At another level, to be a recipient of such attention, a city has to offer something more than cheaper real estate and tax benefits.

What cities need is a sense of uniqueness; something that separates them from other cities. Without uniqueness, a city can easily be made invisible in a world of cities. In other words, without defining the “local,” there is no “global.” Here is where identifying a coherent message about a place, based on its identity, becomes crucial. One of the major challenges facing many cities, small and large, is how to make themselves visible, and how to identify, activate, and communicate their place identity – their brand – through actions.

The challenge of urban branding is that cities are not commodities. As such, urban branding is not the same as product or corporate-style branding. Cities are much more complex and contain multiple identity narratives; whatever the business and leadership says, there are other local voices that may challenge the accepted “script”. In fact, while city marketing may focus mainly on attracting capital through economic development and tourism, urban branding needs to move beyond the simply utilitarian, and consider   memories, urban experiences, and quality of life issues that affect those who live in a city. A brand does not exist outside the reality of a city. It is not an imported idea. It is an internally generated identity, rooted in the history and assets of a city.

Catchy phrases, logos, shiny booklets, invented cultural events, or the latest urban design schemes are not the answer. Copying tactics from other cities won't make a city recognizable; it will make it less visible and less unique. The challenge is, then, to ask what assets a city has that others do not possess; which of these assets can be seen as a city’s mark of achievement or recognizable characteristics; and how does one activate, elevate and sustain those characteristics?

This search necessarily starts with residents, who are best suited to answer the first question. And who can respond to the second question better than the collective leadership of a city, including its public and private sectors? Leadership needs to be inclusive of all stakeholder groups, as should the voice of the residents, which must include gender, race, class, and age differences.

At every step of the way, from collecting the diverse narratives to formulating and activating a brand, leadership and inclusive governance play central roles. But who are the leaders? As Robin Hambleton suggested at a recent Urban Studies Lecture at University of Washington Tacoma, leadership does not exclusively translate to political leaders, and governance is not the same as government. He identified four categories of leaders: political, managerial/professional, community, and business. He was careful to distinguish between predatory businesses that are typically place-less and care little about the future of a city, and producer businesses that are typically rooted and place-bound. His fourth category of leaders came from the latter and not the former group of businesses.

Based on his international observation of various cities, many of which suffered a post-industrial condition (e.g. Malmo, Sweden and Melbourne, Australia) the convergence and collaboration of the four leadership categories created an innovation zone that allowed them to turn their cities around and adopt a way forward. The example of Freiburg in Germany, a city of slightly larger than 200,000 residents, is instructive. With the persistence of the Green political party, the mayor, community activists and an imaginative public servant (the Director of Planning and Building), Freiburg was able to enact a particular vision that elevated its status regionally, nationally and internationally. The city is recognized today as a leading European ‘eco-city;’ its history, geography and natural settings at the edge of the Black Forest in Germany allow Freiburg to incorporate this brand with ease. The four categories of leadership converged on this issue and their innovation paid off.

The challenge before most post-industrial and mid-size cities is as follows: who are the leaders within each of these four sectors who can help convene, identify, and activate an urban brand, befitting of this urban region? Are these categories equally powerful? Do political and community leaders carry the same clout as the business and the managerial class? Most mid-size cities typically lack predatory businesses, but who are the producer businesses? More importantly, who are the leaders from that sector that could play an active role in the branding process? Is the leadership balance-sheet lopsided in favor of the managerial/professional class? With limited budget, can they carry forward a bold plan that could make this city visible?

To make a city visible takes more than a logo. The future of a city region depends on a diversity of political, managerial, community and business leaders who will participate and sustain a process that will lead to an inclusively created brand, followed by actions that embrace it. Cities without articulated identities will remain invisible, lamenting at every historical turn the loss of yet another opportunity to be like their more successful neighbors.

Ali Modarres is the Director of Urban Studies at University of Washington Tacoma.  He is a geographer and landscape architect, specializing in urban planning and policy. He has written extensively about social geography, transportation planning, and urban development issues in American cities.

Photo by Lynn Friedman

America's New Brainpower Cities

0
0

Brainpower rankings usually identify the usual suspects: college towns like Boston, Washington, D.C.,  and the San Francisco Bay area. And to be sure, these places generally have the highest per capita education levels. However, it’s worthwhile to look at the metro areas that are gaining college graduates most rapidly; this is an indicator of momentum that is likely to carry over into the future.

To determine where college graduates are settling, demographer Wendell Cox analyzed the change in the number of holders of bachelor’s degrees and above between 2007 and 2012 in the 51 metropolitan statistical areas with over a million people (all saw gains). For the most part, the fastest-growing brain hubs are in the South and Intermountain West (which excludes the states on the Pacific Coast). Some of these places are usually not associated with the highest levels of academic achievement, and for the most, they still lag the national average in college graduation rates.

But times are changing, and educated people are increasingly heading to these metro areas, notably in the South, were job growth has been robust and the cost of living is far lower than in the San Francisco Bay Area, New York or Los Angeles. This includes New Orleans, which ties for first place on our list with San Antonio. The New Orleans metro area’s population of college graduates grew by 44,000 from 2007 to 2012, a 20.3% increase, nearly double the national average of 10.9%. (The percentage of college grads in the U.S. stood at 19.4% in 2012, up from 18% in 2007.)

New Orleans’ story, of course, is unique; the jump certainly is partly due to the return of evacuees to the city after Katrina, and some scoff that the region is destined to return to its historical pattern of exporting its educated young. But right now the American Community Survey data seems to indicate otherwise, as does the decision in recent years by numerous technology, videogame and media businesses to establish operations in the metro area, including General Electric, Paris-based Gameloft and the satellite communications company Globalstar, which in 2010 moved its headquarters from Silicon Valley to Covington, a prosperous suburb of the Crescent City.

What is happening in New Orleans, where I have worked as a consultant, is unique, but it also follows a broader pattern that we see in other areas. Unable to afford to settle long-term in traditional “brain centers,” educated people are increasingly looking for places that have strong economies but also many of the cultural and natural amenities associated with the traditional meccas for the educated. With housing prices that are half to a third of Silicon Valley or San Francisco, New Orleans offered educated workers, particularly younger ones, many of the things they look for, but at an affordable cost.

“For $65,000 a year in San Francisco you get a shared apartment and no car,” says long-time New Orleans tech entrepreneur Chris Reed. ”Here, you get great restaurants and clubs, and you get to have a car and your own nice apartment. It’s a no-brainer.”

Other cities with some of the same characteristics are also winning in the race to bring in more educated workers. Nowhere is this more true than in Texas, which is home to four of the top 12 metro areas on our list. Tops is co-first place San Antonio, which had a net gain of 76,000 college-educated people since 2007, or 20.3%.

Like New Orleans, the San Antonio area has traditionally lagged behind in attracting educated people; nearly one resident in six does not have a high school diploma. But the old Texas town also has many amenities that appeal to educated workers, notably great food and a good nightlife scene. In addition, it boasts one of the fastest-growing regional economies in the country, with expanding tech and energy businesses, something that may have a particular appeal in this still weak recovery.

“When the buzz starts … and hipsters start to get wise to the neighborhood assets that are here, once the hipsters get wind of it – you’ll have to beat them away with a stick,” says economic geographer Jim Russell.

Austin places third, which should come as no surprise — the area is home to the main campus of the University of Texas, boasts a thriving music scene and a strong technology infrastructure. Nor should the rapid growth of educated residents in sixth-ranked Houston, up 16% since 2007, which also enjoys low costs, an increasingly attractive cultural scene and one of the fastest growing hubs of dense urban living in the country. Dallas, also a fast-growing area, lands in 12th place on our list, boosting its college graduate population by 13%, or 175,000.

One of the more surprising metro areas in our top 10 is fifth place Louisville, Ky.-Ind. The home of Humana, it has a thriving health care sector, and also is strong in the food industry and logistics. It has seen a 16.2% increase in the number of educated residents.

Strong growth has also occurred in the Intermountain West, led by Denver (seventh) and Salt Lake City (eighth). Both areas have been beneficiaries of the migration of people and companies from California. This may also explain the growth of 11th place Phoenix, an area that has made remarkable strides since the disastrous days of the housing bust and is once again attracting migrants in larger numbers than any large metro area outside Texas.

So if these areas are leading the race to capture “talent,” who is lagging behind? Not surprising at the bottom of the list are a series of Rust Belt cities with relatively weak economies, led by last place Detroit, where the number of college-educated residents rose 4.1%. Its followed by Providence,  Cleveland and Cincinnati.

Boston, long styled as the “Athens” of America, ranks 47th on our list. Over the past five years Boston has gained some 98,000 college educated people, an increase of 7.2%, well below the national average. Beantown, of course, can always claim it has the highest “quality” brains but even in terms of percentage gains of people with graduate degrees it ranks only 41st .

The data show the universe of educated people is not becoming more “spiky” as some suggest, but is spreading out. This is true not only in terms of percentage growth, but in absolute numbers. Since 2007, for example, the Houston and Dallas metro areas have added more BAs than San Francisco-Oakland, and nearly twice as many as Boston. As a result, these and other such cities are gaining a critical mass in brainpower not widely recognized in the Eastern-dominated media.

At very least, we can say that the conventional wisdom favoring the traditional “brain” cities seems flawed. There will always be areas with more educated people per capita than others, if for no other reason than historical inertia and lack of migration, particularly among the less educated. But the clear pattern now is for brainpower, like population and jobs, to continue dispersing, largely to the South, the Southeast and the Intermountain West, with ramifications that will be felt in the economy in the decades ahead.


EDUCATIONAL ATTAINMENT: 2007-2012: CHANGE OF BA & HIGHER
 20072012Change%Rank
New Orleans. LA       172,965        216,970        44,005 20.3%1
San Antonio, TX       300,114        376,445        76,331 20.3%2
Austin, TX       382,119        477,058        94,939 19.9%3
Nashville, TN       287,154        355,630        68,476 19.3%4
Louisville, KY-IN       195,760        233,566        37,806 16.2%5
Houston, TX       972,615     1,157,627      185,012 16.0%6
Denver, CO       595,437        708,325      112,888 15.9%7
Salt Lake City, UT       193,167        229,140        35,973 15.7%8
Jacksonville, FL       221,907        258,893        36,986 14.3%9
Raleigh, NC       278,754        324,318        45,564 14.0%10
Phoenix, AZ       709,284        818,434      109,150 13.3%11
Dallas-Fort Worth, TX    1,155,069     1,330,312      175,243 13.2%12
Charlotte, NC-SC       348,923        401,116        52,193 13.0%13
Baltimore, MD       589,874        677,837        87,963 13.0%14
Rochester, NY       244,277        280,650        36,373 13.0%15
Portland, OR-WA       479,207        549,825        70,618 12.8%16
Birmingham, AL       187,094        214,201        27,107 12.7%17
Philadelphia, PA-NJ-DE-MD    1,204,380     1,377,684      173,304 12.6%18
San Diego, CA       631,996        722,819        90,823 12.6%19
Columbus, OH       367,811        419,136        51,325 12.2%20
Minneapolis-St. Paul, MN-WI       774,669        881,581      106,912 12.1%21
Washington, DC-VA-MD-WV    1,658,902     1,885,862      226,960 12.0%22
Las Vegas, NV       257,886        293,001        35,115 12.0%23
Indianapolis. IN       333,079        377,189        44,110 11.7%24
San Francisco-Oakland, CA    1,251,139     1,414,393      163,254 11.5%25
Memphis, TN-MS-AR       197,292        222,813        25,521 11.5%26
Seattle, WA       814,902        918,119      103,217 11.2%27
Oklahoma City, OK       210,720        237,329        26,609 11.2%28
St. Louis,, MO-IL       521,047        586,547        65,500 11.2%29
Pittsburgh, PA       456,717        513,838        57,121 11.1%30
San Jose, CA       527,167        592,703        65,536 11.1%31
Kansas City, MO-KS       410,109        460,391        50,282 10.9%32
Miami, FL    1,058,815     1,186,398      127,583 10.8%33
Virginia Beach-Norfolk, VA-NC       284,924        317,741        32,817 10.3%34
Buffalo, NY       207,907        231,718        23,811 10.3%35
Riverside-San Bernardino, CA       469,381        519,680        50,299 9.7%36
Richmond, VA       205,014        226,912        21,898 9.7%37
Los Angeles, CA    2,458,215     2,720,654      262,439 9.6%38
Hartford, CT       276,002        305,100        29,098 9.5%39
Chicago, IL-IN-WI    1,984,496     2,190,424      205,928 9.4%40
Tampa-St. Petersburg, FL       496,826        544,121        47,295 8.7%41
Milwaukee,WI       308,214        337,253        29,039 8.6%42
New York, NY-NJ-PA    4,433,180     4,836,321      403,141 8.3%43
Sacramento, CA       403,140        435,485        32,345 7.4%44
Atlanta, GA    1,151,723     1,243,122        91,399 7.4%45
Orlando, FL       379,636        409,263        29,627 7.2%46
Boston, MA-NH    1,271,193     1,369,597        98,404 7.2%47
Cincinnati, OH-KY-IN       393,076        419,714        26,638 6.3%48
Cleveland, OH       380,479        405,731        25,252 6.2%49
Providence, RI-MA       301,591        320,262        18,671 5.8%50
Detroit,  MI       786,153        819,347        33,194 4.1%51
Total  34,181,501   38,352,595   4,171,094 10.9%
Outside MMSAs  20,152,010   22,389,927   2,237,917 10.0%
United States  54,333,511   60,742,522   6,409,011 10.6%


Joel Kotkin is executive editor of NewGeography.com and Distinguished Presidential Fellow in Urban Futures at Chapman University, and a member of the editorial board of the Orange County Register. He is author of The City: A Global History and The Next Hundred Million: America in 2050. His most recent study, The Rise of Postfamilialism, has been widely discussed and distributed internationally. He lives in Los Angeles, CA.

Graduation image by BigStockPhoto.com.

Replicating Bourbon Street

0
0

Editor’s note: following is an excerpt from Tulane University geographer Richard Campanella’s new book, “Bourbon Street: A History” (LSU Press, 2014), which traces New Orleans’ most famous and infamous space from its obscure colonial origins to its widespread reknown today. This chapter, titled “Replicating Bourbon Street: Spatial and Linguistic Diffusion” and drawn from a section called “Bourbon Street as a Social Artifact,” recounts how this brand has spread worldwide and become part of the language—to both the benefit and chagrin of New Orleans.

Perhaps the best evidence of Bourbon Street’s success is the fact that, like jazz, it has diffused worldwide. It’s a claim few other streets can make. As early as the 1950s, a nightclub named “Bourbon Street” operated in New York City, and apparently successfully, because in 1957 the Dupont family formed a corporation to purchase it with plans to bring “Mambo City” entertainment to clubs named Bourbon Street in Miami and Chicago.1 Today, at least 160 businesses throughout the United States and Canada have “Bourbon Street” in their names and themes; 77 percent are restaurants, bars, and clubs; 11 percent are retailers (mostly of party and novelty items); and the remainder are caterers, banquet halls, hotels, and casinos—more eating, drinking, and entertaining. They span coast to coast, from Key West to Edmonton and from San Diego to Montreal. Greater New York has eleven, while Calgary has six, as does San Antonio (mostly near the River Walk, “the Bourbon Street of San Antonio”). Greater Toronto has sixteen, most of them franchises of the Innovated Restaurant Group’s “Bourbon St. Grill” chain—including one on Yonge Street, which has been described as “the Bourbon Street of Toronto.” There are also Bourbon-named restaurants, bars, and clubs in London, Amsterdam, Hamburg, Naples, Moscow, Tokyo, Shanghai, Dubai, and many other world cities. These replicas enthusiastically embrace Bourbon Street imagery and material culture (lampposts, balconies, Mardi Gras jesters, beads) in their signage, décor, and Web sites. Menus attempt to deliver the spice and zest deemed intrinsic to this perceptual package, as does the atmospheric music. How convincingly do these meta-Bourbons replicate the original? A review of one such venue in Amsterdam (“the New Orleans of Europe”) could easily apply to the actual street:

[T]he jovial Bourbon Street Jazz and Blues Club…attracts a casual, jean-clad crowd of all ages [dancing to] cover bands with a pop flavor [or] blues rhythms. Three glass chandeliers hanging over the bar provide an incongruous dash of glamour to an otherwise low-key and comfortable scruffy décor.2

In this spatial dissemination we see a trend: while local replication of the Bourbon Street phenomenon usually takes the form of competition tinged with contempt (witness the “anti-Bourbons”), external replicas of Bourbon Street view themselves as payers of homage to the “authentic” original, and modestly present themselves as the next best thing without the airfare. No licenses are needed in replicating Bourbon Street; there are no copyrights, trademarks, or royalties due. The name, phenomenon, and imagery are all in the public domain, a valuable vernacular brand free for anyone to appropriate. Try doing that to The New Orleans Jazz and Heritage Festival Presented by Shell and you’d have a lawsuit on your hands.

Bourbon is also among the few streets to be replicated structurally—by the State of Louisiana, which sponsored a three-acre exhibit at the 1964 World’s Fair in Queens, New York. It featured all the standard architectural tropes of the French Quarter topped off with a huge arch emblazoned LOUISIANA’S BOURBON STREET accompanied by towering Carnival royalty. In typical Louisiana fair tradition, however, the exhibit experienced construction delays and filed for bankruptcy, which caused the state to wash its hands of the fiasco and officially change the name of the exhibit to “Bourbon Street.” “The so-called Louisiana area in its present condition,” state officials solemnly proclaimed, “reflects discredit upon the State of Louisiana, its culture, heritage and people.” Wags pointed out that this was pretty much what locals thought of the original Bourbon Street. But unlike the original, a corporate entity named Pavilion Properties, Inc. took over the exhibit, and after removing all references to Louisiana and spiffing up the props, it managed the Creole food booths, Dixieland trios, sketch artists, organ grinders, street performers, and nightclubs (including the popular “Gay New Orleans”) for the remainder of the fair. Also unlike the original, Pavilion Properties’ exhibit, just like the state’s attempt, failed commercially and also filed for bankruptcy. Nevertheless, it introduced a generation of New Yorkers to the Bourbon Street brand.3

At the opposite end of the country two years later, another private-sector entity built a “New Orleans Square” at Disneyland. Based on field research conducted in the French Quarter by Walt Disney himself plus a staff of artists in 1965, the $13.5 million West Coast replica (nearly the cost of the Louisiana Purchase, Disney joked) eschewed the Bourbon moniker, presumably not to scare off parents, but nevertheless incorporated everything that worked on the real Bourbon Street minus the breasts and booze. Disney later replicated New Orleans Square at its Adventureland in Tokyo (1983), which may partly explain the popularity of the real New Orleans with Japanese visitors today. It did not, however, build a New Orleans Square at Disneyland Paris (Euro Disney) when it opened in 1992.4

Bourbon Street has also been thematically and structurally referenced in countless shopping malls, amusement parks, casinos, cruise ship parties, festivals, convention banquets, and wedding receptions, not to mention on film and theatrical sets and in computer animation for movies like The Princess and the Frog. “Bourbon Street” as an adjective has found its way onto menus, usually for spicy dishes, and into household décor, generally to describe old-world filigree inspired by the iron-lace balconies. It’s a case study of cultural diffusion which serves as free worldwide advertising for the original, across various media forms and demographic cohorts, all with zero encouragement and oversight from Bourbonites. Now that’s success.

Imitation may be the sincerest form of flattery, but it also produces competition. Once there was a time when the forbidden pleasures available on Bourbon Street were in high demand and low supply nationwide, particularly in the South. That made Bourbon Street valuable. Today the nation is a whole lot less judgmental about pleasure and much better supplied with comparable pleasure districts. A visit to Galveston’s The Strand, St. Louis’ Soulard, and Mobile’s Dauphine Street, all of which have adopted Bourbon-style Mardi Gras, may satisfy many people’s desire for the escapism that Bourbon Street once monopolized. Even just a few blocks away in downtown New Orleans, Harrah’s has quietly overseen the creation of a Bourbon alternative on the Fulton Street Mall, complete with outdoor dining, festival space, and a growing inventory of venues, all adjacent to the corporation’s hotel and casino. Might such meta-Bourbons erode the market share of the original, in the same way that regional casinos have chipped away at Las Vegas’ domination? Bourbonites would be ill-advised to rely on their fame; better to experiment with innovations, rediscover what worked in the past, and tame that which damages. That said, The Street does have certain inherent advantages: it’s bigger and longer than the competition; it’s embedded into the world-famous French Quarter and enjoys a symbiotic relationship with its tourism industry; and perhaps most importantly, it boasts that intimate historical streetscape and centuries-old civic reputation that infuses in visitors a certain credibility—shall we call it authenticity?—in a way unmatched by places like Las Vegas. On a dark note, Bourbon is also disturbingly vulnerable to accidental or intentional trauma, such as a balcony collapse, crowd stampede, or terrorist bombing, which, in addition to the human toll, could poison The Street’s allure for years. Bourbon, in short, has bright prospects and a record of widespread economic and cultural influence, but should not take its fame and success for granted.

Speaking of cultural influence, Bourbon Street has entered the language of American English, which, curiously, does not have a perfect word for the Bourbon Street phenomenon. Shall we call it an adult entertainment area? A cluster? A strip? A pedestrian mall? A tenderloin, red-light, or vice district? All are awkward, some are imprecise, and none are perfect. The linguistic lacuna is particularly perplexing because nearly every city since Sybaris has developed such spaces.

To fill the gap, some speakers convert common nouns into proper toponyms; examples include Las Vegas’ The Strip, Baltimore’s The Block, and historic New Orleans’ The Swamp or The Line. Others craft “antonamasias,” which, in rhetoric, are attempts to describe the characteristics of a new phenomenon by invoking the name of a comparable known entity, e.g., “the Paris of…,” “the Barbary Coast of…,” “the Greenwich Village of….”5 The antonamasia “the Bourbon Street of….” is among the most popular ways for Americans to refer efficiently and effectively to pedestrian-scale drinking, eating, and entertainment districts. It’s exceedingly common to hear 6th Street, for example, described as the Bourbon Street of Austin. Ybor City is routinely characterized as the Bourbon Street of Tampa, as is Carson Street of Pittsburgh, and Duval Street of Key West (or of the entire Caribbean). Beale Street was completely redeveloped by a real estate corporation in the 1980s from a boarded-up eyesore to become, inevitably, the Bourbon Street of Memphis. A review of 67 published articles since 1986, plus over 300 Internet sources, showed that at least eighty social spaces worldwide have been described as “the Bourbon Street of” their respective communities. They span from Hamburg’s Reeperbahn to Bangkok’s Patpong; from Spain’s Pamplona during the Running of the Bulls to Las Ramblas in Barcelona, from Quay Street in Galway to Lan Kwai Fong in Hong Kong. They are not always urban; sometimes the phrase it used for frisky beaches at vacation destinations, for boating coves (most notoriously in Lake of the Ozarks, a popular rendezvous for nudity and inebriation), or the Mall of America in Minneapolis, the entire town of Hyannis (“the Bourbon Street of the Cape”) or the city of Ogden (“the Bourbon Street of Utah,” historically). Some use it as a warning (“Let’s not turn the Underground into the Bourbon Street of Atlanta”) or as an ambition (“the big goal is for the Mill Avenue District to become the Bourbon Street of the Southwest”). The phrase even found a home in its own backyard; a travel writer called “Jackson Square…the Bourbon Street of daytime New Orleans,” and the Times-Picayune dubbed the Fulton Street Mall as “the Bourbon Street of the [1984] world’s fair.” Some uses emphasize the spatial clustering over the piquant aspect (“Canyon Road [is] the Bourbon Street of Santa Fe’s art scene”); others do the exact opposite: “USA Network [is] the Bourbon Street of basic cable;” “Louisiana Fried Chicken [is] the Bourbon Street of chicken.”6

One would be hard-pressed to think of another street so richly representational. The very matriculation of a street to metaphor status is fairly rare. To be sure, we speak of Wall Street to mean corporate power, Madison Avenue to mean marketing, and Broadway for theater, but as we go further down the list, we find fewer linguistic uses and users. Bourbon Street is one of the American English language’s handiest and most evocative place metaphors, a testament to The Street’s widespread renown and iconic resonance.

Richard Campanella, a geographer with the Tulane School of Architecture, is the author of Bienville’s Dilemma, Geographies of New Orleans, Lincoln in New Orleans, and Bourbon Street: A History (LSU Press, 2014), from which this article was excerpted. Please see the book for sources. Campanella may be reached through http://richcampanella.com or rcampane@tulane.edu ; and followed on Twitter at @nolacampanella.

1 “Dupont Dough Backs Murphy,” Billboard, December 2, 1957, p. 19.

2 Corinne LaBalme, “Night Moves of All Kinds: The Club Scene in Seven Cities—Amsterdam,” The New York Times, September 17, 2000.

3 Francis Stilley, “Visitors to World’s Fair Will ‘Ride Magic Carpet,’ Times-Picayune, April 15, 1964; “Hot Flashes,” Times-Picayune, May 31, 1964, p. 37; Charles M. Hargroder, “Governor, Firm Announce Plant,” Times-Picayune, June 17, 1964, pp. 1-16; Richard Phalon, “Bourbon Street Operator at Fair Is 11th Bankrupt Exhibitor,” New York Times, February 5, 1965, p. 32.

4 “Disneyland N.O. Replica, Aim,” Times-Picayune, April 11, 1965, p. 17.

5 I thank sociolinguist Christina Schoux Casey for informing me of this obscure but useful term.

6 Research by author using hundreds of news and online sources, 1986-present, searched throughout 2012.

Concentrated Wealth or Democracy, but Not Both

0
0

In many uncomfortable ways, American politics now resemble those that arose late in the Roman Republic. As wealth and land ownership concentrated in few hands, a state built on the discipline of soldiers who tended their own farms became ever more dominated by fractious oligarchs. As property consolidated into huge slave-owning estates, more citizens became landless and ever more dependent on the patronage of the rich generals and landowners who increasingly seized control of politics.

In much the same way, as the wealth has concentrated in America, so, too, has the power exercised by those with money. The wealthy have always played an outsized role in our politics, but today, emboldened by Supreme Court rulings easing controls on contributions, oligarchs are dominating the electoral map in ways that have not been seen at least since the abuses of the Nixon years.

Perhaps the most notable, or infamous, example is the Koch brothers, David and Charles, billionaire industrialists whose role in conservative politics has made them the ultimate “bogeymen” for crusading liberal journalists concerned with the growing power of the ultrarich on our political system. Campaigning against the Kochs has become standard issue for Democrats such as Senate Majority Leader Harry Reid.

What makes the Koch brothers such great targets is that they come from an industry – energy – that itself is held in the lowest esteem by the progressive activist community and its media allies. Although they tend to be libertarian in their social views, the Kochs are notably, and not surprisingly, skeptical about climate change policies that might impact their vast oil and gas holdings as well as their industrial companies, which, in the words of former New York Times columnist Frank Rich, “spew” such unhappy products as Lycra and Dixie cups. The Kochs’ ties to the Tea Party have led reliably liberal commentators to suggest that the moguls have played the supposedly grass-roots Tea Party for “suckers.”

As they rail against the Kochs, few progressives note that the balance of oligarchic politics are increasingly shifting toward the Democratic Party. This, of course, includes the predictable Hollywood figures, such as Dreamworks’ Jeffrey Katzenberg and a large section of Wall Street, notably financier George Soros, long a major source of funding for President Obama.

These well-heeled progressives have had little to fear from an administration that, despite its occasional populist outbursts, has adopted an economic policy that has exacerbated an already yawning gap in income growth between the wealthy and everyone else. Indeed, Obama, for all his populist rhetoric, retained close ties to firms like Goldman Sachs, staffing his administration with people from, and associated with, that most-detested of Wall Street firms. Indeed the ultrarich so backed the ostensibly left-wing president that, at his first inaugural, notes sympathetic chronicler David Callahan, the biggest problem for donors was finding sufficient parking space for their private jets.

An examination of campaign contributions shows that the vast majority of America’s wealthiest households may already tilt in this direction. Among the .01 percent who increasingly dominate political giving, three of the largest contributions, besides the conservative Club for Growth, backed by Republican oligarchs, went to groups such as Emily’s List, Act Blue and Moveon.org. Liberal groups accounted for eight of the top 10 ideological causes of the ultra-rich; seven of the 10 congressional candidates most dependent on their money were Democrats.

This ideological shift among the rich, particularly the new rich, in what author Chrystia Freeland has dubbed an “age of elites,” is critical to understanding contemporary political conflict. There have always been, of course, affluent individuals who backed liberal or Democratic causes, out of a mixture of philosophy and self-interest but, for the most part, the wealthy backed Republicans. This has begun to change.

Perhaps most ominous for the Right, the biggest growth in oligarchic politics has been from the very group – the so-called “high tech community” – that has flourished under the current easy-money regime. Once primarily middle-of-the-road Republican, the tech oligarchs have moved “left” in their politics, particularly on social and environmental issues. Many also have profited, or attempt to, through “green” energy investments. The leading tech companies, mostly based in the Silicon Valley, routinely send over four-fifths of their contributions to Democratic candidates.

For the political parties, which are losing influence with every election, the rise of the oligarchs in politics represents a mixed blessing. To be sure, the tens of millions poured into the coffers of party candidates is welcomed, but at the same time, the oligarchs have become so powerful that they have altered, likely for a long time, the nominating and electing process.

Republicans, for example, must deal with the likes of casino billionaire Sheldon Adelson, whose millions kept the quixotic, and seemingly pointless, Newt Gingrich campaign alive in the most-recent presidential primary campaign. The Koch brothers and others have also supported the supposedly grass-roots Tea Party, whose opposition to the Republican establishment has roiled GOP politics since 2010 and ended up with the nomination of some weak candidates.

This year, it may be the Democrats’ chance to lament the rise of the oligarchs. At a time when economic growth and inequality are primary issues to most Americans, the presence of oligarchs all but guarantees that other issues – notably, environmental issues or social concerns like gay marriage – dominate the party’s fundraising. After all, it’s hard to imagine a party increasingly dependent on the wealthy seriously advocating, for example, for the equalization of capital gains and regular income taxes.

Nobody better epitomizes the rise of economic royalist politics in the Democratic Party than San Francisco-based hedge-fund billionaire and green-energy investor Tom Steyer. Steyer has pledged to work against any Democrat who dares express the slightest skepticism about the need to diminish use of fossil fuels, no matter the economic cost. This could prove particularly tough on Democrats from energy states, like Louisiana, Texas, the Dakotas, Colorado and Montana, who historically have supported the fossil fuel industry as a prime generator of high-wage employment, including thousands of unionized blue-collar jobs.

With Steyer pledging some $100 million to his anti-oil campaign, centered on opposition to the Keystone XL pipleline, the party is running against the popular grain. According to a recent Washington Post poll, the project is favored among the public by a margin of roughly three to one.

So, Democrats find themselves pressured to oppose something favored by a large majority, all for an issue – climate change – that barely rates as a priority among voters far more worried about their jobs and families than carbon emissions. Just as well-financed Tea Party extremists have led the Republicans to nominate some lamentable candidates, Steyer’s efforts could undermine Democratic prospects – at least outside the solid coastal precincts – by forcing party figures further toward the gentry version of the Left.

Ultimately, the biggest issue revolves not around the politics of the oligarchs but their overall potential to dominate our entire political culture. As Supreme Court Justice Louis Brandeis suggested in the last century, “We can have democracy in this country, or we can have great wealth concentrated in the hands of a few, but we can’t have both.”

The founders, too, understood this basic truth. James Madison embraced the ideal of dispersed property – “the possession of different degrees and kinds of property” – as necessary in a functioning republic. Thomas Jefferson, admitting that the “equal division of property” was “impractical,” believed “the consequences of this enormous inequality producing so much misery to the bulk of mankind” that “legislators cannot invent too many devices for subdividing property.”

It’s time we started listening to Brandeis and the founders. Until we address this issue of concentrated economic power – be it in the hands of oil barons or tech types – our politics will continue to devolve like those of Rome in the late Republic, undermining the last vestiges of citizen-based politics. Whether or not it results in the rise of an actual Caesar, this could be a sad day for what is left of our old Republic.

This story originally appeared at The Orange County Register.

Joel Kotkin is executive editor of NewGeography.com and Distinguished Presidential Fellow in Urban Futures at Chapman University, and a member of the editorial board of the Orange County Register. He is author of The City: A Global History and The Next Hundred Million: America in 2050. His most recent study, The Rise of Postfamilialism, has been widely discussed and distributed internationally. He lives in Los Angeles, CA.

Photo by Peoplesworld.

Viewing all 3770 articles
Browse latest View live


Latest Images