Quantcast
Channel: Newgeography.com - Economic, demographic, and political commentary about places
Viewing all 3793 articles
Browse latest View live

Post-Nagin, New Orleans Is On Way To Becoming A Model City

$
0
0

Last week’s conviction of former New Orleans Mayor Ray Nagin on 20 charges of bribery and fraud marks the end of a tumultuous era in the city’s history, and perhaps also the beginning of a new era in American urban politics. Perhaps most remarkable was the almost total lack of protest in New Orleans over the downfall of Nagin, who had relied heavily on polarizing racial politics in his last five years in office.

This is among the many hopeful signs in the Crescent City and its environs. Over the past year as I’ve put together a report on the future of New Orleans, I have seen a city once described by Joel Garreau in his Nine Nations of North America (1981)as a “marvelous collection of sleaziness and peeling paint,” clean up its politics, restart and diversify its economy, and begin the slow process of reducing its deep-seated crime problem.

In the past, the “pay to play” politics and corruption epitomized by Nagin and former congressman William Jefferson were widely winked at in New Orleans as if it were just local color. “We like our politics like our rice — dirty,” a Katrina evacuee in Houston once told me with a knowing smile.

Katrina changed that. The natural disaster was made far worse by the corruption and incompetence of virtually every key institution, starting with police and the levee boards. With the city largely underwater and much of its population forced to flee, some urban experts, such as Harvard’s Ed Glaeser, wondered if we would be better off to encourage people to leave the area permanently, perhaps with vouchers, to seek a better life elsewhere.

Yet it is here that the real turnaround began. Business leaders, who had seen Nagin as an ally during his first term, realized he was not up to the extraordinary challenges posed by the disaster. The man who some called “Ray Reagan” for his business-friendly policies was morphing into the worst kind of racial demagogue, a kind of bayou version of Coleman Young or Sharpe James. His appeal to keep New Orleans a “chocolate city” and his now well-documented graft frustrated those who wanted to revive the city and its surrounding region.

“When Nagin came in, he was seen as a reformer,” recalls Greg Rusovich, former chairman of the New Orleans Business Council, which includes 70 of the Crescent City’s largest businesses. “But after Katrina he really turned into a racial politician and surrounded himself with incompetents.”

This incompetence, Rusovich suggests, slowed New Orleans’ recovery as Nagin proved unable to help direct the massive federal aid, and the many private donations, that came into the city. Eventually, voters tired of poor public services and began to demand a more competent regime.

The current mayor, Mitch Landrieu, first elected in 2010 and easily re-electedwith strong black support this month, has brought a climate of technocratic competence to the city. With the active backing of business leaders, the city has attracted large-scale corporate investment, including a 300-person General Electric software development center, as well as a surge of videogame and entertainment companies.

This growth was in large part sparked by a steady movement of young, educated people into the city. For decades, New Orleans’ “best and brightest” tended to move elsewhere; now the flows for the Crescent City have turned positive, including from the West Coast and the Northeast. By last year, theAtlantic Cities, the leading mouthpiece for “hip” urbanism, proclaimed New Orleans potentially the nation’s “next great innovation hub.”

Yet for all the hoopla surrounding the growth in the information sector, it is unlikely to be enough to sustain the New Orleans region’s recovery. Not only are the total numbers of such jobs still small, in the realm of 2,600 for entertainment, STEM employment is lower than a decade ago due to cutbacks at the NASA facilities at Michoud as well as in aerospace. More important, the growth of tech and entertainment jobs will likely be insufficient to address the fundamental issues of race and poverty that have bedeviled the city throughout much of its history.

Today, in part due to the return of evacuees, the poverty rate for the metro area stands at 19%, close to the pre-Katrina level and well above the national average of 15%. The differential between white and black incomes is some $6,000 per household above the national average and some observers, including many African-Americans, fear that the gentrification of parts of the city is reinforcing the class and racial divides that existed before the flood.

Many African-Americans, notes city employee Lydia Cutrer, have “trust issues after many broken promises, and feel like outsiders are taking over.” Or, as Sherby Guillory, a health care worker who now lives in Houston, described the recovery efforts: “They want to build a shining city on a hill, but without the people.”

Ultimately, to deal with these concerns, New Orleans needs to focus on the industries that drove its economy for much of its history: energy and trade. These are the primary providers of high-wage jobs, many of which are blue collar. The New Orleans area lost energy jobs from 2007-12, in part due to the Gulf drilling moratorium in the wake of the BP disaster, but activity is rising again and low natural gas prices have prompted a surge in chemical and refinery investment in south Louisiana.

recent report by the Greater New Orleans Community Data Center concluded that over 10,000 energy, petrochemical and related advanced manufacturing jobs could be added in the region by 2020; in contrast the digital media sector was projected to expand by roughly 2,200 positions. Finding ways to accelerate this development, while using new revenues to shore up the fragile ecosystem, needs to become the primary focus of new development efforts.

This vision for post-Katrina New Orleans will no doubt meet opposition from those who would like the city to evolve into a humid, southern version of San Francisco. Yet this makes little sense for a place whose history, location and ethnic heritage suggest a more economically diverse future. Having survived Katrina and Ray Nagin, the next task should be to see how to make sure that the recovery reaches into those neighborhoods that have historically been left behind. Rather than stand only as a charming artifact of its past, New Orleans can become a role model in showing how cities can not only survive, but create a prosperous future.

Joel Kotkin is executive editor of NewGeography.com and Distinguished Presidential Fellow in Urban Futures at Chapman University, and a member of the editorial board of the Orange County Register. He is author of The City: A Global History and The Next Hundred Million: America in 2050. His most recent study, The Rise of Postfamilialism, has been widely discussed and distributed internationally. He lives in Los Angeles, CA.

New Orleans photo courtesy of Jon Sullivan.

Where New Yorkers are Moving

$
0
0

The American Community Survey has released domestic migration data that was collected over a five year period (2007 to 2011).  There is newer domestic migration data available, such as is annually provided by the Census Bureau's population estimates program, but not in the detail that the latest data provides.

The new release is significant because domestic migration data is provided between each of the nation's more than 3,100 counties. Because the survey was taken over a five-year period, the data represents, in effect, a one-fifth snapshot of domestic migration for each of the years from 2007 to 2011. Each year respondents are asked where they lived a year ago. It is thus a rolling annual figure, rather than a picture of a single year.

The Uniqueness of New York City

The city of New York provides an interesting case for many reasons. The city is by far the largest municipality in the United States and the only municipality composed of at least two complete counties. New York is coterminous with five counties. New York also has by far the greatest extent of high density in the United States, comprising more than 85 percent population of zip codes with greater than 25,000 per square mile density (10,000 per square kilometer).

Finally, New York is at the center of the largest metropolitan area in the United States, which in its expanded, combined form (combined statistical area) has a population of 23.1 million, most of which (20.7 million) is in a built-up urban area that covers the largest land area in the world (has the largest urban footprint). This is more than a third larger than Tokyo, the world's largest urban area by population, with an 80 percent higher population. It is surprising to many that New York's urban area covers nearly twice the land area of Los Angeles and is nearly one-quarter less dense.

Domestic Migration and New York City

New York's broad suburban expanse generally resembles the suburbs of Dallas-Fort Worth, Seattle or Toronto and much of its Staten Island borough (county of Richmond) looks more like suburban New Jersey than New York, most of its urban core – the city of New York – is unique.

And the city continues to export large numbers of people – 90,000 more than arrived in the rolling year represented by the latest ACS data. This is a big number, representing 1.1 percent of the city's 2010 population. This is a larger loss than Philadelphia (0.5 percent), but smaller than Washington (1.4 percent).

This has been evident in the large numbers net domestic migrants reported each year in the Census Bureau estimates. The data shows that people are leaving not only the city of New York not only for the suburbs, but moving in even greater numbers to beyond the metropolitan area. Approximately 27,000 more New Yorkers moved to the suburbs than to the city of New York over the period. However, an even larger 63,000 net domestic migrants left the city of New York for areas outside the metropolitan area.

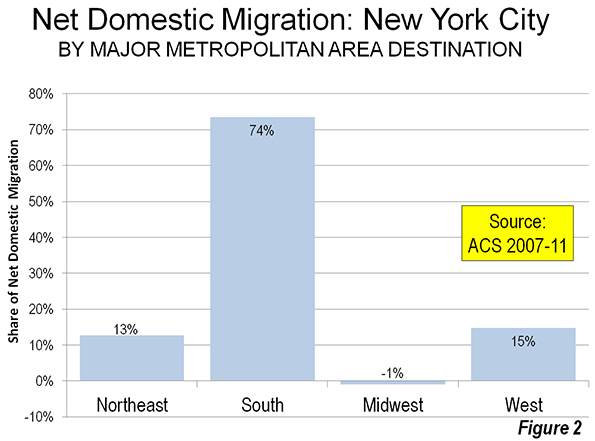
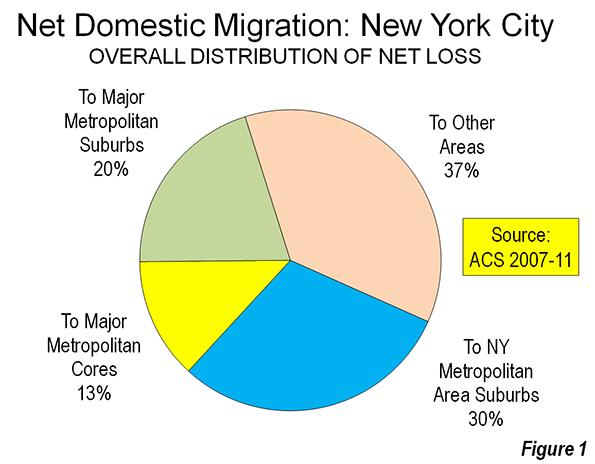
Approximately 30,000 of these inter-regional migrants moved to other major metropolitan areas (those with more than 1 million population). By far the largest share – 74 percent – of the city's net domestic migrants to other major metropolitan areas moved to the South. Four of the five largest major metropolitan gainers at the city's expense were Miami (net 5,600) and Atlanta (net 4,300), followed by Tampa-St. Petersburg, and Dallas-Fort Worth.

Another 13 percent of the city's net domestic migrants moved to other major metropolitan areas in the Northeast. Rochester was the largest gainer with nearly 1000 net domestic migrants from the city of New York, followed by Philadelphia. The city gained more than 250 residents from Boston.

Approximately 9 percent of the city’s net domestic migrants moved to major metropolitan areas in the West. Los Angeles led in the West, gaining 1,800 net migrants from the city. The outlier was the Midwest, which sent more than 300 net migrants to the city (Figure 1).

City residents tended to move to the suburbs of the major metropolitan areas, which attracted 60 percent, while the core cities received 40 percent of the net migrants.

Dispersing Beyond the Larger Metropolitan Areas

However, the most striking trend is that most of the net domestic migrants who left the city of New York to move outside the New York metropolitan area moved to areas outside the major metropolitan areas. In this regard, New Yorkers who move seem to be more inclined toward the greater dispersion of the nation's smaller metropolitan areas and micropolitan areas.

Over the period, approximately 32,500 net domestic migrants left the city for areas outside major metropolitan areas. This is more than moved to the other major metropolitan areas or to the New York metropolitan area suburbs (Figure 2).

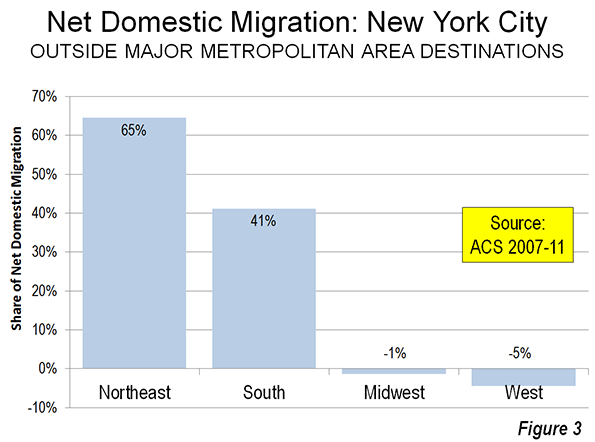
The most surprising finding is that the majority (65 percent) of net domestic migrants from the city who moved to outside the major metropolitan areas settled in the Northeast. Most of these 23,000 residents moved to smaller areas in Upstate New York and Pennsylvania. Virtually all of the other migrants not moving to major metropolitan areas moved to states in the South (41 percent). In contrast, there was a small amount of migration to New York from the West and Midwest totaling less than 2,000 (Figure 3).

Outside New York and New Jersey, which contain nearly all of the New York metropolitan area, Florida received the largest number of net migrants from the city (11,000), followed by Pennsylvania (8,000). Only 100 of the Pennsylvania migrants were to Pike County, which is in the New York metropolitan area. Georgia, Texas and North Carolina all received approximately 5,000 net migrants from the city. The top ten destinations were rounded out by Virginia, Connecticut and South Carolina. A total of 37 states received net domestic migrants from the city. Only Alaska and the District of Columbia sent more than 1,000 net domestic migrants to New York City.

Conclusion

The New York City migration data indicates continuing dispersion of the population. People are moving from the core to the periphery in New York, and many going beyond to less urban areas in the Northeast. More are moving to other major metropolitan and other smaller areas, located for the most part in the South. This year's brutal winter could make the South look even better to New Yorkers.

Wendell Cox is a Visiting Professor, Conservatoire National des Arts et Metiers, Paris and the author of “War on the Dream: How Anti-Sprawl Policy Threatens the Quality of Life.

Photo: Leaving New York City via the Holland Tunnel (by author)

The Sea of Japan: Wading Into the Name-Game Waters

$
0
0

Call it 'Nomenclature Nationalism', or 'The Tyranny of Also Known As'. The Virginia state legislature ventured into unfamiliar foreign policy waters earlier this month when it passed a law that requires school text book publishers to add six little words in reference to the body of water usually known as the Sea of Japan: “also known as the East Sea”. New York and New Jersey have now also placed the item on their state agendas. The moves reflect a trend: Geographic nomenclature is becoming a frontline in nationalism, particularly in Asia.

The legislation in Virginia would seem to be a rather small bore triumph of South Korean sentiments, and organization by Korean voters in local U.S. elections. But it is being treated as a major victory in Seoul, and as a defeat for Japan, which went out of its way to try to forestall the legislation, even hinting that the language might jeopardize Japanese investment in the state.

For the past twenty years, South Korea has been laboring mightily to persuade the rest of the world to use its designation for the body of water that separates it from Japan, or, if not, to at least acknowledge an alternative designation.

Until recently, those efforts have not met with much success. In 2012, South Korea officially asked the International Hydrographic Organization to use the term 'East Sea' for the Sea of Japan. It turned down the request after Washington officially advised the organization against it.

The U.S. Board of Geographic Names, which guides the government on nomenclature issues, also uses Sea of Japan alone, and China and Russia, two countries contiguous to the waters, use variations of the words Sea of Japan in their own languages. The Google Maps search bar brings up 'also known as the East Sea' in Sea of Japan searches, but designates the waters as Sea of Japan on its map.

The number of “also known as…” constructions are proliferating in Asia, clogging up prose and imposing a kind of political correctness on international publications. When writing about Asian issues, journalists and other writers now routinely struggle to appear even-handed.

It has become, of course, common place to now refer to the uninhabited rocks in the East China Sea — the area that is bringing China and Japan closer to war — as 'Senkaku, also known as Diaoyu'. Never mind that the English language publications in China, such as South China Morning Post, don’t bother with such even-handedness, simply calling them 'the Diaoyu'.

Similarly, the disputed islands in the Sea of Japan are usually described as 'Dokdo, also known as Takeshima', though there is, in this case, a third neutral term. The U.S. officially calls them the Lioncourt Rocks, after the French vessel that “discovered” them.

How far down this road must we travel? A half a dozen countries border on the body of water commonly known in English as the South China Sea, each one with its own geographic name for it. So must we, in total neutrality, of course, write 'South China Sea – also known as Nan Hai (Chinese), Bien Dong (Vietnamese) or the West Philippine Sea'?

Manila was perfectly content to refer to the waters in question as the South Sea, until several atolls became objects of disputed ownership. Beginning in 2012, it decided to call the waters 'the West Philippine Sea,' to reinforce its claims to these atolls and islands. The ocean to the east of the Philippines is still known simply as the Philippine Sea.

Issues on dry land include 'Myanmar, also known as Burma', as many publications now refer to the Southeast Asian country. Both words approximate what Burmese call their country, but Myanmar has an unsavory pedigree. In 1989 the military junta known as the State Law and Order Council (SLORC) decreed that Burma was a colonial-era name, and that henceforth it would like to be called Myanmar.

Coming only a year after the bloody suppression of pro-democracy protests in Rangoon (Yangon), there were grounds to question the legitimacy of the name change. The SLORC has passed into history, and Myanmar has gained acceptance almost everywhere except, significantly, the U.S. State Department and among some dissident publications based in Thailand.

A similar situation arose in India when the Shiv Sena, an unsavory, right-wing nationalist party, won control of Maharashita State and declared that the name of its capital, Bombay, was also a colonial relic and would henceforth be known as Mumbai. The Shiv Sena are long out of power, but Mumbai has out-grown its origins and gained international acceptance — along with Chennia (Madras) and Kolkata (Calcutta).

One should probably be grateful that other Asian countries haven’t yet joined the nationalist nomenclature bandwagon to dump “colonial era” names. The Thais don’t insist that we call their capital city Krungthep instead of Bangkok. Beijing doesn’t insist that we exchange 'China' for the tongue twister Zhonggou, and Tokyo doesn’t insist we use Nippon – also known as Japan.

Todd Crowell is author of the forthcoming The Dictionary of the Asian Language. He is based in Tokyo.

Flickr photo by paukrus: Sea of Japan near Nahodka

Oregon's Sad Focus on 'Happiness'

$
0
0

Oregon is a beautiful place, and, for many of the state's well-heeled residents, including many refugees from equally beautiful but overpriced California, economic growth not only is unimportant but is even a negative. Rather than create opportunity, the real issue, according to Gov. John Kitzhaber, is making sure the state ranks high on “the happiness index.” Forget sweating the hard stuff, and cozy up with a hot soy latte.

There's a problem with this. Oregon's unemployment rate remains above the national average and underemployment – the measure of people working part-time or well below their skill level – stands at nearly 17 percent, behind only Nevada and California. Since 2007, the state has lost over 3.4 percent of its jobs, a performance much worse than the national average and even California.

“You have to wonder about the rhetoric of happiness,” suggests economist Bill Watkins, who predicts the state won't be back to 2007 employment levels till next year. “You need jobs for people to be happy, you would think.”

This dearth of opportunity extends even into Portland, the state's dominant city. One recent study showed that earnings for educated male in the city are among the worst in the country. Portland, the land of Ph.D.'s driving cabs and working in coffee shops, notes geographer Jim Russell, “attracts talent for the sake of attracting talent” but does little with them once they arrive. No surprise then that the place has become widely described the “slacker capital of the world.”

Indeed, notes economist Bill Watkins, Oregon over the past five years has lagged in job growth behind not only the nation, but, in particular, its demographic twin, Washington state. Seattle has emerged as the most potent competitor to Silicon Valley, while Oregon's tech sector is largely propped up by Intel's plant in suburban Hillsboro, itself a byproduct of California's regulatory over-reach. There has been no widespread stirring of tech, or for that matter, any strong industry in Oregon.

“The good news is all Intel,” said Watkins, who has studied the state's economy for a decade. “The place is run by the complacent and the comfortable. It's a place of consumption, not production. It's a great place, though, to relax.”

'small is beautiful'

Oregon's parallel-universe approach to economics persisted even during the worst of the 2007-09 recession, with the state tightening its regulatory vise while raising income taxes to the highest levels outside California and Hawaii. It seems hard to imagine why a tech entrepreneur from California or Taiwan would choose a hyper-regulated, high-tax home in Oregon when they can establish themselves in Washington state, which has no income tax but many of the same physical amenities, and access to Seattle's world-class airport.

Perhaps I am missing the point. Growth these days is for Neanderthals and conservatives. In the past, social democrats like the great auto union leader Walter Reuther, after World War II favored economic growth as a way to create “a whole new middle class.” Many of today's progressives actually seem to want a quainter economy, dominated by homey small farms, trendy farm-to-table restaurants and artisan cheese stores.

Although this approach is now cloaked in progressivism, it also mirrors the biases of traditional Tories, who were fierce opponents to suburban development and utterly dedicated to the preservation of the countryside. Old conservatives in Britain generally favor strict controls on suburban and new town development, which, notes film-maker Martin Durkin, have made British housing prices among the highest and least-affordable in the world. Keep the peasants, that thinking may go, in the apartment blocks, so the gentry can better enjoy the pleasures of the countryside.

In his influential “Small is Beautiful” (1973), the British author E.F. Schumacher opposed economic growth and favored returning to “the good qualities of an earlier civilization.” This mantra has been increasingly adopted by what is considered the left side of the political spectrum, largely due to the rise of environmentalism. Indeed, there's a growing movement, and not just in the United States and Britain, to embrace what some call“eco-economics,” which essentially favors steady state, “sustainable” slow growth that focuses on the metric of “happiness.”

Bhutan, a small Himalayan kingdom of less than a million people and the site of a recent Kitzhaber pilgrimage, has emerged as the “happiness” poster child. And what a fine role model this country makes for Oregon and the rest of us. One Asian development expertrecently described the country as “still mired by extreme poverty, chronic unemployment and economic stupor that paints a glaring irony of the ‘happiness' the government wants to portray.”

In this other “happiest place on Earth” one in four people lives in poverty, nearly 40 percent of the population is illiterate, and the infant mortality rate is five times higher than in the United States. Bhutan also has a nasty civil-rights record from expelling members of its Nepalese minority from the country.

Bhutan, of course, is a pastoral country, but progressive urbanists also increasingly apply their “happiness” ideal to cities. Canadian academic Charles Montgomery, for example, celebrates what he sees as high levels of happiness in the city slums of developing countries. Montgomery points to impoverished Bogota, Colombia, for example, as “a happy city” that shows the way to urban development. If we can't do a Bhutanese village, we can all aspire to life in a favela.

These ideas have gained currency among some climate-change campaigners, such as the Guardian's George Monbiot, who acknowledges that his goal is nothing less than “a battle to redefine humanity” and replace the notion of growth with what is commonly referred to now as “degrowth” – a planned, ratcheting down of mass material prosperity.

Not yet widely accepted in America, at least outside Oregon, Northern California, New York City's upper West Side and, perhaps, Vermont, this approach is all the rage in slow-growing Europe. It already has its fans on college campuses and in the media.

‘Happiness' Game winners, losers

In every case of advocacy, however well-intentioned, there are clearly winners and losers. The “politics of happiness,” as one British author puts it, have proven a boon both for the public sector and those parts of the private sector that profit from work with government. Other beneficiaries include tech oligarchs, and other connected investors, who profit from renewables with the guarantee of public subsidies, and what can be called the Trustifarians, who promote anti-growth policies through their foundations and, as a bonus, get to feel very good about themselves.

Other winners include the media clerisy, notably in Hollywood, who propagandize against economic growth while living in unimaginable luxury, as well as academics, notably politically compliant scientists, who can win grants to promote this ideology.

So, who loses in the “politics of happiness”? Certainly, large parts of the working class – farm workers, lumberjacks, factory operatives, and their families – who don't have much of a role in an economy divided between service providers and the wealthy. Also left out of the equation are young families, who, perhaps forsaking the “slacker” life, now find their aspirations for a house and decent job blocked by the generally older, and better off, advocates for “happiness.”

Probably worst off are the poor, which in predominantly white (86 percent) Oregon are more likely not to be minorities. This is particularly true in the countryside, where economic conditions, according to one top state official, are “dire” and may be close to irreversibleUnemployment and underemployment in many rural Oregon counties reaches well into the double digits. People in the interior regions of the state, much like their counterparts in California, complain that Portland's green obsessions over such things as energy and land-use policies makes economic development all but impossible.

In the coming years, this conflict over economics, and the perceived politics of “happiness,” is likely to grow. Unable to prove that their policies have promoted growth, today's progressives have found a way to deal with the economy – ignore it.

This story originally appeared at The Orange County Register.

Joel Kotkin is executive editor of NewGeography.com and Distinguished Presidential Fellow in Urban Futures at Chapman University, and a member of the editorial board of the Orange County Register. He is author of The City: A Global History and The Next Hundred Million: America in 2050. His most recent study, The Rise of Postfamilialism, has been widely discussed and distributed internationally. He lives in Los Angeles, CA.

John Kitzhaber photo by S.MiRK

We Had To Destroy the City In Order to Save It

$
0
0

As housing prices and rents soar out of control in tightly regulated cities like San Francisco and New York, many people have called for a significant loosening of zoning rules to permit greater densification. Many policies contribute to unaffordable housing, including rent control, historic districts, eminent domain abuse, and building codes, but zoning puts an absolute cap on dwelling units per acre thus is generally part of any solution to the supply problem. What’s more, as recent commentators have started to notice, even many of America’s most dense cities are predominantly zoned for single family homes, calling into question the need to dedicate so much space to a single housing typology.

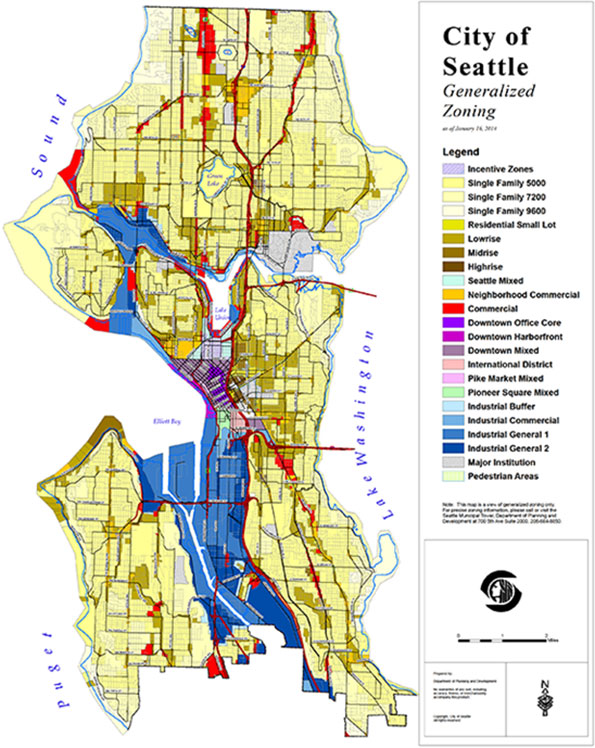
For example, a web site called Better Institutions posted this map of Seattle, in which all of the yellow districts are zoned exclusively for single family homes:

The poster lets his feelings be known by using scare quotes to denote single family “character” and blaming the zoning for Seattle’s high rents.

And Daniel Hertz posted a similar map of Chicago in which the red is single family homes only and yellow is industrial space unavailable for any residential use:

Some go beyond affordability, saying that we also need to significantly increase densities in central cities in order to reduce greenhouse gas emissions.  Harvard professor Ed Glaeser wrote an article advocating this subtitled, “To save the planet, build more skyscrapers—especially in California.”  He says, “A better path would be to ease restrictions in the urban cores of San Francisco, San Jose, Los Angeles, and San Diego. More building there would reduce average commute lengths and improve per-capita emissions” and “Similarly, limiting the height or growth of New York City skyscrapers incurs environmental costs. Building more apartments in Gotham will not only make the city more affordable; it will also reduce global warming.” He claims that, “The best thing that we can do for the planet is build more skyscrapers.”

These complaints and the proposed solution of more dense multi-family development may be true in a technical sense, but what would carrying that out mean for people who actually live in our cities?

Some critics may disdain the character of single family districts but few of these pundits ask the question of what eliminating lower-density housing actually means to the survival of the urban middle class.  Districts, like the Portage Park example Daniel Hertz gave in Chicago, are some of the last bastions of middle class family life in the city.  It’s clear that some densification can be implemented without radically changing the appearance or functioning of the built environment. Allowing 2-flats and coach houses, or even the corner apartment building or townhouse development, wouldn’t ruin Portage Park. There’s no reason such things should not be allowed. But nor would they make a major dent in affordability in places where a tidal wave of global demand is washing over the city such as in San Francisco.

To materially boost the number of units in an era in a manner that moderates prices in a highly desirable place like San Francisco would require massive changes in the built environment of its neighborhoods.  This would radically transform the character and nature of the city in question.  If San Francisco were really covered in skyscrapers, it would cease to be San Francisco--- a city of low-rise buildings framed by hills that would be obscured by high rises. There may well be the same geography on the map labeled as such, but it would be a completely different place. We would have to destroy the city in order to save it.

One person who gets that is Alex Steffan. He’s angry about prices, saying that the “criminal lack of housing is a global scandal.”  He’s also honest enough to forthrightly acknowledge that a sufficient scale of new homes to bend the cost curve would fundamentally change many of our cities:

We can build some housing incrementally, without changing the skyline or cityscape, but not anything like enough. To produce enough homes to matter, fast enough, we're going to have to fundamentally alter parts of our cities. That, of course, demands a local government willing and able to plan and permit such widespread change. It also takes an array of homebuilders doing the actual work, often in more innovative and low-cost ways, like more collaborative housing, manufactured buildings and flexible living spaces. Most of all, it takes broader public insight into how large-scale development can improve our cities.

In other words, it’s a major change in communities that requires selling the public on the idea. He believes that young people will be the agents of change here. This shows perhaps one of the signature affects such changes would have. They would displace families by eliminating their preferred housing typologies in favor of forms more amenable to predominantly younger singles or the childless for  whom living in an apartment with no backyard is more likely a relief than an imposition. But it’s hard to imagine cities as places for solving the problem of climate change if they are, like San Francisco, increasingly places devoid of families with children.

Steffan also says affordable housing is a social justice issue. Yet is it really social justice to require everyone to have equal access to San Francisco, population 825,000?  I think not. Especially not when America is replete with urban centers whose biggest problems are depopulation and worthless houses that you can’t give away. There are plenty of options of places for people to live; we should look at making our now failing cities more attractive to people who may like the housing and neighborhood, if not for issues such as crime and poor schools. There’s no guarantee in America that you can afford to live in the place you might most want to choose. That’s long been true of suburbanites and city dwellers alike.

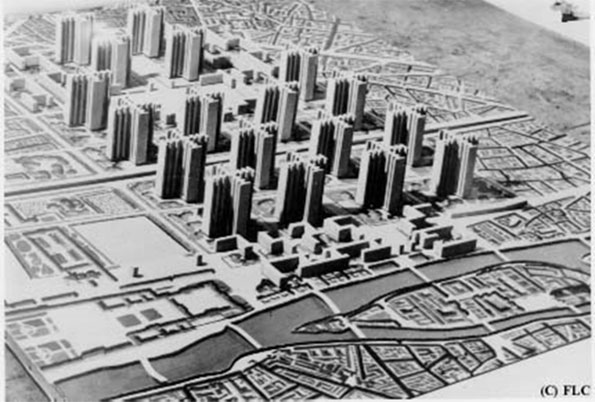
Also, the willingness to fundamentally reshape cities is odd in light of the fact that such previous attempts are uniformly viewed in the urbanist community as disasters. The idea of Manhattanizing San Francisco brings to mind nothing so much as Le Corbusier’s Plan Voisin for Paris, in which the historical cityscape is replaced with towers in the park.

Of course no one is actually saying to take it this far, although Glaeser’s vision gets close it. But once we enshrine the rule that a certain threshold of unaffordability means more density and building regardless of neighborhood character, it’s hard to see what the limiting principle would be. Also, high rises or even buildings above 4-5 stories in height usually require expensive construction techniques, and thus are inherently costly.

It’s true, however, that cities are not static entities. Every downtown skyscraper in America is built on a site that was once used for something else. Yet we see this densification overall as a good thing. Had Manhattan been preserved as of its pre-skyscraper era, it’s not clear the city would have benefitted.

Clearly the zoning and building regulations in our cities are often too strict. Yet the disasters of previous generations’ radical change suggests that incrementalism is a better course.  By all means allow two-unit houses, corner stores with upper story apartments, etc. into currently all-single family zones. Add areas where high rises are allowed the peripheries of districts currently zoned for such; warehouse districts as well as office buildings that are not well occupied.  But don’t bring out the bulldozer wholesale.  Additionally, a healthy city should make sure to embrace the entire palette of housing types – including single family homes. There’s more to making cities attractive to middle class families than just cost, and things like the prospect of a backyard for the kids to play in are among them.

And given the relatively few intact and attractive urban cores in America, prices are going to continue to go up. That’s true even with radical new building. As mentioned, San Francisco only has a bit over 800,000 people. Boston and DC have only about 600,000 each. How many people can you plausibly put into these places? Realistically, not all of us who would like to live in San Francisco or lower Manhattan are going to be able to do so.  That’s true no matter how many skyscrapers we build.

Aaron M. Renn is an independent writer on urban affairs and the founder of Telestrian, a data analysis and mapping tool. He writes at The Urbanophile.

Lead Photo: More density in Los Angeles

What America’s Fastest-Growing Economies Have in Common

$
0
0

Midland and Odessa in West Texas. Pascagoula, a port town on the Mississippi Gulf Coast. Fargo and Bismarck, the two largest cities in North Dakota. These were among the USA’s 10 fastest-growing metro economies in 2013, as ranked by growth in real gross metropolitan product (GMP), and they have a few things in common.

For one thing, none are huge population magnets. They’re also either at the center of the energy boom or indirectly benefiting from the advances in fracking technology. And they share another common trait, too: along with Columbus, Ind., also in the top 10, most of these metro areas depend on one major, export-oriented industry sector to bring in outside income and drive growth.

In Columbus’ case, it’s manufacturing. In Odessa and Midland’s, it’s oil and gas extraction. Fargo and Bismarck have diversified economies, but they’ve a seen surge in economic activity because of North Dakota’s oil and gas boom. And in Pascagoula, it’s shipbuilding (and shipments of liquefied natural gas through the Port of Pascagoula).

USA TODAY had a good rundown from 24/7 Wall St. of the top 10 (and bottom 10) economies, which were based on a Conference of Mayors report released in January. The authors of the piece touched on the reliance most of these metros have on one industry, and the ups and downs that can come with that. In the case of Columbus, they pointed to EMSI’s recent analysis:

The area is highly dependent on manufacturing, and according to a 2012 report from Economic Modeling Specialists Intl., it highly “exemplifies the intriguing potential, and inherent risks, that come with relying on the manufacturing sector.” Engine and motor vehicle parts makers are a huge part of the area’s economy, where manufacturing jobs accounted for nearly 20,000 of the 53,000 total jobs as of November.

Columbus, Ind., which was No. 9 on the fastest-growing economy list, is home to engine-maker Cummins. The central Indiana metro has a remarkable concentration of manufacturing jobs — more than a third of jobs in Columbus are manufacturing-based, and it has the highest share of mechanical engineers in the U.S. (just ahead of Peoria and Bloomington-Normal, Ill.). In recent years, employment growth in Columbus has sizzled, while Cummins continues to prosper.

When a regional economy relies on a single basic industry like manufacturing or energy for much of its employment and exports, it can mean lots of prosperity — and a big jump in gross metro product, as USA TODAY’s list indicates. But it’s also a risky proposition. For every spike in manufacturing production, there are pullbacks and plant shutdowns. Energy booms don’t (usually) last for decades.

“If you’re a small metro area depending on a vulnerable export sector, once that industry goes, you’re in big trouble,” Alec Friedhoff of the Brookings Institution told 24/7 Wall St.

For metros like Midland and Odessa, the natural multiplier effects that come with energy booms will lead to more jobs in business services, retail, and especially transportation. Public-sector infrastructure jobs also usually follow. But the end goal is to spur innovation and sustainable job creation elsewhere in the economy.

With that in mind, which of these 10 fastest-growing metros based on GMP growth is the most diversified already? The following table shows the largest contributor to gross regional product (as shown EMSI’s Analyst), as well as the sector with the largest share of jobs in each metro. The table is ranked by how the 10 metros fared in 2010-2013 job growth.

Fastest-Growing MSAs (Based on 2013 GMP Growth)2013 Jobs2010-2013 % Job GrowthLargest SectorLargest Contributor to 2012 GRP (Private)
Source: QCEW Employees, Non-QCEW Employees & Self-Employed – EMSI 2013.4 Class of Worker; EMSI Social Accounting Matrix model (2012)
Midland, TX92,85723%Mining/Oil & Gas Extraction (22% of jobs)Mining/Oil & Gas Extraction (55% of total)
Odessa, TX80,36023%Mining/Oil & Gas Extraction (15% of jobs)Mining/Oil & Gas Extraction (28% of total)
Columbus, IN52,01418%Manufacturing (36% of jobs)Manufacturing (50% of total)
Bismarck, ND75,09010%Government (19% of jobs)Health Care (13% of total)
Fargo, ND-MN143,5639%Health Care (13% of jobs)Manufacturing, Wholesale Trade, Finance/Insurance, and Health Care (each 10% of total)
Sioux Falls, SD153,3586%Health Care (17% of jobs)Finance/Insurance (18% of total)
Cheyenne, WY53,9176%Government (32% of jobs)Manufacturing and Real Estate (each 10% of total)
Trenton-Ewing, NJ253,7514%Government (27% of jobs)Professional, Scientific, and Technical Services (13% of total)
St. Joseph, MO-KS60,6432%Manufacturing (17% of jobs)Manufacturing (25% of total)
Pascagoula, MS60,214-3%Manufacturing (22% of jobs)Manufacturing (46% of total)


Manufacturing in Columbus makes up the highest percentage of jobs (36%), and mining and oil and gas extraction in Midland is the most dominant GRP force (55% of the total in 2012). Fargo and Bismarck, despite getting lumped in with other North Dakota oil hubs, are fairly spread out in both employment and contributors to GRP. And Pascagoula, where manufacturing accounted for 46% of GRP in 2012, is the only one of the fastest-growing metros to see an employment decline (-3% since 2010).

Sioux Falls, however, stands out in terms of industry mix and GRP — finance and health care are strong industries, and the metro has seen seen steady job growth.

SiouxFalls_2003-2013

Employment has increased 17% since 2003, and the gains have been broad-based. Nine major sectors, including health care, retail trade, finance, government, and professional, scientific, and technical services, have added at least 1,000 jobs in the last decade.

That’s a diversified economy, all right. But most of the other less-diversified economies on this list are doing just fine, too.

Joshua Wright is an editor at EMSI, an Idaho-based economics firm that provides data and analysis to workforce boards, economic development agencies, higher education institutions, and the private sector. He manages the EMSI blog and is a freelance journalist. Contact him here.

'Lone Eagle' Cities: Where The Most People Work From Home

$
0
0

In an era of high unemployment and limited opportunity, more Americans are taking matters into their own hands and going to work for themselves out of their homes.

Normally small businesses have led the way during economic recoveries, but this time around they’re not creating many jobs. Instead much of the growth we are now seeing is in “lone eagle” businesses, to borrow a phrase from Phil Burgess, often operating out of the worker’s residence. This reverses the trend from 1960 to 1980, when there were steady reductions in the number of people who worked at home. Indeed, despite all the talk of increased mass transit usage, the percentage of Americans working at home has grown 1.5 times faster over the past decade; there are now more telecommuters than people who take mass transit to work in 38 out of the 52 U.S. metropolitan areas with more than 1,000,000 residents.

One clear driver of this trend is technology, particularly the growing ubiquity of high-speed Internet. A consultant in New York can now serve customers in Fargo, and vice versa, greatly expanding the range of places where people can live. This is particularly true for aging boomers, as well as younger workers having problems finding a full-time job in this tough economy.

Not surprisingly, of America’s 52 largest metro areas, the ones with the highest proportions of home-based workers are generally those with high-tech, information-based economies. Tops is San Diego, a major center for digital and biomedical businesses, where 6.6% of workers are based at home.

The next five metro areas, which have home worker concentrations ranging from 6.1% to 6.4%, all boast a high number of STEM workers and tech firms: Austin, Portland, Denver, Raleigh and San Francisco-Oakland. They all also have another thing in common: They tend to be popular destinations for millennials, who seem far more comfortable with unconventional work arrangements than older generations.

High real estate costs may be accelerating the trend in San Francisco, San Diego and Portland —  if office space isn’t affordable, why not stay at home? All are also plagued by traffic congestion, most notably the Bay Area, which has among the longest commute times in the country. Rather than drive down snarled freeways, or take slow mass transit, individuals may do better working from home and heading into the traffic maelstrom only when absolutely necessary.

College Towns, Suburbs And Exurbs

Many metro areas, of course, are huge, and have many different kinds of geographies. But when we looked at the percentage of home-based workers in all municipalities with populations above 25,000, two types dominated the top of the table: college towns and tech-oriented exurbs. Boulder, Colo., for example, has the third highest proportion of people who work at home, at 11.6%, almost three times the national average. Other college towns with large proportions of telecommuters and one-person businesses include Berkeley, Calf. (tied for fifth, 10.6%), and Columbia, S.C. (12th, 9.9%), home to the University of South Carolina.

But the bulk of our leading work-at-home locales are tech-oriented suburbs or exurbs. These include several communities around the often traffic-clogged greater Atlanta area, including No. 2 John’s Creek (13.1%) and No. 6 Alpharetta (10.6%).

There are even more in the sprawl of Southern California. As many  longtime Southland residents can attest, the best workday is one that does not involve either driving or taking transit. The top municipalities on our list in the region tend to be more affluent communities, including two suburbs of our top-ranked metro area, San Diego: Carlsbad (16th, 9.4%) and Encinitas (fourth, 10.7%).

The Codger Economy

Yet it would be a mistake to think cities with large home-based workforces are necessarily youthful ones. Nor are they all in large metropolitan areas. Although still slightly below the average for metropolitan areas, the pace of new telecommuter growth is now much faster outside the major metro areas.

More than 5 million Americans aged 55 or older run their own businesses or are otherwise self-employed, according to the Small Business Administration, and their numbers soared 52% from 2000 to 2007. As research from the Kauffmann Foundation suggests, many of these aging workers are not ready to hang up their workboots.

This entrepreneurial push could correlate with  the movement of aging boomers to more rural communities, and sleepier outer suburbs. Contrary to the much-hyped notion of a “back to the city” movement among boomers, Census research suggests that if they move at all, most head further to the periphery. At the top of our list of communities over 25,000 is the coastal North Carolina city of Jacksonville, home to the Marine Corps’ Camp Lejeune and a good number of military retirees. A remarkable 13.8% of the people in this highly affordable, scenic community of 70,000 work out of their homes, roughly three times the national average. The median home price in Jacksonville: $141,000.

Other retirement hot spots with high telecommuter shares include Boca Raton, Fla. (9.8%), Scottsdale, Ariz. (9.8%), and Bend, Ore. (9.0%). These communities tend to attract well-educated boomers, many of whom have kept their business connections and work as consultants. In many cases, telecommuting allows people to continue their careers, but in an atmosphere of comfort, without the burden of commuting and, in many cases, sans the high income taxes of places like California and New York.

We can expect the wired economy to expand to other smaller communities. Already numerous smaller towns in the Midwest, such as Albert Lea, an hour and a half from Minneapolis, Brainerd, Minn., and Hastings Neb., all have home worker shares well above the national average. Many of the areas with the fastest growth in the number of self-employed people, notes EMSI is in small, somewhat isolated communities.

Many analysts who follow these trends expect stay-at-home workers to become more common in the future. According to research by Kate Lister and Tom Harnish of the Telework Research Network, the typical teleworker is a 49-year-old, college-educated, salaried, non-union employee in a management or professional role, earning $58,000 a year at a company with more than 100 employees.

This suggests that, as more workers enter their 50s, the telework population will expand further.  These numbers will continue to be buttressed by both economic and social factors. The shift towards outsourcing by companies seems unlikely to slow in the years ahead, with more work going to subcontractors who can often work at home. At the same time more boomers, particularly those with skills and connections, will continue to move to places that offer more attractive lifestyles — a process that Joel Garreau has labeled“the Santa Fe-ization of the world,” which he links to people with enough money to have choices.

In the future, however, less well-heeled workers can also be expected to increasingly shift to affordable locales that appeal to them. This can be almost anywhere — a beach community, a rural hamlet, an exurb or even a dense urban location, as we can see by the geographic diversity in these rankings. As USC grad student Jeff Khau writes, this should encourage the development of wired coffee shops and casual restaurants in smaller communities and exurbs.

Finally, there are both familial and environmental reasons for this trend to expand. With more two-worker households, it has become more attractive to have at least one person working from home, part-time or full-time. And then there is the environmental desire to reduce carbon admissions. Compared to being forced to live in dense cities, or taking mass transit, the best way by far to reduce energy use – not to mention stress – is to not leave home at all.

Top Places Where Residents Work at Home

No. 1: Jacksonville, NC - 13.8%

No. 2. Johns Creek, GA - 13.1%

No. 3: Boulder, CO - 11.6%

No. 4: Encinitas, CA - 10.7%

No. 5 (tie): Berkeley, CA - 10.6%

No. 5 (tie): Alpharetta, GA -10.6%

No. 5 (tie): Santa Monica, CA -10.6%

No. 8: Frisco, TX - 10.2%

No. 9 (tie): San Clemente, CA - 10.1%

No. 9 (tie): Columbus, GA - 10.1%

No. 11: Bethesda CDP, MD - 10.0%

No. 12: Columbia, SC - 9.9%

No. 13 (tie): Boca Raton, FL - 9.8%

No. 13 (tie): Scottsdale, AZ - 9.8%

No. 15: Newport Beach, CA - 9.5%

This story originally appeared at Forbes.com.

Joel Kotkin is executive editor of NewGeography.com and Distinguished Presidential Fellow in Urban Futures at Chapman University, and a member of the editorial board of the Orange County Register. He is author of The City: A Global History and The Next Hundred Million: America in 2050. His most recent study, The Rise of Postfamilialism, has been widely discussed and distributed internationally. He lives in Los Angeles, CA.

Wendell Cox is a Visiting Professor, Conservatoire National des Arts et Metiers, Paris and the author of “War on the Dream: How Anti-Sprawl Policy Threatens the Quality of Life.

Photo by By Rae Allen, "My portable home office on the back deck"

Switzerland: Why EU Immigrants Were Headed Off at the Pass

$
0
0

The only time the Swiss make US headlines, other than with the occasional Olympic biathlon medal, is when a majority of the voters exercise their franchise by voting down minarets or, as happened this month, banning free immigration from the European Union.

As the most democratic country on earth — major political questions are submitted to a popular vote — Switzerland allows what are called popular initiatives on any issue that can muster 100,000 signatures on a petition. It’s the only country in Europe that operates like "The Gong Show".

Popular initiatives on the ballot arise from signed petitions. Referendums, on the other hand, although voted on in the same manner, sometimes give citizens the right to approve or disapprove legislation that has already passed.

In a country of almost eight million people, getting one percent of the population to sign off for a ballot initiative on the outrage of the day isn’t very challenging. Then, when the vote is scheduled, the Swiss, including me, say yes or no to all sorts of questions.

My favorite initiative, a while back, was whether the animals in each canton (county is the closest English word) needed a lawyer to handle their days in court. A cat man, I voted yes. My neighbors, in the majority, said no, implying that the laws of the jungle were all the animals needed.

In the case of European Union (EU) immigration, the Swiss People’s Party — called the UDC locally and dominated by right-wingers, Swiss Germans, and farmers in rural cantons — asked for a vote to restrict EU immigrants from entering Switzerland, and to restore an earlier edict that Swiss job applicants have precedent over foreigners.

While Switzerland is not a member of the EU, during the last twelve years it has agreed to a number of bilateral treaties that give Europeans unfettered access to Swiss job markets and to establishing local residency here.

With the European economy flat-lining since 2008, many in the EU have drifted across the border into Switzerland to work in a variety of skilled and unskilled jobs. With paychecks in Swiss francs, the work offers better returns than, say, looking to catch on as a hedge fund manager on the Greek island of Mykonos.

Now that the Swiss have voted to put quota limits on EU immigrants, what exactly will happen?

The way the initiative system works is this: just because a question is accepted by popular acclaim doesn’t make it law. It does, however, give the government — in this case the federal parliament in Bern — three years to draft and pass a law that complies with the spirit of the resolution.

The way the law is written over the following three years, however, doesn't necessarily conform exactly to what has been voted up or down in the popular initiative.

In the case of the immigration vote, I would imagine that many caveats will be written into the deportation orders so that foreigners holding down jobs in Switzerland will not be driven to the border, and that future immigrants will continue to find Swiss places to live and work (although the needed paperwork will increase).

When I moved from the US to Switzerland in 1991, it was before the existing open immigration policies were in place. To hire me, my employer had to write the job posting in such a way that only one person on earth, me, had those requisite skills. It took me six months to get a work permit and begin my job.

In much news reporting about the current immigration vote, the subtext is that the Swiss are racist in wanting to boot out foreigners and that the country suffers from “too much democracy” by allowing citizens to vote on questions as though everyone were a parliamentarian.

I'd answer the racism charge by saying that the Swiss are about average in terms of tolerance for immigration. Unlike the US, for example, Switzerland does not have a fence along its southern border. Nor does it fingerprint foreign tourists at the airports.

To my mind, the immigration vote was less about racial intolerance, and more an expression of Swiss anger at Brussels and even Washington for routinely beating up the country over such issues as Libya, banking secrecy, minarets, the strong Swiss franc, and bilateral trade agreements.

Swiss critics — and there are many around Europe and the world — argue that Switzerland wants all the benefits of the adjacent EU, such as access to its rich markets, but without incurring any of the costs, for example, those run up in bailing out the insolvent Greeks.

There may be some truth to this, but, nevertheless, there are also both historical and modern reasons that Switzerland refuses to join the EU. The 1815 Congress of Vienna, at the end of the Napoleonic wars, and a subsequent Treaty of Turin enshrined the idea of Swiss neutrality as one of the cornerstones of the European peace.

No single major power, it was argued, should hold sway over the Swiss alpine passes and the trade flows of Europe. Two-hundred-year-old political traditions die slowly.

The recent reasons that Switzerland has not joined the EU have to do with its federalism, rooted in its communal and cantonal governments, including things like initiative and referendum voting. All political power in Switzerland is local; everyone is a communard.

Many Swiss feel that if the country were an EU member, their communes (really villages) would become hostage to German edicts or French heavy-handedness, not to mention bureaucrats in Brussels.

In practice, Swiss democracy most closely resembles Thomas Jefferson’s constitutional theories, in which well-educated farmers and small business operators (not career politicians) run the villages and the towns, and all abhor centralized power, be it in Bern, London, Paris, Brussels or Washington.

By contrast, the US likes to boast that it is the greatest democracy on earth, even though the Senate is a millionaire’s club, Congress is a gerrymandered closed shop of incumbents, and the presidency is a legalized monarchy. (If in doubt, compare the court of Louis XIV with the 700 people in President Obama’s traveling entourage, which includes speechwriters, chefs, and food tasters.)

Between incumbency and the Electoral College, many US votes “don’t matter,” and they only happen every two or four years.

For sure, letting every Swiss over age 18 play the role of parliamentarian every six weeks has its risks (I still think we should have voted in those animal-rights lawyers). But the major reason I became Swiss in 2009 was so that I could vote every six weeks on the issues of the day.

My family is composed of six voters, and what’s amazing is how we have completely different views on each ballot question. I vote for business and bike lanes and against taxes, while I suspect my wife of either syndicalism or maybe what the French delightfully call gauche caviar, (the local equivalent of 'limousine liberalism').

The children spread their votes around between the greens and fiscal no-nonsense, so that a dinner during an initiative vote reminds me of the last scenes in Lawrence of Arabia, when various tribes swarm the pan-Arab Congress, all waving large flags.

Yes, referendum democracy makes mistakes. The vote to prohibit minarets, to give just one example, was a lose-lose proposition, and it only went on the ballot to humiliate the government. But without these ballots — even those that propose marching immigrants to the border — our dinners would be sadly quieter, and our politics would be, too.

Matthew Stevenson, a contributing editor of Harper's Magazine, is the author of Remembering the Twentieth Century Limited, a collection of historical travel essays. His new book, Whistle-Stopping America, was recently published.
Flickr photo by tomgeens


Forget What the Pundits Tell You, Coastal Cities are Old News - it’s the Sunbelt that’s Booming

$
0
0

Ever since the Great Recession ripped through the economies of the Sunbelt, America’s coastal pundit class has been giddily predicting its demise. Strangled by high-energy prices, cooked by global warming, rejected by a new generation of urban-centric millennials, this vast southern was doomed to become become, in the words of the Atlantic, where the “American dream” has gone to die. If the doomsayers are right, Americans must be the ultimate masochists. After a brief hiatus, people seem to, once again, be streaming towards the expanse of warm-weather states extending from the southeastern seaboard to Phoenix.

Since 2010, according to an American Community Survey by demographer Wendell Cox, over one million people have moved to the Sunbelt mostly from the Northeast and Midwest.

Any guesses for the states that have gained the most domestic migrants since 2010? The Sunbelt dominates the top three: Texas, Florida and Arizona. And who’s losing the most people? Generally the states dearest to the current ruling class: New York, Illinois, California and New Jersey.  Some assert this reflects the loss of poorer, working class folks to areas while the “smart” types continue to move to the big cities of Northeast and California. Yet, according to American Community Survey Data for 2007 to 2011, the biggest gainers of college graduates, according to Cox, have been Texas, Arizona and Floria; the biggest losers are in the Northeast  (New York), the Midwest (Illinois and Michigan)

For the most part, notes demographer Cox, this is not a movement to Tombstone or Mayberry, although many small towns in the south are doing well, it’s is a movement to Sunbelt cities. Indeed, of the ten fastest growing big metros areas in America in 2012, nine were in the Sunbelt. These included not only the big four Texas cities—Austin, Houston, Dallas-Ft. Worth, San Antonio—but also Orlando, Raleigh, Phoenix, and Charlotte.

Perhaps the biggest sign of a Sunbelt turnaround is the resurgence of Phoenix, a region devastated by the housing bust and widely regarded by contemporary urbanists as the “least sustainable” of American cities. The recovery of Phoenix, appropriately named the Valley of the Sun, is strong evidence that even the most impacted Sunbelt regions are on the way back. 

A look at the numbers on domestic migration undermines the claim that most Americans prefer, like the pundit class, to live in and near the dense Northeastern urban cores. People simply continue to vote with their feet. Since 2000, more than 300,000 people have moved to Atlanta, Dallas, Houston, and Charlotte; in contrast a net over two million left New York and 1.4 million have deserted the LA area while over 600,000 net departed Chicago and almost as many left the San Francisco Bay region. These trends were slowed, but not reversed, by the Great Recession.

The Sunbelt’s recovery seems likely to continue in the future. Immigrants, who account for a rising proportion of our population growth, are increasingly heading there. New York remains the immigrant leader, with the foreign-born population increasing by 600,000 since 2000 but second place Houston, a relative newcomer for immigrants, gained 400,000, more than Chicago and the Bay Area combined. The regions experiencing the highest rate of newcomers were largely in the south; Charlotte and Nashville saw their foreign-born populations double as immigrants increasingly beat a path to the Sunbelt cities.

The final demographic coup for the Sunbelt lies in its attraction for families. Eight of the eleven top fastest growing populations under 14, notes Cox, are found in the Sunbelt with New Orleans leading the pack. Generally speaking, roughly twenty percent or more of the population of Sunbelt metros are under 14, far above the levels seen in the rustbelt, the Left Coast, or in the Northeast.

This all suggests that the Sunbelt is cementing, not losing, its grip on America’s demographic future. By 2012 and 2017, according to a survey by the manufacturing company Pitney Bowes nine of the ten leading regions in terms of household growth will be in the Sunbelt.

If the population growth rates predicted by the US Conference of Mayors continue, Dallas-Ft. Worth will push Chicago out of third place among American metropolitan areas in 2043, with Houston passing the Windy City eight years later. Now seventh place Atlanta would move up to sixth place and Phoenix to 8th. Of America’s largest cities then, five would be located in the Sunbelt, and all are expected to grow much faster than New York, Los Angeles or the San Francisco area. Overall, the South would account for over half the growth in our major metropolitan areas in 2042, compared to barely 3.6 percent for the Northeast and 8.7 percent in the Midwest.

What drives the change? Not just the sun, but the economy, stupidos!

From the beginning of the Sunbelt ascendency, sunshine and warm weather have been important lures and this may even be more true in the near future. But the key forces driving people to the Sunbelt are largely economic—notably job creation, lower housing prices and lower costs relative to incomes.

Until the housing bust, states like Arizona, Nevada and Florida were typically among the leaders in creating new jobs but their performance fell off with the decline of construction. But other Sunbelt locales, notably Texas, Louisiana and Oklahoma have picked up much of the slack. This resurgence has been centered in Texas, which created nearly a million new jobs between 2007 and 2013. In contrast, arch-rival California has lost a half a million.

Many other Sunbelt states have yet to recover jobs lost from the recession, but most of their big metros have shown strong signs of recovery. Since 2007 five of the seven fastest growing jobs markets among the twenty largest cities were in Sunbelt states. Looking forward, recent estimates of job growth between 2013 and 2017, according to Forbes and Moody’s project employment to grow fastest in Arizona, followed by Texas. Also among the top ten are several states hit hard by the Recession, notably Florida, Georgia and Nevada. No Northeastern state appeared anywhere on the list; nor did California.

For all its shortcomings, including what some may consider the overuse of tax breaks and incentives, the much-dissed Sunbelt development model continues to reap some significant gains. The area’s history of lagging economically has long spurred Sunbelt economic developers to utilize a policy of light regulation, low taxes and lack of unions to lure businesses to their area. Sunbelt states—Texas, Florida, the Carolinas, Tennessee, Arizona—dominate the ranks of the most business friendly states in the union, notes Chief Executive magazine, findings they often cite when courting footloose businesses.

The clear economic capital of the Sunbelt is now Houston, with some stiff competition from Dallas-Ft. Worth. Houston, the energy capital, now ranks second only to New York in new office construction and is the overall number one for corporate expansions. There are fifty new office buildings going up in the city, including Exxon Mobil’s campus, the country’s second largest office complex under construction (after New York’s Freedom Tower). Chevron, once Standard Oil of California, has announced plans to construct a second tower for its downtown Houston campus while Occidental Petroleum, founded more than fifty years ago in Los Angeles, is moving its headquarters to Houston.

Houston’s ascendance epitomizes the shift in the geographic and economic center of the Sunbelt. The “original in the Xerox machine” for Sunbelt style growth, Los Angeles’ rise was powered by new industries like entertainment and aerospace and oil, ever expanding sprawl and a strong, tightly knit business elite. Pleasant weather and Hollywood glitz still inform the image of Los Angeles, but under a regime dominated by government employee unions, greens and developers of dense housing, it suffers unemployment almost four points higher than Houston . Nine million square feet of space is currently being built in Houston, compared to just over one million in Los Angeles-Orange which has more than twice the population. It is not in the rising Sunbelt but in places like Southern California, where jobs lag amidst high costs, that the American dream now seems most likely to die.

Movin’ on Up

In Houston particularly but throughout the Sunbelt, job growth critically is not tied to cheap labor, but to  industries like energy which pay roughly $20,000 more than those in the information sector. According to EMSI, a company that models labor market data, energy has  generated some 200,000 new jobs in Texas alone over the past decade. Although Houston is the primary beneficiary, the American energy boom is also sparking strong growth in other cities, notably Dallas-Ft. Worth, San Antonio, and Oklahoma City.

Once dependent on low-wage industries such as textiles and furniture, the energy boom is pacing a  Sunbelt move towards generally better paying heavy manufacturing. Texas and Louisiana already lead the nation in large new projects, many of them in petrochemicals and other oil-related production. Of the biggest non-energy investments, three of the top four, according to the Ernst and Young Investment Monitor, are in Tennessee, Alabama and South Carolina, which are becoming the new heartland of American heavy manufacturing, notably in automobiles and steel. Since 2010, Birmingham, Houston, Nashville and Oklahoma city all have enjoyed double digit growth in high paying industrial jobs that used to be the near exclusive province of the Great Lakes, California and the Northeast.

The Sunbelt resurgence is important in part because it offers some hope to millions of Americans who may not have gone to Harvard or Stanford, but have work skills and ambition. The region’s growth in what might be called “middle skilled jobs” that pay $60,000 or above has been impressive.

It may come as a surprise to some, but the Sunbelt is also pulling ahead in high tech jobs. In a recent analysis of STEM (science, technology, engineering and mathematics) job growth for Forbes we found that out of out of the 52 largest regions, the four most rapid growers over the past decade were Austin, Raleigh, Houston and Nashville, with Jacksonville, Phoenix and Dallas also in the top fifteen. In contrast New York ranked #36th out of 52 and Los Angeles, a long-time tech superpower, now a mediocre #38.

In another example of how much things are changing, when college students in the South now graduate, noted a recent University of Alabama study, they do go to the “big city” but their top four choices outside the state are in the Sunbelt—Atlanta, Houston,  Nashville, Tenn., and Dallas—and followed then by New York. The biggest net gains in people with BAs and higher are primarily in the sunbelt, led by Phoenix,   Houston, Dallas-Ft. Worth, Austin, Houston and San Antonio; the biggest losers, according to Cox’s calculations, have been New York, Los Angeles, Chicago and, surprisingly given its reputation, Boston.

These trends may become more pronounced as the current millennial generation starts settling down into family life. Housing costs could prove a decisive factor. In terms of the median multiple, median housing cost as share of median household income, Sunbelt cities tend to be about half as expensive as New York, Boston or Los Angeles, and one third of the Bay Area.  

To be sure, many of the “best and brightest” will continue to flock to New York, the Bay Area or Los Angeles, but many more—particularly those without Ivy degrees or wealthy parents—may migrate to those places where their paycheck stretches the furthest. The Sunbelt, with its job growth, strong middle class wages and lows housing costs, is a good bet for the future.  

What will the future bring?

Prosperity, Herodotus reminded us, “never abides long in one place.” Certainly the Sunbelt economy could lose its current momentum but fortunately, having been schooled by the housing bust, many Sunbelt communities are increasingly focused on improving their basic economy—jobs, income growth, and skills-based education. Tennessee and Louisiana, for example, have led the way on expanding working training, and some of most ambitious education reform is taking place in New Orleans and Houston.

Yet, there are many threats to continued growth, both internal and external. Given his penchant for executive orders and his close ties to wealthy green donors, President Obama could take steps—for example clamping down on fossil fuel development—that could reverse the steady growth along the Gulf Coast. Any draconian shift on climate change policies would be most detrimental to the energy sector Sunbelt states.

But President Obama will not be in office forever. In the long run, the biggest threat to the Sunbelt ascendency is internal. Some fear that as more easterners and Californians flock to the area, they will bring with them a taste for the very regulatory and tax policies that have stifled growth in the states they left behind . Most worryingly, so called “smart growth” regulations could drive housing costs up, as occurred in Florida and several other states in the last decade, and erode some of the Sunbelt’s competitive advantage.

Perhaps the most immediate threat comes from the angry, reactionary elements on the right, who tend to be more powerful in the sunbelt than elsewhere. These groups, sometimes including the Tea Party, have taken   positions on issues like immigration and gay rights that local business leaders fear could deprive their regions of energetic and often entrepreneurial newcomers. Equally important, the right’s anti-tax orthodoxy, although perhaps not as devastating as the huge burdens placed on middle class individuals in the North and California, could delay critical outlays in transportation, parks and other essential infrastructure in regions that are growing rapidly. This is particularly true of education, a field in which most Sunbelt cities, while gaining ground, remain below the national average.

Whatever one thinks of the motivations of the green clerisy, there are clearly environmental measures, particularly in the Sunbelt’s western regions, that these cities need to enact to protect future growth. This includes reducing the amount of concrete that creates “heat islands,” expanding parks, and shifting to more drought resistant plants.

Fortunately, many leaders throughout the Sunbelt, particularly in its cities, are aware of these challenges, and are looking for ways to tackle them. This is driven not by the doomsday environmentalism common in California and Northeast, but grows instead out of a practical concern with stewarding critical resources and creating the right amenities to foster continued growth.

Combined with basics like lower housing costs and taxes, it’s a common optimism about the future that really underlies the resurgence now occurring from Phoenix to Tampa. The long-term shifts in American power and influence that have been underway since the 1950s have not been halted by the housing bust. Disdained by urban aesthetes, hated by much of the punditry, and largely ignored except for their failings in the media, the Sunbelt seems likely to enjoy the last laugh when it comes to shaping the American future.

This story originally appeared at The Daily Beast.

Joel Kotkin is executive editor of NewGeography.com and Distinguished Presidential Fellow in Urban Futures at Chapman University, and a member of the editorial board of the Orange County Register. He is author of The City: A Global History and The Next Hundred Million: America in 2050. His most recent study, The Rise of Postfamilialism, has been widely discussed and distributed internationally. He lives in Los Angeles, CA.

Houston skyline photo by Bigstock.

Energy Running Out of California

$
0
0

The recent decision by Occidental Petroleum to move its headquarters to Houston from Los Angeles, where it was founded over a half-century ago, confirms the futility and delusion embodied in California's ultragreen energy policies. By embracing solar and wind as preferred sources of generating power, the state promotes an ever-widening gap between its declining middle- and working-class populations and a smaller, self-satisfied group of environmental campaigners and their corporate backers.

Talk to people who work in the fossil-fuel industry, and they tell you they feel ostracized and even hated; to be an oil firm in California is like being a pork producer in an ultra-Orthodox section of Jerusalem. One top industry executive told me that many of his colleagues in California cringe at the prospect of being attacked by politicians and activists as something akin to war criminals. “I wouldn't subject my kids to that environment,” the Gulf Coast-based oilman suggested.

What matters here is not the hurt feelings of energy executives, but a massive lost opportunity to create loads of desperately needed jobs, particularly for blue-collar workers. The nation may be undergoing a massive “energy revolution,” based largely on new supplies of oil and, particularly, cleaner natural gas, but California so far has decided not to play.

In all but forcing out fossil-fuel firms, California is shedding one of its historic core industries. Not long ago, California was home to a host of top 10 energy firms – ARCO, Getty Oil, Union Oil, Oxy and Chevron; in 1970, oil firms constituted the five largest industrial companies in the state. Now, only Chevron, which has been reducing its headcount in Northern California and is clearly shifting its emphasis to Texas, will remain.

These are losses that California can not easily absorb. Despite all the hype about the ill-defined “green jobs” sector, the real growth engine remains fossil fuels, which have added a half-million jobs in the past five years. If you don't believe it, just take a trip to Houston, where Occidental is moving. Houston now has more new office construction, some 9 million square feet, than any region in the country outside New York; Los Angeles barely has 1 million. Indeed, most of the office markets that have performed best in reducing vacancies since 2009 – Pittsburgh, Denver, Houston and Dallas – are all, to some degree, driven by energy.

Everywhere you drive in Houston, now leading the nation in corporate expansions, one sees new office buildings. Last time I checked, I didn't see much in the way of a Solyndra, Fisker or other green-business headquarters being constructed anywhere in our Golden State. Energy is driving Houston's surge of some 50 new office buildings, led by ExxonMobil's campus, the second-largest office complex under construction in the U.S. (after New York's Freedom Tower).

Chevron, once Standard Oil of California, has announced plans to construct a second tower for its downtown Houston campus, yet another signal of how that company is shifting emphasis from its roots in the Golden State to the Lone Star State. Relocating employees will have many people with whom to reminisce about old times; both Fluor and Calpine, major energy-related firms, have already made the Texas two-step.

California clearly is squandering an opportunity to restart a large part of its economy. Texas energy has created some 200,000 new jobs over the past decade, while California has barely mustered 20,000. These energy jobs pay well, roughly $20,000 a year more than those in the information sector, according to EMSI. In 2011, this sector accounted for nearly 10 percent of all new jobs created in the nation. This has transformed much of the vast energy zone, from the Gulf to North Dakota. Houston, despite strong in-migration, now boasts an unemployment rate of 5.5 percent, almost four points below the jobless rate in Los Angeles.

What about “green jobs”? Overall, California leads in green jobs, simply by dint of size; but on a per-capita basis, notes a recent Brookings study, California is about average. In wind energy, in fact, California is not even in first place; that honor goes to, of all places, Texas, which boasts twice California's level of production.

Ironically, one reason for this mediocre performance lies in environmental regulationsthat make California a tough place even for renewables. Even the New York Times has described Gov. Jerry Brown's promise about creating a half-million new jobs as something of a “pipe dream.” Even though surviving solar firms are busy, in part to meet the state's strict renewable mandates, solar firms acknowledge that they won't be doing much of the manufacturing here, anyway.

The would-be visionaries who manage the state are selling Californians a lot of pixie dust. Barely 700,000 Americans work in green energy, including building retrofits, compared with 9 million in fossil fuels. Nationwide employment in solar and wind, meanwhile, is well under 200,000. Overall, officials with fossil-fuel-related companies predict 1.4 million jobs in the sector by 2030.

This predicament can't be blamed on California running out of oil and gas; some estimates of the state's oil and gas reserves as considerably larger than those of Texas. The Monterey Shale, located under the state's economically struggling midsection, holds, according to federal Energy Department estimates, almost two-thirds of the nation's total supply of shale oil. Tapping this source, notes a recent USC study, could bring as many as 500,000 new jobs to the state over the balance of this decade.

Despite a bounty of fossil fuels, including along the coast, California's oil production has continued to drop, and now ranks third among the states, behind No. 1 Texas, which has doubled its oil output in less than three years, and once-insignificant North Dakota. Californians have made a decision, based on green theology, that we don't want to produce much of the stuff.

Ordinary Californians bear the brunt of these policies, paying almost 40 percent above the national average for electricity. Rather than produce energy here, we appear set to import much of the oil and gas that, according to the state, still feeds well over 90 percent of California's energy consumption.

Particularly hard-hit has been California's once-vibrant manufacturing sector, which has not mounted anything like the recovery being experienced in other parts of the country. From 2010-13, the country added 510,000 jobs, while California produced fewer than 8,000. Electricity prices are particularly uncompetitive, roughly twice as high in California, as those in prime competitors such Texas, Nevada, Arizona – as well as the hydro-powered Pacific Northwest.

This has – discouraged manufacturers, such as Intel, from locating or expanding in the state. No surprise, then, that, just last week, it was revealed that the Lone Star State had also surpassed California in exports of high-tech goods.

The worst impact of this deindustrialization is felt by blue-collar California. Even San Jose, the Central Valley's traditional manufacturing hub, looks, as analyst Jim Russell suggests, more and more like a “rust-belt town.” Worse off still are the venerable agricultural and manufacturing regions, from the Central Valley to Los Angeles, where one person in five now lives in poverty. California's green energy fixations, notes economist John Husing, are widening an ever-growing chasm based on “geography, class and race.”

Despite these conditions, it's hard to imagine a reversal of our current energy costs. The grip of green interests and their corporate allies in places like Silicon Valley suggests Californians will continue to endure ever-higher energy prices, lagging construction and manufacturing as a regular feature of the economy. This may make the green clerisy in the state happy, but is likely to have the opposite effect on the rest of us and on our economy as it becomes ever more narrowly based and fragile.

This story originally appeared at The Orange County Register.

Joel Kotkin is executive editor of NewGeography.com and Distinguished Presidential Fellow in Urban Futures at Chapman University, and a member of the editorial board of the Orange County Register. He is author of The City: A Global History and The Next Hundred Million: America in 2050. His most recent study, The Rise of Postfamilialism, has been widely discussed and distributed internationally. He lives in Los Angeles, CA.

Oil well photo by BigStockPhoto.com.

The Evolution of Red and Blue America 1988-2012

$
0
0

David Jarman of Daily Kos Elections provides an excellent analysis of the absolute change in the Democratic and Republican vote for president from the 1988 through the 2012 elections, together with valuable tables and maps. The maps, tables, and narrative clearly demonstrate that, while the map looks mostly red as if Republicans were the big winners, the reality is that the Democrats were the beneficiaries of vastly more added votes, because of Democrats’ stupendous domination of the denser, bigger, metropolitan territory. For example, Los Angeles County by itself provided a Democratic gain of 1.2 MILLION, while the largest Republican gain was Utah county, Utah (Provo) with a paltry 90,000 gain. Republicans dominate the vast non-metropolitan expanses, Democrats the urban cores.

But the title of the piece, “Democrats are from cities, Republicans from exurbs”, is not quite right. Density is only one factor in elections; Democrats did quite well in much of exurbia as well as much of suburbia, relegating Republicans to rural, small city, non-metropolitan America. But the story is as much one of social change as of city versus country. Not only the big central cities, but their suburbs and even exurbs have evolved to house the more socially liberal population, with issues of race, women’s rights, and sexuality converting many middle and upper class to the Democratic side, even while rural small town America and much of the South remain socially conservative and supportive of Republicans.

This analysis extends Jarman’s findings by disaggregating the net change in the D and R vote by first looking at the degree of change in the Democratic share of the presidential vote from 1988 to 2012 and second by classifying by the change by such categories as:

  • increased R vote shares, 1,
  • declining R votes, 2,
  • shift to Democratic to Republican,3,
  • increased D vote shares, 4,
  • decreased D vote shares, 5,  and
  • 6, a shift from Republican to a Democratic majority

This permits a more subtle geographic evaluation of the evolution of Red and Blue America. I want to thank the Daily Kos Elections which generously provided the necessary data files. This analysis considers only the vote for president, as the story of votes for congress is complicated by gerrymandering and other issues.

Change in the Democratic vote by type of change (see Table 1)


Table 1: Net Change by Type of Change
Number of Counties2012 %D1988 %DChange in D%88-12 net changeCounty Type (Code)
141130.839.8-9-4,605,1251 Total
44840.355.1-14.5-1,517,3003 Total
10855.857.2-1.4-62,2145 Total
-6,184,639R gain
27471.15812.88,835,8664 Total
31359.742.916.48,917,6996 Total
57242.435.37.1463,7432 Total
18,217,308D gain
12,032,669Net D Gain


Almost half of all counties, 1411, experienced Democratic declines and net Republican gains, totaling  a  net change of 4,605,000, with the Democratic share dropping nine points from 39.8% to 30.8%.  Next in importance for Republicans was the gain of 1,517,000 votes in 448 counties taken from the Democratic column in 1988, with a decline in the Democratic share from 55.1% to 40.3%, a big drop of 14.8 points.  Finally a smaller number of counties, 108, remained Democratic but with a declining share (type 5), giving Republicans a small net gain of 62,000. These Republican gains totaled 6,184,000 and look impressive on a US map.

But what the Democrats lose in vast America, they make up in the crowded parts. Although their increased shares took place in only 274 counties, the gains were populous enough to provide the Democrats with a massive gain of 8,836,000 total votes. The D share rose an impressive 12.5 points from 58.8% to 71.1%. (This exceeds even the R share in the R gaining counties). But even this big number was exceeded by the gain of 8,918,000 in the again fairly small number of counties which switched from Republican to Democratic, with a change in share up 16.4 points from 46.1% D to 59.3%. Finally the Democrats gained a net 464,000 votes in 572 counties carried by Republicans but by a lesser margin than in 1988, with the D share rising from 35.3% to 42.4%.  Overall the net Republican gains of 6,184,000 were surpassed by Democratic gains of 18,717,000 for a net D growth of 12,032,000, a rise in the D share of 5.9 points from 46.1% in 1988 to 52.6% in 2012.

Change By State

A short look at the state level is interesting (Table 2).  Sixteen states became even more Republican, with a net gain of 2,681,000.  Most important in total numbers is the southwestern set of  TX, OK, LA, and AR (1,143,000), then the northern mountain states of UT,ID, WY, and MT (477,000), followed by the Great Plains states of ND,SD, NE, KS, and MO (376,000), and the Appalachian set of TN  and KY (488,000). To the latter should be added West Virginia, 210,000, the only state which switched from Democratic to Republican and an apt example of the non-big-metropolitan and ideological shift in the US electorate.  Only one state, Iowa, experienced a small Democratic decline.

Nine states became even more Democratic, but sixteen switched from Republican to Democratic, and thus spurring the major numeric and geographic manifestation of the 1988-2012 realignment, a total of 15,342,000.  Combining the Democratic states into subregions reveals the overwhelming importance of greater northeastern Megalopolis, yielding a net vote gain of 5,660,000 and of the “Left Coast” with 4,115,000, both dwarfing the total Republican gains. And the gains in the Great Lakes of 2,740,000, northern New England of 443,000, and the southern Mountain states of 431,000 were significant. Finally the major change in the South Atlantic region is notable, with a gain of 1,383,000 in SC, NC, GA, and FL, even though all but Florida remained Republican. At the individual state level California is dominant, 3,367,000, followed by NY-NJ. For Republicans Texas dominated with 578,000 followed by much smaller Utah with 268,000.

County level

The first two maps are the traditional red and blue (sort  of) choropleth maps, showing in Map 1 change in the share voting Democratic and in Map 2, the type of change. Map 3 depicts via graduated circles the absolute net change by counties, like the similar map in the Jarman article.

Percent change in the Democratic and Republican shares, 1988-2012, Map 1

Somewhat over half the territory of the US experienced Republican gains, in red shadings, but on average, the populations of the counties are smaller than for the Democratic counties in the blue shades. The dominant swath of red in the center third of the country from TX and LA north through the Dakotas and MN is impressive, but also prominent is the extension across the border south from MO and southern IL to KY, WV and into western PA, and then the northwestern extension to the mountain west, as far as the Cascade range. The most extreme Republican gains were in the two cores of southern Appalachia and eastern TX and OK into LA, plus UT. Most are non-metropolitan. A few most extreme R gains were in Knott, KY, 50%, Cameron, LA, 45, Mingo and Logan, WV, 44 and 43, and Kent, TX, 43%.

Democratic gains were far more concentrated: in the northeast, in the urban Great Lakes, in much of FL, in the Black Belt of the south, in the metropolitan Left Coast, and in the southern mountain states. The highest gains were in central and suburban-exurban counties in the northeast, the west coast, and Great Lakes, and also in non-metropolitan northern New England. Lower Democratic gains were common beyond the big metropolitan cores or on the edges of the Black Belt in the south.  A few of the more extreme Democratic increases were in Clayton, GA, 51%, Rockdale, GA, 33, both suburban Atlanta, Osceola, FL, 31, Prince George, MD, 30, and Hinds, MS (Jackson), 28%. 

Kind of change, 1988-2012, Map 2

The 1411 counties becoming even more Republican (type 1) certainly dominate the interior Plains from Canada to the Gulf and the interior, mainly non-metropolitan far northwest. There are a few counties (typically university counties) in this heartland with counties still red, but less so in 2012. The dominant areas for Republican decline (type 2) are found in the Great Lakes states, in the non-metropolitan, often exurban edges of Megalopolis (NY, PA, NJ, MD, VA). Other areas of Republican decline include rural areas in the interior west, especially areas with environmental attractions and/or increasing Latino populations, and even in parts of the traditional south, such as MS, FL, SC,NC, and VA.

Most notable are such long term Republican strongholds as Orange, CA, Duval (Jacksonville), FL, and Maricopa, (Phoenix).  Counties which switched from Democratic to Republican (type 3) are first and most impressively in Appalachia from western PA, then including most of WV, and into western VA, central TN into northern AL, second in the TX-OK-AR-LA zone, almost totally non-metropolitan.

Areas of Democratic gains, type 4, darkest blue, require a close look at the map, as they are mainly the metropolitan cores, most notably Los Angeles, Cook, King (Seattle), much of the New York SMSA, San Francisco-Oakland, Detroit, and Philadelphia. However there are also many majority-minority counties: in the Black Belt across the south, in a few Hispanic areas along the Rio Grande, and Native American areas across the west. Highest Democratic share gains were in metropolitan CA,  FL, in exurban New York, Philadelphia, Washington, DC, and Chicago, northern New England and select amenity areas, popular with metropolitan migrants, even in WY and ID!

Democratic voter share declined (type 5) in  some urban cores, like Allegheny (Pittsburgh), but the most prominent areas are in farming and forestry  areas in the upper Midwest (IA, WI, MN, often adjacent to counties which switched from D to R), and traditionally D forest industry counties in OR and WA. Especially interesting are the counties switching from Republican to Democratic, type 6, most critical to understanding the connection to social liberalism. The most prominent area is northern New England and NY, and extending through Megalopolis snatching a large number of very populous suburban and EXURBAN counties (MA, CT, NY, NJ, MD, VA, PA).

A second large swath in territory and population is in CA, switching major metropolitan-suburban counties, and also increasingly Hispanic counties to the D column. This switching of suburban and exurban counties was also prevalent in CO, OR, WA, IL, and MI, as well as in parts of the south, e.g., FL and NC. Less visible is the shift of many university counties in most parts of the country. Last and increasingly important is the shift of rural environmentally attractive areas, mostly across the west, but also in the south Atlantic, upper New England and the upper Great Lakes, in part due to retirement of urban professionals. Some of the most important switches were Riverside, San Bernardino, San Diego, Sacramento in CA; Miami and Orlando, FL; Oakland, MI; Suffolk, Bergen and Westchester (all exurban New York); Mecklenburg (Charlotte); and Marion, IN (Indianapolis).

Absolute change in the D and R vote, 1988-2012, Map 3

Map 3 plots the absolute size variation in the Democratic versus Republican change, via a simple blue versus red, to assist the reader in properly interpreting Maps 1 and 2. The map highlights the tremendous concentration of Democratic gains in the northeastern Megalopolis, metropolitan California, the big cities of the Great Lakes, and Florida, versus the much more widespread pattern  of Republican gains, extensive in area but small in voter magnitude across the Plains, Mountain states, and most notably, Appalachia .

Overall, what emerges is a picture far more subtle than simply cities versus exurbs. The bad news for Republicans is that most of their gains occur in rural areas with little population while the Democrats have consolidated their increases in more populous urban, suburban, and in some places exurban areas. Whether these trends spell the death knell for the GOP in the post-Obama period may turn on how they learn to appeal to the next generation of suburban and exurban voters – many of them Hispanic or Asian – as they enter their 30s, buy houses and start businesses. Economic issues could help here, but an emphasis on social issues, or simple anti-tax dogmatism could spell the GOP’s descent into permanent minority status.


Table 2: Greatest Changes by State
State2012%1988%% ChangeCodeNet change (000)
TX4243.7-1.71-578
UT25.432.6-7.21-268
KY3644.7-8.71-254
OK33.341.6-8.31-253
TN39.541.8-2.31-234
WV36.352.4-16.13-210
WY28.639.5-10.91-62
DE59.643.516.14114
VT68.248.319.96115
NV53.339.214.16141
NH52.937.715.26157
ME57.844.313.56171
WA58.250.87.44435
MA61.7547.74516
VA51.939.712.26598
OH51.543.97.66643
MI54.8468.86739
MD62.648.514.16756
IL58.6499.66979
FL50.438.811.661,036
NJ5943.115.961,068
NY66.252.114.141,720
CA61.945.216.743,367

Richard Morrill is Professor Emeritus of Geography and Environmental Studies, University of Washington. His research interests include: political geography (voting behavior, redistricting, local governance), population/demography/settlement/migration, urban geography and planning, urban transportation (i.e., old fashioned generalist).

Urban Planning 101

$
0
0

Former World Bank principal planner Alain Bertaud has performed an important service that should provide a much needed midcourse correction to urban planning around the world. Bertaud returns to the fundamentals in his "Cities as Labor Markets."

Bertaud begins by reminding us that without well functioning labor markets, cities will not be successful. This requires mobility, which he defines as "the ability to move quickly and easily between locations within a metropolitan area" and "the ability to locate one’s house or one’s firm in any location within a metropolitan area." This mobility, he maintains, is indispensable in facilitating growth of the city.

There is just one exception, according to Bertaud. These are retiree cities, which do not principally rely on mobility for their growth. Yet, Bertaud notes that these are themselves products of the much more numerous conventional cities, where mobility has facilitated growth and in which future retirees accumulate the resources that permit migration to the retirement cities.

There are also the planned cities for government, such as Brasilia and Washington. Bertaud contends that they have become successful because "more diversified labor market "was grafted " onto the government activities."Before that, however: "The ‘cost is no object’ concept presided over their construction and insured their initial survival as they were financed by taxes paid by the rest of the country." This should give pause to nations, especially in the developing world proposing to build and thereby divert resources from improving the lives of people (see;  Unmanageable Jakarta Soon to Lose National Capital?).

Imaginary "Urban Villages"

Bertaud insists on the importance of cities as unified labor markets. Metropolitan areas will be hampered in their development and innovation to the extent that they are fragmented.

He is particularly critical of planning attempts to create "urban villages" within the unified labor markets (metropolitan areas). He contends that: "The urban village model” implies a systematic fragmentation of labor markets within a large metropolis and does not make economic sense in the real world."

Bertaud does not accept the notion that:

"... everybody could walk or bicycle to work, even in a very large metropolis. To allow a city to grow, it would only be necessary to add more clusters. The assumption behind this model is either that urban planners would be able to perfectly match work places and residences, or that workers and employers would spontaneously organize themselves into the appropriate clusters."

He is concerned at the "prevalence of this conceit in many urban master plans," which he characterizes as "utopian trip patterns."

According to Bertaud, the urban village "model does not exist in the real world because it contradicts the economic justification of large cities: the efficiency of large labor markets." The cold water of reality is that "... the urban village model exists only in the mind of urban planners."

Uncontained Self-Contained Satellite Towns

He supports his claim. Seoul's satellite communities were intended to be self contained towns (urban villages), in which most residents both lived and worked. Yet, most of the workers employed in the satellite towns live in other parts of the metropolitan area. At the same time, most of the residents of the satellite  work in other parts of the Seoul metropolitan area. He cites Stockholm regulations requiring neighborhood jobs – housing balances as having no impact on shortening commute distances even when such a balance is achieved.

My own research using 2001 census data indicated that the London area new towns, also intended to be populated principally by people who work in them, had average work trip travel distances more than their diameter (See: Jobs-Housing Balance and Urban Villages in Southeast England). This means that large numbers of people were traveling to work outside the towns. In London as in Seoul, the planners can conceptualize the self-contained satellite towns, but it is beyond them to force the behaviors to make them work.

Similarly misguided efforts elsewhere, from the San Francisco Bay Area and other California metropolitan areas to Montréal and beyond are destined for similar failures.

Commuting and the City

Bertaud cites research by Remy Prud'homme and ChoonWong Lee at the University of Paris showing that the efficiency of cities tends to increase up so long as a large share of the commutes are less than 60 minutes, though optimal efficiency occurs at shorter commute distances. Lest there be any misunderstanding, American cities have average commute times of approximately 25 minutes, according the Census Bureau's American Community Survey, not the hour or two hour journeys of urban legends.

Defining the City

This large commuting radius makes it clear that Bertaud does not accept the distorted urban definition that would, for example, define the urban form to not extend beyond the borders of New York City, or worse beyond the Hudson, East and Harlem Rivers – the boundaries of the island of Manhattan. If the city is limited to dense cores, then the "half urban" world recently announced won't be here for many decades. The city is the metropolitan area – the labor market, which extends to the far reaches of the commuting shed.

The Bottom Line

According to Bertaud, 

"Increasing mobility and affordability are the two main objectives of urban planning. These two objectives are directly related to the overall goal of maximizing the size of a city’s labor market, and therefore, its economic prosperity." 

That brings us back to first principles. Cities are about people. Planning is justified to the extent that it facilitates the aspirations of people. The city requires prosperity, which Bertaud shows in a much needed first installment of Urban Planning 101.

Wendell Cox is a Visiting Professor, Conservatoire National des Arts et Metiers, Paris and the author of “War on the Dream: How Anti-Sprawl Policy Threatens the Quality of Life.

-----

Note: Alain Bertaud's "Cities as Labor Markets," was published by the Marron Institute on Cities and the Urban Environment at New York University and is intended to be a chapter in his forthcoming book, tentatively titled Order without Design.

High Tech Leaves NYC Behind

$
0
0

Is New York City ready to contest in high-tech against Silicon Valley? Fuggedaboutit.

Gotham is so far behind in every conceivable measurement — from engineering prowess to employment and venture funding — that even the idea is somewhat ludicrous.

While Madison Alley has marketed the city’s tech prowess before, going back to when owners of lower Manhattan real estate promoted “Silicon Alley,” the action has been elsewhere.

And while some urban boosters such as Richard Florida and Bruce Katz predict that new tech centers will not be the traditional suburban nerdistans, but instead the dense places where “smart” people cluster, there’s reason to be skeptical.

To some extent, their ideas do apply in San Francisco, though mostly because of its proximity to the people and, more importantly, the venture capital in nearby Silicon Valley. It may even apply to Seattle, where large tech companies like Microsoft and Amazon are based.

But most tech employment has continued to be concentrated in suburban locations. Even as the social media boomlet has created a few high-profile urban firms, core counties nationwide actually lost about 1.1% of their tech jobs over the last decade, while more peripheral areas gained 3.5%.

Despite a few modest successes, New York has not produced any business that approaches the top five firms of social media. Facebook, Twitter, Pinterest, Google and LinkedIn are all based in the Valley or its urban satellite city, San Francisco.

Crucially, New York remains a laggard in Science Technology Engineering and Mathematics (or STEM) employment, with slightly fewer tech jobs per capita than the national average, or a third as many as Silicon Valley.

And it’s not only the Bay that New York is behind — it also trails less hyped locales such as San Diego, Raleigh, Portland, Seattle, Houston and Dallas.

New York’s most glaring weakness is a lack of engineering talent. Behind venture capital, the greatest asset of Silicon Valley is its huge proportion of engineers, roughly 45 out of every 1,000 workers. Other high concentrations can be found in such varied burgs as San Diego, Boston, Houston and Denver.

While the coming Cornell Technion may start to change that dynamic, Gotham has a long way to climb. Right now its concentration is 78th out of 85 metros — just behind Omaha.

And it’s been headed in the wrong direction. Between 2001 and 2011, the New York area ranked a dismal 44th out of 52 metropolitan areas in tech growth, losing a net 84,000 jobs.

Even as things picked up after 2009 with the social-media boom, tech employment here expanded about one-tenth as quickly as in Silicon Valley, as well as Columbus, Salt Lake City and Raleigh. Growth in Seattle was eight times faster.

Without deep engineering talent, regions have a difficult time adjusting to technological changes that periodically reshape the high-tech industry. Silicon Valley is already beginning to move beyond social media; Google and Apple are focused increasingly on building their own pipes to move their content, and expanding into other promising tech fields from household appliances, electric cars and robotics to space exploration. New York simply does not have the engineering heft to make this transition.

Inevitably, the social media boomlet, like the previous dotcom version, will slow, as companies merge and start moving operations to less expensive areas such as Salt Lake City, Denver, Austin and even Columbus, Ohio. Urban tech firms, particularly in media-drenched places like New York, nearly collapsed when the last bubble burst, with Silicon Alley hemorrhaging 15,000 of its 50,000 information jobs between 2000 and 2005.

What’s more, the new tech oligarchs are gaining at the expense of New York’s traditional media industries and their elites. Since 2001, the book publishing industry, dominated by New York, has contracted nationally by 17,000 jobs. Newspapers lost 190,000 positions and magazines 50,000 in that same span. But internet publishing, dominated by the Bay Area, expanded by 77,000 jobs.

Given the cultural tepidness of Silicon Valley, the oligarchs may still exploit talent in places like New York or LA, where artists concentrate. But while New Yorkers talk a good game, money, power and control are shifting away, perhaps permanently, to the left coast.

This story originally appeared at the New York Daily News.

Joel Kotkin is executive editor of NewGeography.com and Distinguished Presidential Fellow in Urban Futures at Chapman University, and a member of the editorial board of the Orange County Register. He is author of The City: A Global History and The Next Hundred Million: America in 2050. His most recent study, The Rise of Postfamilialism, has been widely discussed and distributed internationally. He lives in Los Angeles, CA.

Photo by Mike Lee

Will London Embrace the Monaco Model?

$
0
0

London’s goal — admirable for any city of medieval invention — is to drive the private car underground and replace it with a web of mass transit, suburban trains, bike lanes, taxi stands, and walkways. All of those are well calibrated to an urban grid that consists of mews, squares, and quirky side streets with names like Shoulder of Mutton Alley.

Despite the winds and rains, I recently pedaled all over London and came to the conclusion that it has an excellent chance to get past the automobile era. It could be Europe’s city of tomorrow, one that moves forward with its work/life balance on a human scale. Its future as Europe’s finance center, though, and its real estate forecast, as well as the outlook for its pubs, remain open questions.

I enrolled in Mayor Boris Johnson’s shared bikes — it took a few credit card swipes — and headed off to the City, London's financial district, which lies north of London Bridge.

Will London remain one of the world's top finance centers? The continuing economic crisis, the threat of the U.K. pulling out of the European Union, Scottish independence, and strict new regulations could all spell doom for its merchant banking.

The City’s accommodating genius is that while it is as established as the House of Lords or the East India Company, it is, among other things, a go-go offshore financial center — the Cayman Islands with bowler hats.

Neither continental European nor American nor Asian, London straddles all three markets, funneling money from one part of the globe to another. By comparison, Frankfurt, Paris, Zurich, and Amsterdam are staid regional financial centers. Only New York can give it a run for its money.

At G8 meetings Prime Minister David Cameron bemoans corporate-shell tax dodging and come-by-chance balance sheets, but when he gets home he might as well don a visor and leather sleeves. London is a casino cashing in the chips of a capital-intensive world.

During the Crimean crisis, London has been all for economic sanctions, provided, however, that they don't hurt the City, where Russian oligarchs still get their phone calls returned.

While I was there, London experienced its wettest January since 1670. But one of the city's virtues is that it copes well with bad weather. Houses and hotels are short walks to shops and trains. In most London neighborhoods you will pass many restaurants, drug stores, newsstands, and pocket supermarkets. On television, England was sinking; in London, it was business as usual.

The pleasure of London on a bike is that its very quickly reduced to an overlapping series of small towns, with such well known names as Chelsea, Fulham, Soho, Sloane Square, Lancaster Gate, and Hampstead Heath.

Fewer pubs were in evidence. I read later that about 1400 have been closing every year around England, victim to archaic licensing laws and restrictive franchising, not to mention the iPhone culture that does not cozy up with a pint to dank interiors with ersatz slot machines and pinball games. Industrial Britain has become a service economy, and the servers prefer bistros, bars, and Pret A Manger.

A downside to London is that the world’s happy money has made its property market an international savings bank, where apartments routinely sell for $6 million and some hotels (not mine) cost $700 a night.

Nevertheless, the excellent Tube, buses, commuter trains, and Boris bikes make it easier to stay in less fashionable quarters and connect to the bright lights. London has spent billions on upgrading its railroad stations, which soon will be the iron standard in Europe. By contrast, Moscow is choking on its gridlocked exhaust fumes, Paris prefers tourism to trade, and Berlin still has a hole in its heart.

When I lived in London in the 1970s, King’s Cross had the air of New York’s Port Authority bus terminal, and St. Pancras appeared only to offer connecting service to The Slough of Despond. The renovated St. Pancras International, where Eurostars depart for Paris, Brussels, Lille, and Avignon, is alive with spoken French, fresh croissants, trendy restaurants, and a five-star hotel. With a soaring glass interior, King's Cross could be an Asian airline terminal.

The East End and Canary Wharf still feel like warehouse districts, although now the only cargoes are winking screens in trading rooms. Nevertheless, it is easy to imagine in the next fifty years a second London growing up around the Thames docklands. It has the infrastructure in place — trains, an airport, businesses, nearby housing stock, and open spaces — to support a major city, one part Venice with canals, another part Shanghai with skyscrapers.

The risks to London’s future are political. Insular Tories could lead Britain out of the European Union, the British pound could become a second-tier currency, and the city’s cost structures could make it only an amusement park for Russian oligarchs and Arab sheiks, not the working or middle classes. Call it the Monaco Model.

Still, I would bet on London’s sustainability at all levels of a city’s food chain… if only because it is so eccentrically welcoming to bikes, banks, brokers, and bookstores.

Matthew Stevenson, a contributing editor of Harper's Magazine, is the author of Remembering the Twentieth Century Limited, a collection of historical travel essays. His new book, Whistle-Stopping America, was recently published.
Photo of King's Cross by Matthew Stevenson

Drought Stokes California's Class War

$
0
0

As all the Californians who celebrated the deluge of rain that fell the week before last know, it did not do much to ameliorate the state’s deep drought. We are likely to enter our traditionally dry spring, summer and fall in a crisis likely to exacerbate the ever greater estrangement between the state’s squabbling regions and classes.

There are two prevailing views about how to deal with the drought. Farming interests in the Central Valley want the state to fund construction of additional water storage capacity so that the 700,000 acres of some of world’s richest farmland now fallowed by steep water cutbacks can be put back into production.

The predominant view embraced by the media and ruling political class identifies the drought as yet another manifestation of relentless global warming, which means the focus should be on reducing greenhouse gas emissions. Greens balk at the idea of massive new spending on water storage for the agriculture sector, the state’s biggest water user, advocating instead for more conservation. New dams and reservoirs would have high environmental impacts, they argue, and their benefits may not justify the costs.

Yet many believe more storage is precisely what the state needs, including Democratic Sen. Dianne Feinstein, and the state Assembly’s Democratic leadership, under pressure from Republicans and Central Valley Democrats, recently added $1 billion in funding for water storage projects to a draft water bond proposal.

The southern part of the state, which tends to be drier than the north, has managed to avoid the worst of the drought by investing in its own storage facilities, something the more green-oriented north largely has avoided.

“Pat Brown understood you had to build capacity and store a lot of water,” former Salinas Mayor Dennis Donahue, a lifelong Democrat and radicchio grower, told me. “As a state we have decided not to build capacity that we could have built. To make this a morality tale about climate change is an insult to the 40% of people who are unemployed in some of our rural towns.”

California’s drought has become a national partisan issue, but storage is hardly a Tea Party or libertarian obsession. Hard-hit farming regions, in fact, are not calling so much for less government, but an expansion of water facilities largely owned and operated by state and federal agencies.

Their strongest arguments are economic and, equally important, basic social justice. California produces upwards of of the nation’s fruits and vegetables, and the economy of the interior, and much of the central coast, revolves around agriculture. The interior region suffered the brunt of the Great Recession in California but now must endure the lost of some $5 billion in farm-related revenues; 11 of the 20 metropolitan areas with the highest unemployment in the countryare already located in the interior region of the Golden State.

Not surprisingly many in the interior and rural parts of California see themselves as victims of wealthy coastal counties, whose economies have been bolstered by rising stock prices and absurd home valuations in Silicon Valley. These people regard high-priced water, like expensive energy, as a relatively minor inconvenience. San Francisco actually depends as much or more as any place in California on imported water, but rich urbanistas do not make their living from growing food, manufacturing or logistics. For them, high prices for resources is a kind of moral penance for lives that contribute to the threat of global warming.

At the same time, the basic claim that California’s drought is an inevitable product of warmer temperatures seems a stretch. Anyone somewhat familiar with California water issues — as I have been for the better part of 40 years — knows that the state has a history of alternating wet and dry periods dating back hundreds of years. Indeed, while the most recent rains may not augur a new, wetter period, statewide precipitation has now rebounded to levels much closer to historic parameters.

To be sure, human-caused environmental degradation is real and must be acknowledged, but it’s clear that  droughts have occurred, in California and elsewhere, for thousands of years. Some have lasted for a century or more. The worst dry periods, according to tree records, took place in the 1500s, somewhat before the first SUV hit the road. The 1860s saw massive rains and flooding throughout the state, followed by a severe drought that almost wiped out the state’s cattle industry.

In the last century, California suffered from severe droughts in the 1920s, the late 1970s and again in the 1990s; all ended when rainfall resumed in subsequent years. Even over a period in which greenhouse gas concentrations were increasing dramatically, three California droughts began and ended in much the same way.

More generally, the notion that the United States is entering an era of deep and abiding water shortage also remains dubious. A 2008 federal report on climate and drought concluded that the last decade was not as dry as either the 1930s or the 1950s.

Just a few years ago climate activists were claiming that a major drought throughout the Southeast was a clear harbinger of howglobal warming would affect everyone. Similar claims have been made for a recent drought in the Midwest. According to the U.S. drought monitor map, neither the southeast nor the vast majority of the heartland suffers from serious drought conditions. Indeed over the last year, according to the U.S. Department of Agriculture, the percentage of the country suffering any drought at all has dropped from 66% to close to 50%.

To be sure there needs to be more attention paid — in California and elsewhere — to water issues and conservation, as many greens suggest. But  that’s  no reason to abandon prudent water management, like storage, in the belief that massive desertification is inevitable. California’s Inland leaders are simply calling for  retrofitting and improving water facilities, many of which were built a half century ago, and create additional wet-period storage capacity. If it does not, a large part of the state’s heartland will return to a  desert more by fiat than climate, leaving behind a huge, largely unemployable, and predominately Latino underclass.

Fortunately, not all is lost. For all his sometimes obsessive concern on climate change, Governor Jerry Brown has proposed major improvements in the state water system, much of which was built by his father. In this, he has been willing to challenge the green interests, who inevitably will try to block any new facilities. In the past, even Brown has found changing any of California’s complex environmental laws very difficult given the power of the green lobby, particularly within the courts and the regulatory agencies.

Clearly the  more reasonable water conservation measures urged by the environmentalists should also be adopted. Vast lawns and golf courses watered from the Sierra make little sense in a state whose population and economic centers are totally dependent on imported H20. Yards consume more than half of California’s urban water supply; using more drought resistant plants — my family is replanting our front yard with desert cover — and expanding already available, highly treated recycled water for exterior irrigation are commonsense changes cities and towns throughout the southwest should pursue. Agriculture, which uses more that 75% of the state’s water supply, must also become more conservation-oriented.

Water-hungry crops, like rice and perhaps even cotton, may need to be phased out. More use should be made of drip irrigation, which is employed extensively in other dry climates such as Israel. A greater emphasis on California’s unique advantages for specialty crops like nuts, green vegetables and fruits inherently makes more sense than growing water-hungry crops in competition with more water-rich locales.

But unless Brown can fashion a compromise, the drought will continue to serve as propaganda fodder for the climate change community while promoting the demise of yet another basic industry, joining fossil fuel energy and, increasingly, manufacturing. This assault on tangible industries  devastates scores of poorer, less media-savvy communities. The social results of such an approach is already apparent in the state: the highest poverty rate in the nation and one-third of the nation’s welfare recipients. It may seem moral to link this drought to warming for the sophisticates who control California, but from here, the whole approach seems pretty cold indeed.

This story originally appeared at Forbes.com.

Joel Kotkin is executive editor of NewGeography.com and Distinguished Presidential Fellow in Urban Futures at Chapman University, and a member of the editorial board of the Orange County Register. He is author of The City: A Global History and The Next Hundred Million: America in 2050. His most recent study, The Rise of Postfamilialism, has been widely discussed and distributed internationally. He lives in Los Angeles, CA.

Los Angeles aqueduct photo by BigStockPhoto.com.


Boeing’s Long Shadow

$
0
0

The recent wrangling over decisions on where to build the next version of Boeing’s 777 has left a residue of bitterness and rancor around the Puget Sound region. Were the Machinists forced to give too much? Were the taxpayers squeezed too far? While views will differ on those questions, one thing is clear: jobs lost at Boeing are very difficult, if not impossible to replace.

In the Seattle region we can easily forget how insanely fortunate we are to have Boeing Commercial Airplanes located here. As much as we love to talk about software, gaming, life sciences, internet commerce and other 21st century industries, Seattle owes its status as a large and prosperous metropolitan area almost entirely to the economic base established by Boeing fifty years ago.

And if we can avoid becoming another San Francisco, with high levels of income inequality, outrageous housing prices, a shrinking middle class and a consequent increase in social tensions, we will owe Boeing for that too.

Maybe we paid too much for the 777. But the alternative – Puget Sound minus Boeing – is a frightening idea. Ever since the Boeing Bust of 1969, Seattle area leaders have been trying to diversify the region's manufacturing economy, and with few major successes. The reason for this is obvious: our location in the upper left hand corner of the map.

Manufacturing industries tend to locate near their customers and suppliers to minimize transportation costs. Puget Sound is simply too far from national markets to make sense as a location for heavy industry. By the 1950s, the region had maxed out its potential in timber, fishing and shipping, and the economy stagnated. The manufacturing boom that followed World War II largely passed the region by, and in 1957 a prominent businessman accurately described the Northwest as "America's most important colony."

Then came Boeing's entry into the commercial jet aircraft business. Prior to World War II Boeing had served as a sort of R&D shop for the U.S. government, developing innovative military and airmail planes that never sold very well. Boeing developed the first modern commercial transport, the 247, which was immediately eclipsed by the Douglas DC-3. Boeing had some commercial success, but was still a minor player in the propeller age.

After World War II the military stopped buying B-17 and B-29 bombers, for obvious reasons, and Boeing fell into a slump. It gradually revived itself with the successful B-47 and B-52 jet bomber programs. But it was another military program--developing a jet powered refueling tanker that could keep up with the new jet bombers--that was the key. That tanker airframe was repurposed into the 707, an aircraft that revolutionized civilian air transport and led to the transformation of the Puget Sound economy.

With commercial jet aircraft factories, the region finally had a large, scalable manufacturing industry that did not depend on low transportation costs. In fact, the products deliver themselves! With the success of the 707 Boeing began a very aggressive strategy, launching four new airplane programs during the 1960s: the 727, 737, 747 and the ill-fated SST. Before the bust of 1969, Boeing employed well over 100,000 people in the region, accounting for nearly all the net job growth of the decade.

Since then, Boeing's Puget Sound area employment has fluctuated between 60,000 and 110,000. And although it is gradually shrinking as a share of the economy, Boeing provides one thing that fewer and fewer industries can offer: large numbers of secure, high-paying blue collar jobs. Boeing investments are measured in decades, and even with recent give-backs, the machinists enjoy a very nice compensation package. The layer of middle class employment at Boeing is what makes the Puget Sound region different from San Francisco, and holds the line against our evolution into a Superstar City.

Yes, Boeing's tactics have wounded pocketbooks and left a bad taste in the region's mouth. And its status as a largely Midwestern company (just try to find any Northwest connections on its board) further diminishes the emotional tie. But we cannot lose sight of the value it brings. There is simply no better industry around which to build a regional economy and we are incredibly lucky to have it here. So we'll swallow some pride and hold tight to a company that every region in the world would kill to get its hands on.

The Seahawks 12th Man paint job that Boeing workers put on a brand new 747 freighter just before the Super Bowl brought back a glimpse of the Boeing connection that we used to take for granted. The challenge for Boeing and for regional leaders is to rebuild that connection. In Seattle we will always live in the "Jet City."

Michael Luis is a consultant in public affairs and communications, based in the Seattle area, and is the author of Century 21 City: Seattle’s Fifty Year Journey from World’s Fair to World Stage. He also serves as councilmember and Mayor of the city of Medina, Washington. He can be reached at luisassociates@comcast.net.

Seattle photo courtesy of BigStockPhoto.com.

Bubble Trouble in Silicon Valley

$
0
0

Third-generation venture capitalist Tim Draper believes he has a solution for California's problems that will make the Silicon Valley safe for its wealthy: secession. In a recent interview, Draper suggested that California be divided into six states, including one dominated by the Valley and its urban annex, San Francisco.

By jettisoning California's deeply troubled components – the Central Valley, the Inland Empire, Los Angeles – the Silicon Valleyites can create their own enclave, where incomes will be far higher – $63,288 per capital compared with the $46,477 for the whole state. If adopted, Draper's proposal would mean our self-styled cognitive leaders wouldn't have to deal with interior California's massive poverty, double-digit unemployment, farmer demands for scarce water supplies or manufacturers seeking reasonable energy prices.

Yet, for some in the Valley, Draper's proposals don't go far enough. Another venture capitalist recently suggested that the Valley do away with this whole United States thing entirely and form its own Republic. “We need to run the experiment, to show what a society run by Silicon Valley looks like,” venture capitalist Chamath Palihapitiya argued.

The notion here is that Silicon Valley might do best if detached from the limitations of American citizenship, with firms essentially running their own countries from islands or man-made, offshore facilities, as proposed by libertarian investor Peter Thiel. What the Valley wants, then, is to be left alone – unencumbered by the masses – so that the clever crowd can live with low taxes, in a perfectly socially liberated environment, but without the encumbrances that come with having to worry about the less-cognitively gifted.

“People,” as technology author Jaron Lanier has noted, “are the flies in Moore's Law's ointment.”

This can be seen in the growing pushback over such things as massive wealth accumulation for dubiously useful ventures, and egregious privacy violations. The luxurious Google employee buses shuttling in and out of San Francisco are resented by some residents stuck riding the often poorly maintained, sometimes awful Muni.

One top venture capitalist, Thomas Perkins was so upset over what he sees as scapegoating of the rich that he compared their condition to Jews in Nazi Germany. His directness upset some, but may have expressed more of what is really thought by smoother, younger, more PC-conscious executives.

This is more than simply the usual case of rich people being out of touch. These are not media constructs like Kim Kardashian or Paris Hilton but very powerful, incredibly wealthy people who increasingly are a dominant force in California and national politics. Yet, their political positions often have a “let them eat cake” character. And to be sure, some new oligarchs lean right, mostly on the libertarian side, but these are a distinct minority. The notion of some in the Republican Party who see the Valleyites as saviors is nothing short of delusional.

For the most part, executive and workers at firms such as Google, Apple, Facebook and Twitter are strong proponents of every politically correct idea from climate change legislation to opposing the expansion of suburbia and favoring gay marriage. Yet they are also becoming the wealthiest entities in the nation; besides GE, a classic conglomerate, the largest cash hoards now belong to Apple, Microsoft, Cisco, Oracle and Google, all of which sometimes have more dollars on hand than the U.S. government. Seven of the eight biggest individual winners from stock gains in 2013 were tech entrepreneurs. They were led by Amazon's Jeff Bezos, who added $12 billion to his paper wealth; Mark Zuckerberg, who raked in an additional $11.9 billion; and Google co-founders Sergey Brin and Larry Page, who each gained roughly $9 billion.

Given their phenomenal wealth, one observer compared Silicon Valley politics to those of a mall outlet selling Che Guevara t-shirts. They no doubt nod their heads when President Obama speaks of economic inequality, but when it comes to doing something about it, their general response is: Nevermind.

However they color themselves politically, the oligarchs live above and apart from the rest of society – and, like Draper, want to keep it that way. Their desire to separate from the hoi polloi is natural and stems, in part, from their notion of being a class apart from mere mortals. “We live in a bubble, and I don't mean a tech bubble or a valuation bubble. I mean a bubble as in our own little world,” Google CEO Eric Schmidt boasted to the San Francisco Chronicle in 2011. “And what a world it is. Companies can't hire people fast enough. Young people can work hard and make a fortune. Homes hold their value. Occupy Wall Street isn't really something that comes up in a daily discussion, because their issues are not our daily reality.”

Certainly, politically correct gestures, like support for climate change legislation, don't change this calculus. Google executives, for example, urge the middle class and working class to pay for subsidized, expensive energy – which they also invest in – but maintain their own fleet of private planes.

The distinct sets of rules for oligarchs and everyone else extends even to the most personal issues. Yahoo's Marissa Mayer, a former Google executive, banned telecommuting options for employees – particularly critical for those unable to house their families anywhere close to Yahoo's ultrapricey Sunnyvale home town. Yet, Mayer, pregnant at the time, saw no contradiction in building a nursery in her office.

Nor can it be said that the Valley elite gives at the office. Rather than “share the pain,” tech firms are notorious for not paying much in the way of taxes, including taxes on their properties. Facebook, for example, paid no taxes in 2012, despite making a profit of over $1 billion. Apple, which the New York Times recently described as “a pioneer in tactics to avoid taxes,” has kept much of its cash hoard as part of its basic corporate strategy.

Individuals like Microsoft Chairman Bill Gates have voiced support for higher taxes on the rich, yet Microsoft has saved nearly $7 billion on its U.S. tax bill since 2009 by using loopholes to shift profits offshore, a Senate panel said in a recent report. As former congressman Barney Frank noted recently, Microsoft and other tech titans “have as good a record of tax evasion as anybody.”

Such miserliness also extends to private philanthropy. There is no equivalent financed by Silicon Valley of anything comparable with the energy-industry-financed Texas Medical Center, nor can we expect any of the tech elite to leave behind anything so durable as the Carnegie libraries. For all their loud advocacy on environmental and education issues, the Valleyites are generally considered miserly when it comes to charity, as only four of the top 50 charitable contributors in 2011 came from the tech sector.

They may give big to the elite universities, like Stanford, but they seem oddly unengaged in the struggles of the vast working-class population around them: Poverty rates in the Valley's home of Santa Clara County since 2001 have soared from 8 percent to 14 percent, a jump of 75 percent. The self-proclaimed “capital of Silicon Valley,” the city of San Jose,notes urban geographer Jim Russell, is beginning to resemble a post-industrial “rust belt” city. To expect the Valley elite, ensconced in superpricey Palo Alto or San Francisco, to concern themselves with the Central Valley, beyond the Diablo Range to the east, is beyond wishful thinking.

Remarkably some people, on both the right and left, believe that the Valley's tech community should reform the nation, and recreate the government in their image. True, the likes of Harry Reid and Mitch McConnell do not inspire much confidence, but a society run by the tech lords would be very cold, and highly stratified.

Silicon Valley's problem, as author Jaron Lanier has put it, “is people.” Ultimately, human beings will resent being transformed into little more than digits in a Google algorithm that is then sold to advertisers. Most Americans reject being looked down on by a group that, given accidents of birth, access to money, social networks or even high intelligence, wishes not to share a state, or even a nation, with those who have less. That these attitudes now emanate from people who consider themselves both progressive and uniquely enlightened is not only hypocritical, but almost qualifies as obscene.

This story originally appeared at The Orange County Register.

Joel Kotkin is executive editor of NewGeography.com and Distinguished Presidential Fellow in Urban Futures at Chapman University, and a member of the editorial board of the Orange County Register. He is author of The City: A Global History and The Next Hundred Million: America in 2050. His most recent study, The Rise of Postfamilialism, has been widely discussed and distributed internationally. He lives in Los Angeles, CA.

Welcome to Chicagoland

$
0
0

As part of his plan to boost sagging ratings at the network, CNN chief Jeff Zucker commissioned an eight part reality series about Chicago and its mayor called Chicagoland that premiers tonight at 10pm ET. The show is produced by the same people who did the Brick City series about Newark Mayor Cory Booker, with support from mega-star executive producer Robert Redford.

Rahm and the Media

Given that Brick City seems to have only helped Booker’s reputation, cynics in Chicago have already noted the fact that show’s producers are represented by the William Morris Endeavor Agency, which just so happens to be the home of Chicago Mayor Rahm Emanuel’s brother Ari. This is as much because of as in spite of a well-publicized move by directors Marc Levin and Mark Benjamin to ask the agency to recuse themselves from representing them when it comes to the show.


Trailer for CNN series “Chicagoland” – click here if the video does not display.

One need not believe in such a conspiracy to see this show as yet another example of Rahm’s media power – and his fearlessness in pursuing high profile opportunities to get his message out even in venues where he’s not in complete control. Rahm has had significant success in getting high profile national and global attention – for example, a glowing profile from NYT columnist Thomas Friedman – since taking office. He didn’t shy away from getting out there even when a spike in murders made global headlines Chicago of the type Chicago didn’t want – a time when many mayors would have crawled into their bunkers. And although he’s been in office a while now, Rahm fatigue seems not to have set in. Sun-Times columnist Neil Steinberg has a lengthy piece on him in the March issue of Esquire with the colorful title of “And Now For the Further Adventures of Rahm the Imapler.” The Financial Times recently ran a mostly positive piece called “Rahm Emanuel: Mayor America.” It even includes a high production quality six and a half minute video that will give you a flavor of it (if the video doesn’t display, click here):


With his ambition for Chicago as a global city, Rahm clearly sees global media as the ones that really count. Chicago’s status as a media center afterthought means few out of town reporters actually know that much about the city, hence Rahm has a huge opportunity to shape the message. This must infuriate the local media, which to a great extent Rahm is free to ignore because of his ability to go direct at the national and global level. Chicagoland should thus be seen as part of Rahm’s global media push, both for Chicago and for himself.

Reality TV vs. Journalism

The series is probably as good for Rahm and the city as it could possible get. Certainly the problems – high crime, poor schools, and labor troubles – are not glossed over. But given that they’ve been well publicized globally, it’s hard to imagine how they could be without sacrificing all credibility. Within the context of realism, this is a big win for the city.

Whether it’s a big win for journalism is another story. Like most modern documentaries or reality TV shows, Chicagoland is non-fiction in a sense, but also heavily scripted and edited to provide a compelling narrative. This makes for great TV drama and characterizations, but whether it represents truth as a reporter would tell it is much more doubtful.

Just as one example, the producers clearly had extensive access to Rahm and he’s frequently shown as concerned about crime, battling with unions, boosting the local economy, talking to school kids and even mentoring an inner city kid he brought on as an intern. But is that a fair representation of how Rahm Emanuel spends his time? The Chicago Reader did a two part series analyzing Rahm Emanuel’s schedule and published a two part series about it called “The Mayor’s Millionaire Club” (see part one and part two). They show that access to Rahm is heavily dependent on your wealth, influence, and donations. Yet that doesn’t come through in Chicagoland at all. Instead when the occasional powerful people are shown, they are always doing a good turn for the city, such as a group of tech executives donating products to schools.

I’m not suggesting this series should have been a bulldog investigative piece. However, I strongly suspect that CNN’s actual journalists will be seething at seeing their network and its relatively strong reputation being used for what is clearly not the type of work they themselves would undertake. Right or wrong, the CNN brand carries an expectation of a certain type of journalistic standard that the Sundance Channel (where Brick City originally ran) doesn’t. Right now on CNN’s Chicagoland page there’s an ad for Anderson Cooper 360. Something tells me that were Anderson Cooper in charge of Chicagoland, it would look quite different.

Compelling Drama and Characters

However, taken on the terms of a Sundance series, Chicagoland succeeds, and my guess is that Rahm will be overall pleased. The show sets up the drama by structuring the series as battles between opposing forces. In the first couple episodes, this is the battle between Rahm and Chicago Public Schools leadership on the one hand, and the teachers union and some affected parent groups on the other over plans by CPS to shutter 50 schools. Frankly, I thought it overly portrayed Chicago as if it were Newark. The segments were introduced by short positive vignettes of some aspect of Chicago (like the Stanley Cup playoffs), followed by more extensive coverage of the school closing dispute, and educational and crime problems in Chicago’s impoverished South Side. It would be like doing a flyby of Times Square before doing a deep dive on some of the worst blocks in Newark. While I myself have written on the two Chicagos theme, I was feeling that Chicago was being unfairly stigmatized.

I need not have worried. After the initial focus on the school closing dispute, the focus shifts. The drama is now between the good guys (basically every single person featured in the show) and the bad guys (gangsters and such who exist almost entirely offscreen, or so we’re led to believe). Almost without exception, the good guy characters are shown as 100% white knight types. Instead of positive vignettes followed by something Newarkesque, there’s a more balanced take in time allocation and the threads start merging across the two Chicagos. The show also starts laying the Chicago sales job on with a trowel. In Chicagoland’s coverage of things like the food scene, the music scene, the comedy clubs, or even footage of Rahm protesting a neo-Nazi march back in the 70s as a teenager, it’s hard to see how this could have been any more positive in its portrayal of the city if it had been produced directly by the Chicago Convention and Tourism Bureau. This is a huge win for the city.

The show also manages to create several compelling characters. One of them is the surgeon who leads the trauma unit at Cook County Hospital, a job I certainly would not want. How that guy manages to balance family life in Roscoe Village (my old neighborhood) with the reality of what he deals with every night at his job is beyond me.

But the star of the show is clearly Elizabeth Dozier, principal at Fenger High School in the South Side neighborhood at Roseland. She’s shown fighting not only to only educate her students, but keep them safe over the summer, and even invest in their lives after graduation when they get in trouble. (Dozier trying to help a former student who’s in jail for robbery realistically shows the need for “retail” 1:1 or N:1 investment in the lives of specific troubled people, not just programs, to make a real difference in a troubled person’s life – and even so the difficulty in seeing life change happen). Her obvious passion and dedication in the face of tough odds clearly come through. Yet even here there’s a sense of manufacture. Dozier is a young, attractive, stylish black professional who not only runs a South Side High School, but also gets personal face time with Rahm, knows Grant Achutz of Alinea, and hangs out with Billy Dec on his boat. How much of this A-list hob-nobbing was happening prior to Chicagoland coming to town I wonder? Regardless, it makes for compelling TV.

While I have my quibbles, I think on the whole Chicagoland is an enjoyable watch that will end up being good for the city and the mayor. Just don’t go in expecting journalism. This is first and foremost reality TV style drama. With that caveat in mind, I recommend watching it.

Takeaways From the Chicagoland

Watching Chicagoland made me think again two bigger picture issues.

First, in watching gangs take revenge on each other in an endless cycle of retaliation that literally stretches on for years and in which no one can actually recall the original offense, I was reminded of Hannah Arendt writing on the role of forgiveness:

Forgiveness is the exact opposite of vengeance, which acts in the form of re-acting against an original trespassing, whereby far from putting an end to the consequences of the first misdeed, everybody remains bound to the process, permitting the chain reaction contained in every action to take its unhindered course. In contrast to revenge, which is a natural, automatic reaction to transgression and which because of the irreversibility of the action process can be expected and even calculated, the act of forgiving can never be predicted; it is the only reaction that acts in an unexpected way and thus retains, though being a reaction, something of the original character of action. Forgiving, in other words, is the only reaction which does not merely re-act but acts anew and unexpectedly, unconditioned by the act which provoked it and therefore freeing from its consequences both the one who forgives and the one who is forgiven. The freedom contained in Jesus’ teachings of forgiveness is the freedom from vengeance, which incloses both doer and sufferer in the relentless automatism of the action process, which by itself need never come to an end.

Forgiveness is not the only way to put a stop to a cycle of revenge. Arendt posits official punishment as another. But forgiveness is clearly the fastest and surest route. Until either the police are able to impose order and mete out genuine justice, or the grieving family and aggrieved gang compatriots of these murder victims are able to forgive and forswear vengeance, the cycle is unlikely to ever end.

I don’t want to judge too harshly teenagers in a ghetto living out the only life script they’ve ever known. But what’s our excuse? We too often live out in miniature the same process ourselves. How often do most of us forgive genuine wrong done against us, even of a much less consequential nature? Tune into the internet any day of the week and see untold amounts of shrieking over some offense or another, real or imagined. I suspect the vast majority of us would be behave no differently from those gangbangers in similar circumstances. We are blessed not to be there, however. But will we use that privileged position to end or perpetuate cycles of wrong in our own lives?

Secondly, Chicagoland made me think about the bigger picture of leadership in our cities and the major problems they face. I voted for Rahm as mayor, for three reasons. 1) I saw him as like his mentor Bill Clinton, namely someone to whom getting elected and staying in power is more important than pushing any ideological agenda. In short, I saw him as a pragmatist, not an ideologue with a policy ax to grind like Bill de Blasio. 2) Rahm spent a lot of time outside of Chicago. He’s got a global perspective and a global network that’s critical in this era. He’s also got the gravitas to interact at the highest levels of power in America, which is something few mayors can say. 3) Rahm has no natural constituency in Chicago. So if he wants to be re-elected, he needs to perform. He clearly has future political ambitions, and flaming out as mayor wouldn’t be helpful in pursuing them.

Looking back, while I’ve criticized Rahm for an excessive focus on the elite, I believe my judgment then was correct and on the whole I think he’s done a decent job in a very difficult situation. Apropos of point #3, if Chicago thinks differently, the popular and competent Cook County Board President Toni Preckwinkle is waiting in the wings. Whatever you think of his neoliberal policies, it’s clear Rahm is an actual leader, one with a ton of intelligence, drive, power, and the will to get things done.

Yet watching Chicagoland, it’s evident that even leadership ability of Rahm’s caliber struggles mightily with the city’s huge challenges. Chicago has a massive fiscal hole, and a very serious problem with a two tier society that has left vast tracts of the city behind. It’s by no means certain that Rahm will be able to make Chicago soar in the way that Daley did in the 90s, or even get re-elected if a there’s any stumble and a credible candidate like Preckwinkle gets into the race.

When I think about the difficulties in solving the problems in Chicago, which has not only Rahm’s leadership but a massively successful global city economy in the Loop and hundreds of thousands of well-heeled residents, it makes me pause. If Chicago struggles with its problems, how much more so other cities facing similar or worse problems but with much weaker leadership and no global city money and firepower? It really makes me wonder if a lot of places are simply going to die a slow death barring some lucky break from a change in the marketplace.

This ultimately is what I’d challenge the residents of other cities to think about when watching this show. Look at Chicago and what it is dealing with. Think about your own problems and your resources for combating them vis-a-vis Chicago. If that doesn’t make you sober up, I’m not sure what will.

Aaron M. Renn is an independent writer on urban affairs and the founder of Telestrian, a data analysis and mapping tool. He writes at The Urbanophile, where this piece originally appeared.

Deutschland on the Pacific?

$
0
0

California and Germany may not immediately come to mind as a doppelganger, but they do share several characteristics, particularly when it comes to their attitudes toward energy production and consumption.

Both “States” have large populations which seem to agree that the world will be a better place if renewable sources of energy are given precedence over hydrocarbon based options in powering their economies.

For both, this translates into an emphasis on preferentially using wind and photovoltaic sources. Initiatives include 1) the use of state and federal financial support for building and operating renewable generation and 2) preferential access to the grid for exporting the net power produced.

On the “regulation” side the two “States” differ substantially.     

California is relatively tough on coal based generation – long a major source of power to Los Angeles through Utah – while encouraging additional load following natural gas powered generation. Despite the shutdown of the nuclear plant at San Onofre, California is also viewed as being relatively tolerant of nuclear generation which does provide copious quantities of “base load” electric power without measurable amounts of air pollution. Of course California also likes hydropower when – during wet years – they can get it.

Germany also likes wind, solar and hydro generation, but nuclear power units? Not so much. The draconian nuclear shutdown is a reaction Japan’s Fukushima disaster. However, the unrelated shutdown of natural gas plants in favor of coal based generation is a big surprise. By comparison, Japan, which really has a nuclear generation problem, is running their gas plants hard while trying to restart at least some of their existing nuclear units.

The German natural gas plant cutbacks stem from the relatively high price of Russian sourced natural gas under long term contract. Such gas is simply unaffordable given the mandated subsidies charged to utilities. Ironically, Germany’s political and regulatory priorities have had the unintended consequence of encouraging the use of older coal based generation. Germany does have access to affordable coal as well as to existing power infrastructure that can use it. Due to the lack of politically viable alternatives, Germany is relying on their least attractive option.

Power supply and demand is not created equal

Residential power consumption varies significantly over the typical 24 hour day as people wake up, take showers, eat breakfast, go to work, return home, watch TV or play with their computers, and then go to bed. This is overlaid by seasonal needs for electrically powered air conditioning or heating units as well as by demand from industrial consumers. Output needs to vary directly with consumption.

They do this by dispatching power from two different classes of equipment, “base load” and “load following”. (Think fixed and variable output). The time of daily peaks and troughs vary for each utility, but peaks generally occur in the late afternoon with troughs are observed in the late evening or early morning hours. The difference between the peak and trough can vary by a factor of three. Because electric power can’t be stored, utilities need the capability to follow the demand load by using generators capable of changing output quickly, hence “load following generation”. Gas turbines and hydropower are both good examples of load following generators. The other category “base load” is typically provided by nuclear and coal fired units. These power plants run 24/7 and cannot alter their output in the short term. They are capital intensive but can produce power at relatively low unit costs as long as they maintain full output. Because of pollution issues, coal powered generation is least welcome in California.

Industrial power clients tend to be major consumers of base load power as their manufacturing plants run “24/7” and their need for variable power is much lower than that of the residential sector. Adding together industrial, residential, and commercial minimum demand defines the capacity need for base load generation. Adding together the maximum needs for all categories of load following capacity provides the utility’s total capacity requirement. The difference between the maximum and the minimum defines the need for load following capacity.

California Dreaming

There is at least one other category of power generation. We call it “intermittent”. By that, we mean a power source whose output cannot be predicted, such as wind and solar. Adding socially desirable, but intermittent, renewable power generation to a utility’s supply mix requires that the utility also acquire more predictable supplies, as the utility now needs to react to uncertainty of supply as well as to uncertainty of demand. As a state, California has been able to add new renewable sources, albeit with the result of higher residential rates.

Germany has also added significant amounts of intermittent power to the supply mix, with wind turbines in the North and solar panels in the South. However, the economic impact of these additions has been much more severe for residential rate payers. Germany’s “Energiewende” policy has resulted in multiyear, double digit increases in power prices as the residential sector as well as the “non-energy intensive” industrial sector bear the cost of the experiment.

Because Germany is, uber alles an export led economy, with exports representing 24% of GDP, the planners of the renewables initiative initially exempted large, energy intensive industry from paying the higher rates. Logically enough, they concluded that high power prices would compromise Germany’s ability to compete internationally. More recently, a new coalition government has proposed that, in the interest of “political peace in the family”, these previously exempt energy intensive industrial consumers must now bear part of the high costs of the energy transition. The industrial reaction has been to vote with their feet. BASF announced a multiyear investment program that assume the majority of new capital spending will occur outside of Germany, indeed outside of Europe.

Physician, Heal Thyself

Some economists have argued that Germany should simply purchase additional load following power from better-endowed neighbors. In fact, to some extent, that has occurred with Germany purchasing spot power from France and other neighboring countries. However, Germany’s attempts to sell surplus renewable power back to these same neighbors has been less than successful. This is because intermittent renewables are only available when the wind blows or when sunlight is available, not when the neighbors actually need the power. Germany’s neighbors, who have not yet bought in entirely to the new religion, do not have the ability to rapidly reduce their own domestic production in order to accommodate unpredictable foreign (German) surpluses. As a result, the Germans are exporting grid instability to their neighbors.

With no other options, German utilities have resorted to using coal in order to create power to compensate for the variability in renewable output. American hands are not exactly “clean” as we have become a major supplier of steam coal to Germany, coal we no longer need to burn in US based power plants.

Bipolar personalities and orphan power

“Energiewende”, a national policy intended to accelerate the use of renewables and to reduce both CO2 emissions and particulate air pollution, has instead produced the unintended consequence of multiyear increases in pollution levels. It has caused higher prices to be paid for power in order to accomplish this dubious result. At the same time the policy has irritated Germany’s partners on the European Grid by producing intermittent power when it isn’t needed. I have to believe that Germany’s engineering class foretold this result...Too bad the politicians weren’t listening.

Power to the People

Back in California, the state government has been figuratively wringing its hands over the potential for the development of shale gas. Californians like to use natural gas, most of it imported from other western states and Canada. Ordinarily they would love to have a new local source of supply. However, the problem for California is that much of the state is dry during the best of times and, from a water standpoint, this is not the best of times.

Low snow and rain levels are producing a “double whammy” for the state’s economy. While the legislature passed laws that legalize fracking, the implementation of enabling regulations has run afoul of the incremental need for water, either surface or subterranean, to support the fracking process. In a state renowned for its water wars between urban and rural interests, a new incremental need for water, even with the benefit of additional gas supply, is not good news.  

For Germany, the solution is a bit more intractable. The energy intensive manufacturers in Germany   are now being threatened by a political compromise that has them also paying for the higher costs of renewable penetration of the German power market. The government has now recognized that the residential polity can no longer bare the “unsustainable” higher costs of Energiewende without help from heavy industry.

The result is that their export oriented manufacturing economy is about to export itself to areas with a more welcoming attitude to affordable and sustainable energy supply.  Here on the US Gulf Coast the response is “Y’all come on down!”

German companies as diverse as BASF and Volkswagen have announced new and expanded production facilities along the US Gulf Coast (also known as “The American Ruhr”). As long as German political authorities continue to pander to their fantasies, they will have no choice. Of course we will continue to ship them all the coal they can buy. The Germans have a word for political fantasy that grounds on economic reality. They call it “Realpolitik”.

Eric Smith is a Professor of Practice at the A.B. Freeman School of Business at Tulane University. He serves as the Associate Director of the Tulane Energy Institute. He is a Chemical Engineer and has an MBA from the A. B. Freeman School at Tulane University. 

Renewable energy photo from BigStockPhoto.com

The U.S. Cities Profiting The Most In The Stock Market And Housing Boom

$
0
0

If anything positive can be said for the current tepid economic recovery, it has been very good to those who invest in the stock market or own real estate.

Property owners have been able to reap higher rents and sale prices, and the stock market has soared while the overall economy has registered only modest gains. However, only a precious few have benefited from the bull market on Wall Street. According to Pew Research, only 47% of American households own some stock, down from nearly two-thirds in 2007.

And of those who do own equities, the upper crust control the lion’s share. As of 2010, the wealthiest 20% of U.S. households held 91.7% of all U.S. stock; the top 5%, a shade over two-thirds; and the top 1% controlled 35%.

While incomes for the middle and working class have stagnated in the recovery, the booming stock market helped swell the income of the top 1% by 31.4% through 2012. Overall, the rich now account for 50% of the country’s wealth, more than at any time since 1917, when the income tax was introduced, and well above the level in 1928, at the end of the Roaring Twenties stock boom.

Just as the current asset-driven recovery has had disparate impacts depending on social class, it has affected different regions in divergent ways. To gauge which areas have benefited the most from asset inflation, Mark Schill, head of research at Praxis Strategy Group, looked at the percentage of income derived from rents, dividends and interest in the nation’s 52 largest metropolitan areas and 100 most populous counties.

The Codger Economy

The top of our list is dominated by areas where retirees and aging boomers, particularly the more affluent, are concentrated. Some 57% of Americans aged 50 to 64 own stock, according to Pew, twice as high a percentage as those under 30. People over 55 control well over half the nation’s wealth.

Also as they reach retirement, seniors are less likely to be earning income from wage and salary work, further driving up the share of income from rents, interest and dividends in retirement hot spots. The most well-to-do retirees are the most likely to become migratory snow birds, clustering in the nation’s warmest climes.

This includes the top five metro areas on our list, led by the Miami-Fort Lauderdale-West Palm Beach Metropolitan Statistical Area, where roughly 26.5% percent of income was earned this way in 2012, compared to a national average of 18.2%.

It’s followed by Tampa-St. Petersburg-Clearwater, Fla., and San Diego-Carlsbad, Calif.

These trends are even more evident when we look at the nation’s 100 largest counties. The top of the list is dominated by wealthy retirement counties, led by Palm Beach, Fla., where a remarkable 39.8% of income comes from stocks, rents and interest payments. It’s followed by two other affluent Florida counties: Lee (39.6%), whose largest city is Cape Coral, and Pinellas (29.1%), which is the home county for both St. Petersburg and Clearwater. Other retirement counties at the top of the list include No. 7 Broward (Ft. Lauderdale) and Pima, Ariz., which contains the city of Tucson.

Superstar Cities

The surge of profits for investors also boosts incomes in some of the metro areas whose economies have done the best overall in the asset-driven recovery. This is most marked in the San Francisco Bay area, which added more billionaires  last year than anyplace else in the country.

San Francisco-Oakland-Hayward ranks sixth on our metro area list, with 20.7% of residents’ income coming from rents, dividends and interest, and San Jose-Sunnyvale-Santa Clara comes in seventh (19.3%). This places them well ahead of traditional centers for plutocrats, such as Boston-Cambridge-Newton (16th) and, remarkably, the home of Wall Street, the primary beneficiary of asset inflation, New York-Newark-Jersey City (23rd).

Our counties list offers a more precise map of where asset-driven wealth is, showing that much of it is concentrated in the suburban reaches. Although much of the hype about new billionaires revolves around San Francisco, the real star in the Bay Area is somewhat more prosaic San Mateo County (fifth on our county list), home to tech giants such as Genentech and Oracle , and seven of the 10 largest venture capital firms in the Bay Area. In contrast, San Francisco County ranks 36th.

This diversion in the patterns of where investors and rentiers congregate can also be seen in the sprawling metropolitan area that contains the nation’s financial capital, the 19 million-person New York region. Greater Gotham is home to a remarkable four of the top 15 counties on our list, starting with No. 4 Fairfield County, Conn., a major center for the hedge fund and private equity industries, followed by two affluent suburban counties, Westchester (ninth) and Nassau (13th).

Among the five boroughs only one, No. 14 Manhattan (New York County) ranks in the upper echelon, while three outer boroughs — Queens, Brooklyn (Kings County) and the Bronx — are in the bottom 15 of the 100 largest counties. The heavily minority and poor Bronx ranks last.

Strongest Economies At The Bottom

Not surprisingly, many of the metropolitan areas at the bottom of our ranking are older Rust Belt towns, such as Cleveland-Elyria (44th) and Detroit (46th). These are places where poverty is more concentrated and much of the money has moved away, often to Sun Belt locales such as Florida.

However, the bottom of our list also features many of the nation’s most dynamic economies, including Raleigh, N.C. (43rd); Dallas-Ft. Worth-Arlington, (45th); Charlotte-Concord-Gastonia, N.C. (47th); Columbus, Ohio, (49th); and third to last and second to last among the 52 biggest metro areas, Houston-The Woodlands-Sugar Land, Texas, and Nashville-Davidson–Murfreesboro-Franklin, Tenn.

This appears to be largely a function of age. All these fast-growing areas are also thosemost attractive to young families  with children. These people are drawn primarily by the good prospects for wage employment — needed to support their families and buy houses — and are less likely to depend on rentier profits. Clipping bond coupons may play a big role in some economies, largely on the East and West Coasts, and notably Florida, but far less in those areas that are growing the old-fashioned way, by working for a paycheck.


Income from Interest, Dividends, and Rent
52 Largest U.S. Metropolitan Areas
RankAreaPopulation 2012Share of Income from interest, dividends, & rent
United States (Metropolitan Portion)267,664,44018.2%
1Miami-Fort Lauderdale-West Palm Beach, FL5,762,71726.5%
2Tampa-St. Petersburg-Clearwater, FL2,842,87824.6%
3San Diego-Carlsbad, CA3,177,06321.9%
4Jacksonville, FL1,377,85021.5%
5Virginia Beach-Norfolk-Newport News, VA-NC1,699,92521.3%
6San Francisco-Oakland-Hayward, CA4,455,56020.7%
7San Jose-Sunnyvale-Santa Clara, CA1,894,38819.3%
8Richmond, VA1,231,98019.2%
9San Antonio-New Braunfels, TX2,234,00319.0%
10Las Vegas-Henderson-Paradise, NV2,000,75919.0%
11Los Angeles-Long Beach-Anaheim, CA13,052,92118.8%
12St. Louis, MO-IL2,795,79418.6%
13Sacramento--Roseville--Arden-Arcade, CA2,196,48218.6%
14Washington-Arlington-Alexandria, DC-VA-MD-WV5,860,34218.5%
15Orlando-Kissimmee-Sanford, FL2,223,67418.5%
16Boston-Cambridge-Newton, MA-NH4,640,80218.5%
17Hartford-West Hartford-East Hartford, CT1,214,40018.4%
18Austin-Round Rock, TX1,834,30318.4%
19Seattle-Tacoma-Bellevue, WA3,552,15718.2%
20Rochester, NY1,082,28418.1%
21Denver-Aurora-Lakewood, CO2,645,20918.1%
22Portland-Vancouver-Hillsboro, OR-WA2,289,80018.1%
23New York-Newark-Jersey City, NY-NJ-PA19,831,85817.9%
24Baltimore-Columbia-Towson, MD2,753,14917.9%
25Chicago-Naperville-Elgin, IL-IN-WI9,522,43417.4%
26New Orleans-Metairie, LA1,227,09617.4%
27Milwaukee-Waukesha-West Allis, WI1,566,98117.3%
28Salt Lake City, UT1,123,71217.1%
29Buffalo-Cheektowaga-Niagara Falls, NY1,134,21017.0%
30Minneapolis-St. Paul-Bloomington, MN-WI3,422,26416.7%
31Providence-Warwick, RI-MA1,601,37416.7%
32Oklahoma City, OK1,296,56516.6%
33Kansas City, MO-KS2,038,72416.6%
34Phoenix-Mesa-Scottsdale, AZ4,329,53416.4%
35Philadelphia-Camden-Wilmington, PA-NJ-DE-MD6,018,80016.2%
36Riverside-San Bernardino-Ontario, CA4,350,09616.2%
37Atlanta-Sandy Springs-Roswell, GA5,457,83116.2%
38Birmingham-Hoover, AL1,136,65016.2%
39Grand Rapids-Wyoming, MI1,005,64816.0%
40Cincinnati, OH-KY-IN2,128,60315.9%
41Pittsburgh, PA2,360,73315.8%
42Louisville/Jefferson County, KY-IN1,251,35115.7%
43Raleigh, NC1,188,56415.7%
44Cleveland-Elyria, OH2,063,53515.4%
45Dallas-Fort Worth-Arlington, TX6,700,99115.2%
46Detroit-Warren-Dearborn, MI4,292,06014.8%
47Charlotte-Concord-Gastonia, NC-SC2,296,56914.4%
48Indianapolis-Carmel-Anderson, IN1,928,98214.3%
49Columbus, OH1,944,00213.3%
50Houston-The Woodlands-Sugar Land, TX6,177,03513.3%
51Nashville-Davidson--Murfreesboro--Franklin, TN1,726,69312.8%
52Memphis, TN-MS-AR1,341,69012.7%
Source: Bureau of Economic Analysis
Analysis by Mark Schill, Praxis Strategy Group


Income from Interest, Dividends, and Rent
Top & Bottom 25 Among the 100 Largest U.S. Counties
RankCountyPopulation 2012Share of Income from interest, dividends, & rent
1Palm Beach, FL1,356,54539.8%
2Lee, FL645,29339.6%
3Pinellas, FL921,31929.1%
4Fairfield, CT933,83525.4%
5San Mateo, CA739,31124.4%
6Lake, IL702,12023.8%
7Broward, FL1,815,13723.0%
8St. Louis, MO1,000,43822.8%
9Westchester, NY961,67022.5%
10Pima, AZ992,39422.0%
11Hillsborough, FL1,277,74621.9%
12San Diego, CA3,177,06321.9%
13Nassau, NY1,349,23321.7%
14New York, NY1,619,09021.7%
15Honolulu, HI976,37221.4%
16El Paso, CO644,96421.3%
17Montgomery, MD1,004,70920.9%
18Norfolk, MA681,84520.5%
19Ventura, CA835,98120.3%
20Travis, TX1,095,58420.2%
21Bergen, NJ918,88820.2%
22Middlesex, MA1,537,21520.1%
23Fairfax, Fairfax City + Falls Church, VA1,155,29220.0%
24Orange, CA3,090,13219.7%
25Baltimore, MD817,45519.7%
76Snohomish, WA733,03614.8%
77Mecklenburg, NC969,03114.8%
78Worcester, MA806,16314.7%
79Suffolk, MA744,42614.6%
80Collin, TX834,64214.5%
81San Bernardino, CA2,081,31314.5%
82Gwinnett, GA842,04614.4%
83Marion, IN918,97714.2%
84Jackson, MO677,37714.2%
85Kern, CA856,15814.1%
86Queens, NY2,272,77114.0%
87Tarrant, TX1,880,15314.0%
88Franklin, OH1,195,53713.9%
89Wayne, MI1,792,36513.8%
90Macomb, MI847,38313.7%
91Shelby, TN940,76413.6%
92Harris, TX4,253,70013.2%
93Denton, TX707,30413.2%
94Davidson, TN648,29512.8%
95Kings, NY2,565,63512.8%
96Will, IL682,51812.8%
97Hudson, NJ652,30212.7%
98Philadelphia, PA1,547,60712.5%
99Hidalgo, TX806,55211.1%
100Bronx, NY1,408,47311.1%
Source: Bureau of Economic Analysis
Analysis by Mark Schill, Praxis Strategy Group


This story originally appeared at Forbes.com.

Joel Kotkin is executive editor of NewGeography.com and Distinguished Presidential Fellow in Urban Futures at Chapman University, and a member of the editorial board of the Orange County Register. He is author of The City: A Global History and The Next Hundred Million: America in 2050. His most recent study, The Rise of Postfamilialism, has been widely discussed and distributed internationally. He lives in Los Angeles, CA.

Miami photo by Wiki Commons user Comayagua.

Viewing all 3793 articles
Browse latest View live


Latest Images