Quantcast
Channel: Newgeography.com - Economic, demographic, and political commentary about places
Viewing all 3771 articles
Browse latest View live

Detroit: A Chip off the Old Bulb

0
0

Seven months after the announcement, it still seems like the largest municipal bankruptcy filing (at least up to this point) is the stuff of legend—the culminating event, after successive blunders.  The apex.  Or the nadir. No doubt those of us living here are guilty of a degree of chauvinism as we experience how it plays out firsthand, but it’s easy for anyone with even moderate media curiosity to see how much the city has hogged the headlines.  It may be for all the wrong reasons, but Detroit is prominent once again.

Yet it was only weeks—if not days—after the declaration made international news that, in order to convey to the world the magnitude of the city’s financial woes, journalists honed in on more mundane failures—failures that, by virtue of their banality, were all the more shocking.  Locals have known about them for ages.  A portfolio of abandoned public school real estate larger than many cities’ functional school systems.  An absence of snowplows, even after heavy storms.  A stonewall of silenced civil servants, hogtied from effectively carrying out duties by daily uncertainty about the security of those same jobs.  The virtual absence of any emergency response, resulting in two-hour waits for an ambulance or a police call.

But the one that crowds out the rest, no doubt at least partially due to its ubiquity and ordinariness, is the persistent non-functionality of those streetlights.  One of the editorialists for the Free Press has branded it “the city’s deepest embarrassment”.  By most estimates, up to 40% are out on any given night.  Anyone passing through can tell when crossing into the city limits for this exact reason: even huge stretches of the interstates are black, although they’re state or federal highways.  It’s hard to determine if these shadowy streets originate from a cash-strapped DPW’s inability to replace the bulbs—which obviously require periodic maintenance—or an oversight that far precedes the checkered Kilpatrick administration, when the city’s fiscal woes first garnered national attention.  All it takes is a trip down Mack Avenue on the city’s east side to postulate that the problem is a half-century in the making.


Silhouettes of streetlights punctuate the dusky penumbra, but even at a distance, the shape of these lights seems odd.  Antiquated?  Probably.  And a closer view confirms it.


To be frank, I can’t recall seeing lights like this before anywhere else in the country, and I’m well-traveled across some of the more economically deprived pockets.  From the baroque iron filigree work of the stanchion to the acorn shape of the light itself, my guess is this streetlight comes from an inventory that most cities had fully retired over three decades ago.  And there’s probably good reason for that: this one is broken.


And so is another one half a block away.


About half of the lights along this stretch of Mack use this design, and most are cracked.  A big distended bulb offers more surface area encased in glass—more space for something to wrong.  Whether hit by flying debris hit or (my suspicion) deliberately smashed by a passer-by, this streetlight is almost definitely non-operational.  And the visible hardware is only half the problem: inside that quaint, clunky bulb (your grandmother’s streetlight) is—or was—a mercury vapor lamp. Detroit is one of the few cities that still depends heavily on this less efficient, increasingly obsolete method of illumination; most other large cities have replaced their inventory with superior metal halide lamps.   USA Today also noted that Detroit and Milwaukee share the dubious distinction of being the only large cities that still deploy series circuits for much of the streetlight network, meaning that if one transformer box breaks down, the whole strip of lights goes dark, like an old string of Christmas tree lights.  While the Mack Avenue streetlight featured above remains attached to a wood, other lights in the city append to metal poles, presumably the same age as the lights themselves, characterized by rust, peeling paint, and sometimes even open cavities at the base.  The whole contraption has seen better days.

But viewing these cracked eggs through a cultural lens can help temper some of the scorn.  They might not work well as modern lamps and they’re much easier to vandalize, but they’re relics—they’re curiosity items.  And they’re particularly eye-catching along Mack Avenue because there are so many of them, yet they’re still interspersed with more contemporary designs.  This cool pic doesn’t win awards for clarity, but it still shows the juxtaposition of old and new streetlights, through their silhouettes.


Or on opposite sides of the street.


And on a depopulated residential street not so far from Mack, a different kind of lighting style emerges—perhaps not as old-fashioned but still an oddity.


Perhaps a style and technology that never caught on?

The irony of the 1950s-era (or maybe even 1940s) lighting that lingers on in Detroit is that, in a broader spatial context, it exemplifies technological advancements playfully defying shifts in taste culture for a particular design.  On Mack Avenue, ancient streetlights bespeak a broke, ineffective government.  And yet, elsewhere in the metro, they convey something else.


Forgiving the quality of the photo, it’s still easy to see a similar style of lighting to the ones on Mack Avenue, but this time they’re impeccable.


But this is the comfy suburb of Livonia, presumably part of a streetscape improvement along a thoroughly auto-oriented corridor of strip malls and big boxes.  And they no doubt were a deliberate choice from the Public Works Department because they look good—providing a vintage, old-timey feel.  Apparently they don’t worry in Livonia about ne’er-do-well pedestrians throwing rocks at these distended bulbs.  Maybe it’s because Livonia has few ne’er-do-wells….and even fewer pedestrians.  But even some of the economically healthier neighborhoods within Detroit have caught the bug, replacing older streetlights with a newly vintage design, like these twin lamps in Midtown, near Woodward Avenue.


This inversion of taste cultures pervades streetscapes across the country, where everything old is new again, in order to exploit nostalgia among a generation that never really experienced a normative walkable environment—a landscape that was still the standard during the era when city crew first installed those acorn mercury vapor lamps.  We’re seduced by nostalgia and novelty; a hybrid of the two is doubly sweet.  Just go to the French Quarter in New Orleans, where a city equally negligent in modernizing its utilities now capitalizes on this same inertia—the flickery gas lanterns that once were a backwater embarrassment are now ambiance.  Detroit isn’t yet so lucky to take similar advantage of its obsolete lighting (and the fact that most streets like Mack are a hodgepodge of styles doesn’t help), but that doesn’t mean that an emergent cultural voice won’t someday call those lights “genuine retro”, and the preached-upon choir will be listening.

The periodic “freshening” of basic urban infrastructure is only partly due to necessity, as it may very well be in Detroit.  But a great deal simply has to do with keeping up with the joneses, resulting in often needlessly costly capital investments.  For example, the standard for pedestrian signals at intersections now typically involves a “countdown” timer, telling pedestrians exactly how many seconds they have left to cross.  While useful, are these timer boxes essential?  Regardless, public works departments are rapidly phasing out the single-box approach for these new timer-boxes, with little evidence of public advocacy one way or another (despite the fact that the public inevitably is paying for most of these replacement costs).  From decorative viaducts to Day-Glo yellow road caution signs, jurisdictions hell-bent on an infrastructural one-upmanship should look to Detroit as an inverse exemplar—what might happen when profligacy goes perpetually unchecked.  Unless, of course, these granny-and-gramps streetlights become hip and cool again, in which case the Motor City might have the last laugh.

This post originally appeared in American Dirt on February 27, 2014.

Eric McAfee is an itinerant urban planner/emergency manager who fuses his cross county (and trans-national) travels and love of contemporary landscapes into his blog, American Dirt, where a different version of this article appeared.


A Tale of 273 Cities

0
0

It was the best of times, it was the worst of times; it was the age of wisdom, it was the age of foolishness; it was the epoch of belief, it was the epoch of incredulity; it was the season of light, it was the season of darkness; it was the spring of hope, it was the winter of despair. 

Charles Dickens, A Tale of Two Cities

Since 1790, 273 cities have made an appearance on the list of the nation’s 100 largest places.

Cities of all shapes and sizes have made the list at one time or another - ranging from New York, which has held the top spot in every single census from the very beginning; to little Chillicothe, Ohio, which appeared once in 1830, at #87, and never made the list again.

Examining this list decade-by-decade is instructive, for it largely tracks the entire history of the nation’s settlement patterns - from the initial cultural hearths of Yankee New England and Tidewater Virginia; through the river and canal era; the railroad era; the industrial era; the interstate highway and suburban era; to the decline of the Rust Belt, and the triumph (for the time being) of the Sunbelt - and beyond.

The list tells the story of the relative decline of many cities - places like Providence (1790-1980); Dayton (1830-1990); and Des Moines (1880-2000), which were ranked in the top 100 for decades, have shrunk to one degree or another, and eventually fell off the list, but remain significant-sized urban centers today.

It also tells the story of the absolute decline of many cities - places like St. Louis, Detroit, Buffalo, Pittsburgh, and Cleveland - formerly huge cities that all once ranked in the top 10, which have now lost over half of their population.  All five of these cities remain in the top 100, but they are all suffering from the seemingly intractable problems that come with massive abandonment and disinvestment - fiscal instability, poverty, inequality, and a frayed civic and social fabric.  Here in 2014, their collective future, especially in their current form, is increasingly uncertain.

And that - looking toward the future - is why this topic is truly important. Examining this information is about far more than a trivial jaunt down memory lane.  What does it tell us about the future of our cities?

For one, there is this question: Does any of this even matter?

Is the size of our central cities even important? Aren’t city boundaries arbitrary and meaningless?  Isn’t it the surrounding metropolitan region that really counts?

Well, it’s a complicated story.  For years, pundits, prognosticators, and policy wonks have been telling us that the age of the central city is over; that it is the region that is important.  Economies are based on regional job markets, they say, and improvements in transportation and communications are making local places (even large ones) increasingly irrelevant.

The fact that economies are regional is true - as far as it goes.  But like anything viewed through one lens only, it does not tell the whole story.

Are regions important? Of course. But so are places.  Like so many other things in the realm of urban public policy, this is not a binary, either/or, choice.

Indeed, at the same time that we are being told by one set of pundits about the irrelevance of our cities, we have another set of pundits telling us that this is, in fact, a new golden age for our cities.

Cities entered a long cyclical downturn following World War II, they tell us, but they are now on the rebound, and are experiencing an unparalleled renaissance. Property values are increasing, Millennials are moving to our downtowns, and previously declining neighborhoods are coming back to life, replete with upscale shops, bistros, and pubs. 

But this doesn’t tell the whole story, either. For every gentrifying formerly shrinking city like New York, Washington, and San Francisco, and for every sprawling boom town like San Jose, Charlotte, or Columbus; there is a St. Louis, a Cleveland, and a Detroit; and there is a Gary, a Flint, and a Youngstown.

What does the future hold for these cities?  What about the giant places full of the mind-boggling, post-apocalyptic decay and dysfunction that comes with literally losing one million residents, like Detroit?  

And what about the mid-sized places, like Flint, that may not have the assets or the resources to ever turn the corner.  Will they continue to die a slow, agonizing death, and literally disappear?  Or will they continue on in a shadow-form, serving as a cautionary tale, and inhabiting some type of uniquely American, urban equivalent of purgatory?  

Or can they be restored - if not, perhaps, to their former glory, to at least something that is stable, equitable, and workable for those that remain?

This post is full of more questions than answers.  It is an inherently complicated topic.

Big Questions for the Rust Belt

While it is true that cities have grown and declined (and sometimes grown again) throughout American history, it is also true that we have never before experienced the unprecedented population decline that some of our largest cities have experienced over the past 60 years, especially those in the Rust Belt.

Rust Belt cities have experienced the triple whammy of structural economic decline (the outsourcing of manufacturing); continued regional outmigration (to the Sunbelt); and continued suburbanization (in a region with a strong tradition of local government and a deep antipathy toward consolidation).  All three of these things make the shrinkage of its cities unique, from a historic standpoint.

When a large city loses over half of its population, whether that equates to one million people (Detroit); 500,000 people (Cleveland); or 100,000 people (Youngstown), there are very real consequences for the very real residents that remain.  Even if these particular cities were experiencing widespread regional prosperity and economic growth (they are not), it would not fundamentally change the social and economic reality for city residents living with the consequences of widespread abandonment in these places.

Regardless of what some advocates of regionalism might say, city boundaries are not arbitrary and meaningless.  Although some may claim that shrinking cities are no big deal as long as the metropolitan region overall is growing, central cities will continue to profoundly matter, especially to the people (often disproportionately poor) that remain.

Municipal boundaries are not irrelevant, whatever the regionalists may tell you.  Economies may be regional, but in most of the nation’s fastest declining cities, government is not.  Municipal boundaries affect taxation, land use policy, public safety, education, public infrastructure, and the delivery of social services. 

When a city’s population declines precipitously, the proportional demand for the public services that it provides shrinks less than its population, with the end result that its residents end up paying more in taxes, for less in services.  Even if this were not the case, it is expensive and (politically speaking) exceedingly difficult to scale-back and shrink long-term capital investments in public infrastructure – as “shrinking cities” like Detroit and Youngstown have discovered.  

What goes on within a given city’s actual municipal boundaries has incredibly important ramifications for its tax base; its employment base; the performance of its schools; the distribution of everyday amenities like grocery stores, shops, and restaurants; the delivery of public services; and less tangible, but equally important things like its sense of place and its sense of itself.  As cities are abandoned, decline, and become hollowed out, access to social and economic opportunities diminishes along with the population:  the jobs disappear, the doctor’s offices disappear, the grocery stores disappear – relocated, often, to a distant and increasingly inaccessible locale.  To pretend as though the economic and social well being of city residents is not directly impacted by population decline is to turn a blind eye to reality itself.

But it is not just city residents that are affected by decline.  The health of the entire region suffers as a result.  The shrinking tax and resource base of City “A”, is not simply counteracted by economic growth in nearby cities “B” and “C”.  In a region anchored by a declining central city surrounded by dozens of separate municipalities, the redundant duplication and proliferation of local government services (education, public safety, public utilities, transportation infrastructure, social services) ends up costing all taxpayers more. 

The worst-case scenario is a shrinking central city and a shrinking region with an overall population decline, coupled with continued central city abandonment and continued outward expansion.  In a region like this, there is not only more costly “stuff” (redundant public services and physical infrastructure) than there needs to be, but there is more “stuff” with ever fewer taxpayers to pay for it.

And while the conventional wisdom may be that regional, not local, economies are what matter, it is important to understand that regions comprised of dozens of separate local jurisdictions do not typically behave very effectively as “regions”.  It is not impossible for them to do so, but it is exceedingly difficult. 

So why don’t we just go ahead and combine everything?  Problem solved, right?

Not so fast. 

It has always been interesting to me that the Sunbelt is the region of the country that tends to have the fewest number of local governments, the most liberal annexation laws, and is home to most of the cities that have undergone major city/county consolidations (such as Jacksonville, Nashville, Augusta, Lexington, and Louisville). 

This wasn’t always the case.  Philadelphia consolidated with its neighboring suburbs (some of the largest cities in the country at the time) in 1854, and New York City did the same thing (merging with Brooklyn – then the nation’s 4th largest city, and the other three boroughs) in 1898.

From a public policy standpoint, most of the South and the West is typically regarded as “conservative”; while much of the Northeast and Midwest is viewed as “liberal”.  In this stereotypical telling of the tale, conservatives are supposed to belaissez-faire in terms of urban planning and public policy and are supposed to reflexively favor the local over the regional.

Yet it is precisely in the “conservative” South and West where the people have been most willing to change the model of government and public service delivery to align with modern social and economic realities.  Effective government and accountability is still viewed as extremely important, but voters have recognized the benefits of having less duplication and more efficient delivery of services, as well as the regional cohesion and political power that annexation and consolidation can bring with them.

Urban development patterns and public policy decisions on infrastructure are often different in the Sunbelt as well – especially in the West.  New development tends to be denser and more compact than it does in the Rust Belt.  Not many people know that “car crazy” Los Angeles is actually the most densely populated urban area in the United States, or that “sprawling” Las Vegas ranks 10th.  The Los Angeles “suburb” of Santa Ana is twice as densely populated as the “city”of Cleveland.

Some of this has to do with the fact that scarce water supplies don’t allow for scattershot suburban development, and some of it has to do with an increasingly urban ethos that has evolved, especially in California, over the past 50 years.  Cities and urban residents are not viewed with the same degree of mistrust, suspicion, and disdain that they are viewed with in the Rust Belt.

So, the Sunbelt is usually posited as an economic success story, especially in comparison with the Rust Belt.

But the questions remain:  Was it due to less duplication of local government?  Was it in spite of it?  Or did it have nothing to do with it one way or the other?

No one really knows for sure.

There is little doubt in my mind that some of the reason for the growth and economic prosperity of Sunbelt cities, and for the corresponding decline of Rust Belt cities, is the failure of most Rust Belt cities to adjust their local government paradigms to reflect modern economic realities. 

One only need contrast Cleveland with Columbus, or Detroit with Indianapolis to at least get a general sense of the divergent paths that several pairs of Rust Belt cities have taken, and to make some general comparisons between their regional economic outcomes.

But, these comparisons are not “apples to apples”, either, and it is extremely problematic to claim that the key to Columbus’ economic success (in comparison with, say, Cleveland) has solely been due to its aggressive annexation of nearby communities.

But, with Columbus sitting as the 15th largest city in the U.S. today, and continuing to attract new residents, and with Cleveland dropping from 5th to 45th, and continuing to lose population, it is probably fair to say that it had something to do with it.

If Rust Belt cities had annexed or consolidated with surrounding communities earlier, they would be larger and more cohesive today, and it is probably fair to say that they would have more political clout at the state and national level.  They also could have been better positioned to shape how their surrounding regions grew – into something denser, more compact, more cohesive, and less duplicative of public services and infrastructure.

Could have, would have, should have. That horse has largely left the barn.

Today, it is a fair question to wonder how effective (never mind politically feasible) it would actually be to retroactively superimpose the Sunbelt model upon Rust Belt cities.  Making Buffalo look and function like Charlotte, on paper, would be very different from making it look or function like Charlotte, in reality. 

In most Rust Belt cities today, the fact of the matter is that the incoherent and incohesive development patterns have already occurred, the infrastructure has already been duplicated, and the social and economic mismatches and inequities already exist. 

These problems need to be addressed, but clumsily imposing a model that has appeared to work throughout much of the Sunbelt, without taking the time to understand how it would work here, might not be the answer for our region.  It might just be trying to force a very ineffective square peg into a very politically infeasible round hole.

So, what will the future hold for our cities?  How can we knit them and their surrounding regions together to create an effective, politically feasible, governing framework that works for all of our residents, rich and poor, black and white, urban and suburban? 

I don’t know, but I know that it has to do with starting small, working on fundamentals, building trust, inspiring hope, and building authentic relationships between real people. 

It is the urban policy question of the 21st Century in the Rust Belt, and it is something that urban advocates, political leaders, policy wonks, and everyday citizens will need to grapple with for the rest of my lifetime.

Now, for the Maps…

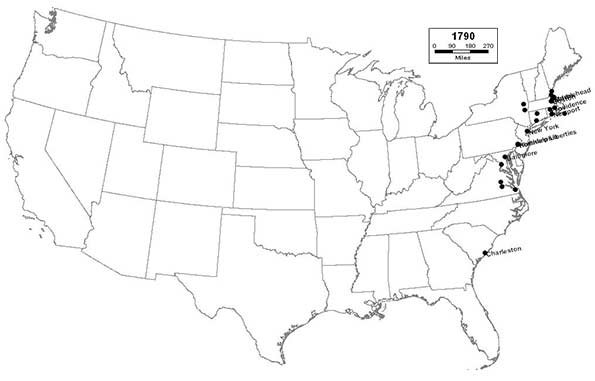
The maps below tell the story of how the 100 largest U.S. cities have changed decade-by-decade since the first census in 1790. Please note that only cities over 2,500 are included, so several of the maps from the earliest census years show less than 100 cities.  The 10 largest cities in each census year are labeled.  

Due to the scale of these maps, Alaska and Hawaii are not shown (Honolulu and Anchorage both rank in the top 100 today).

Below each map you will find a short description of some of the historic, demographic, economic, and transportation trends that were in play at the time of each census. I have also included a breakdown of how many cities in each region of the country ranked in the top 100.

For more detailed information on the 100 largest cities, census-by-census, please click here

1790 - Northeast (18); Midwest (0); South (6); West (0)

In the immediate aftermath of the American Revolution, all of the the largest cities are concentrated along the eastern seaboard.  At the time of the first census, New York City ranked as the nation’s largest - a title that it will go on to hold for the next 220 years; and likely - in perpetuity.  Philadelphia, Boston, Charleston, and Baltimore round out the top five.

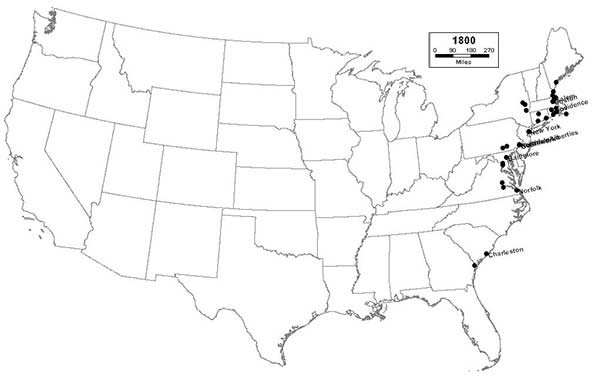
1800 - Northeast (24); Midwest (0); South (9); West (0)

As the 19th Century dawns, the largest cities continue to be clustered along the eastern seaboard as the brand-new nation begins to expand slowly inland. The nation’s new capital, Washington, D.C., joins the list, ranking 31st.  

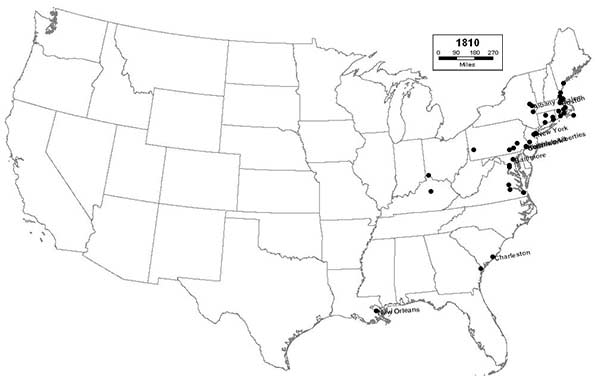
1810 - Northeast (34); Midwest (1); South (11); West (0)

This census marks the beginning of the era of ascendance for the great inland river cities, such as New Orleans, Pittsburgh, and Cincinnati.  These cities will serve as key centers of trade and commerce as the interior frontier of the new nation begins to be settled.

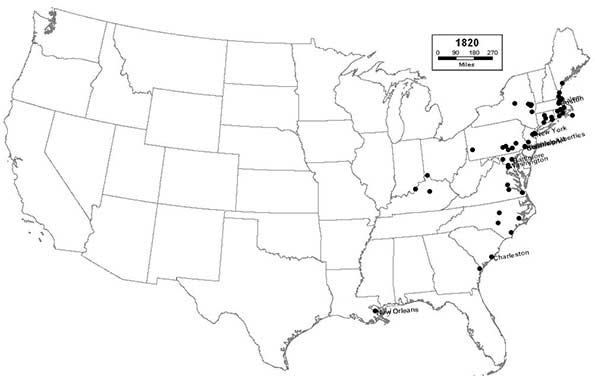
1820 - Northeast (43); Midwest (1); South (17); West (0)

The inland river cities, like Louisville, continue to grow and expand.  The importance of waterways increases further as the canal era dawns, literally putting places like Utica on the map.

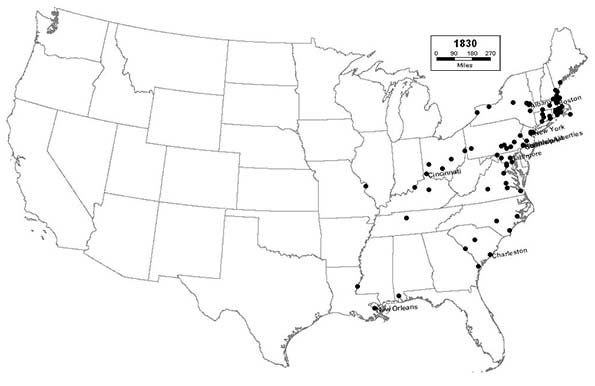
1830 - Northeast (59); Midwest (6); South (25); West (0)

Places throughout the industrial northeast, especially in New England, now firmly dominate the list of the nation’s largest cities. The canals throughout New York, Pennsylvania, and Ohio begin to spur new settlement and industry in places like Buffalo, Rochester, and other smaller cities immediately west and east of the Appalachians. The river cities continue to grow rapidly, as Cincinnati enters the top 10, and St. Louis joins the list.

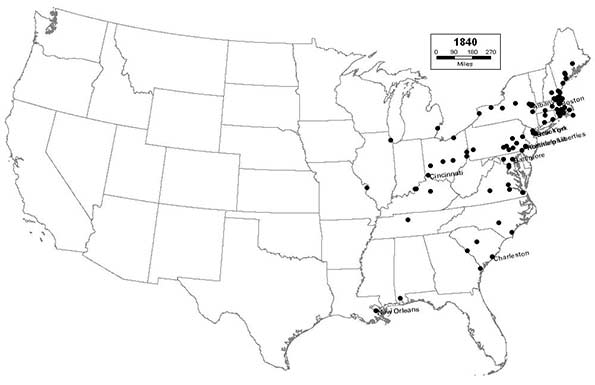
1840 - Northeast (67); Midwest (10); South (23); West (0)

The Great Lakes region begins to develop, thanks to the canals, as Detroit, Cleveland, and Chicago join the list. This region will begin to serve as a staging area for the people and goods needed to develop the areas west of the Mississippi.  The Northeast, bolstered by new immigrants from Ireland, remains the urban heart of the nation. 

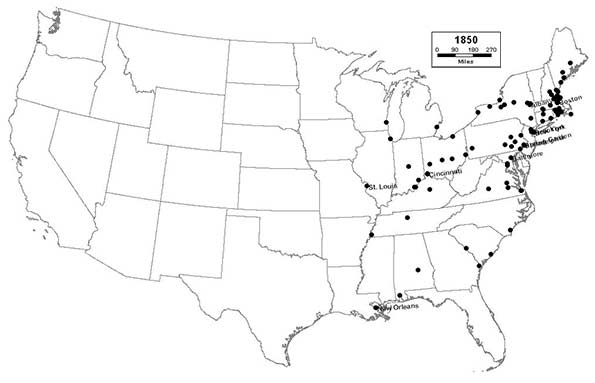
1850 - Northeast (64); Midwest (12); South (24); West (0)

The canal system reaches its mature peak, as strategic locations on the Great Lakes and inland rivers and canals, such as Milwaukee, Memphis, and Syracuse flourish. St. Louis enters the top 10.  The relative importance of the eastern seaboard begins to diminish, especially in the South, as the Ohio and Mississippi rivers begin to rival it in importance. Charleston drops out of the top 10 for the first time since 1790.

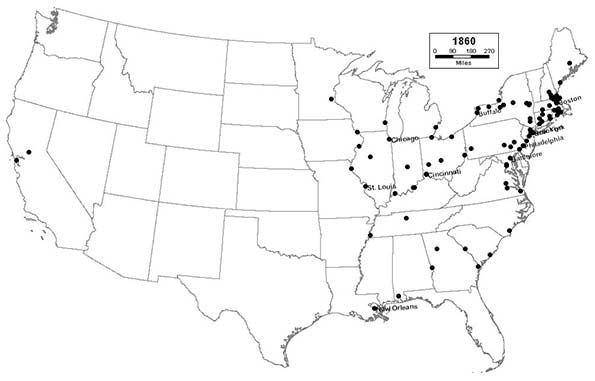
1860 - Northeast (60); Midwest (17); South (21); West (2)

As the Civil War dawns, railroads begin to surpass the canals in importance, as new cities like San Francisco, St. Paul, and Atlanta join the list.  The nation’s largest cities will become increasingly dependent upon the railroads for the next 100 years.  For the first time, Midwestern cities begin to rival eastern seaboard cities in importance, as Chicago enters the top 10, joining Cincinnati and St. Louis.  But the Northeast remains the nation’s urban powerhouse, as Philadelphia consolidates with its neighboring suburban towns to become the nation’s second largest city and New York’s closest, but still distant, rival. 

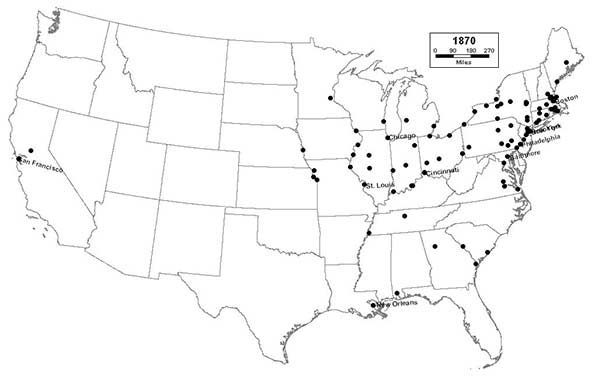
1870 - Northeast (54); Midwest (26); South (18); West (2)

New Midwestern cities like Kansas City, St. Joseph, and Omaha flourish as important gateway railroad terminals from which the Great Plains and the remainder of the West will eventually be settled. The South begins a long period of urban and economic decline following its defeat in the Civil War. The cities of the West Coast begin a period of rapid settlement, as San Francisco enters the top 10.

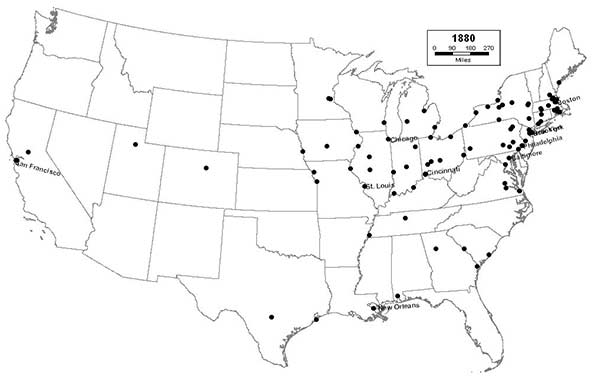
1880 - Northeast (48); Midwest (27); South (20); West (5)

Westward settlement spreads rapidly via railroad across the Great Plains, the West, and Texas, as new cities like Minneapolis, Des Moines, Denver, Salt Lake City, and San Antonio join the list.

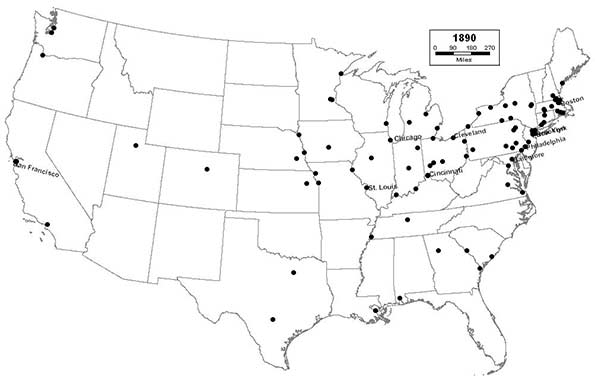
1890 - Northeast (45); Midwest (29); South (18); West (8)

The nation’s manufacturing heartland and industrial base begins to shift from New England to the Great Lakes, as Youngstown join the list, Cleveland enters the top 10, and Chicago surpasses Philadelphia as the nation’s second largest city. The West Coast begins to grow rapidly, as Los Angeles, Seattle, and Portland all join the list, along with Dallas; setting the stage for the eventual domination of the nation’s urban landscape by California and Texas.

1900 - Northeast (46); Midwest (26); South (21); West (7)

As the 20th Century dawns, after nearly four decades of economic decline, the South turns the corner and begins its economic recovery as new industrial cities like Birmingham and Houston join the list.  Mid-sized cities in the Great Lakes region, like Akron, begin to grow rapidly, as a new wave of immigrants from southern and eastern Europe settles throughout this rapidly industrializing part of the country. With railroads now linking the nation from coast-to-coast in several different corridors, the American settlement frontier officially disappears. New York City consolidates with nearby towns and with cross-river rival, Brooklyn, the nation’s 4th largest city, to reach a population of 3.5 million, and achieves unparalleled domination of the nation’s urban hierarchy.

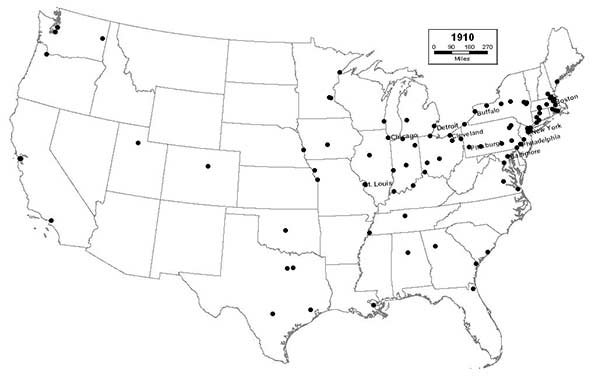
1910 - Northeast (45); Midwest (27); South (19); West (9)

The Great Lakes region continues to thrive as its cities grow larger and more prosperous, and Pittsburgh enters the top 10. Cincinnati drops out of the top 10, but remains a vibrant and expanding urban center. Southern cities, like Fort Worth, Oklahoma City, and Jacksonville join the list, giving Florida a top 100 city for the first time.

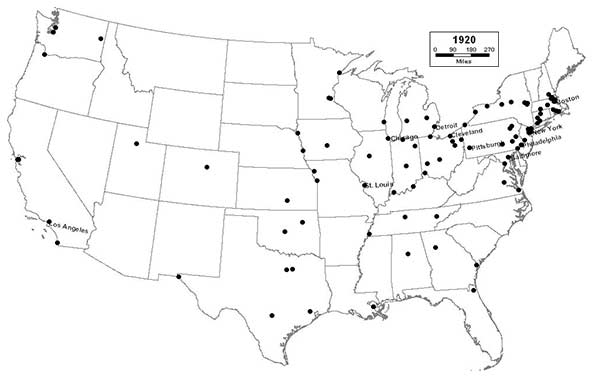
1920 - Northeast (40); Midwest (29); South (21); West (10)

Smaller industrial cities in the Great Lakes region, like Canton and Flint, thrive as the steel and automotive industries explode, and Detroit, “The Motor City”, enters the top 10. Charleston drops out of the top 100 for the first time since 1790. Southern California, poised to eventually become the nation’s prototypical urban region, begins its period of automobile-age ascendance as San Diego joins the list, and Los Angeles enters the top 10. 

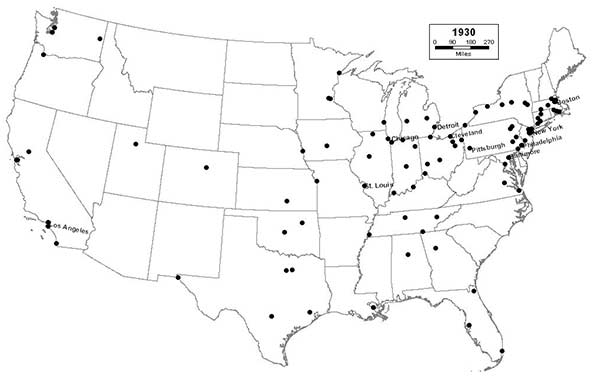
1930 - Northeast (36); Midwest (29); South (23); West (12)

Industrialization in the Great Lakes region reaches its apex in overnight boom towns like Gary, as the region becomes the manufacturing center not only of North America, but of the entire world. The Sunbelt’s period of growth begins in earnest, as cities in California and Florida, like Long Beach, Miami, and Tampa expand rapidly.  In contrast, a period of long, steady decline ensues in smaller industrial cities throughout the Northeast, in general, and New England, in particular.

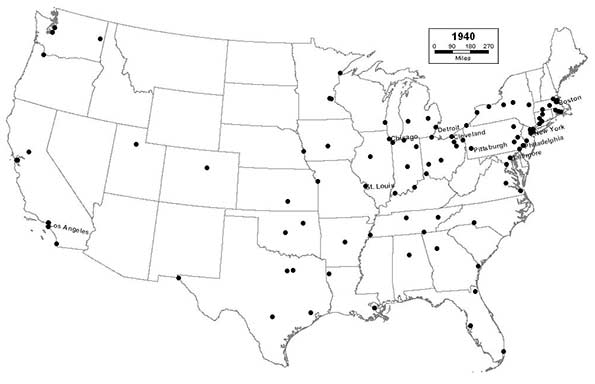
1940 - Northeast (33); Midwest (28); South (27); West (12)

The preceding decade is a difficult one for the nation’s cities.  Very few cities grow in the immediate aftermath of the Great Depression. Northern industrial cities are hit particularly hard, but some southern cities, like Charlotte, begin to flourish.

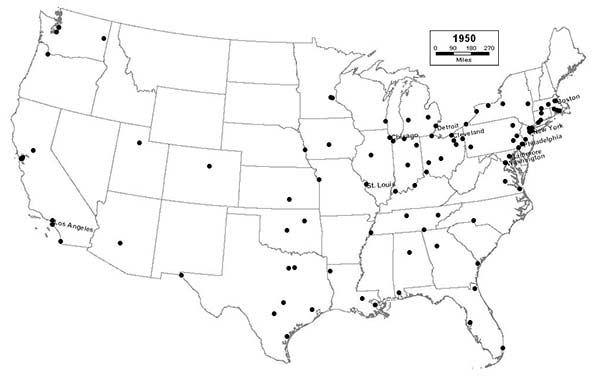
1950 - Northeast (28); Midwest (27); South (31): West (14)

For the first time, the South surpasses the Northeast as the region with the most cities in the top 100, as Austin and Baton Rouge join the list. Pittsburgh drops out of the top 10, as industrial decline in the Northeast accelerates after a brief uptick during the war. Washington, D.C. enters the top 10, due in large part to the expansion of the federal government during the Great Depression and World War II.  Phoenix joins the list at #99, presaging the rapid development of the desert Southwest in the coming decades; a small desert crossroads at the beginning of the 20th Century, it will end the century as the nation’s sixth largest city.

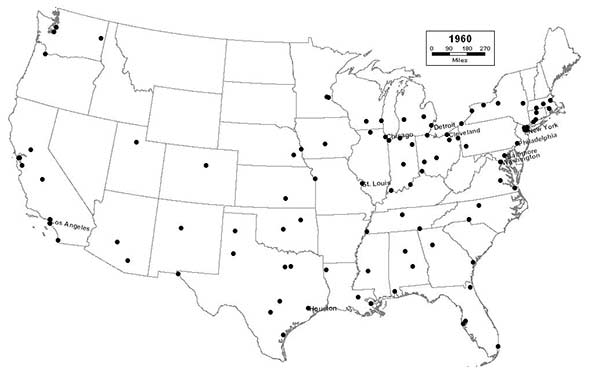
1960 - Northeast (19); Midwest (28); South (35); West (18)

Both suburbanization and deindustrialization become major factors in central city decline, especially in the North, where major cities are hemmed in by adjacent cities and towns, and are therefore unable to expand via annexation. The long tradition of town, borough, and township government throughout the entire North stymies efforts to consolidate governments into units that better reflect modern realities. Boston drops out of the top 10 for the first time since 1790. The expansion of the Interstate Highway System takes its toll, especially on mature Northern cities, by opening up outlying areas for suburban development, and by displacing business and residents in the urban core.  Most cities throughout the Midwest have now reached both the peak of their population and their industrial development.  In the coming years, they will increasingly follow the pattern established in the Northeast 30 years earlier, as the region begins to transition from the “Great American Manufacturing Belt” to the “Rust Belt”.  In contrast, the Sunbelt continues to enjoy explosive growth, as Houston enters the top 10, and San Jose, Tucson, Albuquerque, and Honolulu join the list. 

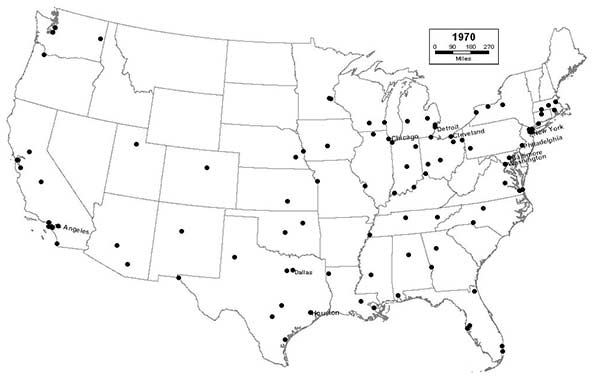
1970 - Northeast (16); Midwest (28); South (35); West (21)

Anaheim, Santa Ana, and Riverside join the list, as Southern California continues to attract new immigrants, both foreign and domestic, in record numbers.  The largest Southern and Western cities continue to grow even larger, as Dallas joins the top 10. The industrial Midwest begins to experience a period of rapid decline, as St. Louis drops out of the top 10. 

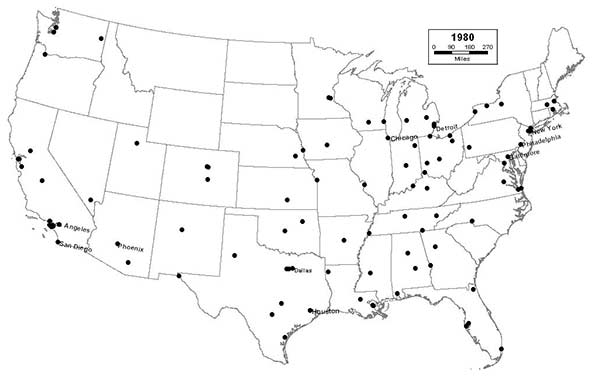
1980 - Northeast (12); Midwest (24); South (38); West (26)

Colorado Springs and Las Vegas join the list, as the interior West continues to grow rapidly.  The growth of the West extends to Alaska, as Anchorage makes the list for the first time.  Even the suburbs of sunbelt cities, like Arlington, Texas, and Aurora, Colorado begin to surpass established Northeastern and Midwestern central cities in population. San Diego and Phoenix join the top 10. Midwestern cities continue to deindustrialize rapidly, and begin losing population at a truly alarming rate. Suburbanization, white flight, and the inability to annex or consolidate with outlying areas make the problem of industrial decline even worse, as Cleveland drops out of the top 10. 

1990 - Northeast (9); Midwest (21); South (40); West (30)

Cities throughout the Sunbelt continue to grow in size, prominence, and influence, as Los Angeles surpasses Chicago as the nation’s second largest city.  Three of the nation’s 10 largest cities are now located in Texas, as San Antonio joins the top 10.  Sunbelt “boomburbs” continue to explode as cities like Mesa, Arizona; Garland, Texas; and Fremont, California join the list, displacing older eastern cities like Syracuse, Worcester, and Providence, which drops out the top 100 for the first time since 1790.

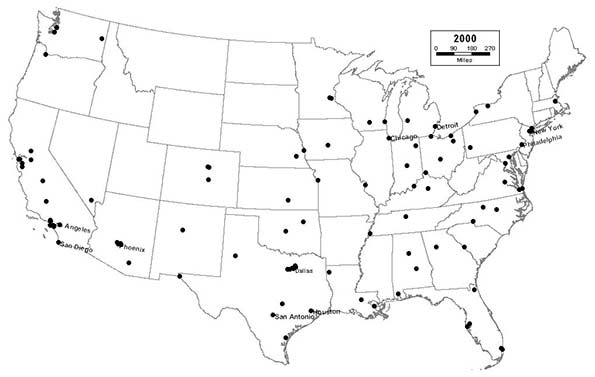
2000 - Northeast (9); Midwest (20); South (40); West (31)

The previously established patterns of Rust Belt decline and Sunbelt expansion begin to stabilize, although many Rust Belt cities continue to lose population at an alarming rate.  Dayton drops out of the top 100 for the first time since 1830. Sunbelt boomburbs continue to grow rapidly, as Plano, Texas; Glendale, Arizona; Scottsdale, Arizona; and Irving, Texas all reach the top 100.  

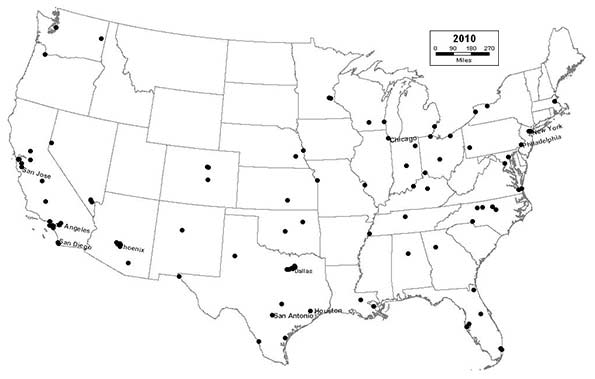
2010 - Northeast (8); Midwest (17); South (39); West (36)

The Sunbelt achieves complete dominance of America’s urban landscape, as 6 of the nation’s 10 largest cities are now located in California and Texas. Rust Belt cities like Cleveland, which experienced a slight respite from decline throughout the 1990s, begin a new period of free-fall, as the housing market collapses in the late 2000s.  Detroit drops out of the top 10.  Akron drops out of the top 100.  Sunbelt cities continue to eclipse their Rust Belt counterparts, as Reno, Orlando, Winston-Salem; Henderson, Nevada; Chula Vista, California; and Irvine, California all reach the top 100.

This post originally appeared in Jason Segedy's Notes From the Underground on April 14,, 2014.

Segedy is the Director of the Akron Metropolitan Area Transportation Study, the Metropolitan Planning Organization serving Akron, Ohio.  As a native of Akron, and as an urban planner, he has a strong interest in the future of places throughout the Great Lakes region, and in the people that inhabit them.

America Down But Not Out

0
0

America, seen either from here or from abroad, doesn’t look so good these days. The country that maintained world peace for decades now “leads by behind,” or not at all. You don’t have to have nostalgia for George W. Bush’s foreign policy to wish for someone in the White House who at least belongs in the same room with the likes of Vladimir Putin. Some wags now suggest that President Barack Obama has exceeded Jimmy Carter in foreign policy incompetence – Carter certainly was more effective in the Middle East.

What about space? Remember, we won the space race but now have to depend on Russian launch vehicles to do much of anything in orbit. President Obama thought we could rely on the Russians to provide us with cheap rides into orbit, but Putin squashed that notion after we objected to his actions in Ukraine. John Kennedy must be turning over in his grave.

And as for our domestic economy, the best you can say is “It could be worse,” particularly if you look at what’s happening in torpid Europe. It’s a sign of our utter lack of confidence that the current administration, and much of the punditry, still thinks we should follow the Continent’s economic and social policies.

Yet, despite all these challenges – and two presidencies the public ranks among the worst in history – it’s far too early to write off the United States. After all, no one else is doing very well. Even the widely touted BRICS countries – Brazil, Russia, India, China and South Africa – face slowing growth and mounting social problems.

There are several factors that help explain why the USA’s long-term prospects are better than many Americans may assume.

Entrepreneurial edge

The essential strength of the U.S. economy has rested on having two things that rarely occur together – an innovative culture combined with massive natural resources. Whole industries, notably technology, years ago thought to be lost to Japanese and other Asian competitors, have recentralized in the United States. In 1990, six of the world’s top 10 semiconductor companies were Japanese; by 2011, five U.S. chip companies dominated the top 10, which included only two Japanese companies, Toshiba and Renesas. And their combined revenue in 2012 was less than half that of world leader Intel’s $49.7 billion.

As of now, there’s not a key technology sector where the U.S. is not in the lead. We dominate social media, software and biotechnology. In fact, about the biggest technical threat we face is from the administration’s bizarre desire to surrender control of the Internet to foreign countries, many of whom, the president may acknowledge, do not share our values or relish our current predominance. Over time, to be sure, there will be challengers, notably China, South Korea and India, but none are likely to gain predominance in the near future. The same can be said in media; Hollywood still reigns supreme and U.S. dominance in fashion, lifestyle and music remains mostly in place.

The advantage of size

Other important countries are geographically large, but none – apart from Australia or Canada – is particularly rich. Russia is an oil plutocracy but beyond energy and weapons doesn’t export much else. China has a large land mass, but less resources, and its ability to feed itself will be increasingly constrained by pollution and diminishing water supplies. The country, by some estimates, has lost 28,000 rivers.

In contrast, America has a huge agricultural base, spread across a vast continent. If California goes dry for a spell, for instance, there’s lots of water and fertile soil in the northern Plains, the Southeast, the Midwest and parts of the Northwest. Size is a form of arbitrage that allows production to move from one place to another. Others are investing heavily in farm land and other real estate, evidence not of American decline, but, instead, of the patterns of investment that led to the country’s great expansion in the 19th century.

The energy revolution

The United States could be on the cusp of another period of broad-based industrial expansion, spurred, in part, by its rapidly growing natural gas and oil production. The current energy and industrial boom, notes Joe Kaeser, president of the German multinational conglomerate Siemens, “is a once-in-a-lifetime moment.” Cheap and abundant natural gas is luring investment from manufacturers in Europe and Asia, who now must depend on often-insecure and more expensive sources of energy.

The energy revolution has helped spark an industrial boom. There is already a shortfall, notes a recent Boston Consulting Group study, of some 100,000 skilled manufacturing positions in the U.S. By 2020, according to BCG and the government’s Bureau of Labor Statistics, the nation could face a shortfall of around 875,000 machinists, welders, industrial-machinery operators and other highly skilled manufacturing professionals.

New capitalist revolution needed

America’s capacity for perpetual renewal – what one Japanese scholar Fuji Kamiya calledsokojikara, a latent power to overcome seemingly insurmountable obstacles – persists but is limited by our political leadership in both parties as well as misguided economic policies. We need to alter contemporary capitalism’s tendency to favor and encourage transactions among investors and asset inflation, rather than fostering broad-based growth that rewards people adequately for their labor.

Fortunately, the capitalist system, particularly one under democratic control, allows for the possibility of reform, as occurred in 19th century Britain and early 20th century America. What is needed now is structural reform that can shift priorities away from rent-seeking and towards true wealth creation.

One clear priority is to reduce “financialization” of the economy. Over the past three decades, financial-services firms have doubled their share of the economy. The Obama recovery, with its bailouts of large banks and free-money policies for investors, has accelerated this trend, as companies have tended to be slow to reinvest profits in new products and innovations, preferring, instead, to engage in mergers or stock buybacks that raise share prices and reward investors, but do little for the overall economy.

In contrast, financial institutions often regard productive industries – notably manufacturing – as hampering short-term financial gains. This has repeatedly pushed companies to strip their industrial assets, typically moving them overseas.

Reforming capitalism toward a broader and more inclusive focus may not appeal to some – Wall Street investors, speculators in high-end real estate and tech oligarchs – who have done just fine the past five years. But, when asked what mattered more to them, most Americans preferred economic growth to redistribution, noted a 2014 studyconducted by the Global Strategy group, a Democratic consulting firm.

Polls of popular opinion in the United States and the United Kingdom find key ecological concerns, such as climate change, well down the list, behind such issues as the economy, immigration, crime, unemployment and even the state of morality. What Americans want most, notes political commentator Mike Barone, is “an economic boom.”

Such a broad-based economic boom is necessary if we are to restore America’s promise for this generation and, more importantly, the next. The country still has all the requisite advantages to lead in the next century and restore the middle class – if only the political leaders either rise to the occasion, or get thrown out.

This article first appeared in the Orange County Register.

Joel Kotkin is executive editor of NewGeography.com and Distinguished Presidential Fellow in Urban Futures at Chapman University, and a member of the editorial board of the Orange County Register. He is author of The City: A Global History and The Next Hundred Million: America in 2050. His most recent study, The Rise of Postfamilialism, has been widely discussed and distributed internationally. He lives in Los Angeles, CA.

USA map image by BigStockPhoto.

Long Island Needs Regionalism

0
0

Eric Alexander, the Executive Director of Vision Long Island, seems to be popping up everywhere on Long Island these days. He was recently quoted in The Corridor Magazine’s transportation and infrastructure issue as saying: “Academic conversations about regionalism is a 90s thing.” Similar to his condemnation on “academic” commentary concerning the downtown redevelopment trend, Alexander made it clear in the piece that he feels a local, downtown-centric approach is the way to go.

Whether we like it or not, Long Island is a singular region.

If Long Island’s developmental future is divided and segmented municipality-by-municipality, we, as a collective whole, will fail. The Village of Rockville Centre, one of Long Island’s much-touted “cool” downtown areas, shares the same aquifer system as Rocky Point. If a company abandons their corporate headquarters in Lake Success, residents in Suffolk feel the economic blow. Despite claims to the contrary by special interests and stakeholders, we are one Island. Our social, economic and environmental policies must reflect that fact.

It is in the interest of builders, developers and stakeholders for Long Island’s developmental future to remain both segmented and divided under the guise of “localism”. Divide, and conquer, as the saying goes. When projects are looked at a regional level, they are more heavily scrutinized, and their impacts are more thoroughly explored.

Here is a scenario: A small village on Long Island is welcoming the economic windfall a particular development is slated to bring, while five miles north to the village, an unincorporated area fears their shops will wither thanks to the influx of shops proposed.  The Village does as they please, approving the development.  Now, the businesses in the unincorporated area lay stagnant thanks to the over-saturation of retail usage that the new development brought to the area.

It’s Urban Planning 101: You don’t build what you don’t need. Much of the debate concerning Heartland, whose future lays with the Town of Islip, is that its impacts will resonate far beyond Islip.

That’s the trouble with localism – it only benefits the locality, and often at the cost of other areas. Unfortunately for Mr. Alexander, some of Long Island’s issues are too big for the “locals know best” model he advocates for. Our fragile aquifer system transcends all geo-political borders, with poor land use decisions in one town impacting water quality in the next.

Our Island is small enough for economic development policies to resonate far beyond the Village or Town level. While the Town of Babylon IDA and Town of Islip IDA squabble over wooing a manufacturing business, a lucky county in North Caroline will reap the rewards when they eventually steal them away from Long Island.  It’s one thing for a village to build more housing options, but successfully raising a new multifamily development isn’t the same thing as quantifying and addressing our marked regional need for different types of housing.

Is it too “academic” to quantify our problems before taking the steps of addressing them? Is a protected aquifer system which supplies our region's drinking water outdated like Zach Morris’ blocky cellphone or the Macarena?

Localism at its worst puts immediate needs first, and Long Islanders as a collective second. Part of the challenge we face as a region is the segmented and fractured governmental systems that prevent us from significantly making any progress. The biggest public works and sweeping acts of environmental preservation in this region’s history were executed thanks to a solid foundation of regional thought. The Long Island Parkway System, LIRR and LIE weren’t built on the local scale. The preservation of 100,000 acres of Pine Barrens forest needed state legislation that trumped local zoning to be adequately protected. Suffolk County’s open space, water protection and farmland preservation programs weren’t locally-sourced, homegrown policies, but rather models emulated nationally thanks to their breadth and regional scale. 

Regionalism at its worst is characterized by monolithic bureaucrats making decisions without any local input. This is why a balance must be struck between both approaches that blend our local sensibilities with a comprehensive regional approach. The commonalities between Long Island’s various towns, villages and even counties warrant regionalism with a local twist. Our common aquifer is the largest common tie, while our surface bodies of water constrain our physical space. Economically, Long Islanders in both counties work and commute to the Island’s employment centers, which are concentrated in a few distinct locations, while all municipalities share neighborhoods that span the socio-economic spectrum. Given the common traits, a regional approach undertaken by municipalities, helmed by non-biased professional planners would serve both the local and regional good. For too long, Long Island’s development future has been staked out by stakeholders and policymakers with something to gain by swaying in one direction or another.

The best community planning efforts stem from public input, assessment of public needs and ample participation by the people who live and work in the area. The best environmental planning efforts use data and scientific study to advance the goals selected. A regional approach takes the best of both these approaches, and balances the needs of a region in a comprehensive manner. A local approach works under certain circumstances. When a neighborhood needs a community center, or seeks to improve their quality of life, the approach to development should be local. However, if the locality proposes development whose impacts resonate far beyond their municipal borders, a regional approach must be taken.

There is a reason why conversations concerning Long Island's future must be academic Mr. Alexander. We all feel the impacts of poor development choices. Sound regional planning isn’t something to dismiss as a “90s thing”, but rather, should be embraced for the betterment of Long Island’s future.  

Richard Murdocco writes regularly on land use, planning and development issues for various publications. He has his BA in both Political Science and Urban Studies from Fordham University, and his MA in Public Policy from Stony Brook University, and studied planning under Dr. Lee Koppelman, Long Island's veteran planner. You can follow Murdocco on Twitter @TheFoggiestIdea, Like The Foggiest Idea on Facebook, and read his collection of work on urban planning at TheFoggiestIdea.org.

Long Island illustration by Wiki commons user Duffman.

Showing the Flag: The Transit Policy Failure

0
0

David King has a point. In an article entitled "Why Public Transit Is Not Living Up to Its Social Contract: Too many agencies favor suburban commuters over inner-city riders," King, an assistant professor of urban planning in the Graduate School of Architecture, Planning and Preservation at Columbia University notes that transit spends an inordinate share of its resources on suburban riders, short changing the core city riders who cost transit agencies far less to serve and are also far more numerous. He rightly attributes this to reliance on regional (metropolitan area) funding initiatives. Many in transit think it is necessary to run near empty buses in the suburbs to justify the use of transit taxes to suburban voters (what I would refer to as "showing the transit flag")

King asks: "So does public transit serve its social obligations?" He answers: "Increasingly the answer is no." King is rightly concerned about the disproportionate growth in spending on commuter rail lines that carry transit's most affluent riders from deep in the suburbs to downtown. Transit policy has long been skewed in favor of the more affluent suburban dwellers in the United States.

My Experience in Los Angeles

I saw this first-hand as a member of the Los Angeles County Transportation Commission (LACTC). When we placed what was to become the first regional transit tax on the ballot (Proposition A in 1980), the shortage of transit service was critical in the highest demand, largely low-income areas of Los Angeles such as Los Angeles and East Los Angeles. I described the situation in a presentation to the annual conference of the American Public Transportation Association: "Often waiting passengers are passed at bus stops by full buses" Approximately 40 percent of the local bus services between the Santa Monica Mountains, Inglewood, Compton, Montebello and Santa Monica reached peak loads of 70 passengers, well above seating capacity

At the same time, suburban area buses were usually less than half-full. In connection with this concern, I produced a policy paper, Distribution of Public Transit Subsidies in Los Angeles County, which was published in by the Transportation Research Board. The abstract follows: 

"Public transit today is faced with the challenge of serving its clientele while subsidies are failing to keep pace with increasing operating costs. In Los Angeles County, there are service distribution inequalities--overcrowding and unmet demand in some areas and, at the same time, surplus capacity in other areas. To use subsidy resources efficiently requires that the effects of present subsidy allocation practices be understood--that is, how subsidies are translated into consumed service, both by type of service and by geographic sector within the urban area. An attempt is made to provide a preliminary understanding of that distribution in Los Angeles County. It is postulated that significantly more passengers are carried per dollar of subsidy in the central Los Angeles area than in other areas and local services require a lower subsidy per passenger than do express services. A number of policy issues are raised, the most important being the very purpose of public transit subsidies."

Generally, transit operating subsidies per passenger were far higher in the suburbs than in the central area (where incomes are the lowest, and poverty rates the highest), and subsidies were much higher for commuter express services than for local bus services.

I attempted to address this problem by proposing a "Mobility Policy" that would have reallocated service based on customer needs, giving precedence to areas where mobility was restricted due to limited automobile availability and lower incomes. Some colleagues whose constituents were disadvantaged by this inequity objected,  feeling compelled, it appeared, to rally about the “transit flag”

On a Siding: Transit Policy in Recent Decades

Since that time, Los Angeles and other major metropolitan areas have built expensive rail and busway systems. Despite the promises of attracting people out of their cars (routinely invoked during election campaigns for higher taxes), the reality is that single occupant commuting has risen from 64 percent in  1980 to 76 percent in 2012. Over the same period, transit's share of urban travel has fallen, though stabilized in recent years at very low levels in most metropolitan areas. Indeed, when New York, Chicago, Philadelphia, Washington, Boston, and San Francisco are excluded (with their "transit legacy cities"), the 46 major metropolitan areas have a transit commute share of just three percent. Overall, more people work at home than commute by transit in 38 of these metropolitan areas and more people walk or cycle to work in 27, according to American Community Survey 2012 data.

Yet the politically driven inequality in transit spending continues. Transit subsidies continue to be far higher for services that are patronized by more affluent riders. For example, subsidies (operating and capital expenditures minus fares) are three times as high for the commuter rail services, with their higher income riders, than for buses, with their lower income riders (Figure).

The difference can be stark, as an example from the New York area indicates. A Fairfield County, Connecticut commuter rail rider with the median family income of $102,000 would be subsidized to the extent of $4,500 per year (assuming the national subsidy figure). By comparison a worker from the Bronx or Hudson County, New Jersey, with a poverty level family income of $18,500 per year (or less) would be subsidized only $1,500 per year. In fact, the bus subsidy would likely be even lower, because transit in lower income areas is much better patronized and thus less costly for the public. My Los Angeles research found inner city services to be subsidized approximately half below the average of all bus services (Note).

Where Transit Works

The functional urban cores contain the nation's largest downtowns (central business districts). Their population densities are nearly five times that of the older suburbs and nine times that of the newer suburbs. The functional urban cores have transit market shares six times that of the older suburbs and 15 times that of the newer suburbs. Yet, it is in these poorer, denser areas where overcrowding is most acute and the need for more service is most acute. In Los Angeles, for example, the greatest potential for increasing transit ridership is where ridership is already highest.

The vast majority of suburban drivers are not plausible candidates for transit, simply because it cannot compete well with automobiles, except, for example, for some trips to the downtowns of the six transit legacy cities (which account only one of seven jobs in their respective metropolitan areas).

Where transit makes sense, people ride. Where it doesn't, they don't. Allocating resources inconsistent with this reality impairs the mobility of lower income residents, wastes resources and relegates transit to an inferior role in the city. Charging the affluent fares well below the cost of service compromises opportunities to serve more people in the community.

Better allocation of transit resources would likely improve core area unemployment rates by increasing the number of jobs that can be accessed by lower income workers. Further, because the better used services would require lower subsidies, there would be funding available for additional service expansions.

The principal fault is not that of transit management. It's the politics.

-----

Note: These data (expenditures per boarding) are estimated from Federal Transit Administration and American Public Transportation Association data for 2012. Commercial revenues other than fares are excluded (the most important such source is advertising). Debt service is also excluded because it is not reported in the annual reports of either organization. The subsidy ratios between lower income and more affluent riders would be changed by including transfers (though the subsidies would still be considerably higher for the more affluent). Some low income riders use more than one bus or rail vehicle for their trip, while some commuter rail riders transfer to bus or rail services at one or both ends of their trips. No readily available data is available to make such an adjustment. The New York area example assumes 225 round trips per year.

-----

Wendell Cox is principal of Demographia, an international public policy and demographics firm. He is co-author of the "Demographia International Housing Affordability Survey" and author of "Demographia World Urban Areas" and "War on the Dream: How Anti-Sprawl Policy Threatens the Quality of Life." He was appointed to three terms on the Los Angeles County Transportation Commission, where he served with the leading city and county leadership as the only non-elected member. He was appointed to the Amtrak Reform Council to fill the unexpired term of Governor Christine Todd Whitman and has served as a visiting professor at the Conservatoire National des Arts et Metiers, a national university in Paris.

Photo: Bart A car Oakland Coliseum Station

The New Extraterrestrial Geography

0
0

This month marks forty-five years since men first left planet earth and set foot on another world. The last man to walk on the moon did so in December, 1972, over four decades ago. It's a good moment to ponder what we haven't done since.

There were six successful landings on the moon, and, almost literally, they barely scratched the surface of that body. The later astronauts had “golf carts” that allowed them to travel short distances, but only a fraction of a percent of the Africa-sized area was directly investigated by humans. To say, as some do, that we shouldn't go back, and should instead go on to Mars, would be like saying that, having touched shore in a half dozen places in the Americas, we should have then ignored those continents and gone on to Asia.

It's a misnomer, of course, to call this a new “geography.” That word is derived from the Greek “ge,” for earth. We probably should use something like 'selenography' for the moon, 'venerography' for Venus, and for Mars, either 'areography,' or my preferred fanciful 'barsoomography' (with a nod to Edgar Rice Burroughs). Each of these “ographies” are vastly different from each other and from earth.

There's a lot of interesting real estate out there, and all we've done so far is to briefly poke around on our own moon a few times, only to abandon the effort after a few years.

We stopped because we have never, as a nation, made it a serious goal to open up the new lands of the solar system. Apollo wasn't about exploration or science. It was a soft battle in a cold war; a demonstration of our technological prowess versus that of a brutal adversary. In order to win, we set up a state-socialist enterprise to rival that of our opponent, except our enterprise was democratic, whereas theirs was totalitarian. We had aerospace contractors; they had design bureaus.

We won even before Apollo 11, with the circumlunar mission of Apollo 8 the previous year, about the same time that the Soviets started to pretend they'd never been racing. The human space program devolved into one of national pride and white-collar welfare in the states and districts of those on the Hill who funded it.

Had it been our intent to develop and settle these new worlds, we would have gone about it very differently. For instance, we might not have acquiesced to the Outer Space Treaty in 1967. The partial goal there was to end the space race by putting the entire solar system beyond the reach of claims of national sovereignty. This is one reason why the US didn't claim the moon when we landed. Instead, we came “in peace for all mankind”.

This had the effect of rendering extraterrestrial private property claims themselves as somewhat problematic, even though it didn't go as far as the Soviets wanted. Private enterprise in space was permitted. Otherwise, the communications and remote-sensing satellite industries might have been stillborn.

If we had followed the tradition of free-enterprise America, we wouldn't have rushed to the moon with an expensive giant rocket. Rather, we would have more methodically developed affordable space transportation, and created a competitive industry to continually drive down costs, as has occurred in other fields of transportation. We'd have developed the infrastructure in space, such as assembly facilities and propellant storage depots — the equivalent of gas stations on the Interstate — that would allow full reusability of vehicles to and from various locations.

We are only now starting to do so, in the face of strong resistance from Congress, primarily because small, private industry doesn't allow sufficient opportunities for graft in the way that large, sole-source NASA contracts do. Congress currently seems determined to repeat Apollo, with its giant rocket and capsule, and its missions costing billions per flight. As a result, it is likely to continue to keep us trapped in low earth orbit for the next few decades.

Fortunately, the government is no longer the only source for the funding of human spaceflight. Several billionaires have expressed interest, including Elon Musk of SpaceX, Jeff Bezos of Amazon, Las Vegas hotelier Bob Bigelow, Microsoft co-founders Paul Allen and Charles Simonyi, and others. Musk has repeatedly stated that the ultimate purpose of his space company is to colonize Mars – he believes it's important that we become a multi-planet species. He has already disrupted the expensive dinosaurs of the space industry with his low-cost rockets, which will become even lower cost if he succeeds, as seems likely, in developing the ability to reuse them rather than to throw them away.

Bezos has also declared his interest, ultimately, in space colonization, whether as an insurance policy against having all of humanity's eggs in a single basket, or perhaps to allow new social experiments like the one our own founders created in their own New World almost two hundred and forty years ago. And Peter Diamandis, author of the book Abundance and co-founder of Planetary Resources, an asteroid-mining venture, notes that the vast majority of resources available to humanity lie not on this tiny planet, but in the rest of the solar system, and ultimately the galaxy and universe beyond.

These entrepreneurs and visionaries hold these beliefs, despite the obstacles. Planets in our solar system have a wide variety of different atmospheres, including (as with our moon) essentially none. None of them are presently breathable by humans, and won't become so absent massive terraforming and/or radical genetic engineering (which at some point begs the question of the meaning of the word “human”).

As for Mars, its atmosphere is far too thin to breathe, even if there were oxygen in it (it's mostly carbon dioxide). But there is water there, and plants in greenhouses could manufacture oxygen from the atmosphere, using sunlight dimmed by its distance from our star. Rocket fuel could be produced, as well, to make access to and from the planet easier. It is full of iron and other minerals, unfortunately including the very toxic hexavalent chromium.

Those who are simultaneously competing and conspiring to open up the solar system, with all of its new lands, are doing so not just for a handful of government civil servants, but potentially for thousands or millions of private adventurers and explorers, in a way that government cannot, and likely will not, absent a sudden burst of vision rarely seen in politicians. But with or without the government, the new lands look increasingly likely to be privately explored, settled, developed, and even created, opening up vast new wealth to humanity, and perhaps giving us the first trillionaire.

Many today lament that they didn't live in the excitement of the sixties, when “we” went to the moon. But the coming decades of the new “solography” promise to be vastly more exciting — not just vicariously, as Apollo was, but with the participation of the new pioneers.

Rand Simberg has had many years of experience in aerospace engineering and project management at the Aerospace Corporation and Rockwell International Corporation in Los Angeles, and has been recognized as an expert in space transportation by the Office of Technology Assessment. He is author of the new book, Safe Is Not An Option, on how our risk aversion holds us back in human spaceflight. He blogs at Transterrestrial Musings.

SpaceX Dragon Cargo Transfer at the SpaceX facility in McGregor, Texas. NASA Administrator Charles Bolden, left, and SpaceX CEO and Chief Designer Elon Musk, view the historic Dragon capsule that returned to Earth following the first successful mission by a private company to carry supplies to the International Space Station. Photo: NASA/Bill Ingalls.

To Fight Inequality, Blue States Need To Shift Focus To Blue-Collar Jobs

0
0

In the coming election, we will hear much, particularly from progressives, about inequality, poverty and racism. We already can see this in the pages of mainstream media, with increased calls for reparations for African-Americans, legalizing undocumented immigrants and a higher minimum wage.

There’s no question that minorities’ economic wellbeing has deteriorated since the economy cratered in 2007. African-America youth unemployment is now twice that of whites, while the black middle class, once rapidly expanding, has essentially lost the gains made over the past 30 years,  says the Urban League.

Conservatives may not have the answers but it’s clear that a progressive regime has not worked either.

The net worth of blacks and Hispanics has declined relative to whites. The black poverty rate stood at 27.2% in 2012, and for Hispanics, 25.6%. At the same time as poor kids are flocking here from Central America, child poverty among Latinos has risen sharply, from 27.5% in 2007 to 33.7% percent in 2012.

One would think these statistics would make someone question at least somewhat boilerplate progressive polices, which certainly have not worked better than standard brand conservatism. But often the common answer to these trends has been a call for more “progressive” social policies that would seek to redistribute wealth and to enforce racial equity in everything from housing to university admission. Given Republican control of the House, these racial and class politics are increasingly most keenly felt in the states and cities.

There are numerous signs of this, including Seattle’s $15 an hour minimum wage and similar proposals in other cities. The thrust of New York Mayor Bill De Blasio’s administration seems to be to provide ever more succor to the city’s large, heavily minority, poor and working-class population through early childhood education and more subsidized housing.

As an old Democrat, I am sympathetic to the concerns. But it’s dubious the deep blue cities have found a solution. Let’s start with the gap between rich and poor. For the most part the regions and states with the widest gap between the classes are overwhelmingly dominated by modern progressivism.

The capital of blue America, New York City, has easily the worst levels of inequality in the country, with an income distribution that approaches that of South Africa under apartheid, notes demographer Wendell Cox.

But New York is hardly the only progressive stronghold  with searing inequality. A recent Brookings report  found that of the regions with the greatest income disparity only one, Atlanta, is located in a red-leaning state. These include San Francisco, Miami, Boston, Washington, D.C., New York, Oakland, Chicago and Los Angeles. The lowest degree of inequality was found generally historically more conservative cities like Ft. Worth, Texas; Oklahoma City; Raleigh, N.C.; and Mesa, Ariz. Income inequality has risen most rapidly in the probably the most left-leaning big American city of luxury progressivism, San Francisco, where the wages of the poorest 20% of all households have actually declined amid the dot-com billions.

 Since most of the urban poor are minorities, these disparities are also reflected in racial terms. Among the nation’s 15 largest metropolitan statistical areas, according to an analysis by Praxis Strategy Group’s Mark Schill, the biggest gap between black and white incomes as of 2012 was also in San Francisco, where African-Americans made 49% of whites’ income. Chicago, Detroit and Philadelphia are a shade behind at 50% to 51%.

In contrast, African-Americans score better in comparison with whites in less expensive, more suburban areas. In Riverside, Calif., black incomes are over 81% of whites, highest among the nation’s 15 largest metro areas; in the Phoenix region, black income is 73% of whites; in Houston, 65%. This is not a case of Democratic rule being the problem; the real issue is what kind of  Democrat. In cities like Phoenix, Riverside and Houston, Democratic mayors are usually very pro-business, and rarely engage in the kind of rhetoric one hears in places like New York or Seattle.

A somewhat similar pattern can be seen among Latinos. The worst disparities – 50% to 54% of white income – are in greater Boston, Philadelphia and New York. Again, the lowest disparity was in Riverside, where Hispanic incomes were 84% of whites, followed at 81% by Miami – a city that is neither cheap nor sprawling, but has a population of generally more prosperous Cuban-Americans. In third place is Phoenix, at 73%, a city, that ironically, has been castigated as a capital of anti-Latino sentiment.

Part of the difference is the strong growth of higher-paid, blue-collar jobs in places like Houston, Oklahoma City, Salt Lake and Dallas compared to rapidly de-industrializing locales such as New York, San Francisco, Chicago and Los Angeles. Even Richard Florida the guru of the “creative class,” has admitted that the strongest growth in mid-income jobs has been concentrated in red-state metros such as Salt Lake City, Houston, Dallas, Austin and Nashville. Some of this reflects a history of later industrialization but other policies — often mandated by the state — encourage mid-income growth, for example, by not imposing high energy prices with subsidies for renewables, or restricting housing growth in the periphery. Cities like Houston may seem blue in many ways but follow local policies largely indistinguishable from mainsteam Republicans elsewhere.

Nowhere is this relationship between job growth and racial disparities clearer than in California, where regulations have slowed construction and industrial growth even as Silicon Valley has enjoyed a giddy boom. In Silicon Valley, Hispanic and African-American incomes have sagged, as manufacturing and many middle management positions have been reduced. But the real problems for poorer and minority residents can be seen in the state’s interior regions, where many communities still suffer close to double digit unemployment or worse.

Part of the problem also lies with costs, particularly for housing. Simply put most working Americans, and most minorities, cannot earn enough to maintain a decent quality of life in most of America’s biggest cities. This is particularly true of big, diverse blue cities like New York and Los Angeles, where the average paycheck, adjusted for cost, ranks worst among the major metropolitan regions.

High housing prices, notes economist Jed Kolko, are a key reason why even with a boom, population growth remains slow in the Bay Area. In contrast, Houston, which also is booming, has seen rapid population growth and in-migration. Since 2000, Houston’s population has grown 30%, three times as rapid as the Bay Area.

One boomtown epitomizes opportunity while in the other growth has largely benefited the well-educated and well-placed. Between 2000 and 2012 income growth in Houston has been 53% while in San Francisco — despite the tech boom — it has been 35%.

Minorities and, particularly, immigrants have been drawn to these sprawling, growing regions as the best places to improve their life. Over the past decade, the foreign-born populations of Houston and Dallas expanded roughly 50%; Atlanta saw nearly 70% growth. In contrast, immigration growth in New York, Chicago and San Francisco was under 20%.


Immigrants are coming to these areas, in many cases, in order to buy a house. In Houston, according an analysis by demographer Wendell Cox, 52% of African Americans and 42% of Hispanics own their own homes. In Los Angeles, this percentage is in the 30s, and in New York and Boston, minority ownership is even smaller. The Atlantic may say the Sun Belt is where the “American dream goes to die” but an examination of the statistics suggests, these critics may need their compasses readjusted.

Much the same can be said about progressive policies. Unlike some on the party-line right, I do not think that concerns about inequality and stunted upward mobility are fabrications by left-wing academics.

The question is how to address the issue. We should consider that last time African-Americans made big strides in income were when the economy was booming under Presidents Reagan and Clinton, both of whom have been criticized for “trickle down” policies. They have done far worse under the present more conventionally progressive region.

If they are honest, it’s time for progressives to deal with these trends with some sense of realism; you don’t have to be a conservative to favor good blue-collar growth. All too often progressive mouthpieces like the New Republic, while admitting black inequality is at the highest level in decades, emphasize such symbolic (and political unlikely) steps, as reparations and and expansion of means-tested subsidies that would help minorities and poor but leave out the middle class, and mostly white, majority.

Such approaches will do little effectively, except to make some progressives feel even more self-righteous. But real progress on race and poverty requires a growing economy that provides opportunities for the broadest part of population. Clearly the regulatory and tax regimes that stunt middle- and working-class opportunities does not help. Blue-state progressive can whine about race, inequality and poverty with the best of them, but they would contribute far more if they started to address these issues with something other than well-rehearsed indignation and rhetoric.

This story originally appeared at Forbes.

Joel Kotkin is executive editor of NewGeography.com and Distinguished Presidential Fellow in Urban Futures at Chapman University, and a member of the editorial board of the Orange County Register. He is author of The City: A Global History and The Next Hundred Million: America in 2050. His most recent study, The Rise of Postfamilialism, has been widely discussed and distributed internationally. He lives in Los Angeles, CA.

Unemployed woman photo by BigStockPhoto.com.

Germany Also Having Big Problems Building Infrastructure

0
0

Der Spiegel had an interesting article recently called “Angry Germans: Big Projects Face Growing Resistance.” The article (linked version is English) talks about how it is increasingly difficult to get infrastructure projects built in Germany.

Wherever ambitious construction ventures loom on the horizon in Germany — from the cities to the countryside, from the coastlines in the north to the Black Forest in the south — opponents are taking to the streets…. As the public’s enthusiasm for constant innovation has lessened, so has the appeal of these sorts of projects, and, as a result, they now inevitably come accompanied by picketers. Germany’s graying society, it seems, is so cozy and settled that it resists anything threatening to upset the status quo. In the process, it has lost sight of the bigger picture.

There are a lot of key points in this article that immediately raised parallels to the United States, where infrastructure projects are also under increasing siege. In fact, some of this reminded me of elements of the Tea Party movement. The protestors are uninterested in compromise. They are devoted, full time activists who are unrelentingly opposed to the projects in question:

[Hartmut] Binner’s form of protest has a radical undercurrent: Well-informed, confrontational and devoid of respect for authority, he is typical of the new grassroots activism spreading across Germany.

….

Binner’s entire life revolves around the campaign. He monitors the routes of departing and landing planes. He plays his self-designed noise simulator on market squares. He kicks off his court appearances by singing the Bavarian national anthem. “If you want to be heard as a member of the public, you need to push the envelope,” he shrugs.


These days, he sees grassroots protests, activism and political responsibility from a different perspective. “The typical protesters are gray-haired, know-it-alls and very networked,” [Freiburg Mayor Dieter Salomon] says. “But they’re not remotely interested in consensus-building, political processes and pluralism.”


Grassroots groups have become so livid, intransigent and single-minded that even the most respected politician in the country, Angela Merkel, is feeling their sting. In early May, hundreds of furious residents had gathered in central Ingolstadt to protest against the construction of a power line from Bad Lauchstädt in Sachsen-Anhalt to Meitingen in Bavaria.

This certainly reminds me of the no-compromises view of the Tea Party. Also, a number of early American Tea Party activists were unemployed, and thus able to basically be full time activists. Even the singing of national anthem has echoes of the Tea Party and their tricorn hats. I don’t want to claim there’s a philosophical or other link between the Tea Partiers and Germany, however.

Not everything lines up with the Tea Party, however. In Germany it seems to be disproportionately retirees who are the most engaged and militant:

Germany’s graying society, it seems, is so cozy and settled that it resists anything threatening to upset the status quo. In the process, it has lost sight of the bigger picture.


Many of the protestors are pensioners with no vested interest in Germany’s future. “It’s striking that the leader of the protests against the Munich runway is a 75-year-old and not someone in the middle of his working life,” [Munich Airport CEO Michael Kerkloh] points out.


Salomon’s nemesis is Gerlinde Schrempp, a determined and argumentative 67-year-old retired teacher with attitude to spare. She’s the leader of the Freiburg Lebenswert movement, which translates roughly to “make Freiburg worth living in. The movement just got elected on to the district council and is first and foremost opposed to any new building in the city.

There’s a stereotype out there of the average Republican voter as an old white guy. But the average Tea Party activist I’ve seen tends to be working age. I look at this one a bit differently. We need to see these types of controversies against the substrate of an aging population. Aging populations are not noted for dynamism, and older people’s self-interest is better served by starving investment for the future in order to save money and avoid uncomfortable change in the present. As a country whose population is projected to decline into the future thanks to this demographic inversion, we are seeing in Germany what’s likely a preview of coming attractions elsewhere around the world.

Indeed, I’m reminded of what one analyst friend of mine in Indiana has said about the property tax caps there. He sees the push to cap property taxes as driven by an aging population in a stagnant state. Old people generally aren’t earning a lot of taxable income nor are they buying huge amounts of stuff, so they are disproportionately less affected by income and sales tax hikes, whereas they often own homes and are hit hard by property taxes. Thus property tax caps serve as another income transfer mechanism from young to old, holding revenue constant. They are in part an artifact of an aging society. Disinvestment in infrastructure can be seen in the same light.

But there’s another part of this that shines a light on yet another group of opponents, namely the intelligentsia.

The term “Wutbürger” (“enraged citizen”) was coined during the Stuttgart 21 fiasco to describe people like Hartmut Binner, and much has been written about them since. They often aren’t the “common man.” According to the Göttingen Institute for Democracy Studies, they tend to be highly educated people with steady incomes and white collar jobs. And while protests movements of the past were often steered by sociologists, today their leaders are more likely to stem from the technical professions, the researchers found.

When we look at opposition to infrastructure in the United States, at least certain types of infrastructure, we see a similar profile of people (though not necessarily technical) behind it. It’s the leftist intelligentsia that oppose the Keystone Pipeline, suburban highway projects, fracking, and many other types of things, often with a militant unwillingness to compromise similar to the Tea Party.

As with Germany, this opposition is enabled by environmental reviews and public participation laws that, while they serve important public purposes, make it easy to delay projects for years through repeated objections and scorched earth litigation. Traditionally environmental lawsuits were associated with the left, but conservatives have started saying, why not us too? Hence litigation against San Francisco’s regional plan. The Hollywood densification plan was recently overturned by lawsuits, and lawsuits have plagued California’s proposed high speed rail line as well.

Whatever the project, it’s sure that somebody on the left and/or the right hates it, and thus will do everything in their power to kill it, which probably means years of delays and untold millions in increased costs.

Also as with the United States, German governments have shot themselves in the foot with a series of financial debacles:

Political and bureaucratic bodies are partly to blame for their own diminished authority. Every major venture seems to entail spiraling costs. Berlin’s new airport was supposed to cost €1.7 billion, a price tag that has shot up to well over €5 billion. Meanwhile, the €187 million earmarked for the Elbphilharmonie concert hall under construction in Hamburg is expected to exceed €865 million by the time the project is completed. Albig is well aware how bad this looks. “People see us as financially incompetent,” he says.

Until politicians can convince the public they have a handle on this, the taxpayer will remain rightly skeptical of many major megaprojects. This is doubly true since it’s very clear, as has been documented by folks like Oxford professor Bent Flyvbjerg, that in many of these cases the politicians were simply lying all along about the real costs.

I’m not sure what all the takeaways are, but there are clearly many forces operating on a global basis to inhibit the development of infrastructure in the West.

Aaron M. Renn is an independent writer on urban affairs and the founder of Telestrian, a data analysis and mapping tool. He writes at The Urbanophile, where this piece originally appeared.

"MittlererSchlossgartenKundgebung 2010-10-01" by Mussklprozz - Own work. Licensed under CC BY-SA 3.0 via Wikimedia Commons.


Don't be so Dense About Housing

0
0

Southern California faces a crisis of confidence. A region that once imagined itself as a new model of urbanity – what the early 20th century minister and writer Dana Bartlett called “the better city” – is increasingly being told that, to succeed, it must abandon its old model and become something more akin to dense Eastern cities, or to Portland or San Francisco.

This has touched off a “density craze,” in which developers and regulators work overtime to create a future dramatically different from the region’s past. This kind of social engineering appeals to many pundits, planners and developers, but may scare the dickens out of many residents. They may also be concerned that the political class, rather than investing in improving our neighborhoods, seems determined to use our dollars to subsidize densification and support vanity projects, like a new Downtown Los Angeles football stadium. At same time, policymakers seek to all but ban suburban building, a misguided and extraordinarily costly extension of their climate-change agenda.

This effort works against the region’s basic DNA. Our Downtown, for all its promotion, is not a dominant business or cultural center. It accounts for barely 1/10th the share of regional employment that Manhattan – at more than 20 percent – provides for its region and less than one-sixth the share of regional jobs accounted for by San Francisco, less than one-third that of much-maligned, spread-out Houston.

Some people contend that, by investing heavily in mass transit, we can re-engineer our region towards a more-19th century model, which Los Angeles, as a 20th century city, never had. Some, like economics and political blogger Matt Yglesias, suggest Los Angeles’ $8 billion-plus investment in rail is making it the “the next great transit city.”

Well, after 30 years of relentless spending on subways and light rail, the share of transit commuters in the region (comprising Los Angeles and Orange counties, the Inland Empire and Ventura County) is about where it was in 1980 – roughly 5 percent – compared with greater New York’s 27 percent or Chicago’s 11 percent.

Village people

Transit has limited effect in Southern California because this region functions best as a network of “villages,” some more urban than others, connected primarily by freeways and an enviable arterial street system. Inside our villages, we can find the human scale and comfort that can be so elusive in a megacity. This arrangement allows many Southern Californians to live in a quiet neighborhood that also is within one of the world’s most diverse – and important – cities.

These villages span all the vast diversity of Southern California. Some areas, like Downtown Los Angeles, increasingly appeal to young professionals who seek a version of dense urban living. They share a universe with cohorts found in many older cities: young hipsters, a small sample of empty nesters and a sizable population of homeless who live on the edges of the gentrification zone.

But Downtown hardly provides a template for the rest of the region. Mostly we live in lower-density villages, many of which – in the San Gabriel Valley, East Los Angeles, Santa Ana, Westminster and L.A.’s Leimart Park, for example – reflect largely ethnic cultures with deeply established roots.

Even newer areas, like Irvine – which still ranks among America’s fastest-growing cities – are now majority Asian and Latino. Irvine’s appeal is largely the much- dissed suburban virtues of clean streets, good parks and excellent schools.

Some areas are almost insanely eclectic. My neighborhood in the San Fernando Valley – sometimes referred to as Valley Village or Valley Glen – includes many people in the film and television business, but is increasingly dominated by Orthodox Jews, Armenians and Israelis. In summer, barely clad acting folk pass Orthodox haredim dressed in impossibly warm black suits and hats.

Walk one direction from my house, and you run into Armenian businesses, including alavash bakery and several kabob restaurants. Walk the other direction, and you enter akashrut world, with signs in both English and Hebrew; you even can get panhandled by an odd Jewish beggar, something you encounter in Israel and parts of Brooklyn but not too often in California.

Outdoor living

What holds these neighborhoods together is a desire for a particular quality of life, usually associated with the single-family home. These, along with modestly sized garden apartments, long have been the primary choice of Southern Californians. Such housing facilitates enjoying this region’s arguably greatest asset: its weather. Residents value a place for backyard barbecues, swimming pools, small soccer pitches for the kids and an element of seclusion.

Unable to afford the pricier L.A. or O.C. neighborhoods, many Southern Californians, to the consternation of the urban planners and some developers, head for a newer village on the regional periphery. Indeed, more than 99 percent of the region’s growth has taken place far from central L.A. For every yuppie who moves Downtown, or into now-fashionable closer-in neighborhoods, a hundred or more move out to Rancho Cucamonga, Valencia, Mission Viejo or scores of other outlying communities.

This article first appeared in the Orange County Register.

Joel Kotkin is executive editor of NewGeography.com and Distinguished Presidential Fellow in Urban Futures at Chapman University, and a member of the editorial board of the Orange County Register. He is author of The City: A Global History and The Next Hundred Million: America in 2050. His most recent study, The Rise of Postfamilialism, has been widely discussed and distributed internationally. He lives in Los Angeles, CA.

Cleveland, LeBron, and the Evolution of Collective Shame

0
0

“Shame is fear of humiliation at one’s inferior status in the estimation of others.”—Lao Tzu.

Sitting with fellow Clevelanders at a since-demolished bar, July 7th, 2010, LeBron James, local boy, uttered the words that hurt: “I am taking my talents to South Beach”. It was a shot heard around the world, but felt sharply inside the Rust Belt city’s heart.

“He had before invoked all the connotations of home, only to leave it,” wrote Cleveland sports columnist Bill Livingston the next day, in a piece entitled “By rejecting his hometown team, LeBron James earns his slot on the [Art] Modell list of shame”. Livingston upbraided LeBron for scheduling a cable event to “exploit this city's suffering”. His words were intent on shaming LeBron for leaving, yet in doing so reared Cleveland’s collective shame for having again been left.

Collective shame is an underappreciated subject. But it, like other collective emotions—think fear and pride—run our societies as noted by the great sociologist Emile Durkheim.

For decades, Cleveland has been held together by a solidarity in loss, especially the collective shame that came with it. Unlike guilt, which is about what one did, shame is an affront on the self, or what one is.

And what was blue-collar Cleveland without a wealth of blue-collar jobs? It was a city of losses—be it of income, population, and a way of life.

Walk down many Cleveland streets and you can see how this loss has played out in disinvestment. Often, the effect on the viewer is the same: status was here, but no longer. The constant reminders of loss give shame currency. Cleveland is not alone here. Cities the world over are afflicted with the hangovers of history. From the “Geography of Melancholy” in the American Reader, the author writes:

Nearly every historic city has its brand of melancholy indelibly associated with it—each variety linked to the scars the city bears. Lisbon has its saudade: a feeling of aimless loss tied to the city’s legacy of vanishing seafarers, explorers shipwrecked in search of Western horizons. Istanbul has huzun: a religiously-tinged brand of melancholy rooted in the city’s nostalgia for its glorious past.

Instead of seafarers, Cleveland had steelworkers, and others who’ve had their working-class status stripped. Yet while the loss was personal, it was the result of macro forces, leaving many feeling powerless and alone. This aloneness was tied up in the feeling of shared suffering. “The very fact that shame is an isolating experience,” notes the author of “Shame and the Social Bond”, “also means that if one can find ways of sharing and communicating it this communication can bring about particular closeness with other persons.”

There are many ways collective emotions are shared. Much of the vessels are informal. Think oral tradition and rumors. Fashion is another channel, like a city’s t-shirts. In fact perhaps nothing says implicit understanding between natives like city mottos emblazoned chest level. Cleveland’s most famous t-shirt said simply: “Cleveland—you’ve got to be tough”. It was made in 1977, in the heyday of the city’s decline. You had to be tough in the face of a post-industrial headwind. Today, iterations remain on this “the world is against us” mentality. “Defend Cleveland” and “Cleveland VS Everybody” t-shirts are worn liberally. Another favorite that tips more toward shame than to a defensiveness against judgment says: “Cleveland Low Life”—a play on “Miller High Life”.

Is all this productive? No doubt, collective shame, according to scholars, can strengthen the bonds between members of a group which, in turn, can lead to a process of self-exploration and restoration of a social identity. Or it can be chronic. Cleveland is well-known for its self-flagellation. It’s especially obvious to folks who aren’t native Clevelanders.

“I have, in fact, never lived in a place whose proud residents so consistently and gleefully disrespect their hometown as Cleveland,’ notes legendary Jeopardy champ Arthur Cho in his recent Daily Beast piece “Cleveland Comes Crawling Back to LeBron: The Masochism of Rust Belt Chic”. Cho, a Cleveland newcomer, goes on to write that though he hates to “engage in victim-blaming”, the reason “everyone dogs on Cleveland is that we ask for it”. Why? Cho concludes: “If we weren’t suffering, we wouldn’t be Cleveland anymore.”

But this Cleveland mindset does little for opening the region up to new ideas. Just as the messages become defensive, so do the policies and politics. Nativist culture reigns. Nepotism and patronage become the grease that runs the status quo. And so the communal shrouding effectively disables the possibility of possibility. Hence, the region’s struggles in its economic restructuring in the era of global connectivity.

In that sense, Cleveland’s collective shame can be a source of bad policies which ensure the collective shame. But why would a city want to do that, albeit implicitly, subconsciously?

“Economic struggle can be a cultural unifier in a community that people tacitly want to hold onto in order to preserve civic cohesion,” writes urban theorist Aaron Renn in Governing. Beyond that, those with power can lose it with community change. Continues Renn:

…[I]t isn’t hard to figure out that even in cities and states with serious problems, many people inside the system are benefiting from the status quo.

They have political power, an inside track on government contracts, a nice gig at a civic organization or nonprofit, and so on. All of these people, who are disproportionately in the power broker class of most places, potentially stand to lose if economic decline is reversed. That’s not to say they are evil, but they all have an interest to protect.

Does this mean Cleveland is doomed? Hardly. The region is experiencing a brain gain. It has incredible assets—namely, its educational, hospital, and cultural institutions—that have been dragging it along toward a point of turning the page. But more is needed. Specifically, more perspective—a perspective that the city’s inferiority complex isn’t about what others think of Cleveland, but about what Clevelanders are compelled to think about themselves.


Which brings us back to LeBron. Soon after his announcement that he was leaving, The Onion wrote a satirical piece called “Despite Repeated Attempts To Tear It Down, Massive LeBron James Mural Keeps Reappearing”. In it, the iconic “We are All Witnesses” banner keeps hauntingly resurfacing. At one point in the piece, city workers removed it panel by panel, “only to find an identical mural hanging directly behind it”. The article ends, “As of press time, nobody outside the Cleveland area had seen the mural once since it was originally taken down…”

The takeaway, then: When suffering has become your identity, you have clearly suffered long enough.

Cleveland’s path to progress means letting go of that which has stubbornly remained. There’s hope that the change is coming, largely due to the presence of the new generation. 

In many ways LeBron is an embodiment of the next generation of Cleveland and the Rust Belt. His return epitomizes possibility. No, I am not talking about championships here, nor the collective Prozac-effects that a parade down E. 9th St. would have on the region’s psyche. Instead it is about perspective.

The day LeBron announced his decision he was leaving Cleveland, he was in Akron. According to an ESPN piece, he knew the decision would hurt people, and that nothing would ever be the same for him. “Somehow he got through the final day of his annual basketball camp in Akron without confessing,” the authors write. “By the time [former teammate] Damon Jones drove him to the airport, where he would fly to Connecticut and reveal his infamous decision to the world, there was a lump in his throat.”

LeBron, like all sons and daughters of the Rust Belt, is a product of collective shame, and so his self-battle with leaving is no surprise. But sometimes leaving is the answer. No person should ever self-sacrifice out of a loyalty to place. And sometimes coming home is the next answer. If only because intermittent personal aspiration will often take a backseat to that evolutionary and endearingly human need to belong.

The secret sauce, here, is the perspective gained in the journey. And then bringing it back to a community that could use more than its fair share.

Richey Piiparinen is a Clevelander, writer, and Senior Research Associate heading the Center for Population Dynamics at Cleveland State University.

Lead photo courtesy of Michael Lapidakis.

Agrarianism Without Agriculture?

0
0

The ever-surprising Ralph Nader has recently been reading some paleo-conservative sources, and has written a book entitled Unstoppable; the Emerging Left-Right Alliance to Dismantle the Corporate State. [link Amazon.com] In the Acknowledgements at the end, he specifically thanks Intercollegiate Studies Institute, a conservative think tank, for keeping in print a tome from the 1930s called Who Owns America? A New Declaration of Independence. Nader devotes the seventh chapter of his book to a discussion of this volume. He quotes Edward Shapiro’s 1999 foreword at some length:

In his 1999 foreword to the reissued edition, historian Edward S. Shapiro called Who Owns America?“one of the most significant conservative books published in the United States during the 1930s” for its “message of demographic, political, and economic decentralization and the widespread ownership of property” in opposition “to the growth of corporate farming, the decay of the small town, and the expansion of centralized political and economic authority.” ……

In this mix, there was espoused a political economy for grass-roots America that neither Wall Street nor the socialists nor the New Dealers would find acceptable. It came largely out of the agrarian South, casting a baleful eye on both Wall Street and Washington, D. C. To these decentralists, the concentrated power of bigness would produce its plutocratic injustices whether regulated through the centralization of political authority in Washington or left to its own monopolistic and cyclical failures. They were quite aware of both the corporate state fast maturing in both Italy and Nazi Germany and the Marxists in the Soviet Union ……

Nor did they believe that a federal government with sufficient political authority to modestly tame the plutocracy and what they called “monopoly capitalism” could work, because its struggle would end either in surrender or with the replacing of one set of autocrats with another. As Shapiro wrote in the foreward, “while the plutocrats wanted to shift control over property to themselves, the Marxists wanted to shift this control to government bureaucrats. Liberty would be sacrificed in either case. Only the restoration of the widespread ownership of property, Tate said, could ‘create a decent society in terms of American history.’”

Although the decentralists were dismissed by their critics as impractical ….. their views have a remarkable contemporary resonance given today’s globalized gigantism, absentee control, and intricate corporate statism, which are undermining both economies and workers. They started with the effects of concentrated corporate power and its decades-long dispossession of farmers and small business. They rejected abstract theories by focusing instead on such intensifying trends as the separation of ownership from control; the real economy of production in contrast to the manipulative paper economy of finance; and the growth of “wage slavery,” farm tenancy, and corporate farming. One can only imagine what they would say today! (Nader, pp. 139-141.)

I apologize for the long quote. These people advocated doing away with the “joint stock corporation” for the most part, to be replaced by cooperatives. I’m not sure about the liability of members of these cooperatives, but that’s a major issue. Without limited liability, I would hesitate to co-invest in any project unless all the partners were as liquid and wealthy as myself, otherwise guess who ends up holding the bag! And it is to be noted that many insurance companies, and some savings and loans, including, until the 1980s, all federally chartered ones, were in fact “mutual” and owned by their depositors or policy holders.

They did not succeed as far as agricultural land was concerned. The concentration of agricultural land under fewer and fewer owners, and even more the oligopolies of processing food through such entities as Cargill, Tyson, and Archer Daniels Midland, proceeded apace. But “widely distributed property ownership” resurfaced on another front; the urban-suburban one. The New Deal first chartered the Federal Housing Administration to underwrite and guarantee loans for homes, and in Truman’s time the Veterans Administration and other reforms brought this regime into full flower. So instead of their forty acres and a mule, people got their ¼ acre and an automobile, the only practical way to travel from their ¼ acre to wherever they wanted to go.

Eventually people came to see their ¼ acre with a house on it as an “investment,” and further, a “source of wealth.” But this was not a truly agrarian source of wealth. Farms depend for their value on the quality of their soil and their productivity as farms. They are truly commercial real estate. But residences depend for their value only to a minor degree on what is on the property itself, but rather on what is around it; and suburbanites demanded that covenants, or the Government in the form of City Hall or County Hall, control their neighbors and what is around them. Part of the reason for living in the suburbs, after all, is the presence of trees and green space. (The suburbanites have therefore been friendly to the environmental cause, as long as it did not touch their automobiles.) There was also the factor that just as printing money dilutes its value, “printing” a large number of houses in an area dilutes their value as well. And, the more development, the more traffic comes to resemble that of the centralized portion of the city and one’s automobile gets stuck in it. Fact: the borough of Irvine, where my office is, imposes a “cap and trade” system on those who would desire to build or repair commercial structures, and what one buys in this marketplace is not carbon or pollution, but potential car trips that one’s project might be potentially using. The suburban model, in the end, demanded that to preserve suburban values, that the building of suburbs be stopped! That’s the irony of the whole thing.

Howard Ahmanson of Fieldstead and Company, a private management firm, has been interested in these issues for many years.

Urban Cores, Core Cities and Principal Cities

0
0

Many American cities, described commonly as urban cores, are functionally more suburban and exurban, based on urban form, density, and travel behavior characteristics. Data from the 2010 census shows that 42.3 percent of the population of the historical core municipalities was functionally urban core (Figure 1). By comparison, 56.3 of the population lived in functional suburbs and another 1.3 percent in functionally exurban areas (generally outside the urban areas). Urban cores are defined as areas that have high population densities (7,500 or per square mile or 2,900 per square kilometer or more) and high transit, walking and cycling work trip market shares (20 percent or more). Urban cores also include non-exurban sectors with median house construction dates of 1945 or before. All of these areas are defined at the zip code tabulation area (ZCTA) level, rather than by municipal jurisdiction. This is described in further detail in the "City Sector Model" note below.

The Varieties of Central Cities

Of course the “urbaneness” of central cities vary greatly. Some, like New York, Boston, Chicago, and San Francisco experienced much of their growth before the 20th century, well before the great automobile oriented suburbanization that occurred after World War II. Others, that experienced early growth, such as Milwaukee and Seattle, annexed substantial areas of suburbanization after World War II, so that their comparatively large functional urban cores have been overwhelmed by suburbs within the city limits. Los Angeles, with a large functional urban core, annexed huge swaths of agricultural land that later became suburban. Finally, a number of other central cities, such as Phoenix and San Jose, have developed since World War II and are virtually all suburban,

Moreover, central cities comprise very different proportions of their respective metropolitan areas (the functional or economic definition of "city"). For example, the central city of San Antonio comprises 62 percent of the San Antonio metropolitan area population. Conversely, the city of Atlanta comprises only 8 percent of the Atlanta metropolitan area population. Obviously, with such a large differential, the term central city describes jurisdictions that are radically different.

This difference is caught by examining the functional urban cores by historical core municipality classifications. The Pre-World War II Core & Non-Suburban central cities have functional urban cores comprising 72 percent of their population. The Pre-World War II Core & Suburban central cities have functional urban cores that are only 14 percent of their populations. The Post-World War II Suburban central cities have very small urban cores, representing only 2 percent of their population (Figure 2).

Among the 54 historical core municipalities, the share of central city population in the functional urban cores varies from a high of more than 97 percent (New York) to virtually zero (Birmingham, Charlotte, Dallas, Jacksonville, Orlando, Phoenix, Raleigh, San Bernardino, San Jose, and Tampa).

Core Cities with the Strongest Urban Cores

It is not surprising that the central cities with the largest share of their populations in the functional urban cores are in the older, established are concentrated in the Northeast Corridor (Washington to Boston) and the Midwest. Only one of the 14 central cities with the highest population share in functional urban cores is outside these areas is San Francisco, the first large city to be built on the American West Coast Among the 25 central cities with the highest functional urban core share, only seven are outside the Northeast Corridor or the Midwest (San Francisco, Oakland, Seattle, New Orleans, Portland, Los Angeles and Salt Lake City).

It is not surprising that the city of New York has the largest function urban core population share, at 97.3 percent. Nearly one-third of the total urban core population in the 52 major metropolitan areas lives in the city of New York (nearly 8,000,000 residents).

Two other central cities have functional urban core population percentages above 90 percent. Buffalo ranks second, at 94.5 percent. San Francisco is third at 94.0 percent.

The next three highest ranking cities are in New England. Boston has an 89.7 percent functional urban core population, followed by Hartford (87.4 percent), and Providence (86.5 percent). These are all of the major metropolitan areas in New England.

Three Midwestern central cities have more than 80 percent of their populations in functional urban cores, including St. Louis (84.1 percent), Minneapolis (83.5 percent), and Cleveland (80.1 percent). Washington (83.4 percent) and Philadelphia (83.4 percent), in the Northeast Corridor also have greater than 80 percent functional urban core shares.

Pittsburgh (76.9 percent) and Chicago (76.6 percent) have functional urban core population shares between 70 percent and 80 percent. At 67.7 percent, Baltimore (67.7 percent) is the only central city in the Northeast Corridor that with less than 70 percent of its population in the functional urban core.

Oakland (54.7 percent), at 15th, is the highest ranking central city outside the Northeast Corridor and the Midwest other than San Francisco. Cincinnati, Rochester, and Milwaukee also have more than 50 percent of their population in functional urban cores.

The top 25 is rounded out by Seattle (37.5 percent), New Orleans (36.8 percent), St. Paul (36.7 percent), Portland (35.2 percent), Detroit (31.3 percent), Los Angeles (29.9 percent) and, somewhat unexpectedly, Salt Lake City (27.1 percent).

The central cities with the largest functional urban core percentages have overwhelmingly suffered large population losses. Among the 25 with the largest urban core shares, only seven were at their peak populations at the 2010 census, and only two of the top 18 (New York and San Francisco). Overall the cities with large functional cores lost more than 35 percent of their population and 8 million residents.

"Other" Principal Cities

Starting in 2003, the Office of Management and Budget (OMB) retired the term "central city" and replaced it with "principal city," which includes the 54 former historical core municipalities and approximately 160 additional cities. The adoption of principal city terminology recognized as OMB described it, that metropolitan areas were no longer monocentric, but had become polycentric. OMB specifically rejected the use of geographical terms other than "principal city" within metropolitan areas, including "suburb." Indeed, the very employment of polycentricity that justified abandonment of the central city designation was the suburbanization of employment. Yet some popular usage (even in some Census Bureau documents), considers any area that is not a principal city as suburban. The more appropriate term would be "not principal city."

Some principal cities that are not historical core municipalities ("other" principal cities) have strong urban cores, especially in metropolitan areas where the urban core stretches well beyond the core municipality's city limits, especially in New York and Boston. Four such principal cities have urban cores larger than 100,000 and urban core population shares exceeding 90 percent, including Cambridge in the Boston area (97.0 percent, and the New York area's Newark (94.7 percent) and Jersey City (100.0 percent), which is higher even than New York City itself. None of these cities was at its population peak in 2010.

Even so the vast majority of the "other" principal cities are overwhelmingly suburban, comprising less of the functional urban core population than areas that are not principal cities (1.5 million compared to 4.1 million outside the principal cities). Overall, the other principal cities are 7.9 percent urban core (compared to 42.3 percent for the historical core municipalities). If the 11 municipalities with cores larger than 50,000 are excluded, the share living in functional urban cores for the remaining more than 150 cities is 1.5 percent. (Figure 4).

Crude Measurement

The perhaps stunning conclusion is that the average difference between the historical core municipality population and the functional urban core population is 73 percent. Core cities --- themselves 57 percent suburban and exurban --- are a crude basis for classifying urban cores and suburbs. Principal cities --- 92 percent functionally suburban or exurban --- are even worse. The bottom line: America is fundamentally more suburban in nature than commonly believed.

-----

City Sector Model Note: The City Sector Model allows a more representative functional analysis of urban core, suburban and exurban areas, by the use of smaller areas, rather than municipal boundaries. The nearly 9,000 zip code tabulation areas (ZCTA) of major metropolitan areas are categorized by functional characteristics, including urban form, density and travel behavior. There are four functional classifications, the urban core, earlier suburban areas, later suburban areas and exurban areas. The urban cores have higher densities, older housing and substantially greater reliance on transit, similar to the urban cores that preceded the great automobile oriented suburbanization that followed World War II. Exurban areas are beyond the built up urban areas. The suburban areas constitute the balance of the major metropolitan areas. Earlier suburbs include areas with a median house construction date before 1980. Later suburban areas have later median house construction dates.

-----

Wendell Cox is principal of Demographia, an international public policy and demographics firm. He is co-author of the "Demographia International Housing Affordability Survey" and author of "Demographia World Urban Areas" and "War on the Dream: How Anti-Sprawl Policy Threatens the Quality of Life." He was appointed to three terms on the Los Angeles County Transportation Commission, where he served with the leading city and county leadership as the only non-elected member. He was appointed to the Amtrak Reform Council to fill the unexpired term of Governor Christine Todd Whitman and has served as a visiting professor at the Conservatoire National des Arts et Metiers, a national university in Paris.

Photo: Downtown Houston (by author)

The Uniqueness of Detroit’s Housing Stock

0
0

Last week, as part of my series on planning reasons behind Detroit’s decline, part 2 of the nine-part series was about the city’s poor housing stock.  I started to play with some numbers to see if there was any validity to my opinions about the city’s housing, and I found some very intriguing things.  Detroit’s housing stock is definitely unique among its Midwestern and Rust Belt peer cities, and perhaps among cities nationwide.  Let’s examine.

Grouping the cities by population figures from the 2013 U.S. Census population estimates, and housing data from the 2008-2012 American Community Survey, I looked at housing age and single family detached housing data for 15 Midwest/Rust Belt cities with populations above 250,000.  One city I typically include in an analysis like this, Louisville, was not included due to a lack of ACS data.  Data for the Twin Cities of Minneapolis and St. Paul were aggregated into one (sorry, Minneapolis and St. Paul) because they jointly function as the core city for their region.  Here’s the big table with all the data:


That’s a lot to digest, so I’ll take the data piece by piece.  First, let’s look at the cities ranked by their percentage of housing units built in 1969 or earlier:

You’ll see here that, perhaps following the general national perception of Detroit housing, the Motor City has an older housing stock.  Only Buffalo has a higher percentage of older housing. Generally speaking, the cities at the top half of this list have older housing because they lack redevelopment activity that replaces older housing, while cities at the bottom half consists of cities with decent levels of redevelopment activity, or more recently built housing that’s been annexed into the city in recent decades.  Here, Detroit does seem to fit the pattern.

But does it really?  If you look at the Census’ earliest category for age of structure, 1939 or earlier, Detroit drops considerably on the list:

Instead of ranking second as in the earlier table, Detroit falls to tenth.  The rest generally hold the same spots they occupied from the previous table as well. The only ones ranking lower than Detroit here are smaller cities (Omaha, Ft. Wayne) and the cities that annexed large amounts of land post 1970 (Kansas City, Indianapolis, Columbus).

Next, let’s look at how the cities rank in terms of their concentrations of single family detached homes:

Detroit shows up here with the second highest percentage of single family detached homes, comprising nearly two-thirds of the city’s housing stock.  Once again, the only comparable cities are the smaller cities and the big annexers.

Clearly, most observers believe Detroit has more in common with Buffalo, Cleveland and Pittsburgh than with Ft. Wayne, Kansas City and Indianapolis.  What happened to Detroit’s housing stock that gave it such an odd profile?

To understand, let’s pull out a specific category on the age of structure table, the 1950-1959 category:

Here, we find that Detroit has, by far, the highest concentration of housing units built between 1950-59 of all its peer cities.  Nearly one in four homes in Detroit were built during this period.  In fact, Detroit, along with Milwaukee and Toledo, occupies a strange space among Midwestern/Rust Belt cities.  (Side note: the more I study Detroit against other Midwestern cities, the more I find that Detroit and Milwaukee are virtually the same city.  And it doesn’t surprise me that Toledo, just 75 miles from Detroit, would share its characteristics as well).  Detroit, Milwaukee and Toledo all added their greatest numbers of housing at the outset of the modern suburban development period, what I’ve called the Levittown Period in my so-called Big Theory of American Urban Development.  This supports my thinking that if anyone was ever interested in establishing a Levittown-style national historic district, Detroit would be a good candidate.  The Motor City has perhaps more small Cape Cod-style, three-bedroom, one-bath single family homes than any city in the nation.

How did Detroit get this way?  Housing demolition likely had some role in a city that lost so much.  Detroit likely lost older single family homes and multifamily buildings over the last few decades, leading to skewed numbers.  The same is also true of Indianapolis, Kansas City and Columbus, cities that annexed large undeveloped areas after 1970 and built new housing there.  Keep in mind, though, that Milwaukee and Toledo, Detroit’s comparables, may not have had the same level of demolition loss that Detroit had, yet they still match the Motor City well.

That leads me to believe that a concentration of housing development at a unique time is a crucial piece in understanding Detroit’s housing stock.

Here’s another way of looking at this.  I grouped the cities by age and single family home concentration and came up with interesting groupings:

Here it becomes clearer that Detroit and Toledo stand alone as locations for old or moderately old structures that are largely single family.  Also, Milwaukee’s greater mix of single family and multifamily units begins to set it apart from Detroit and Toledo, even when it has a similar concentration of Levittown-style housing.

Finally, let’s consider housing adaptability as part of the housing stock analysis.  Chicago, the region’s largest city and lone “global city” member of the group, comfortably rests in the middle of all tables except for the single family detached table, where it shows the lowest concentration of single family homes.  My guess is that Chicago’s continued desirability means more newer housing has been built, and that its lower single family housing numbers mean that other housing types (lofts, condos and the ubiquitous 2-flat and 3-flat) created a more flexible and adaptable housing development landscape.

Assuming that younger structures are more often suitable to renovation for adaptability, moderately old structures require more intense rehabs, and older types are more often subject to demolition and rebuilding, I reorganized the previous table in terms of housing adaptability:

And if I put in the cities next to this adaptability scale, it’s easy to see the magnitude of Detroit’s housing challenges:

Detroit is such a unique city in so many ways.  The Motor City needs more research and analysis that highlights its uniqueness and adds to our understanding of the what led to its downfall, and less of our ire and contempt.

The more I study Detroit, the more I see the seeds of a similar downfall in other cities nationwide.

This post originally appeared in Corner Side Yard on July 6, 2014.

Pete Saunders is a Detroit native who has worked as a public and private sector urban planner in the Chicago area for more than twenty years.  He is also the author of "The Corner Side Yard," an urban planning blog that focuses on the redevelopment and revitalization of Rust Belt cities.

Lead photo: A scene from the Grixdale neighborhood on Detroit’s northeast side.  Source: Google Earth.

Democrats Risk Blue-collar Rebellion

0
0

If California is to change course and again become a place of opportunity, the impetus is likely to come not from the perennially shrinking Republican Party but from working-class and middle-class Democrats.

This group, long quiescent, has emerged most notably in opposition to the state’s anti-global warming cap-and-trade policies, which will force up energy prices. Recently, some 16 Democratic Assembly members, led by Fresno’s Henry Perea, asked the state to suspend the cap-and-trade program, which will add as much as a dollar to what already are among the highest gasoline prices in the nation.

In some senses, this budding blue-collar rebellion exposes the essential contradiction between the party’s now-dominant gentry Left and its much larger and less well-off voting base. For the people who fund the party – public employee unions, Silicon Valley and Hollywood – higher energy prices are more than worth the advantages. Public unions get to administer the program and gain in power and employment while venture capitalists and firms, like Google, get to profit on mandated “green energy” schemes.

What’s in it for Hollywood? Well, entertainment companies are shifting production elsewhere in response to subsidies offered by other states, localities and companies, so high energy costs and growing impoverishment across Southern California doesn’t figure to really hurt their businesses. Furthermore, by embracing “green” policies, the famously narcissistic Hollywood crowd also gets to feel good about themselves, a motivation not to be underestimated.

This upside, however, does not cancel out hoary factors such as geography, race and class. One can expect lock-step support for any proposed shade of green from most coastal Democrats. Among lawmakers, the new Democratic dissenters don’t tend to come from Malibu or Portola Valley. They often represent heavily Latino areas of the Inland Empire and Central Valley, where people tend to have less money, longer drives to work and a harder time affording a decent home. Cap and trade’s impact on gasoline prices – which could approach an additional $2 a gallon by 2020 – is a very big deal in these regions.

Many of these same people historically have worked in industries such as manufacturing and logistics, industries that rely on reasonable energy prices. Companies in these fields increasingly seek locations in lower-cost states, such as Washington, Oregon, Texas, Utah and Arizona, taking generally high-paying blue-collar jobs with them. It’s rare to find a manufacturer, for example, who would move to or expand in, California, outside of a handful of subsidized firms. Even ethnic-food companies are looking elsewhere, despite the fact that the raw materials and a large local market exist here.

The dispute in California over cap and trade – where government limits businesses’ greenhouse gas emissions, and higher-emitting companies buy allowances to exceed their limits – may just be the harbinger of a wider conflict within the party nationally. In Washington, D.C., there is tension between East Coast and West Coast Democrats on one side and representatives from the Plains and the South on the other. Progressives shrug at the loss of these regions and the associated white working-class voters who, as the liberal website Daily Kos contended earlier this year, are just a bunch of racists, anyway.

But, at least here in California, much of the working class is made up of minorities, who are increasingly the economic victims of the enlightened ones. One place to see this is in Richmond in Northern California, where a Green Party mayor and a similarly aligned planning department have tried to block the refurbishing of Chevron’s large refinery there, which is also the economic bulwark of the area.

The dispute over the refinery suggests divisions that may become more commonplace. Essentially, you have on one side overwhelmingly white, often very-affluent greens, allied with powerful Democratic politicians, arrayed to obstruct the refinery. On the other side, you have minorities, many of them union members, whose livelihoods and high-paying jobs depend on the refinery.

The incipient rift between such blue-collar workers and gentry Democrats is inevitable. The wealthy donors who dominate both local and national Democratic politics, like San Francisco hedge fund mogul Tom Steyer, may have made much of their fortunes in fossil fuels, as the New York Times, among others, have reported. But now, having embraced a stringent environmentalism, the gentry seek to impose their “green” agenda on the hoi polloi. If this hypocrisy isn’t disturbing enough, consider the increasingly top-down nature of environmentalist politics. In the past, conservationists focused on how to protect people from harm and preserve nature, in part, so people might enjoy it.

Many of today’s progressives not only are determined to protect their privileges, but seek to limit the opportunities for pretty much everyone else. People like Steyer, for example, who is close to both the Obama White House and Senate Majority Leader Harry Reid, can enjoy their vast estates, while supporting policies that make it improbable for middle-class families to afford a home with a decent back yard.

In many ways, their approach is reminiscent of the old British aristocracy, who combined a passion for preserving nature within their lands with a commitment to limiting its accessibility to the masses. People like billionaire venture capitalist Vinod Khosla are big on being green, but don’t want their less well-endowed neighbors to access the beach near their estates. It’s “Animal Farm” for the ecological age: Some animals, it seems, are more equal – and righteously green – than others.

With virtual strangleholds on much of the media, academia and the punditry, the gentry and their allies may be able to limit coverage of this inherent conflict, but it will be difficult to suppress forever the essential contradictions between the gentry and everyone else.

Democratic strategists hope that, by focusing on social issues – immigration, abortion and gay rights – they can keep the peasants in line. And to be sure, Republicans pushing nativism and social conservatism seem determined to distract Latinos, Asians, women and gays from focusing on the realities of an increasingly neofeudalist California. Political analyst Michael Lind contends this Democratic strategy may not succeed over time. For one thing, he notes, differences on many social issues are narrowing, in part, as more minorities, singles and gays move into suburban or exurban locales.

As social issues become less heated, political divides figure to develop more along economic lines. This conflict may prove no easier to resolve than the GOP’s internal struggle between the Tea Party and corporatists. The Democratic divide will pit much of the party’s financial and media base, in Hollywood and Silicon Valley, against the interests and aspirations of middle- and working-class people who make up the vast majority of Democratic voters.

For those who enjoy political combat, this schism guarantees more sharp divisions among the Democrats. More importantly, this conflict should generate greater debate about correcting our current course, which would be good news for the rest of us.

This article first appeared in the Orange County Register.

Joel Kotkin is executive editor of NewGeography.com and Distinguished Presidential Fellow in Urban Futures at Chapman University, and a member of the editorial board of the Orange County Register. He is author of The City: A Global History and The Next Hundred Million: America in 2050. His most recent study, The Rise of Postfamilialism, has been widely discussed and distributed internationally. He lives in Los Angeles, CA.

Auto manufacturing photo by BigStockPhoto.com.

Millennial Boomtowns: Where The Generation Is Clustering (It's Not Downtown)

0
0

Much has been written about the supposed preference of millennials to live in hip urban settings where cars are not necessary. Surveys of best cities for millennials invariably features places like New York, San Francisco, Chicago and Boston, cities that often are also favorites of the authors.

Yet there has been precious little support for such assertions. Iasked demographer Wendell Cox to do a precise, up-to-date analysis of where this huge generation born between 1983 and 2003 actually resides. Using Census American Community Survey data, Cox has drawn an intriguing picture of millennial America, one that is often at odds with the conventional wisdom of many of their elders.

The Hidden Millennials

We focused on individuals aged 20 to 29, which represents most of the millennial generation that is finishing post-secondary education and getting established in the workforce. Much of the writing about millennials focuses on their impact on downtowns and urban cores. And to be sure, the numbers of millennials living in urban cores has grown, as downtowns and inner-city neighborhoods have gentrified, particularly in cities such as Boston, Seattle, San Francisco, New York and Chicago. Overall, from 2010 to 2013, the population of 20- to 29-year-olds in core counties (which in most cases are identical to the core city of the metropolitan area) rose by 407,400, or 3.2%.

However, that must be put in the context of the overall increase nationwide of that age group in that time span: 4%. Despite the growth in raw numbers of 20- to 29-year-olds living in core counties, the share of the age group living in these areas actually declined slightly, by 0.78%, compared to 2010. Meanwhile, the share of the age group living in the less dense portions of metropolitan and micropolitan statistical areas  increased. Overall roughly 30% of all millennials live in core counties, which means 70% live somewhere else. In the last three years, the number of millennials outside core counties increased by 1.28 million. In 2010, the functional urban cores, characterized by higher density and higher reliance on transit, were home to 19% of the 20-29s in major metropolitan areas, down from 20% in 2000.

In contrast to the constantly reported on urban hipsters, the vast majority of this generation, who get precious little attention from the media or marketing gurus, might be best described as “hidden millennials.” We have to assume some of these young people are still living, primarily in suburbia, with their parents; a recent Pew study put the percentage of people 18 to 31 living at home at 36%, up from 32% before the recession, as well as the 34% level registered in 2009.

This constitutes a population of over 20 million and not all are hopeless slackers — the vast majority have at least some college education. But they are also disproportionately unemployed or out of the workforce, and, living in their parents’ homes, they are pretty much ignored by everyone except perhaps their friends and relatives. Other millennials may well be living in suburban apartments, which tend to be somewhat less expensive, and others, perhaps the oldest of the group, have begun to “launch” starting families and buying houses, which would tend to put them in the suburbs and smaller cities as well.

Millennial Boomtowns

Equally surprising are those cities that have seen the largest increases in their millennial population. It is dogma among greens, urban pundits, planners and developers that the under 30 crowd doesn’t like what Grist called “sprawling car dependent cities.” Too bad no one told most millennials. For the most part, looking at America’s largest metro areas (the 52 metropolitan statistical areas with populations over a million) the fastest growth in millennial populations tend to be in the Sun Belt and Intermountain West. Leading the way is, San Antonio, Texas, where the 20 to 29 population grew 9.2% from 2010-13, an increase of 28,600.

Right behind it, also in the Sun Belt, are Riverside-San Bernardino, Calif. (8.3%); Orlando, Fla. (8.1%); and Miami (7.7%).

Surprisingly Detroit, long considered a demographic basket case, comes in it at No. 5 in our study, with an impressive 6.8% increase. Given the implosion in the population in the city of Detroit, this growth is likely to have taken place almost entirely in the region’s suburbs, which have done far better both economically and demographically than the core.

The Hipster Capitals Lag

For the most part the “capitals of cool” allegedly so irresistible to millennials rank further down the list. The only two arguable hipster magnets to make the top ten were the Denver metro area (seventh) and  Seattle (ninth). The New York metro area ranks 39th with a 3.2% increase, lagging the national expansion in this age group of 4%. The San Francisco-Oakland region, despite the tech boom, places 37th, while the Portland area, renowned as a place where millennials supposedly “go to retire,” ranks 44th. The Chicago metro area’s 20-29 population was essentially unchanged, putting it 49th on our list.

One reason may be that core urban areas are not experiencing the surge in millennials widely asserted. Indeed the millennial populations of the five core counties (or boroughs) of New York grew only 2%, half the national rate of increase and below that of the metro area as a whole.

The same pattern can be seen in the cores of such attractive hipster magnets as San Francisco and Boston, both of which have seen negligible growth among millennials. It appears these areas always attract young people, but also lose them over time. Even more shocking, the 20-29 populations have actually declined since 2010 in the core areas of such much celebrated youth magnets as Chicago (-0.6%) and Portland(-2.5%). Besides Seattle and Denver, the only hip core city showing expanding appeal to millennials is the anomaly of resurgent New Orleans, where the ranks of 20-29 old has grown over 5% since 2010.

The Future of Millennial America

What emerges from this survey is a  picture of a millennial America that does not much mirror the one suggested in most media and pundit accounts. The metro areas with the highest percentages of millennials tend, for the most part, to be not dense big cities but either college towns — Austin, Texas; Columbus, Ohio, for example — or Sun Belt cities. Virginia Beach leads the pack, with 17% of its population aged 20 to 29, compared to 14% nationwide.

But overall  the towns with the biggest share of millennials today are also those growing this population the fastest:  Southern or Intermountain West cities. One big contributing factor is their large Hispanic communities, which for the last three decades have had a far higher birthrate than whites. Latinos constitute 20% of all millennials. This may help explain the large presence of millennials in places like Orlando, Riverside-San Bernardino, and Los Angeles. Other factors may be places where there tend to be high numbers of children, such as Mormon-dominated Salt Lake City.

What these results suggest is that marketers, homebuilders and politicians seeking to target the increasingly important millennial population need to look beyond urban cores. The vast majority of millennials do not live in dense inner city neighborhoods — in fact less than 12% of the nation’s 20-29s did in 2010. Rather than white hipsters, many millennials are working class and minority;  in 2012, Hispanics and African-Americans represented 34% of the 20-29 population. Presumably many of them are more concerned with making a living than looking out for “fair trade” coffee or urban authenticity.

Like most of America, the millennials are far more suburban, more dispersed and less privileged than what one sees on shows such as “Girls” or read about in accounts in theNew York Times and the Wall Street Journal. Reality is often more complex, and less immediately compelling, than the preferred media narrative. But understanding the actual geography of this generation may provide a first step to gaining wisdom how to approach and understand this critically important generation.


20-29 Population Change: Major Metropolitan Areas: 2010-2013
RankMajor Metropolitan Area (MMSA)20102013Change
1San Antonio, TX        311        340 9.2%
2Riverside-San Bernardino, CA        605        655 8.3%
3Orlando, FL        322        348 8.1%
4Miami, FL        716        771 7.7%
5Detroit,  MI        506        541 6.8%
6Houston, TX        856        909 6.2%
7Denver, CO        357        378 6.0%
8Charlotte, NC-SC        288        304 5.8%
9Seattle, WA        499        528 5.7%
10Virginia Beach-Norfolk, VA-NC        274        290 5.6%
11Buffalo, NY        153        162 5.4%
12Jacksonville, FL        187        197 5.3%
13Grand Rapids, MI        141        148 5.2%
14Tampa-St. Petersburg, FL        341        359 5.1%
15Rochester, NY        146        153 4.8%
16Dallas-Fort Worth, TX        911        954 4.7%
17Raleigh, NC        154        161 4.7%
18Los Angeles, CA     1,941     2,032 4.7%
19Richmond, VA        167        174 4.6%
20Nashville, TN        242        253 4.6%
21Indianapolis. IN        253        264 4.5%
22Phoenix, AZ        592        618 4.3%
23Sacramento, CA        307        321 4.3%
24Cleveland, OH        242        252 4.3%
25Austin, TX        295        307 4.2%
26Boston, MA-NH        663        690 4.1%
27Memphis, TN-MS-AR        182        189 4.1%
28Oklahoma City, OK        195        203 4.0%
29Atlanta, GA        719        747 4.0%
30Hartford, CT        154        160 3.9%
31San Jose, CA        254        263 3.9%
32Pittsburgh, PA        293        305 3.8%
33Providence, RI-MA        217        224 3.6%
34San Diego, CA        521        540 3.5%
35Baltimore, MD        381        394 3.5%
36Washington, DC-VA-MD-WV        818        846 3.4%
37San Francisco-Oakland, CA        605        625 3.4%
38New Orleans. LA        176        181 3.3%
39New York, NY-NJ-PA     2,740     2,828 3.2%
40Columbus, OH        283        291 3.0%
41Louisville, KY-IN        159        164 3.0%
42Philadelphia, PA-NJ-DE-MD        823        848 3.0%
43Las Vegas, NV        277        285 2.9%
44Portland, OR-WA        306        311 1.8%
45Cincinnati, OH-KY-IN        280        285 1.7%
46Kansas City, MO-KS        263        267 1.3%
47St. Louis,, MO-IL        371        372 0.2%
48Chicago, IL-IN-WI     1,326     1,328 0.2%
49Minneapolis-St. Paul, MN-WI        470        471 0.2%
50Birmingham, AL        151        151 -0.4%
51Milwaukee,WI        216        215 -0.4%
52Salt Lake City, UT        178        177 -0.5%
MMSAs   23,827   24,780 4.0%
Outside MMSAs   18,862   19,595 3.9%
United States   42,688   44,376 4.0%
In thousands

Analysis by Wendell Cox.

This story originally appeared at Forbes.

Joel Kotkin is executive editor of NewGeography.com and Distinguished Presidential Fellow in Urban Futures at Chapman University, and a member of the editorial board of the Orange County Register. He is author of The City: A Global History and The Next Hundred Million: America in 2050. His most recent study, The Rise of Postfamilialism, has been widely discussed and distributed internationally. He lives in Los Angeles, CA.


What College Gowns Bring to Towns

0
0

The college town, one of America’s most appealing and unique features, grew out of the Age of Reason, and the concept of a regional, liberal-arts college nurtured by a small town has been intertwined with American history. Today, with enrollment dropping, the small, private college seems to be going the same way as the typewriter, the newspaper and the independent bookstore. While some colleges struggle to survive, the institution of the college town lives in suspended animation, ready to support whatever form its major employer may take. One thing’s for sure: the reinvention of the post-college town is coming.

Here in Central Florida, the tradition of a liberal-arts college entwined with a small or medium-sized municipality is alive and well, for the moment. But trouble is brewing. While private institutions in Central Florida may not advertise their funding problems, the truth is plain to see. Rapid expansion of athletic programs, sure-fire profit centers for most schools, is underway at Rollins College, Stetson, and University of Tampa, and all are exploring other ways to reach more students, as well.

Florida’s public universities are not immune to budget problems, either. And their response to the financial crisis says much about the future of college towns everywhere.

Reinvention of the liberal arts college itself has been a cottage industry for the last several years. Student body diversification into “lifelong learning” (read: the lucrative retiree demographic), extensions, outreach campuses, and summer programs for primary and secondary schools has surged, as colleges try to open new markets. Bloated administrative costs have given rise to urgent fundraising and athletic programs, while an army of poorly paid adjunct professors shoulder an increasing burden of responsibility for the actual work of teaching. But, as Moody’s analyst Susan Fitzgerald has said about small, tuition-dependent colleges, they are in “a death spiral – this continuing downward momentum for some institutions [means] we’ll see more closures than in the past.”

The Economist magazine has compared colleges to newspapers. If their analogy were to hold true, of the 4,700 colleges and universities in the world, “more than 700 institutions would shut their doors.” Citing the rise of massive, open, online courses or MOOCS, the magazine suggested that the idea of a professor interacting face-to-face with students will become a luxury. Colleges seem destined to end up in the same tiresome boat as the rest of the digital world, where everything, ultimately, becomes a product on Amazon.

Uncertainty about the future has hastened the liberal arts school’s demise. In the darkest days of the recession we were told there was a STEM crisis: science, technology, engineering and mathematics were the fields that would get you a job. People ditched their liberal arts pursuits for more practical, employable ones, swearing off the indulgent frivolity of a philosophy course for a computer programming class. Panicking parents and students stampeded out of the gothic halls of the English department as fast as they could.

Here in Florida, to pay for a new state campus in Lakeland, the Governor gutted the operational budget of Florida’s 11 other institutions of higher education. The new campus, located on rural land adjacent to Interstate 4, is far from any sort of population center. It's a soulless commuter school; any form of a college town to accompany it lies far, far in the future.

USF Polytechnic is being billed as a “destination campus”. Its showy new structure nearly complete, it lies naked to the Florida scrub and Interstate 4, with a few lonely stucco buildings and portable classrooms marking a kind of desperate, treeless sense of place in the hot Florida sun. No flip-flop-shod students strumming guitars, debating the meaning of Proust or the relevance of Marx will ever be found under its oak trees or in front of its bohemian coffee shops, because there aren’t any. Instead, there’s a harsh, asphalt parking lot and a long, hot trudge to the endpoint, another signal that one’s college years are just like a shopping trip to Wal-mart.

If the one-in-seven death rate holds true, then one of the seven college towns in Central Florida will not have a future either. Gainesville, DeLand, Winter Park, St. Augustine, Tampa, Lakeland, and St. Petersburg are seven places with streets, residences, and businesses that each have grown up around colleges, public and private, and that enjoy a thriving sidewalk life.

Ironically, at least two of these colleges were born in another desperate time, the Great Depression. The University of Tampa, across the Hillsborough River from downtown Tampa, started in a failed hotel when the city took it over from owner Henry Plant’s railroad empire. Likewise, Flagler College in St. Augustine began in a resort hotel built by New York railroad magnate Henry Flagler. The small, private, liberal-arts college was a perfect solution. A grand old structure was re-inhabited, and a struggling city was bolstered.

Towns that grew up around these places have different, more informal qualities than other towns. In Gainesville, for example, churches, temples, student centers, and other non-profit institutions occupy prominent positions within the urban core. There's a diversity of old houses with garage apartments, lean-tos, and enclosed porches. Wood apartment buildings have side stairs, outdoor beer kegs, and bicycle racks. They sit under huge, mature trees, clad in subtropical philodendron vines, and are connected by narrow dirt pathways carved independent of sidewalks. A sense of grown-over-time pervades within and around campus, its boundaries softened by sneaker and bicycle traffic, concert posters and poetry reading notices.

Gainesville, with nearly fifty thousand students, will probably survive, but other, smaller towns may struggle. As conversion to digital learning reduces costs, the college town may disappear. Anonymous reviews, posted online, replace conversations in bookstores. University Avenue may be deleted, just like yesterday’s term paper.

Our bookshelves are crowded with titles about the urban future, but in all of this furious scribbling it seems no one has noticed that sidewalks have all but emptied out in many of our cities. Chicago, New York, San Francisco, and a few more still march to the pedestrian beat. But a fairly thorough survey of peninsular Florida yields few sidewalks with any kind of street life — and the few that still operate as shared, social space all belong to our college towns.

Students, with one foot in childhood and one in adulthood, still walk on sidewalks. They shop online, too, but they still patronize businesses for the sake of the social interaction, and still have use for the physicality of the street… for a street life that seems to be endangered.

College towns, living on today in a shadow of their former bohemian selves, will be reinvented, just as education systems will. But for now, deprived of street life, we breed a different sort of citizen and thinker than an old college town once did. This new digital citizen will construct social space in ways yet to be foreseen.

Richard Reep is an architect with VOA Associates, Inc. who has designed award-winning urban mixed-use and hospitality projects. His work has been featured domestically and internationally for the last thirty years. An Adjunct Professor for the Environmental and Growth Studies Department at Rollins College, he teaches urban design and sustainable development; he is also president of the Orlando Foundation for Architecture. Reep resides in Winter Park, Florida with his family.

Photo of downtown Gainesville by the author. This scene is typical of the streets surrounding the campus of the University of Florida.

Size is not the Answer: The Changing Face of the Global City

0
0

This is an exerpt from a new report published by Civil Service College of Singapore, authored by Joel Kotkin with contributions from Wendell Cox, Ali Modarres, and Aaron M. Renn.

Download the full report.

As the world urbanises and more megacities are created, some smaller, focused urban regions are becoming truly critical global hubs, unlike most larger cities, which are simply tied to their national economies. In a new ranking of global cities, CSC Senior Visiting Fellow Joel Kotkin argues that the truly global city is one that is uniquely situated to navigate the global transition to an information-based economy since the influence of industries such as media, culture or technology are the ones that will determine economic power in future. Kotkin also examines the fundamental challenge faced by cities as they achieve global status: the need to balance two identities, a global and a local one. "The world beckons, and must be accommodated, but a city must be more than a fancy theme park, or a collection of elite headquarters and expensive residential towers", he asserts.

In this urban age, much has been written and discussed about global cities.1 Yet, as the world urbanises and with more megacities (with populations of ten million or more) created, there is a growing need to re-evaluate which are truly significant global players and which are simply large places that are more tied to their national economies than critical global hubs. Similarly, it becomes more critical to consider the unique challenges faced by cities as they achieve world-wide status.

The term “world city” has been in use since the time of Patrick Geddes in 1915. In 1966, Peter Hall published his seminal work “The World Cities”. Hall’s world cities were all predominant cities in existing key nation-states. Later, the concept of “global cities”, based largely on concentrations of business service firms, emerged as the primary terminology describing such international centres.

Be it “world” or “global” cities, such cities have long based their pre-eminence on things such as cultural power, housing the world’s great universities, research laboratories, financial institutions, corporate headquarters, and existence of vast empires and their extended legacy. They also disproportionately attracted the rich, and served as centres of luxury shopping, dining, and entertainment. These world cities have exercised outsized global influence in a system dominated by nation-states.2

As a result, the discussion of global cities has focused primarily on megacities such as New York, Paris, Los Angeles, and Tokyo. This is not surprising, since the population of the world’s largest city has grown nearly six-fold since 1900 (London, in 1900, compared to Tokyo, in 2014). Smaller cities, such as Dubai, Houston, or the San Francisco Bay Area, have not been ranked as highly as they may have deserved.

Rethinking the Urban Hierarchy

We believe the traditional approach has underestimated the overarching importance of a region’s role in technology, media or its dominance over a key global industry.

This new appraisal also stems from the declining power of nation-states in a globalised economy. In 1900, the capitals of empire—London, Paris, Tokyo, Berlin and St. Petersburg—were also the largest cities, the predominant centres of world trade and the exchange of ideas. The exception was non-government anomaly, New York, which has remained North America’s premier city; in contrast, at least until recently, Washington was a relatively minor city.

Today, we are in a period like that of the Renaissance and early modern Europe, where global activity gravitates towards small, more trade-oriented cities, for example, Tyre, early Carthage, Athens, Venice, Antwerp, and Amsterdam and the cities of the Hanseatic League (each home to less than 175,000 people). These cities, for which trade was a necessity, were tiny compared not only to Constantinople (700,000 people), but also London and Paris (more than twice as the trading cities). Similarly, the early trade hubs of Asia were often not larger imperial capitals—such as Kaifeng and later Beijing in China— but smaller cities such as Cambay (India), Melaka (Malaysia) and Zaitun (now Quanzhou in China).

We are seeing smaller, focused urban regions that are achieving more than most larger cities. Compared to many of their larger counterparts, new and dynamic global cities, such as Singapore, Dubai, Houston and the San Francisco Bay Area, have become more influential in the world economy, as measured by critical factors like technology, media, culture, diversity, transportation access and degree of economic integration in the world economy. This “archipelago of technologically high developed city regions”, notes urban geographer Paul Knox, are replacing nation-states as emerging avenues of economic power and influence.

These new global hubs thrive not primarily due to their size, but as a result of their greater efficiencies. This can be seen in the location of foreign subsidiaries. For example, compared to Tokyo, Singapore now has more than twice as many regional headquarters; Singapore and Hong Kong also perform far better in this respect than Asia’s numerous, much larger but less affluent megacities. Global hubs are helped by their facility with English—the world’s primary language of finance, culture, and, most critically, technology. English dominates the global economic system from New York and London to Hong Kong, Singapore and Dubai. This linguistic, digital and cultural2 congruence poses concerns for major competing cities, including those Russia and mainland China.

Download the full report.

Joel Kotkin is executive editor of NewGeography.com and Distinguished Presidential Fellow in Urban Futures at Chapman University, and a member of the editorial board of the Orange County Register. He is author of The City: A Global History and The Next Hundred Million: America in 2050. His most recent study, The Rise of Postfamilialism, has been widely discussed and distributed internationally. He lives in Los Angeles, CA.

UN Projects 2030 US Urban Area Populations

0
0

The United Nations periodically publishes World Urbanization Prospects. One of the highlights is both historic and projected detailed population information for individual cities around the world. The publication provides perhaps the best summary of US urban area population trends since 1950 and also projects their population through 2030. The UN provides data for the 135 urban areas with an estimated population of at least 300,000 residents in 2014. Urban areas are the city in its physical form – the built up area (as opposed to cities in their functional or economic form, the metropolitan area, which includes economically connected territory outside the built up area, from the urban core to the suburbs to the periphery bordering farms and other rural land).

US Urban Areas Since 1950

The United States has undergone an urban population revolution since 1950, the first year that urban areas were designated by the US Census Bureau. In 1950, two-thirds of the population of the urban areas in the UN list was located in the urban areas of the Northeast and the Midwest (including Washington & Baltimore). By 1990, the share had dropped to one half. The UN expects this trend to continue, projecting only 40 percent of the urbanized population to be in the Northeast and the Midwest by 2030 (Figure 1).

Not unexpectedly, this new urban landscape has produced substantial shifts in the rankings of urban areas. The top three cities remain the same, New York, Los Angeles and Chicago; Los Angeles overtook Chicago between 1950 and 1960. This was a stunning achievement, because during the 1950s, Chicago also was experiencing strong growth, adding approximately 1.2 million residents. This is approximately four times the 300,000 added in between 2000 and 2010. Los Angeles passed Chicago by adding 2.5 million residents, the largest 10 year increase of any city since 1950. Los Angeles continued to add more than one million residents per decade through 2000, but has since fallen into the sluggish growth pattern more identified with the Northeast and Midwest, adding less than 400,000 residents between 2000 and 2010.

From today's perspective, it may be surprising that New York grew strongly after 1950, adding 1.8 million residents in the 1950s and 2.0 million in the 1960s. After that, however, the population began declining and did not recover until the 1990s. Like Chicago and Los Angeles, despite the clear improvement in many areas, population growth was small in the last decade, at 550,000.

There has been little stability in the rankings of the rest of the top 10, with only two 1950s entries remaining. Philadelphia, which was ranked 4th in 1950 is now fifth. Boston was ranked 6th, but has fallen to 10th. Detroit was 5th ranked in 1950, and was 12th in 2010. San Francisco has fallen from 7th to 13th. The largest losses in ranking were Pittsburgh which fell 8th to 26th, St. Louis which dropped from 9th to 20th and Cleveland, which fell from 10th to 24th. 

New entrants Miami, Dallas-Fort Worth, Houston, Washington and Atlanta have replaced these cities in the top 10.

The Largest Cities in 2030

The UN's population projections to 2030 indicate modest rankings changes from the present. The top 10 would remain the same, except that Boston would be replaced by Phoenix. As a result, only four of 1950s top ten remain in 2030 – New York, Los Angeles, Chicago and Philadelphia (Figure 2). The rise of Phoenix is particularly impressive. In 1950, Phoenix had a population little more than 200,000. By 2030, it is projected to have 4.8 million residents.

Houston is expected to rise from the 7th largest urban area in 2010 to 4th largest in 2030. Houston would thus pass Miami, Philadelphia and in-state rival Dallas-Fort Worth. Miami and Philadelphia would each fall two positions.

By 2030, there would be 53 urban areas with more than 1,000,000 population, up from 41 in 2010. By comparison, there were only 12 cities with more than 1,000,000 residents in 1950. Seven of the new 1,000,000 cities  are located in major metropolitan areas as of 2010. New Orleans would be restored to the over 1,000,000 list, after having been knocked out by the 2005 Hurricane Katrina and Rita events. Buffalo, however, which is the only other urban area to have fallen below 1,000,000 population (in the 1980s), will not be restored to that level, according to the UN. In addition, Bridgeport, Tucson, Albuquerque, El Paso and McAllen would reach the 1,000,000 level by 2030. The addition of El Paso and McAllen would tie Texas with California, with each having six urban areas with more than 1,000,000 population.

Greater Growth in Smaller Cities

The UN anticipates that US growth will be less concentrated in the largest urban areas between 2010 and 2030. Overall, the population of New York, Los Angeles and Chicago is expected to grow less than 9 percent, less than one half their 19 percent 2010 overall share of the urban population reported by the UN. The other cities over 5 million and those between 2.5 million and 5 million would grow slightly less than their overall share of the population, as is indicated in Figure 3

The smaller population categories would grow faster than their population share. The cities with 1,000,000 to 2.5 million population would grow nearly 15 percent faster than their proportion of the population. Those with from 500,000 to 1,000,000 would grow nearly 20 percent more than their proportion of the population. The cities will fewer than 500,000 residents would capture nearly 50 percent more of their growth than their current population proportion.

Fastest Growing Cities

Only four of today's 50 largest cities would be among the 20 fastest growing from 2010 to 2030. Charlotte and Raleigh would rank 6th and 7th respectively, both growing approximately 72 percent. Austin would rank 11th, growing 59 percent and Las Vegas, at 14th, would grow 51 percent.

The largest percentage growth would be in smaller urban areas, especially in areas near much larger urban areas. The Woodlands would grow 170 percent, nearly five times that the rate of adjacent Houston, which would itself be the fastest growing urban area of more than 2,000,000 population (35 percent). Murrieta-Temecula and Victorville would grow 100 percent and 75 percent respectively, dwarfing the 36 percent of nearby Riverside San Bernardino. Kissimmee would double adjacent Orlando's growth rate, at 78 percent. Provo is expected to grow 69 percent, nearly three times the growth rate of nearby Salt Lake City. Santa Clarita and Lancaster would grow 64 percent and 55 percent respectively, much faster than their much larger neighbor, Los Angeles, at 9 percent.

South Florida cities Cape Coral (80 percent), Bonita Springs-Naples (52 percent) and Port St. Lucie (51 percent) by would grow at three to five times giant Miami.

The same pattern holds even in the Northeast Corridor. Poughkeepsie, at 32 percent, would grow nearly four times the rate of nearby New York, while Worcester would more than double the growth of Boston.

Fayetteville, Arkansas, an urban area that includes Bentonville, with the Wal-Mart headquarters, is the only urban area that is far from larger urban areas and projected to be among the fastest growing (80 percent). Fayetteville is more than 200 miles from both Kansas City and Oklahoma City.         

Continuing Dispersal

Of course, projections are no more than educated guesses. The emerging reality could be similar or radically different than the projections, as is always the case. Nonetheless, from the present vantage point, UN projections show continuing dispersal, as greater growth occurs in smaller urban areas, and continues to move outside the Northeast and Midwest.

Wendell Cox is principal of Demographia, an international public policy and demographics firm. He is co-author of the "Demographia International Housing Affordability Survey" and author of "Demographia World Urban Areas" and "War on the Dream: How Anti-Sprawl Policy Threatens the Quality of Life." He was appointed to three terms on the Los Angeles County Transportation Commission, where he served with the leading city and county leadership as the only non-elected member. He was appointed to the Amtrak Reform Council to fill the unexpired term of Governor Christine Todd Whitman and has served as a visiting professor at the Conservatoire National des Arts et Metiers, a national university in Paris.

---

Note on additional resources: The United States Conference of Mayors has published metropolitan area projections to 2042. Demographia World Urban Areasprovides urban land area and density estimates for all indentified urban areas of 500,000 population or more, with population data provided by the United Nations, national census authorities and other sources.

Photo by Mike Lee

Why Do We Care About Transportation Mode Share?

0
0

The New York Times ran an op-ed piece that helpfully demonstrated the pitfalls of lifestyle arguments in favor of urbanism, namely that they are annoying to everyone but the people making the argument.

The boys, like their father, are lean, strong and healthy. Their parents chose to live in New York, where their legs and public transit enable them to go from place to place efficiently, at low cost and with little stress (usually). They own a car but use it almost exclusively for vacations.

“Green” commuting is a priority in my family. I use a bicycle for most shopping and errands in the neighborhood, and I just bought my grandsons new bicycles for their trips to and from soccer games, accompanied by their cycling father.

These arguments – whether they’re about physical health, or “diverse” or “vibrant” or “creative” communities, or whatever else – are, at bottom, about telling people that they are lacking, and that in order to improve themselves they should become more like the author. In the 1970s, when city dwellers felt superior mainly because of their supposed cultural capital and were telling middle-class suburbanites to loosen up a little, that might have been obnoxious but harmless. In our current situation – when the city dwellers making these arguments are the economic elite (the author of this particular piece, Jane Brody, lives in gentrified brownstone Brooklyn, I believe) – it’s a lot more sinister. Brody talks about commutes as if their length and form were something that most people could freely choose, rather than something imposed upon them by their wages and the price of housing and form of development of their metropolitan area. She makes this a story about personal morality, rather than the constraints we choose to put on people through public policy.

This is related, I think, to the study about mode share in U.S. cities that got passed around the urbanist blogosphere recently. In virtually every instance, the study was presented like a sports power ranking, with the winning cities being those with the least travel by car (“city of Chicago ranks sixth among large U.S. cities for percentage of people either biking, walking, or riding transit,” is a typical formulation of the lede).

But why, exactly, do we care about mode share? The pettiest possible answer is that we doconceive of cars v. transit/biking as a sort of culture war, just like many committed drivers have alleged, and what percentage of people choose to drive or do something else is how we measure whether or not we are winning. This, clearly, is not a particularly edifying possibility. A better answer might be that we really do want everyone else to be more like us – to reap the benefits of non-car commuting, from being healthier (although, contra Brody, I spent my subway commute today scarfing down a pound of spaghetti) to polluting less – and this tells us how many people are enjoying those perks.

That’s much more reasonable, but still problematic in that, like the Times piece, it strongly implies that the issue is individual choice, rather than the circumstances that constrain that choice. The people who write for places like Streetsblog know that circumstances matter, but for the casual reader, articles about mode share makes those issues a sort of specialists’ background.

That’s too bad, because mode share does convey some important information about constraints. If we assume that, allowing for some cultural margin of error, most people will choose to get to work via whatever method they find most efficient and comfortable, then we can determine roughly what percentage of people in any given city have decent access to transit – access that’s at least in the same ballpark of convenience as driving – just by looking at what percentage of people actually use it. Obviously there are complications to this: since one major inconvenience of driving is cost, cities with high poverty rates may have mode shares that exaggerate their transit’s effectiveness, for example. And since transportation choice is basically zero-sum on an individual basis – that is, all that matters is the relative efficiency of each mode – you could get a lot of people on transit by making driving truly hellish, without providing decent service. (Although in the American context, I think there are vanishingly few places where that would be an issue.)

Moreover, if we care about mode share as a proxy for service effectiveness, then beyond a certain point – say, a quarter, a third, whatever, of commuters – you’re kind of done. It doesn’t really matter. If New York City, with one of the most comprehensive transit systems in the world, can only get 50% of its commuters on buses and trains, then surely most of the distinction between it and, say, Asian cities with much higher transit mode shares isn’t the quality of their systems (although they may be of higher quality), but the increased misery of driving in ever-denser places. The issue stops being whether we can get from 40% to 45%, but whether subregions of the metropolitan area have strongly varying mode shares, suggesting that you can only get decent access to transit if you live in the right place. And, of course, that is in fact the case.

But if what really matters is service levels and access – if what we’re trying to accomplish is giving everyone a level of service where transit is a viable option, for reasons outlined here– then why not just measure that directly? Why not have widely-disseminated statistics about the percentage of people in every metropolitan region who can walk to a transit stop? Or make a bigger deal about the number of people who can reach some given percentage of metro area jobs via transit in a reasonable time frame? I almost never see those numbers in urbanist conversations, and to the extent that I do, they’re sort of ghettoized into the “social justice” urbanist subculture.

But these seem like relevant numbers for “mainstream” urbanists, too. In fact, they seem a lot better than mode share. Generalized public arguments in favor of transit projects are more likely to benefit from language that suggests they’ll provide options, rather than language that suggests the ultimate goal of the policy is to force people out of their cars. Because, in fact, that’s what public policy should be about: making transportation easier for more people, rather than moralizing about the perfectly legitimate choices that people make, given their circumstances.

This post originally appeared in City Notes on November 11, 2013. Daniel Hertz is a masters student at the Harris School of Public Policy at the University of Chicago.

Image from BigStockPhoto.com: A metro bus in Madison, Wisconsin.

In the Future We’ll All Be Renters: America’s Disappearing Middle Class

0
0

An Excerpt from Joel Kotkin’s Forthcoming book The New Class Conflict available for pre-order now from Telos Press and in bookstores September, 2014.

In ways not seen since the Gilded Age of the late nineteenth century, America is becoming a nation of increasingly sharply divided classes. Joel Kotkin’s The New Class Conflict breaks down these new divisions for the first time, focusing on the ascendency of two classes: the tech Oligarchy, based in Silicon Valley; and the Clerisy, which includes much of the nation’s policy, media, and academic elites.

The Proleterianization of the Middle Class

From early in its history, the United States rested on the notion of a large class of small proprietors and owners. “The small landholders,” Jefferson wrote to his fellow Virginian James Madison, “are the most precious part of a state.” To both Jefferson and Madison, both the widespread dispersion of property and limits on its concentration—“the possession of different degrees and kinds of property”—were necessary in a functioning republic.

Jefferson, admitting that the “equal division of property” was “impractical,” also believed  “the consequences of this enormous inequality producing so much misery to the bulk of mankind” that “legislators cannot invent too many devices for subdividing property.” The notion of a dispersed base of ownership became the central principle which the Republic was, at least ostensibly, built around. As one delegate to the 1821 New York constitutional convention put it, property was “infinitely divided” and even laborers “expect soon to be freeholders” was a bulwark for the democratic order.

This notion of American opportunity has ebbed and flowed, but generally gained ground well into the 1960s and 1970s.  The very fact that the United States was more demographically dynamic, notes Thomas Piketty, naturally reduced the role of inherited wealth compared to Europe, most notably in France,  where population growth was slower.  Mass prosperity hit a high point in America in the first decades after the Second World War, the period where the country achieved its highest share of world GDP at some forty percent.  By the mid-1950s the percentage of households earning middle incomes doubled to 60 percent compared with the boom years of the 1920s. By 1962 over 60 percent of Americans owned their own homes; the increase in homeownership, notes Stephanie Coontz, between 1946 and 1956 was greater than that achieved in the preceding century and a half.

But today, after decades of expanding property ownership, the middle orders—what might be seen as the inheritors of Jefferson’s yeoman class—now appear in a secular retreat.  Homeownership, which peaked in 2002 at nearly 70 percent, has dropped, according to the U.S. Census, to 65 percent in 2013, the lowest in almost two decade.  Although some of this may be seen as a correction for the abuses of the housing bubble, rising costs, stagnant incomes and a drop off of younger first time buyers suggest that ownership may continue to fall in years ahead.

The weakness of the property owning yeomanry comes at a time when other classes, notably the oligarchs and the Clerisy, have gained power and influence. Over twenty years ago Christopher Lasch argued that “the new class” was arising that “begins and ends with the knowledge industry.”  For this group, the rest of society, he suggested, exists only “as images and stereotypes.” Progressive theorists, such as Ruy Texerira, have suggested that, in the evolving class structure, the traditional middle and working class is of little importance compared to the rise of a mass “upper middle class” consisting largely of professionals, tech workers, academics, and high-end government bureaucrats.

The Economic Decline of the Yeomanry

All this suggests what could be seen as the proletarianization of the yeoman class. In the four decades since 1971 the percentage of those earning between two thirds and twice the national median income has shrunk, according to Pew, from over sixty to barely fifty percent of the population. While middle class incomes have fallen relative to the upper income groups, house prices and health insurance, utilities and college tuition costs have all soared.

This reflects some very dramatic changes in the nature of the employment market. For over a decade, job gains have been concentrated largely in the low-wage service sector, such as in retail or hospitality, which alone accounted for nearly sixty percent of job gains; in contrast middle income positions actually have been declining. Meanwhile, taxes on corporate profits, which are at an all time high, have fallen to near historic lows.

This trend has continued even in the recovery.  Between 2010 and 2012, the middle sixty percent of households, did worse not only than the wealthy, but even the poorest quintile between 2010 and 2012.  In the years of the recovery from the Great Recession the middle quintiles income dropped by 1.2 percent while those of the top five percent grew by over five percent. Overall the middle sixty percent have seen their share of the national pie fall from 53 percent in 1970 to barely 45 percent in 2012. Of roughly one in three people born into middle class households, those earning between the 30th and 70th percent of income now fall out of that status as adults.

This decline, not surprisingly, has engendered a dour mood among much of the yeomanry. For many, according to a 2013 Bloomberg poll, the American dream seems increasingly out of reach; this opinion was held by a margin of two to one among all Americans, and three to one among those making under $50,000, but also a majority earning over $100,000 annually. By margins of more than two to one, more Americans believed they enjoy fewer economic opportunities than their parents, and will experience far less job security and disposable income. This pessimism is particularly intense among white working class voters, and large sections of the middle class.

Many people who once had decent incomes, and may have owned or hoped to own a house or start a business have slipped to the lower rungs of the economy. In the past decade, the number of people working part-time and receiving such benefits as food stamps has expanded well beyond inner cities and impoverished rural hamlets.  Many of the long-term unemployed are older, and often somewhat well-educated workers, who have fallen from the middle class over the past decade. The curse of poverty has also expanded more into suburban locations; something widely cited by the urban-centric Clerisy, but further confirms the yeomanry’s stark decline.

The Assault on Small Business

Perhaps nothing reflects the descent of the yeomanry than the fading role of the ten million small businesses with under 20 employees, which currently employ upwards of forty million Americans. Long a key source of new jobs, small business start-ups have declined as a portion of all business growth from 50 percent in the early 1980s to 35% in 2010. Indeed, a 2014 Brookings report, revealed that small business “dynamism”,  measured by the growth of new firms compared with the closing of older ones, has declined significantly over the past decade, with more firms closing than starting for the first time in a quarter century.

Instead of stemming from the grassroots, the recovery after the latest crash was led, unlike in previous expansions, by larger firms while small company hiring remained relatively paltry. Self-employment rose, but increasingly this took the form of sole proprietorships as opposed to expanding smaller companies with employees. By 2013, smaller firms with under one hundred employees added far fewer jobs than in the prior decade. Unlike prior post-war recoveries, since 2007, grassroots companies did not lead the way out of recession and continued to lose ground compared with larger companies that either could afford the costs or avoid the taxes imposed by, the Clerical regime.

This decline in entrepreneurial activity marks a historic turnaround.  In 1977, SBA figures show, Americans started 563,325 businesses with employees. In 2009, they started barely 400,000 Business start-ups, long a key source of new jobs, have declined as a portion of all businesses from 50 percent in the early 1980s to 35% in 2010.

There are many explanations for this decline, including the impact of offshoring, globalization and technology.  But some reflects the impact of the ever more powerful Clerical regime, whose expansive regulatory power undermines small firms. Indeed, according to a 2010 report by the Small Business Administration, federal regulations cost firms with less than 20 employees over $10,000 each year per employee, while bigger firms paid roughly $7,500 per employee.  The biggest hit to small business comes in the form of environmental regulations, which cost 364% per employee more for small firms than large ones. Small companies spend $4,101 per employee, compared to $1,294 at medium-sized companies (20 to 499 employees) and $883 at the largest companies, to meet these requirements.

The nature of federal policy in regards to finance further worsened the situation for the small-scale entrepreneur.  The large “too big to fail” banks received huge bailouts, but have remained reluctant to loan to small business. The rapid decline of community banks, for example, down by half since 1990, particularly hurts small businesspeople that depended on loans from these institutions.

The Descent of the Yeomanry, with Cheers from the Clerisy

Despite America’s egalitarian roots, the prospect of mass downward mobility has been embraced widely by some business oligarchs and much of the Clerisy. The future being envisioned is one dominated by automated factories and computer-empowered service industries that will continue to pressure both jobs and wages in the future. In this scenario, productivity will rise, but wages may stagnate or decline. This leads some to propose that the American middle and working classes has become economically passé. Steve Case, founder of America Online, has even suggested that future labor needs can be filled not by current residents but by some thirty million immigrants.

Arguably the first group to feel the downward pressure has been blue collar workers, whose lot has declined over the past few decades. After World War Two, as the United Autoworkers’ Walter Reuther noted, “the union contract became the passport to a better life” that was creating “a whole new middle class.” But with the shifting of industry overseas and the decline of private sector unions, the path for blue collar workers to enter the middle class has become more difficult.

Although they often claim to defend the middle class, the political stance adapted by the Clerisy, as well as the tech oligarchs and the investors, tends to worsen this trajectory. Environmental concerns impose themselves most against basic industries such as fossil fuels, agriculture and much of manufacturing. These employ many in highly paid blue-collar fields, with average salaries of close to $100,000. In the last decade, top U.S. firms, notes the liberal Center for American Progress, have cut almost three million domestic jobs.  Automation also leads to the diminution of traditional white collar professions as well as the shift of high-end service jobs offshore.

Overall, it has become increasingly common to regard the middle class as threatened and even doomed. Indeed, as early as1988 Time magazine featured a cover story on the “declining middle class,” which at that time was considerably more healthy than today. After the great recession, the American blue-collar worker has been pitied, but certainly not helped by the clerisy, which believes that there is no hope for manufacturing or similar outmoded jobs in an information age. Blue collar workers were described in major media as “bitter,” psychologically scarred” and even an “endangered species.” Americans, noted one economist, suffered a “recession” but those with blue collars endured a “depression.”

This perspective extends across ideological lines.  Libertarian economist Tyler Cowen suggests that an “average” skilled worker can expect to subsist on little but rice and beans in the future U.S. economy. If they choose to live on the East or West Coast, they may never be able to buy a house, and will remain marginal renters for life. Left-leaning Slate in 2012 declared that manufacturing and construction jobs, sectors that powered the yeomanry’s upward mobility in the past, “aren’t coming back. Rather than a republic of yeoman, we could evolve instead, as one left-wing writer put it, living at the sufferance of our “robot overlords,” as well as those who program and manufacture them, likely using other robots to do so.

Contempt for the middle class is often barely concealed among those most comfortably ensconced in the emerging class order. Financial Times columnist Richard Tomkins declared that the middle class, “after a good run” of some two centuries, now faces “relative decline” and even extinction. This historical shift towards mass downward mobility elicited only derision, not concern: “Classes come and classes go” and that when the middle orders disappears about the only ones that will be sorry to see them go might be the “middle classes themselves. Boo hoo.”

The Rise of the Yeomanry

This reversal in class mobility and the slowing diffusion of property ownership in America, if not addressed, threatens to undermine the country’s traditional role as beacon of opportunity. Equally important, the diminution of the middle orders threatens one of the historic sources of economic vitality and innovation.

The roots of America’s middle class reflects the critical role such small holders have played throughout history.  Dynamic civilizations tend to produce more than their share of “new men.”  But nowhere was this middle class ascendency more dramatic than in Europe, first in Italy and later in northern Europe. 

Initially, this was a comparatively small, outside group, with much of the activity conducted by outsiders such as Jews and, later, Christian dissenters. They were the driving force of the expanding capitalist  market, the creators of cities and among the primary beneficiaries of economic progress. Peter Hall quotes a historian of 15th Century Florence:

Apprentices became masters, successful craftsmen

became entrepreneurs, new men made fortunes in

commerce and money-lending, merchants and bankers

enlarged their business. The middle class waxed more

and more prosperous in a seemingly inexhaustible boom.

These “new men,” which included some landless peasants, gradually overthrew the old  artisan-like traders, eventually supplanted the aristocracy, and in some instances, the royal families as well. In most cases, their ascendency, although at times exploitative, generally promoted the expansion of both freedom and individual choice. They also were among the first commoners to seek out land, often in the periphery, in part as a business decision, but also to mimic the lifestyles of the traditional aristocracy.

As occurs in every economic transition some benefited some at the expense of others. Some “new men” from peasant and artisan backgrounds rose, but many others became part of an impoverished proletariat. Many urban artisans lost their jobs to machines, but many others used their expertise to move into the middle class, often through technical innovations that, in the words of the French sociologist Marcel Mauss, constituted “a traditional action made effective, ”notably in agriculture, metallurgy and energy.

As a colony of Britain, the Americans reflected that island’s rapid ascendancy  of small holders in the 17th and 18th Century, which linked liberation from feudalism with a less hierarchical order and the dispersion of ownership. The rise of the yeoman class in Britain was particularly critical in foreshadowing the evolution of America. These small landowners played a critical role in the overthrow of the monarchy under Cromwell, and consistently pushed for greater power for those outside the gentry. 

Yet ultimately many paid a great price for liberal reform, allowing for enclosures of what had been communal pasture; in the process productivity rose.  Some benefited, becoming gentry themselves, while many smallholders lost their lands, and flowed into the towns where they joined the swelling proletariat. Others, notably large merchants, bought political influence and marriage into old families. By 1750, according to Marx, the Yeomanry had disappeared, a claim denied by some who believed this class persisted, albeit weakened, well into the 19th Century.

The American Model

Many of these displaced yeoman found a more opportune environment in America, where diffusion of ownership, as both Jefferson and Madison noted, remained central to the very concept of the nation.  Small holders served, in the words of economic historian Jonathan Hughes, as  “the seat of Republican government and democratic institutions.”

America’s focus on dispersed ownership was further enhanced by government actions throughout the country’s history.  In contrast to their counterparts in Britain, the yeomanry in the United States enjoyed access to a greater, and still largely economically underutilized land mass, as well as a persistently growing economy. “In America,” de Tocqueville noted, “land costs little, and anyone can become a landowner.”

The Homestead Act was signed by President Lincoln in 1862. By granting land to settlers across the Western states, Lincoln was extending the notion of what historian Henry Nash Smith described as a  “agrarian utopia” ever further into the continental frontier. Yet in reality the Homestead Act, which offered for a $.25 registration fee $1 per 160 acres proved more symbolic than effective, impacting perhaps at most two million people in a nation over 30 million. Railways, using their land grants, actually sold more land than the government gave away.

The westward expansion of the Republic created huge opportunities for expansion of land ownership.  Jefferson wanted the land sold to the public to be a source of one-time revenue and a permanent holding for the buyer.  In many ways, at least until the 1890s, a far higher proportion of Americans owned land—almost 48%—than countries such as Britain where ownership was far more concentrated. These lands, not surprisingly, also became the source of often wild speculative booms and busts, both on the agricultural frontier and the burgeoning cities.

Many factors ultimately undermined the first old agrarian Jeffersonian dream. Capitalist-led industrial growth shifted the proportion of the population living in cities. Only 5 percent in 1790, it rose to almost 20 percent in 1850, and nearly 40% by 1900. The new order, as in England, also weakened the position of the old artisanal professions, which often made up the ranks of the small scale owners; in many cases they were replaced by women, children and new migrants, from the countryside or from abroad. They became, as the British reformist paper The Morning Star wrote, “our white slaves, who are toiled onto the grave, for the most part silently pine and die.”

The movement into cities, and the industrial economy, turned many workers from owners to renters. In the new industrial centers, it became far harder to start a business or own property. Even white collar workers often lost out as the instrumental economic rationality of capitalism displaced a more locally focused economy based on tradition, religion and small-scale production.

In the United States, conditions were generally less gruesome than in Britain or the rest of Europe,  but this did not slow the tendency towards ever great concentration of ownership. The rise of great entrepreneurs like Morgan, Vanderbilt, and Carnegie drove parts of the economy into the hands of  a relative handful of people. This concentration of power and land ownership engendered a powerful protest in both rural and urban areas. Henry George’s influential Progress and Poverty, published in 1879, maintained that “the ownership of land” was the “fundamental fact” determining the social, political and “moral condition of a people.” Land, he asserted, should be owned by the public and government funded by rents.

George’s approach appealed to a population that was seeing land ownership slipping from their grasp. Even on the land, as farming itself modernized, there was a gradual shift , as  farms mechanized and markets became more global, toward tenancy; by 1900 one in three American farmers were landless tenants. The concentration of property ownership continually grew from the 1870s on well into the 1920s.

By the early 20th century, as the original rustic yeoman dream was weakening, there was increased pressure for change from the growing urban population. Much of the pressure came from  a middle and upper-middle class who felt threatened by the concentration of ownership and political power in the hands of the industrial and financial oligarchies.

The Homeownership Revolution

As the nation moved from its agricultural roots, the yeoman class interest in property would find a new main expression in the form of homeownership. This would represent an opportunity both to escape the crowded city or, for the migrant from rural areas, live in a less dense urban environment. This drive was supported by both conservatives and New Dealers, who promulgated legislation that expanded homeownership to record levels. “A nation of homeowners,” Franklin Roosevelt believed, “of people who own a real share in their land, is unconquerable.”

The great social uplift that occurred then, coming to full flower after the Second World War, saw a working class—not only in America but in Europe and parts of east Asia—now enjoying benefits before available only to the affluent classes.  In 1966, author and New Yorker reporter John Brooks observed in his The Great Leap: The Past Twenty-Five Years in America, that, “The middle class was enlarging itself and ever encroaching on the two extremes—the very rich and the very poor.” Indeed, in the middle decades of the 20th Century, the share of income held by the middle class expanded while that of the wealthiest actually fell.

New Deal legislation—the Housing Act of 1934, creation of the Federal Housing Administration (FHA) and the Federal National Mortgage Association, or Fannie Mae—set the stage for the great housing boom of the 1950s. This was further augmented by the GI bill, which also provided low-interest loans to returning veterans.  The success of the private financial and construction interests who benefited from this boom, suggests author Eric John Abrahamson, was largely fostered by what he describes as a “planned” economy that consciously sought to expand ownership both during the New Deal and particularly in ensuing decades. Almost half of suburban housing, notes historian Alan Wolfe, depended on some form of federal financing. This egalitarian impulse was in part driven by people returning from WW II and Korea, many of whom benefited from the GI Bill.

This resulted in an unprecedented dispersion of property ownership. This process was aided by a strong economy and the expansion of automobile ownership, which greatly expanded the yeomanry’s mobility. Increasing numbers of the middle class and even working class people become homeowners, sparking an enormous surge in home building. By 1953, the number of Americans owning their own homes climbed to twenty-five million, up from eighteen million in 1948. A country of renters was transformed into a nation of owners. Between 1940 and 1960 non-farm homeownership rose from 43 percent to over 58 percent. It was an accomplishment of historic proportions, notes historian Abrahamson, of “a transformed Jeffersonian vision.”

New Class Conflict Over the form and Nature of Growth

In recent decades, this vision of widening prosperity and property ownership has become increasingly threatened, as most evidenced by the housing bust of 2007-8. It also has come under increased attack from among the ranks of the clerisy. To be sure, many of those who bought homes in the last decade were not economically prepared, as some analysts suggest. But in the wake of the housing bust, the attack on homeownership expanded to include not only planners and pundits, but even parts of the investment community have seen in the yeomanry’s decline an opportunity to expand the base of renters for their own developments.

The ideal of homeownership, particularly in the suburbs, have long raised the ire of many  academics and intellectuals in particular . Some have sought to de-emphasize increased wealth and seek instead to embrace what they consider a more moral, even spiritual standard. This movement, not so far from old feudal concepts, had its earliest modern expression in E.F. Schumacher’s 1973 influential Small is Beautiful and the writings of London School of Economics’ E.J. Mishan.

Both writers rightly criticized the sometimes cruelly mechanistic nature of much technological change, but also revealed a dislike of the very kind of expansive growth that has lifted so many into the yeoman class after the Second World War, not only in America but in Europe and parts of East Asia. “The single minded pursuit for individual advancement, the search for material success,” Mishan wrote, “may be exacting a fearful toll on human happiness.”

In the search for an alternative, both writers looked not forward, but backwards.  Schumacher described “the good qualities of an earlier civilization”, that is, the old rural English society identified not so much with progressivism, or socialism, but the old Tory class order.

More recently, many advocates of slow, or no growth are finding inspiration in even less enlightened settings than old England. Some point to the small Himalayan kingdom of  Bhutan, the site of a 2014 pilgrimage by Oregon Gov. John Kitzhaber . This  “happiness”  poster child makes an odd exemplar for the 21st century. In contrast to the praise heaped on the tiny nation by Kitzhaber, one Asian development expert recently described the country  as ”still mired by extreme poverty, chronic unemployment and economic stupor that paints a glaring irony of the ‘happiness’  the government wants to portray.” In this “happiest place on earth” one in four lives in poverty, nearly forty percent of the population is illiterate and the infant mortality rate is five times higher than in the United States. It also has a nasty civil rights record of expelling its Nepalese minority of the country.  

Bhutan, of course, is a pastoral country, but some urbanists also increasingly apply their “happiness” ideal to cities, particularly poorer ones. Canadian academic Charles Montgomery, for example, celebrates  what he sees as  high levels of happiness in the city slums of developing countries. Montgomery points to impoverished Bogota, for example,  as “a happy city” that shows the way to urban development. If we can’t do a Bhutanese village, maybe we  can be compelled to evacuate suburbia for the pleasures of life in some thing that more reflects life in a crowded favela.  

Although this emphasis on happiness certainly has its virtues, and should be a consideration in how a society grows, lack of economic growth, and low levels of affluence, seems an unlikely way to make  people more content. Recent research, in fact, finds that, for the most part, wealthier countries are not only richer but happier than those assaulted by poverty. Indeed the happiest countries are not impoverished at all, according to the Earth Institute, but highly affluent countries led by Denmark, Norway, Switzerland, the Netherlands and Sweden; the lowest ranked countries were all very low-income countries in Africa.

The argument against growth  has  gained currency with the rise of environmentalism, long focused, often with justification, on the negative impacts of economic expansion. This has engendered an understandable search for an alternative standard to measure societal well-being. Climate change campaigners such as The Guardian’s George Monbiot  than “a battle to redefine humanity” , essentially ending the era of “expanders” with that of “restrainers.” Some economists, particularly in Europe, have embraced the  notion of what they call “de-growth,” that is a planned, ratcheting down of mass material prosperity. 

Winners and Losers in the ‘Happiness’ Game

In any conflict over the preferred shape of society, there are winners and losers. The shift from a focus on growth to one on what is fashioned as sustainability has proven a boon both for the public sector, particularly those working in regulatory agencies and politicians who now have new ways to elicit contributors, and those parts of the private sector that work most closely with government. Other beneficiaries include connected investors, including many who benefit from “green” energy subsidies that, particularly when measured by their production of energy, are considerably higher than those secured over the past century by oil and gas interests.

The downsizing of growth, naturally, also appeals to many who already enjoy wealth, such as Ted Turner, who then promote anti-growth policies through their foundations, and, as a bonus,  get to feel very good about themselves. Other winners include the media Clerisy, notably in Hollywood–who propagandize such views while living in unimaginable luxury—as well as academics. The successful and well-compensated producer and director James Cameron complains about “ too many people making money out of the system” and warns that growth must stop to save the planet.

So who loses in the new anti-growth regime? Certainly these include large parts of the working class—farmworkers, lumberjacks, factory operatives, oil field workers and their families—who work in extractive industries most subject to regulatory constraints and higher energy prices. Particularly hard hit may well be young families who, perhaps forsaking the “slacker” life, now find their aspirations of a house and decent job blocked by the generally older, and better off, advocates for “happiness.”

Wall Street and “Progressives” find Common Ground

The rise neo-Feudalism, and the decline of the yeomanry is best understood as the consolidation of ownership in ever fewer hands. This process has been greeted with enthusiasm by financial hegemons, who have stepped in with billions to buy foreclosed homes and then rent them; in some states this has accounted for upwards of twenty percent of all new house purchases. Having undermined the housing market with their “innovations,” notably backing subprime and zero down loans, they now look to profit from the middle orders’ decline by getting them to pay the investment classes’ mortgages through rents.

In the wake of the housing bust, and the longer than expected weak economy following the Great Recession, many financial analysts have insisted that we were headed towards a “rentership society” as homeownership rates plunged from historic highs in the three years following the crash. Part of this shift has been exacerbated by the movement of large investment groups like Blackstone to buy up single family houses for rent, representing a kind of neo-feudalist landscape, where landlords replace owner occupiers, perhaps for the long-run.

The impact of the investor move into housing has had a negative effect on middle and working class potential buyers who find themselves frequently outbid by large equity firms.” There is the possibility that Wall Street and the banks and the affluent 1 percent stand to gain the most from this,” said Jack McCabe, a real estate consultant based in Deerfield Beach, Fla. “Meanwhile, lower-income Americans will lose their opportunity for the American Dream of building wealth through owning a home.”

But, however convenient these developments may prove to investors on Wall Street, for society and the future of the democracy, the concentration of ownership in fewer hands is highly problematical. Rather than the yeoman with his own place, and the social commitment that comes with it, we could be creating a vast, non-property owning lower class permanently forced to tip its hat—and empty its wallet—for the benefit of his economic betters.

One would expect that this diminution of the middle class would offend those on the left, which historically supported both the expansion of ownership and the creation of a better life for the middle class. Yet some progressives, going back to the period before the Second World War, have disliked the very idea of dispersed ownership; many intellectuals, notes Christopher Lasch, found  a society of “small proprietors” and owners “narrow, provincial and reactionary.”

Increasingly, the media and many urbanists, who see a new generation of permanent renters as part of their dream of a denser America, also embrace this vision as being more environmentally benign than traditional suburban sprawl.

The very idea of homeownership is widely ridiculed in the media as a bad investment and many journalists, both left and right, deride the investment in homes as misplaced, and suggest people invest their resources on Wall Street, which, of course, would be of great benefit to the plutocracy. One New York Times writer even suggested that people should buy housing like food, largely ignoring the societal benefits associated with homeownership on children and the stability communities.  Traditional American notion of independence, permanency and identity with neighborhood are given short shrift in this approach.

This odd alliance between the Clerisy and Wall Street works directly against the interest of the middle and aspiring working class. After all, the house is the primary asset of the middle orders, who have far less in terms of stocks and other financial assets than the highly affluent. Having deemed high-density housing and renting superior, the confluence of Clerical ideals and Wall Street money has the effect on creating an ever greater, and perhaps long-lasting, gap between the investor class and the yeomanry.

This piece originally appeared at The Daily Beast.

Joel Kotkin is executive editor of NewGeography.com and Distinguished Presidential Fellow in Urban Futures at Chapman University, and a member of the editorial board of the Orange County Register. His newest book, The New Class Conflict is now available for pre-order at Amazon and Telos Press. He is author of The City: A Global History and The Next Hundred Million: America in 2050. His most recent study, The Rise of Postfamilialism, has been widely discussed and distributed internationally. He lives in Los Angeles, CA.

Viewing all 3771 articles
Browse latest View live


Latest Images