Quantcast
Channel: Newgeography.com - Economic, demographic, and political commentary about places
Viewing all 3795 articles
Browse latest View live

Populate or Perish?

$
0
0

Many global population projections point to the current world population of roughly seven billion people peaking at around nine to ten billion in 2050, after which numbers will slowly decline. In the midst of this growth, Australia’s current population of 23 million is predicted to rise to around 30 or 35 million in the same period. This low growth outlook has been called ‘big Australia.’ We are kidding ourselves, aren’t we?

‘Populate or perish’ was a rallying cry of post-World War II Labor Immigration Minister Arthur Calwell as he sought to overcome domestic resistance to immigration. For Calwell, immigration was the key to quickly boosting Australia’s population numbers in the interests of economic and military security. An avowed supporter of the ‘white Australia policy’ he sought immigrants from European backgrounds. Asia was, back then, regarded as the enemy.


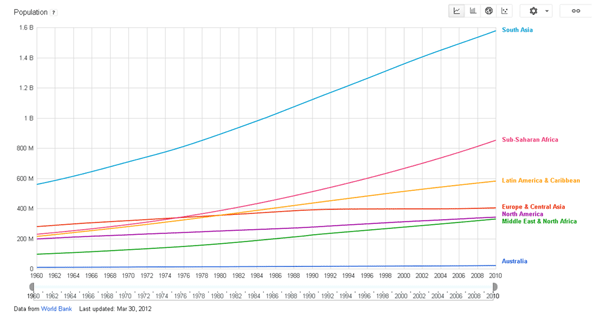
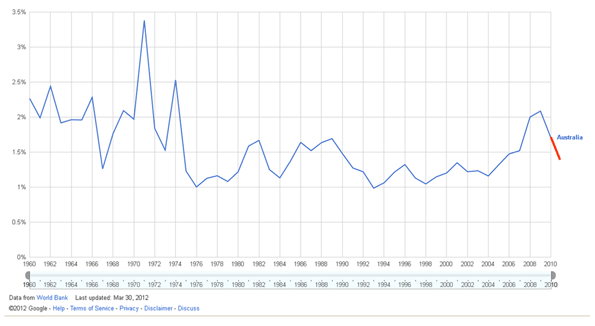
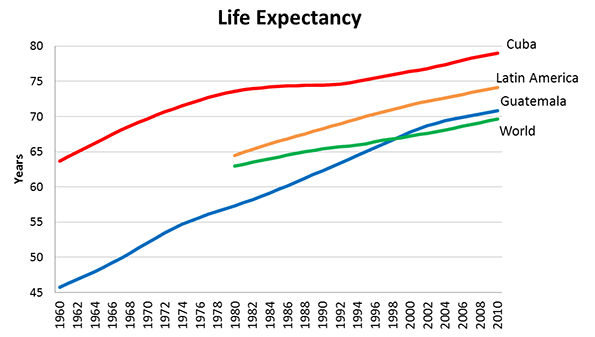
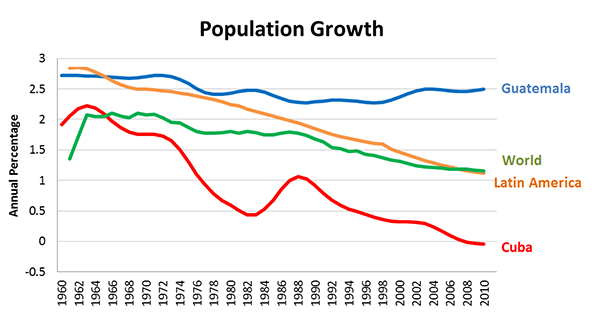
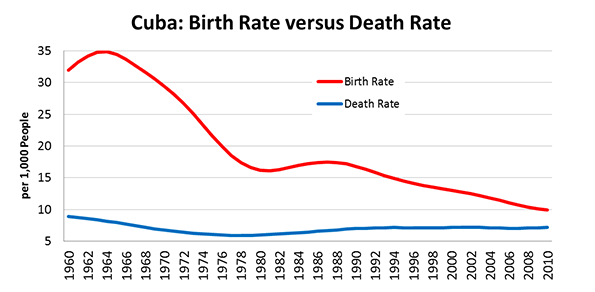
Above: world populations since 1960. Below: Australia’s rate of population growth since 1960. Source: World Bank.

How things change, yet stay the same. In 2012, it’s arguably just as much in Australia’s interests to boost its population numbers, in the interests of economic security and (according to some) military security also. And again, immigration – not an accelerated breeding program of naturalised Australians – is the only way this can realistically occur. As domestic industries increasingly surrender to global competition and as energy, agriculture and services industries increasingly depend on foreign markets for their long term survival, the issue of Australia’s relatively small population – despite its huge continental mass – raises little by way of public debate. A larger domestic population might provide markets for domestic industries, for local employment and for community wide infrastructure.

In contrast the planning fraternity’s dreams of Parisian, London, or New York standards of public transport, for example, will never succeed. Our cities are simply too small to make this work.

But talk of a ‘big Australia’ has become ‘persona non grata’ in public policy circles. We have a Federal Population Minister, but he hasn’t issued a single statement on population policy this year.  Our Prime Minister has other things on her mind, but even if her government was on more solid ground her antipathy to a ‘big Australia’ is well known and a matter of public record. And such is the apparent public hostility to the notion of a bigger population, intermixed as it is with a blend of doomsday environmentalism and references to failed Malthusian or Paul Ehlrich ‘Population Bomb’ scenarios and  myths (suggesting that Australia is running out of room and resources), that few political or public policy leaders want to take up the debate in favour of growth.

With that in mind, I thought some very simple reality checks might prove helpful to stimulate your thinking about Australia’s population capacity relative to the rest of the world. Wendell Cox, author of the global housing affordability study ‘Demographia’ recently published his Demographia World Urban Areasreport with this summary on New Geography. I want to take just two examples and interpose them into the Australian context.

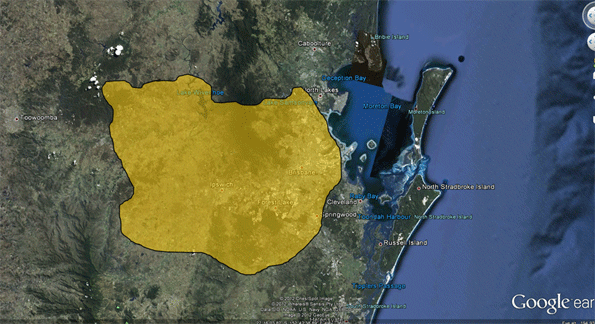
First, let’s look at Los Angeles, California.  Often cited as a region with similarities to the Australian urban context (both in a positive and negative sense), this city popularly known for its ‘sprawl’ actually has a very high level of population density. The total population of the Greater Los Angeles area is around 15 million people. Put into context, that’s roughly two thirds of the entire population of Australia living in the Greater Los Angeles ‘sprawl.’


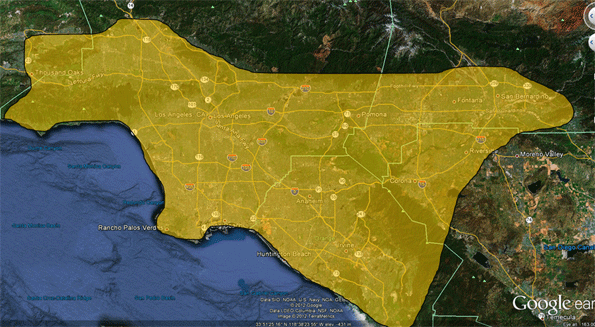
Above: The greater Los Angeles area and below, the same area superimposed in south east Queensland.

Put into a visual context, the contrast is even more apparent. At LA levels of population density, roughly the area we know of as south east Queensland could accommodate some 15 million people comfortably. Yet the conventional “wisdom” is that with just 3 million people it’s bursting at the seams and can’t possibly take any more

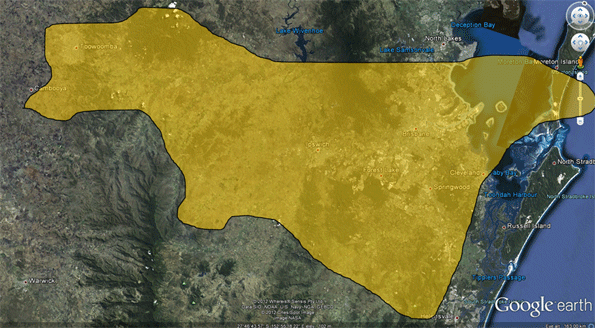
A more extreme example, just to stretch the imagination further, is worth thinking about. Jakarta, Indonesia (our nearest large foreign neighbour) has a population of 26 million people. That’s more than the entire population of Australia, living in one (very crowded) city – at the rate of 9,400 people per square kilometre.

Now, I’m not wishing that sort of urban density (and in large part, misery) on anyone in Australia, but the hypothetical comparison still applies, for the sake of discussion only. The footprint of greater urban Jakarta, home to 26 million people, easily fits within the boundary of south east Queensland.  In fact, it doesn’t even require the Gold or Sunshine Coasts to do it. Imagine this: the entire population of Australia, crammed as it would be into this super-compact urban footprint, and not a single soul living anywhere else on the entire continent?


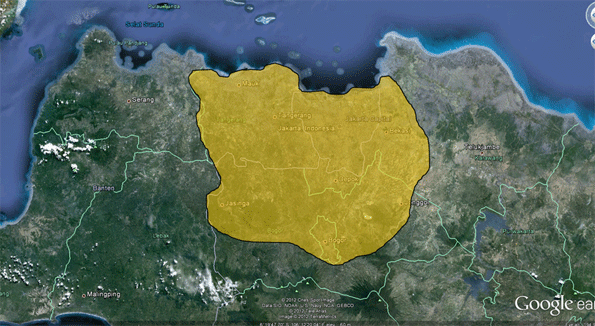
Above: Jakarta’s footprint and below, the same footprint – home to 26 million people – superimposed on south east Queensland.

The argument that Australia is somehow incapable of supporting substantially larger population relies on a myth that we short of room. Nor can it rely on suggestions that we would exhaust our energy stocks (we are a net exporter and would remain so at much larger population numbers), nor our food production capacity (again, we are a net exporter and would remain so even with much higher levels of population). In fact, in terms of food production, a lack of domestic market scale poses a significant problem for producers. The efficiency gains of primary production (livestock to cropping) have outpaced the growth in population.

There is an argument regularly raised that Australia has insufficient water supply to support much larger population numbers but this argument doesn’t hold water (sorry, couldn’t help that) either. What we do lack is water storage by way of dams, but the environmental lobby has vigorously opposed almost every proposed dam in the last 30 years whether for domestic supply, agriculture or hydro energy. The lack of water storage has been a policy decision made by successive governments for varying political reasons.   

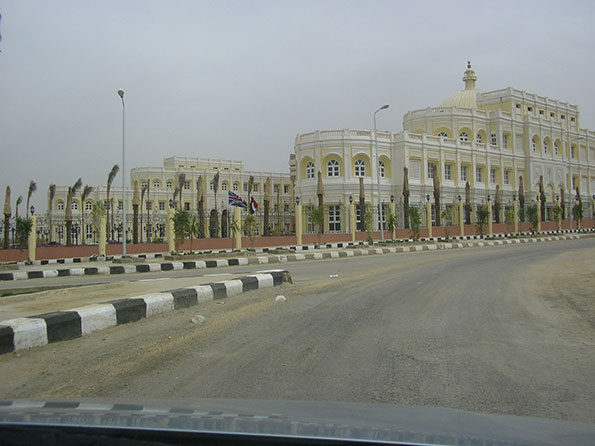
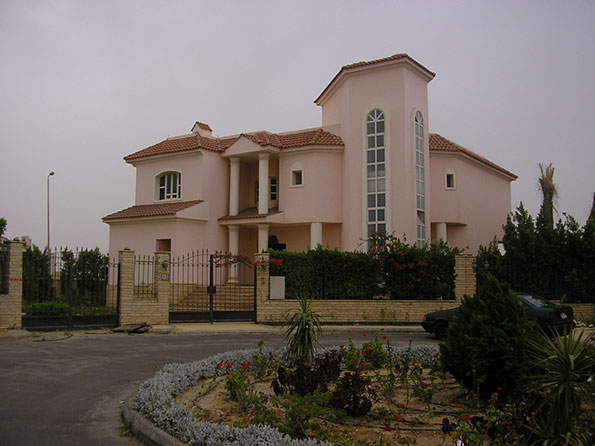
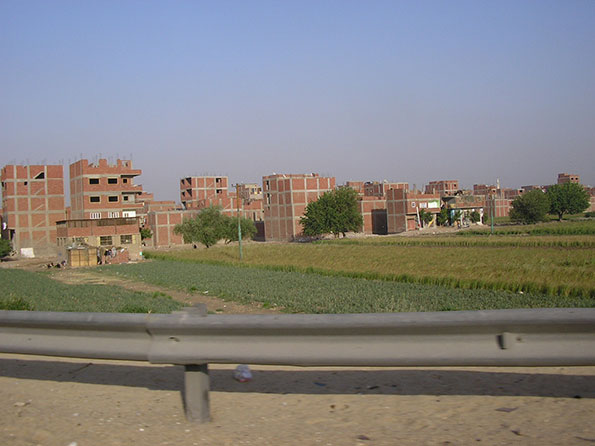
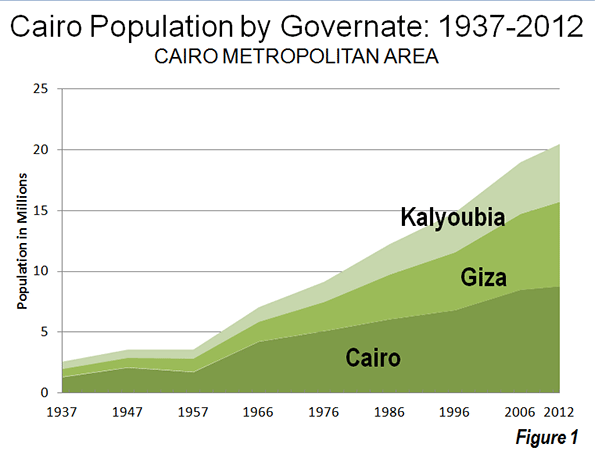
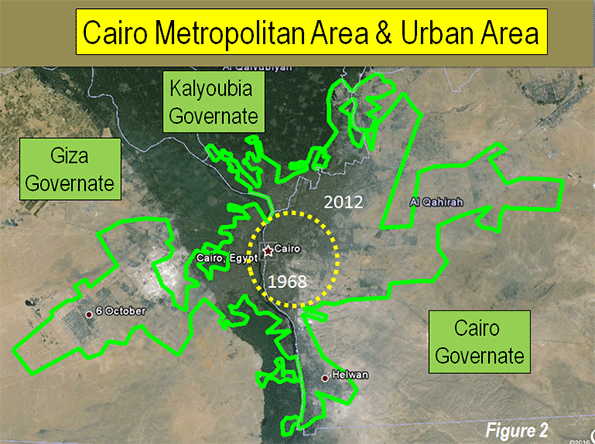
Think also for a moment how cities like Mexico City (population nearly 20 million people) or Cairo (population 18 million) or even countries like Morocco (population 32 million in 500,000 square kilometres on the edge of the Sahara compared with Australia’s 7.6 million square kilometres) manage for water? For Australia to claim it cannot support more people due to water limitations is a bit of joke.

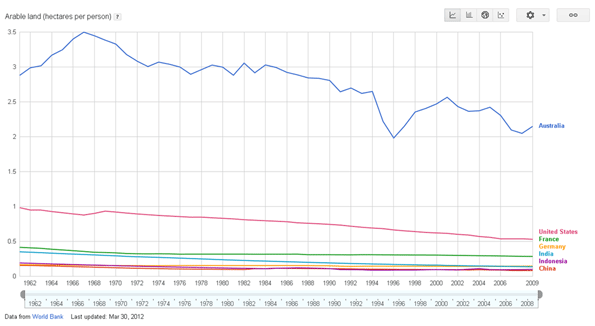
Above: arable land area in hectares per person. Australia is well ahead of the field.

Infrastructure deficits are the other vexed issue raised by by those concerned with population growth. They have pointed out that infrastructure investment has not kept pace with population, and they’re right. The problem though is largely that strategic infrastructure investment in this country is something really only talked about. Instead, what typically happens is that billions are doled out on pet projects in marginal seats or designed to win over particular interest groups that some focus group or other suggests could hold the key to winning the next election. Politically motivated rail projects (especially in NSW), home insulation schemes, TV set box boxes, green energy schemes... the list of our nation’s capacity to waste vast sums quickly is pretty impressive. Our deficient national road network, our inadequate domestic water storage (in many areas), our looming potential energy problems (not just in price thanks to a carbon tax but also in terms of power generation shortages according to some experts) – the bigger and more strategic infrastructure priorities which would support growth seem to get the least attention. Witness the latest Federal Government budget. (Read what Infrastructure Partnerships Australia, among others critical of the budget, had to say here).

So the capacity to fund and deliver strategic infrastructure isn’t the issue. Inept public policy is.

Instead, do we have some other more deep seated aversion to a bigger population? And is this race based? Despite being a successful nation of immigrants (  are we fearful for our culture if we had more immigration? Environmental impacts are often publicly cited as the reason to oppose more people, but if the examples of Los Angeles or Jakarta are remembered, we could in theory house a great deal more people without encroaching on vast areas of natural terrain.

Another big reason to reconsider objections to a ‘big Australia’ is the ticking clock on Australia’s ageing population. Even the Federal Government’s own ‘Tax Reform Roadmap’ released with the May budget warned that:  “The proportion of working age people is projected to fall markedly over the coming decades. Today there are about 4.8 people of traditional working age for every person aged 65 and over. This is expected to fall to around 4 people within the next 10 years and to around 2.7 people by 2050.”

Australia’s current rate of population growth is hovering around 1.4%. We are just shy of 23 million people. We say we’re concerned about getting to 35 million by 2050, by which time the world population will have increased by 2 billion people. We know that our ageing population will struggle to be supported by a diminished workforce  and that we lack sufficient critical mass to sustain a variety of industries in the face of global competition. Yet we consistently refuse to confront the question of a larger population and the consequences of failing to have one.

Ultimately even if we agree collectively to prefer to remain a small nation of less than 30 million, it’s a discussion we need to be having. Pretending the issue isn’t there won’t do anyone any good.

Ross Elliott has more than 20 years experience in property and public policy. His past roles have included stints in urban economics, national and state roles with the Property Council, and in destination marketing. He has written extensively on a range of public policy issues centering around urban issues, and continues to maintain his recreational interest in public policy through ongoing contributions such as this or via his monthly blog The Pulse.

Australia graphic by Bigstockphoto.com.


Seattle Is Leading An American Manufacturing Revival - Top Manufacturing Growth Regions

$
0
0

In this still tepid recovery, the biggest feel-good story has been the resurgence of American manufacturing. As industrial production has fallen in Europe and growth has slowed in China, U.S. factories have continued an expansion that has stretched on for over 33 months. In April, manufacturing growth was the strongest in 10 months.

There are a number of reasons for this revival. Rising wages in China – up from roughly one-third U.S. levels to half that in a decade — and problems associated with protection of trademarks and other issues have led many U.S. executives to look back home. Some 22% of U.S. product manufacturers surveyed by MFGWatch reported moving some production back to America in the fourth quarter of 2011, and one in three said they were studying the proposition.

Certainly how long this expansion can last is an open question, particularly given weakness in Europe and the slowdown in formerly fast-growing developing countries. But one thing is clear: the industrial resurgence is reshaping the economic and employment map in often unexpected ways.

Now rather than being pulled down by manufacturing, our Best Cities For Jobs survey, conducted by Pepperdine University’s Michael Shires, found that many industrial regions are benefiting from their prowess.

From 2010 through March, manufacturers added 470,000 jobs and enjoyed a rate of job growth 10% faster than the rest of the private economy. In the past many areas suffered from having too many industrial workers. Now it looks like we will have too few skilled ones, even in hard-hit sectors like the auto industry. In 2011 there were 50,000 unfilled U.S. job openings in industrial engineering, welding, and computer-controlled machine tool operating, according to the forecasting firm EMSI. If the revival continues, this shortage could worsen.

To determine the cities that are leading the manufacturing revival, we assessed manufacturing employment growth in the 65 largest metropolitan statistical areas. Rankings are based on recent growth trends, as well as job growth over the past five and 10 years, and the MSAs’ momentum (see the bottom of this piece for the full rankings list).

Where Technology Meets Manufacturing

In an era of excitement over the Internet, it is often forgotten that a majority of the country’s scientists and engineers work for manufacturers, and that industrial companies account for 68% of business R&D spending, which in turn accounts for about 70% of total R&D spending.

Nowhere is this linkage between technology and industry more evident than in the Seattle-Bellevue-Everett area, which ranks first on our list of the metropolitan areas leading the manufacturing revival. Over the past year the region was No. 2 in the nation in manufacturing growth, with employment expanding 7.9%. The aerospace sector, led by Boeing, accounted for roughly half this expansion.

The growth in aerospace and high-tech employment creates precisely the kinds of high-wage jobs, including for blue-collar workers, that are lacking in many parts of the country. In 2010 the average factory wage in the area was $64,925, up 9% from 2007. Most critically, manufacturing activity drives growth in other sectors of the economy. About one in six of all private-sector jobs depend on the manufacturing sector, and every dollar of sales of manufactured products generates $1.40 in output from other sectors, the highest of any industry.

As manufacturing employment overall has dropped, the percentage of higher-wage, skilled industrial jobs has been climbing over the last decades, particularly in high-technology related fields Overall, according to EMSI data, the average American factory worker earned $73,000 in 2011, $20,000 more than the average job.

Seattle is not alone in creating high-tech-oriented industrial jobs. Over the past two years Salt Lake City, Utah, which ranks third on our list, has seen significant growth in both electronics and aerospace employment, including a new Northrop Grumman facility. Firms connected to the medical device industry such as Biomerics are also expanding in the area.

Manufacturing is also rebounding in Austin-Round Rock-San Marcos, Texas, which ranks eighth on our list and No. 1 on our overall list of Best Big Cities For Jobs. Last year industrial employment in the Texas state capital area jumped 5%. Semiconductor firms are a big force, employing over 10,000 workers. Although more known for its high-tech electronics, Austin has also enjoyed an expansion in automobile-related employment as well as medical devices.

Energy Capitals

The largest grouping of manufacturing stars have emerged from the Texas-Oklahoma energy belt. With the shale drilling boom unlocking ample supplies of natural gas and lowering prices, petrochemical companies have undertaken major expansions. The rise in drilling and exploration has also sparked greater demand for industrial products such as pipes, drill rigs and other machinery. No surprise that the biggest backers of shale gas exploration are prominent CEOs of industrial firms. A recent study by PwC suggests that shale gas could lead to the development of 1 million industrial jobs.

The shale drilling revolution is making an impact across the country, in places like North Dakota and Youngstown, Ohio, but the epicenter of this boom remains firmly in the oil patch. The Thunder you hear in Oklahoma City is not just on the basketball court — energy growth has propelled a 1,500 person jump in manufacturing employment, a 6.1% increase, with another 1,000 new jobs expected this year. Oklahoma City ranks second on our list.

Other energy capitals are also thriving on the industrial front, including Houston (fourth place), San Antonio (seventh) and Ft. Worth-Arlington (ninth). Although energy is the main driver, manufacturing has been on the rise in a broad array of areas, including aerospace, biomedical and food processing. The surging export economy — Texas is easily the nation’s number one exporter — has further bolstered this growth.

Rustbelt Rebounders

The high-tech and energy economies may be fast-breaking in terms of industrial growth, but manufacturing’s comeback has put some new bounce in the step of many long forlorn parts of the nation’s “rustbelt.” Warren-Troy-Farmington Hills, Mich., epitomizes this trend. Unlike Detroit, which has suffered mass disinvestment, this more suburban area a half hour drive away has become the epicenter of a new, more tech-oriented auto industry.

The Warren-Troy area’s rich concentration of skilled tradespeople and industrial engineers has been described as America’s “automation alley.” It continues to attract high-industrial firms from abroad such as Brose, a German car parts manufacturer, which has recently announced a $60 million investment in the area. Even housing is on the rebound, with rents rising at the fourth highest clip in the country, just behind such standouts as San Francisco and Miami.

Nor is the Midwest manufacturing rebound limited to Michigan. Over the past year sixth-ranked Cincinnati enjoyed 5.4% growth in industrial employment. Manufacturing growth was also strong in Milwaukee-Waukesha-West Allis, Wisc., a center for the production of machine tools and other precision equipment that ranks 10th on our list.

Who’s Falling Behind

Of course not all regions have benefited from the industrial resurgence. For example, the nation’s largest industrial area, Los Angeles, ranks a miserable 49th. The area lost some 20% of its industrial jobs since 2006, and the losses continued over the past year. This goes a long way to explain the area’s continued underperformance before, during and, now, in the early days of recovery from the financial crisis.

Some other large regions did even worse, including such one-time industrial powerhouses as Philadelphia (55th) and New York (59th). Some may argue that these, and other areas, which have been losing manufacturing jobs for decades, no longer need to engage in the messy business of making stuff. But that long fashionable way thinking may be outdated itself, as seen by the improving fortunes of our industrial top 10.

Top Large Regions for Manufacturing Growth


Rank Area 2012 Weighted INDEX 2011 Manuf. Employment (000s)
1 Seattle-Bellevue-Everett, WA Metropolitan Division 81.2 164.3
2 Oklahoma City, OK 74.8 33.6
3 Salt Lake City, UT 74.7 55.1
4 Houston-Sugar Land-Baytown, TX 74.6 229.8
5 Warren-Troy-Farmington Hills, MI Metropolitan Division 74.4 135.3
6 Cincinnati-Middletown, OH-KY-IN 71.7 109.3
7 San Antonio-New Braunfels, TX 70.3 46.3
8 Austin-Round Rock-San Marcos, TX 69.3 50.9
9 Fort Worth-Arlington, TX Metropolitan Division 68.3 89.1
10 Milwaukee-Waukesha-West Allis, WI 67.9 118.5
11 San Jose-Sunnyvale-Santa Clara, CA 67.3 157.9
12 Buffalo-Niagara Falls, NY 65.8 52.3
13 Kansas City, MO 65.2 40.5
14 Omaha-Council Bluffs, NE-IA 64.7 31.8
15 Minneapolis-St. Paul-Bloomington, MN-WI 63.5 178.7
16 Fort Lauderdale-Pompano Beach-Deerfield Beach, FL Metro. Division 63.1 27.1
17 Bergen-Hudson-Passaic, NJ 62.8 63.3
18 Cleveland-Elyria-Mentor, OH 61.7 121.2
19 Portland-Vancouver-Hillsboro, OR-WA 61.1 110.0
20 Santa Ana-Anaheim-Irvine, CA Metropolitan Division 60.0 154.9
21 Columbus, OH 58.0 65.2
22 Charlotte-Gastonia-Rock Hill, NC-SC 57.4 67.9
23 Boston-Cambridge-Quincy, MA NECTA Division 56.9 94.6
24 Detroit-Livonia-Dearborn, MI Metropolitan Division 55.8 72.9
25 Atlanta-Sandy Springs-Marietta, GA 55.2 147.9
26 Chicago-Joliet-Naperville, IL Metropolitan Division 54.4 322.4
27 Hartford-West Hartford-East Hartford, CT NECTA 54.1 57.0
28 Pittsburgh, PA 53.3 87.8
29 San Diego-Carlsbad-San Marcos, CA 52.8 92.0
30 Dallas-Plano-Irving, TX Metropolitan Division 52.8 167.4
31 St. Louis, MO-IL 52.8 111.4
32 Rochester, NY 51.7 61.1
33 Virginia Beach-Norfolk-Newport News, VA-NC 51.3 52.0
34 Denver-Aurora-Broomfield, CO 51.0 61.2
35 Nassau-Suffolk, NY Metropolitan Division 50.4 72.8
36 Providence-Fall River-Warwick, RI-MA NECTA 48.8 51.8
37 San Francisco-San Mateo-Redwood City, CA Metropolitan Division 47.4 36.8
38 New Orleans-Metairie-Kenner, LA 45.8 31.3
39 Northern Virginia, VA 43.7 23.0
40 Orlando-Kissimmee-Sanford, FL 43.4 37.8
41 Tampa-St. Petersburg-Clearwater, FL 43.3 60.0
42 Memphis, TN-MS-AR 42.9 44.3
43 Phoenix-Mesa-Glendale, AZ 42.9 112.3
44 Oakland-Fremont-Hayward, CA Metropolitan Division 42.3 78.2
45 Raleigh-Cary, NC 41.5 27.3
46 Birmingham-Hoover, AL 39.7 35.2
47 Louisville-Jefferson County, KY-IN 38.8 63.5
48 Nashville-Davidson--Murfreesboro--Franklin, TN 38.3 62.8
49 Los Angeles-Long Beach-Glendale, CA Metropolitan Division 38.2 359.7
50 Indianapolis-Carmel, IN 37.9 80.8
51 Las Vegas-Paradise, NV 37.1 19.7
52 Newark-Union, NJ-PA Metropolitan Division 35.2 68.8
53 Jacksonville, FL 34.5 26.7
54 Bethesda-Rockville-Frederick, MD Metropolitan Division 34.1 16.1
55 Philadelphia City, PA 33.3 23.1
56 West Palm Beach-Boca Raton-Boynton Beach, FL Metropolitan Division 32.4 15.0
57 Sacramento--Arden-Arcade--Roseville, CA 31.9 32.5
58 New York City, NY 30.9 73.3
59 Miami-Miami Beach-Kendall, FL Metropolitan Division 28.9 35.4
60 Camden, NJ Metropolitan Division 27.5 36.2
61 Washington-Arlington-Alexandria, DC-VA-MD-WV Metro. Division 27.1 33.6
62 Riverside-San Bernardino-Ontario, CA 25.5 86.6
63 Putnam-Rockland-Westchester, NY 24.8 24.6
64 Edison-New Brunswick, NJ Metropolitan Division 24.3 58.2
65 Richmond, VA 18.7 30.9

The index is calculated using the same methodology as our Best Cities for Job Growth, but using only manufacturing employment in each region.

Joel Kotkin is executive editor of NewGeography.com and is a distinguished presidential fellow in urban futures at Chapman University, and contributing editor to the City Journal in New York. He is author of The City: A Global History. His newest book is The Next Hundred Million: America in 2050, released in February, 2010.

Seattle waterfront photo by BigStockPhoto.com.

The Evolving Urban Form: Shenzhen

$
0
0

No urban area in history has become so large so quickly than Shenzhen (Note 1). A little more than a fishing village in 1979, by the 2010 census Shenzhen registered 10.4 million inhabitants. It is easily the youngest urban area to have become one of the world's 26 megacities (Figure 1). Most other megacities were the largest urban areas in their nations for centuries (such as London and Paris) and a few for more than a millennium (such as Istanbul and Beijing). Shenzhen’s primitiveness can be seen in this 1980 internet photo, and shows the beginnings of construction. A 2006 photograph of one of Shenzhen's principal streets (Binhe Avenue) is above.

Pearl River Delta Location: Shenzhen is located in Guangdong Province adjacent to Hong Kong's northern border. Shenzhen is China's fourth largest urban area, following Shanghai, Beijing, and Guangzou-Foshan.

Along with Dongguan, Guanzhou, Foshan and smaller neighbors, Shenzhen forms the Pearl River Delta,   the world's largest manufacturing center. The Pearl River Delta, along with Hong Kong and Macau, constitutes the world's largest populated extent of urbanization, with nearly 50 million people. They live in a land area of just over 3,000 square kilometers (7,800 square kilometers. By comparison the world's largest urban area, Tokyo-Yokohama, has a population of 37 million and covers 3,300 square miles (8,500 square kilometers). I recall from a Hong Kong to Guangzhou trip on the Canton-Kowloon Railway in 1999 that there was plenty of rural territory on the 100 mile (170 kilometers) route. Today,   development takes place along virtually the entire route (Note 2).

The Special Economic Zone: Shenzhen was established as China's first special economic zone by Deng Xiaoping in the period of liberalization after the death of Mao Zedong. The special economic zones allowed for alternative, generally market oriented reforms, with the end of improving economic growth. The result was economic progress far greater than anyone expected. The special economic zone program was eventually extended to several other urban areas in the nation.

Some governmental officials preferred the previous state dominated approach, despite its greater poverty and sought to roll back the reforms. This threat reached its peak in the early 1990s, after Deng Xiaoping had retired from his government positions. In response, Deng undertook his renown "southern tour" to Shenzhen, Guangzhou and other parts of Guangdong province to promote the new economic approach and the progress that had been made. During the southern tour, Deng is reputed to have said that "to be rich is glorious." Three decades before he had said “I don't care if it's a white cat or a black cat. It's a good cat as long as it catches mice." He committed to results rather than to ideology, in a sense Shenzen and its environs are the engines of non-state owned prosperity. Eventually, the publicity from Deng's southern tour overwhelmed the opposition and China accelerated its move toward a more open economy.

Shenzhen's Core: Unlike the fast growing, but much smaller new urban areas of the United States (for example Phoenix, which is largely a low rise, dispersed expanse of suburbanization), Shenzhen has developed a dense central business district. Even though Shenzhen started the decade of the 1990s with little more than 1,000,000 residents, by 1996 it had the fourth tallest building in the world, the Shun Hing Tower. Only the Sears Tower in Chicago and the two World Trade Center Towers in New York were taller.

In 2011, the Shun Hing Tower lost its local tallest building title to the Kingkey Financial Tower, at 1,449 feet (447 meters) is the 10th tallest building in the world. Now, the world's second tallest building is under construction in Shenzhen, the Ping An International Financial Center, which is reported to reach 2,125 feet or 655 meters, with 116 floors. Only the Burj Khalifa (2,717 feet, 828 meters, 163 floors) in Dubai would be higher. Like Shanghai and Chongqing (and unlike most Chinese urban areas), Shenzhen has a highly concentrated central business district. As a result deserio.com rates Shenzhen's skyline as 9th in the world (Note 3).

Outer Areas Growing Faster: The three central districts (the qu of Futian, Luohu and Nanshan) grew from 2.4 million to 3.3 million population between 2000 and 2010, a rate of 38 percent. However, as is natural for a growing urban area, most of the growth was in the outer districts (Photo: Suburban Shenzhen), which grew from 4.6 million to 7.0 million, a growth rate of 52 percent. Thus, nearly three-quarters of the growth was on the periphery (Figure 2). Population growth in the earlier 1990 and 2000 period was slightly less concentrated in the outer area (68 percent). But overall  population growth has begun to slow down, with Shenzhen added 3.3 million new residents, compared to 4.3 million between 1990 and 2000.  


Photo: Suburban Shenzhen (Longgang)

The Urban Area: Overall, it is estimated that the Shenzhen urban area (area of continuous development) has a 2012 population of 11.9 million, with a land area of 675 square miles (1,745 square kilometers). The urban area has now crossed the border into the Huiyang district of the Huizhou region, to the east. The population density is estimated at 17,600 per square mile, or 6,800 per square kilometer,  approximately 10 percent less dense than the average urban area in China. Shenzhen is about one quarter the density of Hong Kong and double the density of Paris.

Rich and Poor in Shenzhen: Like all urban areas, Shenzhen is a mixture of rich and poor. Shenzhen is generally considered one of the most affluent urban areas in China, yet it also has a very large low income population. Approximately one-sixth of China's residents are considered to be temporary migrants; many work in boomtowns like Shenzhen. Seven million of these 220 million migrants live in Shenzhen,  considered the largest migrant population of any region in the nation. Migrants are attracted to Shenzhen for the same reasons people have moved to cities from early on: to get ahead. At the same time, their remittances sent back home are contributing to improved living conditions far beyond Shenzhen. It is expected that reforms to the "hukou" system of residence permits will allow many of the temporary migrants in Shenzhen and elsewhere obtain permanent residence status. Many of the migrants live in factory housing, or older, very densely packed buildings. At the same time, Shenzhen has a large number of world-class condominium buildings.


Photo: Older Housing: Central Business District


Photo: Newer Housing: Central Business District

The Future of Shenzhen: Much of Shenzhen's future will depend upon the economy of the Pearl River Delta and the extent to which migrants are able to obtain permanent residency status. There is still land enough in the region for substantial population growth. The longer term integration of the Hong Kong and Shenzhen economies could produce an even larger economic dynamo than the two that are currently separate. One thing is certain, however. Shenzhen has led China into a new economic and urban reality.

Wendell Cox is a Visiting Professor, Conservatoire National des Arts et Metiers, Paris and the author of “War on the Dream: How Anti-Sprawl Policy Threatens the Quality of Life”.

-----

Note 1: Shenzhen is one of China's regions, often called "cities," as translated from "shi."  "Shi" more resemble regions than "cities" in the non-Chinese sense, this article refers to "shi" as regions. "Shi" were formerly referred to in English as prefectures. A province is usually composed of "shis" and other "shi" level jurisdictions.

Note 2: These combined regions are not a metropolitan area, for two reasons. First; there is little daily commuting between them and thus they are not a single labor market, which is the definition of a metropolitan area. Second, one of the regions, Hong Kong, has a border with Shenzhen that has international style customs and immigrant controls, which further precludes the two adjacent regions from being a single metropolitan area. In the longer run, greater affluence, greater mobility between the regions and relaxation of border controls could merge some or all of the now separate metropolitan areas.

Note 3: Desiro.com, unlike some other skyline rating systems, places a premium on the density of buildings, rather than simply amalgamating building heights from throughout an urban area.

Photo: Shenzhen:  Binhe Avenue from the Shun Hing Tower (by author)

Midcentury Modern

$
0
0

Midcentury modern tours now are taking place in cities all over the country. Renewed interest in this era capitalizes on the millennials’ interest in design from a time that seems almost impossibly optimistic compared to today’s zeitgeist. Most cities around the country boast a healthy building stock from this postwar period, nicknamed “the suburbs,” although these are ritually condemned – and designated for annihilation – by academics, urban land speculators and the urban clerisy.

Yet the new interest in the mid-century modern form reflects its basic and enduring appeal. As the curious and the trendy take bus tours of these inner-ring neighborhoods, the forms of this era evoke a sense of great confidence and faith in the future, both of which seem to be lost in the obsession with neo-traditional forms that hearken to the pre-car era or to the cartoonlike, sculpture-as-architecture one sees in many urban centers.

Suburban expansion after World War II reached out beyond the streetcar systems that created the traditional neighborhoods of the late 19thand early 20th Century. The returning GIs wanted something simple and affordable to begin their lives after serving their country. Confidence surged in America’s know-how and ability to solve even the deepest social problems. The triumph of science and technology was a palpable presence. The dark side, of course, was the atomic threat, restraining our enthusiasm but only a little.

In this midcentury era, planning and design began to be car-based. Residences were designed to show off the car, putting it out front for display – and some home plans even had tailfinned beauties in the living room


Living Garage, photo from Populuxe by Thomas Hine

Consumer goods were no longer accessed on foot; a new form of luxury consisted of driving up to the front door of a shop with parking in front. Front-loading houses and stores became unquestionably more efficient as a means to accommodate the new American lifestyle.

Yet despite the auto-orientation, the architecture of this era retained the pedestrian scale and intimate feel that marked Main Street before World War 2. This both/and aesthetic marks the form of the 1940s and 1950s, with streamlined design styles like Art Deco Revival and materials like glass and stainless steel. Gentle angles suggested motion, and the theme of mobility was everywhere in the architecture.  Wider streets and lower, longer horizontal lines accommodated this theme and even today the architecture reinforces a feel of motion when driving past these structures.

Modernism also formed a certain ethic. To be modern was more than a lifestyle choice; it was an acceptance of science, knowledge, and technology, free from preconceptions.  At the time, modernism elevated architecture above the style debate, and was considered even a shedding of styles. The politics of the time was similarly marked by Truman’s “straight talk”, and there was a shedding of rhetoric and posturing that lasted up until Joe McCarthy began once again a divide-and-conquer campaign against people.

Translated to the suburbs, modernism meant practical homes, without the adornment that marked Victorian architecture. Instead, modernist residences were marked by deep horizontals and large picture windows, providing a sense of openness that was a hallmark of modernist thought. Floor plans also were open, allowing free movement through space, rather than cutting the house up into cluttered little parlors, dining rooms, or nooks. 

Today, midcentury modern design is fetishized for mass consumption in magazines like Dwell that emphasize acquisitiveness over ethics. But back then, the design meant something else, something cleaner and more powerful. In the 1950s, modernism meant consumption, but even more, the modernism defined the quest for the inner self and a new, forward looking outlook.

By reducing modernism to a sofa style or wallpaper pattern, we risk losing all that this era stood for.  Buildings from the 1950s have sustained themselves through multiple recessions, the rise of the internet, cultural acceleration, massive city growth, and globalism. So perhaps they point towards a real definition of sustainability by having good bones and adapting through all these changes.

The current millennial generation seeks a practical domestic situation, much like returning GIs. Most would prefer to reduce car-trips, but are realistic about this goal, given the range of their travel. Most in this generation see right through car-free living claims; more than one of my students, when discussing walkability, stated that “I’m not gonna lug my groceries even a block in this heat.” The battle with the car is chiefly about making the car more efficient, and less ubiquitous through the use of telecommuting and on-line shopping. It is not about removing it from the scene entirely.

So as McMansions have swollen to represent a kind of architectural obesity, they have made many midcentury neighborhoods unfashionable, for typically these older homes have one parking space, often in a carport, not a true garage. They also are front-loaded, a much more efficient planning concept than alleys, but then the car becomes part of the front façade. Millennials have a hard time understanding what’s wrong with that. Again, as one 28-year-old student put it to me, “It’s just a house, after all…what’s the big deal?”

Developers seeking first-time homebuyers, however, respond to the regulatory climate, which favors solutions like garages on alleys, big homes on tight lots, and neotraditional styling.  Bonus density and other zoning incentives rig the game in favor of this highly regulated development pattern, even in the exurbs.  Here in Central Florida, the development zone nicknamed Horizon West has been codified to enforce these form-based principles, with stiff permitting fees and a highly participatory government staff to keep things on the straight-and-narrow.

Keeping prices low with all this overburden requires developers to cut the cost of the home drastically, likely reducing lifespan of components and systems. Ironically, the house meeting these tortured standards of today is less sustainable than the house built in 1953, with better bones and an adaptable floor plan.

Meanwhile, these 1950s neighborhoods are under attack for their very form. Cities, persuaded by planners to heal the effects of the car, cannot do so in a granular manner, so ordinances are passed  forbidding front-facing garages, or garages set back arbitrarily from the house front. These 1950s homes, with their carports, couldn’t be built today, and so are reduced to the status of heritage sites from a bygone era. In Winter Park, garages are banished to the rear on new homes, and if you are adding a garage to your midcentury home, it must be arbitrarily set back at least four feet from your front wall whether or not your lot can accommodate this arbitrary, and seemingly pointless, ordinance.

Of course mid modern tours allow people to rediscover the essence of the 1950s, and these overlooked neighborhoods could be the springboard for a new era in modern planning.  Front-loaded neighborhoods can be successful when the architecture is designed at a human scale, and fine-grained integration of residential and commercial uses point to a future of home-office, cottage-industry, people-based industry once again.

The Victorian era ended rather abruptly in the 1890s with a series of economic catastrophes that changed America’s middle class. Architecture switched to a more streamlined, Edwardian style – simple, flexible, and utilitarian forms that quickly gave rise to modernist design.  This current economic transition may well bode a similar outcome – design styles, often labeled “contemporary,” reduce the amount of architectural gingerbread and fussiness, reducing cost and maintenance, and may be favored by the coming generation for its cleanliness and utility.

A new era that manages the car at a human scale, forgives people for wanting mobility and efficiency, and allows for contemporary exploration of style and design can and should inform new neighborhood planning. Midcentury suburbs, rediscovered by popular interest, can point the way to a middle ground between mcmansion-style subdivisions and neotraditional fussiness, and maybe even help us rediscover our confidence and faith once again.

This essay is a summary of Richard Reep’s talk “Populuxe and the Atomic Bungalow” given at the 3rd annual Colloquium on Historic Preservation, hosted by Friends of Casa Feliz, Winter Park, Florida in April 2012.  Richard and his wife, Kim Mathis, hosted a midcentury modern tour in their own 1950s home for the colloquium.

Top Manufacturing Sectors For 2011

$
0
0

There has been lots of data indicating that domestic manufacturing is regaining some vigor after years of wasting away. Brookings’ Martin Neil Baily and Bruce Katz, writing in the Washington Post, noted:

Manufacturing employment, output and exports are headed in the right direction: In April, the number of U.S. manufacturing jobs was up 489,000 from the January 2010 low of 11.5 million. The Institute of Supply Management’s manufacturing index has shown 33 consecutive months of expansion.

Some of this growth may be due to re-shoring efforts. This CNBC article mentions Chesapeake Bay Candle, which outsourced much of its manufacturing workforce 17 years ago and is starting to bring them back. Here is an excerpt:

A survey by the Boston Consulting Group in February found more than one-third of U.S.-based manufacturing executives at companies with sales greater than $1 billion are either planning or considering bringing production back to the United States from China.

To inform the discussion a bit more, we tapped into our database and pulled all of the 4-digit NAICS manufacturing sectors (86 in all) to learn more about the recent growth. From the end of 2010 to the end of 2011, our data tells us that the 4-digit manufacturing sectors added just over 200,000 jobs. NOTE: This is less than the Brookings research shows, but we are likely looking at slightly different timeframes and datasets.

Job Winners

The industries that gained the most jobs in one year didn’t necessarily go through the roof, but considering what they went through over the previous nine or 10 years, it is safe to say that the trends we are seeing now are pretty significant. Prior to 2010, pretty much every manufacturing sub-sector experienced significant decline. Domestic machinery manufacturing especially stands out. Several sub-sectors gained a healthy number of jobs last year.

  1. Ag, construction and mining machinery manufacturing (NAICS 3331) gained nearly 14,000 new jobs (7% employment growth) and now employs 218,000. From 2001 to 2009, this industry declined by 3%, shedding 7,500 jobs.
  2. Other machinery manufacturing (NAICS 3339, a catch-all industry) gained 12,000 new jobs (5% employment growth) and now employs 237,000. From 2001 to 2009, this industry declined by 26%, shedding 85,000 jobs.
  3. Metalworking machinery manufacturing (NAICS 3335) gained 11,000 new jobs (7% employment growth) and now employs 166,000. From 2001 to 2009, this industry declined by 37%, shedding 91,000 jobs.

All told, these three sectors added some 37,000 jobs in one year, which is great considering that they actually lost 184,000 over the previous nine years.

Of all the 4-digit sectors, machine shops (NAICS 3327) gained the most new jobs in one year — about 22,000 jobs or 7% employment growth. There are now some 330,000 employed in this sector. From 2001 to 2009, this industry declined by 11% and shed 38,000 jobs.

Motor vehicle part manufacturing (NAICS 3363) added 20,000 jobs, which was 3% growth. There are now 435,500 employed in this industry. From 2001 to 2009, this industry declined 46% (a loss of 356,000 jobs).

Semiconductor manufacturing (NAICS 3344) did well by adding 17,000 new jobs, which represents 4% growth. There are now 386,000 jobs in this sector. From 2001 to 2009, this industry declined by 41% (a loss of 266,000 jobs).

Finally, aerospace products manufacturing (NAICS 3364) gained 13,000 jobs, which is 3% growth. The current job count stands at 488,000. From 2001 to 2009, this industry declined by 3% (a loss of 14,000 jobs).

The big thing to note here is how much of this is related to advanced manufacturing.

Fastest-Growing

Audio and visual equipment manufacturing (NAICS 3343) had the fastest overall growth from 2010-2011. The big thing to note is that from 2001-2009 the industry actually lost more than half (53%) of its total workforce, a total of 25,000 jobs. During 2011, it managed to gain back 12% or 2,360 jobs. We’d say that a one-year rebound like that is great news after such a huge loss.

After that, steel product manufacturing (NAICS 3312), which lost 17,000 jobs (-25%) since 2001, had 10% employment growth and added over 5,000 jobs from 2010-11, and foundries (NAICS 3315), which lost 86,000 jobs (-43%), grew by 9% and added nearly 10,000 jobs.

Highest-Paying

With an average industry earnings level of $140,000 per year (keep in mind this is averaging the wages and salaries of all workers in the industry together), computer and peripheral equipment manufacturing (NAICS 3341) has the highest earnings. From 2001 to 2009, the industry lost 41% of its workforce or 118,000 jobs. In 2011, it grew by 6%, adding 9,400 jobs.

After that comes pharmaceutical and medicine manufacturing (NAICS 3254) and petroleum and coal products manufacturing (NAICS 3241), which both average about $102,000 per year. Neither of these final two sectors grew last year.

Biggest Losers

Despite the overall growth, some industries are still in decline.

Printing and related support activities (NAICS 3231) lost 21,000 jobs in one year (-4%), which was the biggest loss of any 4-digit sector. The biggest loser in percent terms was apparel knitting mills (NAICS 3151), which lost 10% of its workforce.


Below is the complete data table of all 86 sectors.

Description 2010 Jobs 2011 Jobs Change % Change 2011 Avg. Annual Wage
Total
11,487,828
11,690,458
202,630
0.02
$59,138
Machine Shops; Turned Product; and Screw, Nut, and Bolt Manufacturing
311,123
332,817
21,694
7%
$48,785
Motor Vehicle Parts Manufacturing
415,180
435,493
20,313
5%
$55,050
Semiconductor and Other Electronic Component Manufacturing
369,879
386,407
16,528
4%
$88,772
Agriculture, Construction, and Mining Machinery Manufacturing
203,837
217,594
13,757
7%
$70,602
Aerospace Product and Parts Manufacturing
475,009
487,886
12,877
3%
$87,430
Other General Purpose Machinery Manufacturing
225,257
237,315
12,058
5%
$61,266
Metalworking Machinery Manufacturing
155,031
166,188
11,157
7%
$53,903
Foundries
111,056
121,031
9,975
9%
$50,014
Computer and Peripheral Equipment Manufacturing
158,879
168,224
9,345
6%
$140,228
Other Fabricated Metal Product Manufacturing
245,850
254,972
9,122
4%
$55,840
Architectural and Structural Metals Manufacturing
319,567
327,843
8,276
3%
$46,489
Coating, Engraving, Heat Treating, and Allied Activities
121,460
128,481
7,021
6%
$43,415
Beverage Manufacturing
167,187
173,497
6,310
4%
$51,120
Ventilation, Heating, Air-Conditioning, and Commercial Refrigeration Equipment Manufacturing
125,870
132,160
6,290
5%
$49,587
Ship and Boat Building
123,574
129,773
6,199
5%
$56,065
Industrial Machinery Manufacturing
97,824
103,848
6,024
6%
$71,912
Motor Vehicle Manufacturing
152,736
158,707
5,971
4%
$79,407
Engine, Turbine, and Power Transmission Equipment Manufacturing
90,970
96,758
5,788
6%
$72,697
Motor Vehicle Body and Trailer Manufacturing
108,962
114,439
5,477
5%
$44,994
Forging and Stamping
88,269
93,647
5,378
6%
$52,770
Steel Product Manufacturing from Purchased Steel
52,287
57,449
5,162
10%
$57,738
Nonferrous Metal (except Aluminum) Production and Processing
58,036
62,360
4,324
7%
$61,286
Plastics Product Manufacturing
501,678
505,984
4,306
1%
$45,499
Other Electrical Equipment and Component Manufacturing
117,847
122,012
4,165
4%
$58,774
Boiler, Tank, and Shipping Container Manufacturing
84,588
88,693
4,105
5%
$57,507
Converted Paper Product Manufacturing
281,187
284,673
3,486
1%
$53,341
Alumina and Aluminum Production and Processing
54,054
57,539
3,485
6%
$58,638
Medical Equipment and Supplies Manufacturing
303,297
306,341
3,044
1%
$61,515
Electrical Equipment Manufacturing
134,318
136,968
2,650
2%
$63,766
Audio and Video Equipment Manufacturing
20,042
22,402
2,360
12%
$79,151
Basic Chemical Manufacturing
140,942
143,045
2,103
1%
$88,113
Fabric Mills
54,021
56,110
2,089
4%
$41,628
Other Miscellaneous Manufacturing
263,116
265,031
1,915
1%
$46,223
Iron and Steel Mills and Ferroalloy Manufacturing
85,954
87,603
1,649
2%
$73,636
Cut and Sew Apparel Manufacturing
125,398
126,937
1,539
1%
$36,150
Manufacturing and Reproducing Magnetic and Optical Media
25,002
26,425
1,423
6%
$85,820
Other Transportation Equipment Manufacturing
33,191
34,547
1,356
4%
$63,123
Railroad Rolling Stock Manufacturing
18,402
19,752
1,350
7%
$62,647
Office Furniture (including Fixtures) Manufacturing
96,048
97,283
1,235
1%
$44,807
Commercial and Service Industry Machinery Manufacturing
92,184
93,335
1,151
1%
$64,827
Bakeries and Tortilla Manufacturing
276,593
277,718
1,125
0%
$35,578
Rubber Product Manufacturing
121,591
122,587
996
1%
$51,487
Resin, Synthetic Rubber, and Artificial Synthetic Fibers and Filaments Manufacturing
89,107
90,092
985
1%
$78,720
Footwear Manufacturing
13,148
13,863
715
5%
$35,261
Cutlery and Handtool Manufacturing
40,141
40,830
689
2%
$54,144
Paint, Coating, and Adhesive Manufacturing
55,883
56,555
672
1%
$64,627
Pharmaceutical and Medicine Manufacturing
278,781
279,434
653
0%
$102,299
Pesticide, Fertilizer, and Other Agricultural Chemical Manufacturing
35,755
36,407
652
2%
$73,502
Other Leather and Allied Product Manufacturing
10,934
11,557
623
6%
$35,423
Animal Food Manufacturing
51,602
52,172
570
1%
$52,176
Spring and Wire Product Manufacturing
42,338
42,813
475
1%
$45,935
Electric Lighting Equipment Manufacturing
45,298
45,750
452
1%
$52,943
Sugar and Confectionery Product Manufacturing
66,412
66,834
422
1%
$46,306
Hardware Manufacturing
23,529
23,867
338
1%
$53,447
Dairy Product Manufacturing
130,203
130,532
329
0%
$50,968
Leather and Hide Tanning and Finishing
4,015
4,311
296
7%
$44,342
Soap, Cleaning Compound, and Toilet Preparation Manufacturing
100,840
101,045
205
0%
$63,366
Other Nonmetallic Mineral Product Manufacturing
65,438
65,575
137
0%
$49,114
Other Chemical Product and Preparation Manufacturing
84,148
84,261
113
0%
$62,910
Grain and Oilseed Milling
58,689
58,669
-20
0%
$61,858
Sawmills and Wood Preservation
82,512
82,459
-53
0%
$38,074
Textile and Fabric Finishing and Fabric Coating Mills
36,210
36,151
-59
0%
$41,847
Lime and Gypsum Product Manufacturing
13,483
13,408
-75
-1%
$55,548
Clay Product and Refractory Manufacturing
40,381
40,289
-92
0%
$47,440
Other Food Manufacturing
163,346
163,230
-116
0%
$51,728
Other Furniture Related Product Manufacturing
36,427
36,300
-127
0%
$39,650
Pulp, Paper, and Paperboard Mills
111,661
111,144
-517
0%
$74,825
Glass and Glass Product Manufacturing
78,991
78,420
-571
-1%
$51,877
Apparel Accessories and Other Apparel Manufacturing
13,699
12,973
-726
-5%
$35,757
Tobacco Manufacturing
16,251
15,510
-741
-5%
$95,669
Petroleum and Coal Products Manufacturing
110,968
110,014
-954
-1%
$101,861
Fiber, Yarn, and Thread Mills
29,142
28,113
-1,029
-4%
$34,390
Household Appliance Manufacturing
58,658
57,563
-1,095
-2%
$53,698
Other Textile Product Mills
61,833
60,658
-1,175
-2%
$32,955
Fruit and Vegetable Preserving and Specialty Food Manufacturing
173,410
172,057
-1,353
-1%
$42,885
Animal Slaughtering and Processing
485,619
484,061
-1,558
0%
$33,217
Apparel Knitting Mills
18,521
16,702
-1,819
-10%
$35,513
Cement and Concrete Product Manufacturing
169,820
167,189
-2,631
-2%
$46,464
Veneer, Plywood, and Engineered Wood Product Manufacturing
63,204
60,319
-2,885
-5%
$40,514
Navigational, Measuring, Electromedical, and Control Instruments Manufacturing
407,365
404,342
-3,023
-1%
$89,109
Other Wood Product Manufacturing
193,833
190,791
-3,042
-2%
$34,431
Textile Furnishings Mills
57,300
54,100
-3,200
-6%
$36,515
Seafood Product Preparation and Packaging
36,471
33,132
-3,339
-9%
$37,983
Communications Equipment Manufacturing
115,861
111,978
-3,883
-3%
$98,379
Household and Institutional Furniture and Kitchen Cabinet Manufacturing
223,590
218,463
-5,127
-2%
$34,868
Printing and Related Support Activities
485,717
464,657
-21,060
-4%
$43,810


State-by-State

As is our custom in posts like this, we like to provide a state-by-state breakdown. To do this we aggregated all 86 industries together and looked at the distribution of these jobs by state. Here are the results.

The good news is that 40 out of 51 states (including Washington, D.C.) gained manufacturing jobs.

Oklahoma had the best single year percentage growth (9%) for manufacturing and added nearly 11,000 new jobs. Its current tally of manufacturing jobs is 133,500. Texas added the most new jobs, 23,000, and Michigan was second with 21,000. Current employment levels in each state are 833,000 and 497,000, respectively.

California employs the most, 1.2 million, and grew by 1% or 10,000 jobs in 2011.

Indiana and Wisconsin have the highest concentration of manufacturing jobs. Both are nearly twice the national average, and both employ roughly 450,000 manufacturing workers.

D.C. has the highest pay (averaging nearly $100,000 per year) but very few manufacturing jobs (about 1,000). Massachusetts, which has 260,000 manufacturing jobs and grew by 2% last year, has the second highest average industry earnings ($78,000).

Ten states lost jobs. New Jersey was the biggest loser with -8,100 jobs (3% decline). After New Jersey comes Arkansas, which lost 5,100 jobs (-3%) and New York, which dropped 3,500 jobs (-1%).

The data for each state is below.

State Name 2010 Jobs 2011 Jobs % Change 2011 Avg. Annual Wage 2010 National Location Quotient (Average is 1.00)
Total
11,487,828
11,690,458
0.02
$59,138
Oklahoma
122,790
133,524
9%
$47,547
0.91
Utah
110,240
116,542
6%
$50,210
1.07
Louisiana
137,263
145,003
6%
$61,321
0.83
South Carolina
207,789
219,353
6%
$51,111
1.3
Washington
254,839
266,538
5%
$68,111
1
Michigan
475,226
496,576
4%
$61,671
1.42
Missouri
243,033
253,599
4%
$50,367
1.05
Arizona
147,905
154,034
4%
$68,224
0.7
Iowa
200,797
207,870
4%
$50,659
1.57
South Dakota
36,963
38,208
3%
$40,746
1.04
Idaho
53,103
54,797
3%
$51,351
0.97
Kansas
159,776
164,868
3%
$51,944
1.35
Nebraska
91,598
94,376
3%
$43,020
1.13
Texas
810,074
833,421
3%
$65,352
0.89
Kentucky
209,263
215,162
3%
$50,610
1.33
Wisconsin
429,233
439,887
2%
$51,403
1.83
Ohio
620,422
635,427
2%
$54,371
1.42
Pennsylvania
560,428
572,069
2%
$55,099
1.15
Vermont
30,796
31,431
2%
$54,094
1.17
Illinois
559,975
570,941
2%
$61,073
1.14
Massachusetts
254,462
259,117
2%
$78,315
0.91
Wyoming
8,710
8,858
2%
$53,439
0.35
Tennessee
298,290
303,357
2%
$52,828
1.31
Florida
307,489
311,391
1%
$52,500
0.48
Minnesota
292,048
295,448
1%
$57,855
1.28
North Dakota
22,548
22,803
1%
$43,695
0.68
Indiana
447,514
452,536
1%
$55,692
1.85
Alabama
236,259
238,796
1%
$49,608
1.44
Virginia
229,864
231,927
1%
$52,845
0.7
California
1,235,043
1,244,965
1%
$75,079
0.95
Oregon
163,179
164,466
1%
$60,036
1.14
North Carolina
431,536
434,259
1%
$52,551
1.24
New Mexico
29,019
29,194
1%
$53,901
0.41
West Virginia
49,066
49,307
0%
$51,340
0.79
Georgia
343,354
344,947
0%
$51,640
1.01
Connecticut
165,636
166,385
0%
$76,876
1.17
New Hampshire
65,760
66,055
0%
$62,446
1.23
Colorado
125,494
126,028
0%
$61,496
0.63
Delaware
26,137
26,120
0%
$57,090
0.72
Rhode Island
40,328
40,216
0%
$50,621
1.01
Hawaii
12,913
12,873
0%
$40,153
0.23
New York
455,654
452,083
-1%
$61,365
0.61
Maine
50,672
50,234
-1%
$50,836
0.98
Mississippi
135,901
134,099
-1%
$41,709
1.39
Maryland
115,097
113,196
-2%
$66,776
0.51
Montana
16,386
15,942
-3%
$42,569
0.43
New Jersey
255,906
247,809
-3%
$75,142
0.77
Arkansas
160,159
155,012
-3%
$40,584
1.57
Nevada
37,888
36,329
-4%
$51,492
0.38
Alaska
12,735
11,912
-6%
$42,559
0.42
District of Columbia
1,272
1,168
-8%
$97,287
0.02


Conclusion

Folks who watch the economy tend to pay a lot of attention to manufacturing. This is because manufacturing of all types and sizes produces a lot of jobs and, as export-based sectors, bring much-needed dollars into the economy.

This data offers some glimmers of hope for a very large sector that has been the constant bearer of bad news for as long as anyone can remember. More companies are opting for domestic production and the products they produce (like heavy machinery) are seeing good domestic and worldwide demand.

In this analysis some of the big winners appear to be machine shops, machinery manufacturers, audio/visual products, aerospace, foundries, metal working, and computer related manufacturing. Let us know if you’d like to learn more about any of the states or sectors we covered.

Rob Sentz is the marketing director at EMSI, an Idaho-based economics firm that provides data and analysis to workforce boards, economic development agencies, higher education institutions and the private sector. He is the author of a series of green jobs white papers. For more, contact Rob Sentz (rob@economicmodeling.com). You can also reach us via Twitter @DesktopEcon.

Illustrations by Mark Beauchamp.

Here Come the Plurals!

$
0
0

This month America’s destiny as a pluralistic democracy took a new and unprecedented turn. First, early in May, USA Today asked Americans what name they thought would be appropriate for the country’s newest generation now moving into grade school classrooms with its unique behavior and perspectives. Plurals is the name suggested by communications research and consulting firm, Frank N. Magid Associates, with only the Apple product related notion of an iGeneration getting more votes. 
 
Plurals will be different from Millenials. For one thing they will be the first generation in America that will be majority “minority”, as evidenced by the recent U.S. Census Bureau announcement  that more babies born in America in the 12 months between July 2010 and July 2011, were non-white than white. The event occurred about eight years earlier than demographers had predicted it would just a few years ago. The 21st Century pluralistic American society that had often been talked about has arrived. But the question remains whether or not the country’s institutions, and its leadership, will be up to the challenge such a polyglot democracy presents.
 
The Census Bureau predicts that by 2042 the entire population will be less than 50% Caucasian and America will literally be a pluralistic society.

This prediction is based upon the current trends for births among different minority groups compared to whites. Racial and ethnic minorities accounted for 91.75% of the nation’s population growth in this century, with Hispanics comprising a majority of this increase. Rather than immigration flows, which are dropping, this growth will be driven largely by higher rates of fertility among non-whites. Based upon the American Community Survey results in 2010, Hispanics have a fertility rate of 2.4 live births per woman compared to only 1.8 among whites. The only other ethnic group to be having babies at a rate greater than what is needed to replace its current numbers is African-Americans with a 2.1 fertility rate.

This difference is likely to persist and the gap could easily become wider because of the differences in the age of each population. Twenty-five percent of Hispanic women are in the prime child bearing ages of 20-34, compared to only 19% of non-Hispanic whites. (For both African-Americans and Asians, the percentage is twenty-two). The increasing diversity of both of America’s youngest generations is also reflected in the average age of each population. The average age of America’s white population is 42.3, a full five years older than the overall age of the country’s population. The average age of Hispanics is almost fifteen years younger, 27.6, with the other two population groups closer to the average age of the entire population—blacks at 32.9 and Asians at 35.9.

Magid’s research indicated that a majority of Americans were “hopeful and proud” of the country’s increasing diversity, but it was the younger generations, most markedly Plurals, who were more likely to say they were “pleased and energized” by this development. Many older Americans, particularly Baby Boomers and senior citizens, are resisting the changes this dramatic shift is bringing to American society. Already states, such as Arizona, with populations that have the widest disparity between the racial and ethnic makeup of their oldest and youngest generations have experienced bitter political battles over issues such as immigration and education that reflect these divides. The good news is that both Plurals and members of the Millennial generation, born 1982-2003, are positive about this inevitable trend toward a pluralistic society, reflecting their comfort with the diversity in the social circles in which they have grown up.

But that doesn’t mean that Plurals look forward to the nation’s future with equanimity. Most Plurals have been raised by parents from the often cynical and consistently skeptical Generation X. This may explain why Magid found a much greater degree of pessimism about living out the American Dream among them than among their older Millennial Generation siblings, a generation that, despite their current challenges, was brought up in the prosperous Reagan-Clinton era and remains characteristically optimistic. The attitudes of Plurals may also reflect the polarized, bitter politics that have characterized the period of Fear, Uncertainty and Doubt (FUD) that has dominated the news during their young life.

Whatever the reason, the pessimism of the Plurals must be answered by the nation’s leaders in ways which improve prospects for the nation’s future. One way for this to happen quickly would be for those currently holding power to begin to turn the reins of leadership over to those generations more in tune with the nation’s demographic future. If Plurals’ Xer parents and their Millennial siblings are given the opportunity to shape America’s destiny sooner rather than later, the country just might deliver on the promise of the American Dream for its newest generation.  

Morley Winograd and Michael D. Hais are co-authors of the newly published Millennial Momentum: How a New Generation is Remaking America and Millennial Makeover: MySpace, YouTube, and the Future of American Politics, named by the New York Times as one of their ten favorite books of 2008.

From Connection to Dispersal: Urbanisation in the 21st Century

$
0
0

Commentators have long studied connections between cities and how these influence their development. The city is the natural focus of trade-based theories of growth. Exporting a surplus, based on local resources and specialisation was – and is – considered the way to city wealth.

In this world, transport is the key to the trade portal. The cities that dominated world trade in the 19th and 20th centuries were those best connected, initially through their ports and sea links complemented later through strong ties over the airways. Mega-ports and airport hubs were marks of city success. 

This model may be changing, and we need to change our thinking about the future of our cities with it.

Connectedness and concentration
Connectedness is a mantra for the new urbanists: through international connection cities exploit the economies assumed to arise from ever-increasing concentration of people and business. Hence, the city seeking to make its mark globally must invest in ever increasing transport infrastructure. Acknowledging the information age, it may add high-speed broadband to the mix and perhaps, in a symbolic move, an international convention centre.

But is this the right model for 21st century urbanisation?

Aviation – moving on
Think for a moment about what has happened in aviation. The last decade saw a quantum shift from a model whereby a few powerful hubs concentrated movement between a few major centres from which passengers and goods could, in turn, be distributed along local spokes – by regional aircraft, train, coach or car. Airlines based themselves overwhelmingly at these hubs.  The large, twin isle jet reigned supreme. The Airbus A380 is the latest conveyor of that model, but most likely the last.

Because late in the 20th century there was a divergence between an ageing hub and spoke model and a growing model based on  dense networks connecting more and more cities directly. The single aisle, medium-haul jet took off.  And now the long-haul, highly efficient, medium-sized jet is further expanding this capacity to directly connect former spokes – smaller cities – without the need to hub through major cities.

And all of this has been supported by the productivity leap brought about by the low cost airline model. More people, more cities, more directly connected than ever before with the capacity to transform economic, political and social relations among them.  [1]

From transport to logistics
The transport sector was about moving goods from A to B as cost effectively as regulation allowed; and all too often regulation kept costs up to protect old technology and incumbent operators, whether by surface, air, or sea. That, though, is changing as international transport is liberalised.    

And today transport is itself transforming into the business of logistics. And logistics is about distribution – through a production chain, between producers and consumers, and among places.  Goods move seamlessly through integrated operations that can deliver almost anything almost anywhere in a matter of days. 

An informational world
As the capacity to transport goods went up and the cost went down, academics trying to explain the differential growth of cities appealed to a new notion that dominating the exchange of information was the new key to prosperity.  Knowledge and expertise were concentrated in key informational hubs where they became the centres of capitalist power, the hearths of globalisation.  [2]

Well that’s changing, too. Information and expertise is becoming dispersed, knowledge ubiquitous.  This is not just about the internet – although it obviously plays a huge part.  It’s also about the explosion of personal mobility as informational cities give way to an informational world.  (It may also be about the potential for implosion as a result of over-concentration, a threat still lingering in the financial centres of the world). 

Linked cities are giving way to networked communities.

From consolidation ...
The lesson? Those of us involved in planning the city cannot assume the same structures will prevail in the future as those we inherited from the past.  We tend to plan, though, by looking for repeat patterns, seeking generalisation, extracting principles, predicting the unpredictable.  And because infrastructure – roads, rail, ports – are large scale, expensive, and enduring they become the bones around which we construct our futures. 

Infrastructure, particularly transport infrastructure, shapes our presumptions about how the city will function and the form it will take. Hence, urban planning is preoccupied with how to consolidate existing structures, increasing their capacity by building up rather than out and moving to mass transit, among other things.

... to dispersal
Yet the shifts in 21st century logistics and information technology support dispersal.  And it might just be that dispersal is the key to 21st century urbanisation.
Light rail systems, dedicated bus lanes, smaller, more fuel efficient vehicles, lower housing costs, more intimate localised but inter-connected sub-urban communities, common information and mobile expertise cutting across diverse tastes, experiences, and places – these may be the way of the future.

In the developing world where urbanisation is most rapid they may be the only way.  Here dispersal is already the dominant reality. While urbanisation may be exemplified in a few megacities in Asia, these account for only a small part of the total. And even they are marked by rapid peripheral expansion, with distinctive, sprawling, dense and diverse communities on the edge. Democraticised, localised self help institutions and NGOs may be the way to improved sanitation and health care in this environment, and micro-commerce the way to sustainable prosperity. 

And in the slower-growing cities of the west, the maturing of sub-urban life, a return to lifestyle-focused localism, ageing in place, and the growing importance of community-based care point to a future in which dispersal rather than concentration could be the dominant mode of social and spatial organisation. Central structures may still have a role, but a diminishing one.

More generally we may have to think of cities themselves as comprising networks of connections, within and across boundaries. The stronger these networks, perhaps, the more resilient the city. But this does not translate to physical density. Proximity is not the issue. Well connected, dense networks will support, if not encourage, dispersal. 

This is contrary to the currently favoured model in places like my city of origin – Auckland – but it is not at all contrary to the centre within that city that I call home.

Getting it wrong
More than ever as we try to plan for the very long-term, we need to open our minds to alternatives. You only need to look at the list of bankrupt airlines (or in and out of Chapter 11 in the US) to appreciate the consequences of overinvesting in the current model on the assumption that it will prevail indefinitely.

Phil McDermott is a Director of CityScope Consultants in Auckland, New Zealand, and Adjunct Professor of Regional and Urban Development at Auckland University of Technology.  He works in urban, economic and transport development throughout New Zealand and in Australia, Asia, and the Pacific.  He was formerly Head of the School of Resource and Environmental Planning at Massey University and General Manager of the Centre for Asia Pacific Aviation in Sydney. This piece originally appeared at is blog: Cities Matter.

Aircaft photo by BigStockPhoto.com.


[1]            See, for example, Centre for Asia Pacific Aviation (2003) Low Cost Airlines in Asia Pacific: A Force for Change and (2009) Global Low Cost Carrier Report
[2]           E.g. Castells M (1990) The Informational City: Economic Restructuring and Urban Development Blackwell; Sassen S (1991) The Global City, New York, London, Tokyo, Princeton University Press

Declining Birthrates Key to Europe's Decline

$
0
0

The labor demonstrators, now an almost-daily occurrence in Madrid and other economically-devastated southern European cities lambast austerity and budget cuts as the primary  cause for their current national crisis. But longer-term, the biggest threat to the European Union has less to do with government policy than what is–or is not–happening in the bedroom.

In particular, southern Europe’s economic disaster is both reflected — and is largely caused by — a demographic decline that, if not soon reversed, all but guarantees the continent’s continued slide. For decades, the wealthier countries of the northern countries — notably Germany — have offset very low fertility rates and declining domestic demand by attracting migrants from other countries, notably from eastern and southern Europe, and building highly productive export oriented economies.

In contrast, the so-called Club Med Countries– Greece, Italy, Portugal and Spain–have not developed strong economies to compensate for their fading demographics outside pockets of relative prosperity such as Milan. Spain was once one of Europe’s star performers, buoyed largely by real estate speculation and growing integration with the rest of the EU.  Six years ago the country was building upwards of 50% as many houses as the US while having 85% less population. Roughly six million immigrants came to work in the boom, even as roughly seven to eight percent of Spaniards preferred to remain unemployment.

When the real estate bubble broke, there was only limited productive industry to step into the breach. In Spain, private sector credit has dropped for a remarkable eighteen straight months while industrial production has fallen precipitously–7.5 percent in March alone. Spain’s unemployment rate has scaled over 23%, more than twice the EU average. Unemployment among those under 25 in both Spain and Greece now reaches over fifty percent.

After decades of expansion, even fashionable Madrid is littered with store vacancies and  ubiquitous graffiti; many young people can be seen on the street in the middle of the week, either doing nothing or trying to pick up an odd Euro or two performing for tourists.

‘A Change In Values’

Economists tend to explain this decline in terms of budget deficits and failed competitiveness, but some Spaniards believe the main cause lies elsewhere. Alejandro MacarrónLarumbe, a Madrid-based management consultant and author of the 2011 book, Elsuicidiodemográfico de España, says today’s decline is “almost all about a change in values.”

A generation ago Spain was just coming out of its Francoist era,  a strongly Catholic country with among the highest birth rates in Europe, with the average woman producing almost four children in 1960 and nearly three as late as 1975-1976. There was, he notes, “no divorce, no contraception allowed.” By the 1980s many things changed much for the better better, as young Spaniards became educated, economic opportunities opened for women expanded and political liberty became entrenched.

Yet modernization exacted its social cost. The institution of the family, once dominant in Spain, lost its primacy. “Priorities for most young and middle-aged women (and men) are career, building wealth, buying a house, having fun, travelling, not incurring in the burden of many children,” observes Macarron. Many, like their northern European counterparts, dismissed marriage altogether; although the population is higher than it was in 1975, the number of marriages has declined from 270,000 to 170,000 annually.

Falling Births, Falling Fortunes

Now Spain, like much of the EU, faces the demographic consequences. The results have been transformative. In a half century Spain’s fertility rate has fallen more than 50% to 1.4 children per female, one of the lowest not only in Europe, but also the world and well below the 2.1 rate necessary simply to replace the current population. More recently the rate has dropped further at least 5 percent.

Essentially, Spain and other Mediterranean countries bought into northern Europe’s liberal values, and low birthrates, but did so without the economic wherewithal to pay for it. You can afford a Nordic welfare state, albeit increasingly precariously, if your companies and labor force are highly skilled or productive. But Spain, Italy, Greece and Portugal lack that kind of productive industry; much of the growth stemmed from real estate and tourism. Infrastructure development was underwritten by the EU, and the country has become increasingly dependent on foreign investors.

Unlike Sweden or Germany, Spain cannot count now on immigrants to stem their demographic decline and generate new economic energy. Although 450,000 people, largely from Muslim countries, still arrive annually, over 580,000 Spaniards are heading elsewhere — many of them to northern Europe and some to traditional places of immigration such as Latin America. Germany, which needs 200,000 immigrants a year to keep its factories humming, has emerged as a preferred destination.

Declining Population

As a result Spain could prove among the first of the major EU countries to see an actual drop in population. The National Institute for Statistics (INE) predicts the country will lose one million residents in the coming decade, a trend that will worsen as the baby boom generation begins to die off. The population of 47 million will drop an additional two million by 2021. By 2060, according to Macarron, Spain will be home to barely 35 million people.

This decline in population and mounting out-migration of young people means Spain will experience ever-higher proportions of retired people relative to those working. This “dependency rate”, according to INE, will grow by 57 % by 2021; there will be six people either retired or in school for every person working.

If Spain, and other Mediterranean countries, cannot pay their bills now, these trends suggest that in the future they will become increasingly unable or even unwilling to do so.  As Macarron notes, an aging electorate is likely to make it increasingly difficult for Spanish politicians to tamper with pensions, cut taxes and otherwise drive private sector growth. Voters over 60 are already thirty percent of the electorate up from 22 percent in 1977; in 2050, they will constitute close to a majority.

Without a major shift in policies that favor families in housing or tax policies, and an unexpected resurgence of interest in marriage and children, Spain and the rest of Mediterranean face prospects of a immediate decline every bit as profound as that experienced in the 17th and 18th Century when these great nations lost their status as global powers and instead devolved into quaint locales for vacationers, romantic poets and history buffs.

Long before that happens, today’s Mediterranean folly could drive the rest of Europe, and maybe even the world, into yet another catastrophic recession.

Joel Kotkin is executive editor of NewGeography.com and is a distinguished presidential fellow in urban futures at Chapman University, and contributing editor to the City Journal in New York. He is author of The City: A Global History. His newest book is The Next Hundred Million: America in 2050, released in February, 2010.

Girl with Spanish flag photo by BigStockPhoto.com.


China's Top Growth Centers

$
0
0

Hefei, the capital of historically poor Anhui province emerged as China's top growth center among major metropolitan areas over the past 10 years. Metropolitan areas from the interior, the Yangtze Delta and the central and northern coast were the fastest growing, displacing Guangdong's Pearl River Delta, long the growth center for the country.   (Figure 1).

China's Trends in Context: China's growth rate has fallen substantially and the United Nations has projected that the nation will experience population decline starting between 2030 and 2035. However, China's urban areas have grown strongly as people have continued to move to cities for better opportunities. According to World Bank research, China's economic progress since 1981 has lifted more people out of poverty than ever before in the world.

Never before in history have so many people moved to urban areas in such a short period of time.

Since the reforms began in approximately 1980, all of China's population growth has been urban. Rural areas lost approximately 110 million people between 1980 and 2010. That is approximately equal to the population of Mexico and more than each of the nations in the world except for 11. Over the same three decades, 470 million people were added to the urban areas. That is more than 1.5 times the population of the United States.

China's Metropolitan Areas: This article provides an analysis of the urban districts (qu) of Chinas urban regions (routinely mislabeled "cities"). These districts are designated by regional officials as urban for urban development. Since the peripheral urban districts are principally rural, the combination of urban districts (Shi Shixiaqu)in a region are akin to a metropolitan area (labor market area).

Among the metropolitan areas that began the decade (2000) with more than 1,000,000 inhabitants, the slowest 10 year growth rate was 36 percent. In comparison, among the 51 US metropolitan areas with more than 1,000,000 population, only three (Las Vegas, Raleigh and Austin) would have placed in China's top 20, and not higher than 14th (Table). As in the US, the most rapid urban growth is taking place in smaller metropolitan areas with less than 5 million in 2010.  


Top 20 Metropolitan Growth Centers in China: 2000-2010
Rank Metropolitan Area 2000 Population 2010 Population Change % Geography
1  Hefei, AN        1,659,000     4,544,000       2,885,000 173.9%  I 
2  Xiamen, FJ        2,053,000     3,531,000       1,478,000 72.0%  C 
3  Zhengzhou, HEB        2,560,000     4,254,000       1,694,000 66.2%  I 
4  Suzhou, JS        2,473,000     4,074,000       1,601,000 64.7%  Y 
5  Wenzhou, ZJ        1,916,000     3,040,000       1,124,000 58.7%  Y 
6  Ningbo, ZJ        2,201,000     3,492,000       1,291,000 58.7%  Y 
7  Urumqi, XJ        1,753,000     2,744,000          991,000 56.5%  I 
8  Weifang, SD        1,380,000     2,044,000          664,000 48.1%  N 
9  Shenzhen, GD        7,009,000   10,358,000       3,349,000 47.8%  P 
10  Hangzhou, ZJ        4,243,000     6,242,000       1,999,000 47.1%  Y 
11  Beijing, BJ      12,874,000   18,827,000       5,953,000 46.2%  N 
12  Changsha, HUN        2,123,000     3,094,000          971,000 45.7%  I 
13  Chengdu, SC        5,268,000     7,677,000       2,409,000 45.7%  I 
14  Shanghai, SH      15,758,000   22,315,000       6,557,000 41.6%  Y 
15  Hohhot, NM        1,407,000     1,981,000          574,000 40.8%  I 
16  Nanjing, JS        5,098,000     7,166,000       2,068,000 40.6%  Y 
17  Shijiazhuang, HEB        1,970,000     2,767,000          797,000 40.5%  N 
18  Fuzhou, FJ        2,124,000     2,922,000          798,000 37.6%  C 
19  Qingdao, SH        2,721,000     3,719,000          998,000 36.7%  N 
20  Tianjin, TJ        8,146,000   11,090,000       2,944,000 36.1%  N 
 Metropolitan areas with more than 1,000,000 population in 2000.  
 Metropolitan areas consist of urban districts (qu) 
Geographical Codes
 C   Central Coast 
 I   Interior 
 N   Northern Coast 
 P   Pearl River Delta (Coast) 
 Y   Yangtze River Delta (Coast) 
 Data from National Bureau of Statistics of China 


The Interior: Six of the top 20 gainers were in the interior, including fastest growing Hefei. This reflects the appeal of   lower labor costs and perhaps also that rural migrants often prefer to work in regions   closer to their homes and families in agricultural regions. These six metropolitan areas had an average growth rate of 71 percent, the largest rate of any geographical grouping.

  • The capital of Anhui province, Hefei (photo), had the largest gain, at 174 percent. Hefei grew from 1.659 million to 4.544 million. Hefei is developing one of the most dispersed urban forms among China's metropolitan area and there continues to be considerable construction. Hefei's population growth rate was more than double that of second place Xiamen. Anhui is one province removed from the coast and Hefei is only 115 miles (185 kilometers) from the Yangtze Delta's Nanjing.
  • The third ranked metropolitan area was Zhengzhou (photo), the capital of Henan province (also separated from the coast by one province), which experienced a 66 percent population gain.
  • Urumqi, the capital of China's large northwestern province of Xinjiang ranked 7th with a gain of 57 percent. Urumqi is by far the most remote from the East Coast of the large gainers (2,000 miles or 3,250 kilometers from Tianjin, near Beijing).
  • Other interior fast growers were Changsha, capital of Hunan (12th, with 46 percent growth), ;  Chengdu, the capital of Sichuan ranked 13th, with 46 percent growth and Hohhot, capital of Nei Mongol (Inner Mongolia), ranked 15th, with a growth rate of 41 percent.


Hefei


Zhengzhou

Central Coast: Xiamen (photo), one of the first special economic zones designated after Shenzhen and placing 2nd in growth, added 72 percent to its population. This metropolitan area is centered on an island in Fujian province on China's central coast, less than 10 miles from to Jinmen (Quemoy), an island controlled by Taiwan. Fuzhou, the capital of Fujian province was another central coastal metropolitan area among the top 20 growth centers (18th, at 38 percent). The average growth rate of these metropolitan areas on the central coast was 55 percent.


Xiamen

Yangtze River Delta: Like the interior, the Yangtze River (Changjiang) Delta also placed six metropolitan areas among the top 20 growth centers. The average growth rate was 52 percent. The Yangtze River Delta is a large area with a population greater than that of the Pearl River Delta, but with urban regions that are separated from one another by considerable rural territory (unlike the Pearl River Delta). The exception is the Shanghai-Suzhou-Wuxi corridor (Note), where the urbanization is continuous in limited corridors.

  • Suzhou (Photo), part of which (Kunshan qu) abuts Shanghai ranked as the third fastest growing metropolitan area, with a growth rate of 65 percent. Suzhou added 1.6 million people and is nearing 4.1 million. As the growth of Shanghai continues to spill westward and northward, Suzhou is likely to continue its strong growth.
  • The other three top 10 metropolitan growth areas in the Yangtze River Delta were in the province of Zhejiang, including Wenzhou at 5th, growing 59 percent (Photo), Ningbo, one of the nation's largest ports was 6th, at 59 percent and Hangzhou, the provincial capital, which Marco Polo claimed was the largest city in the world in his Travels was 10th, at 47 percent.
  • Shanghai, the nation's largest metropolitan area, placed 14th in growth, at 42 percent. Shanghai had the largest numeric growth, adding 6.6 million to its population, more people than live in Toronto.
  • Nanjing, the capital of Jiangsu province ranked 16th in growth, at 41 percent.


Suzhou


Wenzhou

Northern Coast: Five northern coastal metropolitan areas were among the top 20 metropolitan gainers, with an average growth rate of 42 percent.

  • Weifang, in the province of Shandong ranked 8th in growth, the highest rating among metropolitan areas in the northern coastal area. Weifang added 48 percent to its population.
  • Beijing ranked 12th in growth, at a 46 percent rate. Beijing's numeric growth was second only to Shanghai, at 6 million.
  • The other northern coastal growth centers were Shijiazhuang, the capital of Hebei (17th, at 41 percent) and 175 miles (280 kilometers), south of Beijing. Qingdao, of brewing fame ("Tsingtao" beer) ranked 19th, with a growth rate of 37 percent, while Tianjin, which is close enough to be Beijing's port, ranked 20th, with a growth rate of 36 percent.

Pearl River Delta: In contrast the Pearl River Delta, the home of so much urban growth over the past 30 years, placed only one metropolitan area among the top 20 growth centers, Shenzhen. Shenzhen placed 9th, with a growth rate of 48 percent. This is in stark contrast to 1990 to, when Shenzhen and adjacent Dongguan both more than doubled in population.

Missing Giants: Chongqing was not among the top growth centers. Chongqing has been routinely mischaracterized as China's largest metropolitan area (because of semantic confusion over the word "city"). Chongqing's metropolitan districts grew only 22 percent and the region (a provincial equivalent) lost population. Neighborhood rival Chengdu, capital of Sichuan province from which Chongqing was separated in 1996 more than doubled its growth rate. Manchuria, China's "Dongbei" (Northeast) also failed to place any areas among the fastest growing. Shenyang, the center of China's Rust Belt, grew less than 10 percent, though Harbin, capital of Helonjiang grew nearly 30 percent.

More Growth to Come: Despite an overall population that is just peaking, urban population growth is expected to be substantial. In addition to the 470 million people that have moved to urban areas since 1980, the United Nations projects that another 340 million people will be added to the urban areas by 2045 (after which a modest decline is expected). Over the same 35 years, China's rural population is expected to fall by 387 million (Figures 2 and 3). Where these new migrants move and how they make do will be among the most important urban stories of the next decade.


Wendell Cox is a Visiting Professor, Conservatoire National des Arts et Metiers, Paris and the author of “War on the Dream: How Anti-Sprawl Policy Threatens the Quality of Life”.

-------

Note: Includes Kunshan, part of the Suzhou metropolitan area, but a separate urban area (between the Suzhou urban area and the Shanghai urban area).

Top photo: Hefei: All photos by author.

Latin America’s Demographic Divergence

$
0
0

Increasingly, the debate over plummeting world birth rates is shifting to the developing world. This includes Latin America where on the whole rates are dropping quickly from 5.98 children per woman in 1960 to 2.20 children per woman in 2010.

Yet these aggregate numbers do not reflect the variation in birthrates between various Latin American countries. Even as countries such as Brazil, Argentina, and Mexico head to rates at or even below replacement rates, there remain extreme examples of both higher and lower rates throughout the region. The most extreme variation can be found in Cuba and Guatemala which respectively have the lowest and highest fertility rates in Latin America.

Cuba is estimated to have a current fertility rate of 1.47 children per woman, well below replacement level of 2.1 children per woman. This extremely low rate is not new to Cuba; rather, it reflects changing population dynamics that have been developing since the rise of communism on the island. The effects of low fertility have already begun to manifest themselves in the population of Cuba. For example, between 2005 and 2008, Cuba’s population actually decreased. Although it did increase slightly again from 2008 to 2011, the trend of decreasing population is projected to continue as time goes on.

Source: Oficina Nacional Estadística de Cuba

Cuba’s population by 2025 is supposed to be lower than its population 25 years earlier in 2000 (11,146,203 people in 2000 and only 11,134685 people 2025). Although this decrease of 110,000 people does not seem to be too much of an issue, it will have a severe effect on the country’s workforce and rapid aging. This rapid aging may also reflect the ubiquity of Cuba’s medical care system, which may allow for much of its population to live longer and healthier lives. Cuba’s life expectancy, 78.96 years at the time of birth, is much greater than other countries such as Guatemala and Bolivia, whose life expectancies are 70.83 and 66.27 respectively.

Source: Oficina Nacional Estadística de Cuba

In 100 years, the median age of the population of Cuba is predicted to more than double from its 1950 rate. Children compose a smaller and smaller proportion of the population while the adult population continues to grow.

Source: Comisión Económica para América Latina y el Caribe (CEPAL) División de Población (CELADE)

In this sense Cuba, although a relatively poor country with a Gross National Income per capita of $5,460 in 2008 has demographics more widely associated with far more affluent countries such as Japan, Germany, Italy and Spain. Sometime between 2015 and 2020, Cuban men and women aged 65 and older will outnumber the amount of children in the country, something that has never happened before. The mid 1960s to 1980s saw a major decrease in fertility rates in Cuba, which is shown in the graph above. From 1960 to about 1975 the percentage of children in the population was steady, but then it plummeted dramatically until the mid-1990s, which also saw a massive rise in the share of adults.

At the other Latin extreme stands  Guatemala, estimated to nearly double its population by 2050, from 14,740,000 in 2011 to 27,444,000 in 2050 (a growth of 86.2%). This is a staggering statistic considering the many issues already facing Guatemala. Guatemala has the highest fertility rate of any Latin American, beating out some of the poorest countries in the region. Its current fertility rate is 3.98 children per woman. This is nearly double the replacement level, which is quite divergent from Cuba’s fertility rate.  

Source: World Bank
Guatemala’s fertility rate has been steadily declining since 1960; it still has an extremely high fertility rate that is nearly double replacement level. This means that its population will continue to increase due to a large number of births; however, that is not the only reason for population growth in Guatemala. Like the general trend the world is experiencing, life expectancy in Guatemala is continuing to increase and will only increase more as time goes on.

As women have on average 3.98 children during their lifetime and the entire population begins to live longer and longer, a major increase in population will occur. Like Cubans, Guatemalans now have longer life expectancies than the world average.

Source: World Bank

Guatemala reflects a strange mix of underdevelopment and modernism, which together could drive the major population increase over the next 40 years. The underdevelopment keeps the fertility rate high, while the modernism is driving life expectancy upwards. While the fertility rate is decreasing, it will take a very long time for it drop below replacement level. Similarly, life expectancy will continue to increase until it begins to level off many decades into the future. Not only will its population be affected, but the structure of the population will change with time too.

Source: Comisión Económica para América Latina y el Caribe (CEPAL) División de Población (CELADE)

Ultimately, Guatemala has the healthier population trend. Cuba’s decreasing population will begin to pose major problems. Not only will the population continue to decrease, but the population will also continue to age. Causing significant strain on a government that already has some of the highest rates of social safety net spending. Looking at the average growth rates for Cuba and Guatemala, it seems that Guatemala may be on a healthier trajectory when it comes to population.

Source: World Bank

This is also expressed in the representation of birth and death rates per 1,000 people in the country. Guatemala has a general decrease of both factors over time, which is a fairly common trend in developing countries; however, Cuba has quite erratic behavior in its population’s manifestation of birth and death rates per 1,000 people.

Source: World Bank

Source: World Bank

The 1959 revolution in Cuba caused major shocks to the population both in terms of births and deaths. Immediately following the revolution in 1959, the death rate decreased, while the birth rate actually increased for a few years, only to drop drastically over the next 15 years or so. Cuba’s exceptional government structure – with its welfare state and poor economy – has caused a strange population phenomenon that does not occur in Latin Countries. Guatemala, in contrast, reflects a strange confluence of underdevelopment and modernism. It seems likely that Cuba will soon face a major fiscal and economic fallout from too low fertility while Guatemala will have a population explosion, with a whole different set of challenges.

Population and its dynamics fuel a constant policy debate in every country throughout the world. In Latin America, these divergent fertility rates will not only affect the region but also the world as a whole. Guatemala’s population trajectory could mean increased emigration from the country to the Northern Hemisphere, while Cuba’s population trajectory could mean a collapse of the system and a restructuring of the entire Cuban life. Overall, Latin America has many significant challenges that other regions in the world do not face, and it seems that the divergent population trajectories of different countries in Latin America will ultimately drive major social, political, and economic changes in the region.

Sam Schleier is a senior Peace Studies major and Latin American Studies minor at Chapman University in Orange, CA. He is originally from Phoenix, AZ.

Central America map by Bigstockphoto.com.

Vermont: The Cost of Joining the Gentry Class

$
0
0

There’s nothing particularly modern about traditional rural gentrification. The English roots of successful upper-middle-class urbanites retiring to newly acquired country estates with large houses and small livestock flocks are 18th century or older. Perhaps its earliest American example is Alexander Hamilton’s flight from below-Wall-Street-New York City to the Haarlem that was then the farm country of northern Manhattan Island. There, with wealth accumulated from professional career and governmental service, in 1802 he bought 32 acres of tiny Dutch farms and built his McMansion, “The Grange”, on a viewshed-surrounded hilltop where he could maintain (or not) connections with power and commerce a half-day’s coach travel to the south.

Modern rural gentrification differs somewhat from its academic definition, in that it is not exclusively enabled by the power of a passive-income economic base. It is, though, at least in the theoretical model of most of those who now practice it, a near-Jeffersonian mix of productive and profitable small-scale farming coupled with a remunerative non-farm occupation most typically in the information sector or the consulting professions, commuting to work electronically from a home office or physically on a convenience and client-driven schedule.

And there’s nothing particularly modern about gentrification’s economic clout. In both its urban and rural models, it is enabled by the newcomers’ advantages in wealth and skills, whereby they can readily afford to out-bid the locals for property and can equally readily cope with whatever regulatory barriers might be erected against their unwelcome (particularly in urban re-gentrification of down-scale neighborhoods) incursions. Particularly in recent academic (and sometimes polemical) studies of supposed violations of economic and social justice, much has been made of the new-comers’ ability and readiness to price the old-timers out of their former neighborhoods, although never (to Humble Scribe's knowledge, anyway) have there been accusations that take-overs of Georgetown, DC: Roxbury, Boston: Brooklyn Heights, NYC; or Darien Street, Philadelphia, intentionally raised the overall local “cost-of-stay” so as to, in the phrase used against realtors during the white-flight episodes of the ‘60’s, “use high-bid block-busting to stimulate old-timer departure”.

In contrast, there’s at least some evidence that the recent rural gentrification pattern in Vermont is partially connected with broad-based efforts to use a policy-based raising of the state-wide cost-of-stay in pursuit of a desired state-wide (limited and controlled) low-density and esthetically-nostalgic development pattern. The Vermont anomaly, if you will, is more than just the readiness of mostly-urban newcomers to buy into a rural/small-town state, their advantage based on above-average levels of wealth, past achievement, political skills, and business acumen. The pre-existing Green Mountain State taxation, regulatory, and general business climate, as shown in numerous state rankings and analyses, is exactly the motivating set of governmental and grass-roots forces typically responsible for the out-migration of just such folks from (perhaps more normal) states like California, Illinois, Maryland, or New Jersey. In those places, the same factors that are a draw in Vermont have been causally linked to just the opposite phenomenon: upper-middle-class exodus patterns.

Historically, in-migration of just such urbanites and suburbanites to a once-truly-rural Vermont goes back to the arrival, in the late Victorian decades, of railroad magnates like Billings (to Woodstock) and Webb (to Shelburne), but is more typically illustrated by a later generation, exemplified by the Depression-era “back-to-the-land” migration of Helen and Scott Nearing from the high-rise apartments of NYC to a small farm in Jamaica, Vermont, where they grew some green beans and wrote books about “living off the land” when not on the lecture circuit. The publishing royalties for such as “Living the Good Life,” 1954, were their major but unpublicized source of active income, and, as was unrevealed until a post-mortem biography, multi-million-dollar (in today’s currency) trust funds held by both were the major source of real passive income.

The wave of back-to-the-land immigrants changed Vermont’s demographics and politics irreversibly in the decades from 1960 on, changing a then-predominantly-rural/farm population of some 360,000 with near-zero natural increase to a predominantly-urban/jobs population of some 620,000, most having chosen to migrate in from the cities and suburbs of the East Coast megapoli to practice their own best approximations of the Nearing mix of small-scale ag, commercial enterprise, and trust-fund-check-in-the-mailbox economics ever since. Despite the pretense at making a living from the land, in economic reality the critical cash flow is pension or trust-fund-based.

That quibble notwithstanding, the socio-economics of rural gentrification haven’t changed significantly (except for average age) since the first communes and hippie-yuppie colonies sprang up across Vermont in the ‘60s. Then, their members were typically college kids taking a few years off between the undergrad and grad-school years to grow veggies organically and supposedly meet cash expenses by selling them in ad hoc farmers’ markets to locals who were already quite self-sufficient, thank you, as well as to dabble in non-farm activities ranging from sex to politics. By any sociological measure, these young adults were both wealthier (family, mostly) and more educated than the rural natives they came to live amongst. Today, the new rural gentrifiers are older but similarly well situated.

Those now selecting attractive rural counties and small towns where they can settle into the Nearing model choose places like Vermont, or like Virginia’s Shenandoah Valley, both attractively small enough (in the 9000 square mile range) to enable some degree of political control. If there’s a difference between Vermont and the others, it’s only that the 34000 square miles of Virginia, say, wouldn’t tolerate a state-wide raise-the-cost-of-stay as a keep-it-bucolic-and-nostalgic strategy. The Vermont incomers, having ascended to political power in a much smaller state, have indeed put in a range of policies — some covert, like raising housing costs while depressing business prospects via regulatory opacity, and some overt, like the present campaign to reduce power supplies by a third by shutting down the state’s only nuclear power generator — aimed at dissuading “growth” in favor of sustainability. A half-century earlier, Middlebury College environmentalist/advocate Douglas Burden explained it in terms of keeping the prices of residency high enough to dissuade middle-class residency, while using land use controls and similar devices to insure “keeping Vermont unattractive to additional people.” Those willing and able to pay the heightened cost-of-stay — the Vermont anomaly — would then enjoy their rarified bucolic/ nostalgic surroundings, as Charles, Murray writes, “…in a neighborhood filled with people as rich and smart as possible” much like themselves.

There’s one other aspect of the Vermont anomaly worth noting. Neither those in state government, having watched the advance of rural gentrification and now beginning to claim credit for it and offer various “project funding” vote-purchase devices, nor those actually practicing their own modified versions of “Five Acres and Independence” (the perennial USDA best-seller text for rural-gentry wannabe aspirants for over a century) have addressed the basic conceptual conflict between two ideologies dear to up-scale exurban hearts and minds.

One is “smart-growth”, which requires a small-house/small-lot in-town, walk-to-shopping trolley-to-work urban development pattern (think Portland OR), with no housing beyond the last water and sewer lines. The other is, of course, rural gentrification, which requires at least a few acres in the countryside to grow and sell veggies while using the home office to conduct electronic non-farm profitable business that actually pays for the family’s health care and the kids’ college as arugula and cilantro almost never can. It takes a certain amount of cognitive-dissonance skill to embrace both ideologies simultaneously, but, interestingly, most of the new rural gentry are up to that intellectual task. In simplified form, rural gentrification — the farmette in the country — is for them and their similarly-situated peers and neighbors; “smart-growth” is for everyone else, dissuading those of lesser standing who might otherwise actually presume to come in alongside them to raise their own few acres of apples (and generate crop-shipping truck noises which necessitated a Vermont Supreme Court challenge) and thereby spoil not only the early morning silence but the no-visible-farm-machinery viewshed. But, when smart-growth and rural gentrification finally meet on the field of political and legal combat, practitioners of the latter will be up to the challenge. George Mason Law School professor F. H. Buckley explains why and how:

“Burdensome tax and regulatory policies will be of relative advantage to the rich and powerful, who can employ specialists to work through the maze of rules that impose traps for unwary members of the middle class.” And he doesn’t even touch on Vermont’s own preferred-ten-acre-lot recent (post-‘60s and pre-smart-growth) history, the rural development policy of choice until a new ideology came along. That’s a whole ‘nother Vermont anomaly calling for a whole ‘nother commentary.

Flickr photo: Chard in the Montpelier, Vermont State House Garden, by Waldo Jaquith.

Martin Harris is a Princeton graduate in architecture and urban planning with a range of experience in fields ranging from urban renewal and air-industrial parks to the trajectory of small-town planning and zoning in states like Vermont.

It Can Happen Here: The Screwed Generation in Europe and America

$
0
0

In Madrid you see them on the streets, jobless, aimless, often bearing college degrees but working as cabbies, baristas, street performers, or—more often—not at all. In Spain as in Greece, nearly half of the adults under 25 don’t work.

Call them the screwed generation, the victims of expansive welfare states and the massive structural debt charged by their parents. In virtually every developed country, and increasingly in developing ones, they include not only the usual victims, the undereducated and recent immigrants, but also the college-educated.

Nowhere is this clearer than in the European Union’s Club Med of Spain, Greece, Portugal, and Italy, the focal point of the emerging new economic crisis. There’s a growing sense of hopelessness in these places, where debt is turning politics into an ugly choice between austerity, which reduces present opportunities, or renewed emphasis on public spending, which all but guarantees major problems in the bond market, and spending promises that can’t be kept.

“We don’t know what to do now,” Jaime, a Madrid waiter in his late 20s told me last week. “My wife lost her auditor’s job, and I can’t support the whole family. Maybe we have to move somewhere like Dubai or maybe Miami.”

Many young Greeks, Italians, Portuguese, and Spaniards already have made their moves, with a half million leaving Spain alone last year. But it’s not just Club Med youths who are contemplating greener pastures. Ireland, which in recent decades actually attracted new migrants, is exporting a thousand people a week. In recession-wracked Britain, nearly half of the population say they would like to move elsewhere.

Driving this exodus is a growing perception that this collapse is not cyclical but secular. Increasingly, young Europeans are deciding not to start families—the key to future growth—in reaction to the recession. The stories about divorced Spanish or Italian young fathers sleeping on the streets or in their cars are not exactly a strong advertising for parenthood.

Even in once-rigidly Catholic Spain, marriage and fertility rates have been falling for decades, and family structure weakening. Spaniards are having fewer children now than they did during the brutal civil war of the late 1930s. Alejandro Macarrón Larumbe, a Madrid-based management consultant, in his 2011 book, El Suicidio Demográfico de España, points out that the actual number of Spanish newborns has declined to an 18th-century level.

This demographic implosion makes sense given the legacy left behind by the boomers, who have held on to generous jobs and benefits but left little opportunity for their children, not to mention a high tax burden on what opportunities they do find. For a generation academics have sold higher education—the more the better—as the cure for unemployment and the great guarantor of success. Yet rising education rates in places like Spain have not created jobs for the rising generation, but only expanded unemployment and falling wages among the ranks of the educated.

Even America, traditionally a beneficiary of European woes, seems to have turned on its young. College debt is crushing many young people with degrees—particularly those outside the sciences and engineering—that are not easily marketable. The spiking number of people in their 30s working as unpaid interns reflects this erosion of opportunity. This has happened even as the price tag for college has shot up; 94 percent of students who earn a bachelor’s degree now owe money for their educations, compared to 45 percent two decades ago. Here’s a tribute to futility: today a majority of unemployed Americans age 25 and older attended college, something never before seen.

Governmental priorities here continue to favor boomers and seniors over the young. For a generation, transfer payments have favored the elderly, a trend likely to accelerate as the boomers continue retiring and demand their due. According to Brookings, America spends 2.4 times as much on the elderly as on children. 

Forced to take lower wages if they can find work at all and facing still-expensive housing in those markets where many of the jobs are, roughly one in five American adults 25 to 34 now live with their parents—almost double the percentage from 30 years ago. Increasingly both Wall Street and green “progressives” urge young people to abandon homeownership for a poorer, more crowded life in expensive, high-density apartment blocks.

Across the developed world, wages are being cut for young Americans, Europeans, and Japanese as politicians prefer to offer less to the young than to take anything away from those already ensconced in employment, particularly if organized into unions. In the U.S., everything from government jobs to employment in auto factories and even supermarkets is now on a two-tier track, with older workers’ guaranteed pensions and higher salaries not shared by newer hires.

Pensions represent a bigger generational issue than salaries do. The European welfare state makes America’s seem Scrooge-ish. Their lifetime guarantees are so extensive, and unsustainable, that even the über-frugal Germans are calling for a special tax on younger workers to fund their parents’ pensions.

This generational transfer will likely be accelerated by an aging electorate. In Spain, notes Larumbe, voters over 60 now make up more than 30 percent of the electorate, up from 22 percent in 1977; in 2050 they will constitute close to a majority. The same patterns can be seen in other European countries and, although less dramatically, in the U.S. as well.

As a result, boomer- and senior-dominated parties, both right and left, generally end up screwing young people. This occurs even as they proclaim their fulsome concern for “future generations.”

Politicians on the right, in Europe and elsewhere, scapegoat immigrants in part to hold on to their share of older votes. Left-wing analysts rightly point out that the boomer- and senior-dominated Tea Party here is not likely to cut their own entitlements, preferring instead to push cutbacks in education and other disbursements that aid the young while fighting spending on job creation and productive forms of infrastructure investment.

Politicians on the left, meanwhile, tend to favor redistribution and “sustainability” over the new wealth creation critical for youthful advancement. Many boomers seem to suspect economic growth itself, as when John Holdren, now President Obama’s senior science adviser, back in the 1970s called for the “de-development” of high-income countries. A cynic might conclude that since the progressive boomers already got theirs, it’s fine for the young to live in an era of limits.

With the kind of tax and regulatory regime advocated by today’s regressive progressives—already largely adopted in my home state of California—greens and their allies many not have to worry about too much new growth. Only those connected with the government, or able to ride asset inflation, will do well in the new “progressive” order.

In Europe, east Asia, and America alike, the left and the right have both proven unprepared or unwilling to address the fundamental growth crisis facing the next generation. Neither austerity nor a “progressive” focus on greater government spending and “sustainability” can create the jobs and new opportunities so sorely lacking on the streets of Athens and Madrid and increasingly in American cities as well.

The developed world’s youth shouldn’t expect much help from an older generation that has preserved its generous arrangements at the cost of increasingly stark prospects for its own progeny. Instead the emerging generation needs to push its own new agenda for economic growth and expanded opportunity.

Joel Kotkin is executive editor of NewGeography.com and is a distinguished presidential fellow in urban futures at Chapman University, and contributing editor to the City Journal in New York. He is author of The City: A Global History. His newest book is The Next Hundred Million: America in 2050, released in February, 2010.

This piece originally appeared in The Daily Beast.

Unemployed woman photo by BigStockPhoto.com.

The Atlanta Transportation Tax: Too Much for Too Little

$
0
0

On July 31, voters in a 10 counties of the 28 county Atlanta metropolitan area will vote on whether to raise the sales tax by one cent for $8 billion in transit and highway projects over 10 years. The measure is highly tilted towards transit spending. Sadly, this would do virtually nothing to reduce Atlanta's traffic or its travel times.

In a metropolitan area in which barely one percent of travel (Figure 1) and less than five percent of work trip travel is by transit, the tax measure devotes more than 50 percent of the funding to transit (Figure 2).   Yet in reality, the focus of any transportation revenue issue should be on reducing travel times, whether by transit or highways. This is how transportation improves an urban economy. The reality is that with nearly all travel by highways and transit's inherently slower travel times, much of the tax money would have virtually no impact on reducing travel times or traffic congestion.


Atlanta's Traffic Congestion: Promoters of the tax claim that the highway projects will reduce traffic congestion. Atlanta is well known for its serious traffic congestion. There are two reasons for this:

  1. Atlanta’s sparse freeway system is limited to little more than a belt route (I-275) and three radial freeways (I-20, I-75 and I-85) that converge into two in the one place more capacity is needed, the core. Trucks are not permitted on freeways inside the beltway, which concentrates the considerable interstate traffic on a single roadway, I-275. If Atlanta had the higher freeway density (freeway mileage per square mile) of Los Angeles or Minneapolis-St. Paul, traffic congestion would be far less of a problem.
  2. Atlanta's regional arterial (high capacity streets) system is virtually non-existent. For this reason, I proposed (in 2000) development of a one-mile terrain constrained grid of arterials. The Atlanta Regional Council (ARC), the local metropolitan planning organization, has included a somewhat more modest (but useful) arterial grid in is regional plan.

Yet despite its reputation, Atlanta's traffic congestion could be worse. The latest INRIX National Scorecard rates the Atlanta metropolitan area as having the 15th worst traffic congestion in the nation, behind Portland, which is nearly 60 percent smaller and twice as dense, with its compact city policies. Among high-income world metropolitan areas with more than 5 million population, only Nagoya outside the United States may have a shorter work trip travel time (Note 1). Atlanta's world-competitive work trip travel time of 29 minutes is faster than that of far more transit-dependent Toronto (33 minutes), smaller Sydney (34 minutes) and much smaller Vancouver (31 minutes), despite their compact city policies.

The Transit Projects: So Much for So Little: The proposed transit projects have virtually no potential to reduce work trip travel times and traffic congestion. Approximately one-fifth of the transit funding would be used to rehabilitate and upgrade the MARTA subway system, a need that should have been legitimately funded from the existing MARTA sales tax. Another nearly 20 percent of the transit funding would be spent on the "Belt-Line" streetcar project in central Atlanta. The role of the Belt-Line is more "city building" (read "real estate speculation") than it is transportation. It will do nothing to reduce work trip travel times. Further, it is exceedingly costly. The extravagance of this project is illustrated by an annualized capital cost alone (principally construction) high enough to pay the lease on a new mid-sized car for each new regular passenger (Note 2). Moreover, that is before the likely capital cost escalation and the substantial operating subsidies (Note 3).

Transit's problem in Atlanta (and elsewhere) lies outside its core downtown job market (Note 4). Most destinations in a metropolitan area cannot be reached by transit in a way remotely competitive with the car. The transit tax would only modestly increase transit ridership. ARC projects the transit projects will boost daily transit ridership less than 10 percent. If all of the forecast new passengers were to be taken from cars (which is not likely), the net reduction in traffic volumes over ten years would be equal to less than three months of traffic growth. Put another way, at the best, the transit proposals would mean that the traffic congestion expected on January 1, 2025 would not occur until March of 2025. That's less than 90 days of traffic relief for 10 years of taxation.

The Road Projects: In a metropolitan area in which personal mobility predominates, roadway improvements, such as expansions, an arterial grid in Atlanta's case and completion of the GA-DOT HOT (high occupancy toll) system provide far greater  potential for reducing travel times. There is another significant benefit to highway investments. As traffic speeds increase fuel efficiency improves and both air pollution and greenhouse gas emissions are reduced.

Under the tax referendum, a significant opportunity to improve mobility would be missed, to the detriment of the vast majority of Atlantans; over 88 percent of all commuters in Atlanta travel by car, but the figure is only slightly less (83 percent) among low income commuters (Figure 3).

What's Right About Atlanta: For all its problems, Atlanta has much to be proud of. Former World Bank principal planner Alain Bertaud said of Atlanta in a 2002 study:

While income and population were rising very fast, Atlanta managed to keep a very low cost of living. A worldwide cost of living survey conducted by the Economist Intelligence Unit in 2002 found that Atlanta had the lowest cost of living among major US cities and ranked 63rd among major cities around the world. This achievement is remarkable in view of the rapid rate of growth of the metropolitan area over the last 20 years. It shows that while demographic and economic growth has certainly contributed to generate pollution and congestion, the various actors responsible for the management of metropolitan Atlanta must have done a lot of things right. High income growth and high demographic growth combined with a low cost of living suggests that labor markets are functioning well and that housing does not encounter important supply bottlenecks (Note 5).

As successful as local land use policies have been in making Atlanta livable by making it affordable (the first principle of livability is affordability), local leaders need to start over with a proposal primarily designed to reduce traffic congestion, reduce travel times and grow the economy.

Politics Trumps Reducing Traffic Congestion: Traffic congestion is most effectively addressed by projects that reduce work trip travel times, since it is the concentration of work trips at peak hours that   causes the worst congestion. The long-suffering commuters of Atlanta would have been far better served by a program that selected projects based upon their effectiveness in reducing travel times. A simple cost per hour of delay measure would have been appropriate. Atlanta deserves a much better deal.

Wendell Cox is a Visiting Professor, Conservatoire National des Arts et Metiers, Paris and the author of “War on the Dream: How Anti-Sprawl Policy Threatens the Quality of Life.”

-----------------

Note 1: Based upon 109 metropolitan areas for which data is available. Japanese data is reported as median work trip travel time. Nagoya's median work trip travel time (27 minutes) is less than Atlanta's (29 minutes). The excessively long rail commute times of many Japanese commuters could make Nagoya's average work trip travel time as great or greater than Atlanta's. Dallas-Fort Worth has the shortest work trip travel time of any metropolitan area over 5 million population (and the lowest transit work trip market share)

Note 2: A team led by Oxford University professor Bengt Flyvbjerg found that passenger rail systems typically have cost overruns of 45 percent. If the average increase is experienced, the Belt-Line cost could escalate to $1 billion.

Note 3: The capital cost is discounted at 4 percent over 35 years, which equals more than $5,500 annually. A new Ford Fusion, Toyota Camry, Honda Accord or Nissan Altima could be leased for less than $5,000 annually, with no down payment, according to internet sources (such as http://www.leasecompare.com/)

Note 4: More than 93 percent of metropolitan Atlanta's employment is outside downtown (and Mid-Town). Downtown's share of employment declined from 2000 to 2009 (latest data available from the US Census Bureau, County Business Patterns).

Note 5: Atlanta was most affordable major metropolitan area in the US, UK, Canada, Australia, Ireland, New Zealand and Hong Kong in the 8th Annual Demographia International Housing Affordability Survey.

------

Photo: Atlanta Freeway (by author)

Facebook’s False Promise: STEM's Quieter Side Of Tech Offers More Upside For America

$
0
0

Facebook‘s botched IPO reflects not only the weakness of the stock market, but a systemic misunderstanding of where the true value of technology lies. A website that, due to superior funding and media hype, allows people to do what they were already doing — connecting on the Internet — does not inherently drive broad economic growth, even if it mints a few high-profile billionaires.

Of course Facebook is a social phenomenon that has affected how people live and interact, but its economic impact — and future level of profitability — is less than clear. This stands in sharp contrast to Apple‘s iTunes, which has become a new distribution platform for small software companies and musicians, not to mention the role of Amazon in the distribution of books and other products.

From the standpoint of economic development, it’s time to focus on the growing divergence between two different aspects of technology. One is largely an information sector that focuses on such things as information software (think Facebook or Google), publishing and entertainment. For most journalists and urban theoreticians, this is the “sexy” sector, particularly since it tends to employ people just like them: younger, products of elite college educations, often living in “hip and cool” places like San Francisco, Manhattan or west Los Angeles.

Then there’s a larger, less-heralded group of workers that my colleague Mark Schill at Praxis Strategy Group has focused on: those in STEM (science-, technology-, engineering- and mathematics-related) jobs. These workers perform technology work across a broad array of industries, including but not limited to computers, media and the Internet, representing some 5.3 million jobs in the nation’s 51 largest metropolitan areas. This compares to roughly 2.2 million jobs classified as in the information sector in these 51 regions.

These STEM occupations are about harnessing technology to improve productivity in mundane traditional industries and the service sector. STEM workers are as likely, if not more so, to be working for manufacturers, retailers or energy producers as for software firms. These workers epitomize the notion of technology, as the French sociologist Marcel Mauss once put it, as “a traditional action made effective.”

The information sector may be increasingly important, but it is STEM workers, working in a diverse set of industries (including information), who hold the broader hope for the U.S. economy. Over the past decade, the information sector has created many stars, but about as many flameouts. Overall information employment peaked in 2000 at 3.6 million jobs; by 2011 this number had dropped by almost a million. Things have not much improved even in the current “boom”; between February and May this year, the sector lost over 8,000 jobs.

Essentially the information sector has created a huge amount of churn, as the nature of its employment changes with shifts in technology. For example, the software sector within information has seen real growth, adding some 10,000 jobs the past two years, while other parts of the information sector have suffered significant drops. These include, sadly for aged scribblers, traditional publishing, such as newspapers and book publishing, which has gone from nearly 1 million jobs in 2002 to under 740,000 in May of this year.

With Facebook stock in the tank, and other major social media sites languishing, the current “boom” may prove among the shortest-lived in recent memory. Shares of less well-anchored companies — meaning those with only a vague outlook for long-term profits — such as Zynga and Groupon have fallen dramatically. The market for the next round of ultra-hyped IPOs also seems to be dissipating rapidly. The carnage has led at least one analyst to suggest Facebook’s fall could “destroy the U.S. economy.”

Fortunately the overall picture in technology is more hopeful than you’d understand from reading about social media startups. STEM employment has grown 3% over the past two years, more than twice the national average. In the 51 largest metros areas, 150,000 STEM jobs were added from 2009 through 2011. More important still, this reflects a long-term pattern: Over the past decade, STEM employment — despite a drop during the recession — expanded 5.4%.

These two different classifications underpin geographical differences between and within regions. Sometimes the “hot” areas don’t look so great when it comes to actual job creation in these generally well-paying fields.

Silicon Valley’s social media boom, for example, may have propelled it once again, at least temporarily, into the ranks of the fastest-growing employment centers. Yet it’s not seeing the gains in STEM jobs that took place during earlier Valley booms in the ’80s or ’90s that were broader based, encompassing manufacturing and industry-oriented software. Indeed STEM employment in the Valley still has not recovered from the 2001 tech bust — the number of STEM jobs is down 12.6% from 10 years ago.


Metropolitan STEM Job Growth, Sorted by 10-year Growth
MSA Name 2001-2011 Growth 2009-2011 Growth 2011 Concentration
Las Vegas-Paradise, NV 25.5% -3.4% 0.51
Washington-Arlington-Alexandria, DC-VA-MD-WV 20.8% 4.4% 2.16
San Antonio-New Braunfels, TX 20.1% 3.0% 0.82
Nashville-Davidson--Murfreesboro--Franklin, TN 18.5% 3.1% 0.74
Riverside-San Bernardino-Ontario, CA 18.3% -1.6% 0.55
Seattle-Tacoma-Bellevue, WA 18.1% 7.6% 1.95
Salt Lake City, UT 17.5% 4.5% 1.17
Jacksonville, FL 17.4% 3.0% 0.88
Baltimore-Towson, MD 17.2% 3.9% 1.36
Raleigh-Cary, NC 14.9% 1.4% 1.56
Houston-Sugar Land-Baytown, TX 14.3% 3.6% 1.25
Orlando-Kissimmee-Sanford, FL 14.2% -1.4% 0.90
San Diego-Carlsbad-San Marcos, CA 13.1% 6.5% 1.38
Austin-Round Rock-San Marcos, TX 8.8% 2.4% 1.75
Charlotte-Gastonia-Rock Hill, NC-SC 8.1% 2.1% 0.97
Columbus, OH 7.8% 3.8% 1.32
Buffalo-Niagara Falls, NY 7.7% 2.4% 0.96
Virginia Beach-Norfolk-Newport News, VA-NC 7.5% -3.1% 1.05
Miami-Fort Lauderdale-Pompano Beach, FL 7.5% 2.8% 0.73
Indianapolis-Carmel, IN 7.5% 1.2% 1.06
Oklahoma City, OK 7.3% 2.9% 0.89
Dallas-Fort Worth-Arlington, TX 6.2% 3.7% 1.21
Cincinnati-Middletown, OH-KY-IN 6.1% 4.6% 1.08
Sacramento--Arden-Arcade--Roseville, CA 6.0% -1.6% 1.19
Louisville/Jefferson County, KY-IN 5.6% 4.3% 0.77
Phoenix-Mesa-Glendale, AZ 5.4% 1.5% 1.00
Portland-Vancouver-Hillsboro, OR-WA 5.2% 4.2% 1.24
Atlanta-Sandy Springs-Marietta, GA 4.8% 4.3% 1.10
Denver-Aurora-Broomfield, CO 4.0% 2.8% 1.47
Richmond, VA 3.8% 0.4% 1.14
Providence-New Bedford-Fall River, RI-MA 3.6% 2.4% 0.90
Pittsburgh, PA 3.1% 3.6% 1.07
Hartford-West Hartford-East Hartford, CT 3.1% 1.2% 1.18
Minneapolis-St. Paul-Bloomington, MN-WI 2.6% 3.1% 1.37
Tampa-St. Petersburg-Clearwater, FL 2.4% 2.0% 0.88
Philadelphia-Camden-Wilmington, PA-NJ-DE-MD 2.2% 0.3% 1.19
Kansas City, MO-KS 1.9% -2.6% 1.15
New York-Northern New Jersey-Long Island, NY-NJ-PA 1.2% 2.9% 1.00
San Francisco-Oakland-Fremont, CA 0.8% 3.7% 1.60
Memphis, TN-MS-AR 0.0% 0.7% 0.56
Boston-Cambridge-Quincy, MA-NH 0.0% 4.8% 1.64
Los Angeles-Long Beach-Santa Ana, CA -2.2% 1.7% 0.98
Milwaukee-Waukesha-West Allis, WI -2.3% 0.2% 1.04
St. Louis, MO-IL -3.5% -1.4% 1.05
Birmingham-Hoover, AL -3.9% -3.4% 0.70
Cleveland-Elyria-Mentor, OH -4.9% 1.2% 0.93
Chicago-Joliet-Naperville, IL-IN-WI -5.2% 1.1% 0.96
New Orleans-Metairie-Kenner, LA -6.7% 3.6% 0.71
Rochester, NY -8.9% 2.1% 1.19
San Jose-Sunnyvale-Santa Clara, CA -12.6% 4.9% 3.09
Detroit-Warren-Livonia, MI -14.9% 8.8% 1.42
Total in Top 51 Regions 4.2% 3.0%


Data source: EMSI Complete Employment, 2012.1


Joel Kotkin is executive editor of NewGeography.com and is a distinguished presidential fellow in urban futures at Chapman University, and contributing editor to the City Journal in New York. He is author of The City: A Global History. His newest book is The Next Hundred Million: America in 2050, released in February, 2010.

This piece originally appeared in Forbes.

Computer engineer photo by BigStockPhoto.com.

How To Build a Culture of Bike Safety

$
0
0

As I've settled into life in Florida, I've found myself for the first time using a bicycle as a form of transportation instead of as a form of leisure activity. And, as an urban designer involved in a team that designs bicycle and pedestrian master plans, I've become increasingly aware of the factors that make urban bike use a feasible — or not so feasible — choice.

The Risk & Fear Factors: While I might actually be safe riding my bike down a neighborhood collector road on a dedicated bike lane, when I'm alongside two 10-foot lanes of traffic I do not feel safe. Therefore, I don't ride there. It's a question of perceived risk vs actual risk. As it turns out, I am not unique. Linda Baker in Scientific American has suggested that, when cycling, women are more adverse to risk than men.

The Gender Gap: Baker has also suggested that cycling to work impedes a woman's ability to conform to social norms, including makeup, dress, and hairstyles. That issue would be a big bite to chew, so I'll put aside addressing it here. But consider: While cycling has become a big grass roots movement through organizations like Pro Walk/ Pro Bike and The National Center for Bicycling and Walking, there is an enormous gender gap among users. Planner Jan Garrard states, “If you want to know if an urban environment supports cycling, you can forget about all the detailed ‘bikeability indexes’—just measure the proportion of cyclists who are female.” I personally can't remember the last time or if I've ever seen a woman on a bicycle on the Tampa streets.

Nearly all the new riders on US roads in the last 20 years have been men between the ages of 25 and 64. Taking into account the national demographics, this means that we are currently designing bike-friendly streets for a relatively small constituency.

How can we provide cycling options in a way that reaches out to more users?

The Infrastructure Factor: Substantially lowering the risk of cycling can be best accomplished through a change in infrastructure. Cycle tracks, like the one in New York City, are becoming more popular. Because of the complete physical separation from the threat of cars, all users perceive — and experience — a lower threat to their safety. The problem, besides the constant challenge of funding, is finding the right-of-way to accommodate bikes, especially in a car-centric culture like Florida. There has to be evidence of a high enough level of ridership to justify cutting out a lane from a congested street. It's a chicken and the egg conundrum: there is not the required ridership now because a majority of 50% of the population doesn't feel safe.

A good compromise might be to allow room for a physical separation between a one-way bike lane and car traffic. Creative use of medians and plantings, as in Denver, is one example of this. Simply placing parallel parking between car traffic and the bike lane is another.

The Get-More-Riders Factor: Building a bike culture is more than just infrastructure, but building appropriate spaces is an integral piece. As Billy Hattaway, a Florida DOT official pointed out to me, if we don't create bike lanes that cater to a larger part of the population we might lose the justification to have bike lanes at all.

At the Congress for the New Urbanism annual conference, Wesley Marshall showed evidence proving that the more cyclists there are, the more safe it is to bike. There is a belief by some transportation planning engineers that more cyclists and users in the road make it unsafe, but "safety in numbers" is true. It's partly because drivers are more aware of cyclists when they see them more often; they're on the lookout for them.

The Land Use Factor: People will only choose cycling as a mode of transportation if it is convenient and efficient. Ridership in parts of the city without mixed-uses and with low density will be low compared with more urban areas with many commercial/residential/institutional uses nearby and close together. Riding to a local grocery store to get a gallon of milk is realistic. Riding to a Wal-Mart for your weekly shopping is not. But Marshall's research showed that the biggest aspect of achieving bike safety is intersection density. The more intersections there were in a development, the safer it was for riders. At first thought this seems to go against common sense, because intersections are the sites of many crashes, but more connectivity = slower speeds = more awareness. Connectivity also allows for more mixed-uses and higher densities. Many cities put their resources into developing recreational cycling trails. While this is admirable, as a “wanna-be” cyclist, I'm a proponent of putting those funds into street design, instead. Putting the infrastructure on routes where people go in their everyday lives will lead to the biggest increase in ridership.

A lot of factors need to come together to increase ridership and bridge the gender gap in cycling. I'm someone who would love to ditch my car in favor of my bike on my daily commute, but risk aversion holds me back. Providing a lane along the side of the road is not enough: we must examine the evidence and psychology behind riding in order to make it a real choice for the majority of the population. Otherwise, we will find ourselves losing the justification to provide cycling options at all.

Erin Chantry is an Urban Designer in the Urban Design and Community Planning Service Team with Tindale-Oliver & Associates. She is also the author of the blog At the Helm of the Public Realm.

Photo: Protected / Separated bicycle lane on Dunsmuir Street, downtown Vancouver, Canada, by Paul Krueger


America's Two Economies

$
0
0

Surely you’ve seen it in your own neck of the woods: great contrasts between prosperity and wealth on the one hand, and hardship and despair on the other. I have certainly seen it in every place I have been over the last four years. FDR described the Great Depression as “one-third of a nation ill-housed, ill-clad, ill-nourished.” Yet do we not today have one-third of a nation either unemployed, underemployed, underwater on their one greatest asset (their homes), in crushing debt (which I define as unserviceable from current income), insolvent/bankrupt, on food stamps, unemployment or disability payments, or otherwise dependent on government? The diminishing of the middle class is daunting, but most disturbing is the diminishing of its prospects.

Perhaps you attribute this state of affairs to the “rich get richer, poor get poorer” meme. But there’s something else, something more going on. I have written about this before (unraveling, stagnation, middle America, middle class is the future), but here bring a fuller picture.

In the years since the Great Recession started (and ended?) in 2008-2009, the US has been characterized by two economies. One of these American economies is thriving, as are the economic actors part of it. The other economy is miserable, as are its inhabitants. The divergence between these two economies is growing more pronounced. Why is this so, how did it happen, and what does it portend?

I have been debunking the “rich get richer, poor get poorer” theme for 30 years, maintaining that the relative income gap did not matter as long as absolute income growth was widespread, and economic growth was providing opportunities to all (which was the case). But now those caveats have come into play: middle-income, middle-class earnings, wealth and opportunities are under immense pressure. This is not because the rich get richer, or that redistribution is the answer (I find the debate over austerity vs. growth pretty stupid, when growth too often just means growth of government). It is because of fundamental, structural economic trends which may be with us for a long time to come.

Divergent Sectors, Divergent Fortunes
Perhaps you have heard of the manufacturing “renaissance” in America and the exporting “boom.” Both are true. American exports are booming, measuring in at about $180 billion each month (up from $140 per month two years ago). Exports account for about 14% of GDP, and are growing about 16% a year. American manufacturing employment has been hurt by globalization, but manufacturing output continues to grow and exporters are thriving.

American manufacturing and export prowess are likely to continue into the foreseeable future, as large American companies use innovation and technology to become more productive, and as the growing global middle class demands more American goods (including energy in the form of oil and natural gas).

The bad news is that exports and manufacturing do not translate into more jobs or even higher wages. Our new job growth has been in health care, education, services and government, areas that do not produce great income and wealth. This holds down the potential income gains of all wage-earning Americans.

But the income and potential of those in management, finance, high technology and the professions are not adversely affected. The benefits of productivity, manufacturing, exports and economic dynamism generally, therefore, accrue to the already well-situated capitalists, managers and properly skilled. Sure, the internet will continue to make it easier for many small businesses to survive (and some even to thrive), but they cannot be great founts of sustainable jobs.

Two-tiered economies are well-known and expected in developing countries – an export/manufacturing or raw material sector and a weak domestic service sector – but we’re not used to seeing it in an advanced, technologically sophisticated country like the United States. It actually could mean that the rich will get richer, but the economy will be missing its traditional ladder for those in the middle and below to climb.

Where will enough employment growth come from to maintain the middle class? Many analysts tell us it will come from the innovation sector, or the innovation economy. But again, the benefits of innovation seem now to accrue to the companies and individuals   already in a position to exploit it, increasing productivity and profitability without a concomitant increase in employees.

Dystopian Economics
This is getting perverse, isn’t it? We have high unemployment and underemployment, huge debts and deficits, but companies are profitable and share prices continue to rise. There seems to have been a breakdown in the correlation between employment and GDP, between the housing market and overall economic strength, and between GDP growth and stock market valuations.

Statistics say we are in a low-inflation environment, but living expenses seem to be rising for food, energy, healthcare and education (the things on which the middle class must spend). Those with jobs and income in sectors that are doing well don’t seem to be as affected. That would certainly help explain the contrasts of wealth and hardship that one sees around the country.

In other words, what we seem to have created is a winners-take-all economy. Large companies with global exposure, highly skilled workers, and high net worth individuals are the main beneficiaries of current economic policy. Job creation, most small businesses, and low- and medium-end housing are not.

What if a rising tide no longer lifts all boats?
We now have the lowest percentage of Americans working or looking for work in 30 years. That really is devastating because the only way out of our fiscal and entitlement nightmare is to have more people working more hours and more years. Is the opposite our future?

The trends that are creating and sustaining two economies in the US have been building for years and seem to me to be so strong as perhaps impervious to amelioration. The “two economies model” meets my test of sustainability: being supported and reinforced by other fundamental social, demographic, political and technological trends (or at least not being incompatible with them). It is hard to foresee how the “two economies model” can be reversed or even tempered, though it is a path that will leave tens of millions of Americans behind even as the “working” economy improves.

I have been analyzing, writing and speaking on trends for 30 years. My audiences are often businesses or organizations looking for a picture of the future environment. I usually get a laugh from the observation that the future will be bright for some, dismal for others, and therefore recommend being in the first group. I don’t think I’ll make that joke anymore; somehow it’s no longer funny.

Dr. Roger Selbert is a trend analyst, researcher, writer and speaker. Growth Strategies is his newsletter on economic, social and demographic trends. Roger is economic analyst, North American representative and Principal for the US Consumer Demand Index, a monthly survey of American households’ buying intentions.

Finding a job photo by Bigstockphoto.com.

From California to Canberra, the Real Class War

$
0
0

Just under a year before she crawled over Kevin Rudd to claim the Prime Minister’s office, Julia Gillard visited the United States in her then capacity as Australia’s Education Minister. Her stay in Los Angeles took in the Technical and Trades College, where she brushed up on the teaching of “green skills,” a subject close to her heart. “Here in Los Angeles," she told the media that day, “under the leadership of Governor Schwarzenegger, this is a state that is looking to the future; this is a state that is leading on climate change adaption; and this is a state that’s leading on green skills and I’ve seen that on display today at this college.”

The date was 5 October 2009. As far as dud forecasts go, these platitudes don’t match Lincoln Steffens on the Soviet Union – “I’ve seen the future and it works” – but they’re bad enough. Today Schwarzenegger has gone, his reputation in tatters, and California, reduced to issuing IOU’s to pay its bills, teeters on the brink of bankruptcy.

Australians have long seen California as a trend-setter, given the common Anglophone culture and semi-arid climate on the Pacific Rim. There’s also the shared love of motor car mobility and suburban independence, and a voracious appetite for tech and entertainment products pouring out of Hollywood and Silicon Valley. But these days the Golden State is just as likely to fill Australians with unease. They find themselves infected with a strain of the green-welfare-utopianism that brought California to its knees.  

Sure, this doesn’t show up in official statistics; at least not yet. Gillard and Treasurer Wayne Swan never tire of reminding Australians they are “the envy of the world”: unemployment at 4.9 per cent, GDP growth of 3 percent (or more) this financial year, government debt to GDP ratio of just 23 percent and a projected budget surplus in 2013. In April, the IMF predicted that Australia would be the best performing advanced economy over the coming two years. The government and its allies in the elite media are hyper-vigilant about containing discussion of the nation’s affairs within this bounteous frame.

It’s hard to reconcile Australia’s position with the plight of California, which routinely attracts phrases like “basket case.” Unemployment is running at around 11per cent, significantly above the national US average of 8.2 percent, and Governor Jerry Brown is struggling with an intractable budget deficit of around $US20 billion. Thousands of teachers and other public servants are being laid off, and revenue imposts are driving businesses to other states. One commentator went so far as to say “California’s situation is in some ways more worrisome than Greece’s,” since it represents 14 per cent of the American economy, while Greece only accounts for 2 per cent of the EU.

But if any of this is supposed to make Australians feel good about their lot, it doesn’t. However benign the headline figures look, they’re in a restive mood. The Westpac-Melbourne Institute index of consumer sentiment continues to languish in negative territory, and the latest Roy Morgan Monthly Business Confidence Survey recorded a 57 percent fall in businesses which believe “Australia will have good economic conditions in the next 12 months”. Astonishingly, the recent Boston Consulting Group consumer sentiment survey found that Australians feel less financially secure than the average European, even less secure than Spaniards, whose economy is in meltdown.

Nor is much love flowing to Gillard and Swan. Stuck in opinion-poll hell – support for the government has been around 30 percent for over a year – they would be thrown out in a landslide if an election were held today.  

Why are Australians so low when their economy is so high? The chattering classes are in a funk over this conundrum. People should be showering this fine progressive government with praise, they insist. In patronising tones so familiar around inner Sydney and Melbourne, one columnist scribbled “we are, as a nation, chucking a full-on, all-screaming, all-door slamming teenager temper tantrum … Maybe it’s time we grew up and realised how good we’ve got it.” Others suggest more sober explanations.

Topping the list is Gillard’s absurd $23 a tonne carbon tax, effective from 1 July this year. Most pundits are loath to concede that, in international terms, the measure is quite radical and Gillard only embraced it to appease the Greens. From the comfort of their armchairs, they dismiss fears about the tax as irrational. After all, Treasury modelling indicates that the effect on growth will be minuscule and, under the government’s package, households will be over-compensated for cost of living increases. If only the Opposition would drop its inflammatory attacks, they maintain, the pessimism would disappear.

Some blame the negative wealth-effect of sliding house prices and shrinking superannuation funds, battered by stock market volatility.  

No doubt, such factors do contribute to the malaise, along with loss of faith in a parliament hit by financial and sexual scandals implicating the Speaker and a Labor MP. But opinion-makers who refuse to look beyond the headline figures are concealing the larger story. Across a range of traditional industries, workers grasp that the economy is shifting in directions that could erode the foundations of their mobility and independence. Understanding more than they are given credit for, they fear that the current Labor Government, beholden to Greens and academic elites, and hiding behind stodgy rhetoric, is driving or exploiting those shifts. The most visible manifestations of this are the carbon tax and other green agendas.

These workers have cause to be worried, if they glance across the Pacific. In his close analysis of the California crisis, US demographer Joel Kotkin starts with the premise that “California consolidated itself as a bastion of modern progressivism.” Drawing on extensive evidence, Kotkin exposes the suffocating influence of radical environmentalists, progressive high-tech venture capitalists, Hollywood moguls, and civil rights attorneys, who have given California escalating energy costs – 50 per cent above the US average and rising – and dwindling fossil-fuel energy exploration and production, America’s sixth highest tax rates, also rising, coupled with proposals to skew the tax system in favour of the super-rich against microbusinesses, the third heaviest tax burden on business out of the 50 states, enormous subsidies and tax breaks for solar and other renewable-energy producers, and complex labour laws.

“California’s green policies”, says Kotkin, “affect the very industries – manufacturing, home construction, warehousing, and agribusiness – that have traditionally employed middle and working class residents”. With reason, Kotkin calls these developments The New Class Warfare. There is indeed a class dimension to discontent in the United States and Australia, and it has nothing to do with the confected class-war rhetoric coming out of the Obama Administration – “we must all pay our fair share” – and the Gillard Government –“spreading the benefits of the [mining] boom”.  

John Black, a demographic profiler and former senator, points out that since Labor came to power in 2007, “public administration, education, and health sector jobs have accounted for almost six out of ten of the 760,000 jobs created, instead of the longer term two out of ten.” The health industry alone has grown by 260,000 jobs in four years, a figure that equates to some 2.6 per cent of the whole workforce. Over those years, manufacturing, which accounts for 8.3 of total employment, lost close to 100,000 jobs.

Last year, “health care and social assistance” replaced “retail trade” as the largest occupational category profiled by the Australian Bureau of Statistics, while “manufacturing” along with “agriculture, forestry and fishing”, traditional blue-collar hubs, were the only categories to contract. "Education and training" and "public administration and safety" ranked higher than "transport, postal and warehousing" and "wholesale trade".

Job-shedding by a succession of manufacturing, retail and construction firms has dominated recent news bulletins. According to Black, if not for growth in the publicly-funded sector, the employment rate would be closer to 7 than 5 percent.

If Gillard and Swan are to be believed, such shifts are beyond their control. In a major address on the economy in February, Gillard explained that “the level of the dollar – and the pace of its rise – has broken some business models and forced economic restructuring”. Displaying Marie Antoinette levels of indifference, she declared “these are powerful, economy-wide transformations, perhaps best thought of as ‘growing pains’.” If you thought this posed a complex challenge, think again. “The equation is simple,” she said, “skills brings jobs, and skills bring job security.”

Here Gillard genuflects to the progressive dogma that education is the answer to every economic problem. It’s hardly surprising that a movement dominated by academics, researchers, educators and university administrators should claim ownership of the path to salvation. But Gillard has it back-to-front. In activities like manufacturing, economic growth brings jobs, which bring skills, not the other way around.

It’s true that the mining boom and Australia’s safe credit rating have driven the dollar to near or above parity with the greenback. It’s also true that this has exerted pressures on the export and import-competing sector. But government action has intensified these pressures. Labor is ideologically committed to social gentrification and expansion of the white-collar professional classes, particularly in social services, even if this means transferring resources from productive industries that will slow down, stagnate, shrink or vanish.

While Gillard and Swan would never be so candid, their allies in Australia’s bulging university system, the public sector unions and the Greens aren't so inhibited. Nor are Labor figures like former Prime Minister Paul Keating, who criticised the Opposition’s attack on the carbon tax in these startling terms:

… in this country, 80 per cent of people work in the tertiary economy, in services, in the industry like – as we are tonight, in the service economy. And, the new industries, the green industries, are service industries, not the old manufacturing. Manufacturing’s moved to the east [meaning East Asia]. It’s the service industries that are the new growth industries. So, to turn your back on the mechanism which allocates the capital out of the old industries and into the new ones is to turn your back on the future.

If Gillard Labor cared about blue-collar and other routine jobs, not to mention the small business sector, they would switch to policy settings that spur growth in industries like manufacturing, retail, transportation and logistics, construction and forestry. Cutting spending, reducing company and other business taxes, junking green taxes and green tape, withdrawing from the debt market and liberalising industrial relations would hand employers more flexibility to cope with the high dollar and low cost competitors in Asia.

Clearly, this isn’t the government’s priority. Instead they have introduced a carbon tax and a mining tax, and in last month’s budget dropped a proposed cut in company tax, they are throwing at least $2.7 billion at various green schemes, not including the “winner picking” $10 billion Clean Energy Fund, they have adopted a Renewable Energy Target of 20 per cent by 2020, they are pouring vast sums of money into higher education to the tune of $5 billion a year including an additional $5.2 billion in the budget, some of which will find its way into a maze of “sustainability institutes,” they have lifted the cap on university places and embarked on a radical plan to expand the proportion of 25 to 34 year olds with a bachelor’s degree to 40 per cent by 2025, they have re-regulated the labour market and imposed a system which, according to the chairman of BHP-Billiton, “is just not appropriate and doesn’t recognise today’s realities,” they have laid the groundwork for new multi-billion-dollar programs in aged, disability and mental health care, employing tens of thousands of new carers, and they have endorsed an industrial tribunal decision that boosts the pay of these workers by up to 65 percent.

California here we come.

John Muscat is a co-editor of The New City, where this piece first appeared.

Photo of Australian Parliament House by BigStockPhoto.com.

Is Perestroika Coming In California?

$
0
0

When Jerry Brown was elected governor for a third time in 2010, there was widespread hope that he would repair the state’s crumbling and dysfunctional political edifice. But instead of becoming a Californian Mikhail Gorbachev, he has turned out to be something more resembling Konstantin Chernenko or Yuri Andropov, an aged hegemon desperately trying to save a dying system.

As with the old party bosses in Russia, Brown’s distinct lack of courage has only worsened California’s lurch toward fiscal and economic disaster. Yet as the budget woes worsen, other Californians, including some Democrats, are beginning to recognize the need for perestroika in the Golden State. This was most evident in the overwhelming vote last week in two key cities, San Diego and San Jose, to reform public employee pensions, a huge reversal after decades of ever more expansive public union power in the state.

California’s “progressive” approach has been enshrined in what is essentially a one-party state that is almost Soviet in its rigidity and inability to adapt to changing conditions. With conservatives, most businesses and taxpayer advocates marginalized, California politics has become the plaything of three powerful interest groups: public-sector unions, the Bay Area/Silicon Valley elite and the greens. Their agendas, largely unrestrained by serious opposition, have brought this great state to its knees.

California’s ruling troika has been melded by a combination of self-interest and a common ideology. Their ruling tenets center on support for an ever more intrusive, and expensive, state apparatus; the need to turn California into an Ecotopian green state; and a shared belief that the “genius” of Silicon Valley can pay for all of this.

Now this world view is foundering on the rocks of economic reality. The Soviet Union armed itself to the teeth and sent cosmonauts into space while the public waited on line for toothpaste and sausages. Similarly, Californians suffer from a combination of high taxes and intrusive regulation coupled with a miserable education system — the state’s students now rank 47th in science achievement — and a rapidly deteriorating infrastructure.

The current recession has been particularly severe, continuing at a more acute level than in most states, including places like Florida and Arizona, which also suffered greatly from the housing bust. California now has the third highest unemployment rate in the U.S., beating out only its co-dependent evil twin Nevada and Rhode Island. At the same time, according to a recent Public Policy Institute of California study, inequality in the devoutly “progressive” state has been growing much faster than in the rest of the country.

The most auspicious sign of grassroots support for perestroika was last week’s smack down of public employee unions in San Jose and San Diego. For the first time in recent memory, the unions suffered a humiliating defeat — the measures passed by a margin greater than two to one — as voters endorsed deep reform of the pension burdens bringing these cities to the brink of bankruptcy. Backed by its Democratic mayor, Chuck Reed, San Jose’s measure B aims to reduce pension benefits for both future and current hires. Unsurprisingly, the public employee have threatened to sue.

This may precipitate what could become the California equivalent of a prairie fire. Like San Jose and San Diego, many other California cities are on the verge of bankruptcy. Union-dominated Los Angeles could be the next big domino to fall, according to the city’s own chief administrative office, and has been forced to boost its bonded indebtedness and cut back on critical infrastructure spending to stave off the inevitable.

As services drop and taxes rise — California’s already are among the nation’s highest — voters increasingly realize that one of the main problems is over-generous pensions for public sector workers. This is reflected in the sad reality that the state consistently competes with Illinois for the worst bond rating in the country. Most recently, the state upped its deficit estimate to $16 billion from a $9.2 billion estimate made just in January.

Brown could have used this mounting crisis to reveal his inner Gorbachev. But instead, he has so far chosen a classic Chernenko-Andropov muddle. He proposed a mild pension reform but could not persuade his own party — aware that vengeful the unions will be around long after the old man is gone — to consider it.

More recently, the governor showed his own inner Stalinist by jettisoning his original more modest tax increase proposal for a more radical teachers’ union measure that would raise California’s income tax to the highest in the nation.

Brown’s “millionaire’s” tax, as it is being marketed, starts with individuals making $250,000 or more. Right now it is still ahead in the polls but seems to be losing ground. Joel Fox, a longtime anti- tax activist, senses that people in the state — as evidenced by the San Jose and San Diego votes — are beginning to realize that the tax increases are designed primarily not to improve the schools, keep the parks open or pave the roads but simply to bolster public-sector pay and pensions.

This collective turning on of the civic light bulb comes at the same time that the primary economic delusion that has dominated progressive politics — the myth of the high-tech savior — has fallen into disrepute. Under Brown and his monumentally incompetent predecessor, Arnold Schwarzenegger, state officials maintained a belief that Silicon Valley’s money machine would be able to bail the state out of its budgetary morass.

In this context, the underwhelming performance of Facebook’s IPO last month takes on major political significance. Not only will there be fewer puerile billionaires to inflate the Valley real estate market and bankroll “progressive” candidates and causes, scores of hip wannabe start-ups suddenly may find themselves no longer the darlings of venture capital investors or the stock market. Like California’s budget itself, the social media boom is now looking like something of a fraud.

Another potential casualty of the weak economy could be the green drive to remake the state into a kind of Ecotopian paradise. This is evident in growing opposition to some of Brown’s most beloved initiatives, notably a fantastically expensive high-speed rail system. Sold in the euphoric progressive atmosphere of 2008, support has collapsed as the price tag has soared and the state’s grievous fiscal problems have worsened. The most recent LA Times poll currently finds nearly three in five California voters would like to see the project scrapped.

Once unassailable politically, the environmental community is fracturing between those thoroughly allied to rent-seeking capitalists and the Democratic Party and those still primarily concerned with preserving nature. The Sierra Club, for example, objects to Brown’s attempt to exempt the high-speed line from environmental review. Some Greens also object to Brown-supported projects like the massive tortoise-roasting solar farm planned for the Mojave Desert.

Both Brown and the Greens also have failed to deliver many of the much ballyhooed “green jobs” that they insisted their policies would produce. Instead they may soon have to confront an electorate increasingly skeptical about green fantasies and more concerned with a persistently under-performing economy.

Clearly, the conditions for a California perestroika are coming into place. Still missing is a coherent vision — from either Independents, centrist Democrats or Republicans — that can unite business, private-sector workers and taxpayers around a fiscally prudent, pro-economic growth agenda. Yet it’s clearly good news that , for the first time in a decade, there’s hope that the whole corrupt, failing California political edifice could come crashing down, providing a renewed hope for recovering the state’s former greatness.

Joel Kotkin is executive editor of NewGeography.com and is a distinguished presidential fellow in urban futures at Chapman University, and contributing editor to the City Journal in New York. He is author of The City: A Global History. His newest book is The Next Hundred Million: America in 2050, released in February, 2010.

This piece originally appeared in Forbes.

Jerry Brown photo by BigStockPhoto.com.

The Evolving Urban Form: Cairo

$
0
0

Cairo, Egypt's capital, has long had some of the highest neighborhood population densities in the world. In the 1960s it was reported that one neighborhood had a density of 353,000 people per square mile (136,000 per square kilometer). The most recent data from the Egypt's statistical authority (the Central Agency for Public Mobilisation and Statistics or CAPMAS) indicates that within the Cairo governate (the province in which the municipality of Cairo is located), the overall population density is 117,000 per square mile, or 45,000 per square kilometer. This means that urbanization in the Cairo governate is more than 1.5 times the population density of Manhattan (in New York city) and the ville de Paris.

In recent decades, government officials have undertaken a program to encourage people to decentralize their living and work arrangements, and to move to several new towns in the area.

Overall, the governates that comprise the Cairo metropolitan area have a population of approximately 20.5 million, according to a CAPMAS 2012 estimate. This is approximately the same size of metropolitan areas such as New York and Mexico City. The Cairo metropolitan area is comprised of three governates, which are principally urban, but which also contain millions living in rural areas:

The governate of Cairo (Al Qāhirah) is the largest of these jurisdictions. Parts of the Cairo governate and the Giza government would be considered in the urban core, but the political jurisdictions in Cairo do not lend themselves well to conventional core versus suburban designations (Note 1). The Cairo governate is located on the east bank of the Nile River, and spreads many kilometers, especially to the East and South. This area includes the Cairo international airport and Heliopolis, one of the most affluent areas in the Cairo metropolitan area. The governate of Cairo also includes "New Cairo," an attractive new town located in the southeastern quadrant. This area includes a number of university campuses, multi-story condominium buildings and detached housing. Eventually, New Cairo is expected to have 4,000,000 residents, though the new town is little more than a decade old and still has a modest population of approximately 125,000.


New Cairo: University

The governate of Giza (Al Jīzah) is located on the west bank of the Nile River and, in reality, constitutes a continuation of the urban core. Giza is home the Great Pyramids, which rise on a hill from the western urban fringe. Giza is also home to considerable informal housing development   much different than generally found in other megacities. Much of the development is high rise, with concrete block buildings rising seven and more stories from the streets. Generally, the streets are so narrow and irregular that they are not shown on local maps. The governate of Giza also includes the "6th of October" new town, located on the west side of the hills on which the Great Pyramids stand. Eventually, 6th of October is expected to have a population of 3,000,000, though it appears to be less than 500,000 today. The governate of Giza also includes the Sheihk Zayed new town. These new towns have commercial activities, multi-story condominiums and detached housing.


Sheikh Zayed: Detached Housing


Giza: Informal Housing

The governate of Kalyoubia (Al Qalyūbīyah) is located to the north of the Cairo and Giza governates. Unlike Cairo and Giza, Kalyoubia has a majority of its population living in rural areas. However, the continuous urbanization of Cairo stretches into the governate and includes more than 1.5 million people, much of it in the municipality of Shubrā al-Khaymah.

Slowing Growth: Like many of the developing world's megacities, Cairo has experienced its strongest growth in the half century after World War II. In 1937, the metropolitan area had a population of under 3 million. This more than doubled to 7 million by 1966, and again to 14 million by 1996.  From 1996 to 2012, the metropolitan area added 5.5 million people (Note 2). However, more recently, the growth rate has slowed considerably. Between 1996 and 2006, metropolitan Cairo added 28 percent to its population (an increase of more than 4,000,000). However the 2006 to 2012 rate would indicate that by 2016, Cairo is likely to add only 13 percent to its population (approximately 2,000,000 people).

While the governates of the Cairo metropolitan area do not lend themselves well to urban versus suburban population analysis, Cairo clearly has expanded geographically as it has added population. The more central governates of Cairo and Giza have continued to grow, however much of the growth has been in peripheral areas, such as New Cairo, 6th of October and the Helwan area, south of Cairo on the Nile (in the Cairo governate).

Where the Growth is Occurring: Even so, the governate of Cairo accounted for only 19 percent of the metropolitan area's growth from 2006 to 2012, down from 34 percent in the 1996 to 2006 period. The governate of Giza had the greatest growth between 2006 and 2012, at 47 percent of metropolitan growth, an increase from the 39 percent of 1996 to 2016. The governate of Kalyoubia accounted for 34 percent of the growth from 2006 to 2012, an increase from 26 percent between 1996 and 2016 (Figure 1).

Cairo's Physical Expansion: Even though the suburban versus core analysis is difficult to gauge from governate data, a paper by Mootaz Farid and Hatam Al Shafie of Cairo University contains depictions of the urban footprint from 1943 to 1982. In each of the depicted years, the continuous urbanization of Cairo covers only a miniscule share of the present urban footprint. Figure 2 provides an estimate of the urban footprint in 1968 compared to the 2012 urban footprint, indicating that much of the growth was on the periphery.

The Key to Decentralization: The key to making the new towns successful in attracting more residents lies with the dispersion of employment. There is a wealth of international experience to indicate that "self-sufficient" new towns really cannot be self sufficient if they are within commuting distance of the rest of the urban area. In the case of Cairo (as elsewhere) it will prove critical to ensure that there are substantial local employment opportunities for new town residents, although it is likely that a serious degree of self sufficiency may prove difficult to achieve.

Wendell Cox is a Visiting Professor, Conservatoire National des Arts et Metiers, Paris and the author of “War on the Dream: How Anti-Sprawl Policy Threatens the Quality of Life.”

Top Photograph: The Great Pyramid (Giza). All photos by author

------

Note 1: In the past decade there  have been reorganizations of governates in the Cairo metropolitan area. This article uses three present governates for all years.

Note 2: Earlier population data is from http://statoids.com/ueg.html.

Enterprising States 2012: Beating the New Normal and Policies that Produce

$
0
0

The following is an exerpt form a new report, Enterprising States, released this week by the U.S. Chamber of Commerce and National Chamber Foundation and written by Praxis Strategy Group and Joel Kotkin. Visit this site to download the full pdf version of the report, or check the interactive map to see how your state ranks in economic performance and in the five policy areas studied in the report. The full report include a case for the nation beating the "new normal" and lists of best-performing states by policy area, and an index to select the top 10 states likely to continue to grow.

Troubled by economic stagnancy and high unemployment, many pundits and policy makers are referring to the U.S. economic malaise as the “new normal,” claiming that we have reached both technological and economic plateaus. To be sure, the relative weakness of the current recovery – arguably the weakest in contemporary history – does support the “new normal” thesis.

Not everyone, or every state, accepts the notion of inevitable, slow growth and gradual decline. From the onset of the recession, some states have largely avoided the downturn. By the end of 2011, six states – North Dakota, Wyoming, Alaska, Utah, Texas, and Montana – showed more than 8% job growth over the past decade. Another 22 had shown some, although less robust, employment increases compared to 2001.

More important still, nearly every state enjoyed some overall private-sector job growth between January 2011 and January 2012. Most critically, growth has spread to many states hardest hit by the recession, including Michigan, California, and Florida. The strongest job growth continued to take place in other states, notably Louisiana, Oklahoma, Texas, Utah, and North Dakota.

The new geography of growth reflects many of the intrinsic strengths of the U.S. economy often missed by many policymakers and commentators. After a brief lapse, the country is already outperforming all its traditional high-income rivals in Europe, as well as Japan, as it has done for most of the past two decades. Key U.S. assets include surging agricultural and energy production, the general rebound in U.S.-based manufacturing, and unparalleled technological supremacy. The country remains attractive to both foreign investors and skilled immigrants.

For the U.S. to be successful, this new geography of growth needs to extend across the 50 states and expand for long enough to significantly lower the high rate of unemployment. This will require something more than a single-sector focus. Attention must be paid to both basic and advanced industries since innovation and technology growth alone cannot turn around most regions and states. 

More than anything, governments and business leaders need to appreciate how these sectors interact with each other. To be effective across all geographies, innovation must be applied to a broad array of industries, including but not limited to computers, media, and the Internet. Innovation and new technologies are also a means to unlock the productive potential of both mundane traditional industries and the service sector.

States striving to do well in this environment face many barriers to fostering economic growth and creating jobs. These barriers include the high level of debt in many states; a growing skills mismatch between the workforce and the jobs available within a state; and outdated regulations and taxes that serve as barriers to free enterprise.

Policies that Produce

In the ebb and flow of the global economy, states can no longer rely solely on strategies of keeping costs low and providing incentives to attract footloose, commodity-based branch plants or offices. Instead, states must create the right business climate that allows companies and entrepreneurs to create 21st century jobs. 

Dramatic changes in the scope and scale of the global economy have significantly altered the nature of foreign competition. Jobs are the new currency for leaders across the globe, and those who can create good jobs will own the future. With 95% of the world’s customers now living outside our borders, trade with other countries is a key part of our economy that will continue to be important long into the future. 

Businesses need a highly skilled workforce – which includes many workers with certificates or two-year degrees – that is able to perform the jobs of a 21st century economy. States that are able to get students involved in the STEM fields – science, technology, engineering, and math – will be the most competitive. 

Innovation, now the essential driving force for creating and sustaining economic opportunities, is much more multidisciplinary and global in scope than ever before. Innovation and market cycle times are much shorter and continue to accelerate. This makes it more important than ever that states provide the tools, support, and tax and regulatory environments for companies to continuously innovate without onerous delays and burdensome costs that put their entrepreneurs and businesses at a competitive disadvantage.

Enterprising States 2012 takes an in-depth look at the specific priorities, policies and programs of the 50 states. Generally, the states fostering economic growth and creating jobs today – and those most likely to grow in the next decade – are defined by the following broad policy approaches:

  • Parlaying their natural resources and historically competitive industry sectors into 21st century job-creating opportunities
  • Paying attention to and addressing their competitive weaknesses
  • Supporting their companies’ business development efforts to reach an expanding global marketplace
  • Creating a fertile environment and workforce for a technology-based and innovation-driven economy
  • Investing in infrastructure – digitally and physically engineered – that meets the operating requirements of business and connects businesses to markets and customers
  • Getting government, academia, and the private sector to collaborate effectively to make sure that more new ideas developed by companies and in research labs scale up into industries
  • Taking steps to make existing firms more productive and innovative, creating an environment in which new firms can emerge and thrive
  • Maintaining an affordable cost of living for middle-skilled and middle-class employees
  • Promoting education, workforce development and entrepreneurial mentoring to continually fill the talent pipeline
  • Fostering an enterprise-friendly business environment by cleaning up the DURT (delays, uncertainty, regulations, and taxes), modernizing government, and fixing deficiencies in the market that inhibit private-sector investment and entrepreneurial activity.

State policies and programs that most effectively promote job creation are rooted in market reality. This means building on the existing core industries and technological advantages of a state while pursuing opportunities in growing and emerging sectors. Building on and sustaining existing economic momentum remains a key means of guaranteeing success in the future.

Huge increases in food exports, domestic energy investment, a revived manufacturing sector, a burgeoning tech sector, vital demographics, and increased investment from abroad create a strong base for long-term secular recovery of the U.S. economy. Rather than facing a dismal future of the new normal, we may actually be on the cusp of a recovery that could become one of America’s finest moments. The key to making this work, for the states and the nation, lies in policies that promote broad-based, long-term economic growth.

Download the full report, or read the Enterprising States 2012 coverage at the National Chamber Foundation blog.

Praxis Strategy Group is an economic research, analysis, and strategic planning firm. Joel Kotkin is executive editor of NewGeography.com and author of The Next Hundred Million: America in 2050.

Viewing all 3795 articles
Browse latest View live


Latest Images