Quantcast
Channel: Newgeography.com - Economic, demographic, and political commentary about places
Viewing all 3792 articles
Browse latest View live

The New Class Warfare

$
0
0

Few states have offered the class warriors of Occupy Wall Street more enthusiastic support than California has. Before they overstayed their welcome and police began dispersing their camps, the Occupiers won official endorsements from city councils and mayors in Los Angeles, San Francisco, Oakland, Richmond, Irvine, Santa Rosa, and Santa Ana. Such is the extent to which modern-day “progressives” control the state’s politics.

But if those progressives really wanted to find the culprits responsible for the state’s widening class divide, they should have looked in a mirror. Over the past decade, as California consolidated itself as a bastion of modern progressivism, the state’s class chasm has widened considerably. To close the gap, California needs to embrace pro-growth policies, especially in the critical energy and industrial sectors—but it’s exactly those policies that the progressives most strongly oppose.

Even before the economic downturn, California was moving toward greater class inequality, but the Great Recession exacerbated the trend. From 2007 to 2010, according to a recent study by the liberal-leaning Public Policy Institute of California, income among families in the 10th percentile of earners plunged 21 percent. Nationwide, the figure was 14 percent. In the much wealthier 90th percentile of California earners, income fell far less sharply: 5 percent, only slightly more than the national 4 percent drop. Further, by 2010, the families in the 90th percentile had incomes 12 times higher than the incomes of families in the 10th—the highest ratio ever recorded in the state, and significantly higher than the national ratio.

It’s also worth noting that in 2010, the California 10th-percentile families were earning less than their counterparts in the rest of the United States—$15,000 versus $16,300—even though California’s cost of living was substantially higher. A more familiar statistic signaling California’s problems is its unemployment rate, which is now the nation’s second-highest, right after Nevada’s. Of the eight American metropolitan areas where the joblessness rate exceeds 15 percent, seven are in California, and most of them have substantial minority and working-class populations.

When California’s housing bubble popped, real-estate prices fell far more steeply than in less regulated markets, such as Texas. The drop hurt the working class in two ways: it took away a major part of their assets; and it destroyed the construction jobs important to many working-class, particularly Latino, families. The reliably left-leaning Center for the Continuing Study of the California Economy found that between 2005 and 2009, the state lost fully one-third of its construction jobs, compared with a 24 percent drop nationwide. California has also suffered disproportionate losses in its most productive blue-collar industries. Over the past ten years, more than 125,000 industrial jobs have evaporated, even as industrial growth has helped spark a recovery in many other states. The San Francisco metropolitan area lost 40 percent of its industrial positions during this period, the worst record of any large metro area in the country. In 2011, while the country was gaining 227,000 industrial jobs, California’s manufacturers were still stuck in reverse, losing 4,000.

Yet while the working and middle classes struggle, California’s most elite entrepreneurs and venture capitalists are thriving as never before. “We live in a bubble, and I don’t mean a tech bubble or a valuation bubble. I mean a bubble as in our own little world,” Google CEO Eric Schmidt recently told the San Francisco Chronicle. “And what a world it is. Companies can’t hire people fast enough. Young people can work hard and make a fortune. Homes hold their value.” Meanwhile, in nearby Oakland, the metropolitan region ranks dead last in job growth among the nation’s largest metro areas, according to a recent Forbes survey, and one in three children lives in poverty.

One reason for California’s widening class divide is that, for a decade or longer, the state’s progressives have fostered a tax environment that slows job creation, particularly for the middle and working classes. In 1994, California placed 35th in the Tax Foundation’s ranking of states with the lightest tax burdens on business; today, it has plummeted to 48th. Only New York and New Jersey have more onerous business-tax burdens. Local taxes and fees have made five California cities—San Francisco, Los Angeles, Beverly Hills, Santa Monica, and Culver City—among the nation’s 20 most expensive business environments, according to the Kosmont–Rose Institute Cost of Doing Business Survey.

Still more troubling to California employers is the state’s regulatory environment. California labor laws, a recent U.S. Chamber of Commerce study revealed, are among the most complex in the nation. The state has strict rules against noncompetition agreements, as well as an overtime regime that reduces flexibility: unlike other states, where overtime kicks in after 40 hours in a given week, California requires businesses to pay overtime to employees who have clocked more than eight hours a day. Rules for record-keeping and rest breaks are likewise more stringent than in other states. The labor code contains tough provisions on everything from discrimination to employee screening, the Chamber of Commerce study notes, and has created “a cottage industry of class actions” in the state. California’s legal climate is the fifth-worst in the nation, according to the Institute for Legal Reform; firms face far higher risks of nuisance and other lawsuits from employees than in most other places. In addition to these measures, California has imposed some of the most draconian environmental laws in the country, as we will see in a moment.

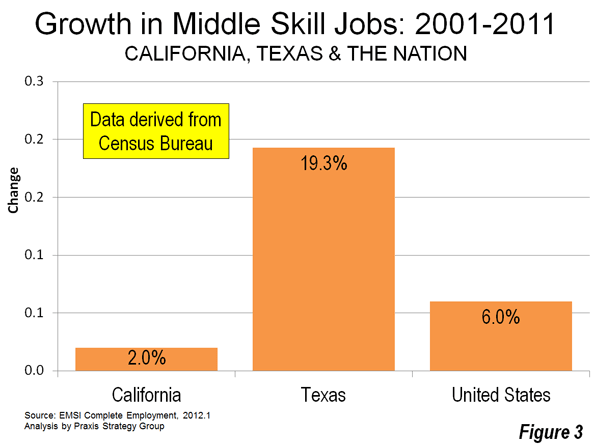
The impact of these regulations is not lost on business executives, including those considering new investments or expansions in California. A survey of 500 top CEOs by Chief Executive found that California had the worst business climate in the country, and the U.S. Chamber of Commerce calls California “a difficult environment for job creation.” Small wonder, then, that since 2001, California has accounted for just 1.9 percent of the country’s new investment in industrial facilities; in better times, between 1977 and 2000, it had grabbed 5.6 percent.

Officials, including Governor Jerry Brown, argue that California’s economy is so huge that it can afford to lose companies to other states. But for the local economy to be hurt, firms don’t have to leave entirely. Business consultant Joe Vranich, who maintains a website that tracks businesses that leave the state, points out that when California companies decide to expand, often they do so in other parts of the U.S. and abroad, not in their home environment. Further, Brown is too cavalier about the effects of businesses’ departure. As Vranich notes, many businesses leave California “quietly in the night,” generating few headlines but real job losses. He cites the low-key departure in 2010 of Thomas Brothers Maps, a century-old California firm, which transferred dozens of employees from its Irvine headquarters to Skokie, Illinois, and outsourced the rest of its jobs to Bangalore.

The list of companies leaving the state or shifting jobs elsewhere is extensive. It includes low-tech companies, such as Dunn Edwards Paints and fast-food operator CKE Restaurants, and high-tech ones, such as Acacia Research, Biocentric Energy Holdings, and eBay, which plans to create 1,000 new positions in Austin, Texas. Computer-security giant McAfee estimates that it saves 30 to 40 percent every time it hires outside California. Only 14 percent of the firm’s 6,500 employees remain in Silicon Valley, says CEO David DeWalt. The state’s small businesses, which account for the majority of employment, are harder to track, but a recent survey found that one in five didn’t expect to remain in business in California within the next three years.

Apologists for the current regime also claim that the state’s venture capitalists will fund and create new companies that will boost employment. It’s certainly true that in the past, California firms funded by venture capital tended to expand largely in California. But as Jack Stewart, president of the California Manufacturing and Technology Association, points out, a different dynamic is at work today: once a company’s start-up phase is over, it tends to move its middle-class jobs elsewhere, as the state’s shrinking fraction of the nation’s industrial investment indicates. “Sure, we are getting half of all the venture capital investment, but in the end, we have relatively small research and development firms only,” Stewart argues. “Once they have a product or go to scale, the firms move [employment] elsewhere. The other states end up getting most of the middle-class jobs.”

Radical environmentalism has been particularly responsible for driving wedges between California’s classes. Until fairly recently, as historian Kevin Starr says, California’s brand of progressivism involved spurring economic growth—particularly by building infrastructure—and encouraging broad social advancement. “What the progressives created,” Starr says, “was California as a middle-class utopia. The idea was if you wanted to be a nuclear physicist, a carpenter, or a cosmetologist, we would create the conditions to get you there.” By contrast, he says, today’s progressives regard with suspicion any growth that requires the use of land and natural resources. Where old-fashioned progressives embraced both conservation and the expansion of public parks, the new green movement advocates a reduced human “footprint” and opposes cars, “sprawl,” and even human reproduction.

The Bay Area has served as the incubator for the new green progressivism. The militant Friends of the Earth was founded in 1969 in San Francisco. Malthusian Paul Ehrlich, author of the sensationalist 1968 jeremiad The Population Bomb and mentor of President Obama’s current science advisor, John Holdren, built his career at Stanford. Today, more than 130 environmental activist groups make their headquarters in San Francisco, Berkeley, Oakland, and surrounding cities.

The environmentalist agenda emerged in full flower under nominally Republican governor Arnold Schwarzenegger, who initially cast himself as a Milton Friedman–loving neo-Reaganite. On his watch, California’s legislature in 2006 passed Assembly Bill 32, which, in order to cut greenhouse-gas emissions, imposes heavy fees on using carbon-based energy and severely restricts planning and development. One analysis of small-business impacts prepared by Sacramento State University economists indicates that AB 32 could strip about $181 billion per year, or nearly 10 percent, from the state’s economy. At the same time, land-use regulations connected to the climate-change legislation hinder expansion for firms.

Another business-hobbling mandate is the law requiring that 30 percent of California’s electricity be generated by “renewable” sources by 2020. The state’s electricity costs are already 50 percent above the national average and the fifth-highest in the nation—yet state policies make the construction of new oil- or gas-fired power plants all but impossible and offer massive subsidies for expensive, often unreliable, “renewable” energy. The renewable-fuel laws will simply boost electricity costs further. The cost of electricity from the new NRG solar-energy facility in central California, for instance, will be 50 percent higher than the cost of power from a newly built gas-powered facility, according to state officials. For providing this expensive service, NRG will pay no property taxes on its facilities. By some estimates, green mandates could force electricity prices to rise 5 to 7 percent annually through 2020.

The renewable-fuel regulations are driving even green jobs out of the state. Cereplast, a thriving El Segundo–based manufacturer of compostable plastic, last year moved its manufacturing operations to Indiana, where electricity costs are 70 percent lower. Fuel-cell firm Bing Energy cited cost and regulatory factors when announcing its move from California to Florida. “I just can’t imagine any corporation in their right mind would decide to set up in California right now,” the firm’s CFO, Dean Minardi, told the Inland Valley Daily Bulletin. Still more rules, aimed at improving water quality and protecting endangered species, could have a devastating effect on the construction and expansion of port facilities, which tend to sustain high-wage blue- and white-collar jobs.

The political class largely ignores the economic consequences of these policies. Indeed, Governor Brown and others insist that they will create jobs—upward of 500,000 of them—while establishing California as a green-energy leader. To turn Brown’s green dreams into reality, the state has approved enormous subsidies and tax breaks for solar and other renewable-energy producers to supplement those dispensed by the Obama administration. Yet for all this, California has barely 300,000 “green jobs,” many of which are low-wage positions, such as weather-stripping installers. And the solar industry, in California and abroad, is imploding.

Bill Watkins, head of the economic forecasting unit at California Lutheran University, notes that California’s green policies affect the very industries—manufacturing, home construction, warehousing, and agribusiness—that have traditionally employed middle- and working-class residents. “The middle-class economy is suffering since there is no real opposition to the environmental community,” says Watkins. “You see the Democrats, who should worry about blue-collar and middle-income jobs, give in every time.”

Progressives and many Occupy protesters mourned the death of high-tech innovator and multibillionaire Steve Jobs. They also tend to view social-networking firms like Facebook more as allies than as class enemies. This embrace of Silicon Valley is nearly as strange as the Occupy movement’s decision to target the ports of Los Angeles and Oakland—large employers of well-paid blue-collar workers. Activists portrayed the attempted port shutdowns as attempts to “disrupt the profits of the 1 percent,” but union workers largely saw them as impositions on their livelihood. As former San Francisco mayor and state assembly speaker Willie Brown wrote in the San Francisco Chronicle: “If the Occupy people really want to make a point about the 1 percent, then lay off Oakland and go for the real money down in Silicon Valley. The folks who work on the docks in Oakland or drive the trucks in and out of the port are all part of the 99 percent.”

The explanation for the progressives’ hypocritical friendliness to Silicon Valley is simple: money and politics. Venture capitalists and highly profitable, oligopolistic firms like Google (with its fleet of eight private jets) invest heavily in green companies; they were also among the primary bankrollers of the successful opposition to a 2010 ballot initiative aimed at reversing AB 32. The digital elite has become more and more involved in local politics, with executives from Facebook, Twitter, and gaming website Zynga contributing heavily to the recent campaign of San Francisco mayor Ed Lee, for example. Lee has, in turn, been extremely kind to the digerati, extending a payroll-tax break to Twitter and a stock-option break to Zynga and other firms that may soon go public.

Hollywood manages to outdo even Silicon Valley in its class hypocrisy. Former actor Schwarzenegger doesn’t let his green zealotry stop him from owning oversize houses and driving fuel-gorging cars. Canadian-born director James Cameron, who contents himself with a six-bedroom, $3.5 million, 8,300-square-foot Malibu mansion, talks about the need to “stop industrial growth” and applauds the idea of a permanent recession. “It’s so heretical to everybody trying to recover from a recession economy—‘we have to stimulate growth!’ ” says Cameron. “Well, yeah. Except that’s what’s gonna kill this planet.”

According to the Tax Foundation, California residents already pay the nation’s sixth-highest state tax rates, and they are likely to keep rising. Three tax-raising measures have already been proposed for the November 2012 ballot. Governor Brown’s proposal, which would boost both income and sales taxes, stands a good chance of passage. Hedge-fund manager Tom Steyer, an investor in environmental firms, has floated a measure that would raise taxes on out-of-state companies that conduct any operations in California and use some of the revenue to subsidize green-friendly building projects. And Molly Munger, a civil rights attorney and daughter of Warren Buffett’s longtime business partner, is pressing a measure to raise income taxes to fund schools. The so-called Think Long proposal, financed by nomadic French billionaire Nicolas Berggruen and overseen by a committee including Google’s Schmidt and billionaire philanthropist Eli Broad, proposes a mild cut in income-tax rates for the highest earners (like themselves) but new taxes on services provided by architects, accountants, business consultants, plumbers, gardeners, and others—the sole proprietors and microbusinesses that represent the one growing element in the state’s beleaguered private-sector middle class.

More money for social services or education might help alleviate some of the recession’s impact, but it cannot break the vicious cycle from which California currently suffers: weak growth leading to low tax revenues, government boosting taxes to make up the shortfall, and those higher taxes driving businesses and jobs away, resulting in continued weak growth. What California’s middle and working classes need above all is broad, private-sector job growth—and that, fortunately, is a goal still well within reach. The Golden State may be run stupidly, but it retains enormous assets: its position on the Pacific Rim, large numbers of aspiring immigrants, unparalleled creative industries, fertile land, and a treasure trove of natural resources.

The most promising opportunity is in the contentious area of fossil-fuel energy, a mainstay of the state’s economy since the turn of the twentieth century. California still ranks as the nation’s fourth-largest oil-producing state. Traditional energy has long provided good jobs; nationally, the industry pays an average annual salary of $100,000. And elsewhere, from the Great Plains to eastern Ohio, an oil and gas boom is driving growth.

But California has thus far excluded itself from the party. Even as production surges in other parts of the country, California companies like Occidental Petroleum report diminishing oil production. The drop-off proves, some environmentalists say, that “peak oil” has been reached, but the evidence shows otherwise: the last few years have seen a fourfold increase in applications for drilling permits in California, largely because of the discovery of the massive Monterey shale deposits—containing a potential 15 billion barrels of oil—and of an estimated 10 billion barrels near Bakersfield. The real reason for the reduced production is that California has rejected most of the drilling applications since 2008. “I asked Jerry Brown about why California cannot come to grips with its huge hydrocarbon reserves,” recalls John Hofmeister, former president of Shell Oil’s U.S. operations. “After all, this could turn around the state. He answered that this is not logic, it’s California. This is simply not going to happen here.”

The anti-fossil-fuel stance, according to the Los Angeles County Economic Development Corporation, has placed some $1 billion in investment and 6,000 jobs on hold. The sense of wasted opportunity can be palpable. If you travel to Santa Maria, a hardscrabble town near the Monterey formation, you pass empty industrial parks and small, decaying shopping centers. As economist Watkins put it at a recent conference there: “If you guys were in Texas, you’d all be rich.”

California doesn’t even need to abandon its progressive tradition to narrow the class divide. Homebuilding, manufacturing, and warehousing could expand if regulatory burdens other than those associated with fighting climate change were merely modified—not repealed, but relaxed sufficiently to make it possible to do business, put people to work, and make a profit. New energy production could take place under strict regulatory oversight. Future industrial and middle-class suburban development could be tied to practical energy-conservation measures, such as promoting home-based businesses and better building standards. California’s agriculture industry—currently thriving, thanks to exports—could be less burdened by the constant threat of water cutbacks and new groundwater regulations.

Even from an environmental perspective, increased industrial growth in California might be a good thing. The state’s benign climate allows it to consume fossil-fuel energy far more efficiently than most states do, to say nothing of developing countries such as China. Keeping industry and middle-class jobs here may constitute a more intelligent ecological position than the prevailing green absolutism.

More important still is that a pro-growth strategy could help reverse California’s current feudalization. The same Public Policy Institute of California study shows that during the last broad-based economic boom, between 1993 and 2001, the 10th percentile of earners enjoyed stronger income growth than earners in the higher percentiles did. The lesson, which progressives once understood, is that upward mobility is best served by a growing economy. If they fail to remember that all-important fact, the greens and their progressive allies may soon have to place the California dream on their list of endangered species.

This piece originally appeared in The City Journal.

Joel Kotkin is executive editor of NewGeography.com and is a distinguished presidential fellow in urban futures at Chapman University, and contributing editor to the City Journal in New York. He is author of The City: A Global History. His newest book is The Next Hundred Million: America in 2050, released in February, 2010.

Los Angeles aqueduct photo by BigStockPhoto.com.


Homebuilding Recovery: How CAD Stifles Solutions

$
0
0

The Recovery Blueprint is a multipart series on homebuilding. Part II addresses how a reliance on CAD software and a lack of collaboration stifle sustainable land development solutions.

The front cover of Engineering News-Record on March 12th, 2012 was about a technology survey conducted a few weeks earlier. Of 18 issues surveyed, the need for better software was mentioned most frequently. Under the heading "Software Shortfall - Better, Simpler, Cheaper", the editors noted that 'dissatisfaction with current products cuts across all responses,’ and labeled the area, 'Needs Improvement'.

Better Software: Until a few decades ago the development of the world was represented by a hand drawn plan. Computer Aided Drafting (CAD) did not exist. There was an intimacy between the design of buildings and the land development task at hand. Since the introduction of CAD, the typical American city has seen few technology changes in the ways that housing is designed. There is virtually no advancement in the design of land development that can be associated with this new era of software-enabled design. If anything, it could be argued that CAD technology resulted in worse design of the cities in which we dwell.

During a recent lunch with a prominent architect, he explained to me how easy it is to do multifamily design. Simply create one interior unit and one end unit, and then repeat with minor modifications for the first floor units. There was no mention on how to increase the views, or of perceived space (versus actual space), or of efficiencies that could help make everyday living better for the residents. Only that CAD made things so much faster and ‘easier’ for the architect.

Several software solutions companies boast in their literature about how the development of hundreds of lots can be generated in a minute. The attitude that technology is a tool for speed, instead of for quality, feeds complacency and dumbs down design to series of ‘typicals’ or ‘blocks’ that can be instantly duplicated.

CAD was intended as a drafting tool to serve hundreds of purposes within a multi-billion dollar software industry. To serve all industrial usages, CAD has become a ‘jack of all trades but master of none’. This is most apparent in land-based design, which requires calculations based upon coordinate geometry. CAD requires a separate data structure to perform these calculations. As an industry core technology, CAD compromises and limits land development design. To do land based calculations for environmental and economic reporting requires precision spatial analysis, and CAD technology fails to deliver. If CAD were a spatial platform there would be no need for a separate GIS technology (another industry problem) for analytical data.

CAD Saturation: The hand drafting tools used just a few decades ago simply do not exist today. In a saturated market, CAD companies must generate fees through updates, support and training. If these systems were easy (see above complaints) and quick to learn the support and training income would plummet. Thus, intentional complexity assures CAD an income stream for companies at the expense of limiting progress and stifling design advancements.

Pre-packaged software results in pre-packaged solutions. For example, imagine that an engineer schooled in the use of a particular software is given the task of designing a storm sewer on a 100-acre subdivision. To design and create the required drawings and reports for the multi-million dollar storm sewer system using add-on software to CAD, it might take only a day or so. A more natural alternative using surface flow is likely a viable option, potentially reducing infrastructure expense by tens of thousands, and in some cases millions, of dollars. However, there is no ‘button press’ for surface flow. If consulting fees are based upon a percentage of construction costs the situation becomes worse.

Many Architects intelligently use technology that is not possible through CAD. Some of these more intelligent software solutions have even been acquired by leading CAD companies. GIS (Geographic Information System) technology is generally based upon polygons, that is, a series of straight lines forming a shape. Typically, it's useless for precision engineering and surveying irregular, real-world sites.

Technology Inhibited Collaboration: Architects, engineers, surveyors and planners — the group of consultants that are given responsibility to design and produce plans for our world's growth — have been, historically, un-collaborative. Technology has done little to change this and foster collaboration.

Only a few decades ago, it was a given that hand drawn sketches would need to be calculated for construction. Today, a planner using CAD could ‘sketch’ thousands of inaccurate lines and arcs that look like a finished plan, but would be useless for engineering and surveying. Data transferred to the CAD system of an engineer or surveyor does not magically become accurate, and therefore usable. The way CAD has been utilized destroys collaboration instead of building it.

This isn't the fault of CAD technology, which actually can create precise drawings. The blame falls on those that teach its use. One way to build collaboration would be for schools in engineering, architecture, planning, and surveying to work on common projects, teaching the needs of each other in a way that reduces time and workload, allowing more time for better decision making.
Unsustainable Sustainability: It’s human nature to find comfort at a certain stage of equilibrium. What does this mean? We relent to the flow of everyday life. In the case of land development issues, methods and technology that go with the flow lead to an unsustainable path.

Those involved in the development industry, whether working for private or for public entities, know our growth is not sustainable. Instead of seeking better methods, we have reduced planning to either mindlessly automating design, or to creating stricter design models that promise progress by providing a better architectural façade.

Instead of being more efficient and reducing the physical elements required for development, we have added solutions that often increase installation and maintenance costs. An example is permeable paving, which is a wonderful idea: pavement that allows rainwater to pass into the ground, instead of running off the pavement's end and flooding the surrounding area. The problem is not the pavement, but the fact that the under layer supporting the paving must also be permeable. To do this is often prohibitively expensive. If it's not done properly, it traps water that can freeze (in colder climates) and then expand, and may not hold up to the weight of heavy loads.

Despite the promise of permeable pavement, design innovations that can reduce the volume of street surface by 30% or more without reducing functionality make more sense. Eliminating an excessive amount of street surface is an efficient solution that costs less to install and maintain than permeable pavement.

Funding Sources For Innovation: Would it be possible for someone to discover a way to create an affordable base for permeable pavement? Probably. There are hundreds of millions of dollars available from private foundations and government grants for solutions leading to sustainable growth. However, foundation grants fund only 501c non-profits. Should future solutions to development be tied only to non-profit or politically connected entities, or to private firms which may be more capable of innovation?

There is no technology that can create a better design; we can only create better designers. Instead of educating CAD users on how to automate design, we need to create a generation of designers who use technology to create wonderful neighborhoods instead of quick subdivision plans.

The consultant needs to concentrate on the best solution, not just the solution that is a mere button press away. Today, there is no excuse for creating designs that are not precise. Architects, engineers, planners, and surveyors need to learn to fulfill each other's basic needs. This would go a long way towards creating a new era of collaborative design.

Rick Harrison is President of Rick Harrison Site Design Studio and Neighborhood Innovations, LLC. He is author of Prefurbia: Reinventing The Suburbs From Disdainable To Sustainable and creator of Performance Planning System. His websites are rhsdplanning.com and pps-vr.com.

Flickr Photo: Designing tools by evrenozbilen.

2012 How We Pick the Best Cities For Job Growth

$
0
0

We seek to measure the robustness of a region’s growth both recently and over time. We look at all of the metropolitan statistical areas (MSAs) for which the Bureau of Labor Statistics reports monthly employment data. They are derived from three-month rolling averages of U.S. Bureau of Labor Statistics “state and area” unadjusted employment data reported from November 2000 to January 2012.

This year’s rankings use four measures of growth to rank all 398 metro areas for which full data sets were available from the past 10 years. “Large” areas include those with a current nonfarm employment base of at least 450,000 jobs. “Midsize” areas range from 150,000 to 450,000 jobs. “Small” areas have as many as 150,000 jobs. This year’s rankings reflect the current size of each MSA’s employment. Only one MSA, Lafayette, La., changed size categories, moving from the “Small” to “Midsize” category, so this year’s rankings can be directly compared to the 2011 rankings. In the instances where the analysis refers to changes in ranking order within the size categories, Lafayette, La., is reported as if it had been included in the “Midsize” category last year.

The index is calculated from a normalized, weighted summary of: 1) recent growth trend: the current and prior year’s employment growth rates, with the current year emphasized (two points); 2) mid-term growth: the average annual 2006-2011 growth rate (two points); 3) long-term trend and momentum: the sum of the 2006-2011 and 2000-2005 employment growth rates multiplied by the ratio of the 2000-2005 growth rate over the 2006-2011 growth rate (two points); and 4) current year growth (one point).

The data reflect the North American Industry Classification System categories, including total nonfarm employment, manufacturing, financial services, business and professional services, educational and health services, information, retail and wholesale trade, transportation and utilities, leisure and hospitality, and government.

The Best Cities for Jobs 2012

$
0
0

Throughout the brutal recession, one metropolitan area floated serenely above the carnage: Washington, D.C.  Buoyed by government spending, the local economy expanded 17% from 2007 to 2012. But for the first time in four years, the capital region has fallen out of the top 15 big cities in our annual survey of the best places for jobs, dropping to 16th place from fifth last year.

It’s a symptom of a significant and welcome shift in the weak U.S. economic recovery:  employment growth has moved away from the public sector to private businesses. In 2011, for the first time since before the recession, growth in private-sector employment outstripped the public sector. More than half (231) of the 398 metro areas we surveyed for our annual study of employment trends registered declines in government jobs, with public-sector employment dropping 0.9 percent overall. Meanwhile, private-sector employment expanded 1.4 percent.

Read about how we selected the 2012 Best Cities for Job Growth

Instead of government, the big drivers of growth now appear to be three basic sectors: energy, technology and, most welcome all, manufacturing. Energy-rich Texas cities dominate our list — the state has added some 200,000 generally high-paying oil and gas jobs over the past decade — but Texas is also leading in industrial job growth, technology and services. In first place in our ranking of the 65 largest metropolitan areas is Austin, which has logged strong growth in manufacturing,  technology-related employment and business services. Houston places second, Ft. Worth fourth, and Dallas-Plano-Irving sixth. Another energy capital, Oklahoma City, ranks 10th, while resurgent New Orleans-Metairie places 13th among the largest metro areas.

To determine the best cities for jobs, we ranked all 398 current metropolitan statistical areas based on employment data from the Bureau of Labor Statistics covering November 2000 through January 2012. Rankings are based on recent growth trends, mid-term growth, long-term growth and the region’s momentum. (Here is a detailed description of our methodology.) We also broke down rankings by size — small, medium and large — since regional economies differ markedly due to their scale.

The strong growth of the energy sector, and Texas, is even more evident in our overall ranking, which includes many small and medium-sized metropolitan areas. The top 10 fastest growers overall include such energy-centric places as No. 1 Odessa, Texas; second-place Midland, Texas;  Lafayette, La. (fourth place); Corpus Christi, Texas (sixth), San Angelo, Texas (seventh); and Casper, Wyo. (10th).

The shift from public to private can be seen in the falling rankings of many of the most government-dependent economies. Outside of Washington, D.C. (where federal employment actually has continued to grow), Bethesda-Rockville-Frederick, Md., took an even more dramatic tumble in our big city table,  dropping 34 places to No. 46.There were sizable relative declines in the rankings of many state capitals such as Springfield, Ill. and Madison, Wisc. College towns, which had previously done well in the face of the recession, have also moved sharply lower in our rankings, due to a combination of state budget cuts and better performance elsewhere. College Station, Texas, plummeted from fourth last year on our overall list to 167th; Fairbanks, Alaska, slid from 15th place to 165th, Corvallis, Ore., tumbled from 40th place to 203rd place; and Cedar Rapids, Iowa, dropped from 81st to 246th.

Budget constraints have also hurt military towns, which previously had been largely immune to the recession. Last year’s overall No. 1, Killeen-Ft. Hood, Texas, slid to 43rd place; Jacksonville, N.C., home to Camp Lejeune, fell to 102nd from 19th last year; and Lawton, Okla., home to Fort Sill, slipped to 274th from  No. 20 last year.

In addition to energy, the technology sector has been on a tear. After a decade of tepid growth and some years of job losses, Silicon Valley has blown itself another huge tech bubble, this time driven by the social media craze and a surge in private-equity investment. In the San Jose-Sunnyvale-Santa Clara metro area, the number of information sector jobs is up 36 percent over the past five years; this year the epicenter of Silicon Valley jumped 22 places to No. 5 among the 65 biggest metro areas. The social media boom has also been very good for the San Francisco-San Mateo-Redwood City area, which rocketed 16 places to a solid 17th this year.

But much of the tech growth in the country has continued to flow to more affordable regions less dependent on venture investment. At the head of the pack is Austin, where Apple recently announced a large expansion,  and Salt Lake City, No. 2 on our big cities list, which is a major destination for expansion for Silicon Valley firms such as Adobe, Twitter and  Electronic Arts. Other big players benefiting from the tech boom include seventh-place Raleigh-Cary, N.C., which has been a consistent top 15 performer for the past seven years; Seattle, which rose 18 places to 14th, and Denver at No. 15.

Perhaps most encouraging of all has been the expansion of the manufacturing sector. In 2011 manufacturing expanded at three time the rate of overall GDP, according to Mark Perry of the University of Michigan-Flint, and the sector added 425,000 jobs, also outpacing the national average.

As a result, the fortunes of some of America’s hardest-hit manufacturing regions are improving. Columbus, Ind., rose from 235th overall last year to No. 3 on our list this year.  Michigan is beginning to see some signs of new life: perennial cellar dweller Holland-Grand Haven rose a remarkable 202 places to 19th on the overall list. A slew of other Michigan cities rose more than 100 places, including Grand Rapids (64th place), Bay City (136th), Warren-Troy-Farmington Hills (199th), Muskegon-Norton Shores (219th), and Jackson (233th).  It is a glimmer of hope in a region that has lurked near the bottom of our Best Places rankings for as long as we have published it.

Another group of big cities that may be seeing light at the end of the tunnel are some of the metro areas hit hardest by the bursting of the housing bubble. Miami, Fla., which ranks 21st among the 65 largest metros, Tampa-St.Petersburg-Clearwater, Fla.  (33rd), Phoenix (45th), Riverside-San Bernardino, Calif. (50th), and even Las Vegas (56th) began to show some signs of new life this past year.

So amidst all the good news, which big cities are still doing badly, or even relatively worse? Sadly, many of the places still declining are located in our home state of California, including Los Angeles (59th place among the biggest metro areas), Sacramento (60th), and, and just across the Bay from Silicon Valley, Oakland (63rd). Only the old, and to date still not recovering,  industrial towns of Providence, R.I. (64th), and Birmingham-Hoover, Ala. (dead last at No. 65), did worse.  And the glad tidings in manufacturing have not touched all the Rust Belt cities: Camden, N.J. (57th), Newark, N.J. (58th), Cleveland, Ohio (61st), and Detroit (62nd) still feature prominently near the bottom.

Read about how we selected the 2012 Best Cities for Job Growth

This piece originally appeared in Forbes.

Joel Kotkin is executive editor of NewGeography.com and is a distinguished presidential fellow in urban futures at Chapman University, and contributing editor to the City Journal in New York. He is author of The City: A Global History. His newest book is The Next Hundred Million: America in 2050, released in February, 2010.

Michael Shires, Ph.D. is a professor at Pepperdine University School of Public Policy.

Austin photo by Bigstockphoto.com.

World Urban Areas Population and Density: A 2012 Update

$
0
0

The latest edition of Demographia World Urban Areas has just been released. The publication includes population estimates, urban land area estimates and urban densities for all nearly 850 identified urban areas in the world with a population of 500,000 or more. These urban areas account for approximately 48% of the world's urban population. Overall, data is provided for approximately 1500 urban areas, comprising approximately 1.9 billion people, or 52% of the world's urban population.

Urban areas (or urban agglomerations) are areas of continuous urban development within a metropolitan area (labor market area), and are the physical form of that constitutes the essence a city. Generally, urban areas can be identified by the lights one would see from an airplane at night or in a satellite photograph. Urban areas are not metropolitan areas, which represent the economic or functional form of a city. Urban areas are a component of metropolitan areas, the other component of which is non-urban or rural territory. A metropolitan area is the combination of the urban area(s) and rural areas, which together comprise the economic region or labor market (commute shed).

Over the last year, new census reports have become available in such nations as India, Indonesia, China, Canada, Bangladesh, the United States and South Korea. The new data has resulted in a number of ranking changes from before.

The Megacities: In 2012, 26 urban areas qualify as megacities (Rental Car Tours for 24 of the megacities are available), with populations of greater than 10 million people (Table). As has been the case for nearly six decades, Tokyo remains the largest urban area in the world, with approximately 37 million. New York, which Tokyo displaced in 1955, has fallen to seventh largest and has the lowest population density of any megacity, at 4600 per square mile or 1800 per square kilometer (Note 2). London, which New York displaced in the 1920s never became a megacity due to the imposition of its greenbelt. Instead urbanization leapfrogged into the exurbs of southeast England, where all of the London area's net population growth has occurred since World War II (London ranked third as late as 1960).  


Table 1          
LARGEST URBAN AREAS IN THE WORLD (MEGACITIES): Estimated 2012
(Over 10,000,000 Population)          
         
Rank Geography Urban Area Population Estimate Land Area: Square Miles Density Land Area: Km2 Density
1 Japan Tokyo-Yokohama 37,126,000 3,300 11,300 8,547 4,300
2 Indonesia Jakarta 26,063,000 1,075 24,200 2,784 9,400
3 South Korea Seoul-Incheon 22,547,000 835 27,000 2,163 10,400
4 India Delhi, DL-HR-UP 22,242,000 750 29,700 1,943 11,500
5 Philippines Manila 21,951,000 550 39,900 1,425 15,400
6 China Shanghai, SHG 20,860,000 1,350 15,500 3,497 6,000
7 United States New York, NY-NJ-CT 20,464,000 4,495 4,600 11,642 1,800
8 Brazil Sao Paulo 20,186,000 1,225 16,500 3,173 6,400
9 Mexico Mexico City 19,463,000 790 24,600 2,046 9,500
10 Egypt Cairo 17,816,000 660 27,000 1,709 10,400
11 China Beijing, BJ 17,311,000 1,350 12,800 3,497 5,000
12 Japan Osaka-Kobe-Kyoto 17,011,000 1,240 13,700 3,212 5,300
13 India Mumbai, MAH 16,910,000 211 80,100 546 30,900
14 China Guangzhou-Foshan, GD 16,827,000 1,225 13,700 3,173 5,300
15 Russia Moscow 15,512,000 1,700 9,100 4,403 3,500
16 Bangladesh Dhaka 15,414,000 134 115,000 347 44,400
17 United States Los Angeles, CA 14,900,000 2,432 6,100 6,299 2,400
18 India Kolkota, WB 14,374,000 465 30,900 1,204 11,900
19 Pakistan Karachi 14,198,000 300 47,300 777 18,300
20 Argentina Buenos Aires 13,639,000 1,020 13,400 2,642 5,200
21 Turkey Istanbul 13,576,000 540 25,100 1,399 9,700
22 Brazil Rio de Janeiro 12,043,000 780 15,400 2,020 6,000
23 China Shenzhen, GD 11,885,000 675 17,600 1,748 6,800
24 Nigeria Lagos 11,547,000 350 33,000 907 12,700
25 France Paris 10,755,000 1,098 9,800 2,844 3,800
26 Japan Nagoya 10,027,000 1,475 6,800 3,820 2,600


Jakarta (Jabotabek) has emerged as the world's second largest urban area, with a population of 26 million. This is a larger population than reported by the United Nations, since its estimates include little more than DKI Jakarta, the national capital district and beyond which urbanization stretches for a considerable distance. Continuing suburban growth in Seoul-Incheon secured that urban area a ranking of third, with approximately 22.5 million people. As was reported last year, new estimates indicate that Delhi has emerged as India's largest urban area, with a population of 22.2 million and a growth rate that should result in its passing Seoul-Inchon in a matter of a few years. Mumbai, which like Mexico City in the 1980s has often been promoted as being destined to become the largest urban area in the world, was passed by Delhi over the past decade and has become the second largest urban area in India.

Manila is ranked as the fifth largest urban area in the world, with 22.0 million people. In Manila, as in Jakarta, the population reported to the United Nations is far below that of the genuine urban area. The reported population is for the National Capital Region (popularly and misleadingly called "Metro Manila), which represents approximately one-half of the population of the urban area, which stretches into four additional provinces (Cavite, Laguna, Rizal and Batangas). If the population of the Washington urban area were reported in the same manner, it would be 600,000 – the population of the District of Columbia – rather than the 4.6 million indicated in the 2010 census for the entire urban area.

Los Angeles, until recent years one of the fastest growing urban areas in the world, has dropped to 17th largest in the world and seems destined to drop out of the top 20 in the next decade or two. Fast growing Karachi, Istanbul, Lagos and others could become larger than Los Angeles. Los Angeles reached its peak ranking of 6th largest in the world from 1965 through 1980 and entered the top ten by 1950.

Over the past decade, Paris became a megacity, reaching a population of 10.7 million. Paris has been Western Europe's fastest growing large urban area since World War II. All of its growth since 1921 has been in the suburbs, which stretch over more than 1,000 miles (2,600 square kilometers).  This is more land area than Houston's suburbs, but more densely populated. Since 1921, the historical core municipality (the ville de Paris) has dropped in population from 2.9 million to 2.2 million.

By world standards, the Paris urban area has grown slowly, having fallen from being the world's third largest in 1965 to its current ranking of 23rd. However, over the past census period, Paris added 600,000 residents, compared to less than 200,000 in the previous period, indicating a decline in out-migration and a higher natural population rate increase.

Urban Area Densities: Dhaka, the capital of Bangladesh grew strongly between 2001 and 2011 and is by far the most densely populated urban area in the world. Dhaka's density is estimated at 115,000 per square mile or 44,000 per square kilometer, with slum (informal dwelling) densities reported report up 4,210 per acre, or 2.7 million per square mile (1 million per square kilometer). At this density, all of the world's 3.7 billion urban residents could be accommodated in an area approximately equal to that of the Washington (DC-MD-VA) urban area. All of Dhaka's urban population of 15.4 million fits into a land area equal to that of the city (municipality) of Portland (population less than 600,000). Nonetheless, analysts have referred to this example of the ultimate of urban density to be "sprawling."

Among the urban areas with more than 2.5 million population, the second-most dense is Mumbai, at 80,100 per square mile or 30,900 per square kilometer. The most dense high income world urban area is Hong Kong, at 67,000 persons per square mile or 25,900 per square kilometer. Of course, Hong Kong's density is the result of an accident of history, which resulted in huge migration to the former British colony following World War II. Hong Kong is more than twice as dense as the second most dense high income world urban area, Busan, Korea. The smaller nearby, yet historically similar enclave of Macau (560,000) has an even higher density than Hong Kong, at 70,000 per square mile (27,000 per square kilometer).

Seven of the densest urban areas with more than 2.5 million population are on the Asian subcontinent. These include Dhaka and Chittagong in Bangladesh, Mumbai, Ahmedabad, Surat and Jaipur in India and Karachi, in Pakistan. Colombia has two of the densest, Bogota and Medellin. Hong Kong is the only high income nation urban area among the 10 densest (Figures 1 & 2).


The least dense urban areas with more than 2.5 million population are all in the United States. The least dense is Atlanta, with 1800 people per square mile or 700 per square kilometer. The second least dense is, perhaps surprisingly, Boston, despite its reputation for high density. Boston's population density is 2200 per square mile or 800 per square kilometer. Also, perhaps surprisingly, Philadelphia is the least dense urban area in the world with more than 5 million population, while Chicago is the least dense urban area of more than 7.5 million. The lower density of US urban areas is illustrated by the fact that Portland, with its reputation for higher density and densification planning, would have ranked 11th least dense, if it had reached the 2.5 million threshold used in this ranking.

Most Extensive Urban Areas: New York covers the most land area of any urban area at nearly 4500 square miles or 11,000 square kilometers. Tokyo covers 3300 square miles or 8500 kilometers. Chicago is the third most expansive urban area, at 2,600 square miles (6,900 square kilometers). Los Angeles, which has long been perceived as the most sprawling of world urban areas, ranks fifth, covering 2400 square miles or 6,300 square kilometers. Atlanta and Boston, the world's least dense major urban areas, rank 4th and 6th, covering 2,600 and 2,100 square miles respectively (6,900 square kilometers and 5,400 square kilometers).

The Continuing Exodus from Rural Areas: Around the world, people continue to seek the promise of better economic outcomes in urban areas. United Nations forecasts indicate that another 2.5 billion people will be added to urban areas by 2050, while rural areas (which contain all population not urban) will be reduced in population by 300 million. The world's urban population is expected to rise from today's nearly 53 percent to 67 percent. More than 90 percent of the urban growth is expected to be in less developed nations.

Wendell Cox is a Visiting Professor, Conservatoire National des Arts et Metiers, Paris and the author of “War on the Dream: How Anti-Sprawl Policy Threatens the Quality of Life”.

------

Note 1: Demographia World Urban Areas uses national census authority urban area population and land area data in the few nations designating urban areas on a basis generally consistent with that of the United States Census Bureau. Elsewhere, land area estimates are determined using satellite photography (Google Earth). Population estimates are also obtained from a variety of sources, such as United Nations data, where it is reflective of the urban area population (some data reported to the United Nations is for jurisdictions that are only a part of the urban area and in other cases, metropolitan area data is reported), estimates relying on a "build-up" of local authority data from national census authorities and other sources. Demographia combines some adjacent urban areas when they are contained within the same metropolitan area or consolidated area, such as in New York and Los Angeles (for a complete list see Demographia World Urban Areas). Also see: Urban Terms Defined.

Note 2: Exceptions: In some cases, continuous urbanization does not constitute a single urban area because they are not within a single labor market (metropolitan area). This can be the case within a nation, such as in the Pearl River Delta of China, where Shenzhen, Dongguan, Zhongshan, Jiangmen, Huizhou, Zhuhai, Guangzhou-Foshan and Hong Kong, which are separate labor markets. International borders (and the Hong Kong-Shenzhen border) also define separate urban areas if free movement of labor is not permitted. Thus Detroit and Windsor or San Diego and Tijuana are separate urban areas because free movement of labor is not permitted. On the other hand, treaties permit virtual free movement of labor between the French and Belgian sides of the Lille urban area and between the Swiss and French components of the Geneva urban area.

----

Photo: Recent migrants to Dhaka slum in NGO school (photo by author)

Australian Elections: A Comeback for Pro-growth Policy?

$
0
0

The latest local government elections in Queensland, along with the by election for former Premier Anna Bligh’s state seat of South Brisbane, may point to a fundamental shift in popular mood back in favour of growth and development. After many years of anti-growth policy paranoia, it’s a refreshing wind if it lasts.

Was the electoral storm that swept ‘Can Do’ Campbell Newman and the conservative LNP to power only a few weeks ago something more than a direct reaction to a failed state Labor government? Subsequent local government election results state-wide may point to a more fundamental shift in community attitude. Why? Because one month after a resounding rejection of the state government, voters once again lined up to sink the knife into incumbent mayoral candidates who have presided over needless bureaucracy, excessive red tape and anti-growth policies disguised in political or media spin.

Those who expected a bounce back to Labor from voters recognising the very large mandate of the new LNP state government were proven badly wrong. Even Labor’s stronghold state seat of South Brisbane, narrowly held by the former Premier at the last election, barely got over the line to Labor this time in a by election.

Is this a sign that anti-growth and anti development policies, manifesting themselves in all manner of precautionary principles, red tape and green tape and which effectively ground the Queensland economy to a standstill, are on the nose? Maybe it’s not just the Labor ‘brand’ but bad public policy per se which is being rejected.

The real economy – undisguised by the statistical support of the booming resources sector – has been suffering, with construction activity across the board falling to record lows, interstate migration and population growth slowing to record lows, and house prices and personal balance sheets under stress. Rising utility costs, partly or largely (depending on your view) driven by green-tinged policy settings, have hurt average families. New housing costs have risen and proven a barrier for a generation of young families wanting to enter the market without having to sacrifice everything in exchange for a mortgage they can’t afford. Overall, the people are clearly pissed off. And they showed it.

In Brisbane, Lord Mayor Quirk – a prominent anointee of ‘Can Do’ Campbell Newman - was returned with an increased majority. And elsewhere, pro-growth candidates replaced incumbents whose administrations had presided over growth in regulatory process with little by way of measureable outcomes. In Redlands, a reputedly notorious local authority in terms of its hostile attitude to growth and development, Mayor Melva Hobson was turfed out in favour of pro-growth candidate and new Mayor, Karen Williams, (Williams scoring 69% of the primary vote to Hobson’s 31%).

On the Gold Coast, pro-growth candidate and Chamber of Commerce President Tom Tait won resoundingly with 37% of the primary Mayoral vote. The next closest candidate was Eddie Saroff – a long serving Gold Coast Councillor and former Labor federal candidate, on 17.5%.

On the Sunshine Coast – another Council which became notorious for being difficult to deal with and consumed with red tape and pointless administrative process – the pro growth and pro business candidate Mark Jamieson (33%) scored more than double his nearest two rivals, each on 17%.

In Ipswich, popular Mayor Paul Pissale increased his majority, with almost 88% of the primary Mayoral vote. You would be hard pressed to find a more passionate, pro-growth and pro-development Mayor than Pissale, especially when it comes to his beloved Ipswich. This is a man who proudly proclaimed that he welcomed development and developers to his city.

In Cairns, another region fast developing a reputation for an economy strangled in anti-development red and green tape and excessive planning controls, prominent local business identity and pro growth candidate Bob Manning picked up 56% of the primary vote, well ahead of his nearest rival, the incumbent Val Schier on 20%.

The South Brisbane by-election result adds weight to the argument that this is part of a widespread and deep seated mood for change. Labor, in what is billed as a stronghold inner city seat, expected some solid bounce back as South Brisbane voters were encouraged not to give the LNP another seat in Parliament. They didn’t listen to the party line, and only one in three (33%) put the new Labor candidate Jackie Trad first. By contrast 38% of South Brisbane voters put LNP candidate Clem Grehan first. Labor had to survive on the preferences of the green vote, which drew 19.4% of the primary vote in that seat.

Now take these most recent results and put them back to back with what happened in the state election just over a month ago. The LNP picked up a staggering 50% of the primary vote state wide, giving them 78 of the 89 seats. Labor picked up just over one in four primary votes, at 26%. The Greens only picked up 7.5% - less than their result in the previous election. The Greens in fact were outpolled by Katter’s ‘Australia Party’ which scored 11.5% of primary votes state wide. (I’m not sure whether to describe Katter’s party as pro growth but its connections to pro development rural interests suggests it is).

That state election was a clear cut choice between a ‘Can Do’ Campbell Newman and a Labor machine which ran heavily on anti-development messages in its campaign, alleging that an LNP Government would be hostage to developers and hostile to the environment. There was no confusion in voter’s minds when they rejected the latter and firmly chose the former. You don’t get much more pro-growth than a candidate and a party which uses ‘Can Do’ as its rallying cry.

The point of all this is that the new political mandate for growth shouldn’t be dismissed as some isolated reaction to the past government’s failings. The community seem to be making their views clear: bring back growth, bring back economic prosperity, restore the state’s balance sheet and with it, restore some health to personal balance sheets. The anti-growth movement will never be silenced by majority views but hopefully in this clear message from the people, it will take a backseat and keep a low profile, for a while at least.

For Labor, aligning itself with anti-growth movements might prove even more damaging in the long run. Average workers on average wages left the Labor Party in Queensland in no doubt they were on the nose. It’s not just an issue of a damaged brand, and much more than a failed campaign strategy. If Labor stands in people’s minds as a party which objects to progress, which imposes punitive taxation on even humble endeavours, which is responsible for excessive intrusion of regulation into people’s lives, and which is hostage to fringe interest groups in a bid to win preference deals, it may be left in a political wilderness for a long time to come. Labor’s reconnection to working families and their values and interests is as surely the key to the revival of their fortunes, just as John Howard achieved and as Campbell Newman and a host of newly elected Mayors in Queensland have proven.

Ross Elliott has more than 20 years experience in property and public policy. His past roles have included stints in urban economics, national and state roles with the Property Council, and in destination marketing. He has written extensively on a range of public policy issues centering around urban issues, and continues to maintain his recreational interest in public policy through ongoing contributions such as this or via his monthly blog The Pulse.

Brisbane photo by Bigstockphoto.com.

Is Negative Population Growth Upon Us? Deaths Exceed Births in One Third of U.S. Counties

$
0
0

Population change has short run and long run effects. Short run effects include changes in fertility rates that can result from economic fluctuations. For example, during a recession, couples may delay having children until economic conditions improve.  Once job growth has begun and expectations rise, birthrates can increase The correlation is not perfect and other demographic factors could come into play.   

Yet it seems increasingly true that for a rapidly increasing portion of the American landscape, deaths will routinely exceed births. Indeed, total births in the USA peaked at 4,316,000 in 2007, before dropping in the last four years. Recently released provisional birth data by the CDC (Center for Disease Control) show that births in 2011 are preliminarily estimated to be 3,961,000, the lowest figure since 1999. Reviewing the data month by month, we seem to be experiencing continued downward momentum this year. With deaths hitting an all time high of 2,507,000 in 2011, the natural rate of increase for 2011 looks to have dropped to .0047 percent (slightly less than half a percent per year).

With the expectation that the world’s population will stabilize mid-century, eventually every country’s population – with few exceptions in Africa and elsewhere – will stop increasing. Deaths will exceed births in most countries, and future growth may become more a function of shifting migration patterns. 

This reality can already be seen in parts of the United States. In one third of the 3,141 counties deaths now exceed births. In the next nine years, the number of counties in this category will expand, which could result in a markedly lower population count in the 2020 census. In contrast, a number of counties continue to experience significant natural rate of increase, and a handful of places experience the triad of dynamic change: births exceeding deaths, immigration, and positive net migration from other parts of the USA.

The Census recently released population estimates for America’s 3,141 counties.  We can compare the estimates of July 1, 2011 with those of July 1, 2010, by visualizing a series of maps.

Map Figure One: Estimated Population by County as of July 1, 2011

The first map shows the distribution of population by county: revealing concentrations in the coastal areas, and lower population in the central regions. Los Angeles County, California had the most persons:9,889,056 persons; Kalawao County, Hawaii had the fewest: 90 persons.

Map Figure Two: Estimated Absolute Change in Population from July 1, 2010 to July 1, 2011

The second map shows the pattern of population change during one year.  A total of 1,494 counties lost population, or about 47% of America’s 3,143 counties. This number is an increase from the change from 2000-2010, where 1,103 counties lost population. As one third of counties are experiencing greater deaths than births, another twelve percent are experiencing losses due to net migration. The county that gained the most people from 2010 to 2011 was Harris County, Texas (Houston), which added 71,532 persons.  The county that lost the most people was Wayne County, Michigan (Detroit), with a decline of 13,150 persons.

Map Figure Three: Estimated Relative Change in Population from July 1, 2010 to July 1, 2011

The third map shows relative population change in the United States. This reveals  quite a varied landscape. Western North Dakota, experiencing rapid growth of its energy sector, is experiencing fast population growth, along with metropolitan counties in Texas, Colorado, North Carolina and Florida. The county with the fastest population growth is Loving County, Texas, in the rural and isolated West Texas panhandle,  with a 13.25% growth rate resulting from the population increasing from 83 to 94 persons.  The county with the fastest shrinking population is Roberts County, Texas, in the equally rural and isolated North Texas panhandle with a decline of -11.69%.  Counties with very small populations can be subject to rapid change due to the effects of migration.

Map Figure Four: Estimated Relative Births minus Deaths (Natural Rate of Absolute Population Change) from July 1, 2010 to July 1, 2011

The fourth map shows the landscape of births minus deaths, or natural change, without the effects of migration. In 2011, one third of counties, or 1,041 out of 3,143 have deaths exceeding births. At the same time, counties with positive natural change, or births exceeding deaths, are concentrated, with half of all net natural change occurring in only 61 counties. The county with the highest level of natural change is Los Angeles County, with a 74,813 natural increase. The county with the highest negative level is Pinellas, Florida (Tampa- St. Petersburg area), with a decrease of 3,037 persons.

Map Figure Five: Estimated Relative Births minus Deaths (Natural Rate of Relative Population Growth) from July 1, 2010 to July 1, 2011

The fifth map show relative natural rate of population change, and the extensive area of slow and negative natural population decrease.  Most of the Appalachian counties have deaths exceeding births, along with extensive areas in the Great Plains states and at least parts of all 48 lower states. Only Alaska and Hawaii have positive natural increase across all of their respective counties. The fastest growing natural population is in Northwest Arctic Borough, Alaska, growing at a rapid 2.53% per year.

Despite this expansive landscape of 1,041 counties that now have deaths exceeding births, and hundreds of counties approaching this status, there are 162 counties that exceed 1% growth per year, or are growing at about the global average rate. On the other hand, only 11 counties are declining faster than 1% a year, indicating that most of the impact is gradual.

Map Figure Six: Estimated Domestic Migration from July 1, 2010 to July 1, 2011

The sixth map shows domestic migration, or net moves from one county to another. The top 159 counties received a net of 1,000 domestic migrants or more, and these areas include Florida, the Front Range Counties of Colorado, and the major metropolitan counties of Texas.  Overall, 1,229 counties had positive domestic migration, while 1,914 counties had negative domestic migration. Hillsborough, Florida (Tampa area), had the highest positive migration with 22,963 net movers, while Los Angeles County, California had the greatest number of net leavers with a total of 55,146 net departing residents.

Map Figure Seven: Estimated International Migration from July 1, 2010 to July 1, 2011

The seventh map shows the coastal pattern of international migration.  International migration is most visible in California, Arizona and Nevada, and in a number of metropolitan areas including the Northeast and the Chicago area.  One-hundred and thirty- two counties experienced more than 1,000 immigrant arrivals, and these counties received 74 percent of immigrants, indicating that immigration is concentrated. On the other hand, immigration is also widespread, as all but 520 counties received one or more immigrants during the year.

The top county for international immigration was Los Angeles, California, with a total of 42,413 immigrants.  The next four counties were Miami-Dade, Florida, with 19,996; Harris, Texas (Houston), with 19,558, Cook, Illinois (Chicago) with 17,208 and Queens, New York with 15,949 immigrants.

Map Figure Eight: Estimated Net Migration (Combined International and Domestic) from July 1, 2010 to July 1, 2011

The eighth and final map shows the combined effect of domestic and international migration.  Net migration is positive in areas of the Southwest, Texas metropolitan areas and most of Florida. A total of 1,403 counties had positive net migration, while 1,740 counties experienced negative net migration. The top county in America for positive net migration was Miami-Dade county in Florida, with a net migration of 38,382 persons. The county with the highest negative net migration was Wayne County, Michigan, with a net migration rate of -19,580 persons.

Today one third of United States Counties appear to have entered the stage of zero population and perhaps even negative population growth, but only 31.4 million people or ten percent of the American population lives in these mostly rural counties. Given our concentration in metropolitan areas, the expansion to an ever larger group of counties might continue all the way up to about eightly percent of our land area, before the momentum of this effect manifests into the major population clusters. Fertility rates by race and Hispanic origin of the mother may play a role, but it should be noted that the Hispanic fertility rate has dropped from 2.53 in 2009 to 2.35 in 2010, and may have further declined in 2011. The impact of reduced immigration might also play a role in depressing population growth.

The first estimate of county population change, the period from July 1, 2010 to July 1, 2011, shows a mixed picture of dynamic activity; there are a set of counties still experiencing robust population growth, but a third and perhaps increasing number of counties undergoing negative natural population growth.  These changes can be compared with 2012 county estimates in a year from now, and we can look for the diffusion process associated with population slowdown to continue. We will update our maps as further information becomes available.

Ron McChesney is a Geographer with Three Scale Strategy and Research in Columbus, Ohio. Ron received a PhD in Geography at The Ohio State University in 2008.

Greg Overberg is a City and Regional Planner with Three Scale Strategy and Research in Columbus Ohio.  Greg received a MA in City and Regional Planning at The Ohio State University in 2011.

Sources:

Centers for Disease Control (CDC), 2012: Provisional monthly and 12-month ending number of live
births, deaths, and infant deaths and rates: United States, January 2010 – December 2011. Provisional
data from the National Vital Statistics System, National Center for Health Statistics.

Statistical Abstact of the United States, 2011. Table 78. Live Births, Deaths, Marriages and Divorces.

 US Census Bureau, 2011 County Total Population Estimates:
Web Site:  http://www.census.gov/popest/
Accessed April 30, 2012

US Census Bureau, 2000 and 2010 Census by County:
Web  Site: http://www.census.gov/popest/data/intercensal/county/county2010.html
Accessed April 30, 2012

The OECD Reviews Chicago

$
0
0

“Although still high in absolute terms, GDP and labor productivity growth rates are sluggish – both by US and international standards. The Chicago Tri-State metro-region’s contribution to national growth has slowed over the past decade and the region does not stand out as a top knowledge hub. Despite a dynamic and numerically large labor force, the region has experienced virtually no growth in the size of its prime working-age population and displays limited ability to attract and retain talent when compared to its US peers. More worrisome are the persistence of unemployment and the lack of sufficient job creation.” – OECD Territorial Review, The Chicago Tri-State Metropolitan Area

The Organization for Economic Cooperation and Development (OECD) is an international organization that has its roots in the administration of Marshall Plan aid to rebuild Europe after World War II. The OECD was invited by the Chicagoland Chamber of Commerce* to perform a “territorial review” of Chicago’s regional economy. I believe this is the first such review the OECD has ever undertaken in the United States. The results were released a couple months ago. Unfortunately, the OECD doesn’t make its reports available for free online, but the Chicagoland Chamber graciously sent me a copy. I did a read through of this inch-thick, 332-page report and wanted to share a few observations about it. As the quote at the top might indicate, this report, like Rahm Emanuel’s economic strategy, was fairly gloomy. My points will be topical and not an integrated narrative as I did not get to undertake as thorough a review as I might like.

Performing the Study Demonstrates the Challenge

The review focused on the Chicago metropolitan area, though frequently included the Milwaukee metro area as well. Wisconsin and Indiana were invited to participate in the project, which was notable given the city-centric nature of most civic development initiatives in Chicago and the fact that the lion’s share of the people and economic output are in Illinois. It’s a recognition of the need to think regionally. Wisconsin did participate, but Indiana declined. Explaining why, Indiana economic development chief Mitch Roob said, “We don’t do studies, we do deals.” Indiana also made it clear that it intended to differentiate itself from Illinois to attract jobs, and that luring jobs across the border from Illinois was a core plank in their economic development strategy. (Interestingly, as I’ve documented elsewhere, Indiana has rolled over and actually allowed Kentucky to financially exploit it on the other side of the state, so the behavior is not consistent).

Indiana Governor Mitch Daniels loves to criticize Northwest Indiana for not getting its act together. Indeed, much of that criticism is fully warranted and Daniels has spent enough time up there to get an up close and personal look at regional dysfunction. Nevertheless, NWI functions as part of the metro Chicago economy. Its success is ultimately tied to Chicagoland’s overall success, not luring jobs from a stagnated region across the border. Indiana may have a few huge gas stations and liquor stores right on the border, but you can’t build an economy on that. (From 2004-2011, Mitch Daniels term in office, Indiana has actually lost a greater percentage of its jobs than Illinois and the migration of people from Illinois to Indiana also slowed, so the “Illinoyned” strategy obviously isn’t working). Indiana should clearly have come to the table for this review.

The fact that Indiana wouldn’t even participate in a study just goes to show how difficult regional cooperation can be. In that regard, the undertaking of the OECD review itself shows the challenge facing the region. I should note that the report authors did a good job of trying to fairly include and represent Indiana despite the state government’s lack of participation.

Interesting Statistics

The OECD review amassed quite a bit of interesting statistical data on Chicago and puts them in the context of other major cities in the 34 countries that comprise in the OECD. I think that by itself made the review worth doing. I might suggest other cities take a look at this to determine if such a study would be relevant to them, particularly as international comparisons can be difficult to pull off.

This report is a goldmine of stats and there’s way too much to list here, but a few things that jumped out at me:

  • The OECD report benchmarked labor productivity, which is less commonly looked at in economic studies. Chicago’s is above average but growing more slowly than average.
  • Chicago has trailed the nation in job growth. Had Chicago simply matched the national average in job growth since 1990, the region would have 600,000 more jobs than it does today.
  • There was quite a bit of sectoral analysis of Chicago’s economy. In fact, they actually normalize the sectoral composition of Chicago’s economy when looking at job growth to see if its under performance in job growth was due to concentration in slow growing sectors – but it was not.
  • Chicago is known for having America’s second largest business district, but it ranks only fifth out of the top ten regions in America for the percentage of its jobs in the core city. Between 1960 and 1990, over 96% of new regional jobs were created outside downtown.
  • There were many other interesting statistics around labor force participation, mobility of educated labor, elderly dependency ratios, educational attainment, poverty, patents, the structure of governments, taxation, etc.

Excess High End Talent

According to the OECD, Chicago suffers from a skills mismatch in its workforce. This is not just true at the bottom end of the economy as might be expected, but also at the top end, where there is a surplus of highly skilled labor:

At the high end, there is a large pool of high-skilled, highly educated workers, in principle more than sufficient to fill the jobs available at that level … at the high-skill end, data for the tri-state region points to an apparent oversupply.

To some extent this shouldn’t be a surprise. Chicago is a desirable city for people to live in, particularly for educated workers inside its heartland catchment area. As with other big city talent magnets, the economy doesn’t always supply the right employment for all the people who want to live there. The many articles about unemployment in Portland, for example, illustrates this, and Chicago is similar. In that regard, you might see the skills surplus as a sign of local strength.

However, the skill concentration in Chicago isn’t producing the type of high end innovation economy seen elsewhere. As the OECD notes, “Indicators suggest that the Chicago Tri-State metro-region does not rank as highly among the US knowledge hubs as one might expect, given the size of its economy and population and its concentration of world-class research universities.”

Also, Chicago may not be as attractive a talent hub as its aggregate numbers indicate. Again per the OECD:

To be sure, the Chicago Tri-State metro-region remains an attractive place for many migrants, but it is less attractive than many of its US metro-region peers. Moreover, if the analysis is confined to highly educated people of prime working age (25+, with at least a bachelor’s degree), then the picture is even more problematic. During 2005-09, more such people moved into the area than left it, but the net gain was relatively small compared with other large US metro-regions. Los Angeles, for example, benefited from a net gain of nearly 80,000 highly educated people in 2009, compared with 3,500 for the Chicago Tri-State metro-region.

When you under-perform as a talent magnet and still can’t put high skilled labor to good use, that’s a definite sign of trouble. This was one thing that was eye opening for me in the study as I’d previously assumed the high end of the market was in pretty good shape and that skill mismatch problems were the result of a large under-educated population vs. open jobs requiring mid-tier skills.

Policy Prescriptions

The OECD’s recommendations were not nearly as strong as its assessment of the region’s conditions. This shouldn’t be surprising as it is easy to look at data and see what may be wrong, but it is not always obvious what to do about it. The recommendations fall into five broad categories:

  • Better Skills Matching
  • Improving Innovation and Entrepreneurship
  • Investments in Transportation and Logistics
  • More Green Industry Growth
  • More Effective Institutional Arrangements

First off, including “green growth” as one of only five major chapter headings is a joke. The aggregate number of jobs identified as specifically green is small. And as I’ve noted many times, there’s no such thing as green industry. Pretty soon there will just be industry again – it will all be green. So if Chicago and the US aren’t doing well at today’s industries, why would we think they would do any better at tomorrow’s? “Green” isn’t some sort of fairy dust you can sprinkle on and work wonders with. If anything, the acceleration of transition to more green practices will only drive more manufacturing offshore, exactly as it did with light bulbs. The track record of trying to create “green jobs” almost everywhere has been poor and has failed to live up to the hype, so I can’t believe the OECD is doubling down on this snake oil.

For the other areas, the OECD doesn’t break much new ground, though does highlight some interesting international case studies of regions getting it right. The sections more or less regurgitate the laundry list of organizations and initiatives already in place, then tag on “do more and coordinate better.” Examples include, “create region-wide capacity to match skills supply with demand” and “broaden the innovation focus [to include] non-science-and-technology-based innovation.”

By contrast, there was little focus on what counterproductive initiatives might be trimmed. While, for example, the report notes that many of the excessive numbers of local governmental units probably should be eliminated or merged, it doesn’t really look at how many of the alphabet soup of various non-governmental civic development groups might likewise be better off euthanized. Given the unified civic leadership nexus of Chicago, this should in theory be much easier than killing off governments, which are famously resistant to elimination. It’s hard for civic sector leadership to scold state legislatures about the need to consolidate when they can’t even do it themselves. This shows that the OECD had to deal with local political reality, so it probably pulled a lot punches in the recommendations. Statements of raw flattery such as “All key public and private stakeholders are keenly aware of what needs to be done to address these issues effectively” show the extent to which the OECD wanted to avoid ruffling feathers and challenging the Chicagoland status quo, which is disappointing.

I might also take issue with the way the problems were attributed to these structural factors without addressing at any great length many of the clear drivers of Chicago’s under-performance. For example, Chicago is the regional capital of a greater Midwest that has been struggling as a whole. It’s tough to swim upstream against that. (I’ll have more to say on other underlying factors in a subsequent analysis of my own).

In short, this report got it half right in giving us a very good look at the current conditions, strengths, challenges, and international comparisons. Where it lagged was in fully articulating the structural landscape driving the under-performance and developing compelling strategies for turning the ship around. Still, if I were a region out there looking for a good snapshot of where I stood in the marketplace, the OECD would be on my list of people to call.

* Disclosure: I won a competition sponsored by the Chicagoland Chamber in 2009.

Aaron M. Renn is an independent writer on urban affairs and the founder of Telestrian, a data analysis and mapping tool. His writings appear at The Urbanophile.

Chicago skyline photo by Bigstockphoto.com.


Small Cities Are Becoming a New Engine Of Economic Growth

$
0
0

The conventional wisdom is that the world’s largest cities are going to be the primary drivers of economic growth and innovation. Even slums, according to a fawning article in National Geographic, represent “examples of urban vitality, not blight.” In America, it is commonly maintained by pundits that “megaregions” anchored by dense urban cores will dominate the future.

Such conceits are, not surprisingly, popular among big city developers and the media in places like New York, which command the national debate by blaring the biggest horn. However, a less fevered analysis of recent trends suggests a very different reality: When it comes to growth, economic and demographic, opportunity increasingly is to be found in smaller, and often remote, places.

Read about how we selected the 2012 Best Cities for Job Growth

This year’s edition of Forbes’ Best Cities For Jobs survey, compiled with Pepperdine University’s Michael Shires, found that small and midsized metropolitan areas, with populations of 1 million or less, accounted for 27 of the 30 urban regions in the country that are adding jobs at the fastest rate. The three largest metropolitan statistical areas that made the top 30 — Austin, Houston and Salt Lake City — are themselves highly dispersed with sprawling employment sheds.

Rather than the products of “smart growth” and intense densification, almost all of the fastest-growing metropolitan areas — including larger ones like Silicon Valley and Raleigh — tend to be dominated by suburban-style, single-family homes and utterly dependent on the greatest scourge of the urbanist creed: the private car. But many of the smaller areas also punch above their weight in myriad ways, spanning a host of industries.

Among the 398 MSAs we ranked for the list, energy towns dominate the top of the table:  Odessa, Texas (100,000), took first place; followed by Midland, Texas (population: 111,000), in second place; Lafayette, La. (fourth, 114,000); Corpus Christi, Texas (sixth, 287,000); San Angelo, Texas (seventh, 92,000); Casper, Wyo. (10th, 54,000); and Bismarck, N.D. (21st, 61,000). These cities’ economies have expanded steadily over the last few years, beneficiaries of a great boom in fossil fuels that, unless derailed by regulators, will continue for the foreseeable future.

But some of the other best cities for jobs make their livings in different ways, such as No. 12 Glens Falls, N.Y., riding growth in business services and tourism; and No. 15 Columbia, Mo., which is primarily a college and government town. Several smaller communities have bounced back strongly with the recovery of manufacturing, including No. 3 Columbus Ind., No. 11 Williamsport, Pa., and No. 19 Holland-Grand Haven, Mich.

This shift in opportunity also parallels some compelling demographic trends. In the 1990s, the rate of population growth of areas over 1 million and those below was essentially similar. In contrast, in the subsequent decade, urban areas with fewer than a million people expanded by 15%, compared to barely 9% for larger urban areas, notes demographer Wendell Cox. In those 10 years, areas with fewer than a million people accounted for more than 60% of urban growth. Essentially more Americans are now moving to smaller regions than to larger ones.

We  see is a very different reality than that often promoted by big city boosters. Large, dense urban regions clearly possess some great advantages: hub airports, big labor markets, concentrations of hospitals, schools, cultural amenities and specific industrial expertise. Yet despite these advantages, they still lag in the job creation race to unheralded, smaller communities.

Why are the stronger smaller cities growing faster than most larger ones? The keys may lie in many mundane factors that are often too prosaic for urban theorists. They include things such as strong community institutions like churches and shorter commutes than can be had in New York, L.A., Boston or the Bay Area (except for those willing to pay sky-high prices to live in a box near downtown). Young families might be attracted to better schools in some areas — notably the Great Plains — and the access to natural amenities common in many of these smaller communities.

Perhaps another underappreciated factor is Americans’ overwhelming preference for a single-family home, particularly young families. A recent survey from the National Association of Realtors found that 80 percent preferred a detached, single-family home; only a small sliver, roughly 7 percent, wanted to live in a dense urban area “close to it all.” Some 87 percent expressed a strong desire for greater privacy, something that generally comes with lower-density housing.

This trend towards smaller communities — unthinkable among big city planners and urban land speculators — is likely to continue for several reasons. For one thing, new telecommunications technology serves to even the playing field for companies in smaller cities. You can now operate a sophisticated global business from Fargo, N.D., or Shreveport, La., in ways inconceivable a decade or two ago.

Another key element is the predilections of two key expanding demographic groups: boomers and their offspring, the millennials. Aging boomers are not, in large part, hankering for dense city life, as is often asserted. If anything, if they choose to move, they tend toward less dense and even rural areas. Young families and many better-educated workers also seem to be moving generally to less dense and affordable places.

Perhaps even more surprising, this tendency toward decentralization can be seen around the world: much of the new growth is in smaller cities, with India as a prime example. A recent McKinsey study found that “middle-weight” cities, many of them well under a million, have already started taking a larger percentage of the world’s urban growth.

McKinsey suggests that the notion that megacities will dominate the urban future constitutes “a common misconception.” Instead surging smaller cities will constitute well over half of the world’s urban growth, gaining ever more share from the megacities over time. This is particularly true in the U.S. which constitutes the epicenter for the new smaller city economy. Of the world’s 600 hundred “middleweight” cities, the U.S. is home to 257. Together they generate 70% of U.S. GDP.

What does this mean for investors, companies and individuals in the coming decades? For one thing, Wall Street, which tends to obsess over a handful of high-cost, dense, urban markets, may seek out new opportunities in faster-growing smaller cities. Prices tend to be lower and competition for prime space less intense, and the demographic wind is at their backs. Companies looking to expand may find not only a welcome mat from the locals, but also an expanding workforce in these generally more affordable places.

Finally, particularly for the next generation, the shift to smaller cities provides a whole realm of new options for sinking roots, starting business or a family and owning a home. Smaller city life certainly does not appeal to everyone, or every business, but their growing dynamism provides a welcome option for people who want to get a leg up in the next decade.

Read about how we selected the 2012 Best Cities for Job Growth

This piece originally appeared in Forbes.

Joel Kotkin is executive editor of NewGeography.com and is a distinguished presidential fellow in urban futures at Chapman University, and contributing editor to the City Journal in New York. He is author of The City: A Global History. His newest book is The Next Hundred Million: America in 2050, released in February, 2010.

Photo: Glens Falls, NY

The Export Business in California (People and Jobs)

$
0
0

California Senate President Pro-Tem Darrell Steinberg countered my Wall Street Journal commentary California Declares War on Suburbia in a letter to the editor (A Bold Plan for Sustainable California Communities) that could be interpreted as suggesting that all is well in the Golden State. The letter suggests that business are not being driven away to other states and that the state is "good at producing high-wage jobs," while pointing to the state's 10 percent growth over the last decade. Senate President Steinberg further notes that the urban planning law he authored (Senate Bill 375) is leading greater housing choices and greater access to transit.

This may be a description of the California past, but not present.

Exporting People

Yes, California continues to grow. California is growing only because there are more births than deaths and the state had a net large influx of international immigration over the past decade. At the same time, the state has been hemorrhaging residents (Figure 1).

Californians are leaving. Between 2000 and 2009 (Note), a net 1.5 million Californians left for other states. Only New York lost more of its residents (1.6 million). California's loss was greater than the population of its second largest municipality, San Diego. More Californians moved away than lived in 12 states at the beginning of the decade. Among the net 6.3 million interstate domestic migrants in the nation, nearly one-quarter fled California for somewhere else.

The bulk of the exodus was from the premier coastal metropolitan areas. Since World War II, Los Angeles, San Francisco, San Diego and San Jose have been among the fastest growing metropolitan areas in the United States and the high-income world. Over the last decade, this growth has slowed substantially, as residents have moved to places that, all things being considered, have become their preferences.

More than a net 1.35 million residents left the Los Angeles metropolitan area, or approximately 11 percent of the 2000 population. The San Jose metropolitan area lost 240,000 residents, nearly 14 percent of its 2000 population. These two metropolitan areas ranked among the bottom two of the 51largest metropolitan areas (over 1,000,000 population) in the percentage of lost domestic migrants during the period. The San Francisco metropolitan area lost 340,000 residents, more than 8 percent of its 2000 population and ranked 47th worst in domestic migration (New York placed worse than San Francisco but better than Los Angeles). Each of these three metropolitan areas lost domestic migrants at a rate faster than that of Rust Belt basket cases Detroit, Cleveland and Buffalo.

San Diego lost the fewest of the large coastal metropolitan areas (125,000). Even this was double the rate of Rust Belt Pittsburgh.

Exporting Jobs

California is no longer an incubator of high-wage jobs. The state lost 370,000 jobs paying 25 percent or more of the average wage between 2000 and 2008. This compares to a 770,000 increase in the previous 8 years. California is trailing Texas badly and the nation overall in creating criticial STEM jobs and middle skills jobs (Figures 2 & 3) Only two states have higher unemployment rates than California (Nevada and Rhode Island) . California has the second highest underemployment rate (20.8 percent), which includes the number of unemployed, plus those who have given up looking for work ("discouraged" workers) and those who are working only part time because they cannot find full time work. Only Nevada, with its economy that is overly-dependent on California, has a higher underemployment rate.


Business relocation coach Joseph Vranich conducts an annual census of companies moving jobs out of California and found a quickening pace in 2012. Often these are the very kinds of companies capable of creating the high-wage jobs that used to be California's forte. Vranich says that the actual number may be five times as high, which is not surprising, not least because there is no reliable compilation of off-shoring of jobs to places like Bangalore, Manila or Cordoba (Argentina).

To make matters worse, California is becoming less educated. California's share of younger people with college degrees is now about in the middle of the states, while older, now retiring Californians are among the most educated in the nation (Figure 4).

Denying Housing Choice

It is fantasy to believe, as Steinberg claims, that there are enough single family (detached) houses in the state to meet the demand for years to come. More than 80 percent of the new households in the state chose detached housing over the last decade. People's actual choices define the market, not the theories or preferences of planners often contemptuous of the dominant suburban lifestyle.

In contrast, however, the regional plans adopted or under consideration in the Bay Area, Los Angeles and San Diego would require nearly all new housing be multi-family, at five to 10 times normal California densities (20 or more units to the acre are being called for). New detached housing on the urban fringe would be virtually outlawed by these plans. And, when Sacramento does not find the regional plans dense enough, state officials (such as the last two state Attorneys General) are quick to sue. If the "enough detached housing" fantasy held any water, state officials and planners would not be seeking its legal prohibition. To call outlawing the revealed choice of the 80 percent (detached housing) would justify the equivalent of a Nobel Prize in Doublespeak.

At the same time by limiting the amount of land on which the state preferred high density housing must be built, land and house prices can be expected to rise even further from their already elevated levels (already largely the result of California's pre-SB 375 regulatory restrictions).

Transit Rhetoric and Reality

Transit is important in some markets. About one-half of commuters to downtown San Francisco use transit. The assumptions of SB 375 might make sense if all of California looked like downtown San Francisco. It doesn't, nor does even most of the San Francisco metropolitan area. Only about 15 percent of employment is downtown, while the 85 percent (and nearly all jobs in the rest of the state) simply cannot be reached by transit in a time that competes with the car. Even in the wealthy San Jose area (Silicon Valley), with its light rail lines and commuter rail line, having a transit stop nearby provides 45 minute transit access to less than 10 percent of jobs in the metropolitan area.

A recent Brookings Institution report showed that the average commuter in the four large coastal metropolitan areas can reach only 6.5 percent of the jobs in a 45 minute transit commute. This is despite the fact that more than 90 percent of residents can walk to transit stops. Even when transit is close, you can't get there from here in most cases in any practical sense (Figure 5).

SB 375 did little to change this. For example, San Diego plans to spend more than 50 percent of its transportation money on transit over the next 40 years. This is 25 times transit's share of travel (which is less than 2 percent). Yet, planners forecast that all of this spending will still leave 7 out of 8 work and higher education trips inaccessible by transit in 30 minutes in 2050. Already 60 to 80 percent of work trips in California are completed by car in 45 minutes and the average travel time is about 25 minutes.

For years, planners have embraced the ideal of balancing jobs and housing, so that people would live near where they work, while minimizing travel distances. This philosophy strongly drives the new SB 375 regional plans. What these plans miss is that people choose where to work from the great array of opportunities available throughout the metropolitan area. These varied employment opportunities that are the very reason that large metropolitan areas exist, according to former World Bank principal planner Alain Bertaud.

People change jobs far more frequently than before and multiple earners in households are likely to work far apart. Similar intentions led to the development up to four decades ago of centers like Tensta in Stockholm, which ended up as concentrated low income areas (Photo). It California, such a concentration would do little to improve transit ridership, even low-income citizens are four to 10 times as likely use cars to get to work than to use transit.


Tensta Transit Oriented Development: Stockholm

All of this means more traffic congestion and more intense local air pollution, because higher population densities are associated with greater traffic congestion. Residents of the new denser housing would face negative health effects because there is more intense air pollution, especially along congested traffic corridors.

Self-Inflicted Wounds

Worst of all, California's radical housing and transportation strategies are unnecessary. The unbalanced and one-dimensional pursuit of an idealized sustainability damages both quality of life and the economy. This is exacerbated by other issues, especially the state's dysfunctional economic and tax policies. It is no wonder California is exporting so many people and jobs. California's urban planning regime under SB 375 is poised to make it worse.

Wendell Cox is a Visiting Professor, Conservatoire National des Arts et Metiers, Paris and the author of “War on the Dream: How Anti-Sprawl Policy Threatens the Quality of Life”.


Net Domestic Migration: 2000-2009
Rank Metropolitan Area Net Domestic Migration Compared to 2000 Population
1 Raleigh, NC         194,361 24.2%
2 Las Vegas, NV         311,463 22.4%
3 Charlotte, NC-SC         248,379 18.5%
4 Austin, TX         234,239 18.5%
5 Phoenix, AZ         543,409 16.6%
6 Riverside-San Bernardino, CA         469,093 14.3%
7 Orlando, FL         225,259 13.6%
8 Jacksonville, FL         126,766 11.3%
9 Tampa-St. Petersburg, FL         260,333 10.8%
10 San Antonio, TX         177,447 10.3%
11 Atlanta, GA         428,620 10.0%
12 Nashville, TN         123,199 9.4%
13 Sacramento, CA         141,117 7.8%
14 Richmond, VA           75,886 6.9%
15 Portland, OR-WA         121,957 6.3%
16 Dallas-Fort Worth, TX         317,062 6.1%
17 Houston, TX         243,567 5.1%
18 Indianapolis. IN           72,517 4.7%
19 Oklahoma City, OK           41,082 3.7%
20 Denver, CO           66,269 3.0%
21 Louisville, KY-IN           34,381 3.0%
22 Birmingham, AL           26,934 2.6%
23 Columbus, OH           34,204 2.1%
24 Kansas City, MO-KS           31,747 1.7%
25 Seattle, WA           40,741 1.3%
26 Minneapolis-St. Paul, MN-WI          (19,731) -0.7%
27 Memphis, TN-MS-AR            (8,583) -0.7%
28 Hartford, CT            (9,349) -0.8%
29 Cincinnati, OH-KY-IN          (17,648) -0.9%
30 Virginia Beach-Norfolk, VA-NC          (20,005) -1.3%
31 Baltimore, MD          (36,407) -1.4%
32 St. Louis, MO-IL          (43,750) -1.6%
33 Philadelphia, PA-NJ-DE-MD        (115,890) -2.0%
34 Pittsburgh, PA          (52,028) -2.1%
35 Washington, DC-VA-MD-WV        (107,305) -2.2%
36 Providence, RI-MA          (49,168) -3.1%
37 Salt Lake City, UT          (34,428) -3.5%
38 Rochester, NY          (40,219) -3.9%
39 San Diego, CA        (126,860) -4.5%
40 Buffalo, NY          (55,162) -4.7%
41 Milwaukee,WI          (74,453) -5.0%
42 Boston, MA-NH        (235,915) -5.4%
43 Miami, FL        (287,135) -5.7%
44 Chicago, IL-IN-WI        (561,670) -6.2%
45 Cleveland, OH        (136,943) -6.4%
46 Detroit,  MI        (366,790) -8.2%
47 San Francisco-Oakland, CA        (347,375) -8.4%
48 New York, NY-NJ-PA     (1,962,055) -10.7%
49 Los Angeles, CA     (1,365,120) -11.0%
50 San Jose, CA        (240,012) -13.8%
51 New Orleans, LA        (301,731) -22.9%
Data from US Census Bureau


-----

Note:  2000 to 2010 data not available

Lead photo: Largely illegal to build housing under California Senate Bill 375 planning

Right in the Middle: The Midwest’s Growth Lessons for America

$
0
0

The Midwest’s troubles are well-known. The decline of manufacturing has resulted in job losses and dying industrial towns. The best and brightest have fled the flatlands for more exciting, sunnier, mountainous, or coastal places where the real action is. Even Peyton Manning has left the heartland for the Rockies.

This narrative is so deeply embedded both in and outside of the Midwest that many people overlook the ways in which parts of the region are bouncing back. The Midwest’s story is important because it serves in significant ways as a regional microcosm of how growth and opportunity should look in America today.

In a recent study we look at trends that upend the conventional wisdom about the Midwest. We find that it is neither doomed to a slow and dirty demise like an old house on an eroding slope, nor forced to reinvent itself Dubai-style in order to compete with Silicon Valley or Manhattan. The Midwest’s future is rooted very much in its past—but with some important updates.

What do we mean? For starters, this means capitalizing on Americans’ desire to reside where the cost of living and doing business is favorable. As the last Census showed, Americans move in droves to regions where the cost of living is low, businesses face fewer obstacles, and workers have choices. As Wendell Cox and Joel Kotkin have shown, this goes for 25- to 35-year-olds as well as 55- to 65-year-olds. People want options and a good quality of life at a price they can afford.

In the Midwest, these trends have favored placed like Columbus, Ohio, and Indianapolis, Indiana. When people hear “Midwest,” they are more likely to think of this kind of picture:

The blue areas show destinations to which people from Detroit have moved between 2000 and 2010. The brown shades are the areas from which Detroit has drawn people. Given Detroit’s well-publicized decline, all the blue should be no surprise.

But a respectable portion of the Midwest looks like this:

And this:

Like most parts of America, Columbus and Indianapolis have seen a net outmigration southward to Florida and Texas. No surprise there. But note how both cities are stealing population from Chicago, Detroit, New York, and even southern California and Miami in Indianapolis’s case. The maps also show how intense interstate competition within the Midwest is right now.

One important measure of the cost of living is housing affordability, which is typically set at 3.0 as a measure of median housing price divided by median income. Compared to San Francisco at 7.2, New York at 6.1, Los Angeles at 5.9, and Miami at 4.7, Columbus stands at 2.8 and Indianapolis at 2.4. Charlotte, which has been an exemplary Sun Belt growth magnet for a while, stands at 3.9, a slight click above the Chicago area’s 3.8.

Affordability and overall quality of life as measured by schools and greater disposable income matter a lot—even to technology entrepreneurs. Some Midwestern areas are outpacing coastal areas on this front. In a recent Forbes ranking of tech growth in the nation’s largest 51 metro areas, the Midwest had three cities within the top 15, with Columbus in third position, followed by Indianapolis and St. Louis.

But it would be wrong for tech boosters to think the Midwest’s future rests in harnessing the power of this sector alone. Rather, it’s a combination of brains and brawn that signify the Midwest’s core strength. When we look at Midwestern areas that have experienced above-average growth in bachelor’s degrees, there are important overlaps with areas experiencing above-average growth in manufacturing, too.

In the corridor from Madison to Milwaukee, or the outlying areas around Chicago, or the Indianapolis metro area, or even in the Quad Cities on the Iowa-Illinois border, we see higher educational attainment and manufacturing growth occurring together. Cedar Rapids, Iowa, had the highest GDP growth from 2000 to 2010 of any metro area in the Midwest. A new corridor has grown up between Cedar Rapids and Iowa City, home to the University of Iowa; it takes advantage of the region’s historical manufacturing capacity and blends it with new technology. Peoria, Illinois, is second to Cedar Rapids in GDP growth. Peoria is home to 200 manufacturing firms, and it is also a Midwestern leader in college degree attainment.

Manufacturing continues to be part of the regional DNA in the Midwest. Trying to move away from it would be a fool’s errand, as this picture shows:

The concentration of manufacturing in middle America is a real asset, especially when combined with higher levels of educational attainment, as we have seen. The Midwest is still home to much of the nation’s skilled labor force. And contrary to the declinist narrative mentioned at the outset, the region has added 50,000 “heavy metal” manufacturing jobs since 2009.

The challenge for the region, actually, will perhaps be filling manufacturing jobs rather than creating them. A recent Deloitte survey found that 83 percent of manufacturers nationwide suffered a moderate or severe shortage of skilled production workers. The Midwest is poised to establish what we call a “new industrial paradigm,” characterized by a blend of heavy manufacturing, new technology, a more highly educated industrial labor base, and lighter labor restrictions (Indiana just became a right-to-work state, and the much-publicized debates in Wisconsin and Ohio over labor laws have only served to draw more attention to the need for reform, whatever the near-term effects). When you add to all of this the new energy sources discovered in some parts of the Midwest—such as new finds in Utica shale in Ohio—a new industrial paradigm in the region could end up being a large source of new wealth creation in the coming generation.

So why might the Midwest be something of a microcosm for how growth and opportunity look in America as a whole, given its idiosyncratic reliance on manufacturing not shared by other regions? The main reason is that middle America is a clear picture of how much the basics matter: Cost of living, job quality, schools, and opportunities to develop the right skills for the best jobs. The areas within the Midwest that have gotten the basics right are poaching people and companies from the areas that haven’t. Any economic development strategy that ignores the basics in favor of a more stylized theory of growth will usually run off the rails before too long. Americans, at the end of the day, want the places they live to get the basics right so they themselves can build their lives, start their businesses, and raise their children as they wish.

This piece originally appeared at The American.

This peice was adapted from a recent report: "Clues from the Past: The Midwest as an Aspirational Region." Download the full pdf version of the report, including charts and maps about the Great Lakes Region.

Joel Kotkin is executive editor of NewGeography.com and is a distinguished presidential fellow in urban futures at Chapman University, and contributing editor to the City Journal in New York. He is author of The City: A Global History. His newest book is The Next Hundred Million: America in 2050, released in February, 2010.

Mark Schill is Vice President of Research at Praxis Strategy Group, an economic development and research firm working with communities and states to improve their economies.

Ryan Streeter is Distinguished Fellow for Economic and Fiscal Policy at the Sagamore Institute. You can follow his work at RyanStreeter.com and Sagamoreinstitute.org.

Great Lakes Freighter photo by BigStockPhoto.com.

Homebuilding Recovery: A Zoning & Planning Overhaul

$
0
0

Part III of the Recovery Blueprint for homebuilding. Defining good zoning and good planning, and a look at how social engineering plays in.

What exactly is ‘planning’?

It can be government creation of an Interstate Highway, or a city council vote on a new park. For the purposes of this blueprint, planning refers to the design of a new land development or a design for redevelopment. In both cases, the land plan is the developer's business plan. The design will either be positive or negative for the sustainability — long-term health — of the city.

Typically, the ‘planner’ will be an engineer or surveyor if the development is suburban, or an architect or ‘urban planner’ designing an urban redevelopment. In any case, the planner will follow regulations that set ‘minimums,’ such as a minimum on lot size, side yards, front and rear setbacks, and so forth. There are a few major problems with this ‘minimums’ based system.

In order to maximize profits for the client (the builder or developer), the planner is encouraged to squeeze as many units as possible within the available land. The design of the development becomes a mathematical exercise, more than an attempt to create an attractive and functional neighborhood design.

The result becomes a monotonous, cookie-cutter solution. It maximizes not just density, but also construction costs, with a high volume of streets, utility mains, and sidewalks.

Technology made the situation worse, with software not only limiting creativity, but also influencing the planning to correspond with the predetermined, robotic functions of the widely used software.

A minimums-based design is quite rigid. In the long run, if a design is driven only by density, the development can be far less profitable for the developer, despite the original intention to economize. Builders who buy lots from the developer also end up paying more than they would have with a different approach. When topography and the overall property configuration are more complex, and as restrictions on wetlands and tree ordinances increase, it gets worse. Rigid designing is like trying to fit a square peg in an odd shaped hole, increasing waste.

Development after development becomes a clone, because of the way regulations are written and interpreted. This monotony can then only be broken up with a much greater attention to architecture and landscaping. The ‘geometry’ of each development remains similar.

This is where the confusion between good planning and good architecture comes in. An example is New Urbanism, with architecture as its key component. A coherent architectural theme, full front porch, and street trees are typical of these developments. Compare that to the vinyl sided, bland subdivision where the three-car garage is the dominant feature. New Urbanism typically wins the curb appeal beauty contest. (Of course, in upscale suburban communities where every home showcases great architecture and landscaping, that is not necessarily the case.)

Underlying New Urbanism is the implication that certain design elements will change behavior and solve social problems. Neighbors will want to interact regardless of income, race, religion, and so on. Many think this ‘Stepford Wife’ approach places design as a tool to implement mind control. Is it?

Those who reside in New Urban communities desire the more attractive setting. The architectural and landscaping control creates a welcoming and cohesive community appearance, compared to the garage snout vinyl cladded subdivision. These developments are typically more expensive per home square foot, thus your neighbor is likely to be somewhat successful, just like you. This is no more social engineering than is providing any market for successful people who value appearance and like to live among others with similar values.

Within a city, other planning solutions can result in social change. Replacing a blighted, high crime neighborhood with a gentrified urban mecca for wealthy residents that enjoy the nightlife is one sure formula to do so. But is it a change in the right direction for a city?

What happens to those low-income families that are displaced? How are their lives improved? Theoretically, they could move to a safer, less blighted area, like many who were displaced by Katrina. Instead of displacing poor families, there are viable solutions based on rebuilding blighted areas and maintaining affordability. Not the typical ‘smart growth’ solutions, though; those often add significantly to redevelopment costs. Compressing these families into dense, high-rise structures does nothing to foster pride, thus, high-density low-income housing could be considered unsocial engineering.

Zoning gets attacked, but the truth is that it tends to preserve property values better than intermixed usage does. New Urbanism offers the promise that the rich and poor can all live on the same block. That would be marketing suicide for the developer and builder. Suburban zoning can also be a terrible model. It places the strip mall or multi-family homes along arterial roads, then transitions to the large single family lots and homes as one drives deeper into the subdivision or the ‘master planned’ community (i.e., ‘larger’ subdivision). Showcasing the cheapest housing, and placing the most families in the worst places is land use madness. To highlight inexpensive homes and strip malls cheapens the development and the city as a whole.

A blueprint for recovery without class barriers, one that benefits all income levels, can easily be accomplished today. To start, the suburban zoning pattern is in serious need for an overhaul. Reversing the pattern would increase property values and profitability, and values would be more stable over time.

A less rigid geometric pattern would reduce monotony, while allowing the development design to adhere to the natural terrain. An adherence to the natural terrain allows surface flow, which reduces the expense and negative impact of traditional storm sewer systems.

How can all of the above be expedited? Cities can be proactive by writing regulations that reward better solutions. That particularly includes a modification of their existing minimums-based regulations.

Flickr photo by infomatique (William Murphy): "Discussion: 'Can Zoning Be Bad For You?' All land in Dublin City is zoned for one particular use or another, some more restrictive than others…"

Rick Harrison is President of Rick Harrison Site Design Studio and Neighborhood Innovations, LLC. He is author of Prefurbia: Reinventing The Suburbs From Disdainable To Sustainable and creator of Performance Planning System. His websites are rhsdplanning.com and pps-vr.com.

London’s Social Cleansing

$
0
0

Unscrupulous landlords are forcing poorer tenants out of their London homes, freeing them up to rent out to visitors to the Olympics this summer, according to the housing charity Shelter. At the same time, the government’s cap on rent subsidies (Housing Benefits) for those out of work or on low incomes threaten to force less well-off tenants out of the capital. Newham Mayor Sir Robin Wales says that they will have to move people as far afield as Stoke-on-Trent if they are to meet their obligations to house the homeless. Fears of ‘social cleansing’ featured in the Mayoral election where Tory incumbent Boris Johnson made sure to distance himself from his own government’s policy to beat off the challenge from veteran left-winger Ken Livingstone.


Inner London, outer London (Newham in red); London, Stoke-on-Trent

Critics of London’s ‘Social Cleansing’ have fixed on the changes to the law regarding housing benefits and the Olympics, but failed to notice that working class Londoners have been being forced out of the nation’s capital for some time now – thanks to the ceaseless rise in house prices. On the London Programme in 2003, I said that without opening up more land to building in the green belt, house prices would spiral out of control, pricing ordinary Londoners out of the capital. Mayor Ken Livingstone slapped me down saying that he would never sanction building on the green belt.

Today Eva Wiseman, a commissioning editor on the upmarket broadsheet, the Observer, says that she cannot afford to rent in London’s once poorest borough, Tower Hamlets, let alone buy a house. She cites Shelter’s estimate that you would need an income of £67,669 to rent there (average income is £26,244).1

It is not hard to understand why prices are so steep. Housebuilding in the UK has failed to keep pace with demand. New housing starts are slightly up after the crash, but overall they are woefully short of actual need. The reason is that Britain has among the most stringent laws on building – the ‘planning laws’ – which stop building on the ever-growing ‘green belts’ that surround our cities.

Given that the working class are the Labour Party’s natural constituency, you might have thought that its years in government (1997-2010) would have seen more homes built for working people. But Labour turned its back on the working classes a long time ago, while keeping its neurotic interest in regulating the economy. The outcome was a re-vamped planning system that put the brakes on home building. This time this was done in the name of the environment, not to protect the Tory Shires from ‘bungaloid sprawl’, as it was originally intended. Housebuilding fell below the bare minimum of 250,000 you would need just to replace the increasingly dilapidated stock.

When David Cameron’s Conservative-Liberal coalition came to power in 2010, his Communities Minister Eric Pickles and Housing Minister Grant Shapps had promised a large scale liberalisation of the planning laws – and even blamed their predecessors for doing more damage than the Luftwaffe to Britain’s housing stock. But the fine print on Shapps’ new planning law proved as prohibitive as what went before. Even those champions of the Green Belt at the Guardian were moved to editorialise that ‘these convoluted and qualified planning laws will become another aid to the big-money lawyers’. 2

The Conservative government’s commitment to liberalisation is like its Labour predecessor’s commitment to the working class, theoretical. Home building remains stalled, and prices have not seriously fallen despite the shortage of credit). Governments of all stripes are most committed to orderly regulation of change, and dread the unsupervised activity of their citizens – a prejudice which has only led to chaos.

The short supply/rising price dilemma is particularly intense in London. A metropolis of nine million creates a fierce competition for prime sites. Even putting aside the super-rich boroughs, like Kensington and Chelsea, where average prices are £1.3 million (roughly $2 million US), the overall London average is £406,000 ($770,000 US) .

Besides being the most logical place for real estate speculation from around the world, London also has been in the grip of the planning system. It was in London that the Labour mayor took on architect Richard Rogers as an advisor, and committed the capital to a programme of building only on brownfield (already developed) land, ‘building up, not out’. The result is not much building at all, except to pack more four and five storey blocks into what few pockets of green space can be grabbed. His successor Boris Johnson has avoided challenging the Livingstone system, preferring a quiet life to any hint of controversy.

Rather than face the problem of the absolute shortfall in new homes, most critics have fixated on peripheral issues, such as the number of empty homes (which, despite the attention they receive, are, because of high prices, at an all-time low). Easy credit, too, has been blamed for high prices, which is true, but the shortage of credit has not led to a great fall in prices, because the underlying problem was the absolute shortage of homes. Others have argued that the British are too wedded to the idea that they should own their own homes, and could rent, like the Germans, failing to understand that the availability of homes to rent depends on their being built, and rents tend to move in the same direction as prices, as The Observer’s Eva Wiseman has discovered. London’s Mayors have dedicated much attention to schemes to build ‘affordable homes’ – sometimes reserved for occupations like teachers and firefighters – though these are too few in number to have much impact on prices overall.

Over time, this means working people are being priced out of central London. Tim Butler, Chris Hamnett and Mark Ramsden’s analysis of London’s employment in the 2001 census shows that outer London and the South East is more working class than inner London. Inner London had more large employers, professionals and managers than outer London and the South East. Outer London had more routine, semi-routine and technical or lower supervisory workers. Inner London did have more unemployed than outer London, and outer London had more self-employed than inner London. This employment profile was new, following changes that took place after fifteen years of economic growth, say Butler and his colleagues, though many have noted the sharper contrasts between wealthy enclaves and impoverished housing estates dogged by underemployment. 3

These social changes show inner London’s parallel embourgeoisment and deepening social poverty. Of course, those who live in the outer suburbs scoff at the protests from well-heeled social commentators about the prices in inner London as ‘Zone Six snobbery’. Still the changes go some way to explaining why Ken Livingstone was unable to sustain the traditional City Hall machine he built consolidating constituencies among inner London’s poor immigrant and residual working class   communities while Tory Boris Johnson won  over the more working and middle class outer suburbs.

In his last term Livingstone concentrated on winning over London’s bloated financial service sector more than he did on popular support – but the City of London switched its allegiances to the Tory Johnson, who champions it as an engine of growth. Neither candidate has understood that the skew towards the overheated financial service sector creates a weakness in the London economy, with manufacturing having moved out to the surrounding South East and a growing lack of upwardly mobile jobs for all but the most skilled or privileged.

The housing benefit cap clearly is a problem for welfare-dependent families who are caught in the poverty trap and cannot earn enough to pay the rent. But the problem of the less well-off being priced out of London began long before the changes in housing benefit rules, or London’s winning the Olympic bid. The city the world will visit this summer increasingly resembles not the social democracy imagined after the Second World War, but increasingly a social bifurcated place increasingly resembling that of Victorian times.

James Heartfield is the author of Let’s Build: Why we need five million new homes, a director of Audacity.org, and a member of the 250 New Towns Club.

--------------------------------------

A Mile High Tower for London

One imaginative solution to London’s housing problem was proposed by Ian Abley and Jonathan Schwinge of the 250 New Towns Club. Abley and his colleagues have been pressing for new building in Britain’s green spaces to meet housing need.

Taking on the challenge of building up as well as out, Ian unveiled a plan for a tower one mile high for London at the Building Centre, which could house 90,000 people.


‘Locked out of the Property Market’, Observer,  6 May 2012

Inward and Upward: Marking Out Social Class Change in London, 1981–2001, Urban Studies 45(1) 67–88, January 2008, 72

London photo by Bigstockphoto.com.

Smart-Growth and Smarter Technology

$
0
0

If you’re an enviro-regulator with a mission, preventing “sprawl” has been ideologically trendy in recent decades. You have successfully predicated your argument on past-history soils-management technological inadequacy, it must be enormously threatening to look back and realize that technology has been gaining on you and is now capable (in engineering terms) and affordable (in end-user cost terms) of enabling just the sorts of rural development the majority of the market-for-housing wants, but you’ve been trying so hard to prevent: Currier-and-Ives-tradition large-lot houses in the countryside.

Case in point: the inadequate-soils argument long used by anti-rural-housing-and-business advocates to demand that buildings not be built anywhere soils aren’t naturally capable of environmentally-sound management of on-site sewage flows, and connection to a piped municipal sewer system isn’t feasible.

One way to win the sewage-flow argument is to control the information flow so that targets of your engineering-inadequacy argument don’t get to know about technologies they might employ, passing all tests of environmental quality and product affordability, to build and occupy the house and-or business in the countryside they want and you don’t want them to have.

If you’re good at it, you can keep the new technologies pretty much unknown to the public long after they’ve ceased being new. For example: chances are your local and regional planners and zoners never passed along to you the Winter 1996 issue of “Pipeline,” a quarterly effort of the National Small Flows Clearinghouse, a Federally-funded enterprise of the National Environmental Services Center within the U.S. Department of Agriculture and headquartered at West Virginia University. That issue was devoted almost entirely to a then-quite-innovative alternative to traditional septic-tank-and-disposal-field design: it was labeled “aerobic” to reflect its use of electric-powered air flows to enable oxygenated digestion, in contrast to the anaerobic design for traditional septic tanks.

As the text explains, “aerobic…a good option…where soil quality…isn’t.” The Aerobic Wastewater Treatment module can be installed and used irrespective of natural site conditions. That was 26 years ago. Last month, the State of Maryland adopted legislation to advance “Smart-Growth” and prevent rural development by establishing new and more rigorous criteria for septic (anaerobic) tank installations. Not a word in the press releases about aerobic technology. Irony: your tax dollars pay for “Pipeline,”  which describes its objective as “small community wastewater issues explained to the public,” but in the last 26 years there’s been zero effort, on the part of your planners and zoners to assist in that effort. Have they actually worked to suppress such (in their opinion) non-useful information, possible counterpoints to their growth-control doctrines? You decide.

It was (and still is) understandable that land with low-permeability clay soils, high water tables, shallow depth to bedrock, and similar negative qualities would be disqualified for in-ground septic systems on the grounds of predictable system failure. If non-soil-based systems didn’t exist, the logic of rural-development-prevention (no access to municipal piped systems) would prevail. That’s why Denver, back in the 80s, mounted a regional green-belt anti-sprawl campaign by curtailing municipal system expansion into previously-unserved real estate. It’s not understandable that development controls based on soil (in)capabilities should still be in place long after non-soils-based technologies have been engineered, manufactured, and marketed. Unless, of course, the soil-capability argument was an excuse, not a real reason.

* * * * * *

Before these little AWT packages became available (and have been unsuccessfully publicized by the Feds since the 90s) the industry was already interested in an even lower-tech non-soils-based design: the evapo-transpiration concept, where primary-treated effluent coming from a traditional septic tank is released into an under-sealed heavily-vegetated patch (in some designs, a shallow lagoon) where about two feet of vertical evaporation will take place annually if rain and snow are kept off. That’s a typical number for northern New England.

Depending on location with respect to septic-tank discharge, electric power for pumping may or may not be needed. But industry interest was pretty much trumped by regulator hostility. Many fruitless meetings were held in Montpelier and Waterbury on the subject, even one at which copies of the 1980 Environmental Protection Agency Design Manual were handed around the table, to no avail.

This raises the basic Smart-Growth question: can it be sold to (or forced on) a generally unwilling public only by pretending that the engineering basis for “sprawl” doesn’t work? There’s ample historical evidence –see Chapter 5, Ben Wattenberg’s “The First Measured Century”, for example—that “…the preference for the single-family detached house was even higher at the end of the 20th century than at the beginning…” but the top-down campaign against just such “sprawl” continues anyway.

It doesn’t seem to matter that such exemplars of Smart-Growth as Portland, OR now show some of the highest housing costs in the nation; or that a new Cal State report on housing costs and young-adult out-migration speaks to a preference “…for raising children on backyards rather than condominium balconies.” One way to counter that, of course, would be to make the backyard even more expensive than the condo by pretending that the traditional on-site sewage system for the former is an engineering health hazard, and that no environmentally-acceptable customer-affordable alternates exist.

To advance Smart-Growth it helps to keep the research and publications of the National Small Flows Clearinghouse as hidden as possible. There are some things, you understand, that the natives are better off not knowing, lest it make them restless.

Martin Harris is a Princeton graduate in architecture and urban planning with a range of experience in fields ranging from urban renewal and air-industrial parks to the trajectory of small-town planning and zoning in States like Vermont.

Rural Vermont home photo by Bigstockphoto.com.

Toward More Competitive Canadian Metropolitan Areas

$
0
0

The Federation of Canadian Municipalities (FCN) and the Canadian Urban Transit Association (CUTA) have expressed serious concern about generally longer commute trip times making Canadian metropolitan areas less competitive. Each has called for additional funding for transit at the federal level to help reduce commute times and improve metropolitan competitiveness.

The Right Concern

The concern over commute times is well placed. Economic research generally concludes that greater economic and employment growth is likely where people can quickly reach their jobs in the metropolitan area. Five of the nation's six major metropolitan areas (Toronto, Montréal, Vancouver, Ottawa-Gatineau and Calgary) have average one-way work trip travel times that are among the highest in their size classes among 109 metropolitan areas in the more developed world for which data is available. Only Edmonton has an average commute time that is among the shortest (Table 1).


Table 1
Average One-way Commute Times: Major Metropolitan Areas
Compared with International Major Metropolitan Areas
Major Metropolitan Area One-way Commute Time (Minutes) Overall One-way Commute: Rank out of 109 One-way Commute: Rank in Population Class
Population Size Class
Toronto 33 97th  Over 5,000,000 11th out of 19
Montréal 31 90th  2,500,000 - 5,000,000 19th out of 23
Vancouver 30 86th  1,000,000 - 2,500,000 60th out of 67
Ottawa-Gatineau 27 60th  1,000,000 - 2,500,000 55th out of 67
Calgary 26 58th  1,000,000 - 2,500,000 50th out of 67
Edmonton 23 15th  1,000,000 - 2,500,000 15th out of 67


The Wrong Answer

Yet the solution – more transit and funding for transit – misses the mark. Transit does many things well, but it does not reduce commute times (Figure 1). According to Statistics Canada, average commute times by transit in the Toronto, Montréal and Vancouver metropolitan areas are from 30 per cent longer to nearly double those of average automobile commuters (Note 2). Some 58 percent of car users (drivers and passengers) reach their work locations in under 30 minutes, something accomplished by merely y 25 percent of transit commuters. Overall Toronto commute times are longer than either Los Angeles – famed for its traffic – as well as much less dense, and far less transit dependent, Dallas-Fort Worth. In Toronto, 21 percent of commuters take transit, compared to two percent in Dallas-Fort Worth. Among Montréal commuters, 20 percent use transit and spend more time commuting than their counterparts in more decentralized Phoenix, where less than two percent take transit. Commute times in transit-focused Vancouver are worse than much larger Los Angeles and indeed longer than nearly American metropolitan area, including Dallas-Fort Worth, Houston, and Philadelphia (Table 2).

Given this pattern, transferring car travel to transit likely would increase commute times and make metropolitan areas even less competitive.


Table 2
30- and 40-minute Commute Shares:
Representative Metropolitan Areas
Population Classification Work Trip Under 30 Minutes Work Trip 30 to 44 Minutes Work Trip Under 45 Minutes
5,000,000 and Over      
Dallas-Fort Worth 59% 24% 83%
Los Angeles 55% 24% 79%
Toronto 48% 25% 73%
Paris 45% 22% 67%
2,500,000 - 5,000,000      
Phoenix 57% 26% 83%
Montréal 47% 27% 74%
1,000,000 - 2,500,000       
Edmonton 68% 20% 88%
Indianapolis 66% 22% 88%
Ottawa-Gatineau 65% 21% 86%
Tampa-St. Petersburg 62% 22% 84%
Calgary 54% 29% 83%
Vancouver 55% 21% 76%
Source: Statistics Canada, U.S. American Community Survey, National Institute of Statistics and Economic Studies (France)


The Geography of Transit

Rational Transit and Downtown:Transit’s greatest strength is in providing access to the largest downtown areas. These areas have the greatest job densities (jobs per square kilometre) in their metropolitan areas and are typically well served by frequent, rapid and convenient transit service from throughout the metropolitan area. This combination of high employment density and superior transit service attracts one-half or more of all downtown commuters in Canada’s major metropolitan areas to transit (Figure 2). Transit is meets the needs of people who commute to downtown and is the rational choice for many, if not most. However, downtowns contain only a relatively small share (14 per cent) of metropolitan area jobs (Figure 3).

Rational Personal Mobility Elsewhere: Areas outside downtown lack any such intense concentration of jobs. The area outside downtown, accounting for 6 out of every 7 jobs (Figure 4), maintain much lower employment densities and generally lacks transit service. This is illustrated by the nation's largest employment center, which surrounds Pearson International Airport in Toronto. Its more than 350,000 employees are spread around an area the size of city of Vancouver (or the city of San Francisco) at a density so low that quick and efficient transit is simply impossible.

For the overwhelming share of work trips to outside the downtown area, the car does the job and transit accounts for less than 10 percent of commuters. Thus, the automobile is the rational choice for most people who commute to locations outside downtown. And things are not getting better for transit. According to Statistics Canada, employment has been growing much faster outside of downtown than in the high density core areas suited for transit. The 2011 census indicated a continuing dispersion of population as well.


Transit's Robust Funding Growth and Declining Productivity

Strongly Rising Transit Subsidies: Transit subsidies have been growing strongly. According to Transport Canada data, from 1999 to 2008 subsidies grew 83 percent (adjusted for inflation), which is more than three times the 26 percent ridership growth rate and 3.5 times the rate of general inflation. Transit’s declining productivity could indicate a substantial potential for improved cost effectiveness and service expansion within the generous present funding levels.

Declining Transit Productivity: At the same time, there are concerns about transit productivity. The Conference Board of Canada has documented a 1.2 percent annual decline in productivity for two decades. The same analysis found productivity in other transport sectors to be generally improving. Transit costs have risen well in excess of inflation, service levels and ridership. Rising costs seriously limit transit’s ability to increase its share of travel in metropolitan areas and limits the important role that it is called upon to play in providing door-to-door mobility for the transportation-impaired, such as disabled citizens, the elderly, and students.

Land Use Strategies that Retard Metropolitan Competitiveness

Policies that Could Make Metropolitan Areas Less Competitive: While the prospects for improving transit commute times are discouraging, some current land use strategies further increase traffic congestion and lengthen commute times and make metropolitan areas and make metropolitan areas less competitive . Compact cities (also called smart growth) policies have been adopted across Canada in an effort to reduce automobile use and increase urban densities. The planning expectation is that housing should be placed near rail stations. Yet job locations throughout metropolitan areas remain highly dispersed, and with the rise of working at home, are becoming more so. The potential for transit systems (or walking or cycling) to materially impact commuting is very limited in the least.

International data indicate that higher densities are associated with greater traffic congestion. Further, higher traffic densities are strongly associated with higher levels of air pollution. Improvements in vehicle technology will make reductions in automobile use to reduce greenhouse gas emissions unnecessary, according to U.S. research by McKinsey & Company. Finally, smart growth type policies have been found to retard metropolitan economic growth in the Netherlands, the United Kingdom and the United States (Note 2).

Improving Metropolitan Competitiveness

Strategies that reduce commute times can improve metropolitan competitiveness. Expanded telecommuting reduces average commute times by its very nature (though the reported commute times routinely exclude the working at home sector, both in Canada and the US). There are also lessons to be learned from Edmonton and the international metropolitan areas that have been more successful in maintaining shorter commutes: more dispersed employment, lower population densities and a larger share of travel by car (Table 3).


Table 3
Comparison of Canadian and U.S. Major Metropolitan Areas
Average One-way Commute Times and Urban Area Densities
 
CANADA Canada Metropolitan Areas United States: Metropolitan Area Size Classes
Commute Time Principal Population Centre Density (per KM2) Average Commute Time Average Principal Population Centre Density (per KM2)
5,000,000 and Over        
Toronto 33 2,900 28 1,400
2,500,000 - 5,000,000        
Montréal 31 2,200 26 1,200
1,000,000 - 2,500,00        
Vancouver 30 1,900 23 1,100
Ottawa-Gatineau 27 1,900
Calgary 26 1,600
Edmonton 23 1,100
Principal Population Centre: Largest population centre (Statistics Canada term for urban area) in the metropolitan area.


Focusing on Objectives: To become more competitive, Canada’s metropolitan areas need to improve their average commute times. This requires focusing on strategies that have the highest potential to reduce traffic congestion.

Residents and businesses in metropolitan areas would be best served by goal-oriented and objective policies squarely directed toward getting people to work faster. The focus should be on what makes commutes shorter, regardless of transport mode, rather than on idealistic notions of how a city should look or how people should travel.

Wendell Cox is a Visiting Professor, Conservatoire National des Arts et Metiers, Paris and the author of “War on the Dream: How Anti-Sprawl Policy Threatens the Quality of Life”.

––--

Note: This article is based upon the recently released Frontier Centre for Public Policy report Improving the Competitiveness of Metropolitan Areas by Wendell Cox, who also serves as a senior fellow at the Centre.

Note 1: Data not provided for other metropolitan areas.

Note 2: On a related note, the Bank of Canada (the central bank) and others have indicated a concern about rising house costs relative to incomes. This is to be expected in metropolitan areas adopting green belts, urban growth boundaries and other land rationing policies. Huge housing price increases have occurred in Vancouver, Toronto, Montréal and Calgary (for example), in response to such policies (This is evident from the annual editions of the Demographia International Housing Affordability Survey, sponsored in Canada by the Frontier Centre for Public Policy). The Bank of Canada may be virtually powerless to slow this loss of housing affordability, since its cause (constraining metropolitan land supply) is beyond the reach of the Bank's monetary policies.

Photo: Suburban Montreal (by author)


The Best Cities For Tech Jobs

$
0
0

With Facebook poised to go public, the attention of the tech world, and Wall Street, is firmly focused on Silicon Valley. Without question, the west side of San Francisco Bay is by far the most prodigious creator of hot companies and has the highest proportion of tech jobs of any region in the country — more than four times the national average.

Yet Silicon Valley is far from leading the way in expanding science and technology-related employment in the United States.

To determine which metropolitan areas are adding the most tech-related jobs, my colleague Mark Schill at Praxis Strategy Group developed a ranking system for Forbes that measures employment growth in the sectors most identified with the high-tech economy (including software, data processing and Internet publishing), as well as growth in science, technology, engineering and mathematics-related (STEM) jobs across all sectors. The latter category captures tech employment growth that is increasingly taking place not just in software or electronics firms, but in any industry that needs science and technology workers, from manufacturing to business services to finance. We tallied tech sector and STEM job growth over the past two years and over the past decade for the 51 largest metropolitan statistical areas in the United States. We also factored in the concentration of STEM and tech jobs in those MSAs. (See the end of this piece for a full rundown of our methodology.)

Anyone who has followed tech over the past 30 years or more understands the cyclical nature of this industry — overheated claims of a “tech-driven jobs boom” often are followed by a painful bust. This is particularly true for Silicon Valley. The remarkable confluence of engineering prowess, marketing savvy and, perhaps most critically, access to startup capital may have created the greatest gold rush of our epoch, but the Valley at the end of 2011 employed 170,000 fewer people than in 2000.

Most of the job losses came in manufacturing, and business and financial services, sectors with a significant number of STEM workers. Even though the current boom has sparked an impressive 8% expansion in the number of tech jobs in the San Jose-Sunnyvale-Santa Clara metropolitan statistical area over the past two years, and 10% over the past decade, the area still has 12.6% fewer STEM jobs than in 2001. Overall, the recent growth and concentration of tech and STEM jobs remains good enough for the San Jose metro area to take seventh place in our ranking of the Best Cities For Tech Jobs. Next-door neighbor San Francisco, ranked 13th, has enjoyed similar tech and STEM growth over the past two years, but over 2001-2011, its total STEM employment inched up only a modest 0.8%.

The Established Winners

So which areas offer better long-term, broad-based prospects for tech growth? The most consistent performer over the period we assessed is the Seattle-Tacoma-Bellevue, Wash., metro area, which takes first place on our list. Its 12% tech job growth over the past two years and 7.6% STEM growth beat the Valley’s numbers. More important for potential job-seekers, the Puget Sound regions has grown consistently in good times and bad, boasting a remarkable 43% increase in tech employment over the decade and an 18% expansion in STEM jobs. Seattle withstood both recessions of the past decade better than most regions, particularly the Valley. The presence of such solid tech-oriented companies as Microsoft, Amazon and Boeing — and lower housing costs than the Bay Area — may have much to do with this.

Our top five includes two government-dominated regions: the Washington-Arlington-Alexandria MSA places second with 20.6% growth in tech employment since 2001 and 20.8% growth in STEM jobs; and Baltimore-Towson, Md., places fifth with 38.8% growth in tech jobs in the same period and 17.2% growth in STEM. Over the past two years, their tech growth has been a steady, if not spectacular 4%. One key to the stability may be the broadness of the tech economy in the greater D.C. area; as the Valley has become dominated by trends in web fashion, the Washington tech complex boasts substantial employment in such fields as computer systems design, custom programming and private-sector research and development.

Diversity in tech may also explain the success of other tech hotspots around the country. No. 3 San Diego-Carlsbad-San Marcos, Calif., has ridden growth in such fields as biotechnology and other life and physical sciences research. Over the past decade, tech employment has grown by almost 30% and STEM jobs by 13% in this idyllic Southern California region, and over the past two years, by 15.7% and 6.5%, respectively. Like San Diego, No. 11 Boston is also a well-established tech star, enjoying 11.3% tech growth over the last decade and nearly 10% over the past two years, with a diversified portfolio that includes strong concentrations in biotechnology, software publishing and Internet publishing. STEM employment, however, has remained flat over the past 10 years though.

New Tech Hotspots

Which areas are the likely “up and comers” in the next decade? These are generally places that have been building up their tech capacity over the past several decades, and seem to be reaching critical mass. One place following a strong trajectory is Salt Lake City, No. 4 on our list, which has enjoyed a 31% spurt in tech employment over the past 10 years. Some of this can be traced to large-scale expansion in the area by top Silicon Valley companies such as Adobe, Electronic Arts and Twitter.

These companies have flocked to Utah for reasons such as lower taxes, a more flexible regulatory environment, a well-educated, multilingual workforce and spectacular nearby natural amenities. Perhaps most critical of all may be housing prices: Three-quarters of Salt Lake area households can afford a median-priced house, compared to 45% in Silicon Valley and about half that in San Francisco.

Several other top players with above average shares of tech jobs are emerging as powerful alternatives to Silicon Valley. Like Salt Lake City, eighth-place Columbus, Ohio, boasts above-average proportions of tech and STEM jobs in the local economy, and benefits from being both affordable and business friendly. The Ohio state capital has enjoyed 31% growth in tech jobs over the past decade and 9.5% in the past two years. Raleigh-Cary, N.C., ranked ninth, is another relatively low-cost, low-hassle winner, expanding its tech employment a remarkable 32.3% in the past decade and STEM jobs 15%.

Possible Upstarts

Several places with historically negligible tech presences have broken into our top 10. One is No. 6 Jacksonville, Fla., which has enjoyed a 72.4% surge in tech employment and 17.4% STEM job growth since 2001, mostly as a result of a boom early in the decade in data centers, computer facilities management, custom programming and systems design. Another surprising hotspot: No. 10 Nashville, Tenn., where growth in data processing and systems design fueled tech industry growth of 43% along with 18.5% STEM employment growth over the past decade.

Who’s Losing Ground

Some mega-regions with established tech centers have been falling behind, notably No. 47 St. Louis, No. 45 Chicago, No. 41 Philadelphia and No. 39 Los Angeles. These areas still boast strong concentrations of STEM-based employment and prominent high-tech companies, but have suffered losses in fields such as aerospace and telecommunications. Remarkably despite the social media boom, the country’s two dominant media centers — L.A. and No. 33 New York — have also performed poorly enough that their STEM and tech concentrations have fallen to roughly the national average.

Valley Uber Alles?

Silicon Valley may be churning out millionaires like burritos at a Mexican restaurant, but looking into the future, one has to wonder if its dominance will diminish. Limited developable land, an extremely difficult planning environment, high income taxes and impossibly stratospheric housing costs may lead more companies and people to relocate elsewhere, particularly if the big paydays needed to make ends meet wind down. Mark Zuckerberg and company can bask in their big IPO this week, but the Valley may soon need to consider what it must do to compete with the many other regions that are inexorably catching up with it.

Best Metropolitan Areas for Technology Jobs Rankings


Region Rank Index Score
Seattle-Tacoma-Bellevue, WA 1 76.0
Washington-Arlington-Alexandria, DC-VA-MD-WV 2 66.4
San Diego-Carlsbad-San Marcos, CA 3 66.0
Salt Lake City, UT 4 58.5
Baltimore-Towson, MD 5 57.7
Jacksonville, FL 6 57.6
San Jose-Sunnyvale-Santa Clara, CA 7 57.2
Columbus, OH 8 52.9
Raleigh-Cary, NC 9 51.9
Nashville-Davidson--Murfreesboro--Franklin, TN 10 51.7
Boston-Cambridge-Quincy, MA-NH 11 51.4
San Antonio-New Braunfels, TX 12 50.7
San Francisco-Oakland-Fremont, CA 13 48.5
Houston-Sugar Land-Baytown, TX 14 47.6
Cincinnati-Middletown, OH-KY-IN 15 47.4
Austin-Round Rock-San Marcos, TX 16 46.8
Atlanta-Sandy Springs-Marietta, GA 17 46.5
Portland-Vancouver-Hillsboro, OR-WA 18 46.3
Detroit-Warren-Livonia, MI 19 46.0
Dallas-Fort Worth-Arlington, TX 20 44.2
Denver-Aurora-Broomfield, CO 21 42.9
Pittsburgh, PA 22 42.9
Buffalo-Niagara Falls, NY 23 42.3
Charlotte-Gastonia-Rock Hill, NC-SC 24 42.1
Indianapolis-Carmel, IN 25 41.5
Minneapolis-St. Paul-Bloomington, MN-WI 26 41.0
Providence-New Bedford-Fall River, RI-MA 27 40.5
Miami-Fort Lauderdale-Pompano Beach, FL 28 40.1
Richmond, VA 29 39.1
Phoenix-Mesa-Glendale, AZ 30 38.7
Louisville/Jefferson County, KY-IN 31 38.6
New Orleans-Metairie-Kenner, LA 32 38.0
New York-Northern New Jersey-Long Island, NY-NJ-PA 33 37.8
Hartford-West Hartford-East Hartford, CT 34 37.6
Tampa-St. Petersburg-Clearwater, FL 35 36.0
Oklahoma City, OK 36 35.7
Orlando-Kissimmee-Sanford, FL 37 35.0
Riverside-San Bernardino-Ontario, CA 38 33.8
Los Angeles-Long Beach-Santa Ana, CA 39 33.7
Las Vegas-Paradise, NV 40 33.4
Philadelphia-Camden-Wilmington, PA-NJ-DE-MD 41 33.3
Sacramento--Arden-Arcade--Roseville, CA 42 33.2
Cleveland-Elyria-Mentor, OH 43 29.9
Rochester, NY 44 29.5
Chicago-Joliet-Naperville, IL-IN-WI 45 26.0
Memphis, TN-MS-AR 46 25.8
St. Louis, MO-IL 47 24.9
Kansas City, MO-KS 48 24.4
Virginia Beach-Norfolk-Newport News, VA-NC 49 24.3
Milwaukee-Waukesha-West Allis, WI 50 24.1
Birmingham-Hoover, AL 51 11.3


Joel Kotkin is executive editor of NewGeography.com and is a distinguished presidential fellow in urban futures at Chapman University, and contributing editor to the City Journal in New York. He is author of The City: A Global History. His newest book is The Next Hundred Million: America in 2050, released in February, 2010.

Mark Schill is Vice President of Research at Praxis Strategy Group, an economic development and research firm working with communities and states to improve their economies.


Rankings Methodology

Our Best Cities for Technology Jobs ranking is a weighted index measuring growth and concentration of technology-related employment in the nation’s 51 largest metropolitan regions. The 51 regions are scored against each other on a 1-to-100 scale. The index includes both tech industry employment data and occupation-based employment data. Our technology industry component covers 11 six-digit NAICS sectors covering information industries such as software publishing, Internet publishing, data processing, and tech-related business services such as computer systems design, custom programming, engineering services, and research and development. The technology industry data covers 4.5 million jobs nationally. The occupation-based component includes 95 science, technology, engineering, and mathematics (STEM) occupations as classified by the federal Standard Occupation Classification system. This covers 8 million STEM workers that could be employed in any industry. Employment data in our analysis is courtesy of EMSI, Inc. and is based upon over 90 federal and state data sources.

The index comprises four weighted measures: 50% STEM occupation growth, 25% technology industry growth, 12.5% STEM occupation concentration, and 12.5% technology industry concentration. Growth measures are evenly balanced between the 2001-2011 growth rate and the 2009-2011 growth rate, while the concentration measure are job location quotients from 2011.

Note that there is likely to be some double-counting of STEM workers working in tech industries. The tech industries are also obviously employing others, such as salespeople, managers, janitors, etc.

Though these types of rankings typically include only industry data, we felt the STEM jobs data captured “tech” more cleanly so we weighted it higher. However we felt it still important to include the data covering the industries that most identify with the high-tech economy.  The heavier weight on STEM helps minimize the effect of a double-counted STEM worker in a tech company.

Seattle photo courtesy of BigStockPhoto.com.

Facebook’s IPO Testifies to Silicon Valley’s Power but Does Little for Other Californians

$
0
0

The  $104 billion Facebook IPO testifies to the still considerable innovative power of Silicon Valley, but the hoopla over the new wave of billionaires won’t change the basic reality of the state’s secular economic decline.

This contradicts the accepted narrative in Sacramento. Over five years of below-par economic performance, the state’s political, media, and business leadership has counted on the Golden State’s creative genius to fund the way out of its dismal budgetary morass and an unemployment rate that’s the third highest in the nation. David Crane, Governor Schwarzenegger’s top economic adviser, for example, once told me that California could easily afford to give up blue-collar jobs in warehousing, manufacturing, or even business services because the state’s vaunted “creative economy” would find ways to replace the lost employment and income. California would always come out ahead, he said, because it represented “ground zero for creative destruction.”

Schwarzenegger’s successor, Jerry Brown, and his economic team have been singing the same song, hoping, among other things, that the Facebook offering, and other internet IPOs, might bring in enough money to stave off the state’s massive, growing deficit, now estimated at more than $16 billion. Yet even as the new IPO wave has risen, California’s fiscal situation has worsened while state tax collections around the nation have begun to rise.

Of course, Facebook’s public offering will help, but only so much. According to the legislative analyst’s office, the Facebook gusher should put an additional $1.5 billion into the state coffers this year, roughly one tenth of the state deficit, with perhaps another billion in the following few years. This constitutes a nice win, but barely enough to sustain the state even over the short—not to mention the long—run.

The problem lies in large part in the nature of the economy epitomized by Facebook. Being based in cyberspace and driven entirely by software, such companies employ almost exclusively well-educated workers from the upper middle and upper classes. In the past “a booming tech economy created all kinds of jobs,” notes Russell Hancock, president and CEO of Joint Venture Silicon Valley, a key industry research group. “Now we only create these rarefied jobs.”

As Hancock suggests, this contrasts with previous California booms. Back in the ’80s or even the ’90s, California’s tech booms were felt broadly in Orange and other Southern California counties and appeared to be moving inland to places like Sacramento. Anchored by its then dominant aerospace industry, Los Angeles remained a tech power on its own while enjoying employment from a burgeoning fashion industry, the nation’s dominant port and, of course, Hollywood. 

In contrast, today’s job surge has been largely concentrated in a swath from San Francisco down to Sunnyvale. These firms create the kind of outrageous fortunes celebrated in the media, but their overall employment impact has not been enough to keep California even at parity with the rest of the country. Over the past decade, the state has created virtually no new STEM jobs (science, technology, engineering and math-related employment), while the U.S. experienced a 5.4 percent increase. Arch rival Texas enjoyed a STEM job gusher of 13.6 percent. More important still, mid-skill jobs grew only 2 percent, one third the rate nationally and roughly one fifth the expansion in the Lone Star State.

Even the Bay Area itself has enjoyed less than stellar growth. Indeed, even now overall unemployment in the Valley remains at 9.3 percent, below the state average of more than 11 percent but higher than the national average. The Valley now boasts 12 percent fewer STEM jobs than in 2001; manufacturing, professional, and financial jobs also have shown losses. Overall, according to research by Pepperdine University economist Mike Shires, the region at the end of last year had 170,000 fewer overall than just a decade ago.

Today’s Valley boom is also very limited geographically as well, with most of the prosperity concentrated in the Peninsula area, particularly around places like Mountain View (headquarters of Google), Menlo Park (headquarters of Facebook) and in pockets of San Francisco. Meanwhile, San Jose, which fancies itself “the capital of Silicon Valley,” faces the prospect of municipal bankruptcy, a fate increasingly common among cities across the state.

The magnetic pull of the current tech boom is even weaker across the bay in the Oakland area, where unemployment scales to 14.7 percent. According to the recent rankings of job growth Shires and I did for Forbes, Oakland ranked 63rd out of the nation’s 65 largest metropolitan areas, placing between Cleveland and Detroit.

Outside of San Diego, which has continued to gain jobs, the echoes of the tech “boom” are even fainter elsewhere in the state. Sacramento placed 60th in the job creation study, just behind Los Angeles, by far the largest region in the state. Former high-flier Riverside-San Bernardino ranked 50th, while the once booming “OC,” Orange County, could do no better than a mediocre 47th.

These economies have also become technological laggards. According to a study on tech job creation by my colleague Mark Schill, greater Los Angeles, Sacramento, and Riverside-San Bernardino, three large regions, now rank  in the bottom third in tech growth. The Los Angeles area, once the global center of the aerospace industry, now has a lower percentage of jobs in tech-related fields than the national average.

Beyond the big coastal cities, in places few reporters and fewer venture capitalists travel to, things are often worse. Fresno, Modesto, and Merced have among the weakest employment numbers in the nation. They may be partying in Palo Alto, but things are becoming increasingly Steinbeckian just 50 miles inland.

This is happening even as there has been an ominous decline in the overall quality of California’s talent pool. For residents over age 65, the state ranks 2nd in percentage of people with an AA degree or higher, but among workers 25 to 34 it falls to 30th. Even worse, according to National Assessment of Educational Progress, California eighth graders now rank 47th in science-related skills, ahead only of Mississippi, Alabama, and the District of Columbia.

None of this seriously affects the new wave of Valley firms. A Google, Apple or Facebook can cream the top not only of the California workforce, but the most gifted drawn from around the world. The old Valley depended on engineers and technicians cranked out in unheralded places like San Jose State and the junior colleges; the new Valley simply mines Stanford, CalTech, Harvard and MIT for its most critical raw material.

This reflects the contradiction inherent in California’s emerging economy.  High-end, massively financed tech firms like Facebook can endure the Golden State’s weak general education, insanely tough regulations, high energy costs, and rising tax rates. Silicon Valley software firms generally tend to support, or certainly don’t oppose, the draconian energy, land use, and other state regulations widely opposed by other, less ethereal industries.

The main reason: costs cannot be so well sustained outside the favored zones. This explains why people are not flocking in large numbers to California anymore. Last year, according to IRS data, California ranked 50th ahead of only Michigan--for rate of in-migration. So as the most gifted young nerds cluster around Palo Alto, middle-class families leave; between 2000 and 2009, 1.5 million more domestic migrants left the state than came. Even the Bay Area--the epicenter of the boom—has been losing 50,000 domestic migrants a year, due to unsustainably high housing prices and a narrower range of employment options for all but the best educated.

Many of these people–and companies—are moving to places that are far less attractive in terms of climate or culture, such as Utah, Texas, or even Oklahoma. The migrants may miss the beach or the temperate climate but reap huge benefits from lower home prices, lower taxes, and much better business environments. 

Of course, any state would welcome the windfall that is coming from Facebook and other dot.com phenomena. But the celebration over IPOs and rich payouts obscures the greater danger that threatens the future of the Golden State. The current boom demonstrates that Californians can no longer count on the prosperity of a few as the harbinger of better things for the rest of us. Instead Californians now inhabit, as a recent Public Policy Institute of California study    suggests, a society that is increasingly class divided, far more so than the national average.

Ultimately, one should not expect Facebook, or any company, to solve these vast problems. To expect this tech wave to reverse California’s decline is nothing short of delusional. 

Joel Kotkin is executive editor of NewGeography.com and is a distinguished presidential fellow in urban futures at Chapman University, and contributing editor to the City Journal in New York. He is author of The City: A Global History. His newest book is The Next Hundred Million: America in 2050, released in February, 2010.

This piece originally appeared in The Daily Beast.

Facebook photo by BigStockPhoto.com.

CNU20: Shootout at the New Urbanism Congress

$
0
0

I knew there was the possibility that this month's Congress of New Urbanism — CNU20 — in West Palm Beach would be an exercise in brainwashing. While I was excited to be meeting some of the thinkers at the forefront of my profession, I certainly was aware that the founders of the movement were opinionated and outspoken. The number of attendees has way outgrown the close dinner group that began New Urbanism more than 20 years ago, but heavy hitters like Andres Duany, Elizabeth Plater-Zyberk, Ellen Dunham-Jones, and John Norquist, to name a few, still have a big hand in the direction of the movement.

I was pleasantly surprised to find just the opposite. The first session was a debate on theology between two very prominent urban designers, Daniel Solomon and Andres Duany, which set the tone of challenging our own and each other’s beliefs in what New Urbanism is and should be.

During what is hopefully the worst economic downturn I will ever see there has been almost no New Urbanism development. The movement, along with the rest of the housing market, has stalled. When the market picks back up will developers and planners condemn the stringent LEED-ND framework, a prescriptive guide for sustainable development developed in part by the CNU?

Daniel Solomon thinks so. In Solomon’s lecture, which he humorously titled “My Dinner with Andres,” he challenged the prescriptive and code-based turn New Urbanism had taken, saying that the movement’s implementation guide, particularly LEED-ND, “strangles and sucks the life out of the American economy.” He blamed Duany’s Smart Code and Manual, describing Duany as a man who was rigorous and defiant in his beliefs, and simultaneously as a man who questioned his own ideas constantly, saying “Andres Duany creates an intellectual straightjacket that others wear, but that he won’t even put one arm in.”

I think I understand why people gravitate towards concrete codes and manuals. We live in a time that is full of challenges for our built environment. People feel comforted by a set of rules: Here’s a problem, and if I follow this, I can fix it. This equals confidence and control for urban designers and planners.

But perhaps Solomon’s most striking argument was to call the New Urbanist code a “reductive certitude” that was no different than Le Corbusier’s Athens Charter. For the uninitiated: Just the mention of this document makes planners shudder. It is blamed for some of the biggest idealistic planning screw-ups ever. Solomon’s argument was that, like Duany’s Smart Code, Le Corbusier's plan was written with certainty, and with little room for questioning. It was a quite a slam to compare Andres Duany, the founder of the very movement to which all in attendance subscribe, to Le Corbusier, often cited as the destroyer of city life. Man, were we in for a rebuttal.

And we got one.

I was eagerly watching the first row for the response of some of the New Urban heavies. Ellen Dunham-Jones leapt up immediately, cheering and loudly applauding. It was obvious that there was a divide in this union, but it existed in a context that welcomed it.

Duany came out on fire in defense of his “straightjacket,” saying that the code allows for local calibrations and adaptations. His argument focused on the fact that the real world is a world of laws, not a world of opinions and ideas, and that the same system that was used to destroy the urban form can be responsible for fixing it. Disputing the notion that without a code planners will be free, he made the case that the building code is the default setting for US municipalities, it is not going away, and that we need to use it to make change. In short, don’t fight the system; use it to your advantage.

Interestingly, Duany also defended those who love traditional suburbs. He described research exercises where people were shown a picture of an ideal New Urbanism development, and a picture of typical suburban scenario. The former usually contained a compact, dense cottage with a picket fence and beautiful streetscape. The latter contained a plain house with garage alongside the front door, sitting on a large, empty street. Despite the obvious attempt to sway opinion, 30% of people still chose the suburban scenario as their optimal place to live. He takes the stance that these people’s freedom to choose older-style suburbs must be protected, and that his smart code provides for that.

I challenge you to watch the session here and ask yourself the same questions about New Urbanism that these men do. I look forward to sharing my response to the other sessions at CNU20. Stay tuned....

Erin Chantry is an Urban Designer in the Urban Design and Community Planning Service Team with Tindale-Oliver & Associates, and the author of At the Helm of the Public Realm. A different version of this post appeared there. With a BA in Architecture, an MA in Urban Design, and an MSc in Urban Planning, she has served

Flickr photo by Florida Community Loan Fund, Townhouses at Henrietta, West Palm Beach, FL. Developed by New Urban League CDC / Urban League of Palm Beach County.

CNU20: New Urbanism Suffers Some Young Adult Angst

$
0
0

Possibly the most earnest folks in the real estate development industry assembled for the 20th anniversary of the founding of the Congress of the New Urbanism in West Palm Beach, Florida this month. Among the excellent accomplishments of CNU20 attendees: a credible car/pedestrian strategy, some fine looking new communities, and perhaps best of all, a body of hard-won knowledge about town-making for citizen education.

Officially, CNU20 was optimistic and confident, but an undercurrent of negativism marred the event. More than one New Urbanist questioned the validity of what by now should have been a transformative movement. But the imposition of form-based codes and regulations on city growth has become a stress point in the movement's evolution.

Three hundred communities now boast New Urbanist town planning, over a dozen communities have adopted form-based zoning, and urban design schools are teaching the New Urban principles all over the country, facts triumphed during the opening plenary session. Form-based zoning uses a hierarchy of increasingly dense districts with defined boundaries, rather than land-use (or Euclidian) zoning to regulate growth. These principles are exquisitely defined in a model code nicknamed the Smart Code, which defines street width and sidewalk width, and provides fine-grained guidance on the form of a building on a given lot. Participants in early work sessions were taught how to work the code, and walked the hot, humid streets of West Palm Beach to interpret its many nuances and subtleties.

In 2003, Downtown West Palm Beach was redeveloped, and it should be a proud example of the earliest New Urban efforts. Instead, conference participants spoke of the result with open distaste. The main outdoor plaza features a noisy fountain, which a group of attorneys, architects, and land planners belittled as "a mini Bellagio”; a pale imitation of the huge Las Vegas hotel's water feature. Andrés Duany, one of the founders of the CNU, stated during the conference that “much of the architecture of the downtown zone was junk.” The movement’s most flamboyant spokesman, James Howard Kunstler, cited the "cartoonish, low quality finish of the buildings” as a failure. The distance New Urbanists have put between themselves and one of their finest achievements is dismaying.

When not complaining about West Palm Beach, many practitioners wandered the somewhat sparse exhibit hall of booths sponsored by municipalities, attorneys, and consultants. Conversations often hit notes of personal suffering. Few new communities of any scale are being funded, so just as the supply of highly trained New Urbanists has hit the market, demand has dwindled to a trickle of infill projects here and there. Morale at the ground level was quite low, given the effort New Urbanists have put forth.

Pedestrian-based urban form is a science that New Urbanists can offer to every community, and it has been a win for them where it has been implemented. Our monocultural vehicular transport model of car-dominated cities has made people work hard to carve out social space. The New Urbanist critique of the aesthetics of transportation is right on target. Armed with plenty of real data about how pedestrian environments work, New Urbanists have succeeded at softening the city and allowing pedestrians to compete.

New Urbanists can also point to successes in the real estate market. In one study session, three single-family residential New Urbanist communities were analyzed, and the developer’s financial models were revealed. Each of the three communities fared better than their competitive set through the 2008-2012 cycle, in terms of net present value, appraisals, and foreclosure rate. New Urbanists claimed credit for this, although the affluent demographics and in-town locations tilted the plate in their favor. Still, New Urbanists have created a strong model that works for a segment of the population.

Perhaps New Urbanism's most potent contributions are to the art and science of traditional town planning. A solid body of knowledge that is based upon beautiful real places— Charleston, South Carolina and Savannah, Georgia, to name just two — now informs much of the theory behind place-making. We Americans are notably unsentimental about our cities, tearing down landmarks and whole districts in the quest for efficiency and betterment. New Urbanists have made it fashionable once again to care about history and good design, and our cities are the better for it.

The CNU’s 20th anniversary marks a curious point in the life of this laudable and lasting movement. Because there isn't any new development occurring, government effortshave turned towards adding form-based code overlays to existing cities. Already, Miami and Philadelphia have passed these codes to regulate growth. Many other cities like Orlando operate a standard zoning code by ordinance, while enforcing a form-based code as well. Property owners, developers, and design teams must now satisfy the intricacies of two local codes, rather than one, to get a building permit.

While de-regulation is a term on everyone’s lips, this quiet up-tick in regulation has occurred largely under the radar screen. Those pushing for form-based code are largely consultants, who argue that the code will make for a better city by protecting us from ourselves. Municipal officials are amenable to, it, too.Both groups see the job security it promises them. Developers see profit if their communities can boast adherence to a strict code that promises a better lifestyle.

Developers would normally scream loudly at any new regulation, no matter how trivial, but they are passively allowing form-based code because of the effect it can have on their bottom lines.
If these codes tend to increase cost, well, the financial investors don’t complain, because the more money that's borrowed to complete these structures, the more interest income they earn. So — form-based codes benefit all the interest groups that advocate their implementation.

At CNU20 we witnessed the coming of age of a new regulatory regime. Place-making, once an activity trusted to individual citizens, has become codified; a vision enforced by authorities and interpreted by high priests who have special training to understand how to make a proper city. Maybe we have so abused our power as individuals that we deserve to have this power taken away. Perhaps our city form is so ugly, and so dysfunctional, that we cannot rescue it without serious intervention.

Or, perhaps not. The American Dream is not about freedom from sprawl, as suggested in the movement’s seminal manifesto, “Suburban Nation”. Rather, it's about freedom to choose. New Urbanists might be able to provide this freedom within the confines of a new institution, the Smart Code, as long as the Smart Code produced good results. But if the critique at CNU20 of their own Downtown West Palm Beach is any indication, the Smart Code ain’t so smart after all.

American town planning needs less regulation, not more. Let’s use CNU’s body of knowledge to educate citizens and provide a path forward, not with the manacles of a new code, but with the freedom to create a new urban form that suits the lifestyles of the 21st century.

Flickr photo by Eric Alix Rogers, New Urban, in Six Corners, Chicago. New houses, all facing a common sidewalk, with garages on alleys behind. Off of Kilbourn, just south of Irving Park.

Richard Reep is an architect and artist who lives in Winter Park, Florida. His practice has centered around hospitality-driven mixed use, and he has contributed in various capacities to urban mixed-use projects, both nationally and internationally, for the last 25 years.

How “Public” Is the Public Sector?

$
0
0

You may have heard the old joke about the convenience store with a neon sign blaring, “Open 24 Hours”. A customer stops in one morning for coffee, and confronts the store’s owner, “Your sign says ‘Open 24 Hours’, but I stopped by last night at midnight for a pack of smokes and you were closed.” The owner replies, “Oh, we’re open 24 hours…just not in a row.”

I’ve been reminded of this exchange during one of the more intriguing battles over what “public ownership” means in California's state parks. Governor Brown has designated 70 of them (out of 278) for closure in an effort to help close the state’s chronic multi-billion dollar budget deficit. In response, a Marin County Democratic Assemblyman, Jared Huffman, offered AB 42. The measure, which has now been signed into law, makes it easier for non-profits to enter into operating agreements with at least 20 of the parks on the chopping block. The law cuts the typical red-tape involved in forming such a “public-civic partnership”, including greater freedom in hiring and providing some added legal protections. And AB42 has been written specifically to hold local governments harmless from possible shoddy work, so lawsuits aren't an issue. Over the last six months a number of parks have started making such arrangements and will continue to operate. But this is not without some consternation.

The first AB42-enabled contract has recently been signed between the previously closed Jack London State Park in Sonoma County and the Valley of the Moon Natural History Association, which will handle staffing and maintenance for this $500,000 annually budgeted facility. The Association plans to cover expenses through a mix of fundraisers, volunteer labor, and creative marketing.

Asked for her opinion on these new public-civic partnerships, state Sen. Noreen Evans (D-Coastal Northern CA) recently told The Huffington Post why she disliked the legislation: “My own philosophy is that a state park should be owned and operated by the public. Any time you turn even a portion of a state park away from public control, you always have the problem that the park's interest becomes inconsistent with serving the public." But this leaves open the question of what the senator means by 'owned and operated by the public'?

Of course a state park is 'owned by the public' in the broadest sense, but what control do I, as a Californian, really have over how my state parks are run? In many of these AB 42 relationships between state parks and local organizations, the public is far more involved in the maintenance and running of these places than they were before.

In another issue I’ve written about, a group of parents and community volunteers were threatened with a union lawsuit if they persisted in their efforts to assume administrative tasks in a San Francisco Bay Area junior high school that had been hit with several years of budget cuts.

The local chapter of the California Service Employees’ Association (CSEA), sought to prevent parents and residents from volunteering as playground supervisors and back office staff. Said CSEA local president, Loretta Kruusmagi, “As far as I’m concerned, they never should have started this thing. Noon-duty people [lunchtime and playground assistants]—those are instructional assistants. We had all those positions. We don’t have them anymore, but those are our positions. Our stand is you can’t have volunteers, they can’t do our work.”

Notice the sense of ownership over these public sector positions. Even in the face of dire municipal fiscal situations, with stark choices between whether or not to continue services everywhere from parks to libraries, public sector unions are increasingly challenging local volunteers who are attempting to fill the gap. It is easy to wonder whom are the real “public servants” – the employees or the parents? As to complaints about the quality of volunteers, I'm not sure unprofessional behavior by volunteers outnumbers - even per capita – that by unionized/fulltime employees.

A similar story is being written currently in the West Los Angeles area Culver City Unified School District. Here, in an interesting twist on the aforementioned tale, a service union in a local elementary school is seeking to force willingly lower paid classroom attendants to unionize, and demanding that a local charity pay for these unionized positions. The El Marino Language School has been a dual language (Spanish and Japanese) immersion program for more than two decades.

A “blue-ribbon” school in California, the students of El Marino have scored exceedingly high in a number of categories . In order to keep the students “immersed”, the school began hiring native language-speaking “adjuncts” to work in classrooms for a few hours each day – usually a couple of days per week. An additional element to what the district usually supports, these positions – often filled by parents of current or former students with teaching experience – are supported by a group of local booster clubs.

The longtime program apparently escaped the watchful eye of the Association of Classified Employees (“ACE”), which represents service employees in the district. Upon learning that these non-unionized “adjuncts” were working at El Marino, ACE gave the district an ultimatum: force them to unionize or allow us to bring in our own “adjuncts”.

The current battles over how “public” libraries will be run in California casts a bright light on the use of this rhetoric by municipal unions seeking to keep out competition from private organizations. The city council of Santa Clarita, voted to withdraw from the Los Angeles County system, and contract out their three libraries to LSSI (Library Systems and Services), a private company based in Germantown, Maryland.

The response from some residents and the library employees’ union was an outcry at the supposed “privatizing” of the public library. As the New York Times reported, protest signs at the council meeting declared, “keep our libraries public”, as if access to their libraries was going to be constrained by LSSI. As then-mayor pro tem, Marsh McLean responded, “The libraries are still going to be public libraries. When people say we’re privatizing libraries, that is just not a true statement, period.”

Faced with the prospect of more communities deciding to offer library services through contracted firms, California’s SEIU lobbied the Legislature for passage of AB 438, which adds extra hurdles to city councils making these decisions. Proclaiming that they had “beat the privatization beast in California”, LA County Community Library Manager and SEIU Executive Board Member, Cindy Singer said, "By signing AB 438, Governor Brown put taxpayers and the public ahead of the profits of privately held corporations.” But, once again, knowing exactly what “public” Ms. Singer is referring to requires some circuitous thinking.

Her statement is patently untrue in Santa Clarita, where, as Atlantic Cities describes, “Hours have increased. The library is now open on Sundays. There are 77 new computers, [and] a new book collection dedicated to homeschooling parents and more children's programs.” It appears Santa Claritans have come out “ahead”.

The macroeconomic term “crowding out” is broadly used to describe the adverse impact on private investment created by government action. The phrase also applies to the negating influence government-delivered services can have on the actions of non-profits and businesses. This is not to say that volunteers and businesses can (or should) fill all the gaps exposed by the fiscal crisis, but it may be time to consider a new phrase, as Americans assume an old role: “crowding in” anyone?

Pete Peterson is Executive Director of the Davenport Institute for Public Engagement and Civic Leadership at Pepperdine University's School of Public Policy.

Flickr Photo by robinsan, Parking Volunteer

Viewing all 3792 articles
Browse latest View live


Latest Images