Quantcast
Channel: Newgeography.com - Economic, demographic, and political commentary about places
Viewing all 3789 articles
Browse latest View live

No, It's the Deniers who Are Wrong

$
0
0

Dennis Meyers is the Principal Economist at California’s Department of Finance. He has recently published two parts of what is promised to be a four-part series titled The Declinists are Wrong. He intends to convince us of “the fundamental strength of the Golden State’s dynamic and vibrant economy.”

I was going to wait until the entire series was complete before commenting, but part one and part two are so poorly argued that I feel compelled to respond now.

In part one, Meyers argues that California’s economy is strong because it is big. He points out that California represents about 12 percent of the United States population and is the ninth largest economy in the world.

This is, as Mr. Spock would say, highly illogical. It just doesn’t follow that just because you are big you will have a “dynamic and vibrant” economy. Instead, we have lots of counter examples. Great Britain was once large, wealthy, vigorous, and powerful. Not anymore.

Closer to home, we have Detroit. In 1950, Detroit’s population was 1.85 million, and it was America’s fourth largest city. Today, Detroit has a population of only 713,777. Its once-vigorous economy is not even a shadow of its former self. Its government is unable to even keep the lights on. It turns out that the lights do go off before the last person leaves.

In part two, Meyers argues the California is wealthy and this assures a prosperous future. This is, of course, the same logical fallacy as in part one. Detroit was also once one of America’s richest cities.

Meyers makes another mistake: He talks about average incomes. When it comes to incomes, averaging hides California’s real story, which is its increasing inequality and increasing poverty. California has two of America's poorest cities. Fresno, with a poverty rate of 30.2 percent, is the eighth poorest American city over 200,000 population. San Bernardino, in the same category, and with a poverty rate of 34.6 percent, is second only to Detroit.

One of the denialists’ favorite tactics is to find a data point where California does pretty well, and then argue that the selected data point is a reason for the state to do well. Call this a selective data bias. Of course, expanding from the specific to the general is a logical fallacy. This dog is brown therefore all dogs are brown.

Typically, venture capital is the selected data. A huge percentage of the nation’s venture capital is invested in California, no doubt about it. The problem is that the nation’s venture capital is not all that much. In 2011, California received 51 percent of the nation’s $28.76 billion venture capital net investment — $14.76 billion, which represents less than one percent of California’s almost $2 trillion economy. Almost all of it went to four counties in the Bay Area.

Meyers takes selective data analysis to a new zenith. He digs through California’s jobs data to find small sectors that are generating jobs at a faster rate in California than nationwide. For example, California's Computer and Electronic Production Sector (a sub-category of Durable Manufacturing) created jobs at a rate of 2.1 percent in 2010, compared to a national rate of 1.1 percent.

That’s all well and good, but over the past 12 months, California has lost durable manufacturing jobs. The growth that Meyers cites has only slowed California’s manufacturing jobs losses. Slowing decline is welcome, but it’s not a sign of imminent prosperity.

And he adds a nice touch discussing mining:

"The one high-wage sector in which national job gains outpaced those in California was Mining, which includes oil and natural gas production. There are several regions, such as Texas, that are blessed with generous deposits of these resources which California lacks. This advantage also shows up in Engineering Services employment…. The presence of healthy oil and natural gas resources typically generates demand for engineering consulting services related to exploration and extraction."

That’s just wrong. California has abundant oil and natural gas resources. In fact, recent California discoveries are roughly equivalent to the proven reserves of Nigeria, the world’s 10th-largest oil producer. We’ve chosen not to extract them. We’ve also chosen to no longer exploit California’s vast mineral resources.

Chris Thornberg, Beacon Economics founder and economist, recently came up with a novel argument to deny California’s decline. He says that since recent jobs data have been revised upward, “we are in full recovery mode and not looking back.” The problem here is that the jobs data were revised from terrible to merely dismal.

Look at the data. Below are two charts summarizing changes in jobs since the pre-recession peak. The first is the United States. California is the second. Both are pretty discouraging. Four and half years after the recession, the US is still down almost 5 million jobs. This represents about a 3.5 percent net decline. California, down almost a million jobs, is even worse — down a net 6.2 percent.

Job Changes From the Peak

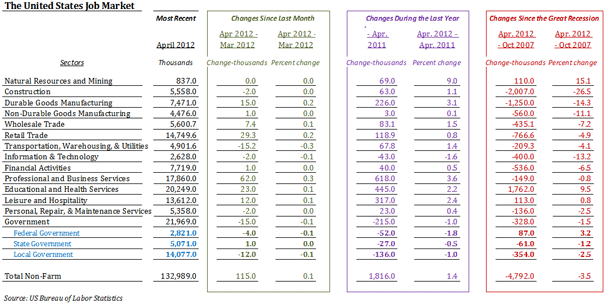
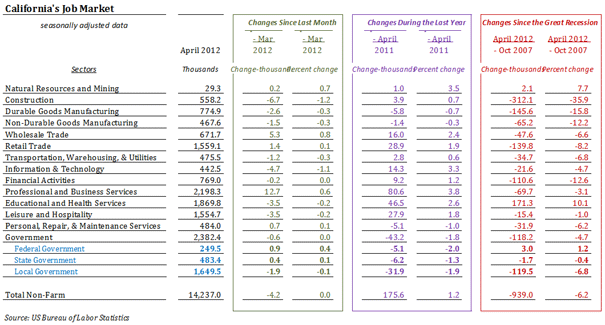
California has also seen slower-than-US job gains over the past year. It is worse than that, though. California has lost jobs in durable manufacturing, non-durable manufacturing, and in the other services category, labeled as Personal, Repair, & Maintenance Services in the table. By contrast, the US only saw job losses in one sector over the past year, the information and technology sector.

The very recent news is worse. In March, the most recent month for which we have data, California lost jobs while the nation gained. And the number of declining sectors has expanded to include construction, durable and non-durable manufacturing, transportation, warehousing, utilities, education/health, and leisure/hospitality.

The signs of California’s weaknesses are all around us. With about 12 percent of the US population, we have about a third of the nation’s welfare recipients. It tops the nation in teen unemployment. Domestic migration has been negative for about two decades, after a century-and-a-half of being the destination for people from all over America.

California’s weakness is the result of California’s choices. It has chosen to be anti-oil and anti-gas, and to unilaterally implement the nation’s most restrictive environmental regulations. California has elected to impose the nation’s most restrictive regulatory regime on all businesses and an onerous tax system. In short, California has chosen to be anti-opportunity and to have a weak economy. The denialists have chosen not to see California’s decline.

Flickr Photo by Steve Rhodes: Jobless not Hopeless, Ask for my resume - Chris Stewart, Union Square, San Francisco 2009

Bill Watkins is a professor at California Lutheran University and runs the Center for Economic Research and Forecasting, which can be found at clucerf.org.


Cities, Cars, People: Is Changing Car Use a Function of New Urbanism?

$
0
0

One cornerstone for urban designers and planners seeking to transform the polycentric or suburban city of the 20th Century into something resembling the high density city of the 19th was a cross-city comparison by Newman and Kenworthy and successors. [1]   They argued that this proved automobile dependence is a function of city density.  It followed that regulating for greater residential densities and increasing the capacity of public transport systems to avoid the congestion that would follow if people continued to drive themselves would improve the sustainability of cities.

Of course, any comparison with the overcrowded and unhealthy cities of an earlier century is unfair: today’s density is achieved with higher standards of private and public space, and much enhanced transit and sanitation.  And many, probably the majority, of 21st century citizens in high income nations can escape the confines of the urban environment on occasional sojourns to country or coast (or beyond), unlike their 19th Century or developing world counterparts.  They can even find repose in the midst of 24/7 city hubbub in their own in-house media centres.

But can we really build urban policy on the Newman and Kenworthy analysis?  Especially given evidence that car use is declining anyway?

Questionable correlation
There are still questions over the original analysis and it successors.  Cross-cultural effects, physical geography, differences in economic structure, incomes, wealth, and growth all intervene in the relationship between city density and car dependence.  And cause and effect are hard to pin down. 

Perhaps more critical: the leap from observing relationships across cities at a point in time to regulating travel behaviour, housing ,and consumption choices into the future assumes that individual behaviour is a microcosm of collective behaviour. This fallacy of inference has long been recognised by the biological and sociological sciences.  And the likelihood of getting policy wrong by making such an assumption is far greater when dealing with populations of people, with their diverse circumstances, beliefs, values, and means, compared with, say, populations of penguins. 

Is it this blind spot that has made it so much more difficult to get people out of their cars or their low density houses than anticipated by urban reformists?

The city as a time warp
One problem is that analyses of city density and car dependence are usually static.  Plotting urban form and transport consumption at a particular point in time – the mid/late 20th century in the Newman and Kenworthy case – embodies particular patterns of technology, wealth, and behaviour.  Consequently, their urban prescription is based implicitly on the 9 to 5 work day; single city centres that focus urban employment, exchange, and consumption; and the nuclear family with its distinctive housing and service demands. These are all urban artifacts that have been breaking down since the 1960s.

But the times they are a-changing
In a 2011 paper the authors acknowledge that things are changing as international evidence shows rates of car use beginning to decline in parts of the world.  A partial view of what they are changing from, though, sustains a deterministic explanation of the why and what they are changing to:

“technological limits set by the inability of cars to continue causing urban sprawl within travel time budgets; the rapid growth in transit and re-urbanization which combine to cause exponential declines in car use; the reduction of car use by older people in cities and among younger people due to the emerging culture of urbanism and the growth in the price of fuel which underlies all the above factors”.[2]

The view remains time-bound; even the reference to exponential decline is a simplistic inference of the relationship between public transport and car use taken from a cross section of cities in 1995. 

Individual agency barely gets a mention.  Any description of an “emerging culture of urbanism” needs to be embedded in the reality of evolving patterns of wealth, income, and consumption and even in simple demographics to determine just how real and significant it is.

Growing old and driving more
What are the grounds for the claim that older people are reducing their car use, for example? I took a quick look at the evidence for New Zealand.  It is certainly not the case here.  The rate of growth in driving has been higher among older age groups than among younger – with decline most evident among the under 45s.  

Is it so different in the other ageing societies from which Newman and Kenworthy draw their examples?

Figure 1: Changes in Annual Driving Distance by Age, New Zealand 1990-2008


Fewer kilometres doesn’t mean less dependence
What does go a long way to explaining declining car travel in the aggregate is the fact that older people don’t drive as much younger people, and populations in western cities are simply getting older.  It’s simple maths – as the population ages car usage will go down, despite a greater propensity to drive among older cohorts. Again, look at the evidence from New Zealand:

Figure 2: Automobile Dependence by Age Group, New Zealand 2004-2008


Car usage appears to decline after age 44, rapidly after retirement age, 65. 

Why does car use fall with age?
There are a number of reasons why this may be so.  From 45 years on households have fewer transport-dependent children.  Mature families may have more localised social networks.  A greater share of recreation may be neighbourhood based.

On retirement work trips disappear and incomes, discretionary dollars and consumption fall.  The capacity for more shared travel and trip planning increases as households age.  Diminished car use doesn't necessarily mean that households are less automobile dependent.  They just doesn’t generate as much travel demand.

These explanations don’t depend on particular urban designs.  Yet Newman and Kenworthy claim that diminished driving happens because “older people move back into cities from the suburbs”.  This is not consistent with the common observation of people’s preference to age in place.[3]  (For the New Zealand evidence, see my posting Ageing in the City).

Moving into the centre - a one-way street?
And their notion “the children growing up in the suburbs would begin flocking back into the cities rather than continuing the life of car dependence” rather simplifies a historically specific event: the transition of sons and daughters of the baby boomers from young adulthood, advanced education, and job seeking to the career and housing paths associated with their movement into more stable relationships.  As they age, it is highly likely that suburban preferences re-emerge, sustained by the capacity to purchase and operate a private vehicle.

Generation X boosted inner city dwelling over the past two decades, and Generation Y will do so, to a lesser extent, for another decade.  The 15 to 24 year age group also coincides with the age of greatest automobile independence (illustrated for New Zealand in Figure 3).  But don’t expect this historically-specific phenomenon to sustain some sort of indefinite culture of city consolidation, and I wouldn’t bet the fiscal bank on expensive transit systems designed around the assumption that it will. 

These are passing generations: their successors will be that much smaller and facing a somewhat different world.[4]

Figure 3: Use of non-Automotive Modes by Age Group, New Zealand 2004-2008


Who are we planning for?
Of course, there are plenty of exceptions to prove the rule: but that is the point.  Diverse communities have diverse expectations and behaviours. And they are continuously changing, in composition, in form, and in behaviour. 

The failure of modernity lay in its assumption of conformity and convergence, compounded by the conceit that we could regulate for it.  And planning for what is little more than a statistical construct – the auto-independent city – risks blinding us to the richness and opportunity of alternatives, of lifestyle, of environmental stewardship, of urban design, and of mobility.

If we start with the behaviour of individuals and households our designs for sustainable cities may be less deterministic and our planning less didactic, better informed, lighter in touch, and a lot more effective in meeting the long-term needs of evolving urban communities.

Phil McDermott is a Director of CityScope Consultants in Auckland, New Zealand, and Adjunct Professor of Regional and Urban Development at Auckland University of Technology.  He works in urban, economic and transport development throughout New Zealand and in Australia, Asia, and the Pacific.  He was formerly Head of the School of Resource and Environmental Planning at Massey University and General Manager of the Centre for Asia Pacific Aviation in Sydney. This piece originally appeared at is blog: Cities Matter.

Aukland photo by Bigstockphoto.com.


[1]            Newman, P and Kenworthy J (1989) Cities and Auto Dependency: A Sourcebook. Gower, Aldershot
                     Newman, P and Kenworthy, J Sustainability and Cities: Overcoming Automobile Dependence, Island Press, Washington, D.C.
[2]        Newman P and Kenworthy J (2011) “‘Peak Car Use’: Understanding the Demise of Automobile Dependence”, World Policy Transport and Practice, 17, 2, 31-42
[3]        Pynoos R, Caraviello R, and Cicero C (2009) “Lifelong Housing: The Anchor in Aging-Friendly Communities”, Journal of the America Society on Aging, 33, 2, 26-32
[4]         For New Zealand, check the numbers

Millennials’ Home Ownership Dreams Delayed, Not Abandoned

$
0
0

Eighty percent of Americans buy their first house between the ages of 18-34. While the Millennial Generation’s (born 1982-2003) delayed entry into all aspects of young adulthood has sometimes been characterized as a “failure to launch,” the generation’s  preference for single tract, suburban housing should become the fuel to ignite the nation’s next housing boom as Millennials  fully occupy this crucial age bracket over the next few years.

According to a study by Frank N. Magid Associates, 43 percent of Millennials describe suburbs as their “ideal place to live,” compared to just 31 percent of older generations. Even though big cities are often thought of as the place where young people prefer to live and work, only 17 percent of Millennials say they want to settle  in one. This was the same percentage of members of this generation that  expressed a preference for living in either rural or small town America. Nor are Millennials particularly anxious to spend their lives as renters. A full 64 percent of Millennials surveyed, said it was “very important” to have an opportunity to own their own home.

That hasn’t stopped a number of commentators from arguing that Millennials ought to prefer renting a loft apartment to buying a house and that   they would be better off doing so. For example, sociologist Katherine Newman, is “hoping that the Millennial Generation doesn't set its sights on homeownership as a benchmark of economic stability, because it's going to be out of reach for so many of them that it will just be a recipe for frustration."

But survey research suggests it may be her hopes that will be dashed as the Millennial Generation matures. Eighty-four percent of 18-34 year olds who are currently renting say that they intend to buy a home even if they can’t  currently afford to do so. As Neal Coleman, a married Millennial in his mid-twenties, put it, "You're freer when you own your own home, your own land. You're not beholden to a renter's contract, or lease. My feeling is that homeownership is an investment in being able to control your surroundings, to build a life for you and your family."

Glenn E. Crenlin from the Runstad Center for Real Estate Studies at the University of Washington believes that “what we're looking at in terms of the Millennial Generation is likely only a delay in homeownership of three to five years, not a long-term trend away from homeownership itself." He cites census data from the American Community Survey that shows a significant increase in homeownership among Millennials as compared to Baby Boomers when they were at the same age that Millennials are now.  “While 900,000 households in the Millennial Generation [now] own their own home, only 500,000 Baby Boomer households owned their own homes at the same point in their lives.”

This data suggests the key to a resounding revival of America’s housing market may be the availability of affordable homes in neighborhoods with amenities that would appeal to Millennials and their young families. As always, safe streets and good schools are key components of such an environment. But so too are short commutes to work and nearby shops featuring the local products that appeal to younger customers.

Such neighborhoods already exist in many close-in suburbs whose housing stock is in need of some renovation, or “gentrification,” from energetic owners committed to improving their local community. These attributes describe Millennials precisely. Their willingness to invest sweat equity in rehabilitating their first home should be rewarded in the financing process either by counting its value toward a down payment or using it to wipe out some of the outstanding student debt with which many of the members of this generation are burdened. Alternatively, homes could be offered to Millennials as rentals with an option to buy and with the cost of any renovations performed by the renter deducted from the down payment required to make the conversion from rental to ownership.

Recently, National Association of Realtors President Moe Veissi announced that "Realtors are committed to ensuring that the dream of homeownership can become a reality for generations of Americans to come." To start making that dream come true for Millennials, realtors and those who finance home purchases need to create innovative new offerings tailored to the needs and wants of Millennials. Policies and programs that will  enable America’s most populous generation to own a  piece of the American Dream offer the best hope for igniting the home construction boom critical to boosting country’s still sagging economy.

Morley Winograd and Michael D. Hais are co-authors of the newly published Millennial Momentum: How a New Generation is Remaking America and Millennial Makeover: MySpace, YouTube, and the Future of American Politics and fellows of NDN and the New Policy Institute. Full disclosure: Michael D. Hais retired in 2006 as Vice-President of Entertainment Research from Frank N. Magid Associates after a 22 year career with Magid and continues to do occasional work for the firm.

New home photo by BigStockPhoto.com.

Historic Heritage of the Rust Belt

$
0
0

I’ve been spending a lot of time in Ravenna recently. No, not the town in Italy with its early Christian buildings and glittering mosaics. I mean Ravenna, Ohio, a small industrial city of some 12,000 people near Akron. 

Along with Akron and Cleveland, Ravenna flourished as an industrial center in the early 20th century.  In recent decades, however, its economy, like most of northeastern Ohio’s, has been sluggish at best, and the town hasn’t changed much physically for many years except for occasional demolitions at the center and new subdivisions at the periphery. News from Ravenna rarely makes it even into the Cleveland papers. It is certainly not known for its architecture.  It has some perfectly good late 19th and early 20th century houses and commercial buildings, but none of these is likely to draw tourists.

One of the very few really remarkable things about Ravenna is a 150-foot high flagpole erected in 1893.  Almost absurdly high for the scale of the city, it is a fascinating product of late 19th century American engineering ingenuity and vernacular design as well as a reflection of patriotism and civic pride. Standing right in the center of the city, it is arguably the most notable monument not just of Ravenna but for miles around.

Unfortunately, township trustees now plan to demolish it.


Image:  Ravenna flagpole viewed from East Main Street, Ravenna Ohio.  Photo by Tom Riddle, 2012

The battle over the Ravenna flagpole says a good deal about the fate of the great manufacturing belt that stretches along the southern edge of the Great Lakes. Once one of the greatest manufacturing regions of the world, it has struggled mightily since World War II as aging infrastructure, obsolete industrial facilities, a gap in educational attainment, and non-competitive wages have left it fighting to find its place in the late 20th, not to mention the 21st century economy.

In many ways Ravenna is a microcosm of the larger region.  In Ravenna, as throughout the region, economic stagnation has taken a toll on the city’s built environment. Main Street has vacant storefronts and empty lots where stores used to stand. Some of the housing stock has started to deteriorate. 

The biggest change in Ravenna, as in most Rust Belt cities, though, has been the transformation in the industrial landscape. In city after city from Duluth, Minnesota, to Rochester, New York, icons of American industry have vanished. The Homestead Steel works outside Pittsburgh has been largely demolished, replaced by a shopping mall. The same fate has befallen the LTV Steel plant in Cleveland and the great Western Electric complex on the boundary between Chicago and Cicero.


Image:  Hawthorne Works Shopping Center in front of remaining tower of the Western Electric Hawthorne Works in Cicero Illinois

Some of this demolition was necessary, even welcome, since many of these factories were located amidst densely populated neighborhoods and constituted a logistical and environmental nightmare. But much of the demolition has been motivated primarily by a desire to remove from sight embarrassing reminders of a previous era. Demolishing the factory, city fathers figure, better allows potential buyers of the site to appreciate a wonderful riverside location or proximity to downtown and the endless opportunities to build something new. 

What has replaced those grand temples of industry, however, has usually been underwhelming, with late 19th century brick loft buildings reduced to rubble to make way for cheap one-story strip malls that neither employ a lot of workers nor generate a lot of tax revenue. The old urban identity has been destroyed, but there has been very little to take its place. 

The process is akin to the efforts of men and women of a certain age who resort  to plastic surgery, hair implants and clothes more appropriate for a younger generation. These cosmetic efforts rarely fool anyone.  In fact, what they most clearly convey is a loss of confidence.  

Fortunately there is a growing awareness that wholesale demolition of industrial fabric does not necessarily   prepare cities for their post-industrial future. This movement to save industrial heritage came into its own first in Britain, not surprisingly, since Britain was the cradle of the Industrial Revolution. For decades now important eighteenth and early nineteenth century industrial sites have been preserved, often as historic sites and tourist destinations.


Image: Ironbridge in Coalbrookdale, Shropshire, England, named a World Heritage Site in 1986

A similar thing has happened in the United States.


Image:  Pawtucket, Rhode Island, Slater Mill, started 1793, now a National Historic Landmark.


 Old loft buildings have become residential condominiums, even in some rather unlikely places.

Image: River Mill Condominiums along the Fox River in Oshkosh, Wisconsin, opened in 1986 in a building constructed for the Paine Lumber Company


Image: Quaker Square, Akron, a hotel developed in 1980 in concrete silos built by the Quaker Oats Company in the 1930s and now owned by the University of Akron.

The preservation of the industrial landscape that cannot be easily reused has been more problematic.   Even so, there has been a movement to preserve some of the most important examples both as testimony to the industrial heritage of their regions and as a way of showcasing the regions in which they are located, providing amenities for the citizens and attracting tourists.

Germany has been a leader in this movement. The Voelklinger Huette outside Saarbrucken preserves an entire complex intact as a monument to the industrial heritage of the area.  Even more spectacular has been the transformation of large pieces of the Ruhrgebiet, the heart of Germany’s pre-World War II heavy industry, into a set of imaginative parks, museums and other institutions.


Voelklingen Huette (Voelklingen Iron Works) near Saarbrucken, Germany. A UNESCO World Heritage site and museum.


Duisburg Nord Landschaftspark (landscape park) in Duisburg, Germany, a coal and steel plant transformed into a public park according to designs done in 1991 by architect Peter Latz who retained as many of the old structures as possible.

Of course, the Ravenna flagpole lacks the grandeur or the historical significance of these places. But it is an important historic relic in its own right and arguably as important for Ravenna as the great industrial complex at Duisburg is to the Ruhrgebiet.

Erected in 1893 by the Van Dorn Iron Works of Cleveland, the flagpole was one of at least four similar or identical structures erected in the northeast of the United States. It appears that only the one at Palmyra, New York, still stands. Recently refurbished, the Palmyra pole seems to have been built as a mast for displaying banners of political candidates. 


Image:  Post card of Main Street Ravenna showing the flagpole in front of the courthouse.


Image:  Palmyra, New York, flagpole, fabricated, like the Ravenna pole, by the Van Dorn Iron Works of Cleveland. It has been recently restored.

These flagpoles reflect late 19th century American engineering ingenuity. Earlier poles had usually been of wood. They frequently snapped in high winds and had to be replaced. When the Ravennans needed to replace their pole they used a new and improved technology available to them.

The technology, involving the use of latticed steel boxes, was developed for the railroad and construction industry. The individual elements were not new. Steel had been replacing wrought and cast iron for a number of years. Truss bridges and other constructions using similar structural technologies had been well developed earlier in the century. Inexpensive steel and the techniques of constructing large structures out of it using rivets rather than bolts, however, was new. The technology was ideally suited to the construction of large structures of all kinds, notably bridges.


The same qualities of strength and light weight that made it ideal for bridges also made it perfect for towers. All over Europe and America engineers used latticed towers not just for flagpoles, for but lighthouses, look-out stations, electric light towers and a host of other uses.


Image:  Electric Light Tower, constructed in 1881 at the corner of Market and Santa Clara streets in San Jose, California to house arc lights intended to illuminate downtown.  It collapsed in December 1915.

 
Image: A surviving “Moonlight Tower” in Austin, Texas.  Manufactured by the Fort Wayne Electrical Company for use in Detroit, 31 of the towers were purchased from the city of Detroit and re-erected in Austin.  In 1970 the remaining 17 towers were listed on the National Register of Historic Places. The city spent $1.3 million to dismantle and restore these towers in the early 1990s.  


Image: Villingen, Germany, Aussichtsturm (Observation Tower) 1888. This 30 meter high tower, erected on a hill outside the village of Villingen, provided views over the surrounding countryside as far as the Alps.

The grandest example of this structural technique is, of course, the Eiffel Tower, built for the Paris exposition of 1889. Although larger in scale than any of the other examples, it used many of the same materials and construction methods as the Ravenna flagpole. Initially heavily criticized by much of the artistic elite of the day as being essentially useless and much too big, the Eiffel Tower soon came to symbolize Paris to the world. No one would imagine demolishing it today.


Image:  Paris, Eiffel Tower built for the 1889 Exposition. It reaches a height of  1015 feet using latticed steel elements and rivets similar to those used on the Ravenna flagpole

The Ravenna pole, erected four years later was built as a monument to national pride and an affirmation of the place of the city of Ravenna in the larger American republic. The pole also had a more local significance. It would allow Ravennans for once to greatly outstrip their neighbors and rivals in Kent, 10 miles to the west. In fact, at the time of its completion, the pole must have been one of the taller flagpoles in America and one of the taller structures anywhere outside the largest cities.  Of course, by now it has been dwarfed, particularly in the last couple of decades when a new battle for flagpole superlatives has broken out, curiously enough this time in some of the most out-of-the-way corners of the globe.

National Flagpole at Baku, Azerbaijan, at 545 ft. flagpole, briefly the world’s highest flagpole before being eclipsed by one in Tajikistan. Both were built by a company in San Diego.

Even if now dwarfed by flagpoles in Azerbaijan, North Korea, and Tajikistan, the Ravenna flagpole still reflects the pride of a struggling industrial city. It has required periodic maintenance and has gotten into the news occasionally when some inebriated citizen has tried to climb it. However, for most Ravennans it has come to be so much taken for granted that citizens were stunned when they heard that the  Trustees of the Township of Ravenna, the body that has jurisdiction, decided that it was a legal liability, a drain on township resources and should be demolished. In response, a group of local citizens has stepped in and is fighting to maintain the pole, raising money toward its repair and trying to see if ownership can be transferred to a governmental entity or group of entities willing to maintain it.

In one way, this is a fight about intangibles like local pride, patriotism, a desire to maintain historic heritage and a sense of place. Some people write off these sentiments as mere nostalgia. But preservation of this kind can have tangible consequences. No one is claiming that preserving the pole will generate vast new tourist revenues or solve basic economic problems. But the movement to save the flagpole rests on the notion that stewardship of historic heritage can play an important role in reminding everyone of the specific qualities of a place that made it successful in the past – and perhaps can be built upon to craft a better future.

Robert Bruegmann is professor emeritus of Art history, Architecture and Urban Planning at the University of Illinois at Chicago.

The Evolving Urban Form: Tokyo

$
0
0

Tokyo is the ultimate in urbanization, being nearly one-half larger than any other urban area in the world. Further, Tokyo has retained been the largest urban area in the world for longer than any period since London's approximately 100 year run from the early 1800s to the early 1900s. During the 1920s, New York became the largest, but was displaced by Tokyo in 1955.

Tokyo became the world's largest urban area by adding more than 20 million people between 1955 and 2000, adding more people than lived in any other urban area in the world during that period. Even with its now slow growth, Tokyo seems likely to remain number one for two decades or more. However, if the breakneck growth of urban areas like Jakarta, Delhi and Manila continues, Tokyo could relinquish its position by 2030, especially if Tokyo begins losing population, joining Japan in that country’s accelerating rate of population decline as is projected (below). 

The Tokyo region is much more than Tokyo proper (the "ku-area"). It includes Yokohama, which with 3.7 million people is larger than any suburb in the world except for Howrah in the Calcutta area. Kawasaki, between Tokyo and Yokohama has a population of 1.4 million, while Saitama, to the north has 1.2 million. Chiba, on the way to Narita International Airport, is home to nearly 1,000,000. There are multiple possible definitions of the Tokyo region. This article defines the Tokyo metropolitan area as Chiba, Kanagawa, Saitama and Tokyo prefectures (Note 1).

Suburban Areas: Tokyo also has the largest suburban population of any metropolitan region in the world. Approximately 26.7 million, or 75 percent of the Tokyo region’s 35.4 million population lives in suburban areas. This is the largest expanse of suburbanization in the world. The suburban population increase since 1950 exceeds that of New York, Los Angeles, and Paris combined (Note 2).

The Core

Tokyo is unique in having abolished its core municipality. In 1943, the former city of Tokyo was combined with the prefecture of Tokyo. This area was also labeled the Tokyo "metropolis." (Note 3) The prefecture of Tokyo contained a number of additional municipalities, which were not impacted by the merger, while the former area of the city of Tokyo was directly administered by the prefecture. In the intervening decades, the former city has been reorganized into 23 wards (ku), which have obtained considerable self-government authority, emerging as the near equivalent of cities themselves.

This "ku" area can be considered the historical core municipality. The 23 ku reached a peak population in 1965 of 8.893 million in 1965. In the next 30 years, the 23 ku sustained a population loss of more than 900,000, while the suburban areas were adding more than 20 million. The ku area exceeded its previous peak in the 2010 census, reaching 8.946 million, approximately 50,000 more than in 1965.

Growth Trends:

Census data indicates that in 1940, the core accounted for 53 percent of the region's population. This dropped to 41 percent in 1950, with the largest share of war-time population losses in the ku area. The core gained back to 47 percent of the population in 1960. After that, nearly all growth was in the suburbs. Between 1950 and 2000, 87 percent of the population gain was in the suburbs. In the last decade, the suburbs share of growth dropped to 63 percent (Figure 1 and Table)


Tokyo Metropolitan Region
Population by Sector: 1920-2010
Year Tokyo Region Former City of Tokyo Balance of Tokyo Prefecture Tokyo Prefecture Kanagawa Prefecture Saitama Prefecture Chiba Prefecture
1920    7,678,000  2,173,000     1,526,000     3,699,000   1,323,000   1,320,000   1,336,000
1930    9,958,000  1,995,000     3,414,000     5,409,000   1,620,000   1,459,000   1,470,000
1940  12,740,000  6,779,000        576,000     7,355,000   2,189,000   1,608,000   1,588,000
1950  13,051,000  5,385,000        893,000     6,278,000   2,488,000   2,146,000   2,139,000
1955  15,424,000  6,969,000     1,068,000     8,037,000   2,919,000   2,263,000   2,205,000
1960  17,864,000  8,310,000     1,374,000     9,684,000   3,443,000   2,431,000   2,306,000
1965  21,017,000  8,893,000     1,976,000   10,869,000   4,431,000   3,015,000   2,702,000
1970  24,113,000  8,787,000     2,621,000   11,408,000   5,472,000   3,866,000   3,367,000
1975  27,042,000  8,647,000     3,027,000   11,674,000   6,398,000   4,821,000   4,149,000
1980  28,697,000  8,349,000     3,269,000   11,618,000   6,924,000   5,420,000   4,735,000
1985  30,273,000  8,354,000     3,475,000   11,829,000   7,432,000   5,864,000   5,148,000
1990  31,796,000  8,164,000     3,692,000   11,856,000   7,980,000   6,405,000   5,555,000
1995  32,577,000  7,968,000     3,806,000   11,774,000   8,246,000   6,759,000   5,798,000
2000  33,413,000  8,130,408     3,928,592   12,059,000   8,490,000   6,938,000   5,926,000
2005  34,472,000  8,490,000     4,081,000   12,571,000   8,791,000   7,054,000   6,056,000
2010  35,618,000  8,946,000     4,213,000   13,159,000   9,048,000   7,195,000   6,216,000
Data from Census of Japan


Generally, however the last decade has been far better for the core than in any period since 1960. Over each of the last two five year census periods, the percentage growth in the core has been greater than that of the suburbs, which, examining data from Europe, United States, Canada, and elsewhere is quite unusual.

Density Comparisons

Tokyo is often portrayed as one of the world's highest density urban areas. It is not. At a density of 11,300 per square mile (4,300 per square kilometer), Tokyo is less dense than London (13,700 & 5,300), one-sixth the density of Hong Kong (67,000 & 25,900) and one-tenth the density of Dhaka (115,000 & 44,400). There are two reasons for this:

  1. Tokyo does not have intensely dense central areas. The ku area has a density of 37,300 per square kilometer (14,400 per square kilometer). This is well below the densities of Manhattan (69,000 & 27,000) and the ville de Paris (51,000 & 21,000). Only one of the ku (Toshima) exceeds the density of Paris.
  2. Further, according to the Japan House and Land Survey of 2008, Tokyo has a large stock of detached houses, by definition lower density. Nearly 45 percent of the Tokyo region's housing is detached. One-third of the dwellings within 30 kilometers (18 miles) of the core are detached. This figure rises to more than 60 percent outside 30 kilometers from the core and 85 percent between 60 and 70 kilometers (37-43 kilometers) from the core (Figure 2).

Transport

Tokyo is a transit oriented metropolis, with by far the highest transit usage in the world. In 2007, 65 percent of trips within a 50 mile radius were by mass transit. Overall transit usage is (passenger miles or kilometers) in the Tokyo region is approximately double that of all combined usage in the United States and nearly 10 times that of Paris, according to the Millennium Cities Data base. At the same time, one-way work trip travel times are reported to be the highest in the high income world, at a median of 45.9 minutes (Note 4) for main earners. Work trip travel times from residences are the shortest from the most remote residential locations (60-70 kilometers from the core) at a median of 26 minutes and at 29 minutes from residences between 50 and 60 kilometers from the core. Median travel times are 36 minutes one way within 10 kilometers of the core (Figure 3). The longest commutes are from residences located between 10 and 50 kilometers from the core (6 to 31 miles), which peak at 54.5 minutes each way between 20 and 30 kilometers (12 and 18 kilometers) from the core.

Toward a City State?

Japan has been centralizing for decades, principally as rural citizens have moved to the largest metropolitan areas. Since 1950, Tokyo has routinely attracted much more than its proportionate share of population growth. In the last two census periods, all Japan’s growth has been in the Tokyo metropolitan area as national population growth has stagnated. Between 2000 and 2005, the Tokyo region added 1.1 million new residents, while the rest of the nation lost 200,000 residents. The imbalance became even starker between 2005 and 2010, as Tokyo added 1.1 million new residents, while the rest of the nation lost 900,000. (Figure 4)

Eventually, Japan’s imploding population will finally impact Tokyo. Population projections indicate that between 2010 and 2035, Tokyo will start losing population. But Tokyo's loss, at 2.1 million, would be a small fraction of the 16.5 million loss projected for the rest of the nation (Figure 5). If that occurs, Tokyo will account for 30 percent of Japan's population, compared to 16 percent in 1950. With Japan's rock-bottom fertility rate, a declining Tokyo will dominate an even larger share of the country’s declining    population and economy in the coming decades.

Wendell Cox is a Visiting Professor, Conservatoire National des Arts et Metiers, Paris and the author of “War on the Dream: How Anti-Sprawl Policy Threatens the Quality of Life.”

Photo: Yamanote Loop Train, Tokyo Station (by author)

Note 1: The government defines a Tokyo major metropolitan area, using smaller area data. However, insufficient data is readily available for this article.

Note 2: These three urban areas have the largest suburban populations in the high income world outside Tokyo and Osaka-Kobe Kyoto.

Note 3: The term "Tokyo metropolis," has misled any number of analysts to believe that it means the Tokyo metropolitan area. In fact, it means only the prefecture of Tokyo, which is only one of the from one of the from four to eight prefectures (part or all) that can be considered a part of the metropolitan area, depending on the definition. Thus any comparison of the "Tokyo metropolis" with anything else in metropolitan in the world is best dismissed out of hand.

Note 4: Based on an analysis of the detailed data, it is estimated that the one-way average work trip travel time is more than 48 minutes.

Thunder On The Great Plains: A Written-Off Region Enjoys Revival

$
0
0

They may not win their first championship against Miami’s evil empire, but the Oklahoma City Thunder have helped to put a spotlight on what may well be the most surprising success story of 21st century America: the revival of the Great Plains. Once widely dismissed as the ultimate in flyover country, the Plains states have outperformed the national average for the past decade by virtually every key measure of vitality — from population, income and GDP growth to unemployment — and show no sign of slowing down.

It’s a historic turnaround. For decades, the East Coast media has portrayed the vast region between Texas and the Dakotas as a desiccated landscape of emptying towns, meth labs and right-wing “clingers.” Just five years ago, The New York Times described the Plains as “not far from forsaken.”

Many in the media and academia embraced Deborah and Frank Popper’s notion that the whole region should be abandoned for “a Buffalo commons.” The Great Plains, the East Coast academics concluded, represents “the largest, longest-running agricultural and environmental miscalculation in American history” and boldly predicted the area would “become almost totally depopulated.”

Yet a funny thing happened on the way to oblivion. Rising commodity prices, the tapping of shale gas and oil formations and an unheralded shift of industry and people into the interior has propelled the Plains economy through the Great Recession.

Since 2000, the Plains’ population has grown 14%, well above the national rate of 9%. This has been driven by migration from the coasts, particularly Southern California, to the region’s cities and towns. Contrary to perceptions of the area as a wind-swept old-age home, demographer Ali Modarres has found that the vast majority of the newcomers are between 20 and 35.

Oklahoma City epitomizes these trends. Over the last decade, the city’s population expanded 14%, roughly three times as fast as the San Francisco area and more than four times the rate of growth of New York or Los Angeles. Between 2010 and 2011 OKC ranked 10th out of the nation’s 51 largest metropolitan areas in terms of rate of net growth.

Nothing more reflects the changing fortunes of Oklahoma City than the strong net migration from many coastal communities, notably Los Angeles and Riverside, a historic reversal of the great “Okie” migration of the 1920s and 1930s. In the past decade, over 20,000 more Californians have migrated to Oklahoma than the other way around. OKC has even experienced a small net migration from the Heat’s South Florida stomping grounds.

The city’s transformation from a cow town into an attractive, modern metropolis has been fueled by some $2 billion in public investment and over $5 billion in private investment, says Roy Williams, president of the Oklahoma City Chamber of Commerce. Besides the arena for the Thunder, the city has engineered a successful riverfront development known as Bricktown, fostered a growing arts scene and become more ethnically diverse, largely as a result of immigration from Mexico.

This pattern of revived urbanization can be seen in other Plains cities. World-class art museums grace Ft. Worth’s Cultural District, and downtown in Omaha, Neb., has become a lively venue bristling with revelers on weekends. Even downtown Fargo, N.D., now boasts a boutique hotel, youth-oriented bars, interesting restaurants and a small, but vibrant arts scene.

Great Plains cities are doing well, however, predominantly due to their strong record of economic growth. Over a decade in which most large metropolitan areas lost jobs, Ft. Worth, Dallas, Oklahoma City and Omaha have created employment. Unlike many Bush-era boom towns, such as Las Vegas, Riverside-San Bernardino, Calif., or the major Florida cities, the Plains did not hemorrhage jobs during the Great Recession.

The Plains states enjoy some of the lowest unemployment rates in the country. There were seven states with unemployment of 5% or less in April; four are on the Plains: North Dakota, with the nation’s lowest jobless rate at 3%, South Dakota, Nebraska, Iowa and Oklahoma.

This is partly due to a booming energy industry. As U.S. oil and gas production has surged over the past decade, the Plains’ share has grown from roughly a third to nearly 45%. The biggest two gainers, Texas and Oklahoma, together boosted their energy employment by 220,000.

But the Great Plains’ economic dynamism extends well beyond energy. The region’s farms and ranches cover an area exceeding 500 million acres,or over 790,000 square miles — larger than Mexico — and account for roughly a quarter of the nation’s agricultural production. These farms have benefited from the long-term increase in food commodity prices — notably wheat, corn, soybeans — and record exports. Since 2007 the Plains share of food shipments abroad has surged from 20% to nearly 25%.

At the same time, the region’s industrial sector, notes research by Praxis Strategy Group’s Mark Schill, has withstood the recession better than the rest of the nation. Never a center of unionized mass manufacturing, the region has become a location of choice for expanding industries, in part due to low costs, cheap energy and a favorable regulatory environment.

They know all about this in Oklahoma . Last year the Sooner State led the nation in industrial growth. One major coup: a large Boeing facility moved last year from California to OKC. The Dakotas and Nebraska also sit in the top ranks of producers of new industrial jobs. Since 2007, the Plains states have boosted their share of U.S. manufactured good from 19% to 21%.

More surprising still has been the region’s surge in employment in jobs related to science, technology, engineering and math. This has been spearheaded, of course, by Texas, but most other Plains states — North Dakota, South Dakota, Oklahoma — also have enjoyed well above average tech job growth. North Dakota, remarkably, now boasts the second-highest percentage of people 25 to 44 with a post-secondary education, behind only Massachusetts; it also has one of the highest rates of high-tech startups in the nation.

Given their generally strong state budgets, the Plains states have continued to pour more resources per capita into university-related research than their counterparts elsewhere. North Dakota ranks number one here, but South Dakota, Oklahoma, Kansas, Montana and Texas all rank in the top 10.

None of this suggests that the Plains are ready to bid for primacy as high-tech centers with California or Massachusetts, or Ohio and Michigan as the country’s industrial bastions. For all their improved amenities, Omaha, Ft. Worth or Oklahoma City seem unlikely to surpass New York City as the nation’s cultural, restaurant or financial capital in our lifetimes.

Yet it seems clear that the region, long dismissed as irrelevant, will play a much larger role in the nation’s economic future. Like the young Thunder, the people of the Plains now have a prairie wind at their back.

Joel Kotkin is executive editor of NewGeography.com and is a distinguished presidential fellow in urban futures at Chapman University, and contributing editor to the City Journal in New York. He is author of The City: A Global History. His newest book is The Next Hundred Million: America in 2050, released in February, 2010.

This piece originally appeared in Forbes.

Oklahoma City photo by BigStockPhoto.com.

Will Servants' Quarters Come Back, Too?

$
0
0

As the Great Recession enters its fourth summer, America continues to separate into the multiple economic strands that characterized an earlier day. Our cities, built mostly since the 1930s, poorly accommodate this lack of unity, and will require radical revision if our class divisions continue to deepen.

Back in the era of the streetcar suburbs, at the turn of the 20th century, we also experienced a tiered, multiple economy. The post-Victorian prosperous middle class had carved itself new residential beltways around inner core cities – the so-called “suburbs”. The look and the form of these old residential beltways is fondly remembered by some, so much so that they are imitated in some new developments today. Tall houses tight to the street with service alleys and front porches marked America’s urban form in this era, and can be seen in much of the literature promoting traditional town planning.

Examining the original homes more closely yields some surprises, for they were radically different than our homes of today. The differences aren’t apparent from the outside, which is perhaps not important to the planners who wish to reinstitute this kind of design. Turn-of-the-century houses accommodated two economies by dedicating the first two floors to the middle-class family who owned the home (usually white), while the attic or basement had a separate entry and stair to the kitchen, dedicated to the staff (usually from an immigrant or ethnic minority group).

This two-tiered economy was considered natural and acceptable at the time. Domestic labor was an inexpensive and ingrained part of the American middle class experience. The staff often came and went via the service alleys, and the streetcars were often built to connect the housekeepers, butlers, and cooks to the city, while father commuted into town on his own.

Cities were also two-tiered, with bands of low-income service housing interwoven between more prosperous neighborhoods. Winter Park, Florida, where I live and work, is a good example of this. Tony Park Avenue is a shopping street that runs north-south through the city beside a pretty chain of lakes. Surrounding those lakes are houses built as second homes for wealthy families from Chicago and elsewhere in the Midwest.

On the west side of Park Avenue, within a short walk of those homes, sits one of those bands: Hannibal Square, a neighborhood where many of the domestic service workers lived. Tiny homes on 25 foot lots still exist, sandwiched together, out of sight of the promenading Winter Park set across the railroad tracks. This city form was repeated with many variations throughout the South. The word “segregation” comes closest to identifying this double economy, with all the inequality that it implies.

In Winter Park’s post-World War II era, as Florida boomed, many of the grand old bungalows with attic apartments emptied out, and were sold to owners looking for permanent, year-round residences. This new generation used these structures differently. A combination of upward mobility, opportunity, and a new sense of unity in the decade of conformity made it unfashionable to have servants in one’s own home. By 1954, separate but equal was banished forever in schools. Housing was undergoing a similar evolution. Throughout the 1960s the two-tiered home was phased out, and many thought staff quarters and the upstairs-downstairs subculture was gone forever.

Economic pressure, meanwhile, on neighborhoods like Hannibal Square became fierce. Original residents, now retired, saw their home values appreciate. A few sold out – much to the chagrin of their children, who felt a neighborhood allegiance and resented the gentrification and loss of identity of their community. Cities like St. Petersburg, Florida, that have a similar geography to Winter Park, are still experiencing severe strains in race relations as they cope with this dark vestige of a two-tiered economy.

Yet by the turn of this century our housing forms had shown measurable progress indeed. Segregated staff quarters were largely things of the past. Suburban residents, whether from Hannibal Square or upper Winter Park, were competing in the same large job marketplace, freed from the caste system of servant and served.

Nostalgia for the urban form that flourished in a two-tiered economy stems from a romantic notion about the simplicity of these times, and, at least for the prosperous, life certainly was simple. But adapting the architecture of 1905 to the residential market of the start of this century has been a selective process.

Shady, narrow streets, white picket fences, and front porches where neighbors could sit and wave to passers-by are trademarks of yesteryear which developers — and buyers — wanted to see replicated. Where servant’s quarters used to be, interior square footage was regained for home theaters, home gyms, game rooms, play rooms, and family rooms, now that a domestic servant was not required. These rooms respond to our contemporary culture’s increasingly private, plugged-in world, but are at odds with the outward urban form that emulates an “eyes on the street” culture swept away by the car. Home prices skyrocketed partly because buyers were demanding the interior amenities that they craved, as well as exterior amenities that they were being taught to appreciate.

Meanwhile, our economy was dis-unifying into strands that economist Paul Krugman so aptly nicknamed The Great Unraveling. We thought we were progressing, but it is a bitter truth that the world can, after all, regress.

Should this multi-tiered economy harden into a physical form, it could likely resemble that of the previous century, a form that we thought we had put away for good. It would be sadly ironic if neo-traditional neighborhoods, created to resemble the forms of the old two-tiered economy, are to now be remodeled to accommodate the "new" two-tiered economy.

Richard Reep is an architect and artist who lives in Winter Park, Florida. His practice has centered around hospitality-driven mixed use, and he has contributed in various capacities to urban mixed-use projects, both nationally and internationally, for the last 25 years.

Flickr Photo by Bob Carney. Neo-traditional homes – large homes on very small lots in Urbana, Maryland

The Beijing Bicycle: A Requiem

$
0
0

Just because China has 500 million bikes on the road or tucked away in sheds or courtyards does not mean the two-wheeler has a bright future there, especially in its largest cities.

Such is the growing indifference to the bike in China that no one seems to mind that the national model is manufactured in Taiwan (or under license on the mainland). With a single gear and heavy steel frame, the Giant is ideal for long rides on flat city streets. At a cost of US $180, it is the bike bargain of the world. Nevertheless, the dream for younger Chinese is a Honda scooter.

The problem now in Beijing, Xian, and Guangzhou, if not in the country at large, is that increased prosperity is making city bike riding that much more a thing of the past. Wonderful Asian bike cities like Hanoi have already been lost to the noisy scooter and small car. Is Beijing next?

Three years ago, Beijing was delightful by bike. Initially, I signed up with my friend George at Bicycle Kingdom to teach me the tricks of the narrow streets and the detours around Tiananmen Square. Ever since that first night of instruction, when we rolled out to the Olympic Park and down to the Temple of Heaven, I have been pedaling on my own power in Beijing and savoring every moment in the saddle.

One reason that biking in Beijing is such a pleasure is that riders are accorded privileges lost to those sitting in traffic jams or drifting around on tour buses. During the 60th anniversary of the Chinese Revolution, a bike got me a front row seat to the spectacle.

Beijing bikes have their own lanes, traffic lights, and rights-of-way, and a rider can easily thread his or her way anywhere. At railroad stations there are special bicycle parking lots, and even at the Forbidden City it is possible to leave your bike next to the front gate, as if you were a Mandarin.

A few of the parks are off-limits to riders, but to my mind the only way to explore the hutongs — the historic districts of old Beijing, laid out like rabbit warrens — is on a bike, with which it is possible to roll past tea houses, food stalls, and open shops, as if in a Venetian gondola.

Recently back in the capital, I spent a long day riding from Tiananmen Square out to Peking University, near the Summer Palace — about fifteen kilometers (a little more than nine miles) to the northwest.

I had mapped out my route using a mixture of back streets and boulevards, and rolled away to find the Beijing grave site of the American writer Edgar Snow, whose 1937 book, Red Star Over China, was the first English-language account of Mao Tse-tung and a reportorial classic. (They met near Yenan, to which I went by train, but where there are almost no bikes.)

To be sure, bike riding in Beijing is an acquired skill. I accept that it means weaving around buses, parked cars, delivery vans, and other obstacles. What surprised me on this long ride — about three hours in all — is how often the bikes lanes were flooded with motor scooters, cars, and a variety of motorized contraptions.

After a while, I had my eyes attuned to the demographics of bike riders. They tended to be school kids or the elderly. From this blacktop survey, I judged that middle-aged or prosperous Beijingers have little appetite for riding. Most were moving around on scooters, the kind that have clogged many Asian cities.

On earlier bike rides around Beijing, I found the experience sublime. This time it felt like I was riding for my life in New York City, outnumbered and outgunned by a variety of taxis, swerving motorists, and motorcyclists.

Not only is Beijing going the way of Bangkok and other Asian cities that have been lost to gridlock, but the effects of non-riding can been seen among the Chinese themselves, more of whom are obese; undoubtedly KFC and McDonalds don’t help, either.

Beijing is not the only Chinese city where I found biking on the wane. On my recent trip I also visited Xian, Chongqing, and Guangzhou, in search of Maoist redoubts and World War II battlefields. Chongqing (which has an excellent General Joseph Stilwell Museum and a Chou En-lai house) is built on hills, like San Francisco, so it has never been much of a bike city. Xian and Guangzhou are ideal for the bike, at least in their historic quarters. Yet each city is now overrun with cars.

In Xian, I spent a long time just trying to find a shop that would rent me a bike. I went to several where the owners just shrugged. Finally, I borrowed a neglected bike from a hostel, but first had to take it in for repairs. No one had ridden this Giant in weeks, and the seat was set for a Lilliputian.

You wouldn't cycle to see the Terra Cotta warriors on a local clunker, as they are an hour by car from the city. But a bike is perfect to explore the Muslim quarter or to take in the Xian Incident Museum, which tells the story of Chiang Kai-shek’s kidnapping in 1936 and his subsequent agreement to recognize the Communist party. (Nothing focuses the mind like a kidnapping.) In Guangzhou I made it to the Sun Yat-sen Museum, but the snarling traffic scared me into a taxi.

In Beijing and other cities, you still see bicycles loaded with garbage bags, cords of wood, furniture, dumplings, racks of clothing, and things like hundreds of fresh eggs. Some riders can comfortably bike around several family members on one frame, and it’s not unusual to see children following a parent through a busy intersection. In one alley, I biked alongside a man using his bike to move a large desk.

In Beijing and Xian, I especially love the cyclists who have rigged up devices so that they can ride around with their caged birds, although one cycling raven of my acquaintance just sat on a wooden perch across the handlebars. Where will he be in five or ten years? I hate to think that Edgar Allen Poe was a writing an elegy for, among other things, the Beijing bike:

Quoth the raven, “Nevermore.”

Matthew Stevenson, a contributing editor of Harper's Magazine, is the author of Remembering the Twentieth Century Limited, a collection of historical travel essays. His next book is Whistle-Stopping America.

Photo: Raven on a Bicycle, Beijing, by the author.
Flickr Photo: Bird Scooter; birds and paraphernalia on a bike in Beijing by IstoletheTV.


The Collapse of Chicago Media

$
0
0

When the satirical humor weekly The Onion announced it was moving its editorial staff from New York to Chicago it was considered quite a coup by boosters of the Windy City. Yet the hoopla surrounding revealed more about Chicago’s decline as a media center than any significant uptick. This includes news of a staff rebellion at the Onion in which writers attempted to scotch the move, with some ultimately deciding not to come. The strong celebration of a relatively small relocation in the grand scheme of things also shows a city looking hard for good media news where there has been so much bad recently.

The biggest blow of the all has been the end of the Oprah Winfrey show and her departure for Los Angeles to start a new network. She was the one legitimate mega-star who came from Chicago and built an empire recognizably Chicago-based. When she left, her network, which has struggled to obtain distribution and viewers, carried a Rosie O'Donnell talk show based in Chicago that ultimately folded as well. Similarly, Playboy, another iconic Chicago media brand, also departed for LA.

Some of this reflects national trends that have led to a greater concentration of media in New York and, to some extent, Washington. All across America, local media has struggled. The Tribune, Sun-Times, and alt-weekly Chicago Reader all went bankrupt, and while they continue to publish, they have become in many respects shadows of their former selves. New mayor Rahm Emanuel, while still engaging with local media, has frequently decided to bypass it, going directly to major national media to get the city's story out. For example, he hosted New York Times columnist Tom Friedman, resulting in a fawning profile.

Daley also had occasional good luck with the national media, getting glowing stories in publications like the Economist and the New Yorker. Many of these read like classic Sunday travel section pieces in their boosterism. One possible reason for that is that they are travel pieces. Chicago never had a huge number of national bureaus, and the number has shrunk in the past few years because of the difficulty in supporting a national footprint generally. For example, the Washington Post closed all of its bureaus, and the Chicago bureau was a casualty. Today most national news outlets don't have a boots on the ground perspective of the city, and thus are open to being spun by clever locals.

This lack of out of town and foreign media means that what coverage Chicago does get is often positive, but the flip side is that Chicago doesn’t have a built in platform for getting its message out nationally or globally. New York is America’s media center. DC, LA, and the Bay Area all have a robust out of town media presence because of the industries based there (government, entertainment, and tech respectively). They have a megaphone to the world that Chicago doesn’t. That’s perhaps one reason Emanuel made what many consider an ill-advised play for the NATO summit: it was a rare opportunity to showcase Chicago to global journalists.

Chicago also falls short in new media. In many cities, the decline of the daily paper has been offset by a robust new media infrastructure. This includes sites like Crosscut in Seattle or MinnPost in the Twin Cities.  Major national sites like Gawker or the Huffington Post have tended to be based in traditional media center like New York or Washington. Chicago has been curiously absent here. An attempt at a non-profit online new site, the Chicago News Cooperative, failed due to financial difficulties, despite seven figures in funding from the MacArthur Foundation and a contract with the New York Times.  

Where major platforms have arisen in Chicago, they've often left in order to pursue their ambitions. For example, music site Pitchfork, which started out of a music festival in Chicago, moved its editorial staff to Brooklyn. Statistical journalist Nate Silver likewise moved to New York.

The challenge facing media and journalists in Chicago was best perhaps summed up by JC Gabel, a die hard fan of the city.  He relaunched the historic Chicagoan magazine in an effort to rebuild the sort of infrastructure the city once had. He wrote in the launch issue:

By all accounts, it should be an exciting time to live and work in Chicago. But there is little well-paid creative work available for the hungry freelancers—the writers, artists, photographers, editors and designers—who call Chicago home. Locally, what work there is pays a pittance; nothing that could sustain the kind of long-form storytelling we were discussing.

This might help explain the mass exodus from Chicago of creative minds of our generation throughout the last few years. Opportunities on either coast—or overseas—eventually come calling, and although they retain pride in their erstwhile Midwestern hearts, they cease to be Chicagoans by physical address.

Stop Smiling, the magazine I co-edited and co-published for more than a decade from Chicago, ultimately couldn’t have made it without also keeping a New York office and a strong West Coast presence. By and large, a majority of stories were executed in Los Angeles or New York, and all the money we raised through ad sales came right out of the agency machines on either coast. But Chicago was always our inspiration, a place where we retired to—first to brood, then to get our work done.

I know firsthand how difficult it is to carve out a national niche audience in a city that many still consider fly-over country, despite its rich history and inventive spirit.

Part of the challenge for Chicago lies in the ongoing changes being wrought by the internet and globalization. These are both spreading around some activities and ever more concentrating others. Media is among those undergoing further centralization into the handful of fortress hubs, notably New York and DC. This has hit Chicago, always a second-tier media center, hard.

But the good news is that Chicago is full of talented folks like Gabel with a passion for their city. Chicago actually does have the critical mass of talent to support a far stronger media ecosystem than it has today. And with the low barriers in the internet age, there's no insurmountable obstacles to making that happen. But clearly anyone trying to make a go of it in media in Chicago today is swimming upstream against a fast flowing current of decline.

Aaron M. Renn is an independent writer on urban affairs and the founder of Telestrian, a data analysis and mapping tool. His writings appear at The Urbanophile.

Tribune tower photo by Bigstockphoto.com.

Despite Obama’s Policies, The Rust Belt’s Revival Could Save His Campaign

$
0
0

Barack Obama’s political base always has been more “creative class” than working class—and his policies have favored that base, seeming to cater to energized issue and identity constituencies including African-Americans, Hispanics, gays, and greens, often at the expense of blue-collar workers.

Yet improving conditions for those workers—particularly in the industrial heartland—could save his flagging presidency.

The industrial zone’s four key states—Michigan, Ohio, Wisconsin, and Pennsylvania—constitute the most critically contested territory in this year’s contest. Fifty-four electoral votes are at play here, with Pennsylvania’s 20 votes alone equaling all those at stake in the much-ballyhooed battleground of the Intermountain West (Colorado, Nevada, and New Mexico).

The Midwest is also home to the two states with the biggest drops in unemployment over the past two years. Michigan leads the way with an almost five percentage point drop, while Ohio comes in second with a nearly three–point decline. Other key Great Lakes battlegrounds—Wisconsin, Indiana and arguably Missouri—have also seen two-point drops in their unemployment numbers.

“Rust Belt” no longer seems like a pejorative, as the northern industrial states now boast unemployment rates well below those in once-booming states including California, Nevada, Florida, and South Carolina.

In the last two years the nation has added more than 400,000 manufacturing jobs, led by states in the upper Midwest. Between 2010 and 2011, Michigan led the nation by creating 25,000 new industrial jobs with a heady 5 percent growth rate second only to Oklahoma. Wisconsin came in second with 15,000 new positions, and a growth rate of more than 3 percent.

These gains may not come to close to making up the losses suffered over the past decade, but the growth is encouraging. Manufacturing employment brings higher wages to regional economies. In the Cincinnati area, the average factory job pays $61,000 a year—$15,000 more than the city’s average wage. This creates an outsized impact on the rest of the economy, from housing and retail to demand for business services. There are already significant shortages of skilled workers such as welders and machinists.

Midwestern employers are projecting an 18.5% jump—the largest of any region—in the number of college graduates that will be hired this year.

The new industrial economy creates considerable demand for those who can fill STEM (science, technology, education, and mathematics related jobs). Between 2009 and 2011, Michigan enjoyed the second strongest rate of STEM growth in the nation, just behind Washington, D.C.

Much of what generated the heartland recovery—and much of what could slow or even reverse it—lies outside of the president’s control. But if the momentum holds through November, the political winds there will be at Obama’s back, helping him sell Great Lakes voters on the idea that the nation is moving in the right direction under his leadership. The key here lies with the revived auto industry.

Obama’s “decision to rescue GM and Chrysler was exceedingly popular in auto manufacturing dependent states like Michigan and Ohio,” says former Michigan Democratic Party chair Morley Winograd. “The rise in manufacturing employment since has buoyed housing prices, boosted workers' morale, and allowed Obama, in these states anyway, to be able to claim he delivered on the campaign’s promise of hope and change. "

Mitt Romney is now effectively even in the polls in Michigan (one of his three “home” states), but he may have trouble explaining his opposition to the auto bailouts if the economic tide is rising.

“Obama will win Michigan in a walk, “ predicts Winograd. “Outside of a nostalgic visit to his boyhood home, Romney won't be seen in the state after Labor Day.”

One state both candidates are sure to spend time in is Ohio, which has already emerged once again as a bellwether in the race.

Rick Platt, an industrial development official in Newark, an industrial city of 50,000 in the central part of the state, sees the Ohio race as a struggle between “two narratives” about Obama.

The first is the positive one, a reflection of industrial gains of more than 10,000 jobs last year and falling unemployment. The other narrative builds around fear over a second Obama term.

Those concerns are especially pronounced in traditional swing regions like the Utica Shale in the eastern part of Ohio and the coal-producing swaths of western Pennsylvania (nearly half of the businesses in the booming gas and oil extraction field are based in the industrial heartland) that have long been resentful of Washington regulators. Business owners are concerned—as are many of their employees—that a second Obama term could mean the EPA shutting down the nascent natural gas boom that’s begun to generate both energy and high-wage industrial jobs. Some businesses have postponed investment due to uncertainty about the election and the prospect of aggressive regulation.

“There’s a lot of things in play,” says Platt, who has been active in Republican politics. Not surprisingly, he credits much of the region’s recovery to the economic policy of Republican governors like John Kasich in Ohio, Michigan’s Rick Snyder, and Wisconsin’s Scott Walker—all states he notes that are lapping Illinois.  The Land of Lincoln, Obama’s Democrat-controlled home state, suffers the region’s highest unemployment rate and is competing with California for the nation’s worst credit rating. “It’s not clear right now which of the two narratives will win out.”

The health of the manufacturing economy may prove even more important to the president’s reelection than the Dow Jones index. If industrial growth softens or goes into reverse—for instance, if Europe’s economic troubles cross the Atlantic—the Midwest will feel the effects first.

And if the Rust Belt suffers, Obama’s path to a second term gets that much tougher.

Joel Kotkin is executive editor of NewGeography.com and is a distinguished presidential fellow in urban futures at Chapman University, and contributing editor to the City Journal in New York. He is author of The City: A Global History. His newest book is The Next Hundred Million: America in 2050, released in February, 2010.

This piece originally appeared in The Daily Beast.

Oklahoma City photo by BigStockPhoto.com.

U.S. Desperately Needs a Strategy to Attract the Right Skilled Immigrants

$
0
0

President Obama’s recent “do it myself” immigration reform plan, predictably dissed by conservatives and nativists, reveals just how clueless the nation’s leaders are about demographics. Monday’s Supreme Court ruling on Arizona’s immigration crackdown also broke down along predictable lines, with both parties claiming ideological victories.

Yet the heated debates are missing the reality of immigration and its role in America’s future. In reality America needs more immigrants, but with a somewhat different mix.

Rather than an issue of “values” or political sentiment, we need to look at immigration as a matter of arbitrage, a process by which rapidly aging countries bid for the skills and energies of newcomers to keep their economies afloat.

Nowhere is this immigration arbitrage clearer than in the world’s most rapidly aging region, Europe. By 2050 the workforce there is expected to decline by as much as 25%. Yet this diminishing resource is now increasingly on the march as young Greeks, Italians and Portuguese flee to stronger economies in Europe’s Nordic belt and elsewhere. An estimated half million left Spain last year alone. Ireland, which in recent decades actually attracted new migrants, was exporting a thousand people a week last year. In recession-wracked Britain, a 2010 poll found nearly half of the population would like to move elsewhere.

Germany, with its ultra-low birthrate and rapidly aging population, has emerged as a primary migration beacon. Germany needs about 200,000 new migrants ever year to keep its economic engine humming. For decades, newcomers from Turkey and other Islamic countries have flocked there, but this migration has failed to deliver much added value due to their general lack of skills and divergent cultural values. So the Germans — as they did back in the 1960s — look to harvest the diminishing pool of skilled workers from equally aging states on the EU’s southern periphery.

But it’s not simply a matter of a one-way south to north flow. Other EU countries, such as Italy, are playing the immigration arbitrage game by importing young workers from rapidly depopulating southeastern Europe. Milan, for example, added 634,000 foreign residents in just eight years (2000 to 2008), the largest share from Romania, followed by Albania. Over the period, more than 80% of Lombardy’s growth has come as a result of international immigration.

But immigration arbitrage is more than a simple numbers game. As Europe learned through its bitter experience with immigration from North Africa and the Middle East, importing populations without necessary skills and attitudes useful for the modern economy can produce unhappy results. The key issue is how to attract and select immigrants likely to contribute to the national well-being and economic competitiveness.

Almost everywhere in the world, there are shortages of skills ranging from construction to advanced engineering. Much of contemporary immigration to East Asia reflects the need for workers — largely from India, Bangladesh, Indonesia and Sri Lanka — to perform tasks considered “dirty, dangerous and difficult” (or 3-D).  Singapore and Hong Kong also have a bull market for high-end workers in order to maintain their increasingly financial and technology-oriented economies.

But skills should not be conflated merely with university degrees. Education is no longer a guarantor of productivity; the degree, once a sign of distinction, has become a commodity. Many disciplines have little net positive economic impact. Few countries likely suffer shortages of post-modernist literature graduates, performance artists or lawyers.

Opening the doors to undocumented high school graduates, many with no real marketable skills, as President Obama just did, may not have a great positive long-term effect on the economy. Perhaps it would be better if our immigration policies were less about politics, and ethnic constituencies, and more about gaining specific skills and abilities from other countries, including from Mexico’s growing ranks of educated and skilled workers.

Some countries, such as Canada, Australia and Singapore, already have made major accommodations favoring skilled or entrepreneurial immigrants. The United States, to its great disadvantage, has been slow in this regard. In 2011 barely 13% of all American immigrants came as a result of employment-based preferences, down from 18% 20 years ago. Family reunification should remain a cornerstone of immigration but needs to give way substantially to a more skills-oriented policy.

America’s approach is particularly baffling given our looming skills shortages. The reviving auto industry is already running short of craftspeople such as numerical machine tool operators. In fact, David Cole, chairman of the Center for Automotive Research, predicts that as the industry tries to hire upwards of 100,000 workers, they will start running out of people with the proper skills as early as next year.

This shortage is also intense in many engineering and technically oriented fields. The Pittsburgh area alone has 1,500 engineering job openings. The Great Lakes Metro Coalition, covering 12 states, is advocating for a federal immigration policy focused on attracting highly skilled talent. Government and business leaders in economically healthy parts of the Great Plains, Texas and Utah now consider persistent skilled labor shortfalls — particularly in science and technical fields — as the greatest barrier to continued growth.

Immigration policy should also look to bring in more entrepreneurs. As business start-ups overall have slowed, immigrants continue to launch new businesses. Today fully one-fifth of all American businesses are owned by immigrants, up from 12% two decade ago. Many of these are located in suburbs and small towns, where together a majority of immigrants see opportunities and a better quality of life.

These qualitative distinctions may be lost on many in the pundit class. As a decline in Mexican immigration has driven overall immigration down below 2009 levels, the number of Asian newcomers is once again growing. Their share of annual new arrivals has risen over the past two years from 36% to 42%.

Asians increasingly do not come for just economic opportunity — there’s often more of that at home — but to attain things almost impossible in their native countries  such as a single-family homes with a backyard and less congested, tree-shaded neighborhoods. For some, like migrants from China, political and religious freedom also is often a major attraction.

This is good news for the future. As a Pew report recently pointed out, Asian immigrants tend to possess many of the characteristics this country sorely needs: a commitment to education, family and entrepreneurship. McKinsey suggests China and India will produce 184 million new college graduates over the next 10 years; this provides a vast pool of which the U.S. has only to pick up a small portion to boost its economy.

This is not to argue for a policy based on ethnicity or geography. There are hard-working, skilled immigrants to be had from the poorest countries in Latin America or Africa. If you want to see this, go to any strip mall around Houston, Los Angeles or northern New Jersey.

We need to target immigrants most likely to help our advanced industries, start businesses and families, and whose descendants will provide critical demographic vibrancy. There may soon be many such people looking to move from places like the Middle East, particularly Christians or liberal Muslims threatened by rising Islamism. There also should be policies to welcome restless young Europeans who may be seeking more opportunity elsewhere.

The age of immigration arbitrage will require critical shifts in all advanced countries to provide many more openings for skilled immigrants and entrepreneurs. But ultimately the best way to attract these people lies in boosting the kind of economic growth and opportunity that can attract this most valuable resource to a country.

Joel Kotkin is executive editor of NewGeography.com and is a distinguished presidential fellow in urban futures at Chapman University, and contributing editor to the City Journal in New York. He is author of The City: A Global History. His newest book is The Next Hundred Million: America in 2050, released in February, 2010.

This piece originally appeared in Forbes.

Immigration rally photo by BigStockPhoto.com.

Questioning the Messianic Conception of Smart Growth

$
0
0

A new analysis from the United Kingdom concludes that smart growth (compact city) policies are not inherently preferable to other urban land use policy regimes, despite the claims of proponents."The current planning policy strategies for land use and transport have virtually no impact on the major long-term increases in resource and energy consumption. They generally tend to increase costs and reduce economic competitiveness." The article goes on: "Claims that compaction will make cities more sustainable have been debated for some time, but they lack conclusive supporting evidence as to the environmental and, particularly, economic and social effects."

These would not be surprising findings to Newgeography.com readers, who are accustomed to similar analyses rooted in economic, demographic, and environmental data. However, this article appeared in the Spring 2012 issue of the Journal of the American Planning Association, under the title, "Growing Cities Sustainably: Does Urban Form Really Matter?"

Moreover, the authors are urban planning insiders, including Marcial H. Echenique, a land use and transport professor at Cambridge University, Anthony J. Hargreaves from the Martin Centre for Architectural Studies at Cambridge, Gordon Mitchell from the Faculty of the Environment at the University of Leeds and Anil Namdea of the School of Engineering at the University of Newcastle.

Smart Growth Criticisms

Many of the British critiques parallel those made by critics of smart growth for years. They focus particularly on the concern that smart growth generally has neglected economic and social costs. For example, smart growth policies lead to higher house prices by rationing land (such as with urban growth boundaries). Higher house prices lead to less discretionary income for households, so that there is less money for other goods and services, lowering employment levels. The resulting densification leads to more intense traffic congestion, with resulting economic losses and more intense air pollution, which is less healthful.

The Research

The authors modeled land use and travel behavior in three areas of England, subjecting them to three land use alternatives: compact development (smart growth), planned development (which I would label "smart growth light") and dispersal, the generally liberal approach common in United States, Canada, Australia and New Zealand for decades after World War II (and still in many US and some Canadian markets).

Echenique et al analyzed the London metropolitan region (Greater London Authority, Southeast England and East England), which has a population of 20 million and the Newcastle (Tyne and Wear) metropolitan region, which has a population of 1,000,000. They also analyzed a sub-region within London metropolitan region, Cambridge, with a population of 500,000.

Their model projected little difference in outcomes between the three land use regulatory regimes to 2031. Predictably, land consumption was less under the compact development, but the variation in land consumed varied no more than plus or minus one percent from the trend (base case) in the London area, where only 11 percent of the land is in urban or transport use. Other factors, such as the change in transport energy use, greenhouse gas (GHG) emissions from transport and residences and air pollution varied little between the three regulatory regimes.

Economic costs in 2031 were projected to be the lowest (best) for the dispersed option and the highest for the compact development option, both in the London and Newcastle metropolitan regions. Planned development ranked second.

The compact development option scored best in the Cambridge sub-region, while the planned development option was the highest cost. The dispersed option ranked second. The researchers attributed the better result for compact development in the Cambridge area to its uniqueness as a low-density, centrally oriented, high-tech, university community and further noted that densification could "reduce its attractiveness over the longer term."

Smart Growth Claims: Setting the Record Straight

Based upon their research and review of the literature, the authors proceed to undermine some of smart growth's most sacred foundations.

Smart Growth Claim: Smart growth has little or no impact on house prices:

Echenique et al: "...restrictions on the supply of development land have led to property price increases, penalizing city dwellers by leading to less dwelling space...”

Smart Growth Claim: Smart growth increases housing choice:

Echenique et al: "One downside of this policy is a substantial reduction in choice of dwelling types, with new dwellings being mainly apartments."

Smart Growth Claim: Smart growth does not increase traffic congestion:

Echenique et al: The authors cite research indicating that high average density is the main cause of highway congestion in Los Angeles. They also cite Reid Ewing (University of Utah) and Robert Cervero (University of California) who reviewed studies of household travel behavior finding that a doubling of density would lead to only a 5 percent reduction per person, or an increase of 90 percent in travel (Note 1). The authors add: "The obvious conclusion is that an increase in density will increase traffic congestion."

Smart Growth Claim: Smart growth reduces air pollution:

Echenique et al: "It can also increase the overall respiratory disease burden as exposure to traffic emissions is increased.

Smart Growth Claim: "Empty nesters" (aging households with no offspring at home) will seek smaller houses in the urban core: 

Echenique et al: "There is, however, no substantial evidence that older couples leave their spacious houses and gardens..."

Smart Growth Claim: Smart growth improves the jobs-housing balance.

Echenique et al: "One of the main arguments for the dispersed city is that there is no longer a single center where most jobs and services occur. Urban areas, rather, exhibit a dispersed and often polycentric structure, bringing jobs and services closer to residents with a more complex movement pattern not readily served by public transport.

The authors suggest the following "takeaway:"

"Urban form policies can have important impacts on local environmental quality, economy, crowding, and social equity, but their influence on energy consumption and land use is very modest; compact development should not automatically be associated with the preferred spatial growth strategy."

Thus, the Echenique et research contradicts the thesis that compact development or smart growth should replace (make illegal) other regulatory regimes, including the more liberal dispersed pattern.

"Smart growth principles should not unquestioningly promote increasing levels of compaction on the basis of reducing energy consumption without also considering its potential negative consequences. In many cases, the potential socioeconomic consequences of less housing choice, crowding, and congestion may outweigh its very modest CO2 reduction benefits."

The British research is an important step toward focusing urban policies on objectives, rather than means. Cities are economic organisms. They have increased their share of the population 10 fold in just two centuries and been pivotal to unprecedented economic growth and affluence. People moved to the cities for economic opportunity, not to sample particular urban forms. Cities best serve their principal purpose and their residents best when they encourage economic growth. The fundamental objective is to maximize the discretionary income of residents, and this can be done while reasonable environmental standards are maintained. Yet, as Echenique et al and others have shown, smart growth tends to retard economic growth. In an age of teetering national economies, failing pension funds and the most uncertain fiscal environment in at least 80 years, the world needs cities to be unleashed for the economic growth. Urban policies that ignore economics need to be replaced with wholistic approaches strongly focused on the key reason that cities exist: to enrich their citizens.

Wendell Cox is a Visiting Professor, Conservatoire National des Arts et Metiers, Paris and the author of “War on the Dream: How Anti-Sprawl Policy Threatens the Quality of Life.”

------

Photo: Letchworth Garden City, London metropolitan region (by author).

Note 1: Calculation: According to the research, doubling the density of an area reduces vehicle travel per capita by 5 percent. With 200 percent of the previous population (double the density), vehicle travel would be increased 90 percent (200% [x] 95% [=] 190%).

Gentrification? Brixton's Angell Town Story

$
0
0

In the US, urban planners talk about the 'redevelopment' of a neighborhood. In the UK, 'regeneration' is heard more often. What is the difference, from both the planner and the resident perspective? Are they both synonyms for 'gentrification'? Angell Town , a UK 'estate' in Brixton — it would be called a 'public housing project' by Americans — provides a good example of how these questions are answered in practice.

In theory, meanwhile, the answers are… yes, and no. They overlap quite a bit, but the terms are not the same. In its simplest form, to redevelop is to develop again, which implies doing it over completely. Regeneration most directly means “rebirth or renewal”, implying that the entity remains throughout the process.

The American Planning Association (APA) defines redevelopment as “public actions that are undertaken to stimulate activity when the private market is not providing sufficient capital and economic activity to achieve the desired level of improvement…. such as direct public investment, capital improvements, enhanced public services, technical assistance, promotion, tax benefits, and other stimuli including planning initiatives such as rezoning."

The Royal Town Planning Institute (RTPI) defines regeneration as “a holistic process which aims to reverse the economic, social and physical decline of places where market forces alone will not suffice… balancing community, business, environmental and individual needs… as well as changes to the physical environment.”

So — redevelopment focuses on monetary investment and physical changes. Regeneration focuses on the existing community and the “social decline” of a place, as well as economic and physical factors. Even further, it aims to “holistically,” address “individual needs.” Of course many redevelopment projects address the community, but because the APA distinctly says that “the private sector may initiate redevelopment projects without any active public involvement beyond the government’s traditional regulatory role,” I would argue that it involves less social investment than regeneration.

Perhaps the distinct difference between the responsibility to act directly on behalf of existing residents versus the responsibility to investors stems from a large English planning system that is more politicized (and therefore receives more federal funding.)

While in America, gentrification might be seen as an inevitable side effect of redevelopment, in England it is seen as a sometimes inevitable and therefore tragic side effect of regeneration.

To illustrate this point, look at a true regeneration project: Angell Town, Brixton, London

Problem (courtesy of Rudi):

• Lack of public space for social interaction – derelict communal areas were unused.
• The garages provided were dark and un-surveyed, and therefore, never used.
• The estate was perceived as crime ridden, as the multiplicity of bridges and walkways provided ideal escape routes for criminals, often from outside the estate itself.
• Litter accumulation resulted from removing the bridges (which gave access to the waste removal pick-up points), in an attempt to reduce crime
• The estate came to epitomize neglect and decline
• The estate became stigmatized a sink estate.

Solution – A summary of simple urban design changes:

• The first main part of the scheme involved re-orientating the existing deck-access housing into a more “normal” street format, based on terraced dwellings which related to the street through individual entrances.
• Each dwelling was given an individual, recognized identity — surveillance on the street was improved, as windows now faced directly out
• Terraced housing replaced the monotonous, unsafe corridors of entrances.
• The pedways, which were perceived as unsafe, were removed so that the houses could be extended to face on to the street.
• New central grassed areas were defined as focal points for the houses. These areas were separated from the new vehicular perimeter roads by railings, enabling children to play, away from the danger of traffic and dogs.
• The unused garages on the ground floors were replaced with shops and community facilities, such as a bar, cafe, workshops, and even a recording studio in one area, to provide the previously, much lacked social amenities. This design measure also helped transform dark and bleak spots into animated facades of street level activity.

Instead of only seeing Angell Town's problems, the urban designer, planners, and architects looked at them as opportunities to build on the strong community that had lived there for decades. The project improvements didn’t eradicate every trace of the place that had become their home, but committed a large investment to renovate the buildings they could, and design the new ones to compliment the existing ones so well that you had to look hard to tell the difference between the two.

Members of the community could still see where they came from. In other words, it still felt like home. Most importantly they could look again a little harder and see their bright futures. This might sound like I’m laying it on a little thick, but the success of this regeneration stunned so many, both nationwide and on the European continent, that it provoked intense project documentation. Residents who were interviewed realized what planners so often don’t: they looked to their physical environment to define their identity. With the existing bones of the original Angell Town Estate still in existence, they easily identified the physical improvements to be improvements in themselves.

This outstanding result came from an intense and time-consuming community consultation process, a term that is distinctly different than public involvement. The lead urban designer was so involved with the community that he actually lived there on the weekends in a flat. While this is rare in any country, it certainly is to be commended.

Perhaps the most powerful items in Angell Town now are the benches that, poetically, are made from the rubble of demolished parts of the old buildings, caged, with stone seats on top. People can actually sit on the physical representation of what was destroying their community. This was recited by residents often as what made the biggest difference to them. Don’t ever underestimate the power of poeticism!

I would love you to share you comments on this story. I'll also suggest: Consider the many similar public housing projects in America that have been completely razed and rebuilt to look like another place. How does it make people feel to have their homes be deemed so worthless that they are torn down and completely replaced, often with architectural rubbish?

So, what will it be — redevelopment or regeneration?

Photo: UK Government Web Archive: Angell Town – "Many residents also have private outdoor space." Building for Life is run by CABE and the Home Builders Federation with Design for Homes.© Commission for Architecture and the Built Environment (CABE)

A different version of this post appeared on Erin Chantry's blog, At the Helm of the Public Realm. Chantry is an Urban Designer in the Urban Design and Community Planning Service Team with Tindale-Oliver & Associates

Religion and the City

$
0
0

Seek the welfare of the city where I have sent you into exile, and pray to the LORD on its behalf; for in its welfare you will have welfare. – Jeremiah 29:7

Religion is another one of those topics seldom discussed in urbanist circles. Though Christianity was originally an urban religion, modern Christianity has always had a bit of a problem with cities, with their licentious ways, anonymity, and the little bit of Babylon and Sodom they all contain.

The religious in the US are often associated with the political right and conservative stances on social issues – just the type of people who don’t like cities or city dwellers much, and vice versa. In particular, the strident opposition of many to abortion and homosexuality puts religion on the wrong side of what are also litmus test issues for many urbanists.

Yet urbanists should take religion much more seriously than they often do. That’s because it plays a much bigger role in the city and civic health than currently believed, and because many urban congregations have mastered the art of outreach and conversion in a way that transit and density advocates can only dream out.

The Importance of Religion

Churches have always been important institutions in cities. Even today, the only reason many families with children are confident enough to stay in the city is because they can enroll their kids in Catholic or other religious schools. I can only imagine what a place like Chicago would look like if its religious school network wasn’t there. Religious institutions are also heavily involved in poor relief and other social service activities that help reduce the tax burden. And regardless of what you personally think about any particular religion, if someone is able to use faith to help them get over serious personal dysfunction like criminal behavior or alcoholism, more power to them.

For ethnic and minority communities, churches have long been key community institutions and support organizations. In a video I’ll get to shortly, Tim Keller notes as one example how the Jewish community of New York City has built extensive institutions there that made it much easier for Jewish families, not just young Jewish singles, to stay in the city. Churches have long been important in black communities that are often neglected and underserved by government, and many black pastors are seen not only as religious, but very important community or political leaders as well. I suspect religious institutions play a particularly key role in fostering community networks for what are niche minorities in many cities – Muslims, Sikhs, etc.

This is an urban world that doesn’t feature much in the landscape of the traditional affluent white bobo demographic that dominates urbanist discussion. But even in that group, I see many examples of how religious minded urbanists types have helped boost and build a better future for their city.

For example, in Indianapolis, the Earth House Collective, a “group of peace activists, conservationists, artists, musicians, Methodists, teachers and many more dedicated to peace, wellness, community and culture” is based in the heart of downtown Indianapolis at Lockerbie United Methodist Church. Similarly, the Harrison Center for the Arts, one of the city’s most important arts venues, is housed at Redeemer Presbyterian Church. Both of these are taken seriously by even the most hardened atheists in the city.

The Harrison Center’s executive director, Joanna Taft, was one of the people who helped found the church as well (and the charter Herron High School and lots of other things). She explained how her Christian motivation propels her work in city revitalization:

I have been Presbyterian my whole life and my worldview has been influenced by the protestant reformed concept of the cultural mandate. This is the idea that humankind has been called to continue God’s work of creation–building cities, restoring broken neighborhoods, creating beauty, raising children, planting gardens, etc…..While some of our Christian friends would feel guilty doing this work because it was not “full-time Christian service”, understanding the cultural mandate gave us the freedom to pursue what some would see as secular work.

There’s a lot more to religion in the city than just abortion protests. It’s time urbanists took religion and religious institutions a lot more seriously, even if they don’t agree with the religious in many cases.

Learning from Evangelism

Not all religions seek out converts, but Christianity and Islam, two of the big kahunas, do. Since in most countries you can’t force someone to belong to a religion or have a particular set of beliefs, this requires the ability to persuade, and really speak to the people you are trying to convert.

If you really are trying to save souls, then it isn’t enough just to be right, you have to also be effective. That’s the part of the message that’s too often lost on urbanists of various stripes. They are pushing transit, density, sustainability, etc. largely based on a belief that these are self-evidently correct policies. I find that often their ability to sell them to people who are skeptical or come from a different worldview is poor. When people don’t sign on to the latest carbon reduction scheme, rather than blaming a bad sales job, the blame is almost always put on the people rejecting it, such as by calling them idiots, intellectually dishonest, shills for corporations, or “deniers.” I’m sure there are some of these types out there, but I believe the vast bulk of people don’t fall into these categories.

Not all, but a good chunk of religious evangelists actually care about what works. Their mandate doesn’t allow them to simply write off unbelievers as a hopeless sinners. As a result, you often see a lot more analysis of what they think they need to do to be successful in their mission.

As an example, I highly recommend watching the following 18 minute video of a speech by Rev. Tim Keller of Redeemer Presbyterian Church in New York City. (If the video doesn’t display, click here). If you aren’t familiar with the Redeemer story, this New York Times article from 2006 is good background. Keller’s speech is called “God’s Global Urban Mission,” and this segment discusses Contextualization. He gives 10 ways that urban churches are different from suburban or rural churches, and what they need to do differently to be successful in urban environments. Almost all of these are very relevant to urbanism.

He talks about items ranging from multicultural sensitivities to taking the arts serious to “being famous for helping the poor.” The latter was an item that jumped out at me because, as I’ve noted before, too many urbanist arguments are basically arguments for what I call “Starbucks urbanism.” If called on this, people will say, “But of course transit will benefit the poor too.” But that’s not how it’s sold. Urbanists ought to be famous for the way they design, implement, and talk about their policies as instruments for helping the poor and facilitating upward economic and social mobility. There’s a lot of other good stuff in the video that’s relevant to urbanism.

For those who prefer reading, Keller also wrote a paper called “Our New Global Culture: Ministry in Cities, which says of itself: “This paper surveys the rise of global cities, the culture and dominant worldviews within these cities, and a framework for ministering in them.”

You may think Keller’s analysis and framework is bunk, but at least he’s trying to look at the city as it is, and figure out what he’s got to do to adapt his ministry to it, not trying to make the city adapt itself to his ministry.

By the way, Keller is excited about immigration from places like Africa or China where Christianity is a lot more alive and expanding than it is in the US and especially Europe. I was clicking around Wikipedia and found this picture of a Chinese evangelical Christian church in Madrid is that is a perfect example of this trend and how it is changing the face of cities.


If you prefer a more purely secular example, Saul Alinsky also believed in understanding the worldview of people he was trying to organize. Even people he thoroughly disagreed with, he refused to hold in contempt, instead trying to see things from their perspective on their own terms. In “Rules for Radicals” (1971), he had this to say:

To bring out this reformation requires that the organizer work inside the system, among not only the middle class but the 40 percent of American families – more than seventy million people – whose incomes range from $5,000-$10,000 per year. They cannot be dismissed by labeling them blue collar or hard hat.

….

Many of the lower middle classes are members of labor unions, churches, fraternal, service and nationality organizations. They are organizations and people that must be worked with as one with work with any other part of our population – with respect, understanding, and sympathy. To reject them is to lose them by default. They will not shrivel and disappear. You can’t switch channels and get rid of them. This is what you have been doing in your radicalized dream but they are here and will be.

Wise words indeed.

Thanks to Pastor Kevin Bruursema at New Life Community Church in Lakeview, Chicago for the Tim Keller video reference.

Aaron M. Renn is an independent writer on urban affairs and the founder of Telestrian, a data analysis and mapping tool. He writes at The Urbanophile, where this piece originally appeared.

City Church photo by BigStockPhoto.com.

Pakistan: Where the Population Bomb is Exploding

$
0
0

In much the developed, as well as developing world, population growth is slowing. Not so in Pakistan according to reported preliminary results of the 2011 Pakistan census. Here population is growing much faster than had been projected. Pakistan's population stood at 197.4 million in 2011, an increase of 62.7 million from the last census in 1998 (Note 1). The new population is 20 million more than had been forecast in United Nations documents. Some of the additional growth is due to refugees fleeing Afghanistan, but this would not be enough to account for the majority of the under-projection error.  

Pakistan: Moving Up the League Tables

As a result, Pakistan has passed Brazil and become the world's 5th most populous nation, following China, India, the United States and Indonesia. Pakistan's 11 year growth rate is estimated at 34.2 percent, nearly double that of second ranking Mexico, at 18.2 percent, where the birth rate (as indicated by the total fertility rate) is projected to drop to under replacement rate by the end of the decade. Perhaps most significantly, Pakistan's growth rate is more than double the rates of India (15.9 percent) and Bangladesh (14.1 percent),which have long had reputations for strong growth (Table and Figure 1). At this growth rate, Pakistan could become the world's fourth most populous nation by 2030, passing Indonesia.


Table
10 Most Populous Nations: 2000-2011: Population Trends
Rank Nation 2000 2011 Change % Change
1 China    1,278.0    1,348.0        70.0 5.5%
2 India    1,071.0    1,241.0       170.0 15.9%
3 United States       285.5       313.1        27.6 9.7%
4 Indonesia       216.2       242.3        26.1 12.1%
5 Pakistan       147.1       197.4        50.2 34.2%
6 Brazil       176.9       196.7        19.8 11.2%
7 Bangladesh       131.9       150.5        18.6 14.1%
8 Russia       146.1       142.8         (3.3) -2.3%
9 Japan       125.9       126.5          0.6 0.5%
10 Mexico         97.0       114.8        17.8 18.4%
Population in Millions
Population data from UN, except for Pakistan (from Pakistan census)
2000 Pakistan population estimated from 1998-2011 growth rate.

Remarkably, while much of the world has seen a reduction in fertility rates and population growth, Pakistan's growth rate has increased. Between 1991 and 2001, Pakistan grew 25 percent, a rate that increased by more than one third (to 34 percent) between 2001 and 2011 (Figure 2). Pakistan's total fertility rate (TFR --- the number of live births the average woman has in her lifetime) is reported by the UN to be 3.2. This is well above India's rate of 2.6 and far above the Bangladesh rate of 2.2 (which is only barely above the generally accepted replacement rate of 2.1). Pakistan's fertility rate is the highest of any of the largest countries and one of the highest in the world outside sub-Saharan Africa.

Not surprisingly, the average household size is very high, at 6.8. This is a slight decline from the rate of 6.9 in 1998. By comparison, more developed countries, such as in Europe and North America, tend to have average household sizes of from 2.2 to 2.6.

Karachi: World's Leading Urban Area by 2030?

Pakistan's largest metropolitan region and capital of Sindh province, Karachi, grew even faster. Between 1998 to 2011, Karachi grew from 9.8 million to 21.2 million, adding more than 11 million people (115 percent). No metropolitan region in the world has ever grown so much in so little a period. This 13 year growth rate, adjusted to 10 years, is 8.7 million. Until the last decade, only Tokyo, among the larger world metropolitan regions, had ever grown more than 6 million in 10 years (6.2 million from 1960 to 1970). Between 2000 and 2010, Jakarta grew 7.4 million, Shanghai grew 7.0 million and Beijing added 6.0 million people.  (See Figure 3.)

Mexico City and Sao Paulo, with their reputations for explosive growth rates, are now expanding at only 3 million (or less) per decade, and their growth is slowing. The fastest growing metropolitan regions in regions in Europe and North America peaked at similar numbers. New York's greatest growth was 3.4 million between 1920 and 1930, while Los Angeles grew 3.1 million from 1980 to 1990.

The early census results indicate an urban area (area of continuous urban development, a part of a metropolitan area) population of approximately 19.5 million, which would rank Karachi as the 7th largest in the world. With an urban land area of approximately 310 square miles (800 square kilometers),  Karachi has an average population density of approximately 63,000 per square mile (24,000 per square kilometer), making it more dense than any "megacity" (urban area over 10 million population) except for Dhaka (Bangladesh) at 115,000 per square mile (44,000 per square kilometer) and  Mumbai (80,000 per square kilometer and 31,000 per square mile)

Karachi's strong growth now places it among a group of large and rapidly growing urban areas that could challenge Tokyo to become the world's largest urban area in 20 years. Indeed, should Karachi's now 6.0 percent growth rate fall to 4.0 percent, Karachi would still be the world's largest urban area in 2030, followed by Jakarta, given its present growth rate. With Tokyo likely to begin losing population by that time, Delhi may pass Tokyo by 2030 as well.

At the same time, Karachi is densifying in an unusual way: it is increasing its average household size. While the average household size is dropping modestly in the nation as a whole, Karachi's average household size rose from 6.7 to 7.3 between 1998 and 2011, meaning that nearly 10 percent of any recent density increase is within housing units (it is not known whether this is due to higher local fertility rates or "doubling up" of family units in housing units).

As the largest metropolitan area of one of the world's largest nations, Karachi draws residents from the rest of the nation (and outside) to take advantage of its economic opportunities. Pakistan is not a rich country, with a gross domestic product (purchasing power parity) of less than $3,000 per capita in 2011. This compares generally to rates of $30,000 to $40,000 in the larger European Union economies, $40,000 to $50,000 in Australia, Canada, United States and Hong Kong and $60,000 in Singapore. However, incomes are higher in Karachi than in the rest of the country.

As huge numbers of people have migrated to Karachi, many have been forced to live in informal settlements (slums), as squatters. In 2000, it was estimated that approximately 5 million of Karachi's residents (nearly 50 percent) at the time lived in slums.

Hyderabad

Hyderabad (Pakistan, not India) is the second largest metropolitan region in the province of Sindh. Hyderabad's claim to fame is that it is growing even faster than Karachi. Between 1998 and 2011, Hyderabad grew from 1.4 million to 3.4 million, or 129 percent.

Other Areas

So far, the reported census results are limited to the provincial data and local data in the province of Sindh. However, in view of the strong growth rates around the nation, it seems likely that the count in the nation's second largest urban area, Lahore, will surpass 10 million.

Urban Growth in Pakistan

Finally, any review of suburban and exurban land use on Google Earth suggests that Pakistan is taking the advice of the United Nations in its State of the World Population Report 2007: Unleashing the Potential of Urban Growth, which said (Note 2):

(a) expanding their city limits; (b) planning for road grids in the areas of expansion; (c) locating
the required 25- to 30-metre-wide right-of-way for the infrastructure grid on the ground

Radiating both from Karachi and Hyderabad, there are new grids of streets for housing and other development of a type that will allow the burgeoning cities of Pakistan to grow and perhaps even breathe at the same time.

Wendell Cox is a Visiting Professor, Conservatoire National des Arts et Metiers, Paris and the author of “War on the Dream: How Anti-Sprawl Policy Threatens the Quality of Life.”

------------------

Photo: Map of Karachi by Wikipedia user Nomi887

Note 1: This population includes the areas of Kashmir administered by Pakistan (and claimed by India) and excludes the areas of Kashmir administered by India (and claimed by Pakistan).

Note 2: This concept was pioneered by Professor Schlomo (Solly) Angel of New York University and Princeton University, who proposed that developing world urban areas provide grids of dirt roads to accommodate their rapidly growing populations. This would ensure a better planned urban area and lead to more healthful living conditions (and avoid the necessity of high-density slums or shantytowns).


Localism As An Anti-Depressant

$
0
0

Are we heading into a new era of local solutions?

Western economists and governments usually measure the health of the job market by unemployment percentages, with unemployment defined as less-than-full-time employment. But the reality for many Americans today is more akin to the rest of the world. Dad may not have a full-time job, but instead works several part-time jobs – auto mechanic when there are customers, store clerk on the weekends, and perhaps furniture repair guy for the neighborhood. Mom probably has a few part-time jobs also: housekeeper at a nearby hotel, caterer, and babysitter. Children old enough to work may do odd jobs.

This kind of economy may be more prevalent than economists think. It breeds neither hope nor health, especially since most remember the before-times.

Active resistance to this dark vision likely means more local solutions to economic problems. Instead of the turnaround coming from above, it may instead come from below. Big oil, big finance, and their floundering politicians are not the place to look for answers anymore. This may come as no surprise to anyone who has watched the last four years worth of turmoil, but the media, which is caught up in this game, is missing a much bigger story.

A good example from recent history is the turnaround performed by Boston’s North End neighborhood. Before World War II, this neighborhood was a classic immigrant community, and considered unhealthy, dangerous, and poor. After the war it was blacklisted by bankers who refused mortgages for home buyers, and the North End was cut off by the Central Artery highway running through the city. It became Boston's odd, leftover district.

But a mysterious thing happened to the North End. The nation's great urbanist, Jane Jacobs, visited it in 1959 with the director of the Boston Housing Authority, who wanted to show her the neighborhood before it was razed in the name of urban renewal. What she saw was a vibrant, robust street life, beautifully restored buildings, tenements that had been repurposed for middle-income flats, and a sense of pride in the neighborhood. After researching the area, she discovered it had the lowest crime rate, disease rate, and mortality rate in the city. Jacobs successfully staved off the bulldozers, and the North End still exists as one of the most picturesque neighborhoods in America today.

Because the North End was cut off by institutional investors, the neighborhood became economically introverted. Construction work was done on a cash or barter basis, and people made slow, incremental changes to their residences as the money became available. Instead of relying on banks for big credit infusions, North Enders relied on themselves.

By the standards of mainstream economists like Paul Krugman, the economy seems to be unraveling. A different way to view this phenomenon is to see it as multiplexing: different channels are being created. When only one channel is effectively being considered, other channels are developed without much scrutiny.

Tippy Perez is a typical example of someone who has tuned in to a local economic channel. As a paralegal for a large Orlando corporation with thousands of employees, Ms. Perez had job security, benefits, and the signature suburban lifestyle of the mainstream economy. Last year, however, she quit her job. “It was a dead-end job that wasn’t worth the fight anymore,” she stated. Between uncertain job security and the increasingly vicious corporate politics that come with the territory at such a large firm, her mainstream economy job simply could not hold her. After she quit Ms. Perez began a neighborhood pet-sitting service. Within a few months her home-based business has taken off, and she will never look back.

It’s busy and demanding, and lacks such mainstream amenities as a 401K, vacation, and sick leave, and Ms. Perez left a fine professional career for the service industry. This move, however, has much greater appeal to her because she can regulate the pressure. The income, although smaller, comes with less stress. Corporate downshifters starting bike shops and farms have been around for some time, but those are usually stories of escape from an urban location. Ms. Perez is part of an increasing population that has chosen to stay in the same place, but to downshift out of the mainstream into the local economy, sometimes as local as the immediate neighborhood.

Food trucks are another example. The restaurant world, so overrun by big brand franchises and chains, has been seriously challenged by a new form of dining with little overhead and a spicy, independent spirit. The popularity of these trucks comes from the fatigue we are suffering from the high prices and industrialized food production typical of so many restaurants today. Alert neighborhood organizations are combining food truck rallies with local farmers’ markets and other events to create new forms of public involvement. Without the regulatory burden that comes with public accommodations, food trucks are a sign of this new economy.

The hallmark of each of these phenomena is its localism. As in the North End, no one is waiting for the big banks to come in and fix things. Instead, people are turning local needs into opportunities at a scale that is small enough that outside help is not needed. Under our very noses, a new economy is being born. Our towns and cities will adapt to this form long before it is noticed by the mainstream. The ingenuity and ambition of individuals will be the factors that bring us out of the Millennial Depression, and create a new economy for the future.

Richard Reep is an architect and artist who lives in Winter Park, Florida. His practice has centered around hospitality-driven mixed use, and he has contributed in various capacities to urban mixed-use projects, both nationally and internationally, for the last 25 years.

Flickr photo: Boston's North End by P Medved

Misreferencing Misoverestimated Population

$
0
0

I know the media confusion story of the past week is all about the momentary misreporting that got the story of the Supreme Court ruling backwards. Yet there was some real misoverestimating across the nation over the latest census numbers that were released recently on municipal population estimates for 2011.

Here are some recent headlines:

LATimes: U.S. population in cities growing faster than in suburbs

Chicago Tribune: Census sees Chicago’s population inching up

Boston Herald: U.S. population in cities growing faster than in suburbs, figures show

AP: Big US cities boom as young adults shun suburbs, census estimates show

Lots more just like those. Guess what… Pretty much all of those stories are wrong, or at the very least baseless when you really look at the data.

The census data reported was the 2011 population estimates for incorporated places across the US. So basically cities, towns, boroughs, and townships. We went through this yesterday, but if one read the actual census methodology for this particular data they were quite clear. The subcounty (i.e. municipal) population estimates are mostly based on an estimate of the change in housing units at the municipal level. The census changed their methodology on how they computed housing unit change for this particular data and as they explain:

“To produce subcounty housing unit estimates, we distributed the extrapolated county estimates down to each subcounty area within a county based on 2010 Census proportions.” (emphasis added)

Which means basically that there was very little 2011 data that went into these numbers. Without using new information it begs the question of how much the results should be interpreted. They basically took the estimated county level population data and allocated it to smaller municipalities based on the 2010 Census. They also just assumed that all the growth was even within counties. That assumption, that center cities grew the same as their immediate suburbs, produced the results being reported on everywhere. There appears to be no other supporting analysis for the assumption, it is just an assumption. Other than that, there is no new information here to lead to the conclusions making their way into the headlines. It may have even tripped up the experts out there because the Census folks explain they changed their methodology just for this particular data release, and are likely to change it again before next year’s update. But you have to read into their methodology notes to realize the changes for just this year. This is all probably an example of why some of us have the bad habit of reading footnotes first.

Was there any new growth in cities? Not at all. Or at least there is no data in any of this to tell us one way or another. The Census basically took the growth that likely continued to be mostly in the suburbs and just assumed it was spread evenly between center cities and suburbs within counties across the nation. The result was that it all of a sudden appeared cities were growing faster (or in some cases shrinking less) than they have been in other data. In reality, the new patterns were no more than an artifact of the temporary change in the Census Bureau’s methodology for this data. If they had ever used the same methodology in the past, namely taking county-wide population changes and distributed growth evenly across municipalities the results would have come out the same. If these municipal estimates had been calculated this way over the last decade, they would have wound up being very much different from the eventual decennial census enumeration.

So the headlines may be ok if there is data on ‘cities’ that are in themselves counties, but those areas are few; or in the case of New York City, multiple counties. For most cities are only parts of larger counties. Other than Allegheny County I looked at Cook County which includes Chicago and indeed both the city of Chicago and most all of its Cook County suburbs are being reported as having nearly identical growth rates since 2010. I bet that is no more true there than it isn’t here.

The only caveat to any of that is that the data reported does seem to have some new 2011 data on group quarters population incorporated into it, as their methodology says it should. So where there was a recent change in the population of college dorms, military barracks, prisoners are related types of institutions then you are seeing population changes different from the county-wide averages. That appears to me the main source of the disproportionate growth the 2011 data is showing for the City of Pittsburgh. So real growth for sure, but I would be careful in explaining its causes.

So this all may not be as egregious an error as the news cycle we once had in 2000 when population ‘growth’ Downtown was attributed to a big new influx of young people living in the Golden Triangle in the 1990’s. The truth was that the Allegheny County Jail was rebuilt and expanded in the 1990’s and that expansion more than accounted for a nominal reported increase in Downtown’s residential population. The eventual increase in Downtown’s population would come mostly a decade and several hundred million dollars in subsidies later. Nonetheless, this misuse of Census data is certainly more widespread and likely be misreferenced for years to come.

Chris Briem works at the Program in Urban and Regional Analysis at the University of Pittsburgh's University Center for Social and Urban Research. This article originally appeared at Nullspace on June 29, 2012 and The Urbanophile on June 30, 2012.

Photo by Flickr user quinn.anya, accessible online.

Coney Island's Invisible Towers

$
0
0

When crowds thronged Coney Island for the annual Nathan's hot dog eating contest on July 4th, they found a boardwalk amusement strip that was, for the umpteenth year in a row, undergoing a summer of change and transition.

There is the new: go-carts and a new roller coaster for the "Scream Zone" that the Luna Park amusement park added last summer; and the start of a new pavilion alongside the Parachute Jump, where the old B&B Carousell (second "l" now enshrined as a historic typo), relegated to storage since 2005 and painstakingly restored at city expense, will once again whirl next spring.

There is the disappeared and the disappearing: Henderson's Music Hall, where Harpo Marx made his stage debut, was demolished two winters ago by landowner Thor Equities; this spring, it was replaced by a nondescript one-story structure that, lacking tenants, was instantly boarded up with plywood. And barring an unforeseen reprieve, this will be the final summer for both Denny's ice cream and the Eldorado bumper cars, each of which is expected to see its Surf Avenue storefront razed for new construction — or at least occupied by new businesses — in the near future.

It's another step in the remaking of the Brooklyn beachfront that began in 2003, when the city launched a rezoning process to transform the diminished yet still-popular summer destination into what it hoped would be a year-round hot spot for both residents and entertainment-seekers. In the years since, what seemed like the beach's inexorable slow slide into decay — a bathhouse burned down one decade, a derelict rollercoaster razed the next —turned into a whirlwind of change, as developers and longtime neighborhood property owners alike began smelling greenbacks in the air, and the 46-year-old Astroland amusement park and many longtime boardwalk businesses were pushed out in the rush to make way for promised glitzier attractions.

Yet amidst all the noisy mermaid-filled debates that accompanied the rezoning battle, it's been easy to forget that the amusement district proper — a beachfront strip of rides, carny games and skeeball parlors that over the decades has shrunk to a relict dozen or so acres — was never the main target of the city's rezoning efforts. Though the storefronts along Surf (including the homes of Denny's and Eldorado) were slated for high-rise hotels on the city's rezoning renderings, much of the focus of the Coney Island Development Corporation (spun off by the city Economic Development Corporation in 2003 to oversee redevelopment plans) was to the west, where the city's stated intent was to bring mixed-use housing and retail towers to the vacant lots that have littered Surf Avenue since they were cleared for urban renewal in the 1960s. Click here to see a map of the rezoned area.

"It's a neighborhood with a significant amount of poverty, very few jobs and lots of abandoned lots," said city Economic Development Corporation (EDC) president Seth Pinsky after the rezoning was approved by the City Council in 2009. The hope at the time was that by dropping some high-end residents into Coney Island, as well as new storefronts along Surf Avenue that could host restaurants, movie theaters and other year-round attractions, local residents could finally have access to more than the seasonal jobs that have traditionally accompanied the summer beach season.

Three years later, though, there is little sign of the condo messiah arriving anytime soon. A single apartment building on the boardwalk at West 32nd Street was begun two winters ago, but today remains unfinished. Nearby, Coney Island Commons, a mixed-income coop complex that will include a new YMCA-run community center, has blown past its original summer 2009 target completion date — thanks to delays in finalizing financing and community agreements, according to developer Jerome Kretchmer — and is now slated for an opening in 2013.

Among the actual lots rezoned three years ago, meanwhile, Thor's plywood-bedecked single-story building is the only sign of new construction. In particular, the "Coney West" lots just west of the Brooklyn Cyclones stadium, which in city renderings appeared as modern glass-and-brick towers fronting tree-lined boulevards, remain much as they have for decades: empty expanses of dirt and gravel, used as ad-hoc parking lots if anything at all.

Some of this, no doubt, can be blamed on the collapse of the housing bubble, which struck just as the city put the finishing touches on its rezoning plan. Yet even if demand for beachfront condos rebounded tomorrow, many longtime residents warn that it would still take years, if not decades, of sewer and electrical upgrades before Bloomberg's residential dreams could become reality.

"Before they put up one major building, they basically have to rip up the entire peninsula, and put in stormwater lines and sewage lines," says Ida Sanoff, a former Community Board 13 member who has become the beachfront's most dedicated environmental watchdog.

It's an investment that the city says it's willing to make — eventually: The EDC is now openly talking about a "30-year plan" for redevelopment. The price tag, according to city figures, could run close to half a billion dollars, making it one of the most expensive city redevelopment projects of the Bloomberg era. And even then, it's an expensive gamble by the city that the promised construction will ever arrive.

* * * *

If Thor Equities' Joe Sitt was the developer that Coney fans loved to hate — the man who evicted Astroland, who threatened to build high-rise apartment buildings and hotels right on the boardwalk — then Taconic Investment Partners were the designated good guys. With none of Sitt's bluster, the real estate investment firm quietly bought up several blocks of vacant lots along Surf Avenue — one, bought by Sitt for $13 million, cost Taconic $90 million less than a year later — and announced plans to work with the city to bring in mixed-use condo towers at a respectful distance from the amusement zone.

Taconic officials were amiable and readily accessible at the time, but have since all but disappeared from public view; company officials did not return numerous calls and emails for this article, and its websitenotes only that "Taconic is in the process of evaluating the economics of a planned development for some or all of our holdings."

The city, meanwhile, is moving slowly on the infrastructure upgrades that it will take to support the new buildings, when and if they arrive. The first phase — a set of new storm sewers and ungraded sanitary pipes along W. 15th St. and a short stretch of Surf Avenue — is currently in the design phase, with work set to start in the fall and a target completion date of 2015. Two more phases will expand into surrounding blocks, but not until 2022. A total of $140 million has been budgeted for new sewer and water lines between West 12th Street and West 21st Street, according to EDC.

But the peninsula's infrastructure needs, according to longtime locals, go far beyond the few square blocks around the Taconic properties. "Everything south of Surf Ave., there's no storm water lines in," says Sanoff. "You're going to have a lot of paved surfaces, and where is all that stormwater going to go?" Already, she says, "If you walk the beach here after a heavy rain, it's just littered with poop bags" that dog owners have thrown into the sewers — and which have popped back up when stormwater backs up.

"The whole peninsula is in need of [infrastructure work]," says CB13 district manager Chuck Reichenthal. "You can't put up highrise hotels, buildings, or anything else, when what exists now has flooding problems."

Brian Gotlieb, who served as chair of Community Board 13 from 2002 to 2006, says he expects that the city would have moved more quickly on sewer upgrades if developers were champing at the bit to put shovels in the ground. Even so, he worries that sewers are only the tip of the iceberg when it comes to needed infrastructure upgrades. "Coney Island has always had problems with brownouts and blackouts," he says, predicting a need for major electrical upgrades. (EDC says these will be handled by ConEd on an as-needed basis.) And then there's the eventual demand for schools to educate the children of all those condo dwellers if and when they arrive.

What the total cost would be, no one can say. The city Independent Budget Office projects a total city expense of $277 million on land acquisition, park and boardwalk reconstruction, and other neighborhood capital projects through 2013; add in the $140 million budgeted by the Department of Environmental Protection for sewer work, and the total price tag is at $417 million. (If you include the $39 million Keyspan Park and $250 million Stillwell Avenue subway terminal — first put in motion when Rudy Giuliani was touting Coney Island and as the next Times Square — total public expense on the rebuilding of Coney rises to more than $700 million.) And that's not even factoring in any increased costs of protecting a newly developed beachfront from the ravages of climate change: In 2007, Rohit Aggarwala, who was then running Mayor Bloomberg's PlaNYC project to plan for the city's future growth, called a five-inch rise in water level by 2030 "a moderate scenario"; a University of Arizona sea-level mapping toolprojects that in a worst-case scenario, Coney Island could be reduced to three disconnected islands by the end of this century. (The rezoning does require that local streets be raised to guard against sea-level rise, according to EDC, but specific plans—and budgets—will be worked out only "as sites are developed.")

This is par for the course in city redevelopment efforts, says Hunter College planning professor Tom Angotti. "I don't know of anyone who systematically calculates costs in New York City," he says. "The infrastructure that does get built is a very pragmatic response to either developer needs or community opposition." In other cities, he notes, "when you have a significant negative impact, then there's a whole discussion of whether new infrastructure is needed — here, it doesn't get discussed."

* * * *

If there's an upside to the city's deliberate pace, it's that if the market for Coney condos never recovers to pre-crash expectations, then taxpayers save the hundreds of millions of dollars it would take to build the infrastructure to support the influx of new inhabitants. (The $95 million the city spent to relieve Sitt of his stretch of the amusement district, though, is a sunk cost.) The downside is that then the last ten years of upheaval on Coney Island has failed to achieve its primary goal.

It would also mean the death of hopes that the rezoning drama will ultimately produce jobs for the impoverished blocks to the west, a cul-de-sac known as the West End that sports some of the highest unemployment rates in the city. During the rezoning battle, a coalition calling itself Coney Island CLEAR, made up of representatives of several city unions and a handful of locals (most prominently Rev. Connis Mobley of the West End's United Community Baptist Church), lobbied for job guarantees for local residents as part of the rezoning.

Gotlieb, who served on CLEAR's board, says that the hope was that new development would bring not just jobs — which in Brooklyn as often as not employ people outside the immediate neighborhood— but training opportunities to help residents plan for careers. And while the CIDC has helped some people get building certifications, he says, so far there's been little to build. "Once the economy took a turn that it did, nobody was doing a heck of a lot."

For now, the city is publicly professing patience, with an EDC spokesperson saying that an timetable for the Taconic properties "is determined by the private developer," adding, "We’re less than three years into a 30-year redevelopment plan and significant progress has already been made. We’re confident the 2009 rezoning lays out a practical pathway going forward."

Looked at another way, though, this round of predictions of a reborn Coney Island has been going on for almost a decade, and its biggest booster is only a year and a half from departing City Hall. If the long history of failed plans for the neighborhood — from the post-war urban renewal plans that first created today's vacant lots to Ed Koch's late-'70s promises of beachfront casinos — tells us anything, it's that in Coney Island, nothing is a sure bet.

This piece originally appeared at The Brooklyn Bureau.

Photo By Pearl Gabel.

Modern Families: Fact from Fiction

$
0
0

I sometimes struggle with our willingness to look straight through evidence to see only what we want to see, or what we believe we should be seeing. Some recent interpretations of the Australian census and conclusions about housing form and consumer choice regrettably fall into this category.

Early results from the Australian census may have disappointed some boosters who have actively promoted the view that the typical family household is a thing of the past. The argument has had many forms but usually includes one or more of the following:

  • that single person households are the fastest growing household type; that lifestyle choices mean that more people want to live closer to city centres;
  • that the suburban housing block is an environmental calamity and is no longer even suited to what households want;
  • that high density, multi-level housing with high reliance on public transport is a preferred housing model for the ‘new’ generation of family types.

And so it goes.

Sadly for the promoters of rapid social change, the census reveals that the facts aren’t on their side. Indeed, in terms of housing form and family type, nothing much has really changed. There have been movements at the margin and movements in both directions, but nothing I would interpret as conclusive evidence of fundamental social change.

Housing form

Across Australia, 73.8% of us live in a detached house. In the last census, it was 74.3%. That’s hardly a seismic shift. In 2011, 14.6% of us lived in apartments compared to 14.7% five years earlier. Townhouses account for 9.9% of households versus 9.3%.  Don’t hold the front page, nothing much has changed.

There are regional differences. In Sydney, detached housing is at 58.9% from 60.9% while apartments represent 27.6% of households against 26.4% five years earlier. This higher proportion in apartments comes as little surprise given the highly restrictive planning policies of NSW in that period and prior (which included a virtual prohibition on suburban expansion), combined with the long established tendency of Sydney to accommodate more people in apartments than other capitals. But for all the hype about Bob Carr’s ‘brawl against sprawl’ and subsequent planning regimes, the actual change in housing has been minimal. (Instead, what happened is that the industry stopped supplying much of either).

In Melbourne by contrast, detached housing represents 71.1% of housing from 71.6% five years earlier. Apartments are 16.6% versus 16.4%. Melbourne, and Victoria generally, has had a less deterministic approach to planning whereby detached suburban expansion hasn’t been as vigorously opposed, so the higher dominance of the detached house is no surprise. But it also shows little change over recent times, which doesn’t support the view that a majority of consumers would prefer higher density over lower.

In Brisbane, detached housing is at 77.6% versus 78.7% five years earlier, which is a very small change and also one of the highest proportions of households in detached housing in the country. Once again, the evidence isn’t pointing to massive social change. It isn’t even pointing to modest change.

Family type

Also regrettable for the promoters of widespread social change has been the fact that family types have remained largely unchanged. There are 43% of people living as a couple with children (it was 43.3% five years earlier) and there are 39.5% living as couples without children.  Remember also that ‘couples without children’ includes couples in the pre-family formation stage (young, and starting out in life in the main) and also ‘empty nesters’ (parents whose children have left the family home). A further 16% are single parent families. 

The Census this time also went into some detail about same sex couples. But set aside the media and political hype and the facts show that the proportion of same sex couples across the country is 0.7%. There’s been a lot of media comment and public policy attention recently about that 0.7%.

The inevitable conclusion from this evidence is simply that the overwhelming majority of people in Australia remain families who either have children, who plan to have children, or who have had children who have left home, and that this proportion hasn’t changed to anywhere near the extent promoters of social change might have wished.

This also has implications for housing choice and style. There will be a market for higher density, inner city housing but our policy makers need to keep in mind that the detached home remains the overwhelming preference for families as a place to raise children. That also includes couples planning to raise children (not all of whom live in apartments until the first child comes along – many prefer to plan ahead) and it also includes couples with children who have left home but for whom a third or fourth bedroom is needed for grandparent child minding or children returning to the family home.

However, the evidence hasn’t stopped some sections of the media or social commentators from reaching entirely different conclusions. “Up not out for housing” declared one writer who wrote: “Australia is increasingly favouring higher density living, according to the 2011 census.” Really? Based on the same evidence above? You’d be seriously pushed to draw that conclusion. Add to this that supply side policies have restricted the choice of detached housing in preference to the promotion of higher density, which means that increasingly housing choice has been restricted, and what there is of it, much more expensive. To conclude anything about ‘favouring’ one type of housing or another, without assessing the supply side policy constraints which limit choice, is a bit like saying more people prefer mangoes in summer than in winter. Duh.

The Grattan Institute is another that seems committed to turning the evidence on its side to support pre-determined points of view. In this opinion piece, Grattan Institute cities program fellow Peter Mares concluded that: “that despite paying significantly more to put a roof over their head than they were five years ago, many are not ending up in the kind of housing that best matches their preferences.”  Describing the “popular view that we are wedded to the suburban block” as a mismatch, the conclusion is that ‘we’ (being, I presume, the unelected policy makers)  need to have “a serious, if difficult, conversation about what type of housing we should build and where it should be built.”

Well, that would be difficult if it means imposing a form of housing on a population that might prefer to make its own choices about what type of housing it ‘should’ have and where they ‘should’ be living. 

These aren’t the only examples and as more Census data becomes available, plenty more commentators will seek to extrapolate minor changes at the margin into claims this represents evidence of fundamental social change. It doesn’t and we can only hope our policy makers know the difference between evidence and a sitcom.

Ross Elliott has more than 20 years experience in property and public policy. His past roles have included stints in urban economics, national and state roles with the Property Council, and in destination marketing. He has written extensively on a range of public policy issues centering around urban issues, and continues to maintain his recreational interest in public policy through ongoing contributions such as this or via his monthly blog The Pulse.

Family illustration by BigStockPhoto.com.

The Cities Where A Paycheck Stretches The Furthest

$
0
0

When we think of places with high salaries, big metro areas like New York, Los Angeles or San Francisco are usually the first to spring to mind. Or cities with the biggest concentrations of educated workers, such as Boston.

But wages are just one part of the equation — high prices in those East and West Coast cities mean the fat paychecks aren’t necessarily getting the locals ahead. When cost of living is factored in, most of the places that boast the highest effective pay turn out to be in the less celebrated and less expensive middle part of the country. My colleague Mark Schill of Praxis Strategy Group and I looked at the average annual wages in the nation’s 51 largest metropolitan statistical areas and adjusted incomes by the cost of living. The results were surprising and revealing.

In first place is Houston, where the average annual wage in 2011 was $59,838, eighth highest in the nation. What puts Houston at the top of the list is the region’s relatively low cost of living, which includes such things as consumer prices and services, utilities and transportation costs and, most importantly, housing prices: The ratio of the median home price to median annual household income in Houston is only 2.9, remarkably low for such a dynamic urban region; in San Francisco a house goes for 6.7 times the median local household income. Adjusted for cost of living, the average Houston wage of $59,838 is worth $66,933, tops in the nation.

Most of the rest of the top 10 are relatively buoyant economies with relatively low costs of living. These include Dallas-Fort Worth (fifth), Charlotte, N.C. (sixth), Cincinnati (seventh), Austin, Texas (eighth), and Columbus, Ohio (10th). These areas all also have housing affordability rates below 3.0 except for Austin, which clocks in at 3.5. Similar  situations down the list include such mid-sized cities as  Nashville, (11th), St.Louis (12th), Pittsburgh, (13th), Denver (15th) and New Orleans (16th).

One major surprise is the metro area in third place: Detroit-Warren-Livonia, Mich. This can be explained by the relatively high wages paid in the resurgent auto industry and, as we have reported earlier, a huge surge in well-paying STEM (science, technology, engineering and math-related) jobs. Combine this with some of the most affordable housing in the nation and sizable reductions in unemployment — down 5% in Michigan over the past two years, the largest such drop in the nation. This longtime sad sack region has reason to feel hopeful.

Only two expensive metro areas made our top 10 list. One is Silicon Valley (San Jose-Sunnyvale-Santa Clara), where the average annual wage last year of $92,556, the highest in the nation, makes up for its high costs, which includes the worst housing affordability among the 51 metro areas we considered: housing prices are nearly 7 times the local median income. Adjusted for cost of living, that $92,556 paycheck is worth $61,581, placing the Valley second on our list.

In ninth place is Seattle, which placed first on our lists of the cities leading the way in manufacturing and STEM employment growth. Housing costs, while high, are far less than in most coastal California or northeast metropolitan areas.

What about the places we usually associate with high wages and success? The high pay is offset by exceedingly high costs. Brain-rich Boston has the fifth-highest income of America’s largest metro areas but its high housing and other costs drive it down to 32nd on our list. San Francisco ranks third in average pay at just under $70,000, some $20,000 below San Jose, but has equally high costs. As a result, the metro area ranks a meager 39th on our list.

Much the same can be said about New York which, like San Francisco, is home to many of the richest Americans and best-paying jobs. The average paycheck clocks in at $69,029, fourth-highest in the country, but high costs, particularly for housing, eat up much of the locals’ pay: adjusted for cost of living, the average salary is worth $44,605. As a result, the Big Apple and its environs rank only 41st on our list.

Long associated with glitz and glitter, Los Angeles does particularly poorly, coming in 46th on our list. The L.A. metro area may include Beverly Hills, Hollywood and Malibu, but it also is home to South-Central Los Angeles, East L.A. and small, struggling industrial cities surrounding downtown. The relatively modest average paycheck of $55,000 annually, 12th on our list, is eaten up by a cost of living that is well above the national average. This creates an unpleasant reality for many non-celebrity Angelenos.

Many of the metro areas that rank highly on our list have enjoyed rapid population growth and strong domestic in-migration. Houston, Dallas-Fort Worth, and Austin all have been among the leaders the nation in both domestic migration and overall growth both in the last decade and so far in this one. In the past year, for example, Dallas led the nation with 40,000 net migrants while Austin’s population growth, 4 percent, was the highest rate among the large metropolitan areas.

In contrast, many of the cities toward the bottom of our list — notably the Los Angeles and New York areas — have led the country in domestic outmigration. Between 2000 and 2009, the nation’s cultural capitals lost a total of over 3 million people to other parts of the country. Although migration has slowed in the recession, the pattern has continued since 2010.

And how about the future? Income and salary growth has been so tepid recently that few large cities can claim to have made big gains over the past five years; there has been continued volatility as some regions that did worst in the past decade — for example San Francisco — pick up steam. Unfortunately any growth in such highly regulated areas also tends to increase costs rapidly, particularly for housing. In California, this is made much worse by both soaring taxes and a regulatory regime that drives up costs faster than income games.

Similarly these high prices seem to have the effect of driving out middle-class workers; places like New York, Los Angeles and San Francisco have extraordinary concentrations of both rich and poor workers but fewer in the middle. As we pointed out in our annual job and STEM rankings, many technology, manufacturing and business service jobs are heading not to the hotspots but more to the central part of the country.

Over time, it seems clear that, for the most part, the best prospects for the future lie in places that both experience income and employment gains but remain relatively affordable. These include some cities that didn’t crack the top 10 of our list but appear to be gaining ground, such as Nashville, Pittsburgh, St. Louis, San Antonio and New Orleans, a once beleaguered city that has experienced the nation’s fastest per capita personal income growth since 2005.

Maintaining affordability and a wide range of high-paying jobs many not be as glamorous a metric for success as the number of hip web startups or the concentration of educated people. But over time it is likely to be about as good a guide to future prospects as we have.

Joel Kotkin is executive editor of NewGeography.com and is a distinguished presidential fellow in urban futures at Chapman University, and contributing editor to the City Journal in New York. He is author of The City: A Global History. His newest book is The Next Hundred Million: America in 2050, released in February, 2010.

This piece originally appeared in Forbes.

Houston photo by BigStockPhoto.com.


Metropolitan Pay per Job 2011 - Adjusted for Cost of Living
MSA Name 2011 Avg. Annual Wage Unadj. Rank 2011 Adj. Annual Wage Adj. Rank Rank Change
Houston-Sugar Land-Baytown, TX $59,838 8 $66,933 1 7
San Jose-Sunnyvale-Santa Clara, CA $92,556 1 $61,581 2 (1)
Detroit-Warren-Livonia, MI $53,424 17 $57,016 3 14
Memphis, TN-MS-AR $48,025 32 $55,908 4 28
Dallas-Fort Worth-Arlington, TX $53,453 16 $55,564 5 11
Charlotte-Gastonia-Rock Hill, NC-SC $51,143 18 $54,816 6 12
Cincinnati-Middletown, OH-KY-IN $49,886 24 $54,580 7 17
Austin-Round Rock-San Marcos, TX $50,422 19 $54,393 8 11
Seattle-Tacoma-Bellevue, WA $60,123 7 $53,874 9 (2)
Columbus, OH $48,483 30 $53,691 10 20
Nashville-Davidson--Murfreesboro--Franklin, TN $48,343 31 $53,595 11 20
St. Louis, MO-IL $48,638 29 $53,390 12 17
Pittsburgh, PA $49,717 25 $52,444 13 12
Chicago-Joliet-Naperville, IL-IN-WI $56,246 10 $52,419 14 (4)
Denver-Aurora-Broomfield, CO $54,991 13 $52,372 15 (2)
New Orleans-Metairie-Kenner, LA $50,046 23 $52,349 16 7
Birmingham-Hoover, AL $46,381 39 $52,349 17 22
Washington-Arlington-Alexandria, DC-VA-MD-WV $71,180 2 $52,300 18 (16)
Atlanta-Sandy Springs-Marietta, GA $50,273 20 $51,989 19 1
Raleigh-Cary, NC $47,577 35 $50,722 20 15
Milwaukee-Waukesha-West Allis, WI $50,183 22 $50,537 21 1
Richmond, VA $50,198 21 $50,148 22 (1)
Minneapolis-St. Paul-Bloomington, MN-WI $55,300 11 $50,023 23 (12)
Louisville/Jefferson County, KY-IN $45,832 41 $49,980 24 17
Phoenix-Mesa-Glendale, AZ $48,022 33 $49,764 25 8
Salt Lake City, UT $47,064 37 $49,751 26 11
Hartford-West Hartford-East Hartford, CT $61,551 6 $49,718 27 (21)
Kansas City, MO-KS $49,390 28 $49,688 28 0
Philadelphia-Camden-Wilmington, PA-NJ-DE-MD $57,745 9 $49,355 29 (20)
Oklahoma City, OK $44,852 44 $49,019 30 14
Cleveland-Elyria-Mentor, OH $49,531 26 $48,847 31 (5)
Boston-Cambridge-Quincy, MA-NH $66,438 5 $48,389 32 (27)
Tampa-St. Petersburg-Clearwater, FL $44,218 46 $48,168 33 13
Rochester, NY $47,228 36 $47,899 34 2
Jacksonville, FL $44,840 45 $47,753 35 10
San Antonio-New Braunfels, TX $43,920 47 $47,175 36 11
Buffalo-Niagara Falls, NY $46,210 40 $46,866 37 3
Baltimore-Towson, MD $54,980 15 $46,241 38 (23)
San Francisco-Oakland-Fremont, CA $69,041 3 $46,228 39 (36)
Las Vegas-Paradise, NV $44,910 43 $44,865 40 3
New York-Northern New Jersey-Long Island, NY-NJ-PA $69,029 4 $44,605 41 (37)
Virginia Beach-Norfolk-Newport News, VA-NC $46,934 38 $44,572 42 (4)
Portland-Vancouver-Hillsboro, OR-WA $49,472 27 $43,549 43 (16)
Orlando-Kissimmee-Sanford, FL $41,932 48 $43,096 44 4
San Diego-Carlsbad-San Marcos, CA $54,985 14 $42,102 45 (31)
Los Angeles-Long Beach-Santa Ana, CA $55,191 12 $41,559 46 (34)
Miami-Fort Lauderdale-Pompano Beach, FL $45,022 42 $41,286 47 (5)
Providence-New Bedford-Fall River, RI-MA $47,862 34 $38,107 48 (14)
Riverside-San Bernardino-Ontario, CA $41,825 49 $37,211 49 0
Indianapolis-Carmel, IN $48,767 no data
Sacramento--Arden-Arcade--Roseville, CA $53,057 no data
2011 wage data: EMSI Complete Employment, 2012.1
Cost of living data: C2ER
Viewing all 3789 articles
Browse latest View live


Latest Images