Quantcast
Channel: Newgeography.com - Economic, demographic, and political commentary about places
Viewing all 4167 articles
Browse latest View live

The Argument for Less Infrastructure

$
0
0

What would our neighborhoods look like if we voluntarily reduced the amount of infrastructure? This isn’t a purely academic question. As municipal, state, and federal budgets get squeezed there’s going to be a point at which we have no choice but to stop building new roads and even reduce the amount of maintenance on the roads we already have. We could approach this situation with dread and a sense of loss, or we could embrace it as an opportunity to get a better quality of life for a whole lot less money.

I grew up in New Jersey. Like most states the New Jersey Highway Trust Fund is just about bankrupt this year. Unless the gas tax is raised all revenue will go exclusively to debt service. If revenue were to drop below a certain point, due to lower gas prices or lower demand for gas, there won’t be enough money to service the debt either. We’re likely to see triage one way or another.

Screen Shot 2015-01-23 at 6.13.43 PM
Google

Screen Shot 2015-01-23 at 6.11.19 PM
Google

 Screen Shot 2015-01-23 at 6.01.27 PM
Google

Screen Shot 2015-01-23 at 7.02.56 PM
Google

 Screen Shot 2015-01-23 at 7.05.13 PM
Google

This is the historic Water Witch subdivision above Sandy Hook that was first built in 1895, not too far from New York City. Twenty five years ago I had friends who bought an old house here when the neighborhood was only beginning to come back after a long period of decline. Back then the houses were old and in varying states of disrepair. My friends saw the potential and started renovating their place and helped spearhead a revitalization of the neighborhood. These days it’s a posh address with rather expensive homes. But notice the narrow gravel roads.

Screen Shot 2015-01-23 at 6.10.03 PM
Google

 Screen Shot 2015-01-23 at 6.10.28 PM
Google 

Screen Shot 2015-01-23 at 5.59.30 PM
Google

Water Witch is a private community, although it isn’t “gated” in the contemporary sense. That means the HOA members pay to maintain the roads not the government. This is a really important distinction. When people believe their property tax money entitles them to certain things they often have high expectations. They tend to have a very different attitude when they know they’re going to be writing a check directly for the level of service they ask for. This difference in who pays for the roads leads to different outcomes. Back in the late 1980’s I was privy to HOA meeting debates where some members demanded that the roads be paved. They were tired of the ruts, mud puddles, and problems of snow removal. The dirt roads were one of the things that had kept property values depressed for decades. So a consulting engineer was brought in and explained exactly what it would cost to pave the roads. It would be many millions of dollars divided by the forty two homes in the community. That conversation came to a halt instantly. So much for paved roads at Water Witch. The compromise was to maintain the gravel roads to a slightly higher standard with annual adjustments that were far more cost effective. The resulting bucolic country lanes twist up the hill and provide a feeling of retreat from both the nearby city as well as the surrounding suburban sprawl. It also ensures that no one will ever be temped to speed since the roads won’t physically allow it. This keeps the neighborhood safe for pedestrians and cyclists. And it also happens to be more ecological as an extra bonus.

156508764-M-1
Justin Tinapay Photography 

156522759-M-1
Justin Tinapay Photography 

RachChris-r075-1
Justin Tinapay Photography

Now, there were some people in the HOA that didn’t even want to pay for the annual gravel upgrades. These weren’t what you would call poor people, but no one wants to pay for anything if it isn’t absolutely necessary. It was suggested that the community clubhouse could be rented out for special events to generate the needed revenue to pay for road maintenance. Other people objected. Why live in a private community if an army of strangers would come marching in day and night? So the HOA found a sweet spot. The clubhouse would be rented for only twelve events per year between April and October. Valets would be hired at the expense of the renters to manage traffic. Those twelve days would bring in enough money to pay for the road work each summer. It was a reasonable compromise and a good financial deal for everyone. The fact that Water Witch was distinctive and countryfied compared to the unrelenting highways and strip malls of most of New Jersey made it that much more desirable for people looking for a unique event space. People pay extra for charm.

Screen Shot 2015-01-23 at 7.03.20 PM
Google 

Screen Shot 2015-01-23 at 7.01.54 PM
Google

By the way, notice how some people have paved their private driveways with asphalt or stone while the HOA roads and the parking lot at the Clubhouse are gravel. It matters who’s responsible for paying for things and how those decisions are made.

Screen Shot 2015-01-24 at 3.48.13 AM
Google 

Screen Shot 2015-01-24 at 3.47.51 AM
Google

Screen Shot 2015-01-24 at 3.45.56 AM
Google 

Screen Shot 2015-01-24 at 3.43.53 AM
Google

In contrast, here’s a newer upscale residential subdivision not far from Water Witch. Notice the massively wide paved roads and enormous cul-de-sac. I have to ask… What does all that paving really do for the neighborhood? You could land an Airbus A380 on this much tarmac. But what’s the point? You can be quite sure that when these roads become cracked and potholed the wealthy well-connected residents of these grand homes will mobilize and bang heads at the public works department. Somehow the government will be made to absorb the expense of repave things even if the (very high) property taxes from these specific homes doesn’t come close to covering the real cost of maintenance. Would these home owners accept a different standard if they were directly responsible for maintaining their own road?

Screen Shot 1 2015-01-22 at 4.19.01 PM copy
Google

 Screen Shot 2 2015-01-22 at 4.19.01 PM copy
Google 

Screen Shot 2015-01-24 at 7.09.20 AM
Google 

Screen Shot 2015-01-24 at 7.12.21 AM
Google

Now let’s look at a more reasonably priced home in a middle class neighborhood. This is my sister’s house in another part of the state. She and her family live in a respectable 1960’s tract house on a half acre lot. Look at the cul-de-sac in front of her place. It’s nearly a half acre as well. Look how tiny the parked cars are compared to the amount of pavement. Again, what exactly does the neighborhood get out of this arrangement other than a massive heat island effect in summer, a storm water runoff problem, and a lot of high speed traffic that puts children, pedestrians, and cyclists in danger? Think of all the ways that much land could be put to better use to add value to the neighborhood instead of just chipping away at the county budget.

At a certain point hard choices are going to have to be made. The current political conversation involves questions about how to raise taxes while lowering levels of service. But there is another way. We could spend a whole lot less money both publicly and privately and still get a higher quality of life. I’m not sure we as a society are really ready to have that conversation.

John Sanphillippo lives in San Francisco and blogs about urbanism, adaptation, and resilience at granolashotgun.com. He's a member of the Congress for New Urbanism, films videos for faircompanies.com, and is a regular contributor to Strongtowns.org. He earns his living by buying, renovating, and renting undervalued properties in places that have good long term prospects. He is a graduate of Rutgers University.


Praying in the Streets: Ritual as an Urban Design Problem

$
0
0

“[T]he city as World icon is being destroyed, not by being secularized (it was always secular at base with some sacral potencies shooting through it from every angle) but by being radically profaned. The city has become the playground not of Wisdom but the battleground of savages, as in Belfast and Beirut. The city’s sacral potentialities have been removed and invested in the sovereign individual. Its central workshop, where radical transactions with reality used to summon a citizenry to meet in peace, was given notice that its lease was up. The center gave way to parking lots and bus stops; discourse fractured, politics increasingly issued from the mouths of ideological gurus, and the sovereign individual was relegated to suburban sprawls focused on the centers of consumption called shopping malls. Here anxiety and frustration mounted as identity waned.”

– Aidan Kavanagh, o.s.b., On Liturgical Theology, New York: Pueblo Publishing Company, 1984, p. 26.

The church and the city

The Benedictine monk Aidan Kavanagh, who straddled two worlds as both a monk and a Yale divinity professor, proposes that we understand the Church as originally and centrally an urban phenomenon. He translates civitas as “workshop” and “playground,” the space in which social, philosophical, and even scientific questions are worked out by humans in contact with their God, “the locale of human endeavor par excellence.”

By the fifth century A.D., Christian worship in the great cities of Jerusalem, Antioch, Alexandria, Rome, and Constantinople had become not just one service, but an “interlocking series of services” that began at daybreak with laudes and ended at dusk with lamp-lighting and vespers. Only the most pious participated in all the services, but everyone participated in some. The rites “gave form not only to the day itself but to the entire week, the year, and time itself,” says Kavanagh.

Perhaps just as important as the transformation of time was the transformation of space, for the mid-morning assemblages and processions appropriated the entire neighborhood as space for worship. Participants met in a designated place in some neighborhood or open space, and proceeded to the church designated for the day, picking up more participants as they went, and “pausing here and there for rest, prayer, and more readings from the Bible.” The Eucharist itself was a “rather rowdy affair of considerable proportions,” kinetic and free of stationary pews.

Kavanagh contrasts this with modern worship, which he characterizes as “a pastel endeavor shrunk to only forty-five minutes and consisting of some organ music, a choral offering, a few lines of scripture, a short talk on religion, a collection, and perhaps a quick consumption of disks or pellets and a beverage.”

The American urban design pattern

Kavanagh identifies several influences weakening the urban Church as civitas. The many churches developed many different liturgies, resulting in what he calls “liturgical hypertrophy.” These were flattened and standardized, shrunk to centrally-manageable size and legible doctrinal authority, by the English Act of Uniformity of 1549 and the Council of Trent by 1614. At the same time, printed books ushered in the new literary consciousness, eroding the power of community ritual consciousness for European Christians.

But ancient religious practices (and their modern elaborations) are still performed in Europe; processions may still be seen winding through the streets of cities and small towns. Except for the occasional Palm Sunday procession, they are all but absent in the United States. The American urban design pattern — increasingly spreading even to small towns — is forbidding to the kind of religious practice that transforms space and time.

The American urban design pattern is characterized by, first, an orientation toward the automobile above all else; second, toward consumption as the main activity besides work; and third, toward efficient human storage. Human activities other than consumption and “being stored” – as in day cares, schools, prisons, offices, nursing homes, and “housing units” themselves – are made difficult and uncomfortable by the physical built environment itself. Religious activity and social activity, two main components of human flourishing that transform local environments, are increasingly rare and emptied of transformative power.

A Pattern Language (Christopher Alexander, Sara Ishikawa, and Murray Silverstein, New York: Oxford University Press, 1977) is a humane vision of urban and architectural design, focused on the activities of human flourishing. The authors present 253 interlocking patterns, from macro (Pattern 8, Mosaic of Subcultures) to micro (Pattern 251, Different Chairs — because people come in different sizes!), demonstrating how physical space constrains or facilitates the activities of peopling.

A secular book, it does not offer any patterns for churches, though it offers Sacred Space and Holy Ground. Alexander et al. hope that merely offering conducive space will allow proper ritual to spontaneously develop. Certainly, the absence of such space precludes such rituals.

A typical pattern is Pattern 88, the Street Café: “The street café provides a unique setting, special to cities: a place where people can sit lazily, legitimately, be on view, and watch the world go by.” These occur all over Europe, but are rare in the United States. In my old neighborhood in Hollywood, California, there were sidewalk cafés, but people drove from distant neighborhoods, parked their cars, and sat mostly watching automobile traffic. An analogy can be drawn to the city church with a parking lot: its ability to transform space, to claim the city as its own for its own activities, is limited. This kind of café becomes more a place of human storage than for the positive activity of being on view and watching the world go by. Churches, and the religious activity centered on them, may face the same constraint.

Praying in the streets

One of Alexander et al.’s patterns is Pattern 63: Dancing in the Street, a poignant pattern given center stage in Barbara Ehrenreich’s book Dancing in the Streets: A History of Collective Joy. When the physical pathways of connection are reserved for driving, they are closed off from normal, healthy human activities. Much fearful (and regulatory) attention has been paid in recent years to the Muslim practice of praying in the streets in European cities such as Paris and Nice; we can respectfully observe, at least, that faith allows them to transform profane space into space for ritual observance. Still, this practice has not been translatable into the United States; it occurs in New York City, only once a year, with proper permits acquired beforehand.

American streets are not places where ritual, either religious or secular, is easily performed. Only in cloistered communities, set apart from the flows of American life, is this possible, as in the Orthodox Jewish communities of New York and Los Angeles. There, people (importantly) walk to temple, and participate in an “interlocking series” of rituals throughout the Sabbath. During the numerous Great Awakenings in the United States, open space was transformed into religious space through its key ritual, the revival; but this was a temporary transformation, and has not survived in contemporary ritual.

The reinvigoration of religious and social ritual — allowing people to flourish, rather than merely consume and be stored — is as much an urban design problem as a social problem. But there is another characteristic of American civic life, other than its distinctive urban design pattern, that makes praying in the streets so rare: our studied indifference and polite disattention, our lack of perceptible solidarity, summarized by Randall Collins thus:

“Public interaction is an equality without much solidarity, an enactment of personal distance mitigated by a tinge of mutual politeness and shared casualness. Goffman calls it the order of civil disattention. As Goffman notes, this is not merely a matter of sheer indifference, since one needs to monitor others at a distance to avoid contact with them when they are close, ranging from little maneuverings of sidewalk traffic to avoid physical collision, to averting eyes and controlling micro-gestures in order not to intrude into the privacy of their personal space.”

– Randall Collins, Interaction Ritual Chains, Princeton University Press, 2005, at p. 280. Citation removed, emphasis mine.

Waiting for builders and designers to provide good spaces for social and religious ritual is unlikely to be an effective strategy. What would it take for Americans to simply, impolitely use what space there is for these purposes? Americans flood the streets over sports team victories; I saw a crowd of young people pour into a busy street in Hollywood on the night the Obama victory was announced in 2008, out of pure tribal joy. The sustained occupations of public space in recent years (e.g. Occupy Wall Street) have been ugly and unsustainable, but demonstrate a willingness to break through politeness to use public space in new ways. Rather than permanent squatting, imagine a beautiful, rhythmic occupation, one of weekly repetition, of mass praying in the streets with no political goals at all.

This piece was first published by Front Porch Republic.

Sarah Perry studied urban planning at MIT and is a housewife in San Antonio, Texas. She is currently a guest blogger-in-residence at Ribbonfarm.

Trinity Church in Manhattan photo by Wikimedia Commons user Griffindor.

Go East, Young Southern California Workers

$
0
0

Do the middle class and working class have a future in the Southland? If they do, that future will be largely determined in the Inland Empire, the one corner of Southern California that seems able to accommodate large-scale growth in population and jobs. If Southern California’s economy is going to grow, it will need a strong Inland Empire.

The calculation starts with the basics of the labor market. Simply put, Los Angeles and Orange counties mostly have become too expensive for many middle-skilled workers. The Riverside-San Bernardino area has emerged as a key labor supplier to the coastal counties, with upward of 15 percent to 25 percent of workers commuting to the coastal counties.

In a new report recently released by National Core, a Rancho Cucamonga nonprofit that develops low-income housing, I and my colleagues, demographer Wendell Cox and analyst Mark Schill, explored the challenges facing the region. Although we found many reasons for concern, the region’s overall condition and its long-term prospects may be better than many might suspect.

Population trends

The region’s once-explosive growth has slowed considerably. From 1945-2010, the area’s population soared from 265,000 to 4.25 million. Already the nation’s 12th-largest metropolitan area, the I.E. could pass San Francisco and Boston by 2020 (unless faster-growing Phoenix does so first).

Yet, contrary to expectations (and, perhaps, hope among anti-sprawl campaigners), the area continues to be a beacon for people from the rest of the region. There is a notion, widely expressed in the mainstream media, that Southern California’s growth will now focus more on the urban core around Downtown Los Angeles. Yet, as is often the case, what planners and pundits desire is not widely shared by the vast majority of people.

People continue to vote for the Inland Empire – and other peripheral areas – with their feet. Census Bureau data indicates that, from 2007-11, nearly 35,000 more residents moved from Los Angeles County to the Inland Empire than moved in the other direction. There was also a net movement of more than 9,000 from Orange County and more than 4,000 net migration from San Diego County.

Several long-standing demographic trends favor a continued shift to the Inland region, according to Cox and Schill. Immigrants and their offspring may prove the critical factor. Over the past decade, the Inland region dramatically increased its population of foreign-born residents, more than three times the number and at nearly 18 times the rate of the coastal counties.

The influx of immigrants and their children is largely responsible for the region’s relatively young population, compared with the rest of Southern California. As recently as 2000, the proportion of population ages 5-14 in Los Angeles and Orange counties stood at 16 percent, the sixth-highest level among the nation’s 52 largest metropolitan areas. Thirteen years later, that proportion had dropped to 12.8 percent, 33rd among the 52 largest metropolitan areas. In terms of a dropping share of youngsters, the area experienced a 20 percent reduction, the largest in the nation.

In contrast, the Inland Empire remains a bastion of familialism, with 15.3 percent of the population aged 5-14, among the highest levels in the nation. This follows a general pattern; according to recent analysis of Census data, high-cost areas tend to repel families. Of the nation’s most expensive areas, such as the Bay Area, New York and Boston, all tend to have well below national norms in terms of families among their populations.

Perhaps more surprising, younger educated workers also are heading to the region. In fact, from 2011-13, according to American Community Survey data, Riverside-San Bernardino witnessed the 12th-largest increase among the 52 major metro areas in the share of college-educated residents ages 25-34. No major California metro area, including Silicon Valley, could match it. From 2000-13, the Inland region experienced a 91 percent jump in population with bachelor or higher degrees, just less than twice the increase for either Orange or Los Angeles counties.

Overall, the I.E. has become something of a growth area for millennials – basically, adults ages 20-29. San Bernardino-Riverside ranked second among 52 metro areas, adding 50,000 millennials, an 8.3 percent increase since 2010. Los Angeles and Orange counties – older, settled areas with far lower population growth – together registered 18th.

Economic Restructuring

These trends also may reflect improving prospects for the region’s economic recovery. The area remains some 30,000 jobs below its 2007 level, notes California Lutheran University economist Dan Hamilton, but is now growing faster than the rest of the Southland. The region created jobs over the past year at a 2.2 percent rate, well above the 2.0 percent increase in Orange County and almost twice that of L.A.’s 1.3 percent. Foreclosures have diminished to the lowest levels since 2007 and appear back to something resembling normalcy.

One important source of new employment is grass-roots entrepreneurship. Overall, the Inland Empire accounted for a large proportion of the new businesses created statewide from 2012-13 – despite hosting only 7.4 percent of the total businesses in California. A recent report by Beacon Economics suggested that growth will accelerate over the next five years.

At the same time, some of the core industries – such as manufacturing and warehousing – have shown signs of recovery. Industrial vacancy rates have fallen from nearly 12 percent in 2009 to roughly half that level today.

Much of the growth has been for “middle-skilled jobs,” paying $14 to $21 per hour, including positions in medical services, trucking and customer service. Overall, according to one recent survey, the Inland Empire ranked 13th among the nation’s large metropolitan areas in creating such positions. These jobs, notes economist John Husing, are critical to a region where almost half the workforce has a high school education or less.

Even the housing sector, the driver of the post-crash employment decline, has improved considerably. Today, the Inland Empire is experiencing a far greater increase in construction permits than either Los Angeles or Orange counties. This has also helped boost construction employment, although not to anything like the levels experienced a decade before. Construction employment, although up recently, still totals barely half the people it did in 2006.

Some, such as University of Redlands economist Johannes Moenius, express concern that important industries, like warehousing and manufacturing, are increasingly using part-time workers. Positions paying $15,000 to $30,000 annually constitute nearly half of all new jobs.

The ambiguity in the recovery is reflected in a recent survey by Cal State San Bernardino, which found the percentage of those saying the economy was excellent or good had almost doubled since 2010, from 9 percent to 17 percent, but this was considerably below the 40-plus percent seen before the crash.

The Path Ahead

The fate of the Inland Empire remains in the balance. The recovery of the region depends largely on continued widespread population growth, largely stimulated by the production of affordable housing. Yet, at the same time, state regulations, spurred on by the environmental lobby, which seeks to slow, or even eliminate, single-family construction, threaten to force up prices and drive young families outside the state.

Many other core industries of the area – such as warehousing and manufacturing – also face growing regulatory barriers. High taxes and energy costs originating from Sacramento are particularly difficult for industries that require power to operate. Southern California Edison’s rates, for example, are almost twice those found in Salt Lake City, Seattle or Albuquerque.

Some may celebrate these policies that encourage people to say “good riddance” to a region too sprawling and insufficiently cultured. Yet, it’s hard to see how Southern California can continue to add workers – notably, younger middle-class families – without a vibrant Inland Empire. It remains the one Southern California region with the land, and the housing cost structure, to accommodate much of the hard-pressed middle class. Without growth inland, Southern California will be largely relegated to a torpid economy and rapidly aging demographics, a fate that would compromise the aspirations of future generations.

This piece originally appeared in The Orange County Register.

Joel Kotkin is executive editor of NewGeography.com and Roger Hobbs Distinguished Fellow in Urban Studies at Chapman University, and a member of the editorial board of the Orange County Register. He is also executive director of the Houston-based Center for Opportunity Urbanism. His newest book, The New Class Conflict is now available at Amazon and Telos Press. He is also author of The City: A Global History and The Next Hundred Million: America in 2050.  He lives in Los Angeles, CA.

The Emerging New Aspirational Suburb

$
0
0

Urban form in American cities is in a constant state of evolution. Until recent years, American suburbia was often built without an appreciation for future evolution. This has left many older suburbs in a deteriorated state, and has accelerated claims of a more generalized suburban decline.

The Indianapolis suburb of Carmel represents a response to this historic pattern. While responding to today’s market demands with a new aspiration level designed to make it nationally competitive, it’s also trying to position itself for success tomorrow and over the longer term.

This is a critical issue for many suburbs. Like big cities before them, many older suburbs have now aged, and no longer necessarily meet the requirements of the marketplace.  

There are many reasons for this.  The early, usually small-scale Cape Cod-style housing common to many 50s vintage suburbs is not what today’s market is demanding. It’s the same for older enclosed malls – today “lifestyle centers” and other formats are preferred – many of which are now vacant, their grim remains featured on web sites such as DeadMalls.com. Many suburban areas were also built out with “infrastructure light” without upgraded streets, sidewalks, etc. leaving a big backlog of infrastructure need.

Across the country many of these older districts have fallen into decay and become increasingly poor, taking on many of the characteristics of the inner city. As the Brookings Institution noted  over a decade ago, they “are experiencing some signs of distress—aging infrastructure, deteriorating schools and commercial corridors, and inadequate housing stock.”1 Today, the public is more aware of the trend, and events in Ferguson, MO recently gave a wakeup call to newer and still-thriving suburbs that they too may be troubled at some point.

Like other American cities, Indianapolis has many of these older, struggling suburban areas. In its case, many of them are within the core city limits due to a 1970 city-county merger. As regional growth continues to expand outside the central urban county, newer generation suburbs have a chance to learn from the struggles of many of their predecessors.

Carmel – pronounced like the Biblical Carmel – is the first suburb directly north of the city of Indianapolis. It is an upscale residential and business suburb similar to many others around the country such as Dublin, OH; Naperville, IL; and the Cool Springs, TN area.  Its 2013 population of 83,573 made it the 5th largest municipality in the state. While not monolithically wealthy, its 2013 median household income of $100,358 is the 14th highest in the United States among communities of 65,000 people or more.2 It’s a preferred area for the estate homes of wealthy Indianapolis area residents, such as Indianapolis Colts owner Jim Irsay. But it’s not just a bedroom suburb; real estate brokerage Cassidy Turley reports that the Carmel submarket has over six million square feet of office space.3

Being located in the center of the favored quarter of the Indianapolis region, Carmel grew as an upscale area. This gives it a leg up in long term sustainability out of the gate.  

Yet Carmel has not relied just on its wealth to insure against decline. Rather, it has embarked on a transformation program now nearly 20 years old from which three major themes emerge:

1. Responding to current market forces to build a “state of the art” community that is competitive globally, not just within the Indianapolis region.

2. Building a full spectrum of amenities and infrastructure to create a “complete city” with a high quality of life and intrinsic appeal that is a) not based solely on newness or low costs, and b) which has broad demographic appeal.

3. Attempting to create unique cultural and regional attractions  to turn Carmel into a destination in its own right, as much city as suburb.

The primary driver of this transformation has been Mayor Jim Brainard, a Republican currently in his fifth term.  Carmel long had top performing schools – it’s the top rated district in the state   – houses with generous yards, low taxes, and other standard attractors of suburbia. Previous administrations had put in place key policies such as reserving the Meridian St. corridor for high end office space and banning billboards. But Brainard brought numerous changes in Carmel during his tenure including:

Annexation. Carmel has undertaken a series of annexations – nearly 20,000 acres since 2001 alone.4 With over 47 square miles of territory, Carmel has now largely achieved its desired geographic scale.

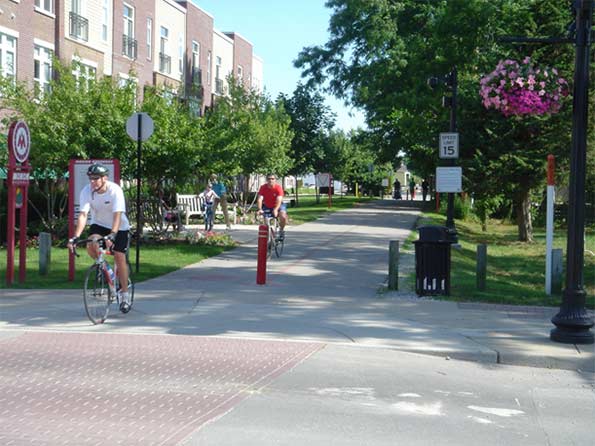
Parks. Carmel’s park acreage increased from 50 to 1000 acres and it has spent heavily on building out its parks. This includes building a $55 million Central Park, which includes a showplace community and fitness facility called the Monon Center.5 And the popular Monon Trail, a rail-trail through the length of the city that extended a previous project built by the City of Indianapolis.


Monon Trail at Main St.

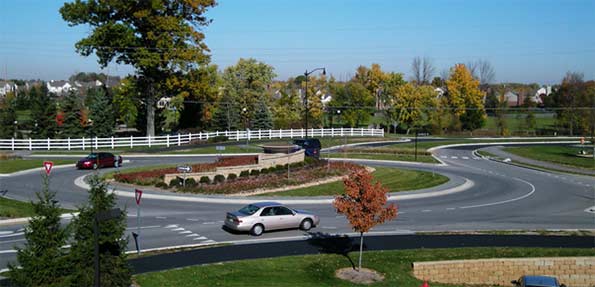
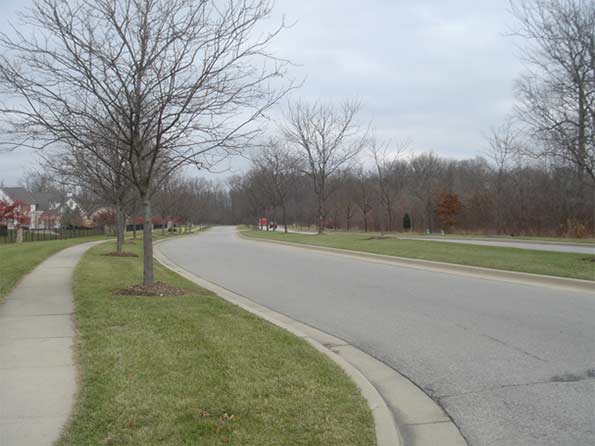
Road Infrastructure. Carmel has invested heavily in upgrading the legacy network of county roads that it overgrew. This includes an aggressive deployment of modern roundabouts. Carmel now has over 80 of these, more than any community in the United States.6 It has upgraded miles of collector roads to urban standards with enclosed drainage, curbs, extra-wide travel lanes, landscaped medians, eight foot multi-use side paths on both sides of the street protected by a landscaped buffer zone, and decorative street signs and other detailing.


Roundabout at Main St. and Illinois St. in the fall


An upgraded segment of River Rd. in early winter

Two major state highways passed through the town, Meridian St. (US 31) and Keystone Ave. (SR 431). These were designed as rural style divided surface highways as is common in Indiana. Carmel convinced the state to relinquish Keystone Ave. to the city and give it $90 million for upgrades and future maintenance. Carmel converted this into a mostly free flowing parkway by spending $108 million to replace stoplight intersections with roundabout interchanges. These not only dramatically improved traffic flow, the bridges over the busy highway provided a high quality, safe connection – especially for pedestrians and bicyclists – connecting eastern and central Carmel, which had previously been separated by this “great wall” of a road. The state is currently performing a similar freeway upgrade on Meridian St., the principal office corridor.


Roundabout interchange at 126th St. and Keystone Parkway.

Water and Sewer Upgrades. Part of Carmel previously received water from the Indianapolis water utility. The City of Indianapolis had privatized this utility but sought to repurchase it. Carmel intervened in the process to pressure Indianapolis into selling it the water lines inside Carmel. Carmel has since undertaken significant infrastructure upgrades such as new wells and pumping stations. During a recent summer drought, Carmel, unlike Indianapolis, did not put in place a mandatory restriction on lawn watering.7

New Urbanism. Beyond core infrastructure, Carmel under Brainard has sought to change its style of development to embrace some of the more positive aspects of New Urbanism such as creating more urban nodes and walkability.

Unlike some traditional railroad suburbs or county seats, the historic center of Carmel was very tiny, and its Main Street populated mostly with one story buildings and empty lots. This was the first focus area, and started with fixing the physical infrastructure.  

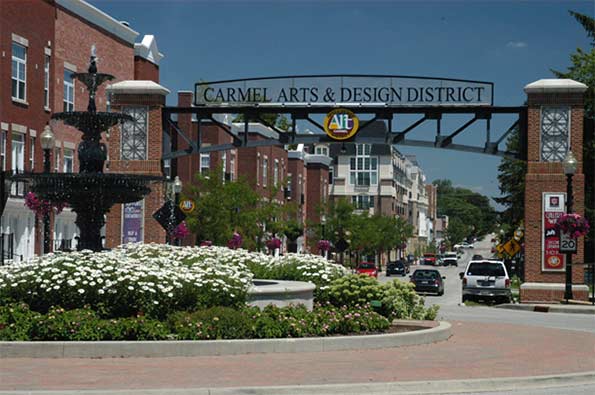
The city rebranded the area as the “Arts and Design District” and utilized Tax Increment Financing to promote multi-story, mixed use development. The result is a mostly occupied and often well-patronized Main Street district. The surrounding historic residential blocks have seen significant redevelopment activity as well.


Main St. at western fountain and gateway arch entryway to rebranded “Arts and Design Distrct.”

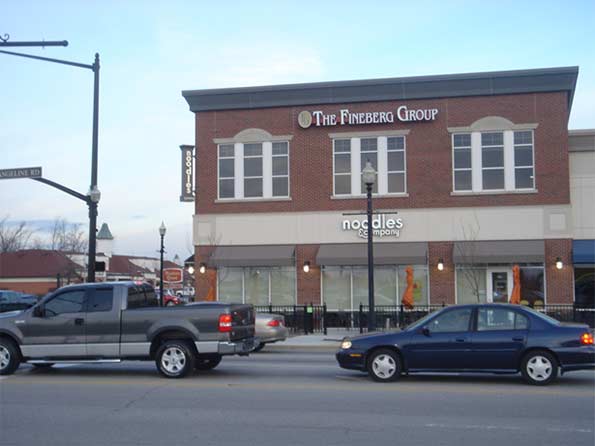
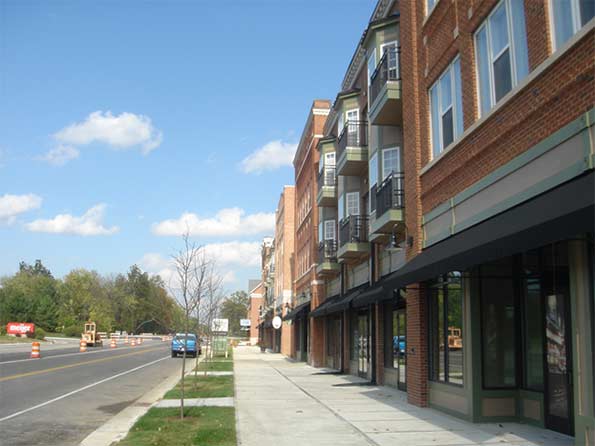
Beyond the historic downtown, Carmel has also implemented multiple New Urbanist style zoning overlays, including on Old Meridian St. and Range Line Rd. (the city’s original suburban commercial strip). These promote mixed use development, buildings that front the street, and multi-story structures. Infrastructure improvements and TIF have been used in these areas as well. There’s also a major New Urbanist type subdivision in western Carmel called the Village of West Clay.


Strip mall and traditional suburban development along Range Line Rd.


New Urbanist style development along Range Line Rd.


New Urbanist development and street improvements under construction on Old Meridian St.

The historic downtown was deemed too small to function effectively as the downtown of a city the size of Carmel today. The city thus decided to create a new downtown area called City Center. The location for this is an area south of the historic downtown area in an older suburban industrial zone that had fallen into a blight pattern. Much of it was vacant and what’s now the principal City Center development was built on the site of a failed strip mall. TIF was aggressively used here as well to redevelop the area.

The City Center development is only partially complete. A veterans memorial and other civic spaces are complete, as are several small office buildings, apartments, and a large mixed use complex. The anchor is a publicly funded $175 million concert hall called the Palladium and an associated theater complex with three stages.8 While these are complete, significant development remains to complete the City Center vision. The city also wants to redevelop the area between City Center and the old downtown, which they now label Midtown, but very little has been done to date.


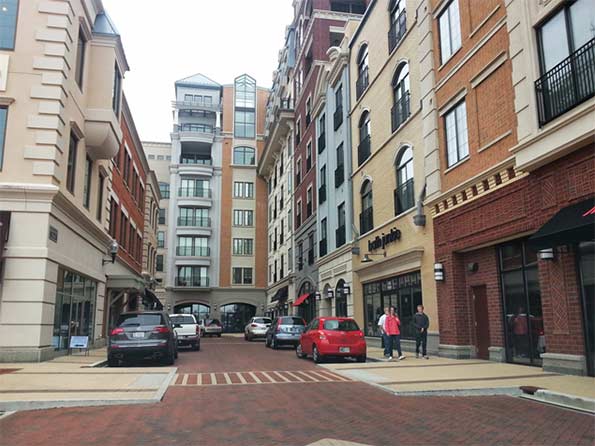
Interior street of City Center development.

The goal of all this development is not the full urbanization of Carmel; this city does not aspire to be dense metropolis, or even Indianapolis. It’s rather about creating more town center type districts with the walkable feel that’s increasingly in favor, but without compromising the fundamental suburban character of the city. It’s also designed to create a city with options. Having a diversity of development styles within the city is part of a strategy of appealing to a more diverse demographic base, including singles and retirees, not just the stereotypical younger family with kids. Traffic flow has been improved, but short trips are now easier to undertake by foot or bicycle, not just by car.

Retro Architecture. Carmel has de facto mandated traditional architectural styles. There’s no one consistent style. Major buildings have been done in Georgian, Second Empire, and Neoclassical type designs. But modernism has been rejected, further differentiating suburban Carmel from urban areas that frequently elect for starchitecture that is unapologetically “of the now.”

The city has also attempted to prevent large corporations from building their standard architectural templates. Brick is effectively mandated, even for big box retailers like Lowes. Retailers like CVS and Kentucky Fried Chicken were forced to build second stories on their structures to locate in certain areas. Another Carmel CVS has an art deco façade.

The city wants high quality aesthetics and a unique sense of place. They also want “timeless” design, though like much New Urbanism architecture it can sometimes come across as pastiche.

Arts and Culture. As part of the attempt to appeal to more arts minded middle aged consumers, as well as members of the  so-called “Creative Class,” Carmel has heavily invested in the arts. The City Center performing arts center was paid for almost entirely with public funds (TIF), an investment in the arts dwarfing even that of Indianapolis. The city has also paid for an extensive public art program, mostly statues by Seward Johnson. And it makes operating grants to local arts organizations such as the Carmel Symphony Orchestra.


Interior of the Palladium concert hall. Photo by Zach Dobson.

Seward Johnson is not a favorite of urban sophisticates. His statutes illustrate the type of play it safe art generally featured by Carmel. More sophisticated or cutting edge fare is not as prevalent. And there have even been some complaints by a limited number of citizens about items such as the classical nudes featured on the door handles of the Evan Lurie Gallery.

Brainard is thinking about the long term when Carmel is no longer the shiny new thing. As he put it, “Because we are designing a new city that will be in place for hundreds of years, the responsibility of doing it right falls to this generation…Carmel is a young city – we are still building our parks, trails, roads and sanitary sewer and water systems that will be here for centuries.”9

He’s also keenly aware of global economic competition and the fact that Indiana lacks the type of geographic and weather amenities of other places. He frequently uses slides to illustrate this point. In one talk he said, “Now this picture, guess what, that’s not Carmel; but this picture is the picture of some of our competition. Mountains – that’s San Diego of course, mountains, beautiful weather, you know I think they have sunshine what, 362 days out of the 365…. What we’ve tried to do is to design a city that can compete with the most beautiful places on earth. We’ve tried to do it through the built environment because we don’t have the natural amenities.”10  While the claims to want to equal the most beautiful places in the world may be grandiose, the key is that mayor believes Carmel’s undistinguished natural setting and climate requires a focus on creating aesthetics through the built environment.

What have the results been to date?  Economically and demographically, the city has performed well. It has managed to create an environment that is proving competitive for business opportunities that might have previously bypassed Indiana. For example, American Specialty Health relocated its headquarters to Carmel from San Diego, with the CEO of the company personally making the move from La Jolla to Carmel.11 Geico also recently expanded. Numerous other corporations are either based in Carmel or have major white collar facilities there. The income levels are very strong, as noted above.

The city’s demographics have also expanded to become much more diverse. The minority population grew 295% between 2000 and 2010, adding 9,630 people and growing minority population share from 8.7% to 16.3%.12 12% of the city’s households speak a language other than English at home.13 Many of these are highly skilled Chinese and Indian immigrants working for companies like pharmaceutical giant Lilly. Even black professionals are increasingly moving to Carmel, with the black population growing 324% in the 2000s and black population share doubling to 3%.14 Carmel is not a polyglot city today, but it’s far more diverse than in the past.

Carmel has also attracted both national press and national awards. Money magazine ranked Carmel as the #1 best small city to live in 201215, and it’s scored highly in other surveys as well. Drew Klacik of the Indiana University Public Policy Institute notes that in an echo of the transformation of the city of Indianapolis since the 1970s, “Carmel has transformed itself from a desirable community within Indiana to a desirable and competitive community nationally.”16

However, it’s hard to argue that Carmel’s results materially outperform peer cities in other regions. Places like Dublin, OH and Cool Springs, TN have significantly more office space, for example. Many of those places are, however, implementing policies similar to those in Carmel . Most Carmel New Urbanist development continues to require TIF subsidies and is not yet sustainable at market rates. The city has obtained better financial terms in some recent deals, however.  And despite major public investment and construction in the central city, many central area census tracts lost population during the 2000s.

The changes have also attracted significant criticism and opposition in some quarters.  While the public remains largely positive on the results, there have been many critiques of the way they were done, some of them legitimate.  A number of the projects had significant cost overruns. The mayor originally said that the Keystone project could be completed for the $90 million the state gave it. The actual cost was nearly $20 million higher.17 The Palladium was originally sold as an $80 million facility, but ended up costing $175 million. The city also said it planned to pay for ongoing operations by raising a $40 million endowment, but was unable to raise the funds, leaving it on the hook for $2 million in annual operating costs. These are not small misses.

Critics also pointed to state figures showing Carmel with nearly $900 million in total debt.18 While it is a wealthy community that can afford the payments, in a conservative state like Indiana, a suburb accumulating nearly a billion dollars in debt raises eyebrows. Carmel’s tax rates remain among the lowest the state, however.

The way the debt was accumulated has been criticized as well. The Palladium was paid for with TIF funds. Rather than bonds, the Carmel Redevelopment Commission – the authority that manages the TIF program and which was controlled by mayoral appointees – structured the Palladium debt as Certificates of Participation to circumvented the need for city council approval, incurring higher interest rates in the process. The city council later refinanced the debt at a lower rate using a general taxing power guarantee in what some called a bailout. In return for the refinancing, the council obtained more oversight over TIF activity.19

Though some controversy is inevitable and some criticisms are legitimate, ultimately the change program in Carmel has proven popular with the public and the city is booming, a boom that’s lending an increasingly bitter tone to the longstanding hostility Carmel has enjoyed from the region due to its status as the highest profile “rich suburb” in the region.

Yet for all the controversy, many regional suburbs are copying some aspects of Carmel’s approach, with roundabouts now a regular feature in area communities and major park programs and New Urbanist style town center developments as well. This includes the massive sports-oriented Grand Park in Westfield and the Nickel Plate District in next door Fishers’ town center.20

It’s also clear that peer type suburbs around the country are adopting similar strategies, such as Dubin, OH’s Bridge Street Corridor proposal21 or Sugar Land, TX’s $84 million performing arts center.22 Imitation, they say, is the sincerest form of flattery. Carmel represents the leading edge of the emergence of a new type of post-Edge City aspirational suburb. It’s something we may be seeing a lot more of in the future.

Aaron M. Renn is a senior fellow at the Manhattan Institute and a Contributing Editor at City Journal. He writes at The Urbanophile.

-------------------------------------

1 Robert Puentes and Myron Orfield. “Valuing America’s First Suburbs: A Policy Agenda For Older Suburbs in the Midwest,” Brookings Institution, 2002.

2 U.S. Census Bureau, “American Community Survey 2013 1-yr”, Table B19013.

3 Cassidy Turley, Indianapolis Office Market Snapshot (Third Quarter 2014), 3.

4 Ellen Cutter. “Explaining the annexation process,” Greater Fort Wayne Business Weekly, June 12, 2014. Accessed January 8, 2015. http://www.fwbusiness.com/opinions/columnist/businessweekly/article_f42d...

5 Matthew VanTryon. “Carmel then and now: World’s Apart,” IndianapolisNewsBeat.com, December 16, 2014. Accessed January 8, 2015. http://blogs.butler.edu/multimedia-journalism/2014/12/16/carmel-worlds/

6 James Brainard, transcript of speech at 2014 International Making Cities Livable Conference, June 23-27, 2013.

7“Why no watering ban in Carmel,” WISH-TV News, July 12, 2012. Accessed January 8, 2015. https://www.youtube.com/watch?v=y51BJYM4Fgc

8 David Hoppe. “The Palladium’s boffo budget,” Nuvo Newsweekly, June 20, 2011. Accessed on January 8, 2015. http://www.nuvo.net/indianapolis/the-palladiums-boffo-budget/Content?oid...

9 James Brainard, notes for 2014 State of the City Address.

10 James Brainard, transcript of speech at 2014 International Making Cities Livable Conference, June 23-27, 2013.

11 Andrea Muirragui Davis. “Wellness provider beefing up new Carmel office,” Indianapolis Business Journal, October 29, 2014. Accessed on January 8, 2015. http://www.ibj.com/blogs/11-north-of-96th/post/50241-wellness-provider-b...

12 U.S. Census Bureau, calculations by author from Census 2000 and Census 2010.

13 U.S. Census Bureau, “American Community Survey 2013 1-yr”, Table B05007.

14 U.S. Census Bureau, calculations by author from Census 2000 and Census 2010.

15“CNNMoney Ranks Americas Best Places to Live,” Daily Finance, August 20, 2012. Accessed January 8, 2015. http://www.dailyfinance.com/2012/08/20/cnn-money-ranks-americas-20-best-...

16 Drew Klacik, telephone interview with author, December 29, 2014.

17“Brainard seeks bonds to finish Keystone,” The Indianapolis Star, October 18, 2009. Accessed January 8, 2015. http://archive.indystar.com/article/20091018/LOCAL/910180409/Brainard-se...

18 Indiana Department of Local Government Finance. “Local Government Debt Report,” September 21, 2012, 15.

19 Kathleen McLaughlin. “Brainard seeks deal on maxed-out TIF,” Indianapolis Business Journal, March 31, 2012. Accessed January 8, 2015. http://www.ibj.com/articles/33569-brainard-seeks-deal-on-maxed-out-tif

20 Cara Anthony. “New look for the Nickel Plate District in Fishers,” The Indianapolis Star, June 28, 2014. Accessed January 16, 2015. http://www.indystar.com/story/news/local/hamilton-county/fishers/2014/06...

21 Brent Warren. “Dublin Moves Ahead With Bridge Street Corridor Plans, Connecting Across River,” Columbus Underground, March 23, 2013. Accessed January 8, 2015. http://www.columbusunderground.com/dublin-moves-ahead-with-bridge-street...

22 Rebecca Elliott. “Sugar Land breaks ground on $84 million performing arts center,” Houston Chronicle, December 9, 2014. Accessed January 12, 2015. http://www.houstonchronicle.com/neighborhood/fortbend/news/article/Sugar...

Recent Population Change in US States, 2012-2014

$
0
0

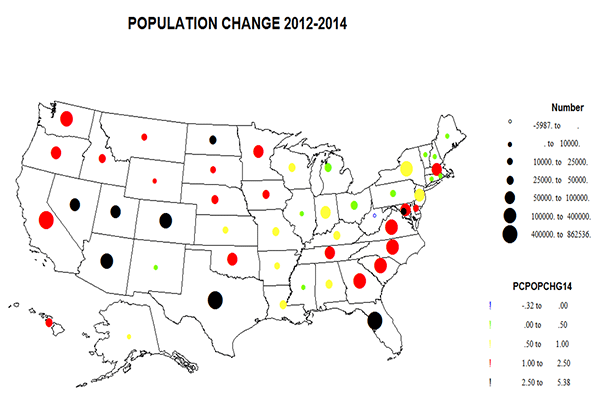
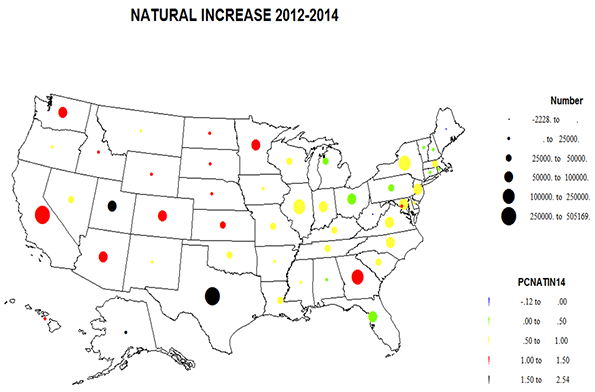
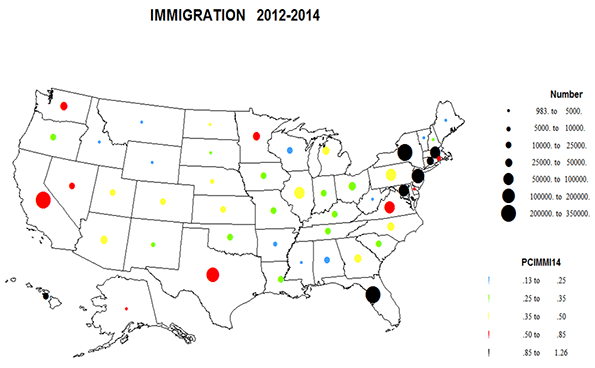
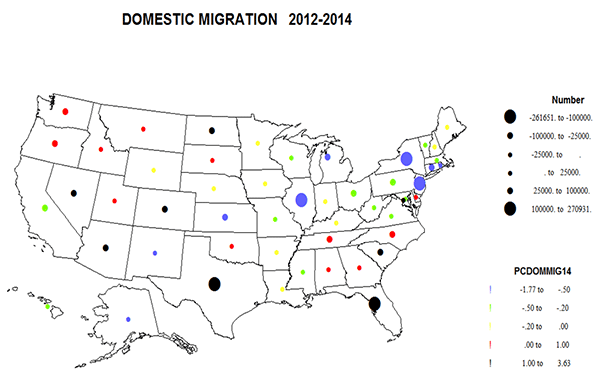
How are states faring in these two years of modest recovery? Change is never simple. States vary in their rates of births and deaths, “natural increase” (or decrease, possibly), rates of immigration from abroad, and especially in domestic, internal migration. I present four maps, for population change, natural increase, immigration, and domestic migration.

Population change

In sheer numbers Texas beats out California, followed by Florida. Well, these are the 3 most populous states. These are followed by North Carolina, Georgia, Arizona, and Washington.  But for the highest rate of growth, the winner is oil boom region North Dakota which easily wins at 5.4%, followed by Washington DC, Texas, Colorado, Utah, and Nevada, all  gaining over 3%. Florida is close at 2.8 and Arizona at 2.7. Growth tends to be high in the west, except Alaska and New Mexico, in the South Atlantic states, plus Tennessee, and in the far northern Plains states.

States with the lowest absolute change are paced by the only state to lose population, West Virginia, followed by five New England states, plus New Mexico.  States with the lowest rates of growth are broadly similar, West Virginia, New Mexico, and some in New England, but also joined by larger Illinois, Pennsylvania, Michigan, and Ohio. Broadly, the swath of slow growth extends from the Gulf, Lousiana, Mississippi, Alabama, through Arkansas and Missouri, then north and east across the Great Lakes states, Kentucky and West Virginia to much of the northeast, with Massachusetts an outlier of modest growth. What components account for these patterns?

Natural increase

Starting this time with fertility rates, Mormon Utah and wild Alaska win, but non-Mormon Texas is third, then strongly Mormon Idaho, Washington DC, North Dakota (all those young workers), and California. The west stands out with higher rates, along with Georgia and DC. The entire east, from Oklahoma to Florida and Maine, suffer low rates, again except for Georgia and DC. Minnesota joins the northern Plains with higher rates of births than was typical from the immediate past decades. 

In numbers, giant California and Texas and New York dominate, followed by Georgia, Illinois, and Virginia. Natural decrease beset West Virginia and Maine, and numbers are low in much of New England and among the smallest states, e.g., Vermont, Delaware, Montana and Wyoming. Note that natural increase is the major component of growth for the most states (25) as expected: AL, AK, AR, CA, DE, GA, ID, IN, IA, KS, KY, LA, MN, Mo, MS, NE, OH, OK, SD, TN,  UT, VA, WA, WI, WY. 

Immigration

Immigration remains a major component of US population change, but its geography is changing.  The highest rate is for Hawaii, but essentially the list is dominated by east coast Megalapolis plus Florida, with amazing rates for New York, New Jersey, Massachusetts, Washington DC, Maryland, and Connecticut. California and Texas, traditional winners, are far down the list as immigration from overseas has boomed while flows from Mexico have been markedly reduced.  Washington is moderately high in rate and numbers (migrants, especially Asians, to high tech jobs). In absolute numbers California is still number 1, but New York is second, Florida third, and Texas down to fourth. Overall rates and numbers are low in the inner portions of the east, except for Minnesota and low in most of the interior west. Note that immigration is the main component of growth for HI, ME, MD, MA, NC, RI, NJ- mostly states located in the eastern megalopolis.

Domestic migration

Internal migration is the major force for redistribution of population across states. In numbers, the big gaining states are to Texas and Florida, as has been the case for quite a while, but there are strong gains in Colorado and Arizona as well. In terms of migration gains, increasingly prominent are North and South Carolina and Tennessee, and even Washington.  The biggest losing states are again as they have been for some time:  New York, Illinois, New Jersey, California (to other states in the west), Pennsylvania, and Michigan.

Highest rates of gain from domestic migration are, not surprisingly, North Dakota, then popular Colorado, South Carolina, Nevada, Florida and Washington, DC, while the higher rates of net out-migration are for Alaska, New York, Illinois, Connecticut, New Mexico and New Jersey. Basically the west wins, except for California, Alaska, and New Mexico, the far southeast gains, while virtually all of the huge quadrant from Kansas to Massachusetts loses. Domestic migration is the main component of growth for CO, DC, FL, MT, NC, ND, NV, OR, SC, and TN  (AZ is about equally high in natural increase and in-migration),  and is the dominant negative component of change for CT, IL, MI, NM, NY, PA, WV and WI.

Immigration offsets internal out-migration in many states: CA, HI, KY, LA, MA, MD, ME, MN, MO, NE, NH, NJ, NY, PA, RI and VA.  The states most balanced in all 3 components of  growth – immigration, domestic migration and natural increase – are DE, DC, NC, and WA.

Summary: what does this all tell us?   

From studying US population for over 50 years, the essential conclusion is that the story is complex and changeable. Therefore, one shouldn’t make long term forecasts based on two years of experience. It is true that broadly the West and the South Atlantic states have experienced vigorous growth for some time, and that the states from Louisiana and Mississippi to Missouri and then extending east to the Middle Atlantic states grew more slowly, without any obvious signs of a turnaround. But there have   been surprises along the edges, perhaps of longer duration, as with ND, SD, and MT developments, while other areas of improved growth, as in MN, MA, and TN, are less sure, as is slower growth in the rest of New England or Alaska. But see below!

Natural increase is normally the least volatile, but even so, note the change from longer term slow-to-greater natural increase for the northern Plains and Minnesota, Georgia stands out in the East.

Immigration is probably the most changeable, as is evident from recent experience, the higher rates of immigrants into Megalapolis, and lower rates in the southwest: TX, NM, AZ. Immigration responds to demand for more technical and professional jobs, as well as for agriculture and construction. But these sectors can be volatile and the effects temporary.   

While internal migration has slowed somewhat in the recession, it remains a potent force. Except for the ND, SD, MT phenomenon, the shift from the northeast and lower Mississippi to the west and the southeast, plus redistribution out of California, seems perhaps surprising, rather stable. Nevertheless, the second lesson is that the patterns for the next two years, 2014-2016 could be different! Already in 2015 are news reports of a marked slowdown in North Dakota, due to the plunging price of oil! Sic transit Gloria! 

Richard Morrill is Professor Emeritus of Geography and Environmental Studies, University of Washington. His research interests include: political geography (voting behavior, redistricting, local governance), population/demography/settlement/migration, urban geography and planning, urban transportation (i.e., old fashioned generalist).

America Needs The Texas Economy To Keep On Rolling

$
0
0

In the last decade, Texas emerged as America’s new land of opportunity — if you will, America’s America. Since the start of the recession, the Lone Star State has been responsible for the majority of employment growth in the country. Between November  2007 and November 2014, the United States gained  a net 2.1 million jobs, with 1.2 million alone in Texas.

Yet with the recent steep drop in oil prices, the Texas economy faces extreme headwinds that could even spark something of a downturn. A repeat of the 1980s oil bust isn’t likely, says Comerica Bank economist Robert Dye, but he expects much slower growth, particularly for formerly red-hot Houston, an easing of home prices and, likely, a slowdown of in-migration.

Some blue state commentators might view Texas’ prospective decline as good news. Some, like Paul Krugman, have spent years arguing that the state’s success has little to do with its much-touted business-friendly climate of light regulation and low taxes, but rather, simply mass in-migration by people seeking cheaper housingSchadenfreude is palpable in the writings of progressive journalists like the Los Angeles Times’ Michael Hiltzik, who recently crowed that falling energy prices may finally “snuff out” the detested “Texas miracle.”

Such attitudes are short-sighted. It is unlikely that the American economy can sustain a healthy rate of growth without the kind of production-based strength that has powered Texas, as well as Ohio, North Dakota and Louisiana. De-industrializing states like California or New York may enjoy asset bubbles that benefit the wealthy and generate “knowledge workers” jobs for the well-educated (nationwide, professional and business services employment rose by 196,000 from October 2007 through October 2014), but they cannot do much to provide opportunities for the majority of the population.

By their nature, industries like manufacturing, energy, and housing have been primary creators of opportunities for the middle and working classes. Up until now, energy  has been a consistent job-gainer since the recession, adding  199,000 positions from October 2007 through October 2014, says Dan Hamilton, an economist at California Lutheran University. Manufacturing has not recovered all the jobs lost in the recession, but last year it added 170,000 new positions through October. Construction, another sector that was hard-hit in the recession, grew by 213,000 jobs last year through October. The recovery of these industries has been critical to reducing unemployment and bringing the first glimmer of hope to many, particularly in the long suffering Great Lakes.

Reducing the price of gas will not change the structure of the long-stagnant economies of the coastal states; job growth rates in these places have been meager for decades. Lower oil prices may help many families pay their bills in the short run. But there’s also pain in low prices for a country that was rapidly becoming an energy superpower, largely due to the efforts of Texans.

Already the decline in the energy economy, which supports almost 1.3 million manufacturing jobs, is hurting manufacturers of steel, construction materials and drilling equipment, such as Caterpillar. Separately, the strengthening of the dollar promises harder times ahead for exporters  in the industrial sector, and greater price competition from abroad, amid weakening overseas demand. Factory activity is slowing, though key indicators like the ISM PMI are still signaling that output is expanding.

Right now in Texas, of course, the pain is mounting in the energy sector. Growth seems certain to slow in places such as Houston, which Comerica’s Dye says is “ground zero in the down-draft.” Also vulnerable will be San Antonio, the major beneficiary of the nearby Eagle Ford shale. The impacts may be worst in West Texas oil patch towns like Midland, where energy is essentially the economy.

Yet there remain reasons for optimism. Cheaper energy prices will be a boon for the petrochemical and refining industries, which are thick on the ground around Houston and other parts of the Gulf Coast. The Houston area is not seeing anything like the madcap office and housing construction that occurred during the oil boom of the 1980s. Between 1982 and 1986 the metro area added 71 million square feet of office space; including what is now being built, the area has added just 28 million square feet since 2010. Compared to the 1980s, the residential market is also relatively tight, with relatively little speculative building.

The local and state economies have also become far more diversified. Houston is now the nation’s largest export hub. The city also is home to the Texas Medical Center, often described as the world’s largest. Dallas has become a major corporate hub and Austin is developing into a serious rival to Northern California’s tech sector.

Texas needs to increase this diversification given that oil prices could remain low for quite a while, and even drop further after their recent recovery.

This is not to deny that the state is facing hard times. Energy accounts for 411,372 jobs in Texas, about 3.2% of the statewide total, according to figures from Austin economist Brian Kelsey quoted in the Austin American-Statesman. If oil and gas industry earnings in Texas fall 20%, Kelsey estimates the state could lose half of those jobs and $13.5 billion in total earnings.

Low prices also could also devastate the state budget, which is heavily reliant on energy industry revenues. A reduction in state spending could have damaging consequences in a place that has tended to prefer low taxes to investing in critical infrastructure, and is already struggling to accommodate break-neck growth. The only good news here is that slower population growth might mitigate some of the turndown in spending, if it indeed occurs.

But in my mind, the biggest asset of Texas is Texans. Having spent a great deal a time there, the contrasts with my adopted home state of California are remarkable. No businessperson I spoke to in Houston or Dallas is even remotely contemplating a move elsewhere; Houstonians often brag about how they survived the ‘80s bust, wearing those hard times as a badge of honor.

To be sure, Texans can be obnoxiously arrogant about their state, and have a peculiar talent for a kind of braggadocio that drives other Americans a bit crazy. But they are also our greatest regional asset, the one big state where America remains America, if only more so.

Joel Kotkin is executive editor of NewGeography.com and Roger Hobbs Distinguished Fellow in Urban Studies at Chapman University, and a member of the editorial board of the Orange County Register. He is also executive director of the Houston-based Center for Opportunity Urbanism. His newest book, The New Class Conflict is now available at Amazon and Telos Press. He is also author of The City: A Global History and The Next Hundred Million: America in 2050.  He lives in Los Angeles, CA.

Photo:
"West Texas Pumpjack" by Eric Kounce TexasRaiser - Located south of Midland, Texas. Licensed under Public Domain via Wikimedia Commons.

Is Jakarta the World's Most Congested City?

$
0
0

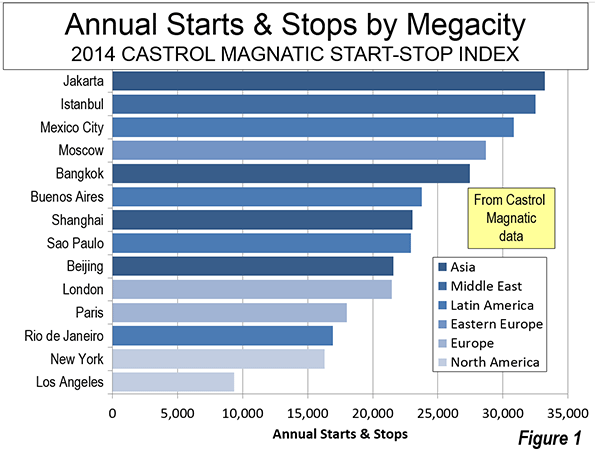
The world's second-largest city, Jakarta, is its most congested according to the Castrol Magnatec Stop-Start Index. The Start-Stop Index estimates the average number of starts and stops per vehicle in 78 cities around the world. Jakarta drivers had 33,240 starts and stops annually according to the survey. A higher number of starts and stops is associated with more intense traffic congestion and more intense greenhouse gas emissions per mile traveled. This is an indication of a roadway system that provides insufficient capacity for the travel demand (including commercial truck traffic). The Start-Stop Index did not include the world's largest city, Tokyo–Yokohama.

Measuring Traffic Congestion

The Castrol Magnatic is one of three international traffic congestion measures that provide information over broad geographical areas. The other two indexes, the Tom Tom Traffic Congestion Index and the INRIX Traffic Scorecard provide measures of traffic congestion by travel time losses. These indexes generally follow the method pioneered by the Texas A&M Transportation Institute, the results of which are reported annually in its Urban Mobility Report.

The Castrol Magnatic Start-Stop Index measures congestion by the number of starts and stops experienced by drivers. The three traffic congestion indexes also measure different geographies. The Tom Tom Traffic Congestion Index provides scores for cities in the United States, Canada, China, Australia, New Zealand, Europe, South Africa and Latin America. The INRIX Traffic Scorecard provides information on cities in the United States, Canada and Europe. The Castrol Magnatic Start-Stop Index provides by far the greatest geographical coverage, with data from the United States, Canada, China, Australia, New Zealand, Europe, South Africa, Latin America and Southeast Asia. However, over its larger geography, fewer cities are evaluated in this survey than in the Tom Tom and INRIX indexes.

The state of traffic congestion reporting is has improved and it seems likely that the remaining portions of the world not yet reported upon will soon be added.

Rating Starts and Stops

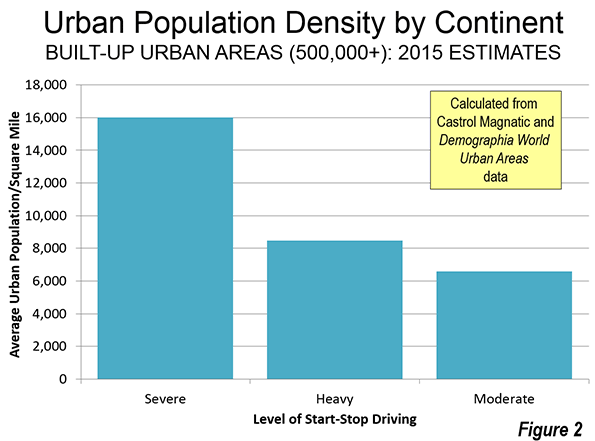
The Castrol Magnatic Start-Stop Index relies on data automatically collected from its subscribers by traffic index publisher and vehicle navigation company, Tom Tom. Castrol Magnatic rates each city on a "three color" matrix. Cities with an average of more than 18,000 starts and stops annually are rated "red." This indicates a "severe" level of start-stop driving. The second level is "amber," with annual starts and stops between 8000 and 18,000. This is considered "heavy" level of start-stop driving. The least critical level is "green," which indicates a "moderate" level of start-stop driving.

Megacities and Start-Stop Driving

Fourteen of the worlds 34 megacities were included in the Start-Stop Index. The Start-Stop Index provides the first information for Jakarta, which has often been cited anecdotally for the worst traffic congestion, a title is now bestowed by Castrol Magntic. Some, but not all of the megacities have been previously rated with high levels of traffic congestion in the other indexes.

Istanbul ranked second among the megacities with 32,520 starts and stops annually. This Istanbul was also second worst in the Tom Tom Congestion Index in 2013. Mexico City had 30,840 starts and stops annually. Mexico City was also among the most congested cities in the 2013 Tom Tom Congestion Index, ranking fifth.

Moscow was the fourth most congested megacity in the Start-Stop Index, with nearly 29,000. Last year, Tom Tom ranked Moscow as having the worst traffic congestion.

Like Jakarta, Bangkok has often been anecdotally cited for having the worst traffic congestion in the world. Traffic is bad in Bangkok, but ranks only fourth worst in the world in according to the Start-Stop Index, with approximately 27,500 stops and starts annually.

Buenos Aires had the six the worst traffic congestion at nearly 24,000 stops and starts annually. Shanghai was rated seventh among the megacities with approximately 23,000 starts and stops, but did not make Tom Tom's most congested 10.

São Paulo was the eighth ranked megacity in nearly a tie with Shanghai. Sao Paulo was ranked seventh by Tom Tom.

Beijing, London and Paris rounded out the 11 cities with severe start-stop driving levels ("red"), with at least 18,000. Beijing ranked as the ninth most congested megacity, the same as its Tom Tom ranking. London's was ranked 10th among the megacities, compared to its the current "London Commute Zone" ranking of third worst in the INRIX Traffic Scorecard. Paris was not ranked in the worst 10 by either INRIX or Tom Tom.

Three of the megacities had heavy start-stop driving levels ("amber"). Megacity Rio de Janeiro ranked 12th, compared to its third worst ranking by Tom Tom.

It may come as a surprise to harried commuters, but the two American megacities were ranked least congested. New York ranked 13th. By far the lowest number of annual starts and stops registered for a megacity were in Los Angeles, at approximately 9,400. This is more than 40% better than for New York and is less than one third of the annual starts and stops in Jakarta (Figure 1). Los Angeles is currently rated as having the fourth worst congestion by INRIX, following Honolulu, Milan and the London Commute Zone, though is not ranked in the worst 10 by Tom Tom. The least congested ranking among the megacities for Los Angeles is at considerable odds with the near domination worst rankings for the three decades of the Texas A&M Transportation Center Urban Mobility Report (which includes only US cities).

The Developing World and the New World

The developing world dominated the most congested rankings among all cities. Among the 10 most congested cities, only one high income city was included, Rome.

Most of the other cities of the New World (Canada, Australia and New Zealand) had fewer than 10,000 starts and stops per year. This included Toronto, Melbourne, Sydney, Auckland and Wellington. The exceptions were Vancouver and Sydney, both with approximately 13,000 starts and stops per year. A number of smaller cities (below 500,000 population) also had fewer than 10,000 starts and stops per year, such as Tampere, Finland and Brno in the Czech Republic.

Environmental and Economic Costs of High Density

Generally, the worst start-stop congestion ratings are associated with cities that have higher urban population densities (Figure 2). This is consistent with the association of greater traffic congestion analysis with higher urban population densities,   also found in the Tom Tom Traffic Congestion Index and the INRIX Traffic Scorecard.

More starts and stops impairs fuel economy, which also materially increases greenhouse gas emissions. Moreover, greater traffic congestion lengthens travel times. Economic growth is greater in where there is rapid mobility throughout the entire metropolitan area (labor market). Yet, urban plans often seek higher densities in their quest for reduced greenhouse gas emissions. The Castrol Magnatic Start-Stop Index results underscore the need for rational urban planning that takes into full account both the economic and environmental consequences of strategies that lead to greater traffic congestion.

Wendell Cox is principal of Demographia, an international public policy and demographics firm. He is co-author of the "Demographia International Housing Affordability Survey" and author of "Demographia World Urban Areas" and "War on the Dream: How Anti-Sprawl Policy Threatens the Quality of Life." He was appointed to three terms on the Los Angeles County Transportation Commission, where he served with the leading city and county leadership as the only non-elected member. He was appointed to the Amtrak Reform Council to fill the unexpired term of Governor Christine Todd Whitman and has served as a visiting professor at the Conservatoire National des Arts et Metiers, a national university in Paris.

Photo: Jakarta: low capacity main artery from busway station (by author)

The New New Thing: Suburban Bunker Buildings

$
0
0

I have a theory about where the next culturally dynamic neighborhoods are likely to emerge and which building types will be the engine of that transformation. It may not be exactly what most people expect.

As American industry receded in the later half of the Twentieth Century it left behind an alluvial delta of redundant buildings that sat vacant for years, no longer useful or productive. All effort was focused on building the new suburbs. These abandoned inner city warehouse districts became so cheap and run down that they were eventually colonized by artists, immigrants, and bohemians seeking cheap rent and an environment where landlords and municipal authorities looked the other way. They weren’t necessarily safe, or clean, or attractive, but they provided a kind of freedom for the people who lived there.

 Screen Shot 2015-02-10 at 8.38.05 PM  Screen Shot 2015-02-10 at 8.39.46 PM Screen Shot 2015-02-10 at 8.40.07 PM  unnamed-2 unnamed
 unnamed-3 unnamed-1 

The photos above are of friends in their 8,000 square foot live/work space in Philadelphia. The general dismissive attitude of many suburbanites is that such people exist outside the mainstream and are irrelevant to the lives of “real” people. Contrary to this common misconception all the creative types I know are highly skilled and hold down jobs as welders, carpenters, accountants, and technicians of various kinds. I know a couple who spend half the year in video production making car commercials and then pursue their art during the long hiatus. I know another guy who worked like a dog for a few years after college at a prototype lab for the pharmaceutical industry in order to pay off all his student loans and other debts. Now he’s free to do what he really wants without the burden of debt. These folks simply choose not to spend their money on a mortgage on a suburban home with multiple car payments, but their lives and economic productivity are very real.

Technically, living in an old warehouse involves breaking a hundred different rules and regulations, but they’ve been there for years and no one cares. It’s that kind of space and that kind of neighborhood. Unfortunately, the area is rapidly gentrifying and they may be priced out of the space soon as nearby warehouses are being converted to luxury lofts. That begs the question – where are the cheap funky emerging neighborhoods these days? You can’t live and work this way in a suburban tract home. Neither the physical space nor the local culture will allow it.

unnamed-1 unnamed

A couple of years ago I was in Salt Lake City having lunch with a prominent well-connected real estate agent. She’s the kind of charming knowledgable person I always seek out so it was a pleasure to see her again. I had explored various parts of Salt Lake from the downtown core all the way out to Daybreak in the distant suburbs. She spoke of the urban renaissance, the new streetcar system, and the many new developments in previously blighted areas. But I explained that the part of town that really interested me was the neglected and undervalued areas in the lackluster middle distance just beyond downtown that were neither sophisticated and urbane nor verdant and domestic. These semi-commercial, vaguely industrial, half-assed residential zones were neither fish, nor flesh, nor fowl. But they had the two qualities that fascinate me: they’re relatively inexpensive and generally ignored by the Upright Citizens Brigade. They’re close enough to downtown and the university that you could still ride a bicycle to access culture and employment, but just a short drive to suburban conveniences farther out. It’s the wrong combination for people with conventional tastes, but the perfect sweet spot for a certain kind of subculture that needs to be left alone in order to thrive. They need wiggle room that doesn’t exist in the highly supervised downtown or manicured suburbs. And many of these brick and concrete buildings are little bunkers where you could do just about anything within the raw space. They offer the one thing that’s in terribly short supply. Slack. 

unnamed-2 unnamed-3 unnamed-1

I sent these photos over to her and explained that these nondescript aging suburban bunker buildings were the next great building type. She was gracious and polite, but she obviously thought I was insane. Now granted, she isn’t the only person to come into contact with me to come to this conclusion – and not just because of my irregular taste in property.

Screen Shot 2015-02-09 at 5.01.50 PM  Screen Shot 2015-02-09 at 5.05.02 PM Screen Shot 2015-02-09 at 5.04.39 PM

This conversation came back to me this afternoon as I walked past a building that used to house a discount bakery outlet. As a much younger and poorer person twenty years ago I used to frequent this establishment myself to buy day old bread and not-quite-expired donuts. This month the bunker building was transformed into an upscale furniture store with in-house designer services. I poked around and explored the shop. I had no particular interest in the furniture itself and don’t think this kind of business could succeed anyplace other than a prosperous part of town. But it was the bones of the building itself that fascinated me.

Screen Shot 2015-02-09 at 5.01.18 PM Screen Shot 2015-02-09 at 5.01.02 PM Screen Shot 2015-02-09 at 4.54.42 PM Screen Shot 2015-02-09 at 5.02.40 PM Screen Shot 2015-02-09 at 4.55.46 PM

It’s a big flexible durable space like the old inner city industrial buildings. The walls and floor are concrete and the ceilings are exposed wood and steel. The former loading docks make perfectly segmented rooms with high ceilings and the ability to adapt to many uses including indoor/outdoor applications. Paint and some inexpensive drywall partitions transform the space very quickly. The front room was mostly glass and open to the parking lot, but the vast majority of the building was entirely private. This is a perfect example of the new new thing. This is where the starving bohemians will end up if they want to continue doing their work in a big, affordable, mostly unregulated spot. In an expensive real estate market people will colonize any vacant building and make their luxury furniture showroom work. But in depressed suburban markets these buildings are ripe for economically displaced artists. Gather enough interesting and entrepreneurial types in one such neighborhood and it could be the social and cultural engine that pulls up an entire dying suburban strip.

John Sanphillippo lives in San Francisco and blogs about urbanism, adaptation, and resilience at granolashotgun.com. He's a member of the Congress for New Urbanism, films videos for faircompanies.com, and is a regular contributor to Strongtowns.org. He earns his living by buying, renovating, and renting undervalued properties in places that have good long term prospects. He is a graduate of Rutgers University.


The Jewish World is Contracting Toward U.S., Israel

$
0
0

Recent anti-Semitic events – from France and Belgium to Argentina – are accelerating the relentless shrinking of the Jewish Diaspora. Once spread virtually throughout the world, the Diaspora – the scattering of Jews after the fall of ancient Israel – is retreating from many of its global redoubts as Jews increasingly cluster in two places: Israel and the United States.

Seventy years after the liberation of Auschwitz, Jewish communities throughout Europe are again on the decline. This time, the pressure mainly comes not from the traditional anti-Semitic Right but from Islamic fundamentalists, which include many European citizens.

Not all this decline is attributable to attacks from Islamic militants. Demographic factors – intermarriage and low birth rates – afflict almost all Diaspora communities.

Read the full article at The Orange County Register.

Joel Kotkin is executive editor of NewGeography.com and Roger Hobbs Distinguished Fellow in Urban Studies at Chapman University, and a member of the editorial board of the Orange County Register. He is also executive director of the Houston-based Center for Opportunity Urbanism. His newest book, The New Class Conflict is now available at Amazon and Telos Press. He is also author of The City: A Global History and The Next Hundred Million: America in 2050.  He lives in Los Angeles, CA.

Photo by Chamber of Fear (originally posted to Flickr as Jewish Family Night) [CC BY-SA 2.0], via Wikimedia Commons

50 Years of US Poverty: 1960 to 2010

$
0
0

Although inequality is the current focus of concern with income, it is in the end a story of the rich, the middle and the poor, who of course have not gone away.  It is valuable to remind ourselves, particularly the young, about how pervasive poverty was 50 years ago, how poverty declined markedly between 1960 and 1980, after which it has risen again. Most important is to understand what led to the poverty reduction between 1960 and 1980, in order to further understand the power and lure of forces which would return us to the good old days of 1960, or before!. This piece is inspired by the pioneering book from 1970 on the Geography of Poverty, with Ernest Wohlenberg, based on 1960 data.  The data updates come mainly from US Census Bureau. 

I start with the basic data, the numbers of the poor and the percent below the poverty level for 1960, for 1980 and for 2010, plus a summary table.  These are supplemented by some maps of the poverty rates for whites and for blacks (or non-whites), and for the elderly (only available for 1980).

Overall for the nation the poverty rate fell from 22% in 1960 steeply down to 12% in 1980 then moved up moderately to 15% during the current era of rising inequality.  I look first at broad patterns of relative poverty for the three times, and then turn to the more interesting or surprising story of the differences in the reduction of poverty across the states, and then the story for whites, blacks and the elderly.

Broad Patterns 

The United States was so different in 1960, with a poor rural south and southwest, and a fairly poor Great Plains. (Figure 1). While the west coast was better off and metropolitan, the main area of lower poverty was the historic urban-industrial core from IL and WI to southern New England, where unionized industry prevailed. CT was richest with less than 10 percent poverty; this compared to MS with a poverty rate of 55! The deep south was amazingly poor and not just for Blacks. 

Changes by 1979 were indeed revolutionary (Figure 2).  Areas of lower poverty extended from the old industrial core to the rest of New England and down Megalapolis to Virginia, and to the “old northwest”, MN, WI, IA, and to most of the US West. Most improved were the corners of the south, TX, OK, and FL, NC, due to energy development, new industries moving to the south and poor blacks escaping to the north.  Only a small lower Mississippi region (AR, LA, MS, and AL) remained fairly poor.

2010 saw a rather general resurgence of poverty – related certainly to globalization and industrial off shoring, deindustrialization in the old northeastern core, and greater poverty across the southern tier from CA to FL, in part related to heavy immigration from Latin America.  Some of this shift could, in my opinion, be pegged as well to the shift to more conservative Republican Party rule.


Numbers of States
WhiteBlackOver 65
Rate196019802010 198019801980
<12%2271441011
12-18%19193010721
18-24%115788
24-40%143611
>40%5


Poverty rates fell broadly between 1960 and 1980, especially for the half of states with 1960 rates above the 22% average level, while the number of states with rates below the 1980 average of 12% rose from 2 to 27 states. Rates increased modestly in the ensuing years in the then states with the lowest rates.

The Relative Fates of States    

Several states fared relatively best, with poverty rates falling at least in half or more in 2010 than in 1980. These are in two disparate sets: first southern states with very high poverty in 1960: AL, AR, KY, MS, NC, and VA, and another northern set  in ME, NE, NH, ND, SD, UT, and VT.  Other states in which poverty rates fell at least in half, but were lower in 1980 than in 2010 include GA, IA, SC, and TN. FL and TX poverty rates fell to less than half the 1960 rates in 1980, but poverty growth by 2010 showed some back-tracking. At the other extreme three states actually had higher rates of poverty in 2010 than way back in 1960: CA, NV, and NY.

The particular gains for the south reflect two dominant forces, the out-migration of large numbers of black people to the north and west, slowing the reduction in poverty rates for the north and west, as well as the successful shift of industry from the north to the south, both forces including millions of families and of jobs.  TX and FL stand out because of high migration from Latin America. The exceptional story of CA and NY is similarly one of massive migration of minorities from the rest of the country but of even larger immigration from Latin America. The opposite story of very low poverty in NH, VT, and ME is one of overflow of opportunities and wealth from Massachusetts. The reason for ND, SD, NE, and UT is pre-oil development, and reflects broader forces for poverty reduction.

Poverty in White and Black

White poverty rates fell from 17 to 9.4 in 1979 but then edged up to 10% in 2010. At the same time, black poverty rates fell from a horrendous 55% in 1959 to just under 30% in 1979 and appears to have remained at 30 in 2010. Note that black poverty rates remain three times that of whites, and are comparatively as high as they were in 1959.  The gap remains worse (Figure 6) in the south and extreme generally across the north, but much lower in places like the Dakotas and upper New England in 1979 in part because of small numbers, and also due to the fact that the 1959 rates included Native Americans while the 1979 numbers did not.  The only good estimates for white poverty were for 1979, and reveal a remarkable uniformity across much of the country, lagging slightly in Appalachia-Ozarkia. (Figure 5) 

Meanwhile, rates for blacks fell more in the parts of the South SC,  VA, NC, FL, and TX, but even more so  in the historic ”black belt” of AL, LA, MS, AR, and SC where the poverty rate dropped from 77 to 33 %. Less improvement is evident for early northern destinations of blacks from the south: NY, IL, MI, OH, and NJ, or in CA and OR.

Please refer back to the table. While whites had rates below 12% in 46 states, for blacks the number is 0.   While 0 states had white rates above 18%, 44 states had black rates above 18%. This is shameful.  I am unable to find any positive spin for this story. The racial gap remains deeply entrenched.

I close with a variant of the 2010 poverty map, showing the absolute numbers as well as the rates (Figure 8). Poverty remains serious across the southern tier, especially on CA, TX and GA, but also in the north, especially in NY and the eastern Great Lakes states.  While direct causality is unlikely, one can understand the worry of the increased numbers and shares of the poor clear across the southern tier of the country- CA to FL.     

Poverty of the Elderly

Compared to the generally poor picture of black poverty, the story  for the elderly is much  more positive. If anyone won the “war on poverty”, it was the elderly. Is this because of their political clout? Not just that, but it obviously matters. The data for 1959 and 2010 are not fully comparable, so the only map is for 1979.  But the elderly poverty rate in 1959 was a striking 46 percent, not that much below the outcast blacks, so the fall in the rate to under 15% in 1979 is quite astonishing. The reasons for this are discussed below. Here we can compare the pattern for elderly with that for all persons.

Actually the correlation between age and poverty is quite high; elderly rates average about 5% above those for all people.  CA, AZ, FL, and NY achieved lower senior poverty rates in 1979 than for all persons, probably a result of selective migration, perhaps a role of political influence in AZ and FL.

Why did poverty fall so much from 1960 to 1980, and then increase again? This is no big mystery! The two powerful and complementary forces reducing poverty were America’s robust economic expansion, in the 1960s especially, combined with social programs, starting with the New Deal (especially Social Security and the minimum wage), and the era of union growth, followed by the 60s Civil Rights revolution, including women’s rights, and the Great Society’s War on Poverty, above all Medicare and Medicaid. Of course these programs had to be paid for, but this was accomplished by vast economic investment and gains in productivity of the economy.

The elderly were a huge part of poverty in 1960 but a relatively low part by 1980.  And despite the nation’s ongoing inability to overcome racial discrimination and unrest, the social programs have greatly helped the emergence  of a black middle class, as much in the south as in the north.

Factoring in the Cost of Living

But wait! Isn’t the cost of living higher in New York and San Francisco than in West Virginia and Nebraska?  Should this affect the estimates of poverty across the state?  The answer is yes, and fortunately, the Census Bureau has just completed a new series of poverty estimates for 2010-2012 adjusting for variations in the cost of living, and compared these to their official figures.  The effects are not trivial.

Essentially, the cost of living is significantly higher in the biggest, densest and richest metropolitan cores, and correspondingly lower is most of the rest of the country. The higher costs in these few giant but populous places is sufficient to raise the number in poverty nationally, by 2.6 million, raising the US rate from 15.1 to 16 percent.

The critical states for underestimating poverty are actually few: CA, 2,750,000 more, up 7.3%: NJ, 415,000 more, up 4.8%; FL, 771,000 more, 4.1%; MD, up 195,000, up 3.3%; NV, 102,000, 3.8%; and NY, up 308,000, 1.6%. California dominates the rise in poverty, by itself adding more poor than the country as a whole.  But some other states with big metropolitan areas do not suffer this cost of living adjustment: TX, -338,000. -1.3%; OH, -252,000, -2.2%; MI, -130,000, -1.3%; IN -106,000, -1.7%; and NC, -249,000, 2.6%. I do not know that these states have in common, perhaps less stringent growth management and lower tax rates.  

There are seven states with a drop in the number of poor of 3% or more after adjusting for cost of living,  including MS, -136,000, -4.6%; NM, -86,000, -4.2%; WV, -75,000, -4.3%; and KY, -165,000, -3.8%.  As a consequence, we end up with a US pattern that is counter-intuitive, and contrary to conventional long-term wisdom about poverty. Big, rich mega-urban California earns the nation’s highest poverty rate as well as in total numbers (24%), followed by DC with 22.7; NV, 19.8; and FL, 19.5.  Long maligned poor states like MS has the same rate as the country, at 16%, AR, 16.5; SC, 15.8; and especially extreme, WV, 12.9 and KY, 13.6. Rather than having the lowest poverty rate at 9.6, CT moves up to 12.5, while IA, 8.6; ND, 9.2; WY, 9.2; and MN, 9.7, fall below 10% poor.  Counter-argument can be made that the story is not so different as first appears, if the richest states with higher cost of living also tend to  have higher levels of services to those in poverty. But this has not been measured. 

Perusing the  two new maps of the percent poor in 2010,cost of living  adjusted, and the change in rates and numbers, highlights the key role of California-Nevada and of Megalapolis-Florida, historic cores of urban wealth, are also incubators of higher poverty. This also supports the idea that that immigration from Latin America must play a role in the heightened poverty along most of the southern border, and especially California.  The curse of poverty remains everywhere, but it’s clearly become more severe in some places, and less so in others.

Richard Morrill is Professor Emeritus of Geography and Environmental Studies, University of Washington. His research interests include: political geography (voting behavior, redistricting, local governance), population/demography/settlement/migration, urban geography and planning, urban transportation (i.e., old fashioned generalist).

10 Most Affluent Cities in the World: Macau and Hartford Top the List

$
0
0

The United States and Europe continue to dominate the list of strongest metropolitan areas (city) economies in the world, according to the Brookings Institution's recently releasedGlobal Metro Monitor 2014. This is measured by gross domestic product per capita, adjusted for purchasing power parity (GDP-PPP). Brookings points out that this does not indicate personal income, but "proxies the average standard of living in an area."

The Global Metro Monitor 2014 provides detailed ratings for the 300 largest metropolitan economies in the world, measured by gross domestic product adjusted for purchasing power parity. The list is defined by total size of the economy, with some cities with very high GDP-PPPs per capita, but small populations are excluded. For example, Midland, Texas, with the highest GDP-PPP per capita metropolitan area according to the United States by the Department of Commerce Bureau of Economic Analysis, is excluded.  Other cities, with large populations and low GDP-PPP s per capita were included, such as megacity Kolkata, with a GDP-PPP of $4,000, a fraction of the top 10 average of $77,000. Megacities such as Lagos, Dhaka and Kinshasa were excluded from the top 300, owing to their low GDP-PPPs per capita

According to data in the Global Metro Monitor website and report, 90 of the top 100 cities were in the United States or Europe in 2014, 68 in the United States and 20 in Europe. The US figure matches that of the previous Global Metro Monitor (2012), while Europe has fallen from 22 to 20 cities.

Macau: The Most Affluent City

Last year's most affluent city, Hartford, was replaced by Macau, which, with Hong Kong is one of China's two special economic regions. Brookings estimates Macau's GDP-PPP per capita at $93,849, opening a substantial lead on Hartford of more than $10,000.

Macau's economy has expanded rapidly the last decade, principally due to legalized gaming industry and related tourism. Macau displaced Las Vegas as the largest gaming center in 2006. According to the Las Vegas Review Journal, Macau's gaming revenues had exploded to nearly seven times that of the Las Vegas Strip ($44.1 billion compared to $6.4 billion). Revenue declined, however, in 2014, partly due to China's anti-corruption drive and competition from other growing East Asian centers, such as Singapore and the Philippines.

Macau is the one of the smallest cities in the Brookings 300, with a population of only 575,000. Only three other richest cities have populations less than 600,000 including Durham, North Carolina the smallest, ranked 12th, Pennsylvania's capital, Harrisburg (with a core city that filed for bankruptcy), ranked 25th and Scotland's capital, Edinburgh, at ranked 37th.

Balance of the Top 10 Cities

As was the case last year, nine of the 10 largest GDP-PPP's per capita were in the United States (Figure). Like Macau, the second and third ranking cities were also smaller than the average, a population of 4.7 million. Second ranked Hartford, with a GDP-PPP per capita of $83,100 has 1.1 million residents. Hartford’s economy strong in finance, especially insurance and benefits and is an important government center, as the capital of Connecticut.

San Jose, with 1.9 million residents, ranked third, with a GDP-PPP per capita of $82,400. San Jose is home to the larger part of the world's leading technology center, suburban Silicon Valley. Tech and University hub Boston ranked fourth.

Leading energy hub Houston ranked as the fifth most affluent city, with a GDP-PPP per capita of nearly $75,000 (Note 1). With 6.4 million residents, Houston is the largest city among the top five. Among the top ten, only New York is larger.

Bridgeport, Connecticut, a metropolitan area adjacent to New York that includes suburban business centers such as Stamford, Westport and Greenwich is ranked 6th.

The balance of the top 10 also includes cities specializing in technology, finance and government. Number seven Washington has probably the world's largest government complex   and has nurtured a huge technology center centered in the Virginia and Maryland suburbs. Seattle ranks eighth, continuing its historic leadership in the technology driven aerospace industry besides its emergence as one of leading information technology centers in the world.

San Francisco which includes part of the Silicon Valley in its suburbs (sharing with San Jose) and has a strong social media industry in its urban core, ranks 9th. The top 10 was rounded out by New York, perennially ranked as one of the two top global cities, along with London (see: Size is not the Answer: The Changing Face of the Global City, referred to as the Global Cities Report, described further in Note 2)

Additional Highlights

Europe:Unlike the United States, which placed 37 of its most affluent cities in the top 50 and 31 in the second 50, Europe's 20 most affluent economies were concentrated in the second 50, with only six in the top 50. Comparatively small Edinburgh, cited above, was the most affluent, at 37th. Paris was ranked 40th most affluent by Brookings and 3rd in the Global Cites report, just ahead of London at 42nd, the perennial global city co-leader (which was ranked number one in the Global Cities Report).

Hong Kong:Along with Macau, China's other special economic region, Hong Kong continued to be among the world’s most affluent, at 39th. The Global Cities Report ranked Hong Kong as the sixth Global City, with a GDP-PPP PPP higher than that of former its former imperial capital   London.

China: Perhaps most significantly, mainland China has begun to enter the top 100. Suzhou, partly exurban to Shanghai (Kunshan), now ranks 68th. Suzhou has been the recipient of considerable business park investment, including cooperative ventures with Singapore. China's economic prosperity may be shifting toward the Yangtze Delta (which extends from Ningbo and Hangzhou, through Shanghai to Nanjing). Along with Suzhou, Wuxi, Changzhou and Nanjing now have GDP-PPP's per capita exceeding $30,000. By contrast, among the large manufacturing centers of the Pearl River Delta, only Shenzhen exceeds a GDP-PPP of $30,000, while Guangzhou, Dongguan and Foshan are below that level (Note 2). According to a new Economist Intelligence Unit report, Jiangsu (which includes the urban corridor from Suzhou to Nanjing) now accounts for more manufacturing employment than any other province.

Surprisingly Low Rankings: Some cities that might have been expected to be among the world's most affluent, ranked comparatively low. For example Tokyo, the world's largest city, ranked fourth in the Global Cities Report, made it only to the third 50 in affluence. Seoul-Incheon, a burgeoning corporate and tech center, remained outside the top 100.

Canada's largest city, Toronto managed only a ranking of 100, well below the Prairie behemoths of Calgary (11th) and Edmonton (23rd). Australia's largest city, Sydney also barely made the top 100, at 95th, far below energy and commodities capital Perth (17th).

European cities with reputations for unusual prosperity also ranked lower than expected. Financial center Zurich was ranked 45th. Scandinavia's most affluent city  was Stockholm (48th), followed by energy leader Oslo (62nd), Helsinki (87th) and Copenhagen, which failed to make the top 100 and ranked in the third 50. Singapore,which the Global Cities Report ranks fourth, is ranked 14th most affluent.  

Evaluating City Performance

Cities grow as migrants are attracted by hope for better lives. This is as true in Africa and India as it is in Europe or the United States. Cities achieve their primary purpose when they produce a higher standard of living for their residents. Some cities do very well at this, as the Brookings data indicates, and some do less well. The Global Metro Monitor provides crucial information that can be used by national, regional and local officials to measure how well their policies are performing in improving living conditions in relation to both their own past and other cities.

Note 1: Purchasing power can vary greatly even within nations. Because of this, the United States Department of Commerce, Bureau of Economic Analysis has developed a regional price parities (RPP) program to adjust for metropolitan area costs of living. For example, in 2012, the unadjusted per capita income in San Jose was 30 percent above that of Houston. In the same year, the per capita income-RPP (or in international terms, the per capita income-PPP) in San Jose was just six percent above that of Houston, indicating cost of living at least 20 percent higher in San Jose. 

Note 2:  Joel Kotkin was principal author of Size is not the Answer: The Changing Face of the Global City, which included contributing authors Ali Modarres, Aaron M. Renn and me. The report was jointly published by the Civil Service College of Singapore and Chapman University. The report is available here.

Note 3: The 2012 Global Metro Monitor ranked some cities of China higher, though Note 19 expressed concerns about population data for some cities, which might have excluded migrant populations (the "floating population"). There are no such difficulties in the 2014 Global Metro Monitor.

Wendell Cox is principal of Demographia, an international public policy and demographics firm. He is co-author of the "Demographia International Housing Affordability Survey" and author of "Demographia World Urban Areas" and "War on the Dream: How Anti-Sprawl Policy Threatens the Quality of Life." He was appointed to three terms on the Los Angeles County Transportation Commission, where he served with the leading city and county leadership as the only non-elected member. He was appointed to the Amtrak Reform Council to fill the unexpired term of Governor Christine Todd Whitman and has served as a visiting professor at the Conservatoire National des Arts et Metiers, a national university in Paris.

Photo: St. Paul's Church (Facade), Macau, photo by authors

Europe Is Still a Second-Rate Power

$
0
0

In the years after the Cold War, much was written about Europe’s emergence as the third great force in the global political economy, alongside Asia and the United States. Some, such as former French President Francois Mitterand’s eminence grise Jacques Attali, went even further: in his 1991 book Millenium Attali predicted that in the 21st century, “Japan and Europe may supplant the United States as the chief superpowers.”

This notion of a fading America has been embraced among some here as well, by authors such as Jeremy Rifkin who has written extensively about a “European dream” supplanting the American one on a global scale. In 2008, CNN anchor Fareed Zakaria predicted the rise of what he called “the post-American world,” with the U.S. still preeminent but losing ground, particularly to emerging countries in Asia. This view is widely held in American elite circles, including many people in or close to the Obama administration.

Yet something funny happened on the road to a post-American era: it didn’t happen. Even under two of the most incompetent administrations in our country’s long history, we are headed not to a “post-American” world, but more likely a “post-European” one.

The Fading of the “European Dream”

Fifty years ago, when Europe’s economy was growing faster than America’s on a consistent basis, and Asia was just emerging, the case for the continent’s ascendency seemed much stronger. But for the past 30 years Europe’s economy has been generally performing worse than that of the U.S. , not to mention rising Asian powers, including China and India.

The Great Recession hit all economies, but recently American growth rates have consistently outperformed those on the continent. By 2013 Europe was still experiencing 12 percent unemployment—a rate that exceeds ours at the height of the U.S. recession. European household debt, notes analyst Morgan Housel, has been increasing while that of American households has dropped.

The roots of Europe’s poor economy lies in large part in the very welfare state so admired by some progressives. To be sure, generous benefits have helped make Europe somewhat less unequal than the United States. But in the process Europe has become a very expensive place to do business. High taxes and welfare costs, tolerable in an efficient economy like Germany’s, have caught up with weaker, less productive countries such as Italy, Greece, and even France.

This weakness is most evident in two critical sectors—energy and technology—critical to modern economies. Europe’s much ballyhooed attempt to go “green” has raised energy costs throughout the continent. Ultimately, the effects of high energy prices tend to fall on the middle and working classes, as well as on manufacturing industries, which are are now scouring the world, including the southern United States, for lower cost alternatives.

Europe is also vastly underrepresented among the rising players in the tech world . The continent still possesses some influential industrial companies—Siemens, BMW, Volkswagen, Bayer, Royal Dutch Shell, Daimler—but it has created no European equivalent to Google, Facebook, Apple, Amazon, Microsoft, Intel, or even IBM. Not one of the world’s 14 largest tech companies by revenue is based in Europe. Five are in Asia, nine in the United States. European officials have tried to curb these often intrusive and arrogant companies, but the problem lies not in overstrong American competition but Europe’s inability to grow and nurture successful young companies.

The Barrel of the Gun

It’s understandable that a continent that almost destroyed itself twice with wars in the 20th century would shy away from the use of military force. This was reinforced by decades of reliance on U.S. military might for security. This situation in turn nurtured a strong anti-military, pacifistic streak that resulted in a region with a large economy but with little to offer on the battlefield. England is the only European country to possess one of the world’s top five military budgets. Besides the U.S., by far the largest military power, the top four include China, Russia, and Saudi Arabia. The three largest economies using the Euro—France, Germany, and Italy—spend one third less on defense combined than the U.S. Increasingly the only counterweight to U.S. power will be the emerging Sino-Russian alliance, which matches Russia’s still prodigious arms production with China’s almost limitless bankroll.

Demilitarization has its perils. As Chairman Mao once noted, “political power grows out of the barrel of a gun.” Sure we should all prefer, like President Obama, to employ “soft power” rather than going in with guns blazing a la George Bush. Yet the world is still full of well-armed people who don’t play by such civilized rules. A hard-baller like Vladimir Putin knows a bluffer when he sees one and knows he can do what he wants, in the Ukraine or elsewhere, without fear of European intervention or even fear that the E.U. might help arm Kiev’s forces. Similarly, Jihadis have learned that you can do what you want to Europeans, knowing that some countries—notably France, Germany, Spain and Italy—will willingly pay ransoms to free their citizens. Kidnap a German and get rich; do it to an American, Brit or, god forbid, an Israeli, and there’s eventually hell to pay.

The Demographic Disaster

Europe’s biggest problem, however, happens inside the boudoir. Along with Japan, Europe has pioneered low fertility. European countries average a fertility rate of 1.5, well below the 2.1 children per family needed to replace their population.

The problem is most acute in Italy, Spain, and, most important, Germany. The number of German babies born annually has dropped below the levels at the turn of the last century. Not surprisingly the U.N. expects Germany’s population to drop 9 percent by 2050. Germany may have fewer children than it did in 1900, but Spain’s total number of births has dropped well below the rates of 1858, and may match those of the 18th century.

This reflects something of a hangover from the disasters inflicted by Europeans on themselves in the last century. After decades of war and conflict, notes historian Tony Judt, Europeans simply wanted peace and quiet. In post-war Europe, every subsequent generation has been a “me generation,” focusing less on family and religion and more on material goods and financial security. Today Europe is one of the most irreligious places on the planet; there are more atheists in Germany, by some counts, than in the entire United States, a country with nearly four times as many people.

To maintain their workforces and create new consumers, European countries have by necessity made a priority of bringing in more immigrants. By 2025 Germany’s economy will need six million additional workers; this means 200,000 new migrants every year to keep its economic engine humming, according to government estimates . The situation gets worse from there, and by 2050 Germany’s overall workforce (PDF) is expected to drop 30 percent below 2010 levels, reducing it from 54 to 38 million. In the same time period the American workforce is expected grow by an additional 35 million workers.

For years, Germany and other western European countries have depended on newcomers from Turkey and other Islamic countries to drive their economy. But Islamic migration is widely believed to have failed to deliver workers with enough skills, not to mention creating ever more dire cultural and social divisions. Concerned about Islamic immigration, Germans are now relying , as they did back in the ’60s, on the diminishing pool of skilled workers from rapidly aging states such as Spain and Italy, as well as from eastern Europe. These economically beleaguered countries have become a major source of new migrants to Germany, numbering roughly one million in 2011, a 20 percent increase from the previous year.

In the process, much of southern and eastern Europe is gradually depopulating. By 2050, Bulgaria is expected to lose 27 percent of its population, while Latvia, Lithuania, and Romania are expected to lose more than 10 percent of theirs. By 2050 the populations of almost the all of Eastern Europe will fall, according to recent projections.

Then there is Europe’s rapidly aging population, a natural product of low birth rates, which also imposes enormous burdens on the region’s economy. A proposal by German Chancellor Angela Merkel would impose a one percent income tax as a “demographic reserve” to make up for rising pension costs. “We have to consider the time after 2030, when the baby boomers of the ’50s and ’60s are retired and costing us more in health and care costs,” explained Gunter Krings, who drafted the new proposal for Germany’s ruling Christian Democrats.

Ultimately the next generation will be the biggest losers in Europe’s decline. Even though birthrates are very low, those young people now entering the workforce face extraordinarily high levels of unemployment ranging 20 percent and higher in countries such as Spain, Greece and France. No surprise that Europe’s young are widely described as “the lost generation.”

Political Chaos

Europe’s current political crisis has spawned a new level of political uncertainty most clearly seen in the rise of radical new parties—such as Greece’s Syriza—on both right and left. Two forces driving this shift in political balance have been immigration and a growing grassroots rebellion, such as has emerged in Greece, over EU budget and regulatory policies. In Spain, for example, the fastest rising party, Podemos, borrows directly from Syriza’s brand of quasi-Marxist radicalism.

But most of the thunder in other parts of Europe comes from the right. Many Europeans have come to see the EU not as a great unified superstate but instead as an oppressive, unelected, despotic power. The “common European home” dreamed of by Soviet President Mikhail Gorbachev is becoming a ramshackle collection of apartments, with neighbors who increasingly don’t get along and look elsewhere for succor.

Another key driver of opposition from the right is the EU’s generally lenient view about immigration. Despite their growing dependence on immigrants, Europeans are increasingly resentful of the newcomers, particularly those from Africa and the Middle East. Some two thirds of Spaniards, Italians, and British citizens, according to an Ipsos poll, believe there are already “too many immigrants,” while majorities in Germany, Russia, and Turkey also hold negative views about newcomers in their midst.

In France the long-standing fear of losing control of national destiny has combined with growing fear over immigration, stoked by the recent terrorist incidents there. This has allowed the far right National Front’s Marine Le Pen to emerge as an unlikely front runner in the next race for president. The rise of the United Kingdom’s Independence Party stems from a similar concern about threats to Britain’s sovereignty as well as angst over immigration, particularly among working and middle class voters. Even countries such as Denmark and the Netherlands, once considered paragons of liberalism, have seen the rise of similarly minded rightist movements.

Back to Bipolarity

Buffeted by a weak economy and a welter of social ills, the aforementioned visions of Jacques Attali and American Europhiles now seem like wishful thinking, if not delusional. In reality in everything from culture and high tech to military prowess, the continent is rapidly becoming a peripheral global power at best. Only Russia, the most powerful military power and the continent’s primary source of energy, seems to have seen the light. President Putin has made this clear as he develops closer ties to China, with whom he shares an authoritarian philosophy.

Other countries on the fringe of the continent, such as Greece and Serbia, also are looking increasingly at Russia, and its emergent Chinese alliance, rather than the E.U. Chinese plans for new bullet trains to Central Asia and eastern Europe could further enhance the Middle Kingdom’s linkage to Eurasia and central Asia.

“So what about us?” Anglo-Americans (culturally if not ethnically) may ask. In a globalized world that speaks and writes in English, the Anglosphere—comprising both the U.K. and its various colonial offspring, including the United States—retains some natural advantages. This is where the most elite colleges and universities are located, and where the top financial, technology, and key business service firms are concentrated. Equally important, the Anglosphere also controls much of what the developing countries will most need in the future—food—through the unsurpassed fecundity of the United States, Canada, Australia, and New Zealand.

Demographics and a unique ability to absorb a wide range of immigrants make the Anglosphere economically and demographically more vibrant than Europe. By 2050, the Anglosphere will be home to upwards of 550 million people, the largest population grouping outside China and India. English-speakers may not straddle the world like the 19th century empire-makers, but they are likely to remain first among equals well into the current century.

Ultimately, the various countries of the world will have to choose between the Anglosphere and the Chinese-led authoritarian alliance. This will become something of a new version of the Cold War (but with China not Russia in the lead position), with each bloc seeking to win influence across the world. Anglophone India and Japan, for example, may choose the Anglosphere due to democratic traditions and a feeling of foreboding about a future forged by Chinese economic and, increasingly, military power.

On the other hand, Latin American nations like Brazil and Argentina may consider “yankee imperialism” a greater threat to their autonomy and choose instead to embrace the Middle Kingdom and its Russian ally. This may also hold true for much of Africa, where China is making deep inroads. The Chinese-led New Development Bank and its $40 billion “Marshall Plan” for infrastructure in developing countries represents a bold move to secure ever more influence in the emerging world order.

In this bipolar world forged in the context of U.S. vs China competition, Europe will likely be a bit player, wooed by both but essential to neither. In the 21st century, the road to power will not run through Paris or Berlin but through Beijing and Washington. Like the great leaders of the post-war era, American politicians and statesmen need to acknowledge the new reality of the post-European world and begin to address its implications.

This piece first appeared at The Daily Beast.

Joel Kotkin is executive editor of NewGeography.com and Roger Hobbs Distinguished Fellow in Urban Studies at Chapman University, and a member of the editorial board of the Orange County Register. He is also executive director of the Houston-based Center for Opportunity Urbanism. His newest book, The New Class Conflict is now available at Amazon and Telos Press. He is also author of The City: A Global History and The Next Hundred Million: America in 2050.  He lives in Los Angeles, CA.

The Three Faces of Populism

$
0
0

More than at any other time in recent memory, American politics now are centered on class and the declining prospects of the middle class. This is no longer just an issue for longtime leftists or Democratic or right-wing propagandists. It’s a reality so large that even the most detached and self-satisfied Republicans must acknowledge it.

The Left’s new superstar, New York City Mayor Bill de Blasio, identifies inequality as “the dominant issue in our public discourse” but similar assessments have recently been coming from such unlikely sources as GOP Senate Majority Leader Mitch McConnell, Jeb Bush and even Mitt Romney.

So, if populism will become a dominant theme in the next election, what form will it take? Populism itself is more a sentiment than a program; it reflects people’s deep-seated fears about the future and a festering resentment of the seemingly unassailable power of financial and other corporate elites.

Read the entire piece at The Orange County Register.

Joel Kotkin is executive editor of NewGeography.com and Roger Hobbs Distinguished Fellow in Urban Studies at Chapman University, and a member of the editorial board of the Orange County Register. He is also executive director of the Houston-based Center for Opportunity Urbanism. His newest book, The New Class Conflict is now available at Amazon and Telos Press. He is also author of The City: A Global History and The Next Hundred Million: America in 2050.  He lives in Los Angeles, CA.

Prairie Metropolitan Areas Drive Canada's Growth

$
0
0

In Canada, growth is moving west, but not all the way. The big growth now is in the Prairies between central Canada and British Columbia, the Canadian part of the Great Plains.

Yet you can’t talk about metropolitan Canada without first mentioning the Toronto region.

The Greater Golden Horseshoe continues to dominate Canada's population, according to the latest census metropolitan area estimates from Statistics Canada. Anchored by Toronto, the metropolitan areas of the Greater Golden Horseshoe (Hamilton, Kitchener, Oshawa, Brantford, Barrie, Peterborough St. Catherine's – Niagara and Guelph) now have a population of 8.7 million residents, 23.4% of the national total of 35.5 million.

The Major Metropolitan Areas

Canada has six major metropolitan areas (populations over 1 million) and a total of 33 (Table 1).


Table 1
Canada: Census Metropolitan Areas
Population: 2001-2011-2014
    Annual Change
Metropolitan Area2001201120142001-20112011-2014
Toronto                      4,883     5,770     6,056 1.68%1.63%
Montréal                     3,533     3,886     4,027 0.96%1.20%
Vancouver                    2,075     2,373     2,470 1.35%1.35%
Calgary                         978     1,264     1,407 2.60%3.62%
Edmonton                        962     1,206     1,328 2.28%3.27%
Ottawa          1,110     1,270     1,318 1.35%1.24%
Québec                          704        777        800 0.99%0.97%
Winnipeg                        696        746        783 0.70%1.61%
Hamilton                        689        742        765 0.75%1.01%
Kitchener-Waterloo       432        493        507 1.34%0.93%
London                          453        489        502 0.78%0.87%
Halifax                         369        402        414 0.86%0.98%
St. Catharines-Niagara       392        403        406 0.27%0.28%
Oshawa                          309        367        384 1.76%1.51%
Victoria                        326        352        359 0.78%0.62%
Windsor                         321        328        334 0.23%0.57%
Saskatoon                       231        270        301 1.58%3.62%
Regina                          197        218        238 1.00%2.98%
Sherbrooke                      184        205        212 1.07%1.18%
St. John's                      176        203        212 1.39%1.49%
Barrie                          155        193        200 2.18%1.30%
Kelowna                         154        184        191 1.76%1.38%
Abbotsford       154        174        179 1.25%0.88%
Kingston                        153        164        168 0.74%0.78%
Sudbury                 161        165        166 0.23%0.09%
Saguenay                        162        159        160 -0.18%0.16%
Trois-Rivières                  143        153        156 0.67%0.56%
Guelph                          129        146        151 1.20%1.20%
Moncton                         122        140        146 1.38%1.37%
Brantford                       129        139        143 0.82%0.87%
Saint John                      126        129        127 0.20%-0.34%
Thunder Bay                     127        125        125 -0.14%0.04%
Peterborough                    115        122        123 0.58%0.29%
Metropolitan Areas  20,851   23,759   24,859 1.31%1.52%
Outside Metropolitan Areas  10,172   10,586   10,684 0.40%0.31%
Canada  31,023   34,345   35,542 1.02%1.15%
In thousands
Source: Statistics Canada


Toronto remains the largest metropolitan area in the nation, at 6.1 million residents. The population has increased nearly 1.2 million since 2001, 300,000 of it in since the census year of 2011. In the past half-century, Toronto has steadily increased its share of Canada's population. In 1961, 11 percent of the nation's residents were in the Toronto metropolitan area. By 2014, 17 percent of the population was in Toronto. Toronto's has built a margin of 2.0 million over second-ranked Montréal, an expansion of more than one half just since 2001. Montréal had been the largest metropolitan area in Canada until 1976.

Montréal continues to be Canada's second largest metropolitan area, at 4.1 million. Montréal's annual growth rate was higher between 2011 and 2014 than in the previous 10 years, though is still growing at less than the national average. 

Vancouver is Canada's third largest metropolitan area. In the second half of the 20th century, Vancouver grew at a rate considerably greater than that of the nation as a whole. However over the last three years, Vancouver's has grown at a rate less than that of Canada as a whole. Vancouver is nearing a population of 2.5 million, which it should achieve in 2015.

Among Canada's major metropolitan areas (over 1 million residents), Calgary is the fastest-growing. Calgary has reached a population of 1.4 million and is growing at 2.5 times the national rate (3.62 percent annually).Since 2001, Calgary has added more than 400,000 residents. Calgary's growth rate has been spectacular. In 1951, Calgary had fewer than 150,000 residents, but has since grown into a major center specializing in energy. Calgary has the distinction of having built by far the largest post-World War II downtown area in either Canada or the United States (see photograph at the top of the article).

Edmonton has grown almost as quickly. From a population of under 200,000 in 1951, Edmonton has grown to more than 1.3 million. Edmonton's annual growth rate since 2011 has been 3.27% and has added more than 360,000 residents since 2001.

Ottawa, the national capital (see photo below), stretches across the Ontario-Québec border, with Gatineau the largest municipality on the Quebec side. In 2011, Ottawa had been the fourth largest metropolitan area since 1941, but has been passed by both Calgary and Edmonton since 2011.


Photo: Centre Block, Parliament Hill, Ottawa

Moving to the Prairies?

The population estimates of the last three years indicate considerable growth in the Prairie metropolitan areas relative to the rest of the nation. The Prairies provinces are include Alberta, Manitoba and Saskatchewan (Table 2).


Table 2
Canada: Census Metropolitan Areas by Region
Population: 2001-2011-2014
    Annual Change
Region2001201120142001-20112011-2014
Atlantic Provinces       794        874        900 0.96%0.97%
Québec                       4,997     5,498     5,683 0.96%1.11%
Ontario    8,587     9,830   10,231 1.36%1.34%
Prairie Provinces    3,765     4,474     4,846 1.74%2.70%
British Columbia    2,708     3,083     3,199 1.30%1.24%
Metropolitan Areas  20,851   23,759   24,859 1.31%1.52%
In thousands
Source: Statistics Canada


Calgary and Edmonton have experienced strong growth for decades. The same was not true of Saskatchewan's two largest cities, Saskatoon and Regina. After years of near population stagnation, both metropolitan areas, and the province added population at an accelerated rate. Saskatchewan's growth pattern has paralleled that of North Dakota, which has shared the energy boom and experienced unprecedented growth after decades of stagnation.

Saskatoon's annual growth rate tied with that of Calgary, at 3.62%. This is more than double the 2001 to 2011 growth rate. Regina nearly tripled its annual growth rate from 1.00% between 2001 and 2011 to 2.98% between 2011 and 2014.

But perhaps the biggest surprise was Winnipeg. Winnipeg was for many years Canada's fourth largest metropolitan area, a title it relinquished to Ottawa in the 1960s. By 2001, Winnipeg had fallen to eighth place, its population exceeded by not only Calgary and Edmonton, but also Quebec City. However, in a major turnaround, Winnipeg's annual growth rate has more than doubled since 2011.

The strength of the Prairies is evident in the regional data (Table 2). The metropolitan areas in the Prairie Provinces grew at more than double the rate achieved by the metropolitan areas in the other regions of Canada between 2011 and 2014.

The metropolitan areas in all of the four other regions of Canada grew at rates below that of the nation as a whole between 2011 and 2014. The slowest growth was in the Atlantic Provinces (New Brunswick, Newfoundland, Nova Scotia and Prince Edward Island). The annual growth rate of Québec's metropolitan areas was the second lowest. However growth edged up in Québec's metropolitan areas. Ontario and British Columbia had grown an approximately the national metropolitan area rate between 2001 and 2011. However, both provinces saw their metropolitan growth fall below the national rate in the last three years.

The Prairies are likely to experience a reduction in their population growth rate as a result of lower oil and commodity prices. It is an open question how long the lower prices will prevail. The proximate cause of the lower prices is OPEC's relaxed rationing of its supply to the world. That could change by political whim at virtually any time, or due to disruptions in the Middle East or West Africa, sending prices higher.

Meanwhile, non-metropolitan Canada continues its very slow growth, which now stands at one-third that of the nation and one-fifth that of the metropolitan areas.

Wendell Cox is principal of Demographia, an international public policy and demographics firm. He is co-author of the "Demographia International Housing Affordability Survey" and author of "Demographia World Urban Areas" and "War on the Dream: How Anti-Sprawl Policy Threatens the Quality of Life." He was appointed to three terms on the Los Angeles County Transportation Commission, where he served with the leading city and county leadership as the only non-elected member. He was appointed to the Amtrak Reform Council to fill the unexpired term of Governor Christine Todd Whitman and has served as a visiting professor at the Conservatoire National des Arts et Metiers, a national university in Paris.

Top Photo: Downtown Calgary (by author)

Corrupt Illinois: Not A Few Bad Apples

$
0
0

Despite a huge advantage in name recognition, massively more money, and a lift from President Obama, Rahm Emanuel failed to avoid a run-off today. It seems many Chicago residents are beginning to realize that our present system – and leaders – are leading us off a precipice.

In the adopted home of a President and the most fabled political machine in the country, the issue here is the factors that drive political decisions. It is increasingly clear that the old political science sense that politicians are less self-interested than regular people – suckers, taxpayers – is dead wrong.  Many American political scientists will claim with enormous conviction that those engaged in the marketplace are more self-interested than those involved in the political process. We scholars and the mainstream media constantly complain about market failure; much less attention is paid to political failure.

Not all academics studying politics have been so naïve about the political process. Over 100 year ago FDR’s influential progressive advisor Federic C. Howe, in his long forgotten book, Confessions of a Monopolist explained the essence of politics:

This is the story of something for nothing—of making the other fellow pay. This making the other fellow pay, of getting something for nothing, explains the lust for franchises, mining rights, tariff privileges, railway control, tax evasions. All these things mean monopoly, and all monopoly is bottomed on legislation.

Seeking special privileges, Howe reasoned, leads to corruption. By the 1960s this notion was explored by economists Gordon Tullock and Anne Krueger, who developed the concept of “rent-seeking.” They saw how politics represents often merely an investment towards plundering the taxpayers for private gain.

Now we have a modern day examination of this phenomena, particularly in the crony capital of the world, Illinois. Political scholars Thomas Gradel and Dick Simpson have written a path breaking  book from The University of Illinois Press on corruption in the state of Illinois. This book is the most comprehensive survey of corruption in the state of Illinois ever published. The lessons here are useful well beyond Illinois. You’ll never understand, for example, Barack Obama’s political career unless you read this book. Gradel and Simpson also remind us that Chicago isn’t the only corrupt place in Illinois.  The corrupt politicians, judges, police, and government bureaucrats are catalogued here and backed by empirical evidence.

Illinois’ biggest town was corrupt from the start. Even the incorporation vote to start Chicago was fraudulently conducted. Chicago’s City Council is the epitome of the place’s corruption. Gradel and Simpson present the evidence:

Thirty-three Chicago aldermen and former aldermen have been convicted and gone to jail since 1973. Two others died before they could be tried. Since 1928 there have been only fifty aldermen serving in the council at any one time. Fewer than two hundred men and women have served in the Chicago city council since the 1970’s, so the federal crime rate in the council chamber is higher than in the most dangerous ghetto in the city.

Those Chicago Aldermen who went on to commit crimes represent all elements of society. White, black, college graduates, rich, poor, felonies on the job, felonies off the job, and more. But, Chicago’s city council isn’t the only corrupt place. Chicago’s police department has faced its’ share of negative publicity:

Since 1960, more than three hundred Chicago police officers have been convicted of serious crimes, such as drug dealing, beating civilians, destroying evidence, protecting mobsters, theft, and murder. However, this doesn’t include all the illegal and unethical activities that have gone undetected or were covered up internally by the police department.

The Emanuel administration still has to deal with police behavior from decades ago. Commander Jon Burge, Chicago’s most infamous police torturer, has already cost the city $120 million in settlements and legal fees with the meter still running.  William Hanhardt, who was elevated to Chief of Detectives after joining the police force in 1953, rose through the ranks to be the Chicago Mob’s most important asset on the force.  He was eventually indicted for running a nationwide jewelry theft ring. This was not any ordinary theft ring. As U.S. Attorney Scott Lassar clearly stated: "Hanhardt’s organization surpasses in duration and sophistication -just about any other jewelry theft ring we've seen in federal law enforcement."  Chicago’s City Council never held hearings on who Hanhardt promoted in his long career and the long racketeering enterprise he ran.

Gradel and Simpson also gives us a unique look at the early career of Barack Obama.  This isn’t the fantasy land Barack Obama of  apologist David Maraness, or Jonathan Alter (whose mother was the first woman to be slated for Cook County office by Mayor Richard J. Daley)  concocts.  

The big question: Was Barack separate from the ethical swamp of Illinois politics?    Obama was a foot soldier of the Daley machine when Congressman Bobby Rush had the nerve to run against Mayor Richard M. Daley in 1999, Daley needed to send Congressman Rush a message.  The Daley operation “encouraged” Illinois State Senator Barack Obama to challenge Congressman Bobby Rush. Obama lost, but won the loyalty of Mayor Daley.  The Chicago machine pushed Obama for the Illinois State Senate, the U.S. Senate, and then the Presidency.  Barack Obama was there when the chips were down.  As one Obama observer explained, he endorsed Daley last time in 2007 despite the corruption and the many civil rights violations. Daley, for his part, backed Obama in his successful run for the white House.

President Obama previously taught civil rights classes at one the country’s most prestigious law schools, the University of Chicago. Given President Obama’s civil rights knowledge as a law school professor,  President Obama’s 2007 endorsement of Daley for mayor remains even more perplexing. Recent revelations about a Chicago police “black site” – much along the lines of CIA interrogation centers --- seem to have done little to change his embrace of the machine.

Clearly the cord to the machine has hardly been cut. Just look at who President Obama hired as top staff members. Daley fundraiser Rahm Emanuel served as Chief of Staff. Mayor Daley’s brother William followed him as Chief of Staff.  Another powerful figure is Mayor Daley’s deputy Chief of Staff, Valerie Jarret. The head of the less than successful Chicago Public School system, Arne Duncan, got promoted Secretary of Education. Chicago machine donor and housing fraudster Penny Pritzker got appointed to Secretary of Commerce.  

But don’t rely just on me. Read Thomas Gradel and Dick Simpson— you may realize the price we all, not just in Chicago or Illinois pay, for not confronting the culture of corruption.

Steve Bartin is a resident of Cook County and native who blogs regularly about urban affairs. He works in Internet sales.

Official White House Photo by Pete Souza.


What’s This Place For?

$
0
0

I was recently asked by Gracen Johnson (check out her site here) to elaborate on the possible future of suburbia. How are the suburbs likely to fare over time? This coincided with a city planner friend of mine who asked a more poignant question about the suburban community he helps manage. “What’s this place for?” If we can answer that question we might be able to get a handle on the possible trajectories of various suburbs.

unnamed-2 unnamed-1 unnamed-5 unnamed-3

For example, we all understand what a farm town is for. Small rural towns produce food. The people who live in the countryside are actively engaged in the business of feeding society. They take soil, water, plants and animals and convert it all into breakfast, lunch and dinner. For the people who want to live this way there are tremendous benefits: fresh air, open space, privacy, independence, a direct connection to nature, strong family bonds, tradition, and so on. Whatever else we might say about farm country we can be certain that it will carry on one way or another or else civilization will grind to a halt pretty quickly.

IMG_0126 (800x533) IMG_0085 (800x533) IMG_0093 (800x533)

We also know what industrial cities are for. They take the raw materials from the surrounding countryside and transform them into finished goods. Grain becomes flour and bread. Timber becomes lumber, then homes and furniture. Iron ore and coal become machinery and power. Crude oil becomes gasoline, petrochemicals, and plastics. There are obvious trade offs for industrial workers, but for many people it’s a pretty good arrangement. If we expect to have manufactured goods in the future these cities will have to continue somehow.

Screen Shot 2015-01-31 at 6.49.37 AM Screen Shot 2015-01-31 at 6.54.26 AM Screen Shot 2015-01-31 at 6.56.05 AM Screen Shot 2015-01-31 at 6.55.40 AM

The new post-industrial locus is a bit trickier to pin down. The service economy doesn’t actually produce any “thing” so the workforce is liberated to live just about anywhere in a way that farmers and factory workers can’t. Oddly, well educated highly paid people don’t actually spread out and inhabit a million cabins in the woods as you might expect. Instead they clump up in a handful of regions that provide abundant cultural amenities. At the same time the post-industrial economy exists in a physical world and all those people and electronic components rely on the underlaying farms, factories, and raw resources that support them. The so-called dematerialization of the economy still requires a serious amount of real “stuff” to function.

Screen Shot 2015-01-29 at 6.18.31 AM Screen Shot 2015-01-29 at 6.05.55 AM Screen Shot 2015-01-29 at 6.06.18 AM

So what does this all mean for the suburbs? The nature of suburbia has always been consumptive rather than productive. People move to the suburbs in order to purchase and enjoy things: a spacious home, a good school district, security, a clean environment, more respectable neighbors, and so on. The majority of the commercial activity is actually in service to suburbia itself. The mortgage brokers, insurers, real estate agents, landscapers, school teachers, firefighters, orthodontists, pancake houses, and auto body shops are all there to help keep the suburbs humming along. But they’re all consumptive in nature. No one is making the tennis shoes sold at the mall or growing the oranges at the supermarket. This is compounded by the fact that the suburbs are maintained largely through debt. Private debt is required for all the mortgages, car loans, credit cards, student loans, and business loans while municipal bonds prop up many essential suburban government functions. The fact that many people don’t understand the difference between production and consumption is one of the big problems the suburbs are going to have to sort out in the future.


Screen Shot 2015-01-28 at 9.22.31 PM Screen Shot 2015-02-03 at 2.12.50 AM

I’m going to get a lot of push back on this concept. I’m sure many of you think that your suburb is full of productive enterprises: the Krispy Kreme, the Jiffy Lube, the dozen Shell and Exxon stations, the Applebee’s, the Foot Locker, the Honda dealership, and the Kroger’s. But these are merely outlets for things that were produced elsewhere. Let me offer another example from my own life. I spent a chunk of my childhood in the San Fernando Valley in Los Angeles. Back in the 1960’s and 1970’s nearly everyone had some connection to companies like Rocketdyne, Litton, and General Dynamics. Those were the engines of the local economy for decades. And they did in fact produce real physical things. But they were all funded entirely by the federal government. Tax money was skimmed off the national productive economy (all those farms and factories) and then spent on missile guidance systems, satellites, and fighter jets. The same was true in Huntsville, Alabama and Marietta, Georgia. Remember what happened to all those places when the feds turn off the spigot during budget cuts? Money flowed in, not out. There’s a reason Peru doesn’t have a space program. The underlying national economy isn’t productive enough to support such extravagant government spending.

As the material abundance we enjoyed in the Twentieth Century tightens up suburbs will have to become much more efficient places that provide things the outside world needs and is willing to pay for. At the same time internal consumption and debt are going to have to be pulled back. That doesn’t necessarily mean a lower quality of life, but it does demand that suburbs retool and ask themselves, “What’s this place for?”

John Sanphillippo lives in San Francisco and blogs about urbanism, adaptation, and resilience at granolashotgun.com. He's a member of the Congress for New Urbanism, films videos for faircompanies.com, and is a regular contributor to Strongtowns.org. He earns his living by buying, renovating, and renting undervalued properties in places that have good long term prospects. He is a graduate of Rutgers University.

Misunderstanding the Millennials

$
0
0

The millennial generation has had much to endure – a still-poor job market, high housing prices and a generally sour political atmosphere. But perhaps the final indignity has been the tendency for millennials to be spoken for by older generations, notably, well-placed boomers, who often seem to impose their own ideological fantasies, without actually finding out what the younger cohort really wants. The reality, in this case, turns out far different than what is bespoken by others.

Nowhere is this tendency clearer than in the perception of what kind of life – and what places – will millennials find attractive. Generally, the narrative goes like this: Millennials are different, they don’t care about owning homes, detest the suburbs and would prefer to spend their lives in dense apartment blocks, riding the rails or buses to whatever work they might be able to find.

Urban theorists, such as Peter Katz, insist that millennials (the generation born after 1983) have little interest in “returning to the cul-de-sacs of their teenage years.” Manhattanite Leigh Gallagher, author of “The Death of Suburbs,” asserts with certitude that “millennials hate the suburbs” and prefer more eco-friendly, singleton-dominated urban environments.

Such assessments thrill the likes of real estate speculators, such as Sam Zell, who welcomes “reurbanization” as an opportunity to cash in by housing a generation of Peter Pans in high-cost, tiny spaces unfit for couples and unthinkable for families. Others of a less-capitalistic mindset see in millennials a post-material generation, not buying homes and cars and, perhaps, not establishing families. Millennials, for example, are portrayed by the green magazine Gris as “a hero generation” – one that will march, willingly, even enthusiastically, to a downscaled and, theoretically, greener future.

Read the entire piece at The Orange County Register.

Joel Kotkin is executive editor of NewGeography.com and Roger Hobbs Distinguished Fellow in Urban Studies at Chapman University, and a member of the editorial board of the Orange County Register. He is also executive director of the Houston-based Center for Opportunity Urbanism. His newest book, The New Class Conflict is now available at Amazon and Telos Press. He is also author of The City: A Global History and The Next Hundred Million: America in 2050.  He lives in Los Angeles, CA.

New home photo by BigStockPhoto.com.

The Changing Geography Of Education, Income Growth And Poverty In America

$
0
0

In this column, we often rate metropolitan areas for their performance over one year, five or at most 10. But measuring economic and social progress often requires a longer lens, spanning decades.

Nowhere is this clearer than in education, which many claim is the key to higher-wage economic growth. Yet there are two sets of numbers that need to be distinguished: those states with the highest percentage of educated workers and the states that have increased their numbers most rapidly.

On one side, the share of the population that is educated, states’ relative standings remain fairly similar to the way they were in 1970. Colorado, California, Connecticut, New Hampshire, New Jersey, Maryland and Virginia are all still above the national average for the percentage of the population over 25 with a bachelor’s degree, which has risen from 10.7% in 1970 to 29.6% in 2013. Massachusetts leads the nation with a remarkable 40.3% of its adult population having graduated from a four-year college. Overall, the “brainiest states” remain well ahead of their competitors in percentage terms.

But in terms of growth in the raw numbers of educated people, most of these states have lagged. Indeed their high concentrations of college graduates may reflect their slow population growth, or the lack of opportunities for people without a bachelor’s degree.

Educating The Sun Belt

The states whose populations of college grads have grown the most are almost all in the South and the Sun Belt, led by Nevada with a 1,292% increase from 1970 to 2012 in the number of residents with four years of college or more, followed by Arizona (861%), Florida (743%) and Georgia (699%).

Although they mostly still lag the best educated states, their large additions of educated workers appears to be transforming these former backwaters into centers of advanced industry and commerce. Since 1970, Texas has increased its population of college graduates by 555% while North Carolina’s surged 659%; in contrast, New York’s educated workforce expanded by 247% and Massachusetts’ by 341%, lagging the national average of 397% growth. California, whose economy grew rapidly through this period, was a shade above that with a 402% expansion in its population of college grads.

The dichotomy is also pronounced when looking at the growth in the population of those with three years of college or more, including community college and certificate programs. Since 1970, for example, South Carolina expanded its population of such people by 746% and Texas by 592%; in contrast Massachusetts’ ranks of “some college” grew by 213% and California’s by 304%. Much of the growth among the leading states was tied to rapid overall population growth due to in-migration, particularly in states like Arizona and Nevada, which was accompanied by relatively rapid job growth.

Brain Centers And Slower Growth

The most educated states by percentage of college graduates are on the East Coast — Massachusetts, Connecticut, Maryland, Virginia, New Jersey — with the exception of Colorado. Many of these states also boasted among of the highest concentrations of college grads in 1970 (Colorado ranked first then with a 14.9% concentration). But with the exception of Virginia, since then the growth in the raw number of educated workers in these states has come at a slower rate than the Sun Belt states, amid their rapid population expansion. For example, since 1970 Connecticut’s population of college grads grew 282%, the fourth lowest rate in the nation and roughly half that of Texas’.

Some might think that states with a higher proportion of educated workers would do better at creating new jobs. But since 1991, according to the Bureau of Labor Statistics, employment in both Massachusetts and New York has grown at 0.4% annual rate, and 0.8% in California. In contrast, Arizona’s annual job growth averaged 2.4% and Texas 2%.

This suggests that having a high percentage of educated people is not enough to grow a jobs-rich economy, particularly if, as Robert Reich suggests, the demand for educated workers in the U.S. has dropped since 2000. It might seem tautological, but expanding economies  attract new educated workers.

The Changing Face Of Poverty

In 1959, the South was the poorest region in the country, with a poverty rate of 35.6%. By 1979, in the wake of the federal War on Poverty and strong economic growth, the poverty rate in the South had fallen by more than half, to 15.3%; by then, New York and Texas had roughly comparable poverty rates. (Note that I am not suggesting a linkage to the education trends discussed above, which mostly cover a later period.)

The shift in the geography of poverty was underlined a few years ago when the Census released a new estimation of how to track it, the Supplemental Poverty Measure. (It takes into account the cost of a broader range of necessities than the standard measure, which is limited to food. It factors in geographic differences in housing costs, adds noncash benefits like nutrition assistance and housing subsidies to families’ incomes and subtracts taxes, child support payments and out of pocket medical expenses). The SPM placed 2 million more Americans below the poverty line as of 2012 than the standard measure; it dropped the poverty rate for those living in rural areas and raised it for those in metro areas and heavily urbanized states like California and New York. For the years 2010-12, California’s poverty rate jumps from slightly above average by the standard measure (16.5%) to the highest in the nation under the SPM (23.8%), followed by the District of Columbia (22.7%). Longtime laggard Mississippi, which ranks second worst in the country under the standard measure at 20.7%, falls back to the national average of 16% under the SPM, better than New York at 18.1%.

Long-term income growth statistics over the same timespan as our education data also tell an interesting story. U.S. per capita incomes have risen 77% in inflation adjusted dollars from 1970 to 2013, according to the U.S. Bureau of Economic Analysis. The leader has been North Dakota, with a 160.4% jump to $53,182. Much of it seems tied to the energy boom – incomes have jumped 51% alone since 2000 — but it’s more than that. Its neighbor South Dakota, where oil production is much less important, ranks third in per capita growth over that span at 125.9%, as it built up a powerhouse financial services industry by loosening regulations

Many of the regions where growth exceeded the national average have historically had low incomes. The former Confederacy accounts for eight of the top 20: Louisiana, Arkansas, Mississippi, Tennessee, Alabama, Virginia, Texas and North Carolina. (All still lag the national average income of $44,765, though, with the exception of Virginia). The Plains and Intermountain states account for another six (North Dakota, South Dakota, Wyoming, Minnesota, Oklahoma). The other big regional winner has been New England, with five of the top 20: New Hampshire, Vermont, Connecticut, Massachussetts and Maine. Washington, D.C., ranks 2nd, with growth of 129.4% to a nation-leading $75,329, showing us once again that our rulers treat themselves well.

Among the laggards is California, where per capita income grew 62.4%, well below the national average. Several other Sun Belt “boom states” that rank highly on our list of states that have expanded their educated populations the fastest have done poorly in terms of income growth, including, Florida (41st), Arizona (48th), and in last place, Nevada. One complicating factor is that these states have a large proportion of people who earned their income in other, colder parts of the country. Not surprisingly, several of the laggards are in the Rust Belt, including Indiana (40th), Ohio (42nd), and Michigan (47th).

The Future

Clearly the economic and educational map of America is changing. There’s a movement of educated people — critical to many industries — to formerly backwater states. Over time jobs, too, are following this path.

In the years ahead we can expect these trends to continue, or even accelerate. There is little reason to believe that states like California or New York are going to re-industrialize or reform their planning systems to help reduce housing prices. They will remain increasingly bifurcated between a very well-educated, affluent population clustered around the most elite industries and an underclass of poor, undereducated people. California, for example, ranks 14th in percentage of college graduates, down from 7th in 1970 but in terms of high school non-graduates it has soared from 44th to 2nd.

This bifurcation doesn’t bode well for these places. People will continue to move to those places where young educated people are now going, notably in the South, the Great Plains, the Intermountain West, and, to some extent, parts of the Pacific Northwest.

Forty years from now America will have many more centers of educational and economic excellence spread across the continent. This may involve a decline in the relative power of some regions, notably California, the Rust Belt and the Middle Atlantic States, but the rise of educated workers and employment elsewhere could help the country retain its competitiveness on an increasingly continental scale.

The Biggest Brain Gain States Since 1970

No. 1: Nevada

Increase In Population Of College Grads, 1970-2013: 1,292%

Pct. Of Adult Population With College Degree, 1970: 10.8%

Pct. Of Adult Population With College Degree, 2013: 22.5%

No. 2: Arizona

Increase In Population Of College Grads: 861% 

Pct. Of Population With College Degree, 1970: 12.6% 

Pct. Of Population With College Degree, 2013: 27.4%

No. 3: Florida

Increase In Population Of College Grads: 743% 

Pct. Of Population With College Degree, 1970: 10.3% 

Pct. Of Population With College Degree, 2013: 27.2%

No. 4: Georgia

Increase In Population Of College Grads: 699%

Pct. Of Population With College Degree, 1970: 9.2%

Pct. Of Population With College Degree, 2013: 28.3%

No. 5: North Carolina

Increase In Population Of College Grads: 659% 

Pct. Of Population With College Degree, 1970: 8.5% 

Pct. Of Population With College Degree, 2013: 28.4%

No. 6: Colorado

Increase In Population Of College Grads: 617% 

Pct. Of Population With College Degree, 1970: 14.9% 

Pct. Of Population With College Degree, 2013: 37.8%

No. 7: New Hampshire

Increase In Population Of College Grads: 603% 

Pct. Of Population With College Degree, 1970: 10.9% 

Pct. Of Population With College Degree, 2013: 34.6%

No. 8: Utah

Increase In Population Of College Grads: 585% 

Pct. Of Population With College Degree, 1970: 31.3% 

Pct. Of Population With College Degree, 2013: 14.0%

No. 9: Idaho

Increase In Population Of College Grads: 563% 

Pct. Of Population With College Degree, 1970: 10.0% 

Pct. Of Population With College Degree, 2013: 26.2%

No. 10: South Carolina

Increase In Population Of College Grads: 556% 

Pct. Of Population With College Degree, 1970: 9.0%

Pct. Of Population With College Degree, 2013: 26.1%

No. 11: Texas

Increase In Population Of College Grads: 555% 

Pct. Of Population With College Degree, 1970: 10.9%

Pct. Of Population With College Degree, 2013: 27.5%

No. 12: Alaska

Increase In Population Of College Grads: 544% 

Pct. Of Population With College Degree, 1970: 14.1%

Pct. Of Population With College Degree, 2013: 28.0%

No. 13: Virgina

Increase In Population Of College Grads: 517% 

Pct. Of Population With College Degree, 1970: 12.3%

Pct. Of Population With College Degree, 2013: 36.1%

No. 14: Washington

Increase In Population Of College Grads: 513% 

Pct. Of Population With College Degree, 1970: 12.7%

Pct. Of Population With College Degree, 2013: 32.7%

No. 15: Tennessee

Increase In Population Of College Grads: 495%

Pct. Of Population With College Degree, 1970: 7.9%

Pct. Of Population With College Degree, 2013: 24.8%

Joel Kotkin is executive editor of NewGeography.com and Roger Hobbs Distinguished Fellow in Urban Studies at Chapman University, and a member of the editorial board of the Orange County Register. He is also executive director of the Houston-based Center for Opportunity Urbanism. His newest book, The New Class Conflict is now available at Amazon and Telos Press. He is also author of The City: A Global History and The Next Hundred Million: America in 2050.  He lives in Los Angeles, CA.

Photo: 1980s-era Reno, Nevada. Public domain.

Urban Core Millennials? A Matter of Perspective

$
0
0

Yes, millennials are moving to the urban cores but not in significant numbers when view from the context of larger city (metropolitan area) trends. That's the updated story, based on new small area data that approximates the year 2011 (Note: ACS 5-Year Data).

Small area trends are important to understanding developments in metropolitan areas, because conventional municipal jurisdiction based analysis obscures the extent of large suburban areas within the boundaries of most core municipalities. In 2010, approximately 58% of the population in core municipalities lived in small areas that were essentially suburban, with much lower population densities than areas that developed before World War II, and where nearly all motorized travel is by car.

Even worse, "principal cities," have been equated to core municipalities in some analyses, despite their overwhelming suburban, single family nature, such as Staten Island in New York to the broad expanses of Phoenix, Denver, and Portland. Excepting the core municipalities, the principal cities designated since 2000 are polycentric business centers, the metropolitan area criteria adopted by the Office of Management and Budget (OMB). Marking the transition of American cities from being monocentric to polycentric, principal cities are 92% suburban and exurban.

This analysis uses my City Sector Model, which classifies small areas (ZIP codes, more formally, ZIP Code Tabulation Areas, or ZCTAs) in metropolitan areas in the nation based upon their function as urban cores, suburbs, or exurbs. The criteria used are generally employment and population densities and the extent of transit use versus car use. The purpose of the urban core sectors is to replicate, to the best extent possible, the urban form as it existed before World War II, when urban densities were much higher and a far larger percentage of urban travel was on transit. The suburban and exurban sectors replicate automobile-oriented suburbanization that began in the 1920s and escalated strongly following World War II.

A recent revision to the model divided the urban core into two classifications, the downtown or central business district ("CBD") and the "inner ring." The CBD is the locus of the most important urban revitalization in the core municipalities, while the inner ring includes the remaining part of the urban core that resembles the outlying parts of the pre-World War II city in its travel patterns and population densities (the City Sector Model criteria are described in the note below).

The Anecdotal Evidence

Seemingly endless stories are covered in both the print and electronic media describing how younger adults have been attracted to the urban core. Press organs like The New York Times and the Los Angeles Times can readily send their reporters to nearby cafes, bars, and restaurants. Much rarer are the anecdotes from the suburban strip malls and even a "Starbucks" on Long Island, Sugarland, outside Houston, or in the San Fernando Valley. But data, not anecdotes, are the most reliable indicators of actual trends.  

From Anecdotes to Data

The new data reinforces the reality that the story of millennials in the urban core is more nuanced than often suggested. This analysis compares population data for younger adults in the age range of 20 to 29 years old.

Data: The Urban Core

The "good news" relates to part of the city, the urban core. Millennials are concentrating to a greater degree than before in the urban core. Millennials have a larger share of the total population in the CBD then in any of the other for city sectors. In 2011, millennials represented 24.4% of the CBD population. By comparison, millennials are a much smaller 14.1% of the overall metropolitan population and the share in the exurbs is only 12.1%, less than one half that in the CBD. The associated inner ring has the second highest millennial component, at 18.1%, well above the shares in the outer sectors. Further, the millennial composition of the CBD increased between 2000 and 2011 from 22.4% to 24.4%. The inner ring millennial composition also increased, from 17.0% to 18.1% (Figure 1).

So there is no question that the urban core millennial population is increasing beyond the general population increase.

Data: City-Wide

The other, often neglected, reality is that the gains in the urban cores are small compared to overall city (urban area or metropolitan area) trends. And millennial urban core gains may well have reached a peak, as has been suggested by Trulia’s Jed Kolko. Over the last year the millennial population in the CBDs has dropped a modest 25,000 (an amount that is probably within the margin of error, since all of these data are from surveys).

Only 2.3% of millennials lived in the CBDs in the most recent year for which there is data (2011). This is up, but only from 2.2% in 2000. That gain was offset by a troubling loss in the inner core from 18.6% to 17.5%. The millennial share increases were all in the suburbs and exurbs (Figure 2).

In numbers, the population aged 20 to 29 increased in the suburbs 20 times that of the CBD and the increase in the exurbs was nearly 9 times as high. Altogether, more than 90% of this cohort’s growth took place outside the urban core in the major metropolitan areas (Figure 3). Overall, the millennial gains in the CBD were approximately 80,000, while the gains in the inner ring were approximately 240,000. By contrast, the millennial gains in the suburbs and exurbs amounted to more than 2.75 million (Figure 4).  

A Matter of Perspective

The story on millennials is simply a matter of perspective. Those most interested in the small but influential urban core, depict a rising tide of millennials, with some justification. Those most interested in all the entire metropolitan area, are compelled by the overwhelming numbers to recognize that the story of millennials in the urban core is less significant in the larger context. But we are far from, and may well never achieve, a return to the imminent "Nirvana" of restoring pre-World War II cities or even a substantially smaller role for cars, which continue to drive the urban form in much of the world.

Continued progress in the urban cores does not depend upon the "death" or decline of the suburbs. If cities are to best perform their crucial role of providing better standards of living and enabling lower poverty rates, they could boost prosperity throughout the city from the urban core through the suburbs to the exurbs.

Note: ACS 5 Year Data: The data were collected by the American Community Survey of the US Census Bureau from 2009 to 2013. One fifth of the survey is completed each year, and therefore the data most closely approximates the middle of the period,  2011.

Note: City Sector Model Criteria: This article continues a series examining the 52 major metropolitan areas (those with more than 1,000,000 residents) using the City Sector Model, which allows a more representative functional analysis of urban core, suburban, and exurban areas, by using smaller areas, rather than using municipal boundaries. The City Sector Model thus eliminates the over-statement of urban core data that occurs in conventional analyses, which rely on historical core municipalities, most of which encompass considerable suburbanization.

The City Sector Model classifies 9,000 major metropolitan area zip code tabulation areas using urban form, density, and travel behavior characteristics. There are five functional classifications: the CBD, the inner ring, all will earlier suburbs, later suburbs, and exurban areas.

The general criteria is as follows: The CBDs include any small area with an employment density of 20,000 or more per square mile. The inner ring has lower employment density, with high residential densities, older housing and substantially greater reliance on transit. The CBD and inner ring together form the urban core, which resembles the population density and travel patterns of the pre-World War II city. The suburbs constitute the balance of the built-up urban areas and the exurbs are beyond the built-up urban areas.

The revised City Sector Model criteria are illustrated in the Figure: "City Sector Model Criteria: 2015," below.

Wendell Cox is principal of Demographia, an international public policy and demographics firm. He is co-author of the "Demographia International Housing Affordability Survey" and author of "Demographia World Urban Areas" and "War on the Dream: How Anti-Sprawl Policy Threatens the Quality of Life." He was appointed to three terms on the Los Angeles County Transportation Commission, where he served with the leading city and county leadership as the only non-elected member. He was appointed to the Amtrak Reform Council to fill the unexpired term of Governor Christine Todd Whitman and has served as a visiting professor at the Conservatoire National des Arts et Metiers, a national university in Paris.

Photo:  The revitalizing CBD of St. Louis (by author)

High Density Housing's Biggest Myth

$
0
0

Advocates of higher density housing development in Australia’s major cities – inner city areas in particular - are fond of pointing to a range of statistics as evidence of rising demand. Dwelling approvals, dwelling commencements, tower crane counts and various other sources, both reputable and dodgy, are referenced and then highly leveraged to support claims that our housing preferences have fundamentally changed in favour of high density apartments. But what’s the one inescapable fact that these advocates are missing?

“Higher density living on the rise” is typical of the light weight PR puffery that passes for market analysis these days.  This piece is typical of the boosterism: 

“Since 2008/09 multi-unit housings’ share of dwelling approvals in Queensland has jumped from 31% to 46%. Much of the increase can be attributed to an increase in approvals for high-rise apartments, with the sector’s share of dwelling approvals doubling between 2008/09 and 2013/14, from about 12% to approximately 24%.” So far, correct.

But it goes on to draw this unjustified but widely supported conclusion: “the popularity of apartment living in the larger capital cities had been driven by a number of factors including decreasing housing affordability and the changing lifestyle of baby boomers and young professionals.”

Or how about this piece of PR chasing nonsense pumped out by a bank no less: “Australians are favouring smaller, more affordable homes, with approvals for the construction of flats, townhouses and semi-detached houses nearing their highest level in 20 years.”

What’s wrong with these conclusions? Simply this: rising dwelling starts for apartments in inner city areas do not necessarily reflect ‘changing lifestyles’ or any ‘popularity’ for this product by home buyers. What it does reflect is a (so far) ravenous investor appetite for the product. This is entirely different to an owner occupier appetite. If owner occupiers were buying these apartments in large numbers, you could then conclude that inner city apartment living was becoming more and more popular. But speculative investors have no intention of living in the product they’re buying.

Owner occupiers in the main aren’t looking for tiny one or two bedroom units. Some developers have targeted the owner occupier unit market, and their designs feature more three and even four bedroom units, spacious in design and with features designed for living in as adults or families. The price points are vastly different. This is so far a niche market which is performing strongly, but it’s completely different to the cookie-cutter apartment stock which is driving the stats.

What is happening in Australia now, and which is being reflected in the dwelling stats for apartment construction, is a nation-wide frenzy of speculative investment in inner city apartments, fuelled by negative gearing, SMSFs, foreign buyers and the search for returns in a very low yielding market. For many apartment projects, more than 80% or 90% of the stock is sold to investors, not to people with the intention of living there. This includes a significant proportion of first home buyers as investors, as Michael Pascoe recently pointed out. 

To meet the investor market, apartments are getting smaller and smaller – to meet the price points demanded by investors. Typically, most projects offer a mix of one and two bedroom units only – and these are designed to squeeze every square inch of efficiency out of them. Construction economics and pricing is all about size, features and finishes and every dynamic is put under the microscope and cut from the project if it means the unit offering can be sold for less without sacrificing margin. Many continue to be offered through project selling agencies or “investment channels” in order to achieve a certain level of pre-sales. ‘Rental guarantees’ from developers provide investors with some certainty that their investment will perform predictably for the first year or two. A successful project is one that is sold out, preferably pre-sold. Actually being occupied is another thing altogether.

What this is doing is creating a large pool of rental units of similar size and design and in similar locations. And contrary to the sort of froth and bubble many commentators attach to the ‘rising popularity’ of apartments, many are vacant: simply locked up and not used by their owners (often overseas buyers). Others are looking for tenants, but can’t rent for what investors need to get. Inner city apartment vacancy rates are rising, and rents are starting to fall: a sure sign of market where supply is beginning to exceed demand. 

‘Official’ vacancy stats produced by Real Estate Institutes only count the properties actively being marketed for rent. The ones that are simply unoccupied and not available for rent don’t form part of the figures. A recent study in Melbourne reviewed water consumption in a number of Docklands Towers and concluded that those apartments with next to no water consumption were effectively empty. They put the vacancy at nearly one in four. Or you can simply look at these towers at night, and count the lights that are on, and draw your own conclusion. Or maybe ask some restaurant or shop owners who took leases in new projects on the promise of “a bustling inner city café society” what the trade is really like.

Increasingly, smart developers are selling sites with approvals in place but before a sod has been turned. In some cases they’re selling even before the approval has been obtained. Why go through the grief of developing something when someone else is happy to pay you a premium many times what the site cost you? 

I don’t actually see anything wrong with any of this. Property markets going through booms and busts are not a new thing. Just ask industry people on the Gold Coast. Or have a look at CBD office markets. Plus, if it weren’t for the frenzy of activity we’re seeing in the apartment market now, there’d be precious little else going on. So it’s keeping an industry alive, and all those whose jobs depend on it. Investors are entitled to take risks and they are just as entitled to lose money as make it. There are no guarantees. 

But please, stop suggesting that what we’re seeing is anything but a case of investor-fueled activity. Investors are buying a financial product, not a lifestyle choice. To suggest it means Australian society is surrendering a three or four bedroom home in favour of a one bedroom apartment is stretching the conclusions that can be drawn from the stats way way way too far.

Ross Elliott has more than 20 years experience in property and public policy. His past roles have included stints in urban economics, national and state roles with the Property Council, and in destination marketing. He has written extensively on a range of public policy issues centering around urban issues, and continues to maintain his recreational interest in public policy through ongoing contributions such as this or via his monthly blog The Pulse.

Viewing all 4167 articles
Browse latest View live