Quantcast
Channel: Newgeography.com - Economic, demographic, and political commentary about places
Viewing all 4164 articles
Browse latest View live

Asians: America's Fastest Growing Minority

$
0
0

Asians have emerged as the fastest growing of the three major ethnic and minority populations in the United States. According to Census Bureau data, the number of US native and foreign-born Asian residents rose 56 percent from the 2000 Census to the 2013 American Community Survey (one year release). This is calculated by comparing estimates based on interviews with residents who have classified themselves as a single race and Asian. In the last two censuses, respondents have been asked to designate their race, with the option of selecting more than one ("combinations"). For simplicity, this analysis uses "one race" rather than "combination" data for Asians and African-Americans as well as all data for Hispanics or Latinos. In 2010, 4.8 percent of the nation's population was "Asian alone" (not in combination with another race or ethnicity).

Overall Population Growth Rates: 2000 to 2013

The 56 percent growth in the Asian population was slightly higher than the 53 percent growth among Hispanics between 2000 and 2013. Asian population growth was also more than three times that of African-Americans, at 15 percent.

Due largely to the greater size of  population of Hispanics and African Americans, the larger Asian percentage increase represented the second smallest numeric increase among the three groups over the past decade. The growth in Hispanics was 19 million, from a 2000 population of 35 million to 2013 population of 54 million. The Asian population grew 5.8 million, from a 2000 population of 10.2 million to a 2013 population of 16.0 million. The African-American population increased somewhat less slowly, at 5.3 million, despite a 2000 population that was nearly 3.5 times the Asian population.

The Census Bureau projects a continuation of similar trends. Between 2013 and 2050, the Asian population (one-race) is expected to increase 115 percent to 34.3 million. This is more than four times the projected national growth rate over the period. The Hispanic population is projected to grow at a slightly lower rate, at 88 percent with a 2050 population of 101 million. The African-American population would continue with the slowest growth of ethnic minorities, adding 40 percent and reaching 16 million by 2050 (Figures 1 and 2), although they will grow faster than the Non-Hispanic White population, which is expected to decline by five percent.


Census Bureau Definition of Asian

Asia is by far the largest continent both in the land area and population. It includes three of the four most populous nations in the world, China, India, and Indonesia (the United States is the third most populous). The Census Bureau classifies people within South Asia (the Indian subcontinent), Southeast Asia and East Asia as Asian, based on their responses to surveys.

As a result, the census definition covers a broad area from the western border of Pakistan, through India, and Bangladesh along with Southeast Asia, China, the Philippines, Japan and Korea.

Distribution of Asian Origins

China, According to the American community survey for 2013, was the origin to the highest number of Asians in the United States, at approximately 24 percent. The Indian subcontinent has the second largest number at approximately 20 percent (including India, Pakistan, Bangladesh and Sri Lanka). The Philippines represents approximately 17 percent of the Asian population, while Vietnam has approximately 11 percent, Korea nine percent, and Japan five percent. Another 15 percent are classified as "other Asian," indicating origins in one of the other areas of Asia, such as Indonesia or Thailand (Figure 3). Some of these might also be Chinese by ethnicity.

Between 2000 and 2013, the largest numeric growth was among Indian subcontinent and "other Asian" origins, both at 90 percent. Chinese origins increased 56 percent, while the Japanese population fell slightly (minus 0.3 percent).

Population Concentrations

The Asian population is unusually concentrated. The 10 states with the largest Asian population account for nearly three-quarters of the total (Figure 4). California had the largest Asian population, with approximately one-third of the Asian population in the United States. Approximately 5.2 million Asians lived in California. This is more than three times the Asian population living in second-ranked New York, with 1.6 million. Texas ranks third in Asian population, with 1.1 million. Five other states have more than one half million Asians, including New Jersey, Illinois, Washington, Hawaii, and Florida.

Who Lives Where?

California's concentration of Asian population extends to all seven census categories. California has more Indian subcontinent, Chinese, Filipino, Japanese, Korean, Vietnamese, and other Asian residents than any other state. New York follows California in the number of Asians with origins in China, the Korea and "other Asian" areas. Hawaii has the second most people with Japanese and Philippine origins. Texas is second in Vietnamese origins and New Jersey ranks second in Indian subcontinental origins. In each of the 10 most Asian states, the group trails Hispanics

Comparisons

In some states, Asians are already the second largest racial minority, behind Latinos. Perhaps most significantly, California's 5.2 million Asians constitute more than double the 2.3 million African-American citizens. In three nearby states, Asians are approximately double or more the African-American population, including Washington, Oregon, Utah, Idaho, and Montana.

In one state, Hawaii, Asians represent the largest minority. Hawaii has 530,000 Asian residents, which is nearly 4 times the Hispanic population and more than 17 times the African-American population. Asians represent the second largest minority in 10 states.

Wendell Cox is principal of Demographia, an international public policy and demographics firm. He is co-author of the "Demographia International Housing Affordability Survey" and author of "Demographia World Urban Areas" and "War on the Dream: How Anti-Sprawl Policy Threatens the Quality of Life." He was appointed to three terms on the Los Angeles County Transportation Commission, where he served with the leading city and county leadership as the only non-elected member. He was appointed to the Amtrak Reform Council to fill the unexpired term of Governor Christine Todd Whitman and has served as a visiting professor at the Conservatoire National des Arts et Metiers, a national university in Paris.

Photo: Hsi Lai Temple (Buddhist), Los Angeles By Aaron Logan [CC BY 1.0], via Wikimedia Commons.


California's Rebound Mostly Slow, Unsteady

$
0
0

California, after nearly five years in recession, has made something of a comeback in recent years. Job growth in the state – largely due to the Silicon Valley boom – has even begun to outpace the national average. The state, finally, appears to have finally recovered the jobs lost since 2007.

To some, this makes California what someone called “a beacon of hope for progressives.” Its “comeback” has been dutifully noted and applauded by economist Paul Krugman, high priest of what passes for the American Left.

In reality, however, California’s path back remains slow and treacherous. California Lutheran University economist Bill Watkins, like other economists, is somewhat bullish on the state’s short-run situation, but suggests that the highly unequal recovery, particularly for the middle class, could prove problematic over time.

“It’s very narrow and not broad-based,” he observes. “That is very troubling.”

Things certainly are better than they were, a few years back but still are far from ideal. Right now, California employment is about 1.1 percent above 2007 levels, slightly below the 1.4 percent growth for the country. In contrast, Texas’ economy has created jobs at roughly 10 times that rate. With a population much smaller than California’s, the Lone Star State added more than 1.2 million jobs, compared with 162,000 for California. No great surprise, then, that California has become, by far, the largest exporter of domestic migrants – more than twice that of any other state – to Texas.

Our unemployment rate, while falling, at 7.3 percent in October was still the nation’s fifth-highest. Even as California has improved, Texas continues to grow as fast, or faster, than the Golden State. According to the U.S. Bureau of Labor Statistics, Texas ranked third in growth over the past year, while California achieved a respectable ninth. It’s possible, though, that with falling oil prices, California might edge out Texas in growth for 2014, but the performance gap – due to the narrowness of the recovery – is likely to remain huge for the foreseeable future.

Regional Disparities

Most of the gains in high-wage jobs in California since 2007 have been in professional and business services – up almost 200,000 – a sector that clusters along the coast. Most strong job gains have been concentrated in the Bay Area, primarily along the 50-mile strip from San Francisco to San Jose. At the same time, conditions have remained sluggish both in less tech-oriented Los Angeles and the Inland economies.

The Sacramento region, for example, remains down 32,000 jobs from 2007 levels; most other Central Valley communities, with the exception of oil-fired Bakersfield, remain stuck at or below their 2007 levels. The Inland Empire may be improving, but remains down 30,000 jobs. Other blue-collar economies, such as Oakland, just across the Bay from booming San Francisco, remains 9,000 jobs below its 2007 level. Los Angeles County, historically the linchpin of the state economy, is down 44,000 jobs.

Improving the economy in these areas may be very difficult as California’s regulatory environment makes it hard for many firms to expand as easily as they can in Nevada, Arizona, Utah or Texas. Under current circumstances, even when Silicon Valley firms expand their middle-management workforce, they are likely to do it in other more business-friendly states – or abroad – than move further east toward the Central Valley.

Blue Collar Bust

One of the great success stories in America the past few years has been the growth of the blue-collar economy. Credit goes to, first and foremost, the energy boom that accelerated growth not only in states like Texas, North Dakota and Oklahoma, but also in Ohio and Pennsylvania, where fracking has expanded. This energy boom has also spilled over into the industrial sector, creating new demand for such things as pipes and sparking a recovery in the auto industry, both in the traditional Rust Belt and the newly industrialized zones of the Southeast.

California, sadly, has remained largely on the sidelines during this great boom, which is one reason why its population suffers the highest poverty rate in the country. Since 2007, for example, Texas has added some 54,000 jobs in the natural-resource extraction sector. California, with some of the nation’s largest oil reserves, has added 15,000. Critically, this sector provides high-wage jobs not only to geologists and managers, but also to an assortment of blue-collar workers, who earn wages, according to Economic Modeling International, of roughly $100,000 annually.

A similar pattern can be seen in manufacturing. As the economy has recovered, U.S. industrial expansion has increased, with employment up 2 percent in the past year. Manufacturing in California, meanwhile, has grown at half that rate. Over the past seven years, the Golden State has lost some 200,000 manufacturing jobs, and, with the state’s high energy costs, it’s difficult to see how this pattern will reverse in the foreseeable future.

Wholesale trade and warehousing represents another key blue-collar industry but California has had virtually no growth here since 2007, while Texas has gained well over 100,000 positions. Future growth for the state in this area may be slowed as trade moves away from the chronic congestion, environmental and labor conflicts surrounding California ports, particularly the key Los Angeles-Long Beach complex. Instead, traffic is headed to more business-friendly facilities along the Gulf Coast and Southeast, as well as to the west coasts of Canada and Mexico.

Similarly, construction, a critical blue-collar sector, and the one that employs more Latinos than any other, has been slow to grow in California, where construction employment remains 190,000 jobs below 2007 levels. Even in the past year, with rising home prices, California construction growth has lagged well behind that of Texas. Looking forward, with ever stricter restraints on single-family housing, the prospects for growth are limited.

Silicon Valley a savior?

Today, most of the hope about California centers on Silicon Valley. “Silicon Valley,” notes economist Watkins, “is the last goose laying golden eggs in California.” It’s hard not to be impressed with the massive wealth accumulation around Silicon Valley and its urban annex, San Francisco. This growth has boosted the state’s improved short-term financial position. But it’s highly improbable that the Valley’s information sector – even at today’s often-absurd valuations – can create enough jobs to sustain the rest of the state. Since 2007, notes economist Dan Hamilton, the state has gained less than 11,000 information jobs, hardly sufficient to make up for the massive losses from the recession.

So, in what sectors are the job gains concentrated? Generally, not necessarily the sectors that create middle-class jobs. The biggest winners, outside of business services, have been generally lower-wage sectors such as education and health care, up 24 percent since 2007 – a remarkable 464,000 jobs – as well as leisure and hospitality, which has grown 10 percent, or almost 158,000 positions.

The class implications of this unbalanced growth are profound. Even in Silicon Valley, Latinos and African Americans have seen wages fall, and the area has been home to the nation’s largest homeless encampment. Meanwhile, many solid middle-class employers – Boeing, Chevron, Charles Schwab and Toyota – continue to shift jobs out of state; Occidental Petroleum, a longtime boon to the Southern California economy, pulled up stakes and moved to Houston.

So, rather than break out the organic champagne to toast California’s comeback, as the Jerry Brown administration would have us do, we would do better to address the ever-growing economic divide in the state. And, to be sure, with little prospects for renewed middle-class and blue-collar job growth, California should not be held up as a model for other states, particularly those that lack both California’s innovation economy and its remarkable natural advantages.

In fact, neither is this situation ideal for most Californians – particularly if you are concerned about the state’s middle class and the consequences of an expanding, often undereducated population with little prospect of ascending the economic ladder.

This piece first appeared at the Orange County Register.

Joel Kotkin is executive editor of NewGeography.com and Roger Hobbs Distinguished Fellow in Urban Studies at Chapman University, and a member of the editorial board of the Orange County Register. His newest book, The New Class Conflict is now available at Amazon and Telos Press. He is author of The City: A Global History and The Next Hundred Million: America in 2050. His most recent study, The Rise of Postfamilialism, has been widely discussed and distributed internationally. He lives in Los Angeles, CA.

An Economic Win-Win For California – Lower the Cost of Living

$
0
0

A frequent and entirely valid point made by representatives of public sector unions is that their membership, government workers, need to be able to afford to live in the cities and communities they serve. The problem with that argument, however, is that nobody can afford to live in these cities and communities, especially in California.

There are a lot of reasons for California’s high cost of living, but the most crippling by far is the price of housing. Historically, and still today in markets where land development is relatively unconstrained, the median home price is about four times the median household income. In Northern California’s Santa Clara County, the median home price in October 2014 was $699,750, eight times the median household income of $88,215. Even people earning twice the median household income in Santa Clara County will have a very hard time ever paying off a home that costs this much. And if they lose their job, they lose their home. But is land scarce in California?

The answer to this question, despite rhetoric to the contrary, is almost indisputably no. As documented in an earlier post, “California’s Green Bantustans,” “According to the American Farmland Trust, of California’s 163,000 square miles, there are 25,000 square miles of grazing land and 42,000 square miles of agricultural land; of that, 14,000 square miles are prime agricultural land. Think about this. You could put 10 million new residents into homes, four per household, on half-acre lots, and you would only consume 1,953 square miles. If you built those homes on the best prime agricultural land California’s got, you would only use up 14% of it. If you scattered those homes among all of California’s farmland and grazing land – which is far more likely – you would only use up 3% of it. Three percent loss of agricultural land, to allow ten million people to live on half-acre lots.”

So why is it nearly impossible to develop land in California? The answer to this is found in the nexus between financial special interests, who benefit from asset bubbles, and powerful environmentalist organizations who apparently view human settlements as undesirable blights that should be minimized. In the San Francisco Bay Area, to offer a particularly vivid example, the Santa Cruz mountains are being targeted to be cleansed of human habitation. Instead of creating wildlife corridors, they are eliminating human corridors. Is this really necessary?

Human Cleansing – The Evacuation Plan for the Santa Cruz Mountains

20141203_RingDo you want to live in the mountains?

Forget it. Only billionaires and non-humans allowed.

If you are familiar with the San Francisco peninsula, you will see that the area proposed for the “Great Park of the Santa Cruz Mountains” encompasses nearly the entire mountain range. A coalition of environmentalist organizations and government agencies are proposing to create a park of 138,000 acres, that’s 215 square miles, in an area that ought to make room for weekend cabins, mountain dwellers, and vacation communities. Why, in a region where homes cost so much, is so much land being barred to human settlement? The pristine stands of redwoods in Big Basin and Henry Cowell State Park were preserved a century ago. There is nothing wrong with preserving more land around these parks. But do they have to take it all?

This is far from an isolated example. Urban areas in California, primarily Los Angeles and the San Francisco Bay Area, have been surrounded by “open space preserves” where future development is prohibited and current residents are harassed. Ask the embattled residents of Stevens Canyon in the hills west of the Silicon Valley, if there are any of them left. Once you’re in a “planning area,” watch out. Backed by bonds sold to naive voters, endowments bestowed by billionaires, and the power of state and federal laws that make living on any property at all increasingly difficult, the relentless land acquisition machine continues to gather momentum. Anyone who thinks there isn’t a connection between setting aside thousands of square miles in California for “habitat” and the price of a home on a lot big enough to accommodate a swing set for the kids needs to have their head examined.

It doesn’t end with open space that is actually purchased, cleansed of humanity, and turned into government ran preserves for plants and wildlife, however. Acquiring permits to build on any land is nearly impossible in California. Land developers who fight year round to try to build housing for people shake their heads in disbelief at the myriad requirements from countless state, federal and local agencies that make the permit process take not months or years, but decades. And it isn’t just farmland, or wetland, or special riparian habitats where development is blocked. It’s everywhere. Even semi-arid rangeland is off limits for housing unless you are prepared to spend millions, fight for decades, and have the staying power to pursue multiple expensive projects simultaneously since many will never, ever get approved.

What is the result? Here is an aerial photo of a subdivision in the Sacramento area, one that every hedge fund billionaire turned environmentalist in California – especially one who runs cattle on his own special 1,800 acre fiefdom in the Santa Cruz mountains on a property that just happens to be in a “non-targeted area” - might consider living in for the rest of his life in order to understand the human consequences of his ideals – cramped homes on 40′x80′ lots, at a going price in October 2014 of $250,000. Notwithstanding being condemned to a claustrophobic existence at a level of congestion that would drive rats in a cage to madness, $250,000 is a pittance for a billionaire. But for an ordinary worker, $250,000 is a life sentence of mortgage servitude. And even this, the single family dwelling, is under attack by “smart growth” environmentalists and public bureaucrats who prefer density to having to divert payroll and benefits to finance infrastructure. The excess! The waste! Stack them and pack them and let them ride trains!

Priced to Sell at $250,000 – Housing for Humans on 40′x80′ Lots

201402_Sacramento-500pxNo mountain air, ocean breezes, or open space for the little people.

Buy a permit, get in line, visit for a day, but then come home to this.

When public employee union leadership talk about the importance of paying their members a “middle class” package of pay and benefits, they’re right. Government workers should enjoy a middle class lifestyle. But they need to understand that the asset bubbles caused by high prices for housing are not only making it necessary to pay them more, but are also creating the inflated property tax revenue that they rely on for much of their compensation. They need to understand that the phony economic growth caused by everyone borrowing against their inflated home equity is what creates the stock market appreciation that their pension funds rely on to remain solvent. And they need to understand that all of this is a bubble, kept intact by crippling, misanthropic land use restrictions that hurt all working people.

There is another path. That is for public employee union leadership to recognize that everyone deserves a chance at a middle class lifestyle. And the way to do that is not to advocate higher pay and benefits to public employees, but to advocate a lower cost of living, starting with housing. One may argue endlessly about how to regulate or deregulate water and energy production, essentials of life that also have artificially inflated costs. But as long as suburban homes consume less water than Walnut orchards – and they do, much less – build more homes to drive their prices way, way down. There’s plenty of land.

Ed Ring is the executive director of the California Policy Center, where this piece first appeared.

The Inevitability of Tradeoffs, or Understanding New England’s Sky High Energy Costs

$
0
0

People advance two main sorts of arguments in favor of things for which they advocate: the moral argument (it’s the right thing to do) and the utilitarian one (it will make us better off). As it happens, in practice most people tend to implicitly suggest there’s a 100% overlap between the two categories. That is, if we do what’s right, it will always make us better off too with no down sides at all.

But is that true?

For most of us, our life experience suggests that there are always tradeoffs and there’s no such thing as a free lunch. Urbanists tend to argue in way that suggests this isn’t the case. The types of policies advocated by urbanists tend to be presented not only as right in a certain moral sense, but also ones that make society better off in every way. When things go awry in some respect, as they always seem to do, this is always seen as an avoidable defect in policy implementation, not as a problem inherent to the policy itself. Urbanists aren’t alone in this of course. It affects most of the world. But since I cover the urban beat, I’ll focus on us for a minute.

Today the New York Times opens a window into the type of trade-offs that are studiously avoided in most writings on the subject of climate change. Called “Even Before Long Winter Begins, Energy Bills Send Shivers in New England,” it talks about how a lack of natural gas pipeline capacity is sending electricity and gas costs through the roof as the temperature turns cold.

John York, who owns a small printing business here, nearly fell out of his chair the other day when he opened his electric bill. For October, he had paid $376. For November, with virtually no change in his volume of work and without having turned up the thermostat in his two-room shop, his bill came to $788, a staggering increase of 110 percent. “This is insane,” he said, shaking his head. “We can’t go on like this.”

For months, utility companies across New England have been warning customers to expect sharp price increases, for which the companies blame the continuing shortage of pipeline capacity to bring natural gas to the region. Now that the higher bills are starting to arrive, many stunned customers are finding the sticker shock much worse than they imagined.

I’ve written about this before re:Rhode Island, which is among the most expensive states in America for electricity (most of which is generated by gas). But all of New England is high, with Connecticut ranked as having the country’s most expensive electricity. Gas prices spike every winter to levels far above the rest of the country, as the graph below that I found via City Lab shows:


This would appear to be a simple problem to solve: just build more pipelines. I included on mylist of starter ideas for improving economic competitiveness in the state.

Unfortunately, planned pipelines haven’t been built due to environmental opposition:

The region has five pipeline systems now. Seven new projects have been proposed. But several of them — including a major gas pipeline through western Massachusetts and southern New Hampshire, and a transmission line in New Hampshire carrying hydropower from Quebec — have stalled because of ferocious opposition.

The concerns go beyond fears about blighting the countryside and losing property to eminent domain. Environmentalists say it makes no sense to perpetuate the region’s dependence on fossil fuels while it is trying to mitigate the effects of climate change, and many do not want to support the gas-extraction process known as hydraulic fracturing, or fracking, that has made the cheap gas from Pennsylvania available.

….

A year ago, the governors of the six New England states agreed to pursue a coordinated regional strategy, including more pipelines and at least one major transmission line for hydropower. The plan called for electricity customers in all six states to subsidize the projects, on the theory that they would make up that money in lower utility bills.

But in August, the Massachusetts Legislature rejected the plan, saying in part that cheap energy would flood the market and thwart attempts to advance wind and solar projects. That halted the whole effort.

Here we see the clear tradeoff in action. Reducing carbon emissions has a clear human and economic cost. High electricity costs wallop household budgets in a region with many communities that are struggling or even outright impoverished (as recently as last year, for example, a third of the residents of Woonsocket, RI were on food stamps). This particularly harms poor and minority residents. What’s more, it helps contribute to the region’s low ranking as a place to do business and its anemic job creation.

Given that gas itself is dirt cheap and will be for the foreseeable future thanks to fracking, hurting residents through high electricity prices designed to drive energy transition is clearly a deliberate policy choice.

Fair enough if you believe reducing carbon requires subordinating other public goals like more money in poor people’s pockets. But how often is this forthrightly stated by advocates? Almost never.

Instead we’re treated to article after article in various urbanist publications talking about some awesome green project that’s being implemented somewhere, and how other places ought to do the same thing. There’s lots of doom and gloom about the increased potential for future disasters if the policies aren’t followed. But there’s seldom much about the immediate negative consequences that almost certainly will follow if they are.

I like energy efficiency. I’m glad we have more fuel efficient cars. I’m very glad I don’t own a car anymore. I’m not so excited about light bulb mandates and other “feel bad” policies that don’t materially affect emissions. But there’s definitely a lot we can do on the energy front.

But I also care about things like poor people’s electricity bills and economic growth. And I’m not willing to make unlimited sacrifices (including imposing sacrifices on other people) in the name of conservation. I can appreciate that others might make different tradeoffs and want more conservation than I do. But at least they ought to be honest about the costs and harm they are imposing on people in the name of their preferred policy matrix.

Instead there’s disingenuous talk about the “green economy” powering local economies when there’s no such thing as green industry. Or claiming, as many did in response to my article earlier this year, that Rhode Island’s government is actually conservative, so its problems can’t be laid at the foot of excessively progressive policies imported from places with vastly more economic leverage than most of New England. I guess I did not know that killing gas pipelines in the name of promoting renewable energy via high prices was a Tea Party idea.

Actually, not even the places that do have huge economic leverage are behaving like this. New York City has more economic leverage than just about anybody. But it also, as the chart above shows, has cheaper gas. One reason is that, as City Lab reported, NYC recently just opened a new gas pipeline into the city:

A really important thing happened last month to New York City and the rest of the mid-Atlantic. This event will change the daily lives of millions of people, especially during the coldest months of winter. And, despite some protesters, it all went down with less fanfare than Jay Z and Beyonce going vegan for a month.

An $856-million pipeline expansion began ramping up service, allowing more natural gas to get to New York City consumers. The New York-New Jersey expansion project moves more gas the last few miles from Jersey, which is the terminus for much of the Marcellus Shale gas flowing out of Pennsylvania, into Manhattan. The Energy Information Administration called it “one of the biggest… expansions in the Northeast during the past two decades.” It will bring an additional 800 billion British thermal units (BTU) of gas to the area per day.

Maybe New England wants to out do New York City when it comes to driving a green energy transition. (NYC seems to be focusing more on climate change adaptation, aka “resiliency,” these days). That’s a valid policy choice to make. But it’s one with consequences.

Unfortunately, the consequences of these policy choices are seldom presented by their advocates. People only discover them when the costs show up in a way that can be tangible traced back to those policies. Maybe in the case of New England and energy costs, people are starting to wake up to the matter, possibly in a way similar to how sky high housing costs in so many cities woke people up to the actual trade-offs being made in housing policy.

Advocates are there to advocate of course. So perhaps it’s unrealistic to expect advocates of any stripe to give you the full story. But that’s why we should always pay attention to what the critics of particularly policies have to say. That will give us a more complete picture of the tradeoffs any particular policy set will require.

Aaron M. Renn is an independent writer on urban affairs and the founder of Telestrian, a data analysis and mapping tool. He writes at The Urbanophile, where this piece originally appeared.

Photo: Pawtucket Power Plant

.

The Cities Where African-Americans Are Doing The Best Economically

$
0
0

The U.S. may have its first black president, but these have not been the best of times for African-Americans. Recent shootings of unarmed black teenagers and the murder of two New York City police officers have inflamed racial tensions. A Bloomberg poll in December found that 53% of respondents believed that race relations have declined since Obama was elected in 2008.

Even if the results were not skewed by the immediate, impassioned responses to the recent tragedies, the persistent economic gap between whites and blacks is a more serious and deep-rooted problem. The unemployment rate for African-Americans stood at 10.4% in December, more than twice that of whites, as it has been formost of the past 40 years.

Blacks’ real median household income ticked up to $34,598 in 2013, roughly 59% that of whites’, a ratio that has also not varied much since the Census Bureau began tracking this data in 1967.

Where African-Americans took a significant step back in recent years was in household wealth, which plunged 31% during the recession, including a steep 35% decline in their retirement assets, which the Urban Institute suggests was partially due to the unemployed drawing down savings to cover living expenses. The wealth of white families fell a comparatively mild 11% from 2007-10.

Yet economic conditions for African-Americans vary widely throughout the country. We decided to look into which of America’s 52 largest metropolitan areas present African-Americans with the best opportunities. We weighed these metropolitan statistical areas by three critical factors — homeownership, entrepreneurship, as measured by the self-employment rate, and median household income  — that we believe are indicators of  middle-class success. Data for those is from 2013. In addition, we added a fourth category, demographic trends, measuring the change in the African-American population from 2000 to 2013 in these metro areas, to judge how the community is “voting with its feet.” Each factor was given equal weight.

Southern Exposure

In the first half of the 20th century, African-Americans fled the former Confederate state for economic opportunity, to escape from institutional racism and, sometimes, for their lives. This pattern,notes demographer Bill Frey, began to reverse itself in the 1970s, with Southern states becoming destinations for black migrants. Since 2000, when the Census registered the first increase in the region’s black population in more than a century, this trend has accelerated, with African-Americans leaving not just the Northeast or Midwest, but the West Coast as well.

Today, Dixie has emerged, in many ways, as the new promised land for African-Americans. In our survey the South accounts for a remarkable 13 of the top 15 metro areas.

At the top of our list is Atlanta, long hailed as the unofficial capital of black America. The city, which in the 1960s advertised itself as “the city too busy to hate,” has long lured ambitious African-Americans. With its well-established religious and educational institutions, notably Spellman and Morehouse, which are ranked first and third, respectively, by US News among the nation’s historically black colleges, the area has arguably the strongest infrastructure for African-American advancement in the country. The region’s strong music and art scene has also made it an “epicenter for black glitterati” and culture.

The superlatives extend well beyond glamour to the basics of everyday life. Some 46.9% the metro area’s black population owned their own homes as of 2013, well above the 38% major metro average for African-Americans. Atlanta’s African-Americans have a median household income of $41,800, also considerably above the major metro average, while their rate of self-employment, 17.1%, is second only to New Orleans.

Clear evidence of the Atlanta area’s appeal can be seen in the growth of the black population, up 50% from 2000 through 2013. This is also well above the of 28% average growth in the African-American population in the nation’s 52 biggest metro areas during the same time.

This shift of African-Americans to Southern metro areas is widespread. Population growth since 2000 above 40% was posted by No. 2 metro area Raleigh, N.C.; Charlotte, N.C. (sixth); Orlando (seventh) as well as the three cities that tie for eighth place: Miami; Richmond, Va.; and San Antonio. The same can be said of Texas’ other big cities: Austin (11th), Houston (12th) and Dallas-Fort Worth (13th).

If there’s a challenger to Atlanta and the renewed Southern ascendency for African-Americans, it’s the greater Washington, D.C., area which ranks third. The median black household income in the metro area is $64,896, more than $20,000  above that of Atlanta and other top-ranked southern cities. Home ownership rates, at 49.2%, are also the highest in the nation.

As in Atlanta, Washington’s black community has strong institutions of culture and higher education. The District is home to Howard University, the nation’s second-ranked historically black university. Washington’s urban core may be becoming less black — down from 60% in 2000 to under 50% in 2013– but this has been more than made up for by the burgeoning population of surrounding suburban areas such as Prince George’s County, which is majority black and relatively prosperous, with poverty rates well below those of the city. The key plus here appears to be the the federal government, which employs many people at high wages in the area.

Incomes also have been boosted by the government in No. 4 Baltimore, which enjoys the third highest black median income and the third highest self-employment rate after Atlanta and New Orleans. As in Washington, much of this prosperity is not in the hardscrabble city core, but in surrounding suburban areas such as Baltimore County, where the black population grew from 20% of the total in 2000 to over 26% in 2010.

Where African-Americans Are Struggling

Many of the metro areas at the bottom of our list are the once mighty manufacturing hubs where Southern blacks flocked in the Great Migration: last place Milwaukee, followed by Grand Rapids, Mich.; Cincinnati (50th); Pittsburgh (tied for 48th) Cleveland (47th) and Buffalo (46th). African-Americans in these old industrial towns earn on average $10,000 to $15,000 less than their counterparts in Atlanta. Self-employment rates are half as high as those in our top 10 cities.

Of course, none of this is too surprising, given the long-term economic malaise in the Rust Belt. But some of our most prosperous metro areas are also not working out well for blacks. These include San Francisco-Oakland, which tied with Pittsburgh for 48th, Los Angeles (40th) and Seattle (36th). In these cities, homeownership rates for African-Americans tend to be 10 to 15 percentage points lower, and self-employment close to half of what we see in greater Washington, Atlanta, Raleigh, Charlotte and the four big Texas cities.

Blacks populations have declined in some of these metro areas, including San Francisco, which has seen a 9.1% drop since 2000, and Los Angeles, where the African-American population has fallen 8%. Chicago (31st), long a major center of black America, has seen a 4% drop since 2000, while the black population of the New York metro area (24th) has grown just 2.4%.

Ironically, many of the metro areas at the top of our list tend to vote Republican. But many local Democratic politicians in the South support generally pro-business economic agendas. African-Americans, who tend to have fewer economic assets than whites, need growth to expand their opportunities; that’s one reason they do so well, relatively, in the South.

But it’s not just growth. Places like Los Angeles and the Bay Area are losing black population because of their high housing prices. Hollywood stars and tech titans may not mind, but it’s tough for most everyone else to buy a house in the big California cities and New York. Housing prices in Atlanta and Houston, relative to incomes, are about half or more less than those in the Bay Area.


Best Cities for African Americans
Metropolitan AreaRankScoreHome Ownrshp RateMedian Hshld IncomeShare of Self EmplymtChange in Population: 2000-2013
Atlanta, GA1     87.0 46.9%$41,80317.1%49.9%
Raleigh, NC2     84.6 46.7%$42,28512.8%55.9%
Washington, DC-VA-MD-WV3     83.2 49.2%$64,89615.1%19.7%
Baltimore, MD4     74.5 46.2%$47,89815.0%15.6%
Charlotte, NC-SC4     74.5 43.9%$36,52213.6%47.8%
Virginia Beach-Norfolk, VA-NC6     72.6 43.8%$40,67713.2%34.6%
Orlando, FL7     71.6 44.7%$33,98211.0%58.9%
Miami, FL8     68.3 44.9%$36,74911.2%32.4%
Richmond, VA8     68.3 47.7%$38,89912.7%17.9%
San Antonio, TX8     68.3 40.8%$41,6819.3%43.3%
Austin, TX11     67.8 43.6%$42,5149.0%39.2%
Houston, TX12     66.3 41.6%$40,5729.9%37.5%
Dallas-Fort Worth, TX13     64.4 38.7%$40,2399.5%45.2%
Nashville, TN13     64.4 41.8%$37,71610.9%31.9%
Birmingham, AL15     63.0 50.0%$33,09215.0%12.0%
Memphis, TN-MS-AR16     61.1 47.2%$31,98113.5%18.5%
Jacksonville, FL17     58.7 46.3%$32,46910.8%24.2%
Boston, MA-NH18     58.2 31.7%$46,5569.1%38.9%
Riverside-San Bernardino, CA18     58.2 40.9%$42,6737.6%32.6%
Philadelphia, PA-NJ-DE-MD20     57.2 47.3%$36,5959.1%13.3%
Tampa-St. Petersburg, FL21     52.9 36.6%$31,66510.8%40.9%
Columbus, OH22     51.4 35.9%$33,4519.3%40.0%
Hartford, CT22     51.4 33.3%$46,0978.3%24.4%
New York, NY-NJ-PA24     49.5 32.0%$43,38110.9%2.4%
New Orleans. LA25     46.6 45.5%$27,81217.4%-13.4%
Denver, CO26     46.2 38.9%$41,2156.3%29.6%
Las Vegas, NV26     46.2 29.0%$34,2818.3%77.7%
Phoenix, AZ28     45.7 31.5%$36,7796.8%93.4%
Portland, OR-WA29     44.2 39.7%$33,6995.8%42.5%
Kansas City, MO-KS30     43.8 39.4%$35,2778.3%15.8%
Chicago, IL-IN-WI31     42.3 39.4%$34,2879.4%-4.3%
Oklahoma City, OK32     41.8 39.2%$34,7457.8%18.4%
San Jose, CA33     40.9 32.9%$53,6457.2%11.4%
Detroit,  MI34     39.9 43.8%$30,1629.5%-4.9%
St. Louis,, MO-IL35     39.4 42.4%$31,2159.1%6.9%
Seattle, WA36     37.5 28.3%$41,0816.7%36.4%
Providence, RI-MA37     36.5 29.3%$32,9077.3%52.5%
Indianapolis. IN38     35.6 35.4%$31,4527.8%29.1%
San Diego, CA39     33.7 30.1%$46,6507.1%2.6%
Los Angeles, CA40     32.2 32.9%$40,9807.7%-8.0%
Rochester, NY41     31.7 34.2%$28,1048.9%16.2%
Sacramento, CA41     31.7 31.6%$33,5307.2%26.4%
Salt Lake City, UT41     31.7 18.7%$32,1025.5%94.2%
Louisville, KY-IN44     30.8 35.7%$28,8267.4%21.0%
Minneapolis-St. Paul, MN-WI44     30.8 26.3%$31,5646.4%69.2%
Buffalo, NY46     26.9 33.7%$26,2109.4%1.6%
Cleveland, OH47     26.0 37.8%$26,6468.8%0.0%
Pittsburgh, PA48     25.5 37.3%$28,0888.0%2.5%
San Francisco-Oakland, CA48     25.5 30.8%$40,1527.3%-9.1%
Cincinnati, OH-KY-IN50     23.6 31.4%$28,6848.7%10.7%
Grand Rapids, MI51     21.6 29.9%$25,4958.0%19.3%
Milwaukee,WI52     14.4 29.9%$27,4387.2%10.8%
Calculated from 2013 American Community Survey & EMSI data
Analysis by Wendell Cox

This piece first appeared at Forbes.

Joel Kotkin is executive editor of NewGeography.com and Roger Hobbs Distinguished Fellow in Urban Studies at Chapman University, and a member of the editorial board of the Orange County Register. His newest book, The New Class Conflict is now available at Amazon and Telos Press. He is author of The City: A Global History and The Next Hundred Million: America in 2050. His most recent study, The Rise of Postfamilialism, has been widely discussed and distributed internationally. He lives in Los Angeles, CA.

Dr. Strangelove: Or How I Learned To Stop Worrying and Love Sprawl (Sort of)

$
0
0

I’m a longtime advocate of walkable, mixed-use, mixed-income, transit-served neighborhoods. But lately I’ve been having impure thoughts about suburbia. Let me explain.


 Screen Shot 2015-01-06 at 8.45.12 PM Screen Shot 2015-01-06 at 8.43.39 PM

What often passes for a neighborhood in America is a low grade assemblage of chain convenience stores, big box outlets, franchise muffler shops, multi-lane highways, and isolated cul-de-sacs. Even when it’s physically possible to walk or bike from Point A to Point B it’s not pleasant, safe, or convenient. I bet there are big parts of the town you live in that look like this.

Screen Shot 2015-01-06 at 8.46.09 PM Screen Shot 2015-01-06 at 8.46.24 PM Screen Shot 2015-01-06 at 8.54.45 PM

Here’s what’s happened to the housing stock in previously desirable post war suburbs. They’ve aged and were passed over in favor of new development farther out on the edge of town. The homes are out of fashion. They’re too small. They don’t have the right modern features. There are questions about the quality of the local schools. And there’s a general perception that the kinds of people who remain may not make good neighbors. These properties sell at significantly lower prices relative to the larger region. It’s often assumed that they’re unlikely to appreciate in value so they’re considered a poor investment.

Screen Shot 2015-01-06 at 8.42.30 PM Screen Shot 2015-01-06 at 8.47.44 PM Screen Shot 2015-01-06 at 9.15.26 PM Screen Shot 2015-01-06 at 8.43.09 PM Screen Shot 2015-01-07 at 1.35.38 AM

This is what the commercial building stock is like. Cheap disposable plywood and cinder block boxes and industrial sheds set behind a patch of asphalt parking lot. These photos happen to be of Portland, Oregon, but they could be from a thousand other places. They’re all the same. This actually looks a lot like where I grew up in New Jersey.

Sure, the sleek new Pearl District and Historic Pioneer Square are fashionable and urbane. But the vast majority of people will never live there. Most of Portland, like most of America, is sprawl. Forget what you’ve heard about urban growth boundaries, streetcars, and jack booted liberal thugs who make you live in a shoebox apartment and take away your car. The reality on the ground is that most of Portland is indistinguishable from everyplace else.

Screen Shot 2015-01-07 at 1.34.34 AM Screen Shot 2015-01-07 at 1.44.53 AM

But here’s the fascinating thing to me – and the source of my recent epiphany about aging sprawl. I always assumed that these neighborhoods would all devolve into the new slums – and many certainly are doing that. Ferguson, Missouri anyone? But it doesn’t have to go that way. These forgotten suburban neighborhoods can just as easily be the new sweet spots for small enterprise and a renewed middle class.

I stumbled on the intersection of 42nd Avenue and Killingsworth (see all photos above) and thought, “What a crap hole.” But then I started to poke around for a couple of weeks. There’s more going on than immediately meets the eye.

Here’s the deal. In the 1970’s and 80’s the cheapest real estate was in America’s abandoned downtowns and industrial zones. They were colonized by people looking for freedom – economic freedom from high rents and mortgages, as well as regulatory freedom to do as they wished without the Upright Citizen’s Brigade shutting them down. Now those places have all been picked over by high end developers and transformed into luxury “lifestyle” centers. The same is true of many close-in historic streetcar suburbs like Portland’s Alberta Arts District here. So if you either can’t afford, or simply don’t want, the premium city condo or the deluxe outer suburb McMansion… where do you go to do your own thing on a tight budget?

IMG_3094 (800x533) IMG_3115 (800x533)   IMG_3122 (800x533) IMG_3126 (800x533) IMG_3109 (800x533)

This is Pollo Norte here on a miserable intersection where two busy roads collide. A friend brought me here for take away dinner one night and the food was simple, but spectacularly good and it was served by charming people. We arrived at 6:30 on a Tuesday and the place was packed. We were lucky to get the last whole chicken and some side dishes just as they sold out. The place is open until ten but they were overwhelmed by many more customers than they expected. This was their first month in business and they couldn’t keep up with demand. Aside from the great food, the customers all seemed to know each other and were in good spirits even though there wasn’t enough food to go around. They were celebrating the success of a great new local spot. Good beer and companionship were their consolation prizes. Now the owners need to ramp up production and work with their local suppliers to obtain more of the organic free range ingredients in keeping with their mission statement about quality and regional sustainability. This is a good problem for a new business to have.

Screen Shot 2015-01-07 at 1.01.19 AM Google

By the way, I pulled this image off Google Street View. This is what the building looked like before the Pollo Norte folks scrubbed it clean, gave it some paint, and infused it with new life. It’s still a piece of crap concrete block bunker, but these buildings can be reinvented to good purpose with the right attitude and community support.

unnamed-9 unnamed-10 unnamed-11 unnamed-12 unnamed-13
 unnamed-14

Here’s another tiny concrete bunker a few blocks down the road. It’s owned by a woman who runs a 550 square foot commercial kitchen called Dash here. She rents out space to a variety of small scale producers who need an inspected facility in order to comply with health codes. When I dropped in I was able to speak with Nikki Guerrero as she was readying her Hot Mamma Salsa for market in local shops. here. Nikki started out selling small batches of salsa at farmers markets and now has expanded to several local grocers. She’s successful enough to support herself with the salsa. I don’t think Dash was intentionally organized as an incubator per se, but it serves as the next step up after people are ready to graduate from home cooking (Oregon has a cottage food law here) and street vending. This is not only profitable for the woman who owns the building and cost-effective for people who rent space, but it also cultivates community among various small business people as they share the space. The beauty of this business model is that any cheap ugly building in any uninspiring location can work so long as zoning and NIMBYs don’t get in the way. When your neighbors are industrial sheds and no name convenience stores you don’t get any push back.

unnamed unnamed-1 unnamed-3 unnamed-4 unnamed-2
unnamed-5

Miss Zumstein’s Bakery across the street here is owned by Anja, a native Portlander who finds it difficult to afford property in the trendy parts of town now that the city has become much more expensive than in her girlhood. She recently opened her bakery/cafe on 42nd Ave. because so many of her friends have recently colonized the neighborhood. Price has pushed people into places to live that they wouldn’t necessarily have chosen otherwise. Now the big task at hand is how to make the ugly traffic corridor a proper walkable Main Street on a tight budget. She said the new Pollo Norte is a great indication of the kinds of small independent businesses she’s working with to carve out a new business zone in an otherwise not-so-great location. Anja was very supportive of the people at Dash (Hot Mama Salsa et al) and was thrilled that a new bicycle shop opened up nearby. Cheap ugly space and lots of enthusiastic like-minded people are their primary resources. 

unnamed-16  unnamed-18 unnamed-20 unnamed-19 unnamed-21

This is Cat Six Bikes here. Two bike guys just opened up shop seven months ago. They were working for someone else in a more established neighborhood and finally decided to do their own thing. There are so many cyclists in Portland that if there’s a three mile stretch without a bike shop it’s actually a problem for a lot of people who need parts and service. They identified this location, realized it was more affordable than other more fashionable parts of town, and decided to fill the need.

They almost rented the building that the Pollo Norte people are in now, but the current location was ultimately a better deal. The dentist who owns the building and runs his practice next door provided a deep discount on the rent because he lives in the immediate neighborhood and wanted to help establish more independent businesses in the area. The alternative probably would have been a check cashing place or a cell phone outlet. The guys were able to pull together their business and populate their initial stock and equipment for $10,000 which they had in savings. There was no need for a loan. They’re both handy and were able to do the carpentry and interior work for the shop themselves.

Screen Shot 2015-01-07 at 1.54.40 AM GoogleScreen Shot 2015-01-07 at 1.57.11 AM GoogleScreen Shot 2015-01-07 at 1.52.51 AM 
GoogleScreen Shot 2015-01-07 at 1.55.31 AM GoogleScreen Shot 2015-01-07 at 1.50.09 AM GoogleScreen Shot 2015-01-07 at 1.56.17 AM GoogleScreen Shot 2015-01-07 at 1.51.55 AM Google

But here’s the other thing they mentioned that got me exploring the rest of the neighborhood. The guys share a house – one lives with his girlfriend upstairs and the other lives downstairs. The house is nearby in the Cully neighborhood where little post war homes often have pretty large lots. Many neighbors do varying degrees of urban agriculture – some for a livelihood. This is absolutely not an option in the city center.

Of course they ride their bikes to work since things are relatively close compared to the far more disbursed newer suburbs far from the downtown core. They were confident that over time they would be able to convince the city to implement road diets that would calm car traffic and make it safer and more pleasant to walk and ride bikes in the area. The primary factor in their favor is that highway expansion and car-oriented improvements are fantastically expensive, while bike infrastructure is ridiculously cheap. They also decided that what the neighborhood lacks in big city urban amenities it makes up for in gardening and door-to-door domestic community as well as significantly lower cost. Many of their friends had already moved to the area so they weren’t alone.

IMG_2632 (800x533) IMG_2635 (800x533) Screen Shot 2015-01-08 at 9.42.51 PMIMG_3561 (800x533)IMG_3566 (533x800)

And what about all those tragic little post war ranch homes? Well, it turns out that they’re radically less expensive than either a condo downtown or a McMansion in the newer suburbs. With a little love they can be transformed into something to be proud of. They’re bigger than an apartment, they have a garden, and they’re a whole lot closer to the city center. They’re also a short walk or bike ride to the emerging 42nd Ave, business cluster.

I’m not saying that all, or even most, aging suburbs will blossom. But it’s at least a possibility. The real question to me is… what pushes a neighborhood down vs. what lifts it up? So far what I’m seeing is that a dead downtown contributes to even deader close in neighborhoods. A thriving downtown attracts more people to the city and creates an economic incentive for people to get creative with the reinvention of not-so-fabulous nearby areas. So if you want your struggling suburb to succeed, support your downtown.

John Sanphillippo lives in San Francisco and blogs about urbanism, adaptation, and resilience at granolashotgun.com. He's a member of the Congress for New Urbanism, films videos for faircompanies.com, and is a regular contributor to Strongtowns.org. He earns his living by buying, renovating, and renting undervalued properties in places that have good long term prospects. He is a graduate of Rutgers University.

International Housing Affordability in 2014

$
0
0

The just released 11th Annual Demographia International Housing Affordability Survey shows the least affordable major housing markets to be internationally to be Hong Kong, Vancouver, Sydney, along with San Francisco and San Jose in the United States. Honolulu, which should reach 1,000,000 population this year (and thus become a major metropolitan market) was nearly as unaffordable as San Francisco and San Jose. An interactive map in The New Zealand Herald illustrates the results.

Rating Housing Affordability

The Demographia International Housing Affordability Survey uses the "median multiple" price-to-income ratio. The median multiple is calculated by dividing the median house price by the median household income. Following World War II, virtually all metropolitan areas in Australia, Canada, Ireland, New Zealand, the United Kingdom and the United States had median multiples of 3.0 or below. Since that time, housing affordability has been seriously retarded in metropolitan areas that have been subjected to urban containment policies. This includes virtually metropolitan areas of the United Kingdom, Australia, New Zealand and some markets in the United States and Canada.

Housing affordability ratings are indicated in Table 1.


Table 1
Demographia International Housing Affordability Survey 
Housing Affordability Rating Categories
RatingMedian Multiple
Severely Unaffordable5.1 & Over
Seriously Unaffordable4.1 to 5.0
Moderately Unaffordable3.1 to 4.0
Affordable3.0 & Under


Table 2 summarizes housing affordability ratings for the 86 major metropolitan areas in the nine nations covered. Apart from China (Hong Kong), the least affordable nation among the major markets is New Zealand, at 8.2, followed by Australia at 6.4. Both nations (and Hong Kong) are rated severely unaffordable. 


Table 2
Housing Affordability Ratings by Nation: Major Markets (Over 1,000,000 Population)
 Nation  Seriously Unaffordable (4.1-5.0)Severely Unaffordable (5.1 & Over)  
    
Affordable (3.0 & Under) Moderately Unaffordable (3.1-4.0)TotalMedian Market
 Australia000556.4
 Canada022264.3
 China (Hong Kong)0001117
 Ireland001014.3
 Japan011024.4
 New Zealand000118.2
 Singapore001015
 United Kingdom01106174.7
 United States142369523.6
 TOTAL14272124864.2


Least Affordable Major Markets

Hong Kong registered the highest median multiple out of the 86 major markets and also in the history of the Survey, at 17.0. Vancouver reached 10.6. Sydney had its worst recorded housing affordability, with a median multiple of 9.8. Adjacent metropolitan areas San Francisco and San Jose had median multiples of 9.2, while Honolulu's median multiple was 9.0. The ten least affordable major metropolitan areas are shown in Figure 1. In nine of these markets, housing was affordable before adoption of urban containment policy (Hong Kong data is not available).

Affordable Major Markets

All of the affordable major markets are in the United States. This includes perhaps the most depressed market, Detroit as well as Atlanta, which has spent most of the last three decades as the fastest growing larger metropolitan area in the high income world. At the same time, Atlanta has consistently been among the most affordable. Detroit's median multiple is 2.0, while Atlanta's is 2.9.

Comparing Demographia Results to The Economist and Kookmin Bank

This year's edition includes a comparison of housing affordability multiple data from The Economist's survey of 40 metropolitan areas in China and Kookmin Bank's survey of major metropolitan areas in South Korea. The least affordable major markets are in China, New Zealand and Australia, all with severely unaffordable median multiples. The most affordable major markets are in the United States and Korea, both rated as moderately unaffordable (Figure 2).

Perspective

Hugh Pavletich, of performanceurbanplanning.com and I have published each of the annual editions, which began in 2005. The perspective of the Demographia International Housing Affordability Survey is that domestic public policy should, first and foremost be focused on improving the standard of living and reducing poverty. This requires policies that facilitate both higher household incomes and lower household expenditures (other things being equal). Housing costs are usually the largest component of household expenditure and it is therefore important that public policy both encourage and preserve housing affordability.

Housing Affordability and Urban Containment Policy

However, in recent years, land use policy has not been focused on this concern. Conventional urban theory sees urban containment as a necessity. Yet, urban containment policies are associated with the loss of housing affordability, due principally to their rationing of land for development. This effect is consistent with basic economics – restricting supply of a desired good tends to drive up prices – that has been long established.

Some of the most important contributions have come from Sir Peter Hall, et al (see The Costs of Smart Growth Revisited), Paul Cheshire at the London School of Economics (New Zealand Seeks to Avoid "Generation Rent") and William Fischel at Dartmouth University (The Consequences of Smart Growth). Donald Brash, former governor of the Reserve Bank of New Zealand attributed the housing affordability losses to "the extent to which governments place artificial restrictions on the supply of residential land" in his introduction to the 4th Annual Edition.

The Importance of Urban Expansion

This year's introduction is provided by Dr. Shlomo Angel, leader of the New York University Urban Expansion Program. Dr. Angel reminds us that "where expansion is effectively contained by draconian laws, it typically results in land supply bottlenecks that render housing unaffordable to the great majority of residents."

He describes the Urban Expansion Program is "dedicated to assisting municipalities of rapidly growing cities in preparing for their coming expansion, so that it is orderly and so that residential land on the urban fringe remains plentiful and affordable." Urban Expansion Program teams are already working with local officials in Ethiopia and Colombia to achieve this goal. Angel's previous work documented the association between urban containment policy in Seoul and large house price increases relative to incomes (see Planet of Cities).

Policies seeking the same goals of plentiful and affordable land on the urban fringe are just as necessary in high income world metropolitan areas.

As time goes on, the negative consequences of urban containment policy on housing affordability and the standard of living have been increasingly acknowledged. Christine Legarde, managing director of the International Monetary Fund said that "supply-side constraints will require further measures to increase the availability of land for development and to remove unnecessary constraints on land use." in a recent statement on housing affordability in the United Kingdom.

Similarly a recent feature article in The Economist (see PLACES APART: The world is becoming ever more suburban, and the better for it) noted that the only reliable way to stop urban expansion was to stop them forcefully (such as through urban containment policy). Yet, The Economist continued, "But the consequences of doing that are severe" and cites the higher property prices that have been the result:"

The Economist continued to note the effect of the policy on households: "It has also forced many people into undignified homes, widened the wealth gap between property owners and everyone else..."

Wendell Cox is principal of Demographia, an international public policy and demographics firm. He is co-author of the "Demographia International Housing Affordability Survey" and author of "Demographia World Urban Areas" and "War on the Dream: How Anti-Sprawl Policy Threatens the Quality of Life." He was appointed to three terms on the Los Angeles County Transportation Commission, where he served with the leading city and county leadership as the only non-elected member. He was appointed to the Amtrak Reform Council to fill the unexpired term of Governor Christine Todd Whitman and has served as a visiting professor at the Conservatoire National des Arts et Metiers, a national university in Paris.

Photo: Exurban London

Looking Back: The Ideal Communist City

$
0
0

Over time, suburbs have had many enemies, but perhaps none were more able to impose their version than the Communist Party of the Soviet Union. In its bid to remake a Russia of backward villages and provincial towns, the Soviets favored big cities – the bigger the better – and policies that were at least vaguely reminiscent of the “pack and stack” policies so popular with developers and planners today.

Some of this took the form of rapid urbanization of rural areas. Under Joseph Stalin’s rule in the Soviet Union from 1929 to 1953, scores of “socialist cities” were founded near new, expansive steel mills. These steels mills were built to speed up industrialization, in order to produce vast amounts of weaponry. These, notes historian Anne Applebaum, represented the Soviet communists “most comprehensive attempt to jump-start the creation of a truly totalitarian civilization”, by bringing the peasantry into the factories to grow Russia’s working class.   Built from the ground up, these factory complexes, notes Applebaum, “were intended to prove, definitively, that when unhindered by preexisting economic relationships, central planning could produce more rapid economic growth than capitalism”.

As is sometimes asserted by urbanists today, the new socialist cities were about more than mere economic growth; they were widely posed as a means to develop a new kind of society, one that could make possible the spread of Homo sovieticus (the Soviet man). As one German historian writes, the socialist city was to be a place “free of historical burdens, where a new human being was to come into existence, the city and the factory were to be a laboratory of a future society, culture, and way of life”.

Elements of High Stalinist culture was evident in these cities; the cult of heavy industry, shock worker movement, youth group activity, and the aesthetics of socialist realism. This approach had no room for what in Britain was called “a middle landscape” between countryside and city. Throughout Russia, and much of Eastern Europe, tall apartment blocks were chosen over leafy suburbs. Soviets had no interest in suburbs of any kind because the character of a city “is that people live an urban life. And on the edges of the city or outside the city, they live a rural life”. The rural life was exactly what communist leaders hoped their country would get away from, therefore Soviet planners housed residents near industrial sites so they could contribute to their country through state-sponsored work.

With this assumption, Soviet planners made some logical steps to promote density. They built nurseries and preschools as well as theatre and sports halls within walking distance to worker’s homes.   Communal eating areas were arranged. Also, wide boulevards were crucial for marches and to have a clear path to and from the factory for the workers. The goals of the “socialist city” planners were to not just transform urban planning but human behavior, helping such spaces would breed the “urban human”.

As is common with utopian approaches to cities, problems arose. Rapid development, the speed of construction, the use of night shifts, the long working days, and the inexperience of both workers and management all contributed to frequent technological failures. Contrary to the propaganda, there was a huge gap between the ideal of happy workers thriving in well-managed cities and the reality.  

If today’s architects sometimes obsess over the quality of production and design, the Soviet campaign to expand dense urbanism was less aesthetically oriented. Less than a year after Stalin’s death, in December 1954, Nikita Khrushchev set a campaign to promote the “industrialization of architecture”. He spoke highly of prefabricated buildings, reinforced concrete, and standardized apartments. He did not care for appearances, instead focusing on just building housing because that is what the people need. Prefab tower blocks, called Plattenbau in German and panelaky in Czech and Slovak, were constructed all over the Soviet Union and their satellite states. Originally, these apartments were to house families working for the state.

In 1957, a group of architecture academics from the University of Moscow published a book called the Novye Elementy Rasseleniia or “New Elements of Settlement”. This team of socialist architects and planners --- Alexei Gutnov, A. Baburov, G. Djumenton, S. Kharitonova, I. Lezava, S. Sadovskij--- became known as the “NER Group.”  In 1968, they were invited to the Milan Triennale by Giancarlo de Carlo to present their plans for an ideal communist city. In cooperation with a group of young urbanists, architects, and sociologists, they created an Italian edition of their book under the title Idee per la Citta Communista.    

Alexei Gutnov and his team set to create “a concrete spatial agenda for Marxism”. At the center of The Communist City lay the “The New Unit of Settlement” (NUS) described as “a blueprint for a truly socialist city“. Gutnov established four fundamental principles dictating their design plan. First, they wanted equal mobility for all residents with each sector being at equal walking distance from the center of the community and from the rural area surrounding them. Secondly, distances from a park area or to the center were planned on a pedestrian scale, ensuring the ability for everyone to be able to reasonably walk everywhere. Third, public transportation would operate on circuits outside the pedestrian area, but stay linked centrally with the NUS, so that residents can go from home to work and vice versa easily. Lastly, every sector would be surrounded by open land on at least two sides, creating a green belt.

Gutnov did acknowledge the appeal of suburbia --- “…ideal conditions for rest and privacy are offered by the individual house situated in the midst of nature…”, but rejected the suburban model common in America and other capitalist countries. Suburbs, he argued, are not feasible in a society that prioritizes equality, stating, “The attempt to make the villa available to the average consumer means building a mass of little houses, each on a tiny piece of land. . . . The mass construction of individual houses, however, destroys the basic character of this type of residence.”

The planner’s main concern was ensuring social equality. This was seen in their preference of public transportation over privately owned vehicles, high-density apartment housing over detached private homes, and maximizing common areas. These criticisms of suburban sprawl have some resonance in the   writings by planners advocating “smart growth” today. Both see benefits to high density housing. For one, they argue it is more equitable so everyone, no matter what social class they belong too, can live in the same type of buildings. Some New Urbanists do also like the idea of mixed-income communities. In addition, they both see their ideal community utilizing mixed-use developments, with assuring people easy access to public services such as day care, restaurants, and parks, creating less of a need for private spaces. Similarly, New Urbanists also claim that their planned developments would foster a better sense of community.

Source: Gutnov, Alexi, Baburov, A., Djumenton, G., Kharitonova, S., Lezava, I., Sadovskij, S. The Ideal Communist City. George Braziller: New York. 1971.

Of course, it is easy to go too far with these analogies. Even at their most strident, new urbanists and smart growth advocates do not enjoy anything like monopoly of power than accrued to Communist leaders. And also, not all the ideas of new urbanists, and even the creators of the Ideal Communist City, are without merit. The ideas of walkability, close access to amenities and services, are adoptable even in privately planned, suburban developments. But the dangers of placing ideology before what people prefer are manifest, whether in 20th Century Russia or America today.

Alicia Kurimskais Senior at Chapman University studying History and Political Science, A first generation Slovakian, she spent one year abroad at Anglo-American University in Prague. She is currently working on her thesis which examines the repercussions taken upon the Czechoslovak people following the assassination of Nazi General Reinhard Heydrich in 1942.  

Lead photo of Krushchev-era apartment buidlings in Estonia, "EU-EE-Tallinn-PT-Pelguranna-Lõime 31" by Dmitry G - Own work. Licensed under Public Domain via Wikimedia Commons.


Peak Oil, Yes and No

$
0
0

I have an Australian friend who works on an oil drilling platform off the coast of Tasmania. He sent these photos from his phone. Pretty cool, huh? These photos got me thinking about the Peak Oil meme. For the uninitiated there are two camps on the subject.

One camp says there’s an unlimited amount of oil, natural gas, and coal in the ground and new technology will always be able to bring it to market. Since global demand is insatiable there will always be money on the table to incentivize new supply. This camp tends to shrug off environmental concerns and puts people and economic growth first.

unnamed-8

The other camp says there’s a fixed amount of fossil fuel in the earth’s crust and at some point the cost and complexity of wrestling the last sour crumbs to the surface will hit a wall the market can’t bear. Concerns about environmental degradation and social justice loom large in this camp.

When oil reached $147 a barrel in 2007 the Peak Oil folks felt victorious. They also insisted that record high fuel prices, not merely financial chicanery, precipitated the economic crash of 2008. Today fracking, shale oil, and new deep water discoveries have created a glut of supply with significantly lower energy prices. There’s currently a lot of, “We told you so” from the other side.

My view on the subject is colored by my experiences growing up during the oil shocks of the 1970’s and the resulting economic repercussions. Those shocks were caused by geopolitics in the Middle East during the Yom Kippur War of 1973 and the Iranian Revolution of 1979. They had nothing to do with any physical lack of oil in the world – just supply chain disruptions. But those disruptions were devastating to my family in ways that many people don’t necessarily remember clearly today.

Screen Shot 2014-12-14 at 12.14.06 AM

My parents had just purchased their first home in suburban New Jersey the year before the oil crunch hit. I was seven years old. Like many young couples my parents had put every bit of their savings into the down payment and were stretched very thin in terms of the monthly payments. Everyone in our extended family was working class with middle class aspirations so home ownership was at the top of the must-have list. New York City was falling apart back then so they drove an hour and a half south until they found a four bedroom fixer-upper on a quarter acre lot in a good school district that they could afford. The house wasn’t perfect, but my folks were convinced that it could be improved over time with sweat equity. Their mortgage was $203 a month. At the time that was a heavy burden relative to their modest income. (Adjusted for inflation that would be the equivalent of $1,153 today.)

Economy

We had oil heat like most people in New Jersey back then. A 300 gallon tank in the back yard would keep the house warm for about a month. From early fall until late spring we burned up six tanks on average per year. When we first moved in heating oil sold for 24¢ a gallon. 24¢ x 300 gallons was $72 (or $409 today). That was the number that my parents used when they put together their household budget before buying the house. At the worst point in the oil crisis heating oil sold for $1.20 a gallon. That’s $360 a tank compared to the mortgage payment of $203 (or $2,045 vs. $1,153 in today’s dollars). Think for a moment about your own mortgage or rent. Now think about what would happen to your personal finances if your utility bill unexpectedly became almost double that sum for half the year.

At exactly the same time that our household budget collapsed under the weight of that heating bill, the cost of nearly everything else also rose significantly. Oil is used in the manufacture and transport of just about everything from beef and milk to lawn mowers and toilet paper. As fuel prices rose that additional cost rippled through the entire economy at the precise moment people had the least ability to absorb the increases. Consumer demand for many discretionary items collapsed, people lost their jobs, and the overall result was a considerably lower standard of living. That process played out over an entire decade and did serious damage to my family.

Today most heat in New Jersey comes from natural gas which is cheaper, cleaner, and produced domestically. Problem solved, right? Well… I’m not so sure.

Screen Shot 2014-12-14 at 3.48.07 PM Google

1l-image

The US still imports large amounts of natural gas and oil from other parts of the world – primarily Canada and Mexico along with Venezuela, Columbia, Nigeria, and the Arab nations. These things are priced in a global market so in spite of the “America is the new Saudi Arabia” talk prices can become volatile based on events in other parts of the world. The Bakken shale oil coming out of North Dakota is priced right along with the oil coming out of that oil rig off the coast of Tasmania. If even a small amount of the global oil supply were to be choked off for any reason (the Strait of Hormuz gets shut down due to war, or the Ras Tanura oil terminal is disabled by terrorists) the price of oil would skyrocket worldwide. Natural gas is harder to transport across the seas so that market might appear to be more insulated than the oil market, but if the price of oil jumped it could cause more of those economic ripples that were so troublesome in the ’70s. If you’re unemployed due to an oil shock and you lose your home to foreclosure it may not help that domestic natural gas remains relatively affordable. Peak Oil doesn’t have to be real for me to be concerned about energy and my household security.

I never ever want to find myself in a similar position as my parents so I organize my affairs as if Peak Oil is a legitimate possibility, regardless of the particulars. Listed below are some of my personal rules. Notice, this isn’t a conservative or a liberal list. There’s no mention of bomb shelters or gas masks or firearms to defend against zombies. Nothing on this list will make anyone poorer or less happy. If life continues to be endlessly prosperous and bountiful no one will be missing out on anything. And by the way, these are all things that our great-grandparents did as a matter of course.

image

Keep debt to an absolute minimum. Live below your means in a smaller less expensive place than you can actually afford. Get that mortgage paid off entirely as soon as possible. Unless you have six kids you don’t really need a 2,600 square foot house with a three car garage and a bonus room. Think about the debt you will take on for a fancy kitchen remodel so you can keep up with the Joneses – and then think about how nice it would be to not have a monthly payment of any kind instead. The fancy kitchen is fine if you can pay cash, but that old Formica might look a whole lot better in a mortgage free home. If the economy gets funky and you lose the house to foreclosure the bank could end up enjoying those granite counter tops while you pack your bags and move in with your crazy brother-in-law.

Screen Shot 2014-12-14 at 4.03.26 PM Screen Shot 2014-12-14 at 4.04.35 PMIMG_3282 (800x600)

Live in a place where you can actually walk or ride a bicycle to all of your daily needs including work, school, the doctor’s office, the post office… This doesn’t mean you have to give up your car or stop driving. It just means you’ll have options and flexibility. And this doesn’t have to be Manhattan. Lots of small rural towns and some older suburban areas still have these qualities. Don’t let the grand double height entry foyer out in the McMansion subdivision off the side of the highway distract you from what’s really important in life. It ain’t chandeliers. 

Screen Shot 2014-12-14 at 2.27.04 PM Screen Shot 2014-12-14 at 2.26.13 PM


unnamed-8


Figure out how to keep the house heated and cooled with the minimum amount of fuel of any kind. Start with the low hanging fruit by adding lots of insulation. Then think about adding modest extra sources of heat such as a small south-facing greenhouse addition or a back up wood stove. If you have the money you could spring for some technological bells and whistles like solar panels, but that’s very last on the to-do list after the cheaper more effective conservation stuff is done. Remember, Denmark is the most energy efficient, most “green” nation on earth with 20% of it’s power coming from windmills, but the other 80% of their energy still comes from dirty old fossil fuels like coal. They just use it very sparingly. First get your household consumption way, way down. Then think about green power to supply what little you do use.

unnamed-7 unnamed-13

Find cost-effective ways to secure a plentiful supply of water that isn’t dependent on mechanical pumps or distant supplies that you have no control over. Rainwater catchment off your roof is one such option. Water security is especially important for people who live in a desert or a region that suffers from long periods of drought.

51a9c926fb04d664dc00177e._s.fit_h.640_w.640_
IMG_4847
IMG_4850
Pantry storage room


Keep a really well stocked pantry to help ride out future difficulties. Mine can make a Mormon grandma blush. Maintaining a well stocked pantry is a sensible form of insurance and a hedge against future inflation, unemployment, or temporary shortages.

Sebastopol with MaAntonia 046 (640x480) Screen Shot 2014-12-14 at 4.32.18 PMjjyfcxytr IMG_5381 (480x640) (2)
IMG_5386 (480x640)
Sebastopol with MaAntonia 039 (640x480) Sebastopol with MaAntonia 008 (640x480)

Produce useful things. Plant a big veggie garden and some fruit trees.  Keep chickens. Keep honey bees. Keep meat rabbits. If you have enough space for a dog, then you have enough space for a couple of small dairy goats. If you’re a vegan pacifist you can adjust by ramping up the garden even more. If you’re a skilled hunter you can fill the freezer with venison.

unnamed-9 unnamed-11 unnamed-12 unnamed-10

Cook. (Nuking a tray of Lean Cuisine doesn’t count.) Learn to bake a loaf of bread from scratch. A pot of bean soup is ridiculously inexpensive and dead easy. If your kids will only eat pizza then learn how to make it at home. In fact, teach your kids how to make it themselves as a family project. This stuff isn’t rocket science. While you’re at it learn to sew or knit or do woodworking. These skills can be rewarding unto themselves as hobbies, and you never know when they might actually become necessary. 

Screen Shot 2014-10-08 at 1.19.32 AM Screen Shot 2014-10-08 at 1.21.00 AM Screen Shot 2014-10-08 at 1.16.59 AM

Get to know your neighbors and build relationships of trust with like-minded people in your community. These associations can be extremely helpful in a crisis. If Peak Oil never occurs you’ve lived a comfortable, affordable, secure life surrounded by good people. How cool is that?

John Sanphillippo lives in San Francisco and blogs about urbanism, adaptation, and resilience at granolashotgun.com. He's a member of the Congress for New Urbanism, films videos for faircompanies.com, and is a regular contributor to Strongtowns.org. He earns his living by buying, renovating, and renting undervalued properties in places that have good long term prospects. He is a graduate of Rutgers University.

Bicycles and Race in Portland

$
0
0

The flashpoint for the gentrification conversation along Portland’s North Williams revolves around the bicycle. The cultural appetite for what the creative class likes and enjoys is in stark contrast to that of the African-American community. “North Williams Avenue wasn’t hip back in the late 1970s. There was no Tasty n Sons. No Ristretto Roasters. No 5th Quadrant. Back then, it was the heart of the African American community. It was wonderfully colorful and gritty.” As the black community saw their own businesses close down through economic disinvestment, they weren’t replaced with new businesses that they regarded as desirable. In the several hours I spent today at Ristretto I have seen roughly a hundred patrons come in and go out, plus others sitting outside on the patios of one of several nearby restaurants. Only three were African-American. As I mentioned earlier, the buildings that surround this coffee shop are home to many African-American families. And yet these new businesses do not appeal to their cultural tastes.

This all came to a head over a road project to reconfigure North Williams and Vancouver Avenue. Both are one-way roads a block apart that carry a high volume of bicycle traffic. Vancouver’s southbound traffic flows carry cyclists towards the Lloyd Center and downtown Portland and so sees its heaviest usage in the mornings. Williams on the other hand carries northbound traffic away from the city center which means its highest use is in the afternoons and evenings when bicycle commuters are heading away from the city center. But the focal point of all of this controversy is specifically tied to North Williams Avenue because this is where most of the new businesses are coming in.

A New York Times article featured this stretch of road including one of the business owners who opened up the beloved Hopworks BikeBar. “North Williams Avenue [is] one of the most-used commuter cycling corridors in a city already mad for all things two-wheeled. Some 3,000 riders a day pass by Mr. Ettinger’s new brewpub, which he calls the Hopworks BikeBar. It has racks for 75 bicycles and free locks, to-go entrees that fit in bicycle water bottle cages, and dozens of handmade bicycle frames suspended over the bar areas. Portland is nationally recognized as a leader in the movement to create bicycle-friendly cities.” Other national newspapers and magazines have also picked up on all of the buzz happening along North Williams. In Via Magazine, Liz Crain writes, “With 3,000 commuters pedaling it every day, North Williams Avenue is Portland’s premier bike corridor. Visitors, too, find plenty worth braking for on two blocks of this arterial, including two James Beard Award–nominated chef-owned restaurants and a slew of hip shops and cafés.” Sunset Magazine has several features on North Williams including: “Go green on Portland’s North Williams Avenue: Enjoy a low-key urban vibe thanks to yoga studios, indie shops, and cafes.”

With images of happy (white) hipsters pedaling bicycles, doing yoga, and eating gourmet food, the nation is given a taste of inner N/NE Portland that is not reflective of the reality of the neighborhood nor the tension surrounding gentrification. These magazines showcase things to see, do, and eat along North Williams with helpful hints like, “Scene: A low-key urban vibe, courtesy of yoga studios and green indie shops and cafes … Dress code: waterproof jacket and jeans with right leg rolled up … Native chic: A waterproof Lemolo bike bag … The Waypost: Creative types come to this coffeehouse for locally produced wine and beer, as well as live music, lectures, and classic-movie screenings.”

However, not all of the residents are necessarily in favor of these changes taking place. And there are certainly other national media outlets who have picked up on the “other side” of the North Williams story. “Located in a historic African-American community, the North Williams businesses are almost exclusively white-owned, and many residents see bicycles as a symbol of the gentrification taking place in the neighborhood.”

The tensions of racism and gentrification have culminated in ongoing debates over North Williams’ status as a major bicycle thoroughfare. Sarah Goodyear of The Atlantic Cities (CityLab) writes, “Sharon Maxwell-Hendricks, a black business owner who grew up in the neighborhood, has been one of the most vocal opponents to the city’s plan for a wider, protected bike lane. She can’t help but feel that the city seems only to care about traffic safety now that white people are living in the area. ‘We as human beings deserved to have the same right to safer streets years ago,’ she says. ‘Why wasn’t there any concern about people living here then?’” This picks us on the tension surrounding the North Williams project in general, and in particular the controversy surrounding repainting the traffic lanes to incorporate new designs which cater to the growing number of bicyclists who use this corridor.

Goodyear goes on to lay out both sides of the controversy:

Jonathan Maus, who runs the Bike Portland blog and has reported extensively on the North Williams controversy, thinks the city should have stood its ground and gone forward with the project, but wasn’t willing to do so in part because of the political weakness of scandal-plagued Mayor Sam Adams, who has been a strong biking advocate and is closely identified with the biking community.

“There’s been too much emphasis on consensus,” said Maus. “I’m all for public process, but I also want the smartest transportation engineers in the country on bicycling to have their ideas prevail.”

Maus, who is white, says the history of North Williams shouldn’t be dictating current policy, and that safety issues for the many people who bike on the street are urgent. “At some point as a city, you have to start planning to serve the existing population,” he said. “The remaining black community is holding traffic justice hostage. It’s allowing injustice in the present because of injustice in the past.”

In light of this, why is North Williams the flashpoint for controversy? The tension and angst is about more than simply repainting a roadway; it embodies the most visual representation of gentrification in inner N/NE Portland. For longtime African-American residents, as expressed above by Maxwell-Hendricks, she and others felt that they had simply been neglected for decades. This negligence took the form of economics, housing, and general concerns of safety. Their frustration is that it wasn’t until middle-class whites began moving into the neighborhood that these issues began to be addressed and rectified. This notion of systemic racism helped created this area and these same forces are at play in gentrifying this once predominantly black neighborhood.

The African-American community feels it has been slighted once again. The initial citizen advisory committee revealed the imbalance: “Despite North Williams running through a historically African American neighborhood, the citizen advisory committee formed for the project included 18 white members and only 4 non-white members.” This is why the push for safety along the North Williams corridor has caused such an uproar. “The current debate about North Williams Avenue––once the heart of Albina’s business district––is only the latest chapter in a long story of development and redevelopment.”

For many in the African-American community the current debate over bike lanes along North Williams is simply one more example in a long line of injustices that have been forced upon their neighborhood. Beginning in 1956, 450 African-American homes and business were torn down to make way for the Memorial Coliseum. “It was also the year federal officials approved highway construction funds that would pave Interstates 5 and 99 right through hundreds of homes and storefronts, destroying more than 1,100 housing units in South Albina.” Then came the clearance of even more houses to make way for Emanuel Hospital. For more than 60 years, racism has been imbedded in the storyline of what has taken place along North Williams.

For many, the North Williams project is more than repainting lines. As Maus reported, “A meeting last night that was meant to discuss a new outreach campaign on N. Williams Avenue turned into a raw and emotional exchange between community members and project staff about racism and gentrification.” In his article, Maus noted the painful history of Albina as the primary catalyst for the tension today.

Lower Albina—the area of Portland just north and across the river from downtown through—was a thriving African-American community in the 1950s. Williams Avenue was at the heart of booming jazz clubs and home to a thriving black middle class. But history has not been kind to this area and through decades of institutional racism (through unfair development and lending practices), combined with the forces of gentrification, have led to a dramatic shift in the demographics of the neighborhood. The history of the neighborhood surrounding Williams now looms large over this project.

It was at this meeting that a comment from one of those in attendance changed the entire trajectory of the evening as the conversation quickly moved away from the proposed agenda. One woman said, “We have an issue of racism and of the history of this neighborhood. I think if we’re trying to skirt around that we’re not going to get very far. We really need to address some of the underlying, systemic issues that have happened over last 60 years. I’ve seen it happen from a front row seat in this neighborhood. It’s going to be very difficult to move forward and do a plan that suits all of these stakeholders until we address the history that has happened. Until we address that history and … the cultural differences we have in terms of respect, we are not going to move very far.”

The crux of the conflict is not about bicycles nor bike lanes nor even new businesses and amenities. It is about racism. The push for creating a more bikeable and bike-friendly commuter corridor has raised the ire of longstanding residents who had felt neglected and voiceless for decades. “The North Williams case study is an example of the City inadequately identifying, engaging and communicating with stakeholders.”

Now that more whites are moving in are changes taking place. “Some question why the city now has $370,000 to pour into a project they say favors the bike community while residents for decades asked for resources to improve safety in those same neighborhoods. To the community, the conversation has polarized the issue: white bicyclists versus the black community.” But is this issue completely race-related? Portland has been and continues to expand its bicycle infrastructure throughout the city, not just in N/NE Portland. There are also several other main bicycle corridors that receive a high volume of bicycle commuters, but since they do not go through any ethnic neighborhoods they have not created this much controversy. This does not minimize the tension and angst over the North Williams project; nor does it downplay the role that racism has played throughout the history of that community.

Note: Footnotes in the original text have been removed. Some hyperlinks have been added.

This is a condensed chapter excerpt from The Bohemian Guide to Urban Cycling.

Coffee and bicycles define Sean's urban existence who believes the best way for exploring cities is on the seat of a bicycle as well as hanging out in third wave coffee shops. Sean is an urban missiologist who works in a creative partnership between TEAM as the Developer of Urban Strategy and Training and the Upstream Collective leading the PDX Loft.

Roadmap to Surprises of the Rustbelt

$
0
0

Back in New York, no one quite believed my accounts of urban renewal across the Midwest, through a piece of the Rustbelt, and then back — that St. Louis is the Brooklyn of the heartland, or that even downtown Buffalo has charms. I tended to be on safer ground when I described Targeted small towns in Ohio, or drive-by shootings in Chicago.

Despite the skepticism I knew I would eventually encounter, my idea was to go intercity with mass transit and to get around locally with my bike. I found that the downtown areas of many Midwestern cities are vibrant, rust free, and often ideal for biking, as well as for hotels, trendy restaurants, and funky businesses.

It’s on the periphery of these Potemkin-convention cities that the bright lights dim on the porches of ramshackle wooden frame houses. That's where the new ghettos look less like rundown public housing and more like rural shanties that have washed up in earlier working-class suburbs.

Does it work to travel from Chicago to New York with a folding bike on trains and buses? Give or take, I managed fine. Amtrak grudgingly accepts folding bikes as normal luggage (it is easier to take a gun on board Amtrak than a full-sized bike), and intercity bus drivers (many are cheerful souls) are indifferent about baggage stowed below.

The bigger problem in my planning was that few trains other than freights cut across the heartland from St. Louis to Cleveland. While buses do make the connections — say, from Terre Haute to Bloomington, Indiana — many of my departures took place between 5 and 6 a.m., the time that a friend calls o’dark.

Nor were the intermodal connections seamless. Routinely, I was dumped off the bus at a Hardee’s in Nowheresville. Between Quincy, Illinois, and Hannibal, Missouri, the only place open at lunchtime was an adult superstore, but I hadn’t worked up an appetite for lace underwear.

Herewith, by city, are some observations from behind the handlebars:

Chicago: I went all over Chicago on the bike, from Frank Lloyd Wright’s show-homes in Oak Park to the South Side slums (where that weekend twelve people were wounded in assorted shootings). I also made it to the old stockyards, Haymarket Square (of anarchist fame), and the Hyde Park home of President Barack Obama, which now is unpleasantly hidden away behind tall trees, concrete anti-terror barriers, and snarling guards, giving it the air of a Beirut embassy.

Beyond the elegant Loop, lakefront, university districts, and various solid neighborhoods, Chicago has endless stretches of abandoned warehouses—no man’s lands between the city and suburbs, belts in search of manufacturing.

I felt better when I found where the Marx Brothers had lived when they were still playing vaudeville; Ernest Hemingway’s boyhood home (when he sported curls in what he famously called that place of “broad lawns and narrow minds”); and a magnificent bike lane that sweeps along Lake Michigan. I even found myself agreeing with former vice president Dan Quayle, who said “It is wonderful to be here in the great state of Chicago.”

St. Louis: Few city downtowns are as pleasant as that of St. Louis, which struck me as having a perfect mix of parks, restaurants, stadiums, hotels, and office buildings converted into residential lofts, many with views of the Mississippi and the Gateway Arch. I biked out as far as Clayton, Missouri, through the incomparable Forest Park, and looped around several universities, hospitals, and museums, all of which add to the city’s infrastructure luster.

Most of what I saw was white St. Louis, as gracious as a southern plantation, although coming and going I went through northern and eastern satellite suburbs — Ferguson is one of many — where the local economy seems to revolve around selling tires, check cashing, and all-night convenience stores.

Indianapolis: On the way from St. Louis to Indianapolis, I stopped in Springfield (part of a Lincoln haj) and Terre Haute. My bus into the Indiana capital left me at the “downtown transit center,” a dreary cave of broken vending machines, now that the former railroad station is an elegant hotel.

The rest of downtown Indianapolis sparkled, and I spent the best day of my travels ducking into the Eiteljorg Museum of American Indians and Western Art, drinking coffee on sunny terraces, following bike paths, exploring the canals, and touring the city’s many universities, Butler and Indiana-Purdue among them.

Only when I went out on the bike that night looking for the boyhood home of writer Kurt Vonnegut did I find the other Indianapolis, which is camped out in dilapidated wooden frame houses or low-rise housing projects, clearly off the convention-city grid. No wonder Vonnegut wrote “So it goes.”

Canton: So poorly is Ohio served with public transportation that I was forced to rent a car to go from Dayton Trotwood (a sad shopping center where the Indianapolis bus dropped me) to Canton and Cleveland. I stuck mainly to the secondary roads, often clogged with traffic and slow lights. Unless someone can add a dome, Astroturf, and The Gap to Hometown USA, it will be lost.

Canton was the saddest city on my travels. Not even the presence of the Pro Football Hall of Fame or William McKinleyism can put a positive spin on the vacant lots and boarded-up storefronts.

Cleveland: I was back on the bike, and loved much of what I saw downtown in the canyons of Art Deco office buildings.

Cleveland is more of an extended suburb than a city — if not a state of mind with a football team — although it can quickly change from blocks of lakefront mansions to rows of seedy body shops… emphasis here on the word “body”.

Buffalo: On my night bike ride into the city from Amtrak’s suburban Depew Station, I passed through a series of depressing slums and at one point had to out-sprint a highwayman who wanted to steal my rig. (“Give me that fucking bike,” is how he introduced himself.)

The new ghetto arose from the old working class neighborhoods; a nether world in the shadows of subsidized convention centers and urban renewal towers. Buffalo at night is a ghost town, although I loved riding north along Delaware Avenue to the state university.

In upstate New York, I made a loop around the Finger Lakes through such rustbelt stalwarts as Corning, Binghamton, Syracuse, and Auburn. The delight was Elmira, with its local college that has the Mark Twain writing studio in which he wrote Tom Sawyer and Huckleberry Finn. Ithaca is a labyrinth of universities and dead-end streets that gets my vote for the most confusing city grid in America.

Syracuse at night — on the bike or waiting at the bus station — felt like the set of a sci-fi movie in which everyone has been vaporized. Binghamton aspires to hipness, but, well, it’s Binghamton. At least Auburn has the prison, and at midnight its strange aurora borealis of klieg lights made my bike vest glow like medieval chain-mail.

A series of buses and commuter trains took me down to New York City. I had booked on Amtrak, but its Lake Shore Limited was routinely seven or more hours late. One conductor blamed the delays on the weather from the previous winter, although my seat mate said impoverished locals robbed the copper from the track signals.

At the end of my riding, I think I came across as someone as morose as the novelist Theodore Dreiser, who took what he called “a Hoosier holiday,” at a time when, as he wrote, “America was in the furnace stage of its existence.” But I defy anyone who doesn’t take heart from a Lake Erie sunrise.

Photo by the author: Downtown Cleveland from Lake Erie

Matthew Stevenson, a contributing editor of Harper’s Magazine, is the author, most recently, of Remembering the Twentieth Century Limited, a collection of historical travel essays, and Whistle-Stopping America. His next book, Reading the Rails, will be published in 2015. He lives in Switzerland.

Obama Pushes the Pace of Policy

$
0
0

With his recent series of executive actions on U.S. policies ranging from climate to energy, immigration and, most recently, Cuba, Barack Obama is working to fulfill his long-held dream of being a “transformative” president. By decisively circumventing Congress with bold decrees, the president has won the plaudits of his core media supporters, with predictable “amens” from Eugene Robinson in the Washington Post and from the New York Times’ Paul Krugman, who described him as a more “transformative” president than either Bill Clinton or Ronald Reagan.

From his earliest days in office, Barack Obama made no secret of his desire to be a “transformational” president. And in Washington’s alternate reality, many in the media still revere Obama, a president with approval numbers in the low 40s, according to RealClearPolitics.com. One giddy CNN commentator even compared our chief executive to “Superman.” Obama insiders have little doubt about his greatness. Former campaign manager Jim Messina calls him not only “transformative” but among the “all-time great presidents.”

Yet, despite these huzzahs, it seems that voters are less than impressed. One reason: Americans may want some change – and may even be willing to sacrifice some to achieve it – but appear less enthusiastic about being “transformed.” They seem more comfortable with change done through the evolutionary swamp of congressional politics, reaching consensus on important issues and being presidential the old-fashioned way.

The most recent transformational president, ironically, was George W. Bush. In his case, this was less a matter of ambition (or even narcissism) than a reaction to the events of 9/ll. Bush’s transformational reordering of American foreign and military policy left us with a persistent mess that his successor, and, likely, Obama’s successors, will have to clean up.

Foreign Policy

Likewise, it’s hard to see this president’s “transformative” foreign policy ideas as particularly successful, or even well-considered. In many ways, notes Harvard’s Joseph Nye, our best foreign-policy presidents – such as George H.W. Bush or Dwight Eisenhower – are “transactional,” while rejecting what he calls “the cult of transformative leadership” pursued by such idealists as Woodrow Wilson, George W. Bush or Barack Obama.

When he took office nearly six years ago, Obama was determined to “reach out” to the Islamic world. Given his own multicultural background, not to mention his famously silvered tongue, Obama seemed sure to turn the Islamic world into our ally. But, as is so often the case, in reality, the U.S. has become steadily less popular since his election. It appears that Muslims have been no more mollified by Obama’s words, not to mention his drones, than by George W. Bush’s bolder bombs-away interventions.

Another exercise in transformational futility has been Obama’s much-hyped “pivot to Asia.” He’s ended up pivoting in circles while China begins to construct its own version of wartime Japan’s imperialist “Greater East Asian Co-Prosperity Sphere.” As China’s military capacities grow, the president is stripping down, something that terrifies our friends in East Asia.

Climate Change

Perhaps no issue has less resonance with ordinary Americans than climate change, ranking consistently at the bottom of voters’ expressed concerns. In survey after survey, economic issues such as unemployment, the economy and the federal budget resonate with voters, while climate change barely registers.

But among those closest to Obama, and to the gentry liberals who are his primary funders, there is no issue more “transformational” than climate change. After all, only a transformative president, like a modern-day Moses, can keep the waters from rising over us as we flee the evil pharaohs of the fossil fuel industry.

This is not to say climate is not a concern, even if you are skeptical about some advocates’ more hysterical claims. It is probably a good idea to address carbon emissions, if for no other reason than pollution is bad and that the scientific “consensus,” although far from unimpeachable, is strong enough to suggest taking steps not to overheat the planet. So the question is how to best address this issue, and at what cost.

Unfortunately, the president’s transformational addiction has led to some poor, and likely counterproductive, decisions. This actually hurts the green cause, as most Americans, according to a recent study appearing in the journal Nature Climate Change, are more interested in adapting to climate change than radically reorienting their lifestyles to prevent it. They may fear a changing climate, but not so much that they want to disrupt their lives in the kind of radical ways suggested by many environmental activists and their business backers.

One thing Americans are not enthusiastic about is – in the name of climate change – sending more of their jobs to developing countries. Obama’s recent much-ballyhooed pact with China on emissions allows the world’s fastest-growing polluter, with a terrible record on this issue, to reject scrutiny of its efforts to limit carbon emissions until 2030. India, another rising greenhouse emitter, refuses even to set a similarly bogus deadline.

This all leaves America, and its even more clueless European allies, slouching toward the nirvana of an energy base dependent on “renewables.” In Germany, and here in California, radical steps have raised energy prices and pushed industries to seek out places with less-Draconian regulations. Sadly, neither greens nor the administration has embraced the more evolutionary approach: substituting natural gas for far-dirtier coal. This switch has already helped the U.S. reduce its carbon emissions faster than any major country, far more, indeed, than the self-righteous Europeans, whose expensive and inefficient green policies have left them burning more coal.

Immigration

As with climate change and foreign policy, good intentions no doubt underpinned the president’s recent orders affecting undocumented U.S. residents. But the way the measure was carried out – after the election, and without the support of Congress – all but guarantees deeper conflict over immigration policy in the coming years. Although most Americans support some form of legalization, most, including many Latinos, also opposed using executive authority to do so.

Getting legislation through Congress may well be painful, and slow, but there is something worthwhile in achieving broad support within both parties. This is particularly true when the opposition, as it does now, has a near-record degree of control of the House and a solid majority in the incoming Senate. The Reagan 1986 amnesty plan had its critics, but it allowed this critical issue to be handled in a bipartisan way. Reagan, clearly a more transformative president than either George W. Bush or Obama, still followed the basics of the Constitution, and acknowledged the importance of getting broad congressional buy-in on his policies.

But, given the imperial manner that Obama employed, immigration policy can be dismissed by some as little more than an effort to expand big government’s – and the Democratic Party’s – client base into the next century. One can argue that this strategy is, indeed, transformational, but in a way that threatens to exacerbate ethnic tensions and worsen the economic plight of citizens – Latino and otherwise – already in the country.

Back to Evolution

The president’s bids, without popular or congressional support, to achieve transformation by decree represents a dangerous turn for the entire political process. This is unhealthy in the long term, not only for Republicans and conservatives, but, down the road, likely for liberals as well. Liberals like law professor Jonathan Turley believe his fellow liberals may someday “rue” their support for Obama’s “uber-presidency” when a conservative president, citing the Obama precedent, also rules by decree.

The overall growth of transformational politics endangers the country. If conservatives sometimes overreach in terms of military affairs or regulations in the bedroom, modern transformational liberalism sees itself as blessed by the gods of science, while, of course, ignoring those things – such as the efficacy of natural gas or the need for GMO foods – that are not compatible with their worldview. These polarized positions leave as many as three in five voters, according to Gallup, wishing for a third party.

A healthy political system, of course, changes, but needs to do so – outside of a major emergency – at a pace that the population can absorb. Every significant change in recent years – from growing legalization of marijuana and gay marriage to bold experiments in educational reform – has come, as it should, from states and localities. This allows change to occur congruent with the values of specific locales, and go national only when this stance appeals to the majority of legislators and voters.

As we know from nature, evolution is often messy, and sometimes how it works is surprising. But, with patience and time, natural systems, like political ones, tend to be able to rebalance and adapt. By jettisoning evolution for transformation, President Obama, following a predecessor seen by many as inept, has made this adjustment process far more difficult and contentious than it would otherwise be.

This piece first appeared at The Orange County Register.

Joel Kotkin is executive editor of NewGeography.com and Roger Hobbs Distinguished Fellow in Urban Studies at Chapman University, and a member of the editorial board of the Orange County Register. His newest book, The New Class Conflict is now available at Amazon and Telos Press. He is author of The City: A Global History and The Next Hundred Million: America in 2050. His most recent study, The Rise of Postfamilialism, has been widely discussed and distributed internationally. He lives in Los Angeles, CA.

Barack Obama photo by Bigstock.

U.S. Economy Needs Hardhats Not Nerds

$
0
0

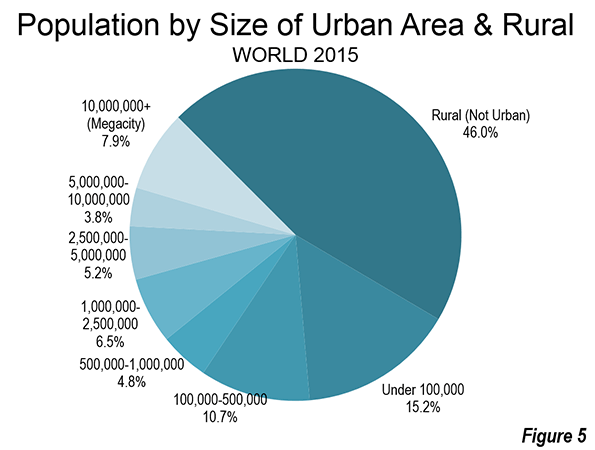
The blue team may have lost the political battle last year, but with the rapid fall of oil and commodity prices, they have temporarily gained the upper hand economically. Simultaneously, conditions have become more problematical for those interior states, notably Texas and North Dakota, that have benefited from the fossil fuel energy boom. And if the Obama administration gets its way, they are about to get tougher.

This can be seen in a series of actions, including new regulations from the EPAand the likely veto by the president of the Keystone pipeline, that will further slow the one sector of the economy that has been generating high-paid, blue collar employment. At the same time, housing continues to suffer, as incomes for the vast majority of the middle class have failed to recover from the 2008 crash.

Manufacturing, which had been gaining strength, also now faces its own challenges, in large part due to the soaring U.S. dollar, which makes exports more expensive. Amidst weakening demand in the rest of the world, many internationally-oriented firms such as United Technologies and IBM forecast slower sales. Low prices for oil and other commodities also threatens the resurgence of mainstream manufacturers such as Caterpillar, for whom the energy and metals boom has produced a surge in demand for their products.

Left largely unscathed, for now, have been the other, less tangible sectors of the economy, notably information technology, including media, and the financial sector, as well as health services. In sharp contrast to manufacturing, energy, and home-building, all of these sectors except health care are clustered in the high-cost, blue state economies along the West Coast and the Northeast. As long as the Fed continues to keep interest rates very low, and maintains its bond-buying binge, these largely ephemeral industries seem poised to appear ever more ascendant. No surprise then that one predictably Obama-friendly writer called the current economy “awesome” despite weak income growth and high levels of disengagement by the working class in the economy. If Wall Street and Silicon Valley are booming, what else can be wrong?

Should the whole economy become more bluish?

One consistent theme of blue-state pundits, such as Richard Florida, is that blue states and cities “are pioneering the new economic order that will determine our future.” In this assessment, the red states depend on an economy based on energy extraction, agriculture and suburban sprawl. By this logic, growing food for mass market consumers, building houses for the middle class, making cars, drilling for oil and gas—all things that occur in the red state backwaters—are intrinsically less important than the ideas of nerds of Silicon Valley, the financial engineers of Wall Street, and their scattered offspring around the country.

But here’s a little problem: these industries do not provide anything like the benefits that more traditional industries—manufacturing, energy, housing—give to the middle and working classes. In fact, since 2007, according to the Bureau of Labor Statistics, the information and technology sectors have lost more than 337,000 jobs, in part as traditional media jobs get swallowed by the Internet. Even last year, which may well prove the height of the current boom, the information and technology industry created a net 2,000 jobs. And while social and on-line media may be expanding, having added 5,000 jobs over the last decade, traditional media lost ten times as many positions, according to Pew.

In contrast, energy has been a consistent job-gainer, adding more than 200,000 jobs during the same decade. And while manufacturing lost net jobs since 2007, it has been on a roll, last year adding more than 170,000 new positions. Construction, another sector hard hit in the recession, added 213,000 positions last year. The recovery of these industries has been critical to reducing unemployment and bringing the first glimmer of hope to many, particularly in the long suffering Great Lakes region.

These tangible industries seem to be largely irrelevant to deep blue economies. A prospective decline of energy jobs, for example, does not hurt places like California or New York, which depend heavily on other regions to do the dirty work. Overall, for example, California, despite its massive energy reserves, created merely 15,000 jobs since 2007, barely one-tenth as many as in Texas. Energy employment in key blue cities such as New York and San Francisco has remained stagnant, and actually declined in Boston.

Similarly, a possible slowdown in manufacturing—in part due to an inflated dollar, depressed international demand, and the loss of industrial jobs tied to energy—will affect different regions in varying degrees. Since 2009, the manufacturing renaissance has been strongly felt in traditional hubs like Detroit, Grand Rapids, and Louisville, as well as energy-charged places such as Houston and Oklahoma City. All saw manufacturing growth of 10 percent or more. Meanwhile New York, Los Angeles, Chicago, San Francisco, and Boston all lost industrial positions.

Finally, there remains the housing sector, a prime employer of blue collar workers and the prime source of asset accumulation for middle class families. Sparked by migration and income growth, construction growth has been generally stronger in Texas cities but far more sluggish in New York and California, where slower population growth and highly restrictive planning rules make it much tougher to build affordable homes or new communities. Last year at the height of the energy boom, Houston alone built more single family homes than the entire state of California.

If you think inequality is bad now …

The new ephemera-based economy thrills those who celebrate a brave new world led by intrepid tech oligarchs and Wall Street money-men. The oligarchs in these industries have gotten much, much richer during the current recovery, not only through stocks and IPOs, but also from ultra-inflated real estate in select regional areas, particularly New York City and coastal California. As economist George Stiglitz has noted, such inflation on land costs has been as pervasive an effect of Fed policy as anything else.

Even in Houston, some academics hail the impending “collapse of the oil industrial economy,” even as they urge city leaders to compete with places like San Francisco for the much ballyhooed “creative class.” Yet University of Houston economist Bill Gilmer notes that low energy prices are driving tens of billions of new investment at the port and on the industrial east side of the city. This growth, he suggests, may help offset some of the inevitable losses in the more white collar side of the energy complex.

The emergence of a new ephemera-led economy bodes very poorly for most Americans, and not just Texans or residents of North Dakota. The deindustrialized ephemera-dominated economy of Brooklyn, for example, has made some rich, but overall incomes have dropped over the last decade; roughly one in four Brooklynites, overwhelmingly black and Hispanic, lives in poverty. Similar patterns of increased racial segregation and middle class flight can be found in other post-industrial cities, including one-time powerhouse Chicago, where areas of  concentrated poverty have expanded in recent years.

Nowhere is this clearer than in ephemera central: California. Once a manufacturing juggernaut and a beacon of middle class opportunity, the Golden States now suffers the worst level of poverty in the country. While Silicon Valley and its urban annex, San Francisco, have flourished, most of the state—from Los Angeles to the Inland regions—have done poorly, with unemployment rates 25 percent or higher than the national average. The ultra-“progressive” city now suffers the most accelerated increase in inequality in the country.

Similar trends have also transformed Silicon Valley, once a powerful manufacturing, product-producing center. As the blue collar and much of older middle management jobs have left, either for overseas or places like Texas or Utah, the Valley has lost much of its once egalitarian allure. San Jose, for example, has long been home to the nation’s largest homeless encampment. Black and Hispanic incomes in the Valley, notes Joint Venture Silicon Valley, have actually declined amidst the boom, as manufacturing and middle management jobs have disappeared, while many tech jobs are taken by predominately white and Asian younger workers, many of them imported “techno-coolies.”

In contrast, the recoveries in the middle part of the country have been, to date, more egalitarian, with incomes rising quickly among a broader number of workers. At the same time, minority incomes in cities such as Houston, Dallas, Miami, and Phoenix tend be far higher, when compared to the incomes of Anglos, than they do in places like San Francisco, New York, or Boston. In these opportunity cities, minority homeownership—a clear demarcation of middle income aspiration—is often twice as high as it is in the epicenters of the ephemeral economy.

To succeed in the future, America needs to run on all cylinders.

The cheerleaders of the ephemeral economy often point out that they represent the technological future of the country, and concern themselves little with the competitive position of the “production” economy—whether energy, agriculture, or manufacturing. They also seek to force the middle class into ever denser development, something not exactly aspirational for most people.

Nor is the current ephemera the key to new productivity growth. Social media may be fun, but it is not making America more competitive or particularly more productive (PDF). Yet there has been strong innovation in “production” sectors such as manufacturing, which alone accounts for roughly half (PDF) of all U.S. research and development.

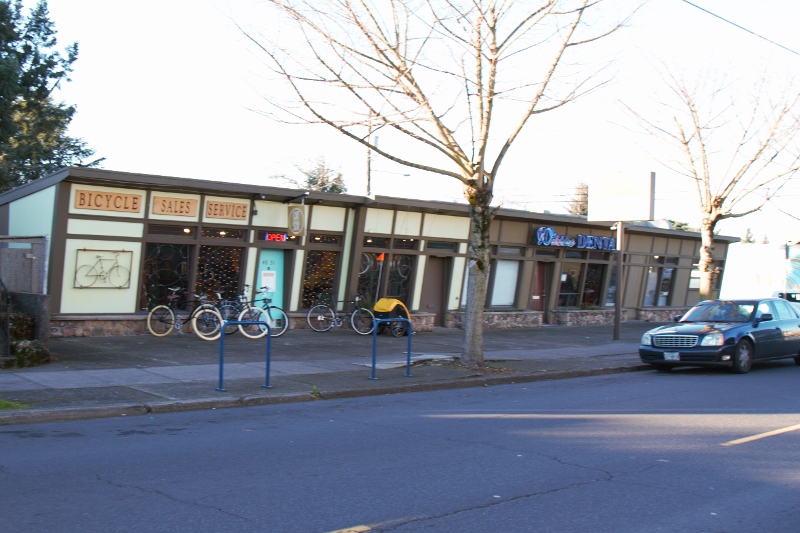
What is frequently missed is that engineering covers a lot of different skills. To be sure the young programmers and digital artists are important contributors to the national economy. But so too are the many more engineers who work in more mundane fields such as geology, chemical, and civil engineering. Houston, for example, ranks second (PDF) behind San Jose in percentage of engineers in the workforce, followed by such unlikely areas as Dayton and Wichita. New York, on the other hand, has among the lowest percentage of engineers of major metropolitan areas.

To be sure, an aerospace engineer in Wichita is not likely to seem as glamorous as the youthful, urbanista app-developers so lovingly portrayed in the media. Yet these engineers are precisely the people, along with skilled workers, who keep the lights on, planes flying and cars going, and who put most of the food on people’s tables.

The dissonance between reality and perception is most pronounced in California. The state brags much about the state’s renewable sector to the ever gullible media. But in reality high subsidized solar and wind account for barely 10 percent ofelectrical production, with natural gas and coal, now mostly imported from points east, making up the vast majority. In terms of transportation fuels, the state has a96 percent dependence on fossil fuels, again large imported, despite the state’s vast reserves. Los Angeles, although literally sitting on oil, depends for 40 percent of its electricity on coal-fired power from the Intermountain West.

Equally critical, the now threatened resurgence of the industrial and energy sectors could reverse trends that have done more to strengthen the U.S. geopolitical situation than anything else in recent decades. Foreign dictators can easily restrict a Google, Facebook, or Twitter, or create locally-based alternatives; for all its self-importance, social media has posed no mortal danger to authoritarian countries. In contrast, the energy revolution has undermined some of the world’s most venal and dangerous regimes, from Saudi Arabia and Iran to Russia and Venezuela.

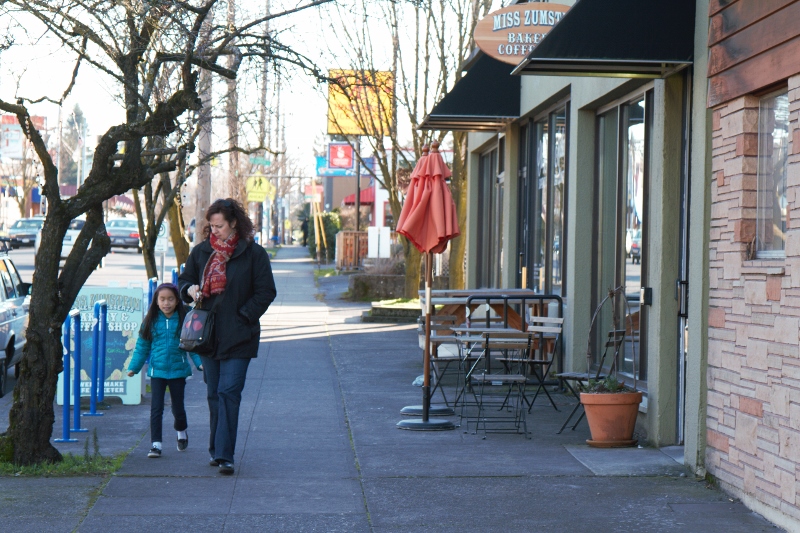
In no way do I suggest we don’t need the ephemeral sectors. Media, social and otherwise, remain important parts of the American economy, and testify to the country’s innovative and cultural edge. But these industries simply cannot drive broader based economic growth and opportunity. Part of the problem lies in the nature of these industries, centered largely in Silicon Valley and San Francisco, which require little in terms of blue collar workers. Another prime issue is that these areas can only import so many people from the rest of country due to extraordinary high housing costs.

Under current circumstances, the centers of the ephemeral economy such as New York or San Francisco cannot accommodate large numbers of upwardly mobile people, particularly families. These, for better or worse, have been vast gated communities that are too expensive, and too economically narrow, to accommodate most people, except those with either inherited money or elite educations. This is why Texas—which has created roughly eight times as many jobs as California since 2007 and has accounted for nearly one-third of all GDP growth since the crash—remains a beacon of opportunity, and the preferred place for migrants, a slot that used to belong to the Golden State.

As a country, we stand at the verge of a historical opportunity to assure U.S. preeminence by melding our resource/industrial economy with a tech-related economy. Our strength in ephemera can be melded with the power of a resource and industrial economy. In the process, we can choose widespread and distributed prosperity or accept a society with a few pockets of wealth—largely in expensive urban centers—surrounded by a downwardly mobile country.

The good news is America—alone among the world’s largest economies—has demonstrated it can master both the ephemeral and tangible economies. To thrive we need to have respect not for one, but for both.

This piece first appeared at The Daily Beast.

Joel Kotkin is executive editor of NewGeography.com and Roger Hobbs Distinguished Fellow in Urban Studies at Chapman University, and a member of the editorial board of the Orange County Register. His newest book, The New Class Conflict is now available at Amazon and Telos Press. He is author of The City: A Global History and The Next Hundred Million: America in 2050. His most recent study, The Rise of Postfamilialism, has been widely discussed and distributed internationally. He lives in Los Angeles, CA.

World Megacities: Densities Fall as they Become Larger

$
0
0

There is an impression, both in the press and among some urban analysts that as cities become larger they become more densely populated. In fact, the opposite is overwhelmingly true, as Professor Shlomo Angel has shown in his groundbreaking work, A Planet of Cities. This conclusion arises from the fact that, virtually everywhere, cities grow organically so that they add nearly all of their population on the urban fringe, which has considerably less expensive land. As their physical form of cities (the urban area) expands, the residents per unit of developed area generally falls.

Previous Analysis

Two years ago, we analyzed growth patterns among the 23 world megacities that had been described in the Evolving Urban Form series. Megacities are urban areas with more than 10 million residents. This article extends the analysis to the other 11 megacities that will be included in the soon to be published 11th edition of Demographia World Urban Areas.

Sadly, historical data is simply not available for the most urban areas. Urban areas are designated in some countries, such as the United States, Canada, the United Kingdom, France, India, and the Scandinavian countries. The census authorities in only a few countries, such as the United States and France have produced reliable information over a number of decades.

Perhaps the most notable historical international effort was that of Kenworthy and Laube, whose global project produced estimates from 1960 through 1990 for a number of urban areas. In some cases, academic efforts have produced consistent urban land area and urban population data for specific cities, such as Lahore, one of the new megacities described below.

Estimating the Density Dynamics of Cities

Where historic urban area data is not available, an effective alternative is to compare core area population growth to areas outside the core in the corresponding metropolitan areas. Areas outside the core typically have lower population densities and the addition of more people outside the cores will normally indicate that the urban density is falling. In some cases, this can be indicated by huge core area losses, such as has occurred for decades in London and Paris, as well as Osaka and Mexico City, described in the previous article (see Table).


Table
SUMMARY OF MEGACITY URBAN POPULATION TRENDS
MEGACITYGeneral Growth Pattern
Bangkok10 Years: 55% of growth outside core municipality
Beijing10 Years: 99% of growth outside core districts
Buenos Aires60 Years: 100%+ of growth outside core municipality
Cairo16 Years: 2/3 of growth outside core governate
Chengdu10 Years: 55% of growth outside core districts
Delhi10 Years: 90% of growth outside core districts
Dhaka10 Years: 50% of growth outside core municipalities
Guangzhou-Foshan10 Years: 75%+ of growth outside core districts
Istanbul25 Years: 100%+ growth outside core districts
Jakarta20 Years: 85% of growth outside core jurisdiction
Karachi20 Years: Estimated density decline 15%
Kinshasa20 Years 65% of growth outside core districts
Kolkata20 Years: 95% of growth outside core municipality
Lagos15 Years: 90% of growth outside core districts
Lahore40 Years: 70% urban density decline
Lima15 Years: 100%+ of growth outside core districts
London110 Years: core districts decline 30% (Inner London)
Los Angeles60 Years: 95% growth outside core municipality
Manila60 Years: 95% growth outside core districts
Mexico City60 Years: 100%+ of growth outside core districts
Moscow8 Years: 95% of growth outside core districts
Mumbai50 Years: 98% of growth outside core districts
Nagoya40 Years 90% of growth outside core municipality
New York56 Years: 45% urban area density decline
Osaka-Kobe-Kyoto50 Years: 95% of growth outside core municipalities
Paris50 Years: 25% urban area density decline
Rio de Janeiro10 Years: 95% of growth outside core districts
Sao Paulo20 Years: 2/3 of growth outside core municipality
Seoul20 Years: 115%+ of growth outside core municipality
Shanghai10 Years: 99% of growth outside core districts
Shenzhen10 Years: 70%+ of growth outside core districts
Tehran15 Years >95% of growth outside core districts
Tianjin10 Years: 85%+ of growth outside core districts
Tokyo50 Years: 95% of growth outside core municipalities


Many core municipalities have been expanded to include areas that are functionally suburban, rather than the intense urbanization that was more usual in pre-automobile sectors of the city. This is not just an American phenomenon. In Canada, there are large areas of functional suburbanization (lower residential densities and majority automobile use for motorized transport) in core municipalities, such as Toronto, Ottawa, and Calgary. There are other examples elsewhere in the world, such as Auckland, London, and Rome.

As a result, functional urban core and suburban characteristics are poorly defined by analyses using municipal jurisdiction boundaries (such as core municipalities versus suburban municipalities).

Urban core populations and densities are best analyzed using functional urban core and suburban characteristics, such as higher residential densities and unusually high reliance on transit, walking and cycling, as opposed to automobiles.

The use of census tracts for this finer grained analysis has been undertaken for the metropolitan areas of Canada by Gordon and Janzen. Following their general model, I have applied functional urban core and suburban characteristics at the Zip Code Tabulation Area (ZCTA) level in the United States, see From Jurisdictional to Functional Analysis of Urban Cores & Suburbs). A number of issues have been covered in articles (City Sector Model index). One article shows that, among the core municipalities of the major metropolitan areas, those with more than 1,000,000 population, only 42 percent of residents live in functionally urban core districts. Virtually the entire core municipality is functionally urban core in New York, Buffalo, and San Francisco. A number of core municipalities simply have no functional urban core (such as Phoenix and San Jose).

Megacity Density Trends

The previous article indicated that population densities were falling in each of the 23 megacities analyzed. A similar conclusion applies to the 11 additional megacities analyzed in this article. All of these trends are indicated in the table.

Paris: It may come as a surprise that the ville de Paris (the core municipality) accounts for little more than one-fifth of the urban area population and less than 1/20th of the continuously built up land area. Further, the ville de Paris has experienced a population decline as significant as many American core municipalities, dropping from over 2.9 million in 1921 to 2.3 million today. The population density of the Paris urban has dropped by more than one-half since 1954 and by nearly 85 percent since 1900. The inner four districts (arrondissements) have lost nearly three-quarters of their population since 1861. The losses may have started earlier, but comparable earlier data is not available.

London: The London urban area has just achieved megacity status. London forced much of its post-World War II population growth outside its newly created greenbelt following World War II. Between World War II and the 1990s, the London urban area lost population. Most, but not all of the London urban area is composed by the Greater London Authority (GLA), over which Ken Livingstone and Boris Johnson have famously presided.

However there has been a significant population increase since the 1990s. The Greater London Authority recently celebrated a "peak population" day to note having exceeded its 1939 population peak.  Virtually all of London's metropolitan area (Note 1) growth has occurred outside the greenbelt, in the exurban areas. Approximately 3.3 million residents have been added to the first ring counties abutting the greenbelt between 1951 and 2011. Inner London, which roughly corresponds to the pre-1964 London County Council area, lost more than 450,000 residents in the same period, while Outer London (also in the GLA and inside the green belt) gained more than 400,000.

However, even with the greenbelt, today's London urban area covers more land area. At the 2011 census, the London urban area had fallen to nearly 15 percent below the Kenworthy and Laube estimate for 1961. Since 1900, London's density is estimated to have dropped by two-thirds. Inner London, which roughly corresponds to the pre-1964 London County Council area, remains approximately one-quarter below its 1901 population, even with recent growth. All of the GLA growth has been in outer London.

Other Megacities: Pakistan's two largest urban areas, Karachi and Lahore are growing at among the fastest rates in the world, averaging approximately three percent annually. Interpolation of data from academic papers indicates declining population densities in both cities.

Lagos continues to grow rapidly. More than 90 percent of its recent growth has been in suburban districts, with their lower, but still high, densities. Kinshasa, one of the new megacities, has the fastest growth rate according to United Nations data. Kinshasa is growing over four percent per year, with nearly two-thirds of its recently reported growth outside the densest areas in the core districts.

Tehran's core districts are now experiencing only modestly increasing population. Nearly all growth (98 percent) has been outside the core districts.

China has recently added two cities to the megacity list, Tianjin and Chengdu. Approximately 85 percent of Tianjin's recent growth has been outside the core districts. In Chengdu, the areas outside the core districts have captured 55 percent of the growth.

Over the past 40 years, 90 percent of Nagoya's growth has been outside the core municipality.

Lima is another new megacity. In Lima, core district population is declining and all growth has occurred in suburban districts over the latest 15 years for which there is data.

The Limits to Urban Density Declines

There are limits to urban density declines. As people become more affluent and car use increases, city densities decline toward those of automobile orientation. Once that has occurred, there may be modest density increases, but not sufficient to restore the much higher urban area densities from the past and now found only in pre-automobile urban cores.

However, as lower and middle income cities, from Lagos to Sao Paulo grow and achieve greater affluence, urban growth is likely to continue to be on the lower density periphery.

Note: The metropolitan area is the economic form of the city. The metropolitan area includes rural and urban territory from which commuters are drawn to employment in the principal urban area.

Wendell Cox is principal of Demographia, an international public policy and demographics firm. He is co-author of the "Demographia International Housing Affordability Survey" and author of "Demographia World Urban Areas" and "War on the Dream: How Anti-Sprawl Policy Threatens the Quality of Life." He was appointed to three terms on the Los Angeles County Transportation Commission, where he served with the leading city and county leadership as the only non-elected member. He was appointed to the Amtrak Reform Council to fill the unexpired term of Governor Christine Todd Whitman and has served as a visiting professor at the Conservatoire National des Arts et Metiers, a national university in Paris.

Photo: Depiction of Lagos built-up urban area

Buses: Ride the Friendly Roads?

$
0
0

Intercity bus companies have made some surprising moves to win a bigger slice of the business-travel market in the past year. City-to-city express operators like BoltBus, GO Buses, and Megabus are upping their game, and several new luxury services have entered the mix with amenities designed to attract disenchanted frequent flyers who wouldn’t have dreamed of taking an intercity coach a few years ago. Think refreshments, attendants, roomy seating, and even shoe shining services.

A case in point is Vonlane, a new first-class service between Austin and Dallas that launched in May 2014 and plans to expand to Houston this March. A luxury operator, it seats only sixteen passengers, and an attendant serves snacks and drinks. It also offers a private six-seat “boardroom” for business meetings, and Wi-Fi and outlets, which are now almost standard on all bus lines. The service is also going after travelers that are willing to ride coaches to make connections to long-haul flights: Vonlane operates from the Hyatt Hotel at Dallas Love Field, where riders have access to a free airport shuttle. The fare isn’t cheap—around $100 each way—but it's far less than flying. Southwest’s walk-up fare is $207.

Equally noteworthy is Royal Sprinter, launched by D.C.-based restaurateur Andy Seligman about a year ago. First-class bus service isn’t new to the Northeast Corridor. It's already available from Manhattan to Boston via LimoLiner, to Washington, D.C. on Vamoose Gold, and to northern New England via both C&J and Dartmouth Coach. What differentiates Royal Sprinter is its small coaches with only eight seats on board, and satellite TV that accesses pay movie and sports channels. The company currently operates two trips each day between New York and Washington, D.C., with fares running around $95.

The powerhouse in express city-to-city service, Megabus, is also expanding from its traditional base of college students and urbanites. Taking aim at the business flyer, it introduced reserved seating in fifty-eight cities last year, with ten seats generally available at a cost of between one and nine dollars on each bus. Groups that reserve seating at a table can conduct business meetings during the trip.

Bus companies are also growing more sophisticated in “selling flexibility,” to allow passengers to change their departure times at only a modest expense, in sharp contrast to restrictive (and costly) airline policies. BoltBus and Megabus, for example, now allow changes up to a day or two in advance for $5 or less, plus any fare difference—a far cry from the $200 charged by American, Delta, and United.

Bus travel-booking websites, most notably Wanderu and Busbud, are also becoming more visible. Wanderu, in particular, offers convenient means of comparison-shopping Greyhound, BoltBus, Megabus, and others, much as Expedia, Orbitz, and Travelocity do for air travel.

What does the resurgence of intercity bus travel mean for U.S. transportation? The growth reminds me of the mid-1980s, when new airline hubs were popping up everywhere. Airlines vied to gain a foothold in markets before their competitors did, fearing that there was enough business for only one carrier, but all the new service led to enormous increases in the number of people flying. Unfortunately, there is a void in official data on what is really happening in the bus business. Schedule information isn’t stored in any public data bases and vanishes from company websites the moment a bus departs, complicating growth analyses of this industry. Air and rail travel data is much more easily available.

To help fill the void, for the past five years I've co-authored a year-in-review summary of what’s happening in this industry. Our study attempts to measure growth by recording schedule activity in published timetables and websites. We focus on branded carriers, including Megabus, Greyhound, and Trailways, because small carriers that intentionally stay below the radar, or only serve specialized niches (such as Chinatown operators and airport shuttles) are too hard to track.

Last year, we observed a 2.1 percent increase in daily scheduled operations on the 107 carriers that met our criteria. While bus service grew, Amtrak train-miles held constant, and the number of airline flights diminished by 3.5 percent. Although bus companies aren’t expanding their schedules at the frenetic pace of past years, when growth often exceeded 5 percent, the sector is still growing much faster than other modes. Plus, ridership appears to be growing at an even faster rate. In October, Megabus reported that its traffic was up 13.5 percent over the past year.

How quickly senior corporate executives on expense accounts will embrace new luxury bus services remains to be seen. Regardless, travel markets of 350 miles or less are about more than college kids and bargain-hunters looking for the cheapest way to get from Point A to Point B.

Joseph Schwieterman is professor of public service and director of the Chaddick Institute for Metropolitan Development at DePaul University.

Photo by the author: Megabus double-decker at the Canal Street loading area in Chicago.


Military Memorials: Is This Really the Best We Can Do?

$
0
0

I was researching material for a blog post about the town I grew up in (Toms River, New Jersey) and accidentally stumbled on something completely unrelated that I find deeply disturbing on multiple levels. It was a roadside memorial dedicated to a fallen soldier. I looked up his name and realized that he had gone to my high school and his family lived very near the house I had once lived in. United States Navy SEAL Denis Miranda was twenty four years old when he perished in Qalat, Afghanistan. He has two surviving brothers on active duty.

Screen Shot 2015-01-18 at 1.38.54 AM
 Google

Screen Shot 2015-01-18 at 1.57.25 AM
Google

Screen Shot 2015-01-18 at 1.39.40 AM
Google

Screen Shot 2015-01-18 at 1.39.13 AM
Google

Denis Miranda is currently being “honored” by a cheap metal highway sign at the back of a ShopRite supermarket next to the employee parking lot and a storm water retention ditch. The chain link fence behind the sign is used to pin up banners advertising cold beer on sale. It isn’t dignified enough to commemorate the death of a native son. What exactly is his mom supposed to think as she drives past this sign on the way home from church? Is it comforting? Do his father and brothers meet at the sign to have a solemn moment of prayer and remembrance while summer traffic backs up at the intersection waiting for the light to turn green? Is the placement of the sign meant to inspire passing motorists to think deep thoughts about the nature of war and patriotism? And what does this kind of monument say about the way our society values its fallen? What does it say about the fact that this might actually be the best spot in town to express public gratitude or collective loss?

Screen Shot 2015-01-18 at 1.57.59 AM
 www.njrunforthefallen.org

Then I realized there was an entire state wide trail of these memorial signs all along the New Jersey coast, each marker representing a veteran who never returned home. The tragedy of all those lost lives and family sacrifices worked on me and I got angry at the memorials themselves. Is this really the best we can do?

NJ WAR DEAD
 The Star-Ledger Archive

Screen Shot 2015-01-18 at 1.15.48 AM
Google

Screen Shot 2015-01-18 at 1.16.36 AM
Google

Screen Shot 2015-01-18 at 1.17.28 AM
Google

This is the sign commemorating the loss of Marine Private First Class Vincent Frassetto who died in Al Anbar Province, Iraq. His memorial is on the side of a cloverleaf intersection near the Ocean County Mall. This same roadside spot is also favored by people placing signs advertising rug sales and warnings about pedophiles who may be lurking in public places. Will anyone ever make a pilgrimage to this sign by parking on the edge of the mall and walking across the grassy cloverleaf with loved ones to ponder the life and death of Vincent Frassetto? Or is the public assumed to be too busy to get out of the car so we better catch them while they’re trapped at a red light? Again, the quality and location of the memorial simply isn’t in keeping with the scale of the sacrifice.

1866432_orig
 marines.togetherweserved.com

Screen Shot 2015-01-18 at 4.40.01 AM
Google

Screen Shot 2015-01-18 at 4.23.03 AM
Google

Major James Weis of the U.S. Marine Corps died in Helmand Province, Afghanistan. Here’s his home town roadside war hero monument. It got me thinking about the people who organized these memorials – all devoted and well intentioned no doubt. Did they truly believe that these arrangements were appropriate? Were the folks on the committee looking around for a sacred place of honor and decide, “Hey, how about we put these cheap highway signs next to the left hand turn lane by the muffler shop and the Krispy Kreme.”?

So… where exactly should we put memorials to fallen veterans these days? What form should those monuments take? We used to live in the kinds of towns were there were obvious places to erect an obelisk or a bronze statue. Now most of us live in tract home subdivisions, work in office parks on the side of a highway, and shop at strip malls. Could it be that these flimsy sheet metal markers reflect our true values and who we really are? Am I the only one who thinks this is weird and distasteful?

John Sanphillippo lives in San Francisco and blogs about urbanism, adaptation, and resilience at granolashotgun.com. He's a member of the Congress for New Urbanism, films videos for faircompanies.com, and is a regular contributor to Strongtowns.org. He earns his living by buying, renovating, and renting undervalued properties in places that have good long term prospects. He is a graduate of Rutgers University.

The U.S. Cities Where Hispanics Are Doing The Best Economically

$
0
0

Since 1980, the percentage of Americans who claim Hispanic heritage has grown from 6% to 17%. By 2040, Latinos will constitute roughly 24% of the population.

Many Democrats no doubt see President Obama’s executive actions on immigration as a step not only to address legitimate human needs, but their own political future. But perhaps a more important question is how these new Americans will fare economically.

We decided to look into which of America’s 52 largest metropolitan areas present Hispanics with the best opportunities. We weighed these metropolitan statistical areas by three factors — homeownership, entrepreneurship, as measured by the self-employment rate, and median household income  — that we believe are indicators of middle-class success. Data for those is from 2013. In addition, we factored in the change in the Hispanic population from 2000 to 2013 in these metro areas, to judge how the community is “voting with its feet.” Each factor was given equal weight. Our findings parallel our recent study of the economic fortunes of African-Americans, but with some important differences.

Surviving Hard Times

The recession was particularly tough on Hispanics, who suffered a 44% drop in household wealth from 2007 to 2010, compared to a 31% decline for African-Americans and 11% for whites. Lower home values are to blame for much of this – many young Hispanic families bought homes just before the recession hit, explains the Urban Institute, but because they generally had higher debt-to-asset ratios than other ethnic groups, the steep drop in housing prices resulted in a sharper decline in their wealth. Hispanics’ home equity dropped 49% over those years.

The recession and the weak recovery have contributed to a change in the demographics of the U.S. Hispanic population – immigration has slowed while the U.S.-born Latino workforce has continued to expand at a brisk clip. In 2013, for the first time in almost two decades, the U.S.-born accounted for the majority of Hispanic workers in the country (50.3%), up from 43.9% in 2007, according to the Pew Foundation.

During the recovery, U.S.-born Hispanics have made strong job gains, adding 2.3 million to the ranks of the employed from the fourth quarter of 2009 through the fourth quarter of 2013, compared with a loss of 37,000 jobs in the recession. But that has only slightly outpaced growth in the Hispanic working-age population.

Hispanic unemployment has come down to 6.5%, but wages have been stagnant – Pew reports a slight gain in earnings of full-time Hispanic workers through the end of 2013, but that came as a result of the retreat of lower-paid illegal immigrants from the workforce.

The Unexpected Place Where Latinos Have Done Best

The prime U.S. cities for Latinos have long been New York, Miami, Chicago and Los Angeles. The Los Angeles metropolitan area alone has more than 5 million Latinos, including an estimated 1 million undocumented immigrants. Yet it no longer is necessarily the best place for them, ranking only a middling 32nd in our survey. L.A.’s once thriving industrial economy has been in a secular decline, and in the process thousands have lost employment. At the same time, construction work has been slow, another traditional source of employment. High housing costs have also put homeownership out of reach. A 2013 Fannie Mae study found that Latinos place greater emphasis on homeownership than the rest of the population.

Given the diminished possibilities of buying a home or finding a decent job in the Los Angeles metropolitan area, Latinos have been flocking to the suburban periphery that encompasses much of adjacent Riverside and San Bernardino counties, also known as the Inland Empire, which ranks second in our survey. From 2000 through 2013, the Latino population in the area soared 74%, compared to a 15% population gain for Los Angeles.

Not surprisingly, given its substantially lower home costs, roughly half those of Los Angeles, the Inland region has a relatively high Latino homeownership rate of 55.3%, compared to 37.7% in Los Angeles. Rates of self-employment are also higher than in L.A. (23.5% to 21.3%) and so too are median household incomes ($47,200 vs. $45,200). The metro area was devastated in the housing bust, but it’s coming back faster than the coastal economy. Although total employment is some 30,000 jobs below its 2007 level, California Lutheran University economist Dan Hamilton notes that Riverside-San Bernardino’s 2.2% job growth over the past year compares well with the 2.0% increase in Orange County and 1.3% in L.A.

Latinos also fared middling in California’s other high-cost metro areas. San Jose ranks 22nd and San Francisco-Oakland ranks 25th.

The same factors that make Riverside-San Bernardino a good place for Hispanics — lower housing costs and decent job growth — characterize most of the metropolitan areas that lead our list. That is particularly true of our No. 1 metro area, Jacksonville, Fla., which is just 40 miles north of St. Augustine, founded by the Spanish in 1565, making it the longest continuously settled city in what is now the United States.

The metro area’s Hispanic homeownership rate of 55% is notably higher than the 43% average in the 52 largest U.S. metropolitan areas.  The median household income of $50,170 is also well above the major metro average of $41,740. Like many Florida cities, Jacksonville was hard-hit by the recession, but over the past year, the region has added close to 22,000 jobs. Jacksonville’s Hispanic population has grown 148% since 2000.

Other Florida metro areas where Hispanics are prospering are Tampa-St. Petersburg (12th),  Orlando (13th), and Miami (16th).

Not surprisingly, Latinos are also doing very well in a number of Texas cities. Like Florida, the state has relatively low housing prices, as well as a generally more buoyant economy, with strong growth in blue-collar fields such as construction, manufacturing and energy. The Lone Star State’s four big metro areas all place in the top 10, with Houston ranking fourth, followed by Dallas-Fort Worth (seventh), San Antonio (eighth) and Austin (ninth). They all are above average in terms of homeownership rates, self-employment and median household income.

Like African-Americans, Latinos have done relatively well in No. 3 Baltimore, where their numbers have increased since 2000 by 175%, with a median household income of $59,940, second highest in the nation behind the adjacent Washington, D.C., area (No. 5), where the median household income for Hispanics is $65,736.

Shifting Patterns

In recent years, immigration overall has shifted to the Southeast away from many of the traditional “gateway” cities. Today the largest growth in foreign-born Americans is in the Southeast and Texas; since 2010 the old Confederacy attracted over 1.5 million foreign-born residents, more than the Northeast and Midwest together.

None of the traditional gateway cities rank in the top 10 on our list. After Miami, the highest ranking of them is Chicago, at 18th, thanks to relatively lower home prices and a high Latino homeownership rate (51.4%).

In contrast, New York, home to the country’s second largest Latino community after Los Angeles, ranks a poor 42nd. This reflects one of the lowest rates of Hispanic homeownership in the country, 26.5%, and modest population growth of roughly 29% since 2000, compared to an average of 96% for the 52 largest U.S. metro areas. New York Latino households earn a median of $42,980. That’s slightly above the 52 major metro median of $41,740, but given the sky-high housing costs in the Gotham area, it doesn’t go very far. In the Bronx, where the population is 55% Hispanic, roughly 30% of households are below the poverty line, the highest rate of any large urban county.

As was the case with African-Americans, the metro areas at the bottom of our list are all faded industrial centers. Milwaukee ranks last, preceded by Providence, R.I. ; Hartford, Conn.; and Buffalo and Rochester, N.Y.

Forging The American Future

Identifying where Latinos are going, and doing well, is critical not just for them but the future of the country. One out of every four American children are Latino and since 2000 they have accounted for two-thirds of all net job gains made in the country. Latinos are also playing a key role in the recovery from the housing bust, accounting for 56% of all new owner households created between 2010 and 2013.

What our research and migration trends suggest is that the geography of Latino opportunity is rapidly changing. The Latinization of America is gathering strength in parts of the South that offer a better deal for new Americans and their offspring than New York, Los Angeles or Chicago. You want a little salsa on those grits?


BEST CITIES FOR HISPANICS/LATINOS
Metropolitan AreaRankScoreHome Ownership RateMedian Household IncomeShare of Total Self EmploymentChange in Population: 2000-2013
Jacksonville, FL      1   80.3 54.9%$50,17117.1%148.2%
Riverside-San Bernardino, CA      2   78.8 55.3%$47,19623.5%74.3%
Baltimore, MD      3   74.0 47.5%$59,9399.8%175.3%
Houston, TX      4   71.6 52.3%$43,02022.9%68.4%
Washington, DC-VA-MD-WV      5   70.7 45.4%$65,73611.0%105.0%
Virginia Beach-Norfolk, VA-NC      6   70.2 47.2%$50,1979.8%156.6%
Dallas-Fort Worth, TX      7   66.8 50.0%$41,62222.1%70.3%
San Antonio, TX      8   66.3 56.9%$42,37723.3%43.8%
Austin, TX      9   65.4 44.6%$43,71220.9%83.4%
St. Louis,, MO-IL      9   65.4 56.5%$50,5707.8%92.2%
Sacramento, CA    11   63.9 43.9%$45,66721.8%66.1%
Tampa-St. Petersburg, FL    12   63.5 49.4%$39,75717.1%100.4%
Orlando, FL    13   61.5 46.7%$38,72117.1%128.1%
Pittsburgh, PA    14   59.1 48.4%$55,1087.3%102.4%
Salt Lake City, UT    14   59.1 49.5%$42,23210.8%78.3%
Miami, FL    16   58.2 52.6%$41,54717.7%46.2%
Las Vegas, NV    17   57.7 40.8%$42,78916.8%101.5%
Chicago, IL-IN-WI    18   55.8 51.4%$45,34911.1%36.7%
Oklahoma City, OK    19   55.3 48.5%$38,05410.0%121.4%
Seattle, WA    20   53.4 35.6%$48,9039.9%112.4%
Richmond, VA    21   52.4 41.8%$38,1869.8%196.1%
San Jose, CA    22   51.9 38.8%$59,15019.9%23.7%
San Diego, CA    23   51.4 38.6%$46,87521.3%40.8%
Charlotte, NC-SC    24   51.0 42.9%$38,8438.6%174.6%
Denver, CO    25   50.5 44.7%$42,07113.5%53.7%
Phoenix, AZ    25   50.5 44.9%$38,70419.9%61.1%
San Francisco-Oakland, CA    25   50.5 38.5%$56,26919.8%34.9%
Cincinnati, OH-KY-IN    28   48.1 41.3%$42,2716.8%190.6%
Atlanta, GA    29   47.6 42.8%$38,9198.8%116.9%
Kansas City, MO-KS    29   47.6 47.1%$40,4327.8%90.7%
New Orleans. LA    29   47.6 41.7%$46,1468.2%74.2%
Los Angeles, CA    32   44.2 37.7%$45,20221.3%15.3%
Raleigh, NC    33   43.8 39.6%$37,5728.4%177.7%
Minneapolis-St. Paul, MN-WI    34   42.3 40.9%$42,7647.6%90.0%
Detroit,  MI    35   41.8 61.5%$41,2767.5%39.8%
Louisville, KY-IN    36   39.4 41.3%$35,5716.5%206.8%
Philadelphia, PA-NJ-DE-MD    37   38.9 43.3%$36,3658.9%81.4%
Memphis, TN-MS-AR    38   37.0 40.5%$32,0418.1%156.2%
Portland, OR-WA    39   36.5 33.3%$40,4869.6%83.8%
Nashville, TN    40   35.6 38.2%$36,4587.3%176.5%
Grand Rapids, MI    41   35.1 47.7%$35,1148.3%54.4%
New York, NY-NJ-PA    42   34.6 26.5%$42,98113.3%29.4%
Birmingham, AL    43   32.7 40.3%$32,1656.9%174.1%
Indianapolis. IN    43   32.7 35.5%$27,2937.7%195.5%
Boston, MA-NH    45   31.7 24.5%$39,08010.7%65.6%
Cleveland, OH    46   30.3 43.9%$38,7627.6%45.7%
Columbus, OH    47   29.3 28.1%$38,5206.9%155.6%
Rochester, NY    48   27.9 37.7%$26,31512.2%55.1%
Buffalo, NY    49   25.0 33.8%$30,48912.0%50.8%
Hartford, CT    50   24.5 29.9%$30,45311.4%54.7%
Providence, RI-MA    51   21.2 23.8%$28,62210.0%64.5%
Milwaukee,WI    52   19.2 34.7%$32,3087.6%68.3%
Calculated from 2013 American Community Survey & EMSI data
Analsys by Wendell Cox

This piece first appeared at Forbes.

Joel Kotkin is executive editor of NewGeography.com and Roger Hobbs Distinguished Fellow in Urban Studies at Chapman University, and a member of the editorial board of the Orange County Register. His newest book, The New Class Conflict is now available at Amazon and Telos Press. He is author of The City: A Global History and The Next Hundred Million: America in 2050. His most recent study, The Rise of Postfamilialism, has been widely discussed and distributed internationally. He lives in Los Angeles, CA.

Wendell Cox is principal of Demographia, an international public policy and demographics firm. He is co-author of the "Demographia International Housing Affordability Survey" and author of "Demographia World Urban Areas" and "War on the Dream: How Anti-Sprawl Policy Threatens the Quality of Life." He was appointed to three terms on the Los Angeles County Transportation Commission, where he served with the leading city and county leadership as the only non-elected member. He was appointed to the Amtrak Reform Council to fill the unexpired term of Governor Christine Todd Whitman and has served as a visiting professor at the Conservatoire National des Arts et Metiers, a national university in Paris.

Jacksonville photo by Don Dearing (Flickr: Jacksonville, FL) [CC BY-SA 2.0], via Wikimedia Commons

Largest 1,000 Cities on Earth: World Urban Areas: 2015 Edition

$
0
0

According to the just released 11th edition of Demographia World Urban Areas (Built-Up Urban Areas or World Agglomerations), there are now 34 urban areas in the world with more than 10 million residents, the minimum qualification for megacity status. Tokyo-Yokohama continues its 60 year leads the world's largest urban area. Before Tokyo-Yokohama, New York had been the world's largest urban area for 30 years. London's run, preceding that of New York, was much longer, at more than 100 years. Beijing, which was the first of today's megacities to reach 1,000,000 population, held the title for 75 years before London, according to census and urban historian Tertius Chandler.

Demographia World Urban Areas is the only regularly published compendium of urban population, land area and density data of urban areas with 500,000 or more population (defined in the Note below). The 2015 edition provides coordinated population, urban land area and density data for all 1,009 identified urban areas with at least 500,000 population. These urban areas account for approximately 52 percent of the world urban population.

Largest Cities in 2015

Tokyo-Yokohama grew to 37.8 million residents, the largest urban area population ever recorded (Figure 1). But second ranking Jakarta is moving up quickly, becoming the second urban area in history to exceed 30 million residents (30.6 million). Regrettably, Jakarta (Figure 2) is often left off world city top ten lists, because the continuous urbanization extending into the regencies (Figure 2) of Tangerang, Bogor, Bekasi and Karawang usually excluded (see The Evolving Urban Form: Jakarta). Regencies are national second level jurisdictions, within the provinces that make up Indonesia.

Fast growing Delhi retained third position, rising to just under 25 million. Later this year, Delhi will be only the third urban area in history to exceed a population of 25 million. Surprisingly, Delhi is nearly 50 percent larger than Mumbai, which is commonly considered to be India's largest urban area. The Census of India does not allow its urban areas to cross state boundaries, which has continued to result in an under-reporting of Delhi's population. Demographia, and the United Nations, have been reporting a higher population level as a result of Delhi's interstate urban extensions. Many urban areas extend across state, provincial or prefectural boundaries, such as New York, Ottawa, Tokyo-Yokohama, Mexico CityBuenos Aires, Manila, Seoul-Incheon, Cairo, Shanghai among  others.

The developing world continued its increasing domination of world's largest cities. This year, Manila passed Seoul-Incheon to become the world's fourth largest urban area. Like Jakarta, Manila is often left off top ten lists of the world's cities, because the continuous urbanization extending into the provinces of Cavite, Laguna, Bulacan and Rizal and are excluded (see The Evolving Urban Form: Manila).

Seoul-Incheon is at risk to falling another position by 2016. At 24.9 million, Seoul-Incheon's leads sixth ranked Shanghai by less than 70,000. The last four positions in the top ten are occupied by Karachi, Beijing, New York and Guangzhou-Foshan. Karachi's position, however, is hard to quantify, because it has been nearly two decades since the last census and the current estimates could be unreliable. New York, along with Tokyo-Yokohama and Seoul-Incheon is only one of three high-income world cities in the top 10.

Beijing and Guangzhou-Foshan are new entries to the top ten, having displaced Mexico City and Sao Paulo. These two Latin American cities have long been among the fastest growing in the world and were headed toward much higher rankings. However, their growth has slowed materially, and they are now ranked in the second 10. Nearby Campinas is now growing faster than Sao Paulo and Toluca is exceeding the percentage growth of Mexico City. There was a time that demographers expected Mexico City to become the largest city in the world. In 2000 and 2005, the United Nations ranked Mexico City as second only to Tokyo-Yokohama.

As indicated in a recent article (World Megacities: Densities Fall as they Become Larger), the number of megacities rose from 29 to 34 (megacities are urban areas with more than 10 million residents). These include Tianjin and Chengdu in China, Lahore (Pakistan), Kinshasa (Democratic Republic of the Congo) and Lima (Peru). China now leads the world with six (Shanghai, Beijing, Guangzhou-Foshan, Shenzhen, Tianjin and Chengdu). The ten largest urban areas are shown in Figure 3 and detailed population data is in Table 1 of World Urban Areas.

Urban Footprints and Urban Density

The title of the world's largest urban footprint --- what some may call “sprawl” ---- is held by the New York urban area. Often seen as the epitome of successful dense development (a characterization that applies only in its geographically much smaller core area), the New York urban area itself constitutes the least dense megacity in the world. New York covers nearly 4,500 square miles (11,600 square kilometers) and has a population density of 4,500 per square mile (1,800 per square kilometer). It is a surprise to many that even Los Angeles is more dense, the result of its much denser suburbs.

Tokyo-Yokohama covers the second largest land area, at 3,300 square miles (8,500 square kilometers). There are now 29 urban areas covering 1,000 square miles or more (2,590 square kilometers). Not surprisingly, approximately one-half (15) of these are in the United States. Another five are elsewhere in the high income world, such as Paris. There are also eight developing world cities of 1,000 or more square miles, such as Jakarta, Bangkok and Sao Paulo. Urban land area data for all 1,009 cities is in Table 3 of World Urban Areas.

Dhaka, the capital of Bangladesh, remained the most densely populated city, at 113,000 per square mile (4,500 per square kilometer). Detailed population density for the 1,009 cities is in Table 4 of World Urban Areas

Where Urban Population is Growing

Asia's has more than half (57 percent) of the population in cities of 500,000 and more (Figure 4). This is more than four times the population of such cities in North America, five times that of Africa and Europe and approximately six times that of South America. With stagnant population growth in the high income world and declines in some nations, there is every reason to believe that urbanization in North America and Europe will continue to decline relative to that of Asia, Africa and South America.

-------

Note: There are two generic definitions of cities: urban areas and metropolitan areas. Urban areas define the physical expanse of cities, which is the area of continuous urban development. The second definition for cities is economic. The economic city is the metropolitan area, which includes the urban area and economically connected territory outside the urban area. The economic relationship is usually determined by work trip data, the extent of commuting from outside to inside the urban area. Because metropolitan areas are always geographically larger than urban areas, they also always have more residents. The difference in geographical sizes can be substantial. The Paris urban area covers only 20 percent of the Paris metropolitan area, a figure close to that of US major metropolitan areas, where urban areas cover only 19 percent of the land in metropolitan areas. The paradox is that metropolitan areas virtually always have more rural land than urban land.

Ideally, urban areas are not defined by local or regional government jurisdictional boundaries, since rural areas are often included in such jurisdictions, especially suburban jurisdictions. Urban development is not constrained by jurisdictional boundaries, nor are urban areas. This causes substantial confusion, because of a general lack of familiarity with urban area concepts, even among experts.

Urban areas are called also called "population centres" (Canada), "built-up urban areas" (United Kingdom, "urbanized areas' (United States), "unités urbaines" (France) and "urban centres" (Australia). The "urban areas" of New Zealand include rural areas, as do many of the areas designated "urban" in the People's Republic of China, and, as a result, do not meet the definition of urban areas above.

Whatever they are called, urban areas are simply the extent of development, which in most cases extends well beyond the boundaries of core municipalities. Demographia World Urban Areas uses the following definition for urban areas.

An urban area is a continuously built up land mass of urban development that is within a labor market (metropolitan area or metropolitan region). As a part of a labor market, an urban area cannot cross customs controlled boundaries unless the virtually free movement of labor is permitted. An urban area contains no rural land (all land in the world that is not urban is considered rural).

Photograph: Lujiazui business district (Pudong), Shanghai, with the nearly complete Shanghai Tower, second tallest building in the world (by author).

Wendell Cox is principal of Demographia, an international public policy and demographics firm. He is co-author of the "Demographia International Housing Affordability Survey" and author of "Demographia World Urban Areas" and "War on the Dream: How Anti-Sprawl Policy Threatens the Quality of Life." He was appointed to three terms on the Los Angeles County Transportation Commission, where he served with the leading city and county leadership as the only non-elected member. He was appointed to the Amtrak Reform Council to fill the unexpired term of Governor Christine Todd Whitman and has served as a visiting professor at the Conservatoire National des Arts et Metiers, a national university in Paris.

America A House Divided Over Race

$
0
0

The election of Barack Obama six years ago was hailed as a breakthrough both for minorities, particularly African Americans, and for his being the first “city guy” elected president in recent history. Both blacks and urbanistas got one of their “own” in power, and there were hopes that race relations and urban fortunes would improve at a rapid pace.

Instead, the recent controversies over police killings of African American men have revealed a shocking deterioration of race relations not seen in a generation. Since the racial euphoria that accompanied the president’s election, views of race relations held by blacks and whites, according to Pew, have become decidedly less optimistic. Nearly half of whites and roughly two in five blacks, according to a recent Politico poll, say race relations have worsened under Obama. Only 4 percent of whites and 13 percent of African Americans thought relations had improved. Another recent survey, this one by Bloomberg, finds 53 percent of Americans opining that race relations have declined under Obama.

For the most part, the current racial discord has been traced largely to the long, uneasy relationship between minorities, notably African Americans, and the police. The disparity in perceptions between whites and blacks are most notable here, says Pew, with 70 percent of African Americans, but barely 25 percent of whites, disputing that police do a good job treating the races “equally.”

Here’s the real tragedy: Some 50 years after the passage of sweeping nationwide civil rights legislation, the institutionalization of affirmative action and billions poured into addressing urban poverty, many African American youth remain well outside the mainstream, unmoored to the economy and far too liable to get into confrontations with law enforcement. This is clearly connected with such factors as the preponderance among African Americans of 70 percent single-female-headed households, nearly half of which are poor.

Then, there are the murder statistics. Columnist Walter Williams has noted that, out of roughly 7,000 blacks murdered last year, 94 percent were killed by another black person. Half of all homicide victims are black, while blacks account for barely 13 percent of the nation’s population. Williams calculates that the black homicide victimization rate is six times that of whites, and in some cities, more than 22 times higher.

Pervasive poverty

Not surprisingly, these sad numbers are also reflected in economic statistics. African American unemployment remains twice that of whites. The black middle class, so responsible for, and understandably proud of, Obama’s elevation, according to the Urban League, in the past decade has conceded many of the gains made over the prior 30 years.

Despite the hoopla about urban revival, a recent study reveals that entrenched urban poverty – places where 30 percent or more of the population lives below the poverty line – actually grew in the first decade of the new millennium, from 1,100 to 3,100 neighborhoods. Meanwhile, the population of these areas doubled, to 4 million. “This growing concentration of poverty,” notes researchers Joe Cortright and Dillon Mahmoudi, “is the biggest problem confronting American cities.”

These trends dwarf the oft-celebrated movement of young professionals and empty-nesters into the urban core. Indeed, notes demographer Wendell Cox, roughly 80 percent of population growth in cities during 2000-10 was from poor people. Not surprisingly, many African Americans have moved to suburbs, where a majority of them now live, according to the Census Bureau.

Also not surprising is that poverty and conflicts with law enforcement are now found in some suburban areas, as was clear in the case of Ferguson, Mo. Yet, poverty in the core cities remains considerably worse than in the suburbs. Despite trite talk about “suburban ghettos,” the poverty rate in the suburbs remains roughly half that of urban centers (as of 2010, 20.9 percent in core compared with 11.4 percent in the suburbs).

Much the same can be said about crime. The overall violent-crime rate in urban cores, although down from 2001, remains almost four times higher than in the suburbs, according to FBI data. Many of the most crime-ravaged cities are heavily African American: Detroit, Oakland, St. Louis, Memphis, Tenn., Cleveland and Atlanta.

Big-city class chasms

The fundamental preconditions for increased racial tensions can be seen in the growing class chasm within cities, particularly gentrifying ones. In New York City, the epicenter of the current debate over policing, good times on Wall Street and among the glitterati has not trickled down into the ghetto. The majority of people in hip Brooklyn, notes researcher Daniel Hertz, have seen their incomes drop over the past decade; roughly one in four Brooklynites, a cohort overwhelmingly black and Hispanic, lives in poverty. Over the entire borough, he points out, residential patterns have become more segregated, and Brooklyn now is second, only to Milwaukee, in terms of racial separation.

In Chicago, like most cities, areas of concentrated poverty have expanded in recent years. Chicago is widely hailed as the progenitor of Alan Ehrenhalt’s “great inversion,” which predicts a continuing shift of rich people into cities while the poor exit to the dreary suburban wasteland. But the reality is far more complicated, as employment in Chicago has dropped below 2001 levels, and middle-class neighborhoods have continually shrunk.

Essentially, amidst renewal, there is greater bifurcation. Prosperous and greatly hyped “super-global Chicago,” notes urban analyst Pete Saunders, enjoys income and education levels well above those of the suburban areas. Most Chicagoans, however, live in “rust belt Chicago,” with education and income levels well below suburban levels. Rather than simply bifurcated, Saunders suggests, “Chicago may be better understood in thirds – one-third San Francisco, two-thirds Detroit.”

The tensions exacerbated by this growing divide are widely evident. Violence is slowly shifting from Chicago’s poorest neighborhoods and into some of the city’s nicest redoubts; Mayor Rahm Emanuel’s 17-year-old son was mugged outside his home. Chicago’s violent-crime rate remains far higher than that of New York or Los Angeles; by some estimates, the city is more dangerous now than during the Al Capone era during Prohibition.

Chicago’s predicament – with a slight increase in murders in 2014 – could prove a harbinger. In some big cities, like Chicago, New York and Atlanta, populations entrenched in poverty will likely remain for the foreseeable future. It’s hard to imagine East New York or the westside of Chicago, much of south Atlanta, or Watts, for that matter, gentrifying anytime soon.

Indeed, Los Angeles, which also experienced a big drop in violent crime over the past decade, now expects to report a 7 percent increase this past year. Late last month, L.A. also experienced a possible attempted assassination of police officers, although the assailants, thankfully, missed.

In some cities, usually smaller and whiter to start with, we are seeing a pattern of what amounts to “ethnic cleansing,” as increasingly isolated communities get driven out of their enclaves by relentlessly rising rents and the loss of blue-collar jobs.

This process is particularly notable in San Francisco, where the black population already is roughly half what it was in 1970. In the nation’s whitest major city – Portland, Ore. – African Americans are being pushed out of the urban core by gentrification, partly supported by city funding. Similar phenomena can be seen in Seattle and Boston where longtime black communities faced near extinction.

Under these circumstances, a degree of racial animus seems inevitable. Some Brooklyn residents, reports theDaily Beast,even justified the targeting of law enforcement officers. For their part, many NYPD officers feel betrayed by Mayor Bill de Blasio’s sympathetic comments about anti-police demonstrations. Some officers have expressed their distaste, inappropriately, by being rude to the mayor and staging slowdowns in arrests.

These racial tensions already are seeping into the political realm. African Americans in New York supported de Blasio’s policing strategy, 2-1, while a strong majority of whites opposed his stance.

The resurgence in racial animus remains arguably the biggest surprise – and one of the greatest failures – not only of Obama, but of our society. In this respect, neither conservative attempts to blame increased racial discord on the president and, now, attempts by his progressive claque to absolve him of any responsibility, really address the more serious issues behind the widening of the racial divide. Cities and communities, divided against themselves by race and class, cannot thrive in the long run, no matter how many publicists and pundits proclaim the battle for urban America already has been won.

This piece first appeared at The Orange County Register.

Joel Kotkin is executive editor of NewGeography.com and Roger Hobbs Distinguished Fellow in Urban Studies at Chapman University, and a member of the editorial board of the Orange County Register. His newest book, The New Class Conflict is now available at Amazon and Telos Press. He is author of The City: A Global History and The Next Hundred Million: America in 2050. His most recent study, The Rise of Postfamilialism, has been widely discussed and distributed internationally. He lives in Los Angeles, CA.

The Gilded Age Makes A Comeback

$
0
0

The historian Carl Degler, who recently died, studied the rapid urbanization and industrialization of the late 19th century. That period has striking parallels to our country at the beginning of the 21st century. Between 1880 and 1915 the country’s face changed, and today the same phenomenon is occurring. The polarization of society and the divisive politics of that time were resolved, according to Degler, only by the rise of progressivism, which returned America to a sense of balance. The lack of a progressive “third way” today is startling, given that the concentrations of wealth and power are higher than ever existed in the Gilded Age.

At the time, America was about to leave behind Jefferson’s ideals of an agrarian-based egalitarian society: the principles of free education, democracy, and land ownership. Now, we are urbanizing again, to a new and greater degree. As we evolve from industrialization to digitalization, the same cycle appears to be occurring. Here in Florida, urbanization is nearly complete, with a single archipelago of semi-urbanity having spread its web across nearly the entire peninsula.

While this may seem like advancement, a gradually disempowered class feels increasingly resentful of the fast-moving cities. Here in Florida, those cities are woven in and around the rural populations. The situation seems dire, but it's only a shadow of the human toll taken during the industrial revolution. Still, it is easy to see why social issues and moral values are central to those feeling left out of the cosmopolitan, prosperous cities.

In the 1890s, no amount of handwringing by do-gooders helped reduce the suffering of children in mines, or the shameful exploitation of railroad workers. Populists, labor firebrands, and utopians contributed little to the solution, only sparking more controversy. Strikes increased divisiveness and polarized the country.

Ultimately, it was through the emergence of progressivism in the reasonable center that true progress was made, and that the balance of the original founding principles was restored. No such movement exists today.

An iconoclastic thinker, Degler called the progressive movement an essentially conservative one, pointing out that Fred Howe and its other luminaries pressed to conserve the original Jeffersonian goals of American reform. Degler quoted Howe: “The great problem now before the American people is, how can opportunity be kept open; how can industry be saved from privilege; how can our politics be left to the unimpeded action of talent and ability?” The progressives formed the American Creed around the new city and industry which were then rising. Howe’s questions are apt in this era’s uncertain world.

A progressive center has yet to emerge from today’s highly polarized political climate. We continue to see and hear more divisiveness, and the upcoming presidential campaign promises to be nasty. Neither party has brought the two sides together. Our political campaigns in Florida reflect this same dialectic. Local races, once a bit more genteel, seem to be modeled after the national scene. A vacuum has opened up in the center. And today, just as at the end of the ninteenth century, there is little incentive yet to fill the vacuum.

Degler saw turn-of-the-century American society as riven into the many poor and the few rich, and viewed the country’s founding democratic ideal as having been permanently subverted. His penetrating analysis of the last Gilded Age, and of an America that was gradual splintering, influenced a generation of scholars and historians. Degler’s essay, “New World A’Comin,’” noted that the rise of progressivism came only after decades of serious abuse and human tragedy at the end of the Industrial revolution.

Progressives such as Howe and fellow reformer E. A. Ross encouraged the shouldering of a certain moral responsibility from top to bottom. But up until Ross’s treatise, Sin and Society in 1907, forty years of increasingly grisly and dark times for workers passed before things got much better.

In today's America, we don't see dead children carried out of coal mines; no dead strikers, and no labor riots in the streets. 'Worker abuse' does not signify starvation or mortal danger. Protest against the privileged wealthy class is also less strident than it was a hundred years ago. Thus, if a progressive movement emerges from our current troubles, it is likely to be comparatively mild, and will need to fight against much more powerful odds to emerge. For one, the news media has no vested interest in settling disputes. And for another, the working class isn’t in peril for its life, and any great settling of accounts between the working class and the elite seems as though it will be put off to the distant future.

I was a student in Florida in the 1970s when I first studied Carl Degler’s ideas during a unique period. The Vietnam War had just ended, and the national identity was sensitive. In Florida, we were highly conscious of the difficult relationship with Cuba. So, along with American history, the state required a course called “Americanism vs. Communism.” The notion of Americanism— not capitalism, you may notice, or democracy, but “Americanism”—included the terms “melting pot,” “exceptionalism,” and “The American Dream.” In a rural state with wide-open land at the time, this anxiety to present a unified, signature American identity had a powerful effect on those of us coming of age: Americanism was on the defensive.

In that mix, Degler’s ideas were provocative. “Wherever men have striven to realize their moral visions, they have demonstrated that ideas, as well as economic forces, can change the direction of history,” Degler wrote in Out of Our Past. With Degler’s death, the notion of history’s moral trajectory may finally have died also. He challenged pat concepts: he refuted the notion of “melting pot,” citing the lack of assimilation of many ethnicities, and the stubborn refusal of a few to put racism behind them. Instead, he called America a “salad bowl.” He also rejected the idea of American exceptionalism, and noted that Jeffersonian ideals were only renewed through hard work. Maintaining these ideals today, in America’s new urban face, seems a fading dream as well.

Here in Florida, the rancor of last autumn's gubernatorial race seems forgotten. People are back at work, tourists are flowing into the state, and the population is swelling. Construction, thanks to easy credit, is everywhere. Reform is unlikely while the good times are here. Americanism, it seems, has triumphed, and the quaint, Jeffersonian notions of an agrarian, egalitarian society are again collecting dust for the time being.

Instead, we have a superficial choice between two political parties that seems less and less substantive, and more and more like a marketer’s dream: Coke or Pepsi. Degler’s notion of history as a continual evolution of ideas, and of the rise of a progressive 'third way' is, for now, dormant. Many of us who were lucky enough to read Out of Our Past in Florida’s public schools still keep Degler's provocative ideas with us. Those ideas may be put to good use when today's soft drinks go out of style, and the public is thirsty for a middle ground once again.

Richard Reep is an architect with VOA Associates, Inc. who has designed award-winning urban mixed-use and hospitality projects. His work has been featured domestically and internationally for the last thirty years. An Adjunct Professor for the Environmental and Growth Studies Department at Rollins College, he teaches urban design and sustainable development; he is also president of the Orlando Foundation for Architecture. Reep resides in Winter Park, Florida with his family.

Flickr photo by Cliff: That Other Gilded Age. Edith Wharton, oil on canvas by Edward Harrison May, seen here during her privileged childhood. Wharton's fiction became acclaimed for its critical view of Gilded Age society.

Viewing all 4164 articles
Browse latest View live