Quantcast
Channel: Newgeography.com - Economic, demographic, and political commentary about places
Viewing all 3795 articles
Browse latest View live

The Danger of Race-Based Politics

$
0
0

Overall, perceptions of worsening racial relations have been building since the Obama years. And now, with everything from the Kate Steinle murder verdict to President Trump’s dog-whistling Muslim tweets, they see destined to worsen further.

Ironically the strongest demand for racial exclusion comes mostly not from traditional racists — still not extinct — but from a campus left determined to address the evils of “whiteness” through policies of racial separation not seen since Jim Crow days. At some campuses, events are held that whites are excluded from and racially separate dorms are being developed. Even at the high school level, there are attempts to be “racially conscious” towards students, essentially teaching them to their racial “profile,” with dubious educational benefits.

President Trump’s unfortunate tendency to go out of his way to offend non-whites, whether they be Navajo war heroes, Hispanics or inner-city African Americans, makes this all worse. The president and the radical racialists both seem to find common purpose in the creation of kindling for racial bonfires.

Race is not the fundamental problem — class is

Some Democrats see identarian politics as the real core of the party and also the most likely course back to power, as the white population drops. The loser here, however, is any hope for racial comity. The rise of racialist politics — pushed by writers like Ta-Nehisi Coates — tends to deepen alienation between ethnic groups. For example, a steadily rising majority of Los Angeles residents now expect another riot in the next five years; that number climbs to 70 percent among younger people.

In California, and some other states, Latino politicians and activists have embraced the notion of “open borders” to the point that some cities, like San Francisco, actually advise aliens with criminal records how to avoid deportation. There is even a notion of downgrading citizenship itself, essentially erasing the border or any sense of shared national identity, more essential than ever in an increasingly diverse country. All this in a state, like California, where more whites are dying than being born since 2000.

Perhaps most tragically, this race-conscious approach does little to address the fundamental problem facing all young people — the lack of jobs that pay anything close to a sustainable family wage amidst soaring rents and home prices. The real issue is a growing class divide, that sees many Americans, including whites, being more downwardly mobile.

Read the entire piece at The Orange County Register.

Joel Kotkin is executive editor of NewGeography.com. He is the Roger Hobbs Distinguished Fellow in Urban Studies at Chapman University and executive director of the Houston-based Center for Opportunity Urbanism. His newest book is The Human City: Urbanism for the rest of us. He is also author of The New Class ConflictThe City: A Global History, and The Next Hundred Million: America in 2050. He lives in Orange County, CA.

Photo: Cabe6403 at English Wikipedia [CC BY-SA 3.0 or GFDL], via Wikimedia Commons


Suburbs & Exurbs Grab Nearly All Metropolitan Growth

$
0
0

The pattern of suburban (and exurban) population growth in the suburbs and exurbs that has dominated the United States since World War II has returned and is intensifying. This is evident from the latest American Community Survey (ACS) data for the 53 major metropolitan areas (more than 1 million population) as analyzed by the City Sector Model (See Note: The City Sector Model).

Before World War II, US metropolitan areas were considerably less automobile oriented and had higher population densities. There had been considerable suburbanization in the 1920s, facilitated at first by transit and then by early automobile growth, but that was largely interrupted by the Great Depression of the 1930s. More rapid suburbanization took place following the war.

The result was that the United States became an overly suburban nation (as research by Professor David L. A. Gordon and colleagues have also found in Canada and Australia).

The Rising Share of Suburban and Exurban Population

City Sector Model analysis shows that by 2000, 83.5 percent of major metropolitan area residents lived in the automobile oriented, principally postwar suburbs and exurbs. The exurbs largely include both urban development and rural areas within the metropolitan area (which is both the labor market and housing market).

The share of residents living in the suburbs and exurbs increased to 85.3 percent in 2010. The share of growth in the Urban Core was so small between 2000 and 2010 that the exurbs passed the urban core in population. The exurban population now leads that of the Urban Cores by 3,000,000.

The most recent data, from the ACS 2012 to 2016 rolling survey (middle year: 2014) places the suburban and exurban share of major metropolitan area population at 85.5 percent. Since 2010, suburban and exurban growth has accounted for an even higher 90.5 percent of population growth (Figure 1). The share of growth in the Urban Core was 9.5 percent, well below its 14.5 percent share of the 2010 population. Even the prewar Central Business Districts, part of the urban core had growth that fell nearly one-third short of their 1.3 percent 2000 population (1.0 percent).

The overall growth in the suburbs and exurbs was 6.6 million from 2010. The Later Suburbs accounted for 3.4 million new residents, the Earlier Suburbs 2.0 million and the Exurbs 1.1 million. The Urban Core added 0.7 million, approximately 70,000 in the Central Business Districts and 610,000 in the Inner Ring (Figure 2). Overall suburban and exurban growth was nearly 10 times Urban Core growth.

Overall, the major metropolitan areas grew at a greater rate than the nation (0.50 percent annually), adding an average of 0.67 percent annually to their population since 2010. By far the greatest growth was in the Later Suburbs, where an annual average of 1.15 percent has been added to the population, more than double than the overall major metropolitan rate. The Exurbs grew nearly as fast as the metropolitan rate, while the Central Business District grew less than the major metropolitan area rate, but more than the national rate. The Inner Ring and Earlier Suburbs grew more slowly than both the national and major metropolitan area rates (Figure 3).

Over the last year, the suburbs and exurbs grew even more quickly, comprising 92.9 percent of major metropolitan growth, leaving just 7.1 percent of the growth for the Urban Core (Figure 4).

The suburbs and exurbs grew from 2010 in 51 of the 53 metropolitan areas. The only losses were in Cleveland and Pittsburgh, where Urban Core losses were even greater than the suburban and exurban losses. However, despite their declining share of the population growth, the Urban Cores have also continued to do better in population growth than in the three decades preceding 2000, before significant declines in central city crime rates. In 25 of the 53 major metropolitan areas, the Urban Cores have grown since 2010.

Some Urban Cores are Doing Very Well

The good news for America's Urban Cores can be found in New York. New York is unique in having by far the largest Urban Core in the nation with 10.7 million residents and 53 percent of the metropolitan area population. Since 2010, New York has had 74 percent of its growth in the Urban Core and only 26 percent in the suburbs. This is by far the strongest urban core showing among the 53 major metropolitan areas and dwarfs that of the other six that have urban cores with more than 1 million population.

Each of the other six metropolitan areas with more than 1,000,000 urban core population had majority suburban growth, ranging from 59 percent in Boston to 80 percent in Washington. Five of these metropolitan areas, New York, Chicago, Philadelphia, San Francisco, Boston and Washington are also unique in having "transit legacy cities" at their cores, which contain 57 percent of transit commuting destinations, according to the 2016 American Community Survey (1 year data). The other metropolitan area with an Urban Core above 1,000,000 population, Los Angeles, has had 89.0 percent of its population growth in the suburbs and exurbs since 2010, about the same as the 90.5 percent average for all 53 metropolitan areas (Figure 5).

The Future?

The net domestic migration trends of this decade suggest that suburban and exurban growth will continue to be strong. These data, which reflect all of 2010 to 2016 (unlike the American Community Survey 2012-2016 data), show that the least core-dominated (most suburban) metropolitan areas that virtually monopolize net domestic migration gains (a table with the extent of suburbanization is in America's Most Suburbanized Cities). The 16 metropolitan areas that are 99 to 100 percent suburban gained about 1,775,000 net domestic migrants. The 13 that are 95 to 99 percent suburban gained 550,000. Overall, the 24 metropolitan areas below 95 percent suburban lost 2,100,000 net domestic migrants. Within these, the nine metropolitan areas below 80 percent suburban --- which includes five of the seven with urban cores over 1,000,000 residents --- lost 1,585,000 (Figure 6). Overwhelmingly, people continue to move to the suburbs (except in New York) and especially to the most suburb-dominated metropolitan areas.

Note: The City Sector Model:

The City Sector Model (Figure 7) classifies population using demographic and land-use factors that changed materially around the time of World War II, after which the automobile sealed its dominance, people walked and used transit less and virtually all new development was at lower densities on the urban periphery (the suburbs and exurbs). Using small area data (zip codes), the City Sector Model produces far more accurate estimates of urban form and lifestyles (such as commuting) than can be obtained from the jurisdictional data that has been used for decades. The use of municipal data --- central cities as the urban cores versus the balance of the metropolitan area as the suburbs --- overstated or understated the extent of the urban core or the suburbs, depending on the metropolitan area. In New York, for example this approach overstated the extent of the suburbs by including places like Jersey City, North Bergen, Hoboken and Union City as suburbs, despite their urban form and lifestyles that are demonstrably urban core. In other metropolitan areas, such as Phoenix, San Jose and Kansas City, the extent of the urban core was wildly exaggerated because they incorporated large suburban areas. Additional background will be found in "Measuring Urban Cores and Suburbs in the United States," in Infinite Suburbia edited by Alan Berger and Joel Kotkin.

Wendell Cox is principal of Demographia, an international public policy and demographics firm. He is a Senior Fellow of the Center for Opportunity Urbanism (US), Senior Fellow for Housing Affordability and Municipal Policy for the Frontier Centre for Public Policy (Canada), and a member of the Board of Advisors of the Center for Demographics and Policy at Chapman University (California). He is co-author of the "Demographia International Housing Affordability Survey" and author of "Demographia World Urban Areas" and "War on the Dream: How Anti-Sprawl Policy Threatens the Quality of Life." He was appointed to three terms on the Los Angeles County Transportation Commission, where he served with the leading city and county leadership as the only non-elected member. He served as a visiting professor at the Conservatoire National des Arts et Metiers, a national university in Paris.

Photograph: Rockefeller Center, New York (by author)

What If Everything You Know About The Suburbs Is Wrong?

$
0
0

With 52 essays from 74 authors, Infinite Suburbia’s 732 pages comprehensively analyze the suburbs from the perspectives of architecture, design, landscape, planning, history, demographics, social justice, familial trends, policy, energy, mobility, health, environment, economics, and applied and future technologies. Organized by theme in an index that best resembles a spider’s web, the book is meant to be read in a nonlinear fashion, reminiscent of a choose-your-own-adventure novel. The editors of The Architect’s Newspaper (AN) spoke with the book’s editors, Alan M. Berger and Joel Kotkin, about the future of the suburbs.

Many of their analyses and provocations upend our notions of what the suburbs are and what they will become.

The Architect’s Newspaper: What is suburbia and how do you define it for this book?

Joel Kotkin and Alan Berger: Suburbia is generally a lower-density area outside the city core. In our approach, we look for such things as predominance of single-family housing, dependence on automobiles (particularly for non-work trips), age of housing stock, and distance from central core. This is about 80 percent of U.S. metro areas; some cities, like Phoenix and San Antonio, are predominately suburban even within their city boundaries. Within the book we have no fewer than five leading authors who define suburbia using different quantitative methods that are arguably more accurate than the U.S. Census at capturing the activities defining suburbia.

What are some of the myths that surround the architecture and design community’s perception of the suburbs?

Berger: Globally, the vast majority of people are moving to cities not to inhabit their centers, but to suburbanize their peripheries. I’m sure we can all agree that there are many suburban (and urban) models that are wasteful, unsustainable, and inequitable. However, despite having deep historical roots in conceiving suburban environments, the planning and design professions overwhelmingly vilify suburbia and seem disinterested in significantly improving it. Robert Bruegmann’s essay in the book reminds us that those who consider themselves the intellectual elite have a long history of anti-suburban crusades, and they have always been proven wrong. Our book, Infinite Suburbia, is built for an alternative discourse that can open paths to improvement and design agency, rather than condemning suburbia altogether. Our goal? To construct a balanced, alternative discourse to architecture and urban planning orthodoxy of “density fixes all,” and in doing so ask: “Can suburbia become a more sustainable model for rethinking the entire urban enterprise, as a vital fabric of “complete urbanization?”

Georgetown, Texas, United States. (Matthew Niederhauser and John Fitzgerald)

What were some of the most surprising or counterintuitive things you found about the suburbs when compiling these essays?

Berger: One of the consistent themes in the book, and what gets me most excited as a landscape scholar, is the virtue of low density and the ecological potential of the suburban landscape. Environmentally, suburbs will save cities from themselves. Sarah Jack Hinners’s research in the book really surprised me. It suggests that suburban ecosystems, in general, are more heterogeneous and dynamic over space and time than natural ecosystems. Suburbs, she says, are the loci of novelty and innovation from an ecological and evolutionary perspective because they are a relatively new type of landscape and their ecology is not fixed or static.

Kotkin: Two trends that may seem counterintuitive to urbanists have been the rapid pattern of diversification in suburbs, which now hold most of the nation’s immigrants and minorities, as well as the fact that suburbs are more egalitarian and less divided by class than core cities.

What did you learn from studying some of the suburbs that aren’t the classic idyllic American suburb as we might see in the media?

Berger: Not surprisingly, the American Housing Survey found that more than 64 percent of all occupied American homes are single-family structures. But in other countries, suburban contexts are anything but low density, such as along the peri-urban edges of Indian cities and those spread across China and Southeast Asia. Globally, not all suburbs look alike or follow the “post Anglo Saxon, North American model.” One fact remains, however, which is that in many parts of the world upward mobility is linked to suburban living.

How do you see suburbia changing in the next few decades?

Kotkin: Suburbs will change in many ways. First, they will continue to spread in those regions that have not employed strict growth controls. Denser development seems inevitable—such as The Domain [development] in north Austin—although [the suburbs] will remain largely surrounded by the single family and townhouses most people prefer. Although they already are, they will become more attractive to Millennials, who will demand fewer golf courses and conventional malls, and more hiking/biking trials and open, common landscapes. Suburbs will become more independent from the traditional city centers except for some amenities and central government services.

Berger: Autonomous driving will dramatically change how we live, particularly in suburbia, where the dominant form of mobility is cars. Once there is widespread adoption of electrified autonomous cars, dramatic sustainability dividends will flourish in the suburbs of the future. This may also take the economic strain off metro mass transit systems, which can focus on service improvements within the core areas rather than stretching outward. Shared autonomous vehicles will become the preferred form of mass transit in areas not serviced by traditional buses or rail.

What are the gentrification problems or other issues around the suburbanization of poverty?

Kotkin: Gentrification, often subsidized by governments, is driving poorer people from city cores to closer or—in some cases—more distant suburbs. These are usually places that are either far from workplaces or have a less desirable housing stock. Yet suburbanization of poverty needs to be put in context of the massive overall population advantage of suburbs; overall poverty rates in cities remain twice as high as those of suburbs, and the pattern has not changed much in the past decade.

What can designers or planners take from the book? Is there a role for traditional planning at this scale, when market forces are so strong?

Berger: Readers should convincingly take away the enormous opportunity ahead in designing more sustainable and equitable suburbs and the importance of suburban fabric to the entire urban enterprise. This is systemically evident from social, economic, environmental, and design perspectives. Of course, there is great agency awaiting designers and planners in the new suburbia. We created them in the first place, so we have a responsibility to evolve the forms and forces toward more sustainable futures.

This piece first appeared in The Architect's Newspaper.

Joel Kotkin is executive editor of NewGeography.com. He is the Roger Hobbs Distinguished Fellow in Urban Studies at Chapman University and executive director of the Houston-based Center for Opportunity Urbanism. His newest book is The Human City: Urbanism for the rest of us. He is also author of The New Class ConflictThe City: A Global History, and The Next Hundred Million: America in 2050. He lives in Orange County, CA.

Alan Berger is Professor of Landscape Architecture and Urban Design at Massachusetts Institute of Technology where he teaches courses open to the entire student body. He is founding director of P-REX lab, at MIT, a research lab focused on environmental problems caused by urbanization, including the design, remediation, and reuse of waste landscapes worldwide. He is also Co-Director of Norman B. Leventhal Center for Advanced Urbanism at MIT (LCAU).

Photo: Infinite Suburbia (Courtesy Princeton Architectural Press).

Bringing Down Housing Prices in the Bay Area

$
0
0

On Sunday the New York Times ran a story on the difficulties of building new housing in California, focusing on the city of Berkeley. There’s a lot of good in the piece, including the insane difficulties of getting approvals to build even when you propose something in keeping with the existing zoning.

But it misses a lot too. Firstly, it focuses on building more multifamily housing in existing single family neighborhoods. That seems to be the main lever it believes needs to be pulled to bring down housing costs. The idea that the Bay Area might build more housing on greenfield sites – single or multifamily – isn’t even contemplated. Nor does the piece cite examples of where large scale infill densification actually rendered housing affordable in the absence of new greenfield construction. I’m not aware of any such cases.

That’s not to say that upzoning or densification are a bad things. I would support upzoning and building more infill in nodes proximate to transit stations. (I also think we should be honest that our intent in this is in fact to change the character of the neighborhood). But if you’re taking urbanized area expansion off the table, don’t ever expect to bring housing prices down materially.

The focus of these kinds of stories usually seem to be places like Berkeley, or San Francisco or Palo Alto or New York City. But these are special places. It’s not realistic to think you could ever build enough housing to accommodate the demand to live in them. Keep in mind that if prices fell by 50% in San Francisco, which would still be high, massive numbers of new people would contemplate moving there. The housing crisis has to be solved primarily through building more workaday communities, not elite ones.

Also, the piece fails to note the role of various building regulations, impact fees, lawsuits, etc. in driving up the price to construct housing. The San Diego Union Tribune recently had a piece on housing prices in that city that details some of these. (They also note that about half of San Diego County land is off-limits to building, including some zoned for agricultural use only).

Lastly, I find it interesting that many of the same kind of people who complain about state preemption in other contexts are very happy to see the state of California disempowering localities to make land use decisions (a core function of local government).

In short, yes, we need to make it easier to build in existing neighborhoods and we need to allow increased density in some locations. But we shouldn’t pretend that building more apartments in the Berkeleys of this world will bring Bay Area housing prices down to affordable levels absent greenfield development (or a collapse in demand).

This piece originally appeared on Urbanophile.

Aaron M. Renn is a senior fellow at the Manhattan Institute, a contributing editor of City Journal, and an economic development columnist for Governing magazine. He focuses on ways to help America’s cities thrive in an ever more complex, competitive, globalized, and diverse twenty-first century. During Renn’s 15-year career in management and technology consulting, he was a partner at Accenture and held several technology strategy roles and directed multimillion-dollar global technology implementations. He has contributed to The Guardian, Forbes.com, and numerous other publications. Renn holds a B.S. from Indiana University, where he coauthored an early social-networking platform in 1991.

Photo: Alfred Twu

Doing Houston Wrong

$
0
0

Last August, Hurricane Harvey made landfall in Texas, causing massive flooding in the Houston area and likely becoming one of the most expensive disasters (current estimate: $81.5 billion) in U.S. history. In the aftermath, Houstonians rallied to rebuild and look after one another, but they did so with the echoes of a persistent chorus of criticism ringing in their ears: Houston, critics said, was partially to blame for what had happened.

Though some of the New York Times’s coverage, notably by Emily Badger, was fair-minded, much of it was full of selective reporting and bias. According to Michael Kimmelman, Houston struggled because it is not properly zoned and because it lacks the planning that one associates with cities like New York. “The very forces that pushed the city forward are threatening its way of life,” Kimmelman wrote. Kimmelman blames Houston’s notorious “sprawl,” underwritten, as one urbanist historian tells him, by “decentralization and anti-statism.”

The Times has a selective memory. New York is certainly zoned and planned, but it suffered $19 billion in damage from Superstorm Sandy, which dropped only a half-inch of rain. But Sandy’s storm surge flooded 51 square miles of New York and inundated 300,000 homes and 23,400 businesses—estimates that exclude the much-larger impacted area in the suburbs of New York City. “‘Smart growth’ plans didn’t prevent that,” noted the Wall Street Journal.

Higher density and zoning don’t guarantee a resilient infrastructure. New Orleans before Hurricane Katrina was both dense and zoned, but this did not protect the city from devastation. In September, Hurricane Irma did considerable damage around residential towers and in downtown Miami. As Houston mayor Sylvester Turner put it: “Zoning wouldn’t have changed anything. We would have been a city with zoning that flooded.”

The real point of Kimmelman’s story, like much Times coverage of almost any natural disaster, is that the effects of climate change are already here, and to avoid them, cities must adopt a specific view of urban development and an accompanying planning agenda. “Texas after Harvey is no different, and perhaps even less prepared to change” than New Orleans, Kimmelman maintains. But Houston responded to disastrous flooding many times before climate change became an issue, including after the 1900 hurricane that essentially destroyed Galveston, and another that deluged downtown Houston in 1935. Yet Kimmelman and other commentators blame Houston for purportedly ignoring nature and inviting disaster. “No city could have withstood Harvey without serious harm, but Houston made itself more vulnerable than necessary,” intoned Bloomberg. “Paving over the saw-grass prairie reduced the ground’s capacity to absorb rainfall. Flood-control reservoirs were too small. Building codes were inadequate. Roads became rivers.”

Hysteria about climate change and finger-wagging about zoning do not address the real issue: boosting resilience. Houston has already shown that it can learn from the past. Previous storms, such as Hurricane Ike (2008) and Hurricane Allison (2001), led to regulations requiring “detention ponds,” which temporarily capture storm water, for all new developments more than 10,000 square feet in land area. These detention basins require no net increase in runoff from new developments. Electricity can’t be turned on for a development until it passes detention inspections, which reoccur annually.

Overall, the Harris County Flood Control District has spent over $4 billion on infrastructure, and spends another $100 million each year—a far cry from doing “nothing,” as critics imply. The Texas Medical Center, the world’s largest medical complex, suffered significant flooding damage during Allison, but it made improvements afterward—installing warning systems, pumps, elevated electrical equipment, and floodgates and doors that prevented flooding damage during Harvey. The media devoted much attention to Houston’s flooded streets but rarely noted that the city designed those streets as last-resort water-detention ponds. Though 30 percent of Harris County was underwater at some point during Harvey, less than 7 percent of homes were damaged. The enhanced regulations helped the region withstand a disaster that would have humbled New York, and which still afflicts New Orleans. In less than two weeks, Houston was largely back in operation.

The notion that setting aside more open space would have contained Harvey is dubious at best. As Charles Marohn notes at Strongtowns, critics lack a “proper sense of scale.” Between 1992 and 2010, according to research by Texas A&M, nearly 25,000 acres of wetlands were lost to development around Houston; they would have stored nearly 4 billion gallons of stormwater. That sounds like a lot, but Harvey dropped an estimated 19 trillion gallons of rain on Texas. The lost stormwater-storage capacity amounts to 0.2 percent of the water that fell during the storm. And too high a greenspace requirement would have led to even more sprawl, pushing developers further out, as has occurred in cities around the world, such as Toronto and London.

Much of what critics think they know about Houston is simply untrue.

“Lack of zoning in Houston has contributed to people building anything, anywhere,” a city planner told Marketplace—but Greater Houston imposes substantial permitting regulations and zones many areas. Sugarland, Pearland, The Woodlands, Cinco Ranch, and Lake Jackson—areas of much recent growth—are zoned. Other outlying areas, like Pasadena and Conroe, are not.

The city is not as “sprawling” as critics insist; the Houston region ranked as the 18th densest among 41 metro areas with more than 1,000,000 people—scoring higher than Boston, Austin, and Philadelphia. Houston’s density is approximately equal to that of Seattle and only 18 percent less dense than Portland, a smart-growth mecca. Houston is far denser than some other large urban areas: 66 percent denser than Hartford, 74 percent denser than Atlanta, and 77 percent denser than Charlotte.

Nor is the city the paved-over disaster so often evoked in the media. Houston has more acres of parkland and greenspace than any other large city in America, and it ranks third behind San Diego and Dallas in park acreage per capita. The city has substantially fewer impervious surfaces covered by buildings, roads, and parking lots (39.2 percent) and substantially more absorbent surfaces with trees, grasses, and soils (60.6 percent) than similarly populated American cities. “If Harvey happened in 1850 instead of today,” explains historian Phil Magness, “the results would be nearly identical in terms of land flooded . . . No zoning law or ban on parking lot construction would ever have ‘fixed’ anything about that.”

The standard suggestion from the experts is that Houston should sharply constrain development in the prairie outside the city, where the vast majority of growth has taken place. Yet Houston’s development model remains attractive enough that, even after Harvey, the region is among the leaders in new housing starts. (Moody’s forecasts a drop in metro Houston’s employment and gross regional product in fourth quarter 2017, but an increase, above pre-Harvey levels, by first quarter of 2018.) Few planners or critics appreciate that Houston’s liberal land-use regulations have led to some of the most affordable housing in the U.S., as measured by price-to-income ratios. Coupled with its strong economy, this has made Houston among the best cities in the world in terms of standard of living—well above New York, Los Angeles, Chicago, and other planning paragons. Over the last 10 years, Houston’s “median multiple”—the median house price, divided by median household income—has averaged 3.2, roughly a third of that in coastal California.

Perhaps the solution to flooding lies not in undermining Houston’s regulatory model but in strengthening it. Houston’s dispersed, multipolar form, notes MIT’s Alan Berger, may have helped it respond more effectively to Harvey; the city has no central point, like Manhattan in New York City, whose closure damages the entire region. If we accept that more Harvey-like events are possible, even probable, then the most important issue is not zoning but flood control, which requires resilient systems. Bolstering resiliency is an issue not just for Houston but also for many communities in the vulnerable coastal areas where a growing number of Americans live.

Should Houston abandon growth to defend itself against projected climate change? Great cities don’t surrender; they build themselves around resiliency. The Netherlands has been addressing, with great success, a rise in sea levels for several hundred years. The prosperity of drought-plagued California depends on massive water transfers from its mountain ranges. Even in impoverished Bangladesh, better drainage and preparedness has reduced deaths and damage from flooding. After the devastation of Harvey, Houston must address its longstanding vulnerability to flood—but with a focus on boosting resiliency, not abandoning its growth model.

Houston has the history and the resources to plan for potential disaster. Often overlooked is the region’s remarkable grassroots culture. Houstonians, residents of America’s most diverse large metropolitan area, reacted to disaster with remarkable aplomb—showing the “Houston spirit,” as Mayor Turner called it. People volunteered to help their neighbors in such numbers that many were turned away.

Such grassroots efforts may not be a complete solution to nature’s fury, but they do represent a critical element, along with strong government action, in building urban resiliency. American cities, particularly coastal cities, will likely face more disasters like Harvey. They can surrender to urbanist orthodoxy, thus assuring the loss of social mobility already so evident in many high-regulation cities, or they can come up with adaptive strategies that protect residents while nurturing urban opportunity.

This piece first appeared in City Journal.

Joel Kotkin is executive editor of NewGeography.com. He is the Roger Hobbs Distinguished Fellow in Urban Studies at Chapman University and executive director of the Houston-based Center for Opportunity Urbanism. His newest book is The Human City: Urbanism for the rest of us. He is also author of The New Class ConflictThe City: A Global History, and The Next Hundred Million: America in 2050. He lives in Orange County, CA.

Tory Gattis is a Founding Senior Fellow with the Center for Opportunity Urbanism, and co-authored the original Opportunity Urbanism studies. Tory writes the popular Houston Strategies blog and its twin blog at the Houston Chronicle, Opportunity Urbanist, where he discusses strategies for making Houston a better city. He is the founder of Coached Schooling, a startup to create a high-tech network of affordable private schools ($10/day) combining the best elements of eLearning, home and traditional schooling to reinvent the one-room schoolhouse for the 21st century. Tory is a McKinsey consulting alum, TEDx speaker, and holds both an MBA and BSEE from Rice University.

Photo: Rich Johnstone, via Flickr, using CC License.

Dense Downtown vs. Suburban Dispersed: A Pilot Study on Urban Sustainability

$
0
0

The fashion among urban planners for “compact city” planning and intensification, emphasized as a substitute for “harmful” sprawl onto greenfields, has been supported by a substantial volume of advocacy and academic work. But as the authors of a new study, “Dense Downtown vs. Suburban Dispersed: A Pilot Study on Urban Sustainability” say in their abstract, most such work has been “…based on very large data sets of generalized data regarding whole-city energy consumption, or large-scale transport patterns, which often misses important nuances…”

These authors, Antony Wood and Peng Du, are to be commended for their academic integrity. Their study reveals some “surprising” (their term) realities. Dr. Wood notes:

“We’ve all grown up thinking that urban density and verticality is a good thing but there has never been a study that has really looked at this in any detail; they’ve all been generic studies, based on large sets of generalised data. So we thought we should undertake a more focused study to prove it. And the results have been quite the opposite to those we thought we would find.”

The data was collected from 249 households living in high-rise towers in the city of Chicago and 273 households residing in houses in the suburb of Oak Park, 11 kilometres from the Chicago CBD.

The high-rise residents energy consumption was 27 per cent more per person than the suburbanites, and even per average square metre of space, consumption was 4.6 per cent higher. Remarkably, the suburban homes involved not only had a typically larger floor area and greater surface-to-volume area (e.g. higher ceilings, roof cavities, etc.), they were also wooden-framed and significantly older – nearly 100 years old on average.

Some of the greater energy use in the high-rises was due to the lifts and the lighting and heating of common spaces and amenities. But on the “embodied energy” (in construction and materials) measure, the high-rise buildings required 49 per cent more embodied energy per square metre, and 72 per cent more per resident.

Ironically, the high-rise residents were found to own more cars per person, in which their overall travel was 9% greater. Their trip distances for daily commuting and shopping were significantly shorter, by car and all modes (and they did more cycling and walking) but the time spent traveling for these purposes was only a few percent less due to lower speeds. But travel for recreation and other purposes was so significantly longer that any advantage otherwise was more than negated.

These findings are not so surprising to those who were aware of Australian data that was crunched on “New Geography” by Phil McDermott a few years ago.

It is long overdue to have realistic study findings to clarify the realities about energy consumption. Anecdotal evidence and intuition have led some skeptics to question this fad long since. For example, there are numerous options to suburban residents that do not exist for high-rise residents. The sun and wind can be utilized much more effectively, for heating and cooling the home and for drying washing. The use of biomass (wood) for heating and even cooking, is possible. (In fact there are numerous “off-grid” and “self-sustaining” options at low density, which ironically was more of a focus of environmentalists a few decades ago).

McDermott points out that the correlation is overwhelmingly between income and sustainability, regardless of location. Higher income earners consume more resources on average, and inner city high income residents the most prolific in energy use. It is interesting to note in the latest Chicago study, that the suburb, as well as the high rise sample, was also relatively higher-income.

One important point that needs to be taken into account when studying this phenomenon, is just how steeply “exclusionary” a city is “by location”. It has often been noted (e.g. by the authors of the “Costs of Sprawl 2000” study) that the higher house prices are (e.g. expressed by a median multiple) in the entire urban area, the stronger the “drive to qualify” effect. Chicago is actually significantly cheaper in all housing options than Australia’s main cities. Explicit anti-sprawl growth boundary policies exacerbate this “spatial sorting by income” effect, inevitably forcing up the price of all urban land and housing of all types in all locations. This could be expected to worsen the “sustainability” outcomes using real data, for city centers versus suburbs.

But there is also a reverse effect which applies at the level of the “whole city” data comparisons: in cities where housing is cheaper, often due to the absence of anti-sprawl land-rationing policies, households at all income levels have more discretionary income to spend after housing costs. In the case of comparison of a city with high housing costs versus one with low housing costs, the correlation between income and consumption may not hold at the “city versus city” level (although it will within each city). An obvious flaw in the common interpretation of large-scale general-data studies that find lower energy use of all kinds in “compact” cities is that such cities have significantly higher housing costs and hence lower discretionary incomes to spend on consumption. Therefore the mechanism by which energy consumption is lower (if it is), is not necessarily inherent operating efficiency at all.

Many urban economists have been advocating all along for fiscal and “pricing” incentives to be used to achieve the alleged objectives of “compact city” policies; the latter having significant unintended consequences that fiscal and pricing incentives do not. Targeting the consumed resources themselves (land, energy, infrastructure use) with taxes, levies and pricing, allows everyone to change their lifestyle in whichever of a myriad of ways that they prefer. In all likelihood, lower density living with sustainability measures for which it is admirably suited may be the preference of the majority.

Anthony Downs summed this paradigm up with a witty analogy in his “Still Stuck in Traffic” (2004) – he likened it to a picture on a living-room wall that is in the wrong place: fiscal and pricing incentives would be like “moving the picture” while prescriptive urban planning policies are like “moving the wall around the picture”.

Phil Hayward is an independent researcher, writer and lobbyist on urban and transport planning. He is based in New Zealand.

Photo: Chicago north from John Hancock.

The New Mandarins Of The Deep State

$
0
0

The shocking defeat of GOP Senator hopeful Roy Moore may not spell the end of Trumpism, but you can see it from there. The president’s unconventional peasant rebellion has now reached its high-water market, with a countervailing tide threatening to inundate an increasingly vulnerable GOP.

One good piece of news: the once common hysteria about Trump as a new authoritarian threat should start to recede. Constitutional limits, such as elections, tend to undermine even the savviest would-be dictators, and Trump is far from that. His endorsement of Moore, uncontrolled tweeting, and otherwise un-presidential behavior likely has squandered any a promising chance for using a robust economy to expand his base. The GOP Goldman Sachs-crafted tax plan, whatever its long-range impact, likely will offer little encouragement to the working and middle-class voters who have supported him.

Trump: Manna from Heaven for bureaucracy

Trump’s incompetence has turned out to be the gift that keeps giving to the growing mandarin class who dominate much of the upper bureaucracy, media, academia and increasingly the corporate world. With the feared Trumpian Reich already collapsing, we may see the revival of another subtler form of authoritarianism, this time from the re-empowered progressive establishment.

In contrast with Trump’s assertive know nothingism, our long entrenched expert class — behind so many miscalls from peak oil and dietary advice to Syria and the Soviet Union — seems a bit more credible. Instead of “draining the swamp,” Trump has managed to unite all the elements of the so-called “deep state” including both predictable big government progressives with historically conservative agencies like the FBI and most of the national security apparatus.

The establishment opposition, defined by undermining leaks and a relentless Russian prosecution, suggests that Trump’s aggrieved sense of persecution appears at the same time both petty but not totally delusional. “It’s no mystery why Trump doesn’t trust U.S. intelligence agencies,” as long-time national security reporter Eli Lake put it. “As the old saying goes: Just because your paranoid doesn’t mean they’re not out to get you. Trump understandably believes the intelligence agencies are out to get him.”

Read the entire piece at The Orange County Register.

Joel Kotkin is executive editor of NewGeography.com. He is the Roger Hobbs Distinguished Fellow in Urban Studies at Chapman University and executive director of the Houston-based Center for Opportunity Urbanism. His newest book is The Human City: Urbanism for the rest of us. He is also author of The New Class ConflictThe City: A Global History, and The Next Hundred Million: America in 2050. He lives in Orange County, CA.

Photo: Gage Skidmore from Peoria, AZ, United States of America (Donald Trump) [CC BY-SA 2.0], via Wikimedia Commons

Commuting in Canada: 2016 Census Report

$
0
0

Statistics Canada has just released the employment access data out of the 2016 Census, based on the main mode of commuting. Generally, there is little change between the modes, as Figure 1 indicates, compared to the 2011 Census results. (See: New Data on Commuting in Canada).

National Results

Automobiles continue to dominate work access (commuting, including travel and working at home, much of which is "telecommuting") in every census metropolitan area (CMA) of Canada (Table). Autos and other personal vehicles, including both those driven alone and those operating with passengers, accounted for 73.6 percent of work access, down from 74.2 percent in 2011.

Transit had the second largest share, at 11.5 percent, and improvement from 11.2 percent in 2011 and continues an increase from 10.2 percent in 2006. The combined walking and bicycle share increased slightly, to 6.5 percent, but remained below the 7.1 percent in 2006. Working at home increased to 7.4 percent, from 2011, with the largest increase of any commuting mode.

Overall, the national one-way work trip travel time was 26.2 minutes, which increased from 25.4 minutes in 2011. The average work access time, including those who work at home (whose travel time is zero minutes), was 24.3 minutes in 2016 (Figure 2).

Major Metropolitan Areas (1,000,000 and Over)

Among the metropolitan areas with more than 1,000,000 residents (Toronto, Montréal, Vancouver, Calgary, Ottawa-Gatineau and Edmonton), work access shares remained similar from the past. The number of people using cars for work access dropped slightly from 67.1 percent in 2011 to 66.1 percent in 2016. Transit's market share remained the same, at 19.3 percent. The share of commuters walking or cycling increased from 6.2 percent to 6.6 percent (Figure 3). Working at home increased to 7.0 percent from 6.4 percent, an increase greater than that of any other mode of commuting.

The average one-way work trip travel time in the major metropolitan areas was 30.5 minutes. The average work access time for all commuters, including those working at home, was 28.3 minutes, 17 percent longer than the national average.

Other Metropolitan Areas over 500,000 Population

The next five largest metropolitan areas all have over 500,000 residents, according to the latest Statistics Canada estimates and include Québec (with its core municipality, the ville de Québec), Winnipeg, Hamilton, Kitchener-Waterloo and London. Auto use decreased from 78.2 percent in 2011 to 77.8 percent in 2016. Transit commuting rose from 8.5 percent in 2011 to 9.5 percent in 2016. The share for walking and cycling dropped slightly, while there was a healthy increase in working at home, from 5.3 percent in 2011 to 5.9 percent in 2016. Again, the largest gain was in working at home (Figure 4).

The average work trip travel time was 24.1 minutes. If those working at home are included, the average work access time was 22.6 minutes. This is seven percent shorter than the national average.

Metropolitan Areas with 100,000 to 500,000 Population

There are 24 metropolitan areas with between 100,000 and 500,000 population. The auto captures 81.3 percent of work access in these areas. Transit accounts for 5.1 percent of work access and 6.2 percent work at home. The average one-way work trip travel time is 22.0 minutes, or 20.6 minutes when those working at home are included. This is 15 percent less than the national average.

Outside Metropolitan Areas

Outside the metropolitan areas, 81.5 percent of commuters use cars, while 1.6 percent use transit. Walking and cycling account for 5.7 percent of commuting in these areas, a larger share than in the three metropolitan area categories described above. The non-metropolitan areas are also dominant in working at home, with a 9.1 percent share (this includes residents who live on their own farms). The average work trip travel time is 21.5 minutes. With those working at home, the work access time is 19.5 minutes, 20 percent below the national average.

Individual Metropolitan Area Highlights

The results among the largest metropolitan areas varied somewhat. In Toronto and Vancouver, transit's market share was up 3.5 percent (not percentage points) and 2.4 percent respectively, while car use was down 3.5 percent and 2.9 percent. Walking and cycling and working at home generally gained at least as many new commuters as transit. The work trip travel time in Toronto was 34.0 minutes, deteriorating from 32.8 minutes in 2011. Inclusion of those working at home reduces the travel time to 31.5 minutes. In Vancouver, the work trip travel time was 29.7 minutes, worsening from the 28.4 minutes in 2011. Working at home reduces the 2016 figure to 27.2 minutes.

In Montréal, car use was also down (0.7 percent) and transit use was down 0.1 percent. Walking and cycling and working at home were up. The work trip travel time was 30.0 minutes, a small increase from the 29.7 minutes of 2011. Including those working at home, the 2016 average travel time for commuters was 28.0 minutes.

The story was different in three metropolitan areas with between 1.0 and 2.5 million residents. In each, car use increased, though only marginally and transit use dropped. Transit use dropped significantly in Calgary (10.8 percent) and Ottawa-Gatineau (9.7 percent), while falling a smaller 0.7 percent in Edmonton. Working at home was up in all three. Travel times averaged 27.3 minutes in Ottawa-Gatineau, 26.5 minutes in Calgary and 25.9 minutes in Edmonton. With those working at home, the average travel times were 25.4 minutes, 24.6 minutes and 24.5 minutes, respectively.

Trends in a Stable Labor Market

It might seem surprising that Canada's transit commuting share is not increasing significantly in light of the increasing public spending intended to attract people out of their cars. Even in a country with comparatively strong transit market shares, there are challenges. Part of the problem is transit projects that do not live up to their patronage projections, such as Toronto's Pearson Airport train (the "UP Express"). Transit use is highly concentrated in the three largest metropolitan areas, Toronto, Montréal and Vancouver (Figure 5). These labor markets have 36 percent of the commuting in the nation. They account for similar percentages of auto commuting (32 percent), working at home (36 percent) and walking (36 percent). In contrast to their 36 percent overall work access share, their share of transit commuting approaches twice that number (67 percent). And, much of that is concentrated is travel to and from the downtown (central business districts), which represent a small minority of overall employment in each metropolitan area. (See Improving the Competitiveness of Metropolitan Areas).

Moreover, migration trends do not favor the largest metropolitan areas. From 2011 to 2016, more than 225,000 net domestic migrants moved to other parts of the nation, all of which rely to a substantially smaller extent on transit. At the same time, the most sustainable mode of commuting, working at home, continues, as in the United States, to be growing more than any other mode. Out of the 35 metropolitan areas, 24 have work at home shares higher than their transit shares. This includes only one of the 11 metropolitan areas over 500,000 (Kitchener-Waterloo) and 20 of the 24 metropolitan areas under 500,000 The work at home gains, of course, have been at virtually no cost to taxpayers, and given the relationship between shorter commuting times and greater productivity this trend could lead to improved economic growth.

###Table

Wendell Cox is principal of Demographia, an international public policy and demographics firm. He is a Senior Fellow of the Center for Opportunity Urbanism (US), Senior Fellow for Housing Affordability and Municipal Policy for the Frontier Centre for Public Policy (Canada), and a member of the Board of Advisors of the Center for Demographics and Policy at Chapman University (California). He is co-author of the "Demographia International Housing Affordability Survey" and author of "Demographia World Urban Areas" and "War on the Dream: How Anti-Sprawl Policy Threatens the Quality of Life." He was appointed to three terms on the Los Angeles County Transportation Commission, where he served with the leading city and county leadership as the only non-elected member. He served as a visiting professor at the Conservatoire National des Arts et Metiers, a national university in Paris.

Photograph: Toronto (by author)


What Is the Future of Flyover Country?

$
0
0

My latest piece in City Journal is a look at the interior of the country and its future. It’s an introductory survey that points out that there isn’t a simple coasts vs. the rest, but that there are many distinct regions and cities with varying performance. Many interior regions and cities are doing very well while others legitimately struggle. But in most cases there are still significant hurdles that need to be addressed. Here’s an excerpt:

"Cultural attitudes can also be crippling, particularly in the Rust Belt and rural areas. There’s a deep hostility to change and often an active suppression of the pursuit of excellence. In some communities, young people find their college ambitions squelched. Other communities have seen so little influx of newcomers that they’ve become culturally narrow and unwelcoming to outsiders, making it hard to build social networks in these insular places. Changing this social trait won’t be easy—yet it is, arguably, essential to all future change. The fact that the civic attitude in Columbus, Indiana, is so different from that of much of the Midwest is a key reason that it has outperformed.

Third, the region needs to develop its human capital. Today’s manufacturing jobs often require computer or other technical skills, for example, so communities need labor-force training programs to help workers develop advanced skills in these sectors. The knowledge-worker labor force also needs upgrades. The heartland suffers because of the “superstar” effect. In today’s world, the spoils often go to the very top of the hierarchy. The heartland is too often good, even very good, but not the best. An exception that proves the rule is Carnegie Mellon University’s computer-science department, which attracted companies like Uber and Google to set up shop in Pittsburgh. The heartland needs to develop more such leading departments in its universities and attract some top talent. To do that, changes in cultural attitudes will be crucial.

Finally, the nation’s interior regions need to find ways to innovate in new, next-generation industries and technologies. The fracking revolution is an example of a homegrown technology disruption that developed local wealth and jobs, while having a global impact on energy prices. Until the heartland can start leading with some of its own innovative industries and technologies, it will always be in a reactive position. It needs to learn how to play offense, not just defense."

Click through to read the whole piece in City Journal.

Aaron M. Renn is a senior fellow at the Manhattan Institute, a contributing editor of City Journal, and an economic development columnist for Governing magazine. He focuses on ways to help America’s cities thrive in an ever more complex, competitive, globalized, and diverse twenty-first century. During Renn’s 15-year career in management and technology consulting, he was a partner at Accenture and held several technology strategy roles and directed multimillion-dollar global technology implementations. He has contributed to The Guardian, Forbes.com, and numerous other publications. Renn holds a B.S. from Indiana University, where he coauthored an early social-networking platform in 1991.

Photo: Via City Journal.

In Defence of Sydney's Westconnex Motorway

$
0
0

The acrimonious battle over Australia’s largest motorway may be a case study in how class conflict plays out across the ‘post-industrial’ metropolis. On one side, inner-urban gurus of ‘liveability’ and ‘sustainability’ envisage a string of high-amenity havens for professionals in the weightless knowledge economy. On the other, a more dispersed population of workers in the material world of freight production, delivery and storage need efficient connections between a range of scattered industries and transportation hubs.

In Sydney’s case the flashpoint is Westconnex, a new motorway completing 33 kilometres of ‘missing links’ around eastern reaches of the Orbital Motorway Network, currently in early stages of construction. One section swerves over parts of the city’s gentrified inner-south and inner-west. Resistance from a coalition of local residents, municipal politicians, academics, anti-mobility activists and inner-city based media has been vehement and implacable.

The 2012 New South Wales Long Term Transport Master Plan (“Long Term Plan”), amongst other documents, sets out the NSW Government’s basic case for the project. “With Sydney growing, we need to fill the missing gaps”, says the plan, “a fully connected motorway network will be the cornerstone of a free flowing road network.” This sounds like a platitude but it expresses the fundamental point. Orbital motorways are otherwise known as ring-roads, loops and circumferential highways. The words ‘orbital’, ‘ring’, ‘loop’ and ‘circumference’ suggest a complete circle or circuit. Motorists can circulate faster and more freely around a whole metropolitan region without entangling themselves in the arterial road or street system. Intersections, traffic lights and cross-streets (‘at-grade crossings’) are replaced by overpasses and underpasses while interchange ramps facilitate entrances and exits.

Many of the world’s leading cities would be dysfunctional without their orbitals. Imagine London with no M25, Boston with no Route 128, Washington DC with no Capital Beltway, Atlanta with no Perimeter, Vienna with no Ringstrasse or Paris with no Pèriphèrique.

The question is whether Sydney – which, as we are repeatedly told, claims ‘global city’ status – should have an orbital motorway or not. Though successful and indispensable, the existing 110 kilometre network is more semi-circle than circle. By the 1980’s it was clear that earlier plans to build a radial motorway network centred on the CBD were inconsistent with Sydney’s decentralized growth. The genesis of today’s orbital lies in the then Department of Main Roads’ 1987 report Roads 2000, which shifted the focus to a cross-suburban system.

Running laterally over south-western parts of metropolitan Sydney, M5 South West opened in 1992, followed by M2 Hills laterally north-west in 1993, M4 West laterally centre-west in 1997, and M7 Westlink vertically down the western edge in 2005. But there’s no vertical M4-M5 link down the eastern side.

One of Westconnex’s more strident critics, Mark Standen of Sydney University, claims it was pushed onto the Long Term Plan by “wealthy directors and shareholders of private toll road corporations … whose sole objective was to increase profits through the expansion of Sydney’s toll road network”. But the original proposals always included further motorways to close the loop, M4 East and M5 East. That these projects stalled had more to do with cynical politics than transportation analysis. The routes passed through gentrified inner-western electorates held by powerful figures of the Labor Government in office between 1995 and 2011. Plans for M4 East were exhibited in 2003 and quietly shelved.

By general consensus, the motorways bestow immense benefits on Sydney in travel time and vehicle operating cost savings, improved access, and reduced accidents. According to an estimate for Infrastructure Australia, their economic contribution to NSW as at 2008 was $22.7 billion. They were a factor in the city’s post-globalisation rise to world stature. Only a few anti-mobility ideologues or eco-extremists would claim the M4, M5, M2 and M7 are a net cost and should be decommissioned. The case for completing the integrated system of which they were always envisaged to be constituent parts should be self-evident.

Anti-motorway activists cling to the delusion that public transport can handle future transport needs, especially light and metro rail. On basic population, traffic and freight projections alone, however, Sydney’s road network faces escalating demands over coming decades. Reports like the Long Term Plan, the 2012 State Infrastructure Strategy (“SIS”) and more recently the Westconnex Updated Strategic Business Case (“Updated Business Case”) note that Sydney is expected to gain an extra 1.6 million people and 600,000 jobs by 2031 (though there’s debate on whether this rate of growth is desirable).

Over that time, the total number of daily trips will increase by 31 per cent from 16 million to 21 million. Morning peak hour car trips are forecast to jump from 9 million in 2011 to 13 million in 2036. Overall, private car trips are expected to grow 27 per cent by 2032. Yet roads will continue to support the same 75 per cent of all weekday trips.

“In complex metropolitan areas with a multiplicity of journey origins and destinations”, explains the SIS, “there is often no realistic alternative to the car for many journeys”. Some 60 per cent of Sydney’s jobs are dispersed outside of defined metropolitan centres, and of the six ‘most constrained strategic corridors’ identified in the Long Term Plan,‘Parramatta to the CBD via Strathfield’ implicates the M4 and ‘Liverpool to Sydney Airport’ implicates the M5.

As the closest motorway to Port Botany and Sydney Airport, Westconnex will also be instrumental – together with Sydney Gateway – in connecting these major transport hubs to the rest of the orbital network. Sydney’s annual road freight movements of 11.2 billion tonne-kilometres will grow by 67 per cent to 18 billion in 2030, says the Long term Plan. Container throughput at Port Botany is growing at an annual rate of 6 to 7 per cent. While 1.7 million TEUs (twenty-foot equivalent unit) were transported on roads to and from the port in 2012, around 2.7 million are expected next year.

In the case of Sydney Airport, today’s 36 million passengers and 656,000 tonnes of cargo a year will blow out to 77 million passengers and 1.5 million tonnes by 2035.

The road mode share of the NSW state freight task is around 63 per cent, staying at around 59 per cent in 2031 (but higher if you exclude the special case of rail transported coal). Only 14 per cent of container movements through Port Botany went by rail in 2011. “Even under optimistic projections of modal shift to rail”, finds the SIS, “road will remain the dominant mode for Port Botany freight traffic.” Road transport has an inherent cost advantage for short haul cargo due to rail’s high fixed costs. And in NSW, 85 per cent of container movements are within the Sydney metropolitan region.

Much of this freight traffic is generated by Sydney’s new industrial heartland. In the wake of higher land values and the apartment boom, as much as 93 per cent of vacant industrial land is now located on the western fringe. Many logistics, warehouse and manufacturing operators are relocating to that region. Located some 50 kilometres west of the CBD, for instance, the Western Sydney Employment Area encompasses 10,700 hectares of zoned industrial lots. Research by consultancy Urbis and the Urban Development Institute of Australia NSW highlights the importance of systemic road connections like Westconnex for the viability of industrial development on the periphery.

Need for the motorway is a function of Sydney’s particular geography. Major transport gateways like Port Botany and Sydney Airport and some areas of high job density are on the eastern seaboard while the city expands inland and westward.

For a time, critics of Westconnex focused on haranguing the government to release the Updated Business Case. Made public in November 2015, it disclosed a Cost Benefit Ratio of 1.71 or a return of $1.71 for every dollar invested. Vehicle kilometres travelled in 2031 were forecast to rise by 600,000 but Westconnex would reduce vehicle hours travelled by 110,000. The Long Term Plan had estimated a cut in travel times on the M4 and M5 by up to 35 minutes.

The Updated Business Casewas later reviewed by well-regarded consultants SGS Economics and Planning for Lord Mayor Clover Moore, whose jurisdiction covers inner-city residents near the route. Two broad objections stand out amongst their criticisms of its assumptions and calculations. First, “building major new motorways is not a solution that other similarly congested cities are implementing”, which seems an odd endorsement of policy by imitation. Cities are very much a product of their unique history, demography and geography. Second, the estimates of travel time savings fail to “assess the impact of induced demand”. This concept is increasingly prevalent in discussions of transport planning, and often used by pro-transit urbanists to demand a blanket prohibition of all highway expansion. Other traffic management options are simply ignored. Here the Long Term Plan considers ‘induced demand’ in its true context:

It is sometimes argued that building new roads is a futile exercise since within a few years, the road network will be as congested as it was before …

… new roads are not primarily required to increase journey speeds for existing users in peak hours (a common definition of congestion). Rather new roads provide the capacity needed for a growing population and economy … Accordingly, a reduction in journey times in peak periods is desirable, but the first task is to maintain existing performance standards and reliability levels as traffic grows.

In the last twenty years, traffic volumes on the [Sydney road network] have grown by approximately 50 per cent, while travel speeds in the peak periods have remained broadly stable. The new roads built in the last two decades were the minimum required to maintain quality of network service and meet growth requirements.

Anti-Westconnex campaigners and their media supporters – who, according to one survey, represent just 12 per cent of NSW voters – also like to push governance issues that they hope will discredit and ultimately scuttle the project. Whether the proposed toll regime is too high and unevenly distributed across the orbital network; whether tunnel ventilation stacks are too large and badly located; whether owners of resumed land are receiving due process and fair compensation; whether the corporation set up to build and sell a stake in the motorway is transparent or accountable enough; whether the sale and financing model entails risks for taxpayers; and whether business case, tender and procurement processes comply with key principles.

Of course, these are legitimate questions of public policy and administration. The government must take them seriously. But they don’t strike at the fundamental rationale for Westconnex as transport infrastructure.

This piece originally appeared on The New City.

John Muscat is a co-editor, along with Jeremy Gilling, of The New City, a web journal of urban and political affairs.

Questions to Ask about Amtrak 501

$
0
0

The wreck of the 501–the Amtrak train that crashed near Seattle on Monday–is raising lots of questions about Amtrak operations, but they aren’t always the right ones. Here are some questions that should be asked and some of the Antiplanner’s preliminary answers. Answers from Amtrak (the operator), FRA (the funder), Sound Transit (the track owner), or WSDOT (the train owner) may differ.

1. Congress required passenger railroads to install positive train control (PTC) by the end of 2015. Why did the Federal Railroad Administration (FRA) give money to the Washington Department of Transportation (WSDOT) for a new passenger rail line that would not open until after 2015 when the project didn’t guarantee funding for positive train control?

Answer: The Obama administration wanted to distribute high-speed rail funds to as many states as possible in order to build political backing for the program, so it couldn’t be bothered with positive train control. The tracks the train was on are owned by Sound Transit, which says it is installing PTC, but it won’t be finished until spring. Public releases of WSDOT’s application for funds for this train didn’t mention PTC.

2. Around 800 people die in railroad accidents a year. PTC would prevent only about 1 percent of these fatalities; far more would be saved by spending the same amount of money on better grade crossings and fencing of rail rights of way. Why do we put so much emphasis on an expensive technology that will do so little?

Answer: Accidents that PTC could have prevented tend to be more spectacular than people getting killed when a train hits their car at a grade crossing. This suggests that, when politicians decide where private businesses spend their money, it’ll get spent on grandiose programs rather than things that could really make a difference.

3. When an auto driver runs a red light and kills a pedestrian, we don’t blame the auto maker for not making driverless cars sooner; we blame the driver and, perhaps, the people who were supposed to train the driver. Why blame this accident on the lack of positive train control when the train driver should have slowed down and Amtrak should have made sure the driver was qualified to operate this section of track?

Answer: Everyone is looking for a scapegoat, and it is easier to blame an institution than an individual.

4. The train in question had about 250 seats, and this was the inaugural run on this route, which usually generates a lot of interest among rail enthusiasts. Yet there were only 80 passengers on board. Does this confirm that Lakewood Mayor Don Anderson was right when he said “this project was never needed”?

Answer: The big change in Seattle-Portland service was not an increase in speeds but an increase in frequencies (a change that may be delayed by the wreck of one of the new train sets funded by the federal government). Amtrak has only been able to fill 54 percent of this train’s seats, and WSDOT was hoping that more frequent and more reliable trains would increase the percentage of seats filled. We’ll know more after a year or so, but it doesn’t look good if the inaugural run filled less than a third of the seats.

5. Why do so many reporters call this a high-speed train? The top speed between Portland and Seattle is 79 mph, the same as it has always been and the same as most other Amtrak routes. In technical terms, this was a conventional, low-speed train.

Answer: Though this was a low-speed train, it was funded by Obama’s high-speed rail fund. By repeatedly using the term “high-speed trains,” reporters are keeping that idea in the public consciousness, perhaps in the hopes that Trump’s infrastructure plan will include money for more such trains. (This could backfire, however, by making people think that high-speed trains are more dangerous. They aren’t–but they are a lot more expensive.)

6. Why do we need passenger trains at all? Amtrak fares from Seattle to Portland start at $26 and cover less than half the costs of the train. Bolt Bus has six buses a day that take less time than the train at fares of around $15. Plane fares start at $65, though most are around $100 (which may still be less than the full costs of Amtrak), and there are dozens of flights a day.

Short-distance trains were made obsolete by buses in the 1920s. Long-distance trains were made obsolete by planes in the 1950s. When other transportation technologies, such as horseback riding, steamboats, and canals went obsolete, we let them go except for tourists and museums. Why can’t we let go of the passenger train?

Answer: America was suffering an inferiority complex in the early 1960s. We were losing the space race; some thought there was a missile gap with Russia; Japanese electronics were beginning to take over American markets. When Japan introduced its bullet trains in 1964, suddenly there was one more area in which our technology appeared to be inferior. Never mind that our jet airplanes were several times faster than Japan’s trains; Congress began funding passenger trains in 1965, and once a federal program gets started, it generates special interest groups dedicated to keeping it going.

Question: At least Amtrak is getting closer to covering its operating costs, right?

Answer: No, when Amtrak says that, it is lying. Amtrak counts more than $200 million in annual subsidies that it gets from the states as “passenger revenues.” Amtrak also pretends depreciation is zero even though, at more than $800 million per year, it is the second largest line item on its operating budget. Amtrak’s deferred maintenance has led to a backlog of needs in the tens of billions of dollars. When counting only ticket fares and on-board food service revenues against operating costs, including depreciation, Amtrak operations lose more than $1 billion a year and ticket fares cover only a little more than half the costs.

Question: At least Amtrak’s Northeast Corridor makes money, right?

Answer: Only if you don’t count depreciation, deferred maintenance, or other costs that Amtrak doesn’t try to allocate to individual routes. The Northeast Corridor needs at least $35 billion in rehabilitation work just to bring it up to a state of good repair. Another way Amtrak has made its trains appear to be profitable is by calling much of its maintenance work a capital cost, and Amtrak can’t afford to do all of the “basic infrastructure” maintenance needed in the Northeast Corridor, much less the rehabilitation work, without federal subsidies of close to $500 million dollars per year (see page 15).

Question: So is Amtrak’s maintenance backlog only in the Northeast Corridor?

Answer: No, Amtrak doesn’t own most of the tracks it uses outside of the Northeast Corridor, but it still has maintenance needs for its stations and rolling stock. When Amtrak took over private passenger service in 1971, the average age of passenger cars that it acquired from the railroads was 22 years, and they were so worn out that nearly all were replaced within a decade. Today, the average age of Amtrak’s passenger cars is more than 30 years, suggesting that it will soon need to spend billions replacing them.

Question: So are all trains obsolete?

Answer: No, only passenger trains are obsolete. Freight trains are extremely productive, and America has the finest, most advanced rail system in the world. That’s because it is mostly private and operates to produce profits, not to give politicians ribbon-cutting opportunities.

This piece first appeared on The Antiplanner.

Randal O’Toole is a senior fellow with the Cato Institute specializing in land use and transportation policy. He has written several books demonstrating the futility of government planning. Prior to working for Cato, he taught environmental economics at Yale, UC Berkeley, and Utah State University.

Photo: A handout photo made available by the Pierce County Sheriffs Department showing Amtrak train 501 which derailed onto Interstate 5 near Olympia, Washington — Shutterstock/AP HANDOUT/EPA-EFE/REX/Shutterstock—HANDOUT/EPA-EFE/REX/Shutterstock via Time.

Cars: Principal Mobility for Workers in Poverty

$
0
0

Out of the approximately 150 million employees identified in the American community survey for 2016, nearly 10% are below the poverty level. Popular lore might provide a misleading impression that most of these employees reach work by transit. Other than in the New York metropolitan area, nothing could be further from the truth.

Where Transit is Most Important

In the 53 major metropolitan areas (those with more than 1 million population), 12.8% of workers in poverty use transit for their work trip. This is a far cry from the 72.7% who use cars, 60.4 percent driving alone and 12.3% in carpools. However, the share of employees in poverty who commute by transit is much closer to that of the overall population. In 2016, 7.9% of workers in the major metropolitan area used transit to get to work. (Figure 1).

New York is the only major metropolitan area in which employees in poverty use transit more than cars for the work trip. There, 41.7% of work trips are on transit, while 36.5% are by car. But the landscape changes quickly even in the other major metropolitan areas with transit legacy cores. In the Chicago, Philadelphia, San Francisco, Boston and Washington metropolitan areas, around 20% of employees in poverty use transit to get to work. The best transit share is in Boston, at 21.5%. However, 2.6 times as many commuters in poverty use cars (56.5%). In the other four metropolitan areas, cars account for between three and four times as much commuting as transit among the workforce in poverty.

Pittsburgh, Las Vegas, Baltimore and Seattle comprise the balance of the top 10 in transit market share among employees in poverty. In each of these cases cars provide five or more times as much commuting for these low income workers (Figure 2).

However, in nine of the 10 metropolitan areas with the highest market shares among commuters in poverty, the automobile still provides overwhelmingly the largest journey to work share.

Where Transit is Least Important

Workers with below poverty incomes used transit the least in Oklahoma City, where the transit share is 1.6%. This compares to an 87.4% share by car, 53 times the number of workers carried by transit. Birmingham ranks second least in transit market share for workers in poverty, at 2.1%, while 42 times as many use cars. Riverside – San Bernardino, Nashville and Raleigh all have automobile market shares that are 30 to 40 times the share for transit among workers in poverty. Charlotte, Memphis, Sacramento and Richmond round out the bottom 10, each with between 20 and 30 times as many commuters in poverty using automobiles as use transit (Figure 3).

Why Low-Income Workers Use Automobiles

It is easy to understand why workers who have earnings below the poverty level predominantly use automobiles. It is simply that so few jobs can be reached in the modern metropolitan area in a reasonable period of time by means of transit.

University of Minnesota research indicates that the average employee in major metropolitan areas can reach far more jobs by car than by transit. The research indicated that the San Francisco metropolitan area had the highest transit access measured by jobs within a 30 mile trip, at 3.5%. This number falls off rapidly in other major metropolitan areas to as low as 0.3% in Riverside and San Bernardino.

In New York, where an astonishingly low 2.5% of jobs are available within 30 minutes by transit, 13 times as many jobs can be reached by car in that time. Among all 49 major metropolitan areas examined, the average employee could reach 43 times as many jobs by car and by transit. What this means is that for most jobs, for most people, a car is an absolute necessity to adequately compete in the labor market.

Longer Term Hope

Obviously, there is no reason to believe that it is remotely possible to efficiently connect the vast majority of workers, whether or not in poverty, with their jobs by transit. However, there is substantial hope. With transit connections so sparse and the cost of driving beyond the financial means of many low income citizens, autonomous cars in the future could cost-effectively provide mobility throughout the metropolitan area that makes it possible for many more people to work. That would be good not only for people unemployed today, but also for the economy.

The car in transit work trip market shares for employees in poverty is indicated in the table below.


Journey to Work: Employed Persons Below Poverty Level
Major Metropolitan Areas: 2016
Metropolitan AreaCommute by CarCommute by TransitCar Times Transit
Atlanta, GA81.3%8.4%           9.6
Austin, TX78.7%8.5%           9.3
Baltimore, MD69.5%13.4%           5.2
Birmingham, AL90.2%2.1%         42.4
Boston, MA-NH56.1%21.5%           2.6
Buffalo, NY76.4%11.8%           6.5
Charlotte, NC-SC88.5%3.2%         27.3
Chicago, IL-IN-WI67.4%18.0%           3.8
Cincinnati, OH-KY-IN75.6%8.3%           9.1
Cleveland, OH76.7%10.6%           7.2
Columbus, OH81.2%3.6%         22.4
Dallas-Fort Worth, TX86.1%3.6%         23.6
Denver, CO74.7%9.1%           8.2
Detroit,  MI83.4%5.4%         15.3
Grand Rapids, MI80.5%8.2%           9.8
Hartford, CT71.7%9.0%           7.9
Houston, TX86.5%3.6%         23.9
Indianapolis. IN87.1%2.7%         32.3
Jacksonville, FL80.3%6.6%         12.2
Kansas City, MO-KS87.0%3.7%         23.3
Las Vegas, NV76.9%13.9%           5.5
Los Angeles, CA73.0%12.1%           6.0
Louisville, KY-IN84.5%5.6%         15.1
Memphis, TN-MS-AR87.1%3.4%         25.9
Miami, FL77.9%10.3%           7.5
Milwaukee,WI76.7%10.2%           7.5
Minneapolis-St. Paul, MN-WI71.6%12.4%           5.8
Nashville, TN87.7%2.4%         36.6
New Orleans. LA77.8%7.6%         10.2
New York, NY-NJ-PA36.5%41.7%           0.9
Oklahoma City, OK87.4%1.6%         53.4
Orlando, FL82.8%5.8%         14.3
Philadelphia, PA-NJ-DE-MD62.5%20.2%           3.1
Phoenix, AZ81.1%5.3%         15.3
Pittsburgh, PA68.8%14.0%           4.9
Portland, OR-WA69.0%11.6%           6.0
Providence, RI-MA83.5%6.1%         13.7
Raleigh, NC83.5%2.4%         34.5
Richmond, VA79.9%3.6%         22.3
Riverside-San Bernardino, CA85.9%2.3%         37.8
Rochester, NY77.3%9.3%           8.3
Sacramento, CA78.5%3.6%         22.1
St. Louis,, MO-IL80.4%11.1%           7.3
Salt Lake City, UT70.9%12.2%           5.8
San Antonio, TX82.0%6.8%         12.0
San Diego, CA74.6%7.0%         10.7
San Francisco-Oakland, CA60.8%19.0%           3.2
San Jose, CA77.3%8.1%           9.5
Seattle, WA68.3%13.2%           5.2
Tampa-St. Petersburg, FL80.4%5.7%         14.1
Tucson, AZ78.6%7.4%         10.7
Virginia Beach-Norfolk, VA-NC79.2%7.6%         10.4
Washington, DC-VA-MD-WV65.1%18.9%           3.4
Major MSAs72.7%12.8%           5.7
Source: American Community Survey 2016


Wendell Cox is principal of Demographia, an international public policy and demographics firm. He is a Senior Fellow of the Center for Opportunity Urbanism (US), Senior Fellow for Housing Affordability and Municipal Policy for the Frontier Centre for Public Policy (Canada), and a member of the Board of Advisors of the Center for Demographics and Policy at Chapman University (California). He is co-author of the "Demographia International Housing Affordability Survey" and author of "Demographia World Urban Areas" and "War on the Dream: How Anti-Sprawl Policy Threatens the Quality of Life." He was appointed to three terms on the Los Angeles County Transportation Commission, where he served with the leading city and county leadership as the only non-elected member. He served as a visiting professor at the Conservatoire National des Arts et Metiers, a national university in Paris.

Photograph: Sport Utility Vehicle via WikiMedia Commons

Is The End Near For Religion?

$
0
0

“At the heart of every civilization, religious values are asserted.”

— Fernand Braudel

Even at this season that should be about spiritual re-awakening, it is hard to deny that we live in an increasingly post-religious civilization. Virtually everywhere in the high-income world, faith, particularly tied close to institutionalized religion, has been dropping for a decade, and the trend is accelerating with each new generation. Even once bright religious celebrations like Christmas have not only become less spiritual, even here in America, but seems to be inexorably returning to its original pagan roots as essentially a winter solstice holiday.

A simple look at the statistics collected by Pew tells the story. The Christian population in Europe is already shrinking. Between 2015 and 2060, Pew estimates the share of North American and European Christians will drop from 36 percent to barely 23 percent. Indeed in 24 of 42 traditionally Christian countries, many of them in Europe, deaths among Christians already exceeds births. Only in Africa, do Christian births seem likely to continue outnumber births.

Here in the U.S., once considered the last wealthy bastion for religion, church affiliation has been declining with each new generation; only 38 percent of younger millennials who consider faith “important in their lives,” notes Pew, compared to nearly 60 percent of boomers. Nearly half of young people predict that by 2050 the largest religious grouping will be those who are unaffiliated.

Read the entire piece at The Orange County Register.

Joel Kotkin is executive editor of NewGeography.com. He is the Roger Hobbs Distinguished Fellow in Urban Studies at Chapman University and executive director of the Houston-based Center for Opportunity Urbanism. His newest book is The Human City: Urbanism for the rest of us. He is also author of The New Class ConflictThe City: A Global History, and The Next Hundred Million: America in 2050. He lives in Orange County, CA.

Photo: Marburg79 (Own work) [CC BY-SA 3.0], via Wikimedia Commons

The New Retail: Gird Your Loins

$
0
0

I was at a friend’s house when she got a delivery of groceries. The boxes arrived at her door from one of the many new services that allow customers to shop online. Fresh fruit, veggies, meat, wine, eggs, cheese, milk, Christmas wreathes, and fresh cut flowers. She just pushed a few buttons and voila!


I happen to have another friend in the neighborhood who works at this particular company so I get an occasional glimpse into the evolving business model from her perspective. San Francisco is a test market. Like so many new companies that launch here, once the concept is proven and refined more investment is gathered and a nationwide expansion ramps up in segments. Some companies dream of being the next Airbnb or Lyft. Others just want to make themsleves appealing enough for an IPO (Initial Public Offering) and cash out. Others want to be acquired by an existing established conglomerate. In many cases the physical assets of a start up are irrelevant (or nonexistent) since the technology and data bases are what others buy and build on.

Parallel to these experiments in direct retail on the interwebs are complimentary start ups organized around “last mile” delivery mechanisms. With so much stuff traveling from Point A to Point B traditional package services are being disrupted or added on to with specialized options and increased local capacity. These too will eventually evolve into larger national systems one way or another.

It’s worth noting that my friend who now orders her groceries on demand as if food were Netflix (another example of retail that migrated to the virtual universe) lives exactly one block from both a Safeway and a Whole Foods not to mention dozens of smaller shops of all kinds. Physical proximity to retail has nothing to do with what’s driving her to shop online. Neither is price.

Two blocks away is a weekly farmers market that sells absolutely everything including produce, bread, honey, meat, and seafood. The quality on offer is a cartoon extravaganza of local, organic, biodynamic, grass fed, free range, blah, blah, blah. Quality isn’t an issue in the neighborhood.

Increasingly the retail experience has become less and less about personal service and more about chain stores pushing more work off on to technology and their customers. It’s all a desperate attempt to cut costs and reduce labor. In recent months I’ve found myself waiting in line with items to purchase while too few employees struggled to manage too many technical procedures. More than a few times I’ve looked at what I had in my basket, realized the time and effort weren’t worth it, and simply walked out of the store without buying anything. The quality of the experience has declined significantly.

The get-big-or-get-out supersizing of retail has resulted in giant warehouses that function with an economy of scale. We all drive out to the edge of town and load up the car with pallets of toilet paper and frozen nuggets. The next logical step in this progression is to have the warehouses distribute products directly to homes. There’s just no reason to show up in person to buy five gallon jugs of laundry detergent.

From a city planning perspective we’re about to have a whole lot of really big empty buildings and thousands of acres of vacant parking lots litter the landscape. We’re just not going to need all these retail buildings anymore. And this new glut will be on top of all the current half dead shopping centers and strip malls we already don’t know what to do with. For decades many municipalities have engaged in an arms race to generate sales tax. If customers could be drawn in from other towns the winning jurisdictions could effectively cream off revenue from their neighbors. Hence the massive proliferation of premium outlet malls, mega auto dealerships, casinos, big box stores, and the like. That entire dynamic has left much of the country seriously over retailed and it’s going to get much worse.

Here’s one of my predictions for how cash starved governments are going to respond. The same technology that facilitates virtual commerce can also be used to create entirely new tax revenue streams. Since all these delivery trucks already have real time tracking devices new per mile fees for operating on public roads will be introduced. Sooner or later every vehicle traveling through every jurisdiction is going to pay for the privilege.

Here’s another twist to this story. I used to buy replacement bags for my vacuum cleaner at a local mom and pop shop. This was the same shop where I bought the vacuum itself. A couple of years ago the shop keeper told me they were relocating to a distant suburb. I stocked up on bags, but eventually ran out. At that point there were no longer any physical places near me that sold the kind I need. Buying mail order replacement bags became my only option. We’re going to see more of this in the future.

There’s nothing particularly new about buying things remotely and having them delivered. The first Sears catalogue was published in 1888 and manufactured goods were sent out across the nation by rail. Local delicatessens have been delivering groceries to apartments in places like New York since forever with no more technology than a telephone and a teenager on a bicycle. And pizza and Chinese food have appeared at suburban front doors for decades.

But what we’re looking at now is a shift in commerce that’s going to have a profound impact on the built environment and economic flows. There are going to be all sorts of new winners and unexpected losers. In places with high land values and pent up market demand redundant retail properties will be redeveloped to other productive uses. But when land is cheap and the market is soft these places are going to fester with no solution in sight. Gird your loins.

This piece first appeared on Granola Shotgun.

John Sanphillippo lives in San Francisco and blogs about urbanism, adaptation, and resilience at granolashotgun.com. He's a member of the Congress for New Urbanism, films videos for faircompanies.com, and is a regular contributor to Strongtowns.org. He earns his living by buying, renovating, and renting undervalued properties in places that have good long term prospects. He is a graduate of Rutgers University.

Cronyism Damaged Venezuela before Chavez

$
0
0

Venezuela is bankrupt, having just defaulted on three interest payments. And much of the world is pointing fingers at the socialist policies of Hugo Chavez and those of his successor, the incumbent Nicolás Maduro. This laying of the blame is not wrong but it is incomplete.

The kindest thing you could say about Mr. Chavez is that he was a talented demagogue who brilliantly identified his opportunity and judiciously seized his moment. But, as previously argued by Fred McMahon of the Fraser Institute, Chavez did not start Venezuela’s downward spiral. He was instead one of the final acts in the country’s decades-long devolution from laissez-faire capitalism to cronyism and finally to socialism. Cronies undermined Venezuela’s economy for decades and opened the door to Chavez’s socialism.

McMahon explained last year:

Venezuela, like much of Latin America, was afflicted by crony capitalists, who detest free markets as much as crony socialists, and degraded free markets long before Mr. Chavez.

Cronyism restricted markets, weakened the rule of law, undermined growth, adopted many leftist “populist” policies to maintain power and favoured their supporters at all income levels, excluding others and generating the frustration that led to Mr. Chavez.

In the same vein, we argued previously that cronyism is a bridge from laissez-faire to socialism.

Measured by the Fraser Institute’s Economic Freedom Ranking, Venezuela ranked 10th in the world in 1970 but it had slipped to a ranking of 109th by the time Chavez became president in 1999. Of course, he and his successor made the crony problem even worse, as socialists everywhere have a habit of doing, and Venezuela ranked 159th or dead last of all ranked countries in 2015.

Some of the decline that started in 1970 is explained by Venezuela’s growing oil revenues. The great leap in the price of oil made the economy increasingly extractive and exclusive. Great wealth came more easily to rent-seekers with the right connections in government and business than to those who deserved it by dint of entrepreneurial merit.

There is a warning here for other countries. In 1970, the United States was ranked 4th on the Fraser index. By 2015, it had dropped to 11th. If this moderate step down is not too worrying at first blush, it may be because cronyism has become a problem in nearly all countries after a prolonged boom in the real estate, telecom, energy, law, finance and other extractive sectors. If it could be measured in absolute instead of relative terms, the US drop would probably look significantly more pronounced.

President Trump and his entourage speak the language of capitalism but they arguably constitute the most glaringly cronyistic administration in memory. In theory therefore, we could now be in a transition that opens the door to the presidency of Bernie Sanders or one of his political heirs.

See the Fraser Institute’s Economic Freedom Rankings from 1970 to today.

This piece originally appeared on Populyst.net

Sami Karam is the founder and editor of populyst.net and the creator of the populyst index™. populyst is about innovation, demography and society. Before populyst, he was the founder and manager of the Seven Global funds and a fund manager at leading asset managers in Boston and New York. In addition to a finance MBA from the Wharton School, he holds a Master's in Civil Engineering from Cornell and a Bachelor of Architecture from UT Austin.

Photo: Karel Fuentes [Public domain], via Wikimedia Commons


Portland’s Congestion Plans Are Working

$
0
0

Portland’s transportation policies are working. At least, they’re working if you think their goal is to increase congestion in order to encourage people to find alternatives to driving. At least, the increased-congestion part is working, but not many are finding alternatives to driving.

According to Waze, Portland has the fifth-most-miserable traffic in the United States. Waze is an app that asks its users to rate their driving experiences. Rather than just measure hours of delay, Waze’s driver satisfaction index is based on a variety of indicators including traffic, road quality, safety, driver services, and socio-economic factors such as the impact of gas prices on the cost of living.

Waze calculates the index for any area that has more than 20,000 Waze users, which means 246 metropolitan areas in 40 countries. Nationally, the U.S. is ranked number three after the Netherlands and France. In terms of congestion alone, the United States ranks number one (that is, has the least congestion). The Netherlands and France edge out the U.S. in overall scores because of their higher road quality and safety ratings.

Unfortunately, Waze’s release of the 2017 index doesn’t include metro area-by-metro area data. But it has posted detailed 2016 data, and the numbers aren’t too different.

According to Waze, the nation’s worst congestion was in San Diego (scoring 3.1 on a scale of 1 to 10 with 10 being least congested), followed by New York and San Francisco (3.7 each), then Portland (4.5), Miami (4.8), and Honolulu (4.9). At 5.3, Seattle was supposed to be less congested than Portland, with Chicago (5.4), Boston (5.5), and Washington (5.5) slightly better still and Los Angeles (5.8) even better. None of these come close to Kansas City or Oklahoma City (8.5 each), Phoenix (8.4), Indianapolis (8.2). Among the nation’s largest urban areas, San Antonio is doing well at 7.8; Tampa and Dallas at 7.3; Minneapolis 7.1; Denver 6.9; Atlanta 6.5; and Houston 6.3.

Portland’s low ranking is a bit of a surprise considering most other studies agree Los Angeles and Seattle are even more congested. But Portlanders have good reason to believe traffic there is getting worse. As the Portland Tribunenoted a few days ago, census data reveal that the number of drivers on the road has greatly increased in the last two years.

The Tribune compared 2014 and 2016 data for the city of Portland and the Portland metropolitan area (which is based on county boundaries). The Antiplanner prefers to use the Portland urbanized area as it is more of an economic unit than the other two, which are based on political boundaries. A more detailed look at the data suggests the situation is even worse than reported in the Tribune.

First, the Tribune‘s look at 2014 and 2016 data showed an increase in transit commuting along with an increase in auto commuting. But 2015 data show that transit commuting in Portland peaked in that year, and there were 2,210 fewer transit commuters in 2016 than in 2015. That’s the first decline transit has seen since 2010, and the decline that year was due to the financial crisis; no similar excuse exists for 2016. The decline, incidentally, was in bus commuters; the number of rail commuters grew.

Second, if we go back a decade, we see that, while transit commuting may have grown in numbers, it hasn’t gained any market share. Transit carried 8.0 percent of Portland-area commuters to work in 2006 just as it did in 2016. People driving alone made up 74.6 percent of commuters in 2006 and the same in 2016. Carpooling’s share declined from 11.2 to 9.8 percent, and the difference was mostly made up for by cycling, which went from 1.2 to 2.8 percent, while walking grew from 3.4 to 3.7 percent.

Third, the really big increase was in people who worked at home. The above numbers look only at commuters. While the total number of Portland-area commuters grew by 19.6 percent, work-at-homes increased by 58.4 percent. While it’s easy to say that work-at-homes are growing faster than transit riders, there’s not much point in doing so as I’m not sure what government policies could promote more working at home if that were considered important.

Finally, despite the increase in work at homes, the number of cars used to take people to work has significantly grown. By dividing the number of two-person carpoolers by two, the number of three-person carpoolers by three, etc., we can estimate the total number of cars used by both drive-alones and carpoolers. This grew from about 655,000 in 2006 to 764,000 in 2016.

Adding more than 100,000 new cars to the road in a decade must have increased congestion, especially since Portland hasn’t built many, if any, new freeways and other arterials in that time period. Yet that congestion hasn’t led a greater share of commuters to ride transit. In fact, transit’s share shrank from 8.5 percent in 2015 to 8.0 percent in 2016 even though there were 4.3 percent more cars commuting to work in 2016 than in 2015.

Census data also estimate the total amount of time people spend getting to or from work (table B08136). Dividing by the number of commuters reveals average trip times. Between 2006 and 2016, average trip times for auto commuters grew from 22.5 to 25.7 minutes, which indicates that congestion has increased.

Average trip times for transit commuters grew from 42.0 to 45.1 minutes. Transit is slower, but longer trip times also suggest that people are willing to spend more time commuting if they don’t have to drive themselves. Curiously, bus trip times in 2016 were shorter than rail whereas they were longer in 2006. This could mean buses are faster but more likely means people have grown less tolerant of sitting on buses when alternatives, such as rail or Uber, are available.

In short, Portland is definitely more congested, but nothing else has worked as planners hoped. Congestion has not boosted transit’s share or discouraged drive-alone’s share of commuting. All of the money spent on light rail has gotten people off of buses and onto trains, but hasn’t gotten people out of their cars and onto transit. All that has happened is that costs to everyone have grown.

This piece first appeared on The Antiplanner.

Randal O’Toole is a senior fellow with the Cato Institute specializing in land use and transportation policy. He has written several books demonstrating the futility of government planning. Prior to working for Cato, he taught environmental economics at Yale, UC Berkeley, and Utah State University.

Photo: Paul Nelson (Flickr) [CC BY-SA 2.0], via Wikimedia Commons

The Migration of Millions: 2017 State Population Estimates

$
0
0

Texas added the most new residents of any state over the past year according to the July 1, 2017 estimates of the United States Census Bureau. Texas grew by 400,000 residents (Figure 1). Florida added 328,000 residents more than one third more than California. Four states grew between 100,000 to 125,000, led by Washington, North Carolina, Georgia and Arizona. Colorado and Tennessee round out the top 10. The ten states adding the most new residents include five from the South census region and five from the West census region.

Population Growth

Over this decade, the three largest states have dominated numeric population growth. Texas has led the nation in each of the seven years, though has experienced declines in growth over the last two due likely to the instability in petroleum markets. Since 2010, Texas has added 3.1 million residents, more than live in 18 states and the District of Columbia. California has added 2.2 million new residents since 2010, edging out Florida. California's growth, however, has dropped significantly, to 240,000 between 2016 and 2017 the smallest number since the late 1990s. California's growth in this decade had peaked in 2014 at more than 350,000, but has since dropped by nearly one quarter. Florida added 2.1 million new residents and has led California in each of the last three years.

The other three largest states did much more poorly. New York has dropped from a gain of over 120,000 in 2011 to only 13,000 in 2017. Illinois has done even more poorly, dropping from the 21,000 gain in 2011 to a loss of 33,000 in 2017. Illinois has experienced a reduction in its growth each year of this decade.

Illinois Drops a Notch: Further, Illinois in 2017 lost its long standing hold on the fifth-largest position to Pennsylvania. Pennsylvania's ascendancy reverses a development in the 1950s, when Illinois passed Pennsylvania to become the third largest state. Less than a decade earlier, Pennsylvania had been passed by California, relinquishing its second ranking, which it had held since the 1810 census. Later, Illinois had been passed in the 1970s by Texas and in the following decade by Florida. (Figure 2).

The South census region has dominated US population growth throughout the decade. Between 2010 and 2017, the South added 9.1 million new residents or 54% of the national growth. This compares to the West, which also grew strongly but added millions fewer (5.5 million new residents). The West accounted for 32% of the national growth. The Midwest and Northeast continue to lag, each taking 7% of the national growth (Figure 3).

Idaho experienced the largest proportional growth rate in 2007, at 2.2%. Idaho was followed closely by its neighbors, Nevada at 2.0% and Utah at 1.9%. The next four positions were taken by large or medium sized states, including Washington at 1.7%, Florida and Arizona at 1.6% and Texas at 1.4%. Colorado and Oregon grew at 1.4%, followed by South Carolina at 1.3% (Figure 4).

Where the Millions are Moving

Despite the fact that interstate migration stands at a lower rate than in recent decades, millions of people continue to cross state lines seeking new residences. From 2010 to 2017, the number was 4.3 million. Domestic migration has been dominated by the South and West census regions, consistent with their dominance of population growth.

The South census region had a net domestic migration gain of 2.7 million residents. The West census region had a gain of 600,000 net domestic migrants, far short of the number in the South. In contrast, a net 1.9 million residents left the Northeast for other census regions, while 1.3 million left the Midwest for elsewhere (Figure 5). Even so, as indicated above, the Northeast and Midwest continue to grow as a result of in migration from other countries and natural growth (births minus deaths).

The six largest states experienced significantly different net domestic migration results. Florida has led in net domestic migration, adding 1.025 million residents from other states since 2010. Florida has also led in three of the seven years. Texas led in the first four years of the decade and has added 945,000 net domestic migrants.

Among the other four largest states, the net domestic migration losses have been substantial. The smallest loss has been in Pennsylvania at approximately 215,000. California has lost approximately 545,000 net domestic migrants since 2010, a pattern that has accelerated in recent years. Just three years ago (2014), California had lost fewer than 50,000 net domestic migrants. By 2017, outward net migration had escalated to nearly 140,000. In the first five years of the decade, California had done less poorly in net domestic migration than Illinois. However, in each of the last two years, California has lost more net domestic migrants than Illinois.

Illinois has lost the second largest number of net domestic migrants, at more than 640,000. The losses have escalated from below 75,000 in each of the first three years of the decade to nearly 115,000 in 2017. New York hemorrhaged by far the largest number of net domestic migrants, more than 1,020,000. In each of the last two years, New York has lost approximately 190,000 net domestic migrants, well above its early 80,000 loss in 2011. (Figure 6).

Dominance of the South (and West)

The latest population estimates indicate that the long-term movement to the South and West is continuing. Of course, the biggest exception in the West remains its largest state, California, which has become one of the nation's largest exporters of people since the 1990s. In contrast, Arizona, California, Washington, Colorado, Oregon, Nevada have attracted large numbers of people. In the South, most states have been gaining domestic migrants, though there are exceptions, especially Maryland, Virginia, West Virginia and Mississippi. But overall the South has been dominant. In each of the last seven years, the South has been the destination for more than 70 percent of US net domestic migration.

The data is summarized in the Table below.


State Population Estimates
2010 - 2017
State & DCApril 1, 2010July 1, 2017Change%Net Domestic Migration
Alabama4,785,5794,874,74789,1681.9%1,153
Alaska714,015739,79525,7803.6%-37,492
Arizona6,407,0027,016,270609,2689.5%278,290
Arkansas2,921,7373,004,27982,5422.8%7,222
California37,327,69039,536,6532,208,9635.9%-556,710
Colorado5,048,0295,607,154559,12511.1%276,485
Connecticut3,580,1713,588,1848,0130.2%-153,276
Delaware899,712961,93962,2276.9%25,824
District of Columbia605,040693,97288,93214.7%30,787
Florida18,846,46120,984,4002,137,93911.3%1,025,261
Georgia9,712,69610,429,379716,6837.4%163,536
Hawaii1,363,8171,427,53863,7214.7%-42,456
Idaho1,570,9121,716,943146,0319.3%61,332
Illinois12,841,19612,802,023-39,173-0.3%-642,821
Indiana6,490,0296,666,818176,7892.7%-57,864
Iowa3,050,2233,145,71195,4883.1%-17,695
Kansas2,858,4032,913,12354,7201.9%-83,158
Kentucky4,347,9484,454,189106,2412.4%-12,593
Louisiana4,544,8714,684,333139,4623.1%-47,701
Maine1,327,5681,335,9078,3390.6%3,968
Maryland5,788,0996,052,177264,0784.6%-112,092
Massachusetts6,564,9436,859,819294,8764.5%-98,948
Michigan9,876,7319,962,31185,5800.9%-225,302
Minnesota5,310,7115,576,606265,8955.0%-32,518
Mississippi2,970,4372,984,10013,6630.5%-59,667
Missouri5,995,6816,113,532117,8512.0%-57,375
Montana990,5071,050,49359,9866.1%37,304
Nebraska1,829,9561,920,07690,1204.9%-12,289
Nevada2,702,7972,998,039295,24210.9%145,131
New Hampshire1,316,7001,342,79526,0952.0%2,875
New Jersey8,803,7089,005,644201,9362.3%-395,160
New Mexico2,064,6072,088,07023,4631.1%-55,903
New York19,405,18519,849,399444,2142.3%-1,022,071
North Carolina9,574,24710,273,419699,1727.3%327,631
North Dakota674,518755,39380,87512.0%39,178
Ohio11,539,28211,658,609119,3271.0%-192,615
Oklahoma3,759,5293,930,864171,3354.6%28,125
Oregon3,837,0734,142,776305,7038.0%181,252
Pennsylvania12,711,06312,805,53794,4740.7%-214,426
Rhode Island1,053,1691,059,6396,4700.6%-33,615
South Carolina4,635,8345,024,369388,5358.4%264,781
South Dakota816,227869,66653,4396.5%11,890
Tennessee6,355,8826,715,984360,1025.7%178,125
Texas25,241,64828,304,5963,062,94812.1%944,018
Utah2,775,2603,101,833326,57311.8%50,162
Vermont625,842623,657-2,185-0.3%-10,179
Virginia8,025,2068,470,020444,8145.5%-53,500
Washington6,741,3867,405,743664,3579.9%249,052
West Virginia1,854,3151,815,857-38,458-2.1%-28,380
Wisconsin5,690,4035,795,483105,0801.8%-68,738
Wyoming564,376579,31514,9392.6%-8,838
Source: U.S. Census Bureau


Wendell Cox is principal of Demographia, an international public policy and demographics firm. He is a Senior Fellow of the Center for Opportunity Urbanism (US), Senior Fellow for Housing Affordability and Municipal Policy for the Frontier Centre for Public Policy (Canada), and a member of the Board of Advisors of the Center for Demographics and Policy at Chapman University (California). He is co-author of the "Demographia International Housing Affordability Survey" and author of "Demographia World Urban Areas" and "War on the Dream: How Anti-Sprawl Policy Threatens the Quality of Life." He was appointed to three terms on the Los Angeles County Transportation Commission, where he served with the leading city and county leadership as the only non-elected member. He served as a visiting professor at the Conservatoire National des Arts et Metiers, a national university in Paris.

Photograph: Chicago, Largest city in Illinois (by author)

What’s Red, Blue, and Broke All Over? America.

$
0
0

Beneath the sex scandals, moronic tweets, ridiculous characters, and massive incompetence that dominate Washington in this mean period of our history lie more fundamental geopolitical realities. Increasingly it is economics—how people make money—rather than culture that drives the country into perpetual conflict.

The tax bill brought that conflict to the surface, as Republicans made winners of Wall Street and the corporate elites, as well as most taxpayers and homeowners in lower-cost states, and losers of high-income blue-state taxpayers in high-tax states such as California, New York, and New Jersey.

A U.S. News and World Report headline denounced the bill as a declaration of “War on the Blue States,” comparing it to the infamous Kansas-Nebraska Act that allowed those states to determine whether to adopt slavery in the face of Northern objections. Others in the blue world suggested the bill meant that America no longer wishes to be “at the forefront of the new economy.”

Many progressives see their vision of a post-industrial economy—green, high-tech, and media-centered—as representing the enlightened future. The blue states are all too often hostile to the manufacturing, agriculture, and energy industries critical to the heartland’s, and the nation’s, future prosperity and security.

The Great Divide

A look at the current Republican majority explains much of our new sectional divide. The states with the largest share of jobs tied to industry (PDF)—Indiana, Wisconsin, Michigan, Iowa, and Alabama—all went for Trump. In contrast, the share of manufacturing jobs in key Clinton states like New York, California, and Massachusetts is no more than half as large.

Differences are even more stark in industries such as energy, mining, and agriculture. The watershed of the Mississippi River, largely controlled by Republicans, is the source of 92 percent of U.S. agricultural exports, and 78 percent of global feed, grain, and soybean exports. The only other major player is California, whose position is threatened by water policies and the prospect of renewed drought.

Perhaps even more politically critical is the energy industry. The top three states for oil and gas jobs—Texas, Oklahoma, and Louisiana—are all deep red. Much of the recent growth has been in the industrial heartland states of Ohio and Pennsylvania, as well as oil-shale-rich North Dakota. All went with Trump.

Blue states have generally abandoned these basic industries. In fact the third largest energy-producing state, California, seems determined to eliminate its once powerful oil and gas sector, while New York, unlike its neighbors, has decided to strangle the emergent shale oil industry in its crib. Manufacturing, on the rise in much of the country, is stagnant or declining in many blue states. Some of the most precipitous drops in the numbers of highly paid blue-collar jobs overall since 1991 have been in California, New York, and Illinois (PDF).

Interior California and upstate New York—the red parts of the big blue states—have declined into a kind of Appalachian dystopia. Nearly half of the 16 counties with the highest percentages of people earning over $190,000 annually are located in California. Yet, the state also has a remarkable 77 of the country’s 297 most “economically challenged” cities based on levels of poverty and employment. Altogether, these troubled cities are home to roughly a third of the state’s population.

California has been portrayed as a “boom state” because of strong growth in finance, technology, media, and tourism rather than tangible production. Workers in these industries tend to be far more liberal than those in manufacturing, mining, energy, or agriculture, and to congregate in the highly urbanized parts of the state.

The professional and business services sector, clustered in New York and Chicago, also amounts for the highest share of all jobs in the blue bastions of Washington, D.C., Northern Virginia, San Jose, and San Francisco.

A similar pattern can be seen in the information sector, which includes software as well as entertainment. Here, Los Angeles leads in total jobs, followed by New York. But the highest share of workers in information can be found in San Francisco, San Jose, and Seattle—all sterling examples of the blue-state economy. These areas claim they are paragons of “opportunity”—and it’s true if you have rich parents, an H1B visa, or a Ph.D.

One blue-state author sees a divide between two economies: “one modern, stable, and healthy, the other backwards, impoverished, and sick.” Slate declared that middle-class jobs in manufacturing and construction are “never coming back.” That was true, until it wasn’t. Over the next decade, there could be a shortage of 2 million manufacturing employees, according to a report this year by Deloitte and the Manufacturing Institute (PDF). More, the “backwards” places in fact employ many skilled people; of the 20 metro areas with the most engineers per capita, only one—Silicon Valley—is located on the East or West Coast.

Crucially, red-state Americans tend to live in more egalitarian regions. In the true-blue economies, employment tends to be highly divided between high-wage workers in finance, media, tech, and business services and low-wage people laboring as cleaners, nannies, retail clerks, and the like. This is one reason why the blue states voting for Clinton, as progressive economist James Galbraith has demonstrated, have far higher levels of inequality than those places, largely in the interior, which supported Trump.

A Tale of Two Presidents

“Elections have consequences, and at the end of the day, I won,” new President Barack Obama famously said in 2009, as his bank bailout and stimulus that gave aid to overstretched governments benefited the places where finance is based and where public spending tends to be the highest.

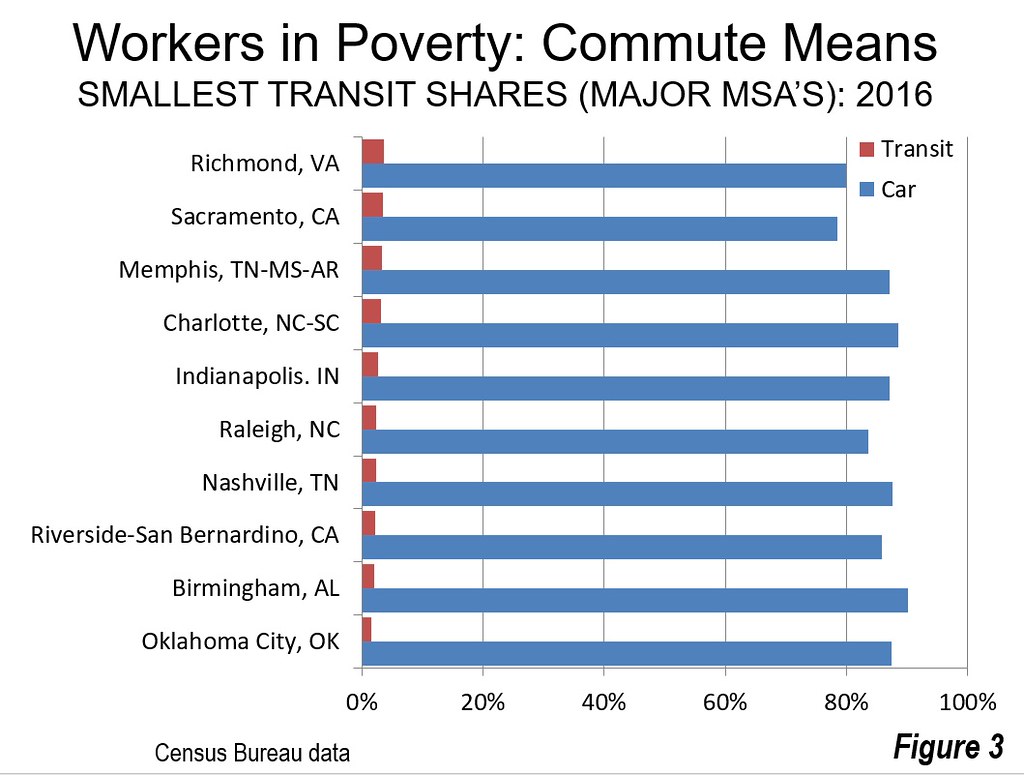
He also supported the expansion of mass transit, something that mostly benefits a handful of dense and deep-blue “legacy cities” beginning with New York but also including San Francisco, Chicago, Boston, Philadelphia, and Washington, D.C. His spending did much less for areas away from the coasts where transit is insignificant, large financial headquarters are distant, and government is generally smaller.

Perhaps the biggest sectional divide, however, was over energy. Obama’s environmental policies were popular in blue states, most with little in the way of energy industries. It was far less so in places where energy constitutes an important part of the economy. More important still, while his subsidies for green energy thrilled Silicon Valley and some Wall Street investors, the prospect of higher energy prices would put American manufacturers at a disadvantage.

All this at a time when the fracking revolution was giving U.S. firms a potential huge advantage against their European and Asian competitors. Obama did not eliminate the momentum in the Rust Belt, but tried to slow down energy production by imposing environmental and federal leasing policies, a la California, that would reduce the scale and raise the costs of the new energy boom.

These issues may not have registered with many Manhattanites or San Franciscans, but they matter greatly to people in Midwestern and Southern states dependent on fossil-fuel energy. Obama may have been hailed a hero in Europe, but less so in places like Odessa, Texas, or Fort Wayne, Indiana. And when his would-be successor, Hillary Clinton, talked about regulating coal mines “out of business,” it all but guaranteed she would lose many of the Appalachian states her far savvier husband had won as recently as 1996.

As President Obama said, elections have consequences. Trump’s red-state economic base explains his move away from the Paris accords, and his dismantling of many Obama-era decrees on energy policy, public lands, and transportation. The fact that so many of the previous presidents’ most important moves were essentially edicts allowed Trump to easily rescind them.

Barely noted in the press, the economy seems to have responded positively to the president’s policies (or lack of them), as evidenced by rising employment, rising stock prices, and increased foreign investment, particularly in industrial properties.

The big winners under Trump have been the ones that were most threatened by Obama: the industrial, agricultural, and energy states that span the territory from Appalachia to the Rockies. So far this year the country has added 138,000 manufacturing jobs, compared to 34,000 jobs lost during the same period last year. High-school graduates and minorities, who languished during Obama’s blue-state boom, now see their wages growing faster than those for managers and professionals.

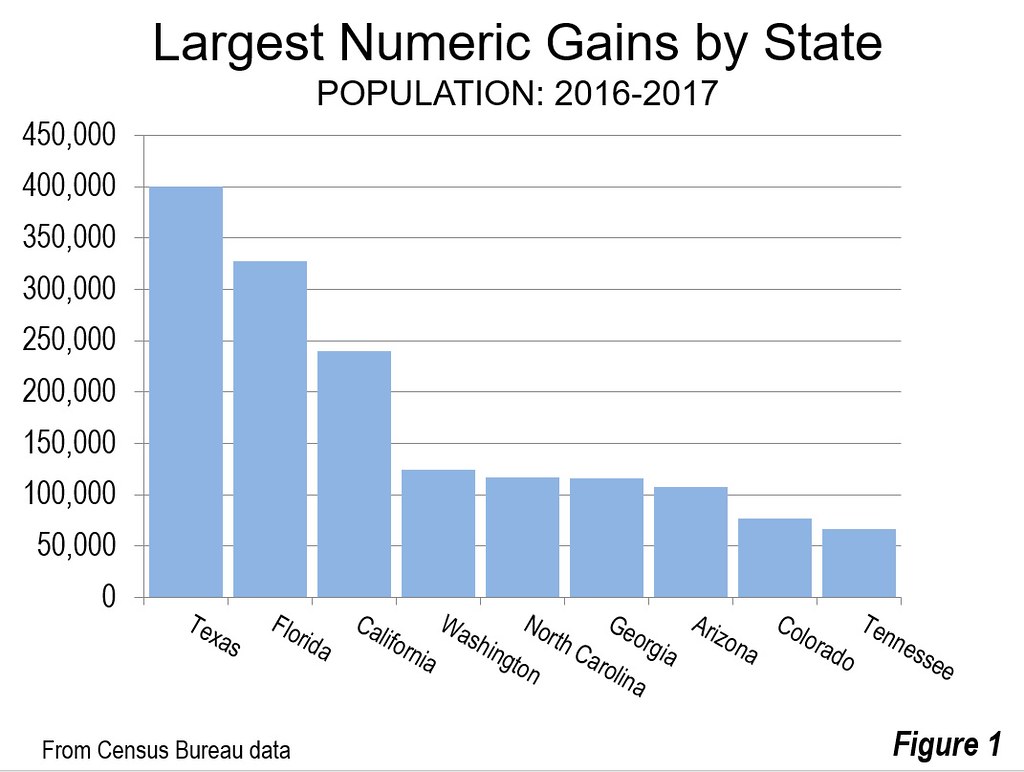
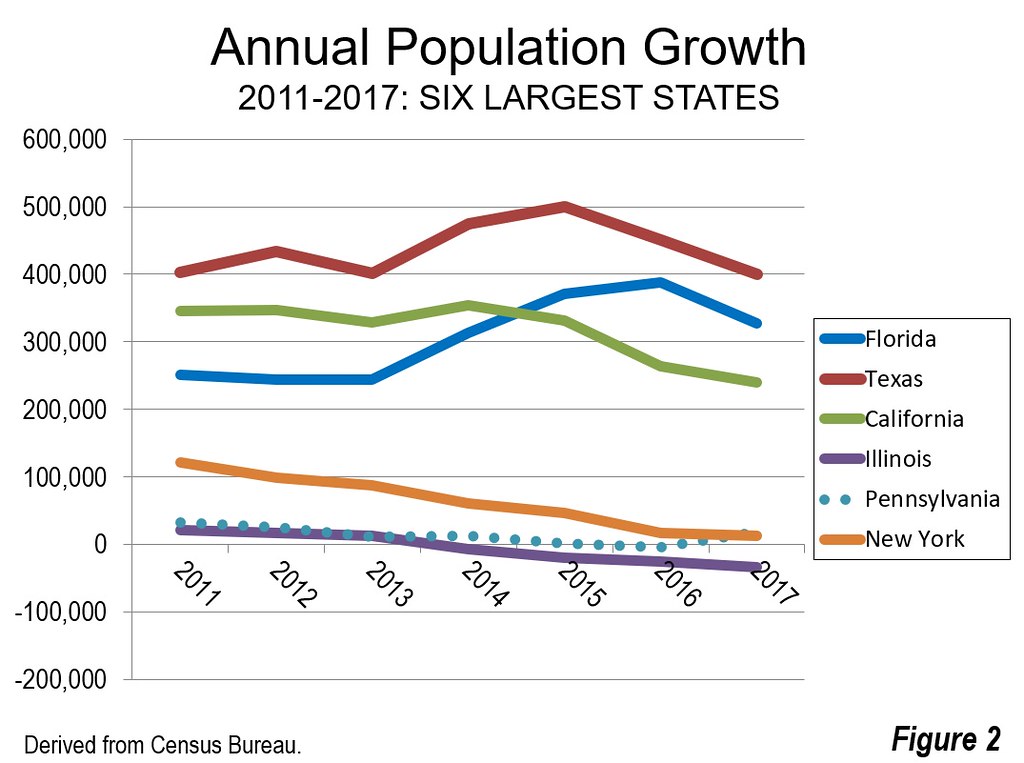
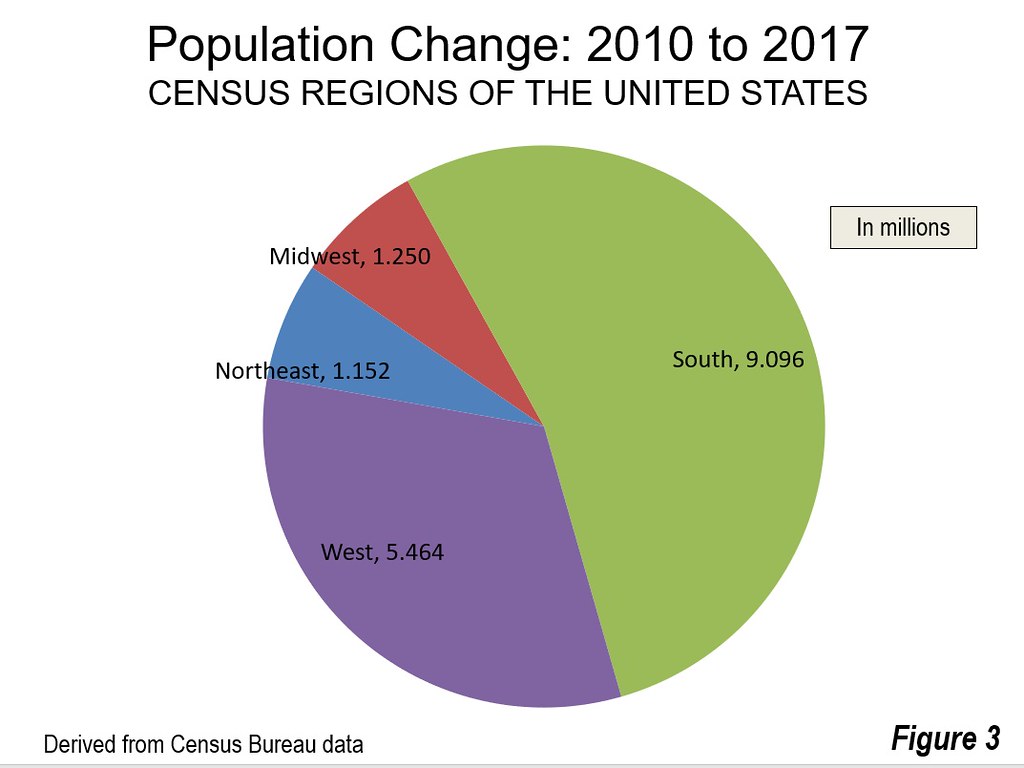
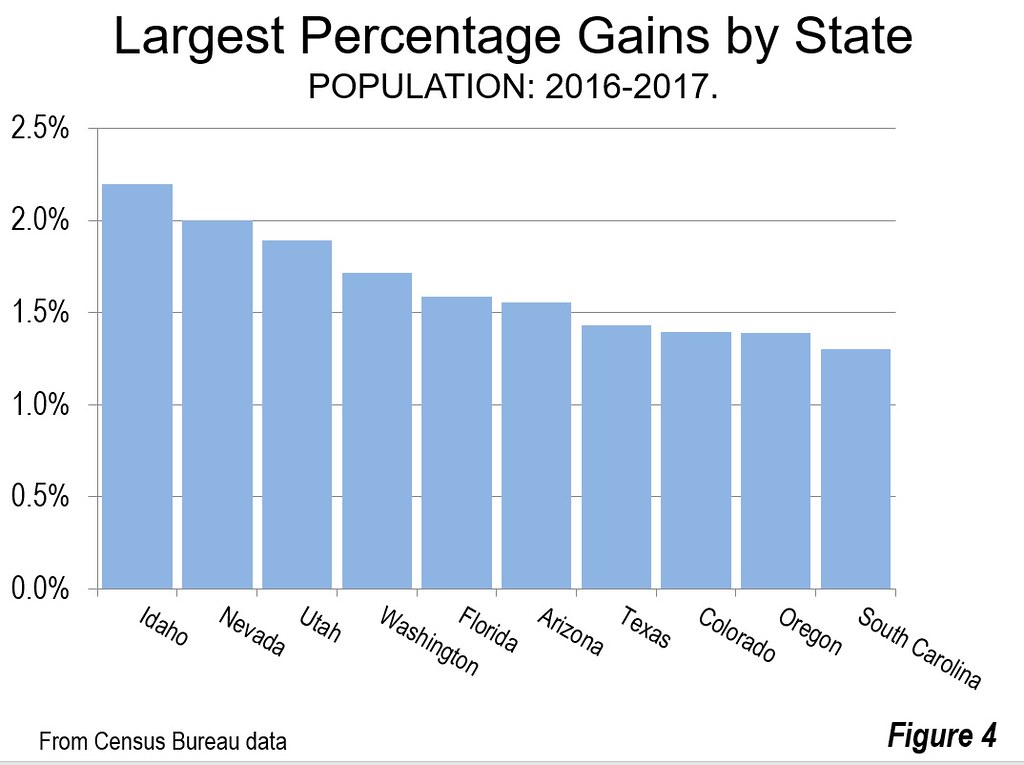
The most recent Bureau of Economic Analysis report also shows a shift away from blue states, notably California and New York. In the most recent quarter, BEA reports, Texas grew almost three times as fast as California and at five times the rate of New York. Meanwhile, Utah, Michigan, and Wisconsin also grew faster than California as did most states in the Southeast. Just last year, California’s estimated GDP growth was twice the national average and among the highest in the nation. Since that boomlet, the state’s job growth has plummeted, and its GDP growth now ranks just 35th in the country. Today, the country’s fastest-growing economies are in the South, not the West.

Could this all be Trump? Probably not, though the boost in energy and manufacturing investment may well be tied to the president’s policies. It’s hard to imagine these states would do as well if Hillary Clinton was ruling the roost. As for California, it appears that regulations have contributed to a massive spike in housing costs, one reason the Bay Area appears to be suffering negative job growth and why, notes a recent ULI report, 74 percent of all Bay Area millennials are looking for the exits (PDF).

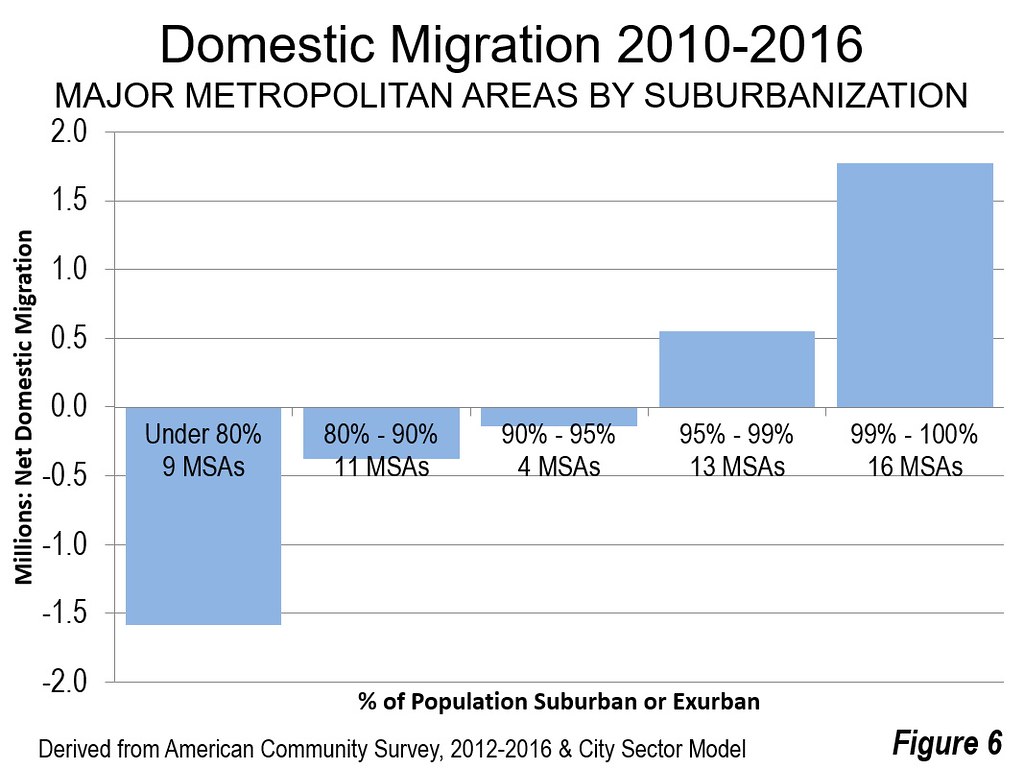
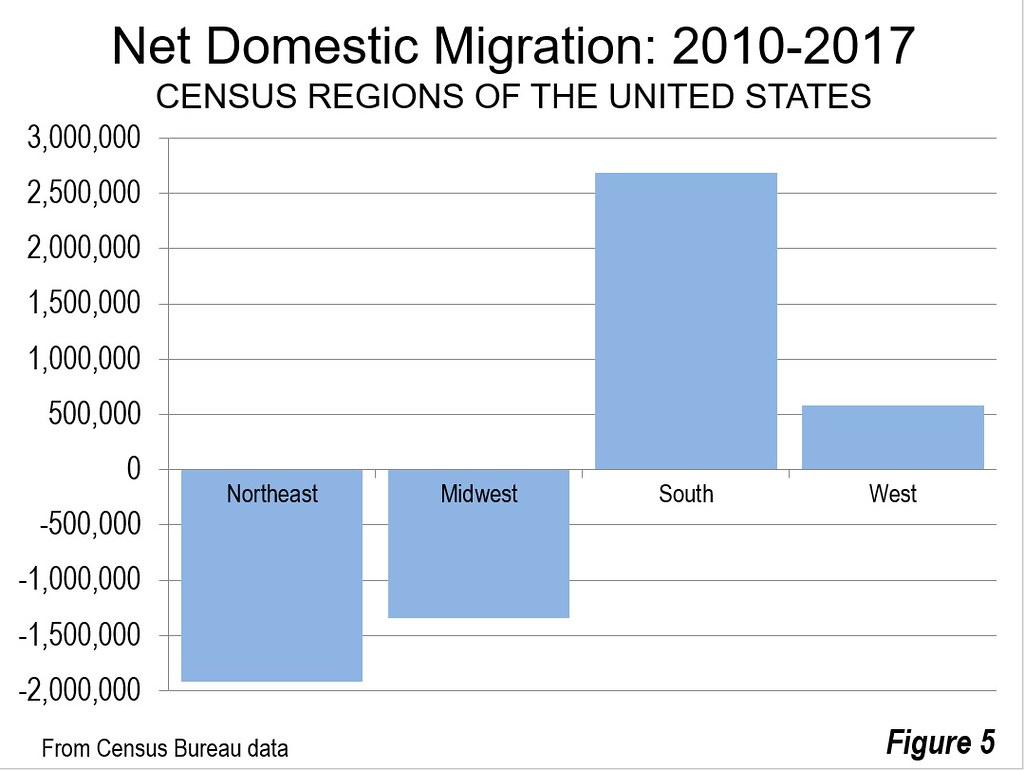
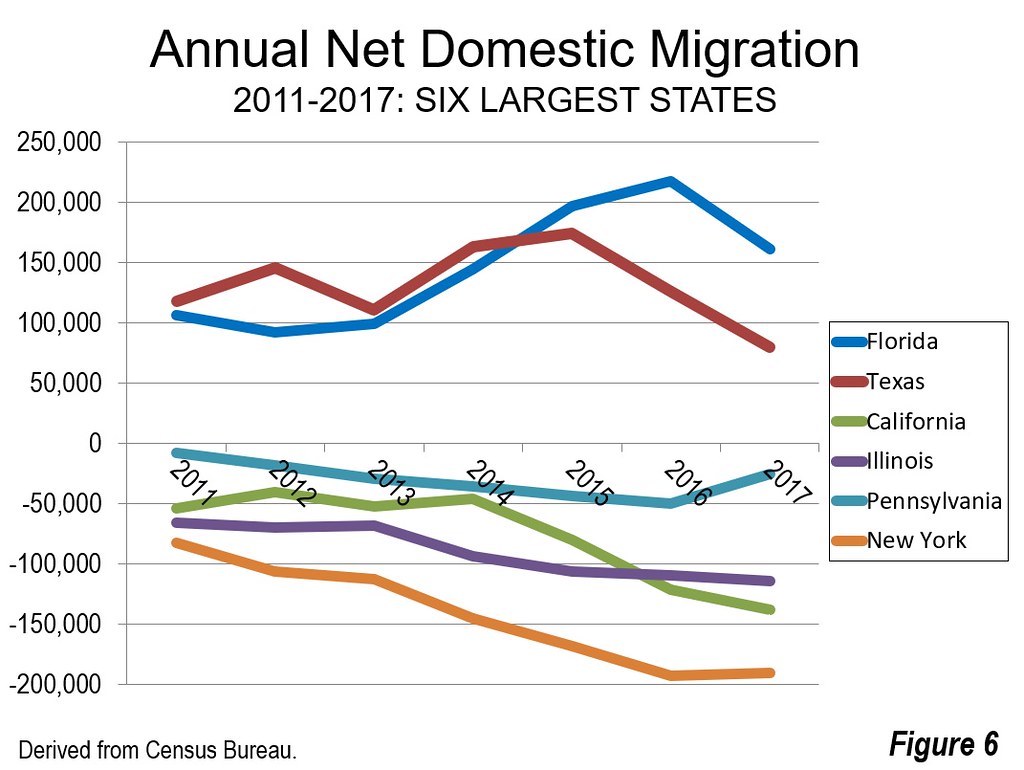
Given this trajectory the tax bill may be the final coup de grace for blue-state growth. One source of wealth creation in the Northeast, and on the West Coast, has been rapid appreciation in housing—costs have shot up more than 3.5 times as fast in coastal California than the national average, even after adjustment for incomes. It is the primary reason why California now has the highest poverty rate in the county, adjusted for housing costs. It’s also one reason why 5.6 million net domestic migrants have left the highest cost states for less expensive ones since 2000, according to annual Census estimates.

Things could soon get worse as the new cap on deductibility of state taxes and mortgages—non-factors for most red-state taxpayers and state budgets—is terrible news for high-tax and high-property value cities and states.

The Trump administration, like its predecessor, has decided that exploiting economic divides between our regions makes good politics. As the number of “blue dog” moderate Democrats in red states dwindles (down to three in the Senate) the blue states become ever more intolerant of even the most moderate Republicans. At least a modicum of political balance, so critical to our system of government, has been replaced by dramatic sectional polarization.

If the blue states hated Trump, the GOP and the heartland before, one must wonder what revenge they will inflict once they get back in power.

This constitutes something of an American tragedy. Our country’s great advantage has always been the complementary nature of its economy. New York, Los Angeles, and the Bay Area drive out ascendency in finance, media, entertainment, and technology. Texas gave us energy and leads in exports; Michigan provides world-class engineering and the Plains a cornucopia of everything from oil and gas to foodstuffs.

It really does not benefit anyone for red states to seek to inflict pain on New York or Los Angeles, any more than it makes sense for MSNBC host and Daily Beast columnist Joy Reid to call rural voters “the core threat to our democracy.”

These economies and geographies need each other. The heartland needs capital and markets. Overpriced, de-industrializing economies on the coast need outlets for their young people—and after tax reform maybe more of their parents—as they seek out an affordable future in the interior.

America’s diverse regions are critical to its ability to out-compete virtually all advanced economies. Great presidents, and effective political parties, recognize this reality. Franklin Roosevelt did not conduct the New Deal just to help New York; he brought jobs, money, and electricity to vast parts of the heartland, the South, and Appalachia. Ronald Reagan’s policies may have shocked New York glitterati, but won over its voters, and helped spark a financial boom that transformed Gotham into one of the great comeback stories of our era. Bill Clinton may have wowed the coastal crowd, but he never forgot where he was from, and created policies that sustained economic growth across much of the country.

This is the kind of leadership neither Donald Trump nor Barack Obama, each limited by their own prejudices and experiences, have provided us. Instead we oscillate between policies that help one part of the country, often at the cost of others. Only when national leadership recognizes the importance of all regions can our seemingly irreconcilable conflict be settled in a way that benefits our still magnificent, albeit sadly divided, republic.

This piece originally appeared on The Daily Beast.

Joel Kotkin is executive editor of NewGeography.com. He is the Roger Hobbs Distinguished Fellow in Urban Studies at Chapman University and executive director of the Houston-based Center for Opportunity Urbanism. His newest book is The Human City: Urbanism for the rest of us. He is also author of The New Class ConflictThe City: A Global History, and The Next Hundred Million: America in 2050. He lives in Orange County, CA.

Photo: Rmichaelrugg (Own work) [CC BY-SA 4.0], via Wikimedia Commons

In The New Year, Worry-Free California Has A Lot To Worry About

$
0
0

Propped up by media idolatry, California is moving from denial to delusion. Case in point: A recent AP story claimed that the state “flush with cash from an expanding economy” would consider spending an additional billion dollars on health care for the undocumented, as well as a raft of new subsidies for housing and the working poor.

All this wishful thinking and noble intentions ignores a slowing state economy, and a structural deficit, keyed largely to state worker pensions, that may now be headed towards a trillion dollars. Perhaps the widely celebrated, although poorly distributed “good times” of the past few years, have clouded Sacramento’s judgement.

Jerry Brown, repeatedly lionized in the national press, finally leaves office after next year, he will likely leave his successor both a totally out of control legislature and looming fiscal crisis. Brown’s replacement will also have to deal with a state that, according to the Social Science Research Council, suffers the greatest income inequality in the nation and the third worst economic environment for middle class families. Worse yet — upwards of one-third of the state population subsists near or in poverty.

Read the entire piece at The Orange County Register.

Joel Kotkin is executive editor of NewGeography.com. He is the Roger Hobbs Distinguished Fellow in Urban Studies at Chapman University and executive director of the Houston-based Center for Opportunity Urbanism. His newest book is The Human City: Urbanism for the rest of us. He is also author of The New Class ConflictThe City: A Global History, and The Next Hundred Million: America in 2050. He lives in Orange County, CA.

Photo: Daniel Schwen (Own work) [CC BY-SA 2.5], via Wikimedia Commons

California Lithium Battery Maker Heads to Appalachia

$
0
0

It is starting out to be a happy new year in Pikeville, Kentucky. Little in technology is more "cutting edge" today that lithium battery manufacturing. Elon Musk last year chose Nevada, not California for his mega plant a few years ago. Now, lithium battery manufacturer Ener Blu has announced plans to move, "lock stock and barrel" from Riverside-San Bernardino, east of Los Angeles, to Appalachian Kentucky, with its plant to be located in Pikeville, to be built on a what was a surface coal mine. Plans are to create 875 manufacturing jobs. Ener Blue also will move its headquarters in Lexington, Kentucky's second largest metropolitan area and the home of the University of Kentucky.

Pikeville: A Unique Move

This could be a very significant move. On the surface, it looks fundamentally different from the many corporate moves that have left high-cost California behind as companies seek the greener pastures of lower taxes, less regulation and lower costs of living (driven largely by better housing affordability) in their efforts to recruit talented staff. The most significant examples are Japanese car manufacturers that have moved their US headquarters to Dallas-Fort Worth and Nashville, which have become major metropolitan areas capable of competing for just about any company looking to move, not to mention households seeking better opportunities as well as urban amenities at an affordable price.

But Pikeville is no Dallas-Fort Worth or Nashville. It is not even a micropolitan area, much less a metropolitan area. The city (municipality) had a population of under 7,100 in 2016, up just 200 from the 2010 census. Pikeville is the county seat of Pike County, which has a population of 61,000, down from 65,000 in 2010.

Appalachian Poverty

Pike County is at the core of one of America's poorest regions, the Appalachians. Pike County's economy has long been dependent on coal and even before recent setbacks, Appalachian coal regions have had more than their share of poverty. The recent declines in coal employment have been legendary. Eastern Kentucky has been particularly hard hit. In the last six years, nearly 75 percent of its coal jobs have been lost.

The latest data from the Appalachian Commission shows Pike County to have a poverty rate of 22.9 percent, 48 percent above the national poverty rate. Its poverty rate is more than double the overall poverty rate for the entire Appalachian region, which stretches from Upstate New York to Mississippi. The median household income is approximately 40 percent below the national figure.

Appalachian Hope

But not all see Pikeville as a place without a future. This would include prolific demographer Lyman Stone, who wrote more than one year ago about the progress that has been made in Pikeville, even as the rural and coal economy surrounding it declines. Pikeville has been rejuvenated by the expansion of its small university, the University of Pikeville, which has more than doubled its enrollment over the past two decades. Stone anticipates continued growth.

Moreover, there is more good news for Eastern Kentucky than just Pikeville. Braidy Industries has embarked on a project to build the first new aluminum plant in the United States in 30 years in Greenup County, on the south bank of the Ohio River west of Huntington, West Virginia. After the plant opens there are plans for more than 500 full time employees.

The tendency over the past few decades has been for the US to shed its manufacturing functions to lower cost venues overseas. At the same time, many areas have been left behind. As the cost of living differences expand between the more expensive metropolitan areas and the rest of the United States, it may be that US corporate interests, and others, will identify opportunities for profitable operation, while at the same time rejuvenating places that have been left behind, like Pikeville and Greenup County.

Meanwhile, back in Pikeville, Kentucky Governor Matt Bevin, Congressman Hal Rogers and Pikeville state Senator Ray Jones II, were present for Ener Blu's Pikeville announcement. The Governor, according to U.S. News and World Report predicted that the company's arrival would transform an area where the coal jobs have disappeared. Congressman Rogers added "this is where we've got a lot of workers needing work that are ... capable, ready to go," An elated Mayor Jimmy Carter referred to the development as revolutionary "for the city of Pikeville and all of Eastern Kentucky,”

Jones, the Democratic Kentucky Senate minority leader, acknowledged partisan differences with Republican Governor Matt Bevin, but added that he has nothing but praise for the Governor's efforts to revitalize eastern Kentucky. He added that, first the Greenup County Braidy announcement and now Ener Blu are two of the most positive economic news in this state in many years.

The Beginning of a Trend?

The real question is whether Pikeville and Greenup County are just blips in the continuing decline of small town America. There are many more small towns that have been left behind in the changing economy. Indeed, there is a broad view that small towns have little or no future, the theme of a New Year's Day Wall Street Journal feature, "The Divide Between America's Prosperous Cities and Struggling Small Towns." Nobel Laureate Paul Krugman even wonders if there is a future for some major metropolitan areas, such as Rochester, New York.

Yet the developments in Eastern Kentucky suggest the potential for an alternate narrative. Greenup County could indicate a revived potential for traditional manufacturing even in the post-industrial age. Pikeville could indicate the potential for "cutting edge" technology to find a home in small towns. Many small towns may not die at all, as they are rejuvenated by public policies in places like California, where the cost of living and cost of doing business has increased by such a degree so that even the most advanced industries seek other venues.

Wendell Cox is principal of Demographia, an international public policy and demographics firm. He is a Senior Fellow of the Center for Opportunity Urbanism (US), Senior Fellow for Housing Affordability and Municipal Policy for the Frontier Centre for Public Policy (Canada), and a member of the Board of Advisors of the Center for Demographics and Policy at Chapman University (California). He is co-author of the "Demographia International Housing Affordability Survey" and author of "Demographia World Urban Areas" and "War on the Dream: How Anti-Sprawl Policy Threatens the Quality of Life." He was appointed to three terms on the Los Angeles County Transportation Commission, where he served with the leading city and county leadership as the only non-elected member. He served as a visiting professor at the Conservatoire National des Arts et Metiers, a national university in Paris.

Photo: Pikeville, Kentucky (aerial view)
https://upload.wikimedia.org/wikipedia/commons/8/82/Pikeville%2C_Kentuck...

Viewing all 3795 articles
Browse latest View live


Latest Images