Quantcast
Channel: Newgeography.com - Economic, demographic, and political commentary about places
Viewing all 3794 articles
Browse latest View live

Los Angeles Transit Ridership Losses Lead National Decline

$
0
0

In recent days, two well placed commentaries have detailed the recent declines both in US transit ridership, and in particular, Los Angeles, where the decline is most severe. The Cato Institute's Randal O'Toole provided a broad analysis of US transit ridership in The Wall Street Journal and explained how emerging trends may be seriously eroding transit ridership and rendering new urban rail systems even less effective than they have been in the past (see: It's the Last Stop on the Light-Rail Gravy Train). In a Los Angeles Times commentary, University of Southern California Professor James E. Moore and former top Los Angeles transit financial official Thomas A. Rubin described that area's stunning transit ridership losses (see: L.A.'s dwindling transit ridership isn't hard to fix: Make riding the bus cheaper and more convenient).

This article provides more details on the developing national transit ridership decline. Particular emphasis is placed on Los Angeles, which, although widely praised as “the next great transit city”, has sustained by far the greatest share of the loss.

Transit Ridership in Context

Transit ridership had reversed its nearly six decade trend from the middle 1990s to 2014, reaching a level of 10.8 million unlinked trips. An unlinked trip is a "boarding," which is when a passenger enters a transit vehicle. A simple trip from point A to B on transit may have a single boarding, such as when only one vehicle is used, or more. For example, a single transit trip in which three buses are used counts as a "boarding" or an "unlinked trip."

The all-time record had been set in 1946, when ridership reached double that level (23.5 billion) following World War II which sparked transit gain with gasoline and tire rationing. However, transit ridership has fallen each of the last three years. Federal Transit Administration data indicates that ridership for the year ended June 30, 2017 had fallen 4.7 percent, or nearly one-half billion annual rides.

The losses have been pervasive. Among the 41 urban areas with more than 1,000,000 residents, 35 experienced losses and six had gains.

Cities Losing the Most Riders

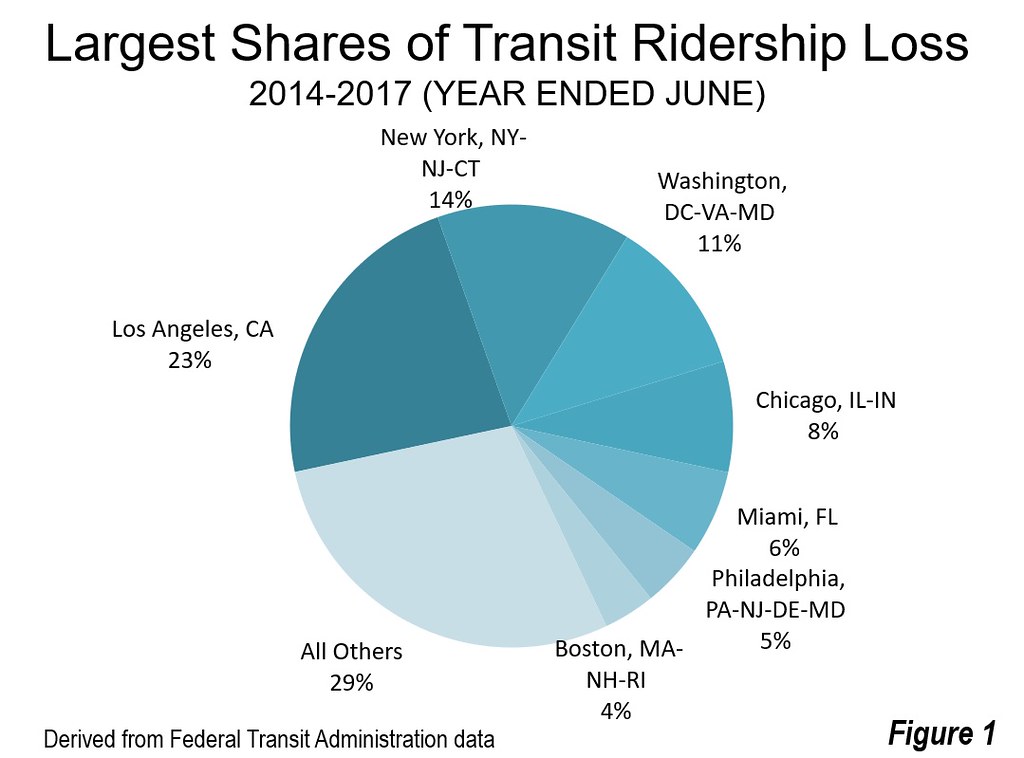
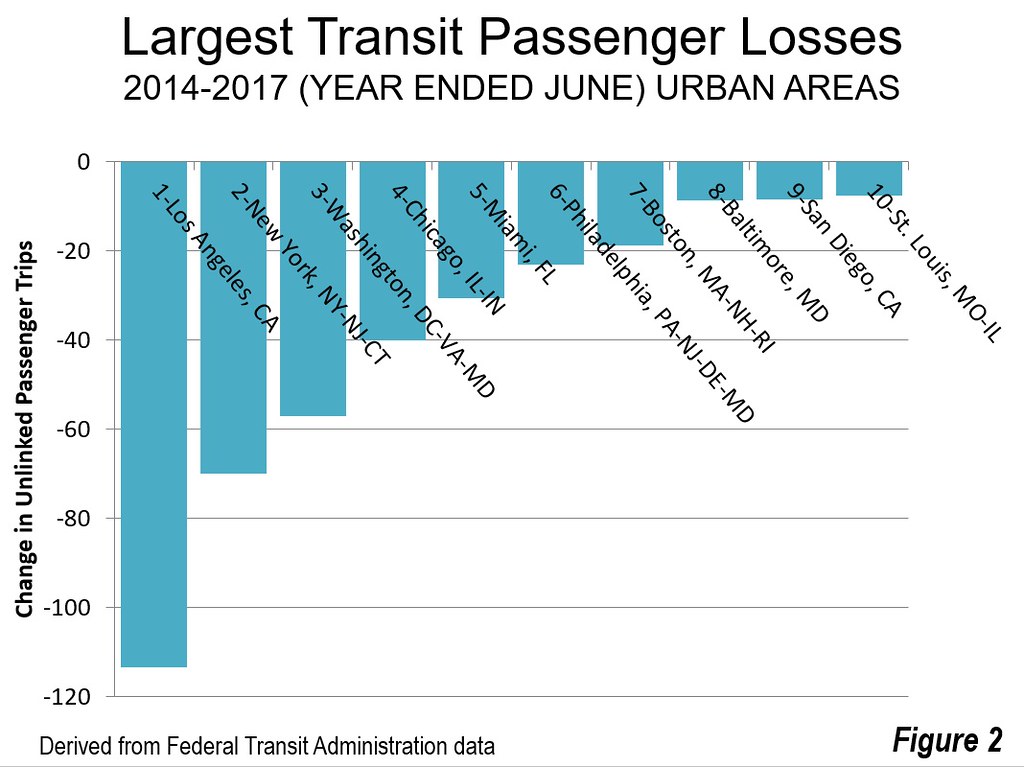
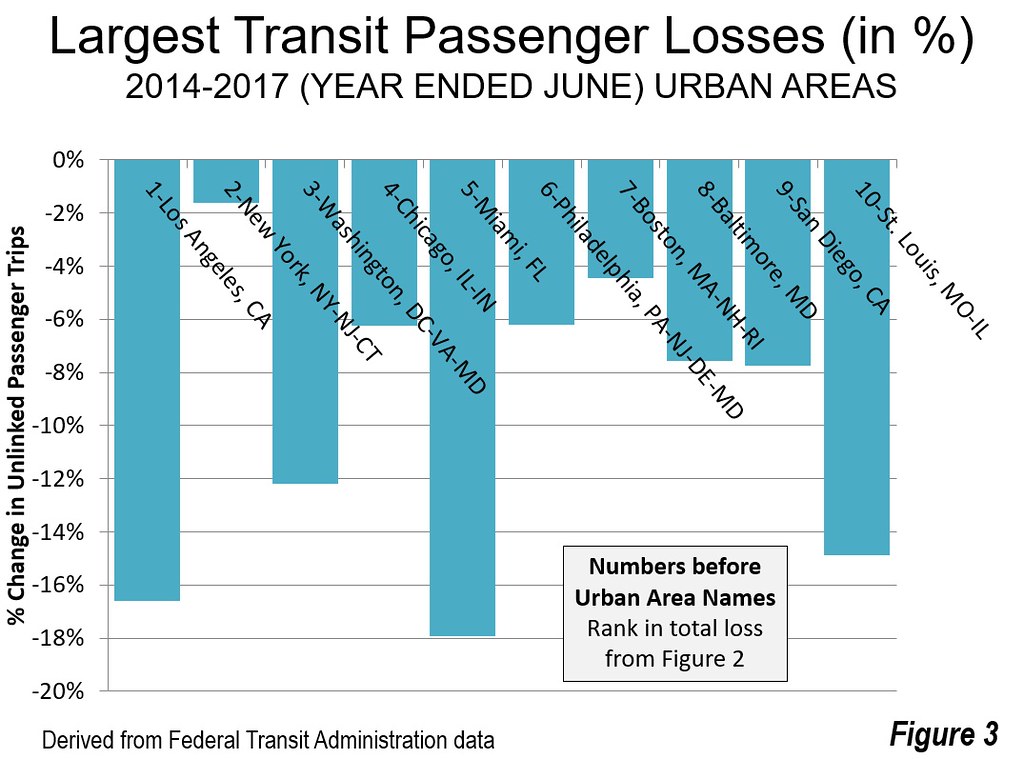
These significant losses were dominated by Los Angeles. Between 2014 and 2017, Los Angeles lost 113 million annual rides, 16.6 percent of its 2014 ridership. The Los Angeles ridership loss was hugely disproportionate to its share of national ridership. In 2014, Los Angeles carried 6.4 percent of the nation's unlinked trips. Yet since that time, Los Angeles has posted 22.9 percent of the ridership decline, 3.6 times its share of ridership.

Los Angeles lost more riders than were attracted by the whole transit systems of metropolitan areas such as Portland, Baltimore, Houston, Dallas-Fort Worth and Minneapolis-St. Paul. Only 10 urban areas had higher ridership in a year than the number of riders lost in Los Angeles. Indeed, Los Angeles fell to third in total ridership, with Chicago being restored to the second place, a position held by Los Angeles since the early 2000s.

Other urban areas also lost riders, although no other area contributed more to the transit loss than Los Angeles. New York saw 14 percent of the decline, or 70 million riders. But this ridership decline of 1.6 percent, represented only one-tenth the 16.6 percent of Los Angeles losses.

Washington, dealing with what appears to have been insufficient attention to safety and infrastructure issues on its Metro, lost nearly as many riders as New York, 57 million. This is a 12.2 percent decline. Washington's loss comprised 12 percent of the national total.

The other largest losers were Chicago (40 million, a loss of 6.3 percent), Miami (30 million, a loss of 17.9 percent), Philadelphia (23 million, a loss of 6.2 percent) and Boston (19 million, a loss of 4.5 percent). Combined, these cities represented 23 percent of the total national loss. Approximately 21 percent of the loss was in the urban areas other than the eight identified above (Figure 1).

The largest ridership losses are shown in Figure 2. Figure 3 converts these 10 largest losses to percentages. It is notable that each of the losses was more than 6 percent over the year, with the exception of Boston and New York, with by far the smallest loss.

Transit in Los Angeles: Where Rail, Not Riders Drive Policy

I personally played an role in establishing the Los Angeles rail system during my time on the Los Angeles County Transportation Commission (see Los Angeles: Rail for Others). Since that time, a rail system of 6 radial routes (from downtown), one cross-town route (along the I-105 Freeway) and two exclusive busways have been opened. No larger US population center outside New York has seen such an improvement in high capacity transit. I and the others on LACTC expected that this system would substantially increase not only transit's ridership but also its market share in Los Angeles. Yet, as Moore and Rubin put it:

"Metro’s current “annual boardings” — just under 400 million — represent a drop of almost 20% from the system’s 1985 peak, even though the county’s population has increased by nearly a fifth since then." Further, all of this has cost more than $15 billion (inflation adjusted).

Astoundingly, this abject policy failure has gone largely unnoticed in the media and, according to Moore and Rubin, at least $500 billion that could have been spent to lower fares and improve bus service has gone instead to expanding a rail. The system’s ineffectiveness can be measured in passengers lost per million dollars of expenditure.

Moore and Rubin remind readers that the low-fare program of 1982-1985 resulted in a 40 percent ridership increase, perhaps the most significant gain in modern US transit history. Moore and Rubin further show that after a federal court agreed with plaintiffs that Metro was expanding the rail system at the expense of the bus system, a 10-year agreement produced a ridership increase of 36 percent.

Transit is About People, not Trains

In its quest to become "the next great mass-transit city," Los Angeles has headed off toward a "dead end." A great mass-transit city does not become so because of its trains (or buses) --- that requires riders. In Los Angeles, riders are increasingly in short supply.

In the final analysis, transit is justified by the extent to which it provides mobility to people, especially to those with insufficient resources to provide their own mobility throughout the metropolitan area. The key to transit is growing ridership and putting riders first (see: The Great Train Robbery).

Wendell Cox is principal of Demographia, an international public policy and demographics firm. He is a Senior Fellow of the Center for Opportunity Urbanism (US), Senior Fellow for Housing Affordability and Municipal Policy for the Frontier Centre for Public Policy (Canada), and a member of the Board of Advisors of the Center for Demographics and Policy at Chapman University (California). He is co-author of the "Demographia International Housing Affordability Survey" and author of "Demographia World Urban Areas" and "War on the Dream: How Anti-Sprawl Policy Threatens the Quality of Life." He was appointed to three terms on the Los Angeles County Transportation Commission, where he served with the leading city and county leadership as the only non-elected member. He served as a visiting professor at the Conservatoire National des Arts et Metiers, a national university in Paris.

Photograph: Los Angeles Metro Rail route map.
https://upload.wikimedia.org/wikipedia/commons/f/fd/Los_Angeles_County_M...


Notes from the Wharton Africa Business Forum

$
0
0

The Wharton Africa Business Forum took place in Philadelphia on November 3-5, 2017. Present were the Finance Minister of Nigeria, the CEO of Ethiopian Airlines and other business leaders (notably from lead sponsors McKinsey & Company and the Boston Consulting Group) and educators. The event was attended by hundreds of participants including Wharton faculty, students and alumni, African investors and entrepreneurs, members of the African diaspora and many others who have an interest in Africa.

These are our notes from the event. They are not intended to be comprehensive.

First, there was a tremendous amount of energy and optimism surrounding Africa developments. There were a palpable sense that Africa’s moment is coming and an urgency that it should not be squandered. These sentiments are validated by our analysis of African demographics that show a coming decline in the dependency ratio and an accompanying increase in the odds of realizing somedemographic dividend. However, fertility rates remain too elevated and are not falling fast enough to deliver the massive dividend that was seen in China, the US and Europe in recent decades.

Second, and very close on the heels of this optimism, there was a clear-eyed realization that nothing is guaranteed and everything remains to be done. It was said that “the 21st century will be the century of Africa”, with emphasis on this being a double-edged sword, meaning that it could be a century of growth and prosperity driven in large part by African demographics, or a century of spiraling calamity if reforms fail to come through as needed. Again, this is supported by our view that education, infrastructure and the fight against corruption all need to make a quantum leap before the African economy can surge forward in a sustained fashion. In our view, the first links in this chain reaction have to be a big improvement in female literacy and a closing of the gender gap. As shown in the graph, fertility falls quickly when literacy rises over 80%.

Third, there was more attention paid to bottom-up developments: exciting new startups across the entire continent, pro-active NGOs and angel investors assisting local projects etc. And there was less discussion of the need to build the adequate large-scale architecture to facilitate and accelerate the work of entrepreneurs and investors. This architecture, the superstructure of the economy, is a top-down effort where populyst has claimed an active role: to assist in the building of robust institutions to improve governance, education and infrastructure and to lower corruption. More on this in coming weeks.

Other quotes or ideas heard at the conference, in random order:

Africa’s “high five” priorities are 1) Feed Africa (food self-sufficiency), 2) Light up Africa (boost the electricity supply), 3) Industrialize Africa, 4) Integrate Africa (encourage intra-Africa trade, tourism etc.), 5) Educate Africa.

Nigeria wants to diversify its economy away from oil. But it still needs oil revenues to effect this diversification. “We need oil to get out of oil.”

“What is different this time: the younger generation have different values. They have a deeper sense of equity.”

“African health priorities have shifted from communicable diseases (HIV, malaria, yellow fever, tuberculosis etc.) to non-communicable (cancer, diabetes, cardiovascular disease, mental disease).”

“Africa is not poor; it is poorly managed.”

“The 21st century is the African century.”

This piece originally appeared on Populyst.net

Sami Karam is the founder and editor of populyst.net and the creator of the populyst index™. populyst is about innovation, demography and society. Before populyst, he was the founder and manager of the Seven Global funds and a fund manager at leading asset managers in Boston and New York. In addition to a finance MBA from the Wharton School, he holds a Master's in Civil Engineering from Cornell and a Bachelor of Architecture from UT Austin.

Photo: Africanmodern (Own work) [CC BY-SA 4.0], via Wikimedia Commons

Orange County’s Low Hanging Fruit

$
0
0

There are things that we can do as a society to work through our big structural difficulties at an institutional level. And there are other things that can be done independently at the household level by individuals. I don’t have the technical skills, political skills, social skills, credentials, patience, or desire to engage the large scale systems. To be honest, I don’t think most people do. But there are all sorts of things that ordinary people can and should do on their own that can make a huge difference on the ground at room temperature. Collectively all our separate choices create the world we inhabit.

On a recent trip to Orange County in southern California I explored the suburban landscape and started to pick apart the typical arrangements as well as some surprising alternatives which demonstrate divergent trajectories. The quiet cul-de-sacs of 1950s homes have been remodeled, expanded, and optimized for different functions over the decades. Low maintenance ornamental landscapes, artificial turf, decorative pavement, and rock gardens abound.

Many homes have received multiple layers of appliqué brick and stone veneer, little cupolas, Iberian and Asian make-overs, and Greco-Roman columns. The pattern is clear. People go out in the world, earn a cash income, then spend a lot of money on beautification projects to reflect an aspirational status.

At the opposite end of the spectrum there’s a tremendous social stigma associated with a dead lawn. It’s a sign of poverty, laziness, a lack of pride, and an act of aggression toward the neighbors. In a location where it doesn’t rain for months or years at a time keeping a lush Kentucky lawn is a challenge. But heavily irrigated and chemically induced turf is also stigmatized as being inappropriate for the local climate, wasteful, expensive, and borderline toxic. A delicate balance of social and economic forces are at play. It’s really all about conforming to a generally agreed upon cultural look and feel.

Hardscaping in a hot climate results in a heat island effect. All day long the sun beats down on the concrete, brick, and stone which soaks up the heat. That heat is then radiated back all night long when the temperature should be dropping instead. When enough of the territory is paved over like this one lot at a time the entire county heats up.

Dark colored roofs – particularly tar and asphalt shingles – also absorb and hold heat. These roofs are disposable and only last for a couple of decades before they need to be peeled off and replaced. Property owners don’t seem to understand that a roof is first and foremost a functional element and not something to be picked out like wallpaper based on fashion. Something as simple as a light colored roof made of a reflective material makes a huge difference in thermal performance inside a building.

Here are classic cases of homes fitted with photovoltaic panels to offset electricity coming from the grid, presumably to help run air conditioning compressors. But the same amount of money could have been spent on a light colored roof that bounces heat away, or extra insulation, or better quality replacement windows, or a reduction in the concrete around the house, or some strategically placed exterior shade structures. At that point the extra “green” power would no longer be needed since the house would have remained considerably cooler passively. I’m in no way opposed to solar power. I just think there’s more low hanging fruit to pluck first. Reduce demand by 90%, then install a few panels to supply the little bit of power that’s still needed.

This house has a standing seam metal roof that reflects the heat away. There are also ventilators that passively draw heat out of the attic. A metal roof has the advantage of lasting a century or more, is fire resistant, and is the perfect surface for collecting rain water. A white pebbled roof also gets the job done in a hot dry climate. So does a white elastomeric material. Is this house any more or less attractive than the others in the area? Meh.

The need to accommodate multiple vehicles per home is apparently universal among the affluent and working class alike. Driving is an essential requirement in suburbia. Therefore the bulk of many front yards are parking lots. Some are just more attractive than others. What I see in each example is a huge amount of money (almost all of it borrowed and repaid with interest) being spent on cars as well as the driveways and extended garages to accommodate them. Four or five cars per household appears to be the norm. On average each car costs $10,000 per year. That’s a $40,000 – $50,000 household expenditure just to get from Point A to Point B. Ouch.

I lived in Orange County when I was a kid and remember the last of the actual orange groves before they made way for supermarkets, tract homes, office complexes, and auto dealerships. The land underneath is still rich agricultural soil and the climate supports a wide range of year round crops. There’s generally enough winter rain and mountain run off in spring to maintain the aquifer.

I met with a young woman who spent the last three years transforming the yard of her rented home into a permaculture style food forest. She said her dream is to be a farmer and own land someday. This garden uses half the water compared to the old lawn it replaced. A deep mulch retains moisture and the dense collection of ground covers, vines, shrubs, and fruit trees keeps the soil shaded and cool.

Everywhere you look there’s food. She’s taken the same space that might have been a driveway, a rock garden, or a plastic lawn and transformed it into a small farm that provides her family with nearly all its fresh produce. The garden is cool and tranquil. The vines and trees help shade the house on hot days. It’s wonderful and incredibly productive.

A few blocks away another woman gave me a tour of her garden burdened with fruit of every variety. The house was quite modest and the yard wasn’t all that large. But she cultivated every inch of it to great effect.

The suburbs are a permanent fixture in the landscape that aren’t going to change much in most places. There’s infill development here and there in the places with enough money, geographic constraints, and market demand to support intensification. The congealing clumps of apartment buildings and office blocks are usually concentrated along the eight lane arterial roads and always include five stories of structured parking. There’s some half assed public transit smeared around that tends to be really expensive to maintain yet doesn’t actually do a great job in the ‘burbs. And there’s an army of expert consultants and engineers who are busy securing grants to build ever more complex and expensive infrastructure projects to keep it all functional. It ain’t Paris folks. It’s always going to be kind of shitty. I can’t help but think the world’s problems can be solved in a garden organized by the ladies.

This piece first appeared on Granola Shotgun.

John Sanphillippo lives in San Francisco and blogs about urbanism, adaptation, and resilience at granolashotgun.com. He's a member of the Congress for New Urbanism, films videos for faircompanies.com, and is a regular contributor to Strongtowns.org. He earns his living by buying, renovating, and renting undervalued properties in places that have good long term prospects. He is a graduate of Rutgers University.

The Future of America’s Suburbs Looks Infinite

$
0
0

Just a decade ago, in the midst of the financial crisis, suburbia’s future seemed perilous, with experts claiming that many suburban tracks were about to become “the next slums.” The head of the Department of Housing and Urban Development proclaimed that “sprawl” was now doomed, and people were “headed back to the city.”

This story reflected strong revivals of many core cities, and deep-seated pain in many suburban markets. Yet today, less than a decade later, as we argue in the new book that we co-edited, “Infinite Suburbia,” the periphery remains the dominant, and fastest growing, part of the American landscape.

This is not just occurring in the United States. In many other countries, as NYU’s Solly Angel has pointed out, growth inevitably means “spreading out” toward the periphery, with lower densities, where housing is often cheaper, and, in many cases, families find a better option than those presented by even the most dynamic core cities.

Reality check: What the numbers say

Less than a decade since the housing crisis, notes demographer Wendell Cox, barely 1.3 percent of metropolitan regions live in the urban cores we associate with places like New York City, Boston, Washington or San Francisco.

Counting the inner ring communities built largely before 1950, the urban total rises to some 15 percent, leaving the vast majority of the population out in the periphery. More important still, the suburban areas have continued to grow faster than the more inner-city areas. Since 2010, the urban core has accounted for .8 percent of all population growth and the entire inner ring roughly 10 percent; all other growth has occurred in suburban and exurban areas.

Much of this has been driven by migration patterns. In 2016, core counties lost roughly over 300,000 net domestic migrants while outlying areas gained roughly 250,000. Increasingly, millennials seek out single-family homes; rather than the predicted glut of such homes, there’s a severe shortage. Geographer Ali Modarres notes that minorities, the primary drivers of American population growth in the new century, now live in suburbs. The immigrant-rich San Gabriel Valley, the Inland Empire, Orange County and their analogues elsewhere, Modarres suggests, now represents “the quintessential urban form” for the 21st century.

Read the entire piece at The Orange County Register.

Joel Kotkin is executive editor of NewGeography.com. He is the Roger Hobbs Distinguished Fellow in Urban Studies at Chapman University and executive director of the Houston-based Center for Opportunity Urbanism. His newest book is The Human City: Urbanism for the rest of us. He is also author of The New Class ConflictThe City: A Global History, and The Next Hundred Million: America in 2050. He lives in Orange County, CA.

Alan Berger is Professor of Landscape Architecture and Urban Design at Massachusetts Institute of Technology where he teaches courses open to the entire student body. He is founding director of P-REX lab, at MIT, a research lab focused on environmental problems caused by urbanization, including the design, remediation, and reuse of waste landscapes worldwide. He is also Co-Director of Norman B. Leventhal Center for Advanced Urbanism at MIT (LCAU).

Photo: Laurie Avocado, via Flickr, using CC License.

Nobody Knows Nothing in Corporate America

$
0
0

If you want to understand why a lot of America’s youth embrace socialism today, just look at this small but revealing story about General Electric. Former CEO Jeff Immelt apparently didn’t just fly around the world in a corporate jet, a fairly standard practice, he had an empty spare corporate jet follow him around just in case anything happened to the jet he was actually using.

Now that the news has come out, supposedly the board wasn’t informed about this, and even Immelt himself says he didn’t know. How convenient. The plane had a bogus passenger manifest designed to make it look occupied, and everyone was instructed to keep it hush, hush.

Immelt was flying around like this with the shareholders’ money, not his own. GE under-performed during his tenure, but Immelt’s pay and perks sure didn’t underperform.

Will anything bad happen to anybody as a result of this stupendous waste of shareholder money? Not likely, unless some junior people need to be offered up as scapegoats.

Is it any wonder more and more people are less than impressed with today’s corporations?

This piece originally appeared on Urbanophile.

Aaron M. Renn is a senior fellow at the Manhattan Institute, a contributing editor of City Journal, and an economic development columnist for Governing magazine. He focuses on ways to help America’s cities thrive in an ever more complex, competitive, globalized, and diverse twenty-first century. During Renn’s 15-year career in management and technology consulting, he was a partner at Accenture and held several technology strategy roles and directed multimillion-dollar global technology implementations. He has contributed to The Guardian, Forbes.com, and numerous other publications. Renn holds a B.S. from Indiana University, where he coauthored an early social-networking platform in 1991.

Photo: JD Lascia, via Flickr, using CC License.

Severely Unaffordable Housing and Traffic Driving Households from Sydney

$
0
0

Recent stories have detailed the strong net domestic migration out of Sydney, Australia's largest city (metropolitan area). A well covered report by economist Callam Pickering has noted strong interest by STEM workers (science, technology, engineering and mathematics) workers in leaving the area (see here and here). Pickering cites high housing costs as a cause, while social researcher Mark McCrindle agrees and notes that "Sydney has the longest capital city commuting times in Australia." Both are right. Sydney has the second worst housing affordability among the 92 major metropolitan areas in nine nations covered by the 13th Annual Demographia International Housing Affordability Survey. Only Hong Kong has housing affordability more severe. Moreover, Sydney's traffic congestion is so bad that its average work trip commuting time is greater than that of traffic clogged Los Angeles, as well as 51 of the other 52 metropolitan areas over 1,000,000 population in the United States.

The out-migration from Sydney is not new, having led Australia in that category for at least a decade. This article examines net domestic migration over the past 10 years in Australia.

Net Domestic Migration among the States and Territories

As goes Sydney, so goes New South Wales. New South Wales experienced by far the greatest net loss, at 146,000, according to the annual reports of the Australian Bureau of Statistics from 2006-2007 to 2016-2016. However, outside Sydney, New South Wales experienced a net domestic migration gain of 54,000, which was widely distributed beyond Sydney (Greater Capital City Statistical Area, or GCCSA), including just west of the Blue Mountains and along the Pacific Coast (Figure 1).

Queensland continues to see the largest net domestic migration gain among the states and territories of Australia. Over the past ten years, 114,000 more people have moved to Queensland than from other parts of the country. This has been driven by the two large resort and retirement centers of the Gold Coast and Sunshine Coast as well as Brisbane, Australia's third largest metropolitan area. Outside these three areas, the state gained 13,000 net domestic migrants.

Victoria, the second largest state in population is also the second largest attractor of net domestic migration. Victoria gained 47,000 net domestic migrants over the last ten years. Nearly all of the net domestic migration gains have been to areas outside Melbourne, the nation's second largest metropolitan area. Other areas of the state of Victoria, such as Geelong, Ballarat, and Bendigo, had strong gains, and all were greater than that of much larger Melbourne, both in actual numbers and population relative terms.

Western Australia gained 36,000 net domestic migrants, all of which and more went to the Perth metropolitan area. Net domestic migration outside Perth was a minus 6,000. The Australian Capital Territory, home of the commonwealth (federal) capital of Canberra gained 2,000 net domestic migrants.

The other states and territories lost net domestic migrants. Tasmania, the island state, lost 4,000 net domestic migrants, while the state capital, Hobart gained 1,000. The Northern Territory lost 12,000 net domestic migrants, 11,000 of which were outside the capital, Darwin. South Australia lost 37,000 net domestic migrants, with 36,000 of the loss occurring in the capital, Adelaide.

Large Metropolitan Areas and Local Domestic Migration

Australia has long been dominated by its few (five) large capital city metropolitan areas, Sydney, Melbourne, Brisbane, Perth and Adelaide. These are the only metropolitan areas with more than one million residents. Yet, trends over the past decade have indicated a flow of domestic migrants (residents who move from one area within the nation to another) to outside the large capital cities. Totaling up annual reports of the Australian Bureau of Statistics, the national statistical agency shows that 163,000 residents moved away from the larger cities to other parts of the country between 2006-2007 and 2015-16.

The Large Capital Cities

Net domestic migration losses have been dominated by a large outflow from Sydney. Sydney's loss of 200,000 net domestic migrants is equal to 4.1 percent of the Sydney GCCSA population according to the 2016 census (4.8 million). Adelaide, capital of South Australia, lost 36,000 residents to other areas. This is not as high a percentage as in Sydney, at 2.8 percent of Adelaide's 2016 GCCSA population (1.3 million). Melbourne, the capital of Victoria, which is nearly as large as Sydney (4.5 million), gained a nominal 3,000 net domestic migrants.

Two of the large capital cities gained. Perth, the capital of Western Australia, added the most net domestic migrants, with a 42,000 gain. This was 2.2 percent of its 2016 Perth's GCCSA population (1.9 million). Brisbane, capital of Queensland, added 28,000 residents, or 1.1 percent of its 2016 GCCSA population (2.4 million).

The Rest of Australia

Altogether, the two large, principally retirement areas garnered nearly one-half of the domestic migrants lost by the large capital cities.

The Gold Coast, just south of Brisbane (80 kilometers or 50 miles) had the largest net domestic migration gain in the nation, at 45,000. This is equal to 6.8 percent of the population recorded in 2016. The Gold Coast is largely in Queensland, but a part, Tweed Heads, is located just across the state border in New South Wales.

The Sunshine Coast, which is 65 miles (105 kilometers) north of Brisbane, gained 38,000 net domestic migrants. This is equal to 13.3 percent of the 2016 population, and the largest net domestic migration percentage gain among the largest metropolitan areas.

Outside of these areas, the rest of Australia gained 79,000 net domestic migrants (Figure 2).

The Future?

The domestic migration patterns, however, do not indicate a mass migration to the outback across the whole of the nation. Outside the capital cities, there is substantial domestic out-migration from Western Australia, Tasmania and the Northern Territory. Yet, there is strong domestic migration outside the capital cities of Queensland, Victoria, and New South Wales. The large capital city migration losses are in just two of the largest capital cities, Adelaide, and Sydney, the largest and dominant exporter of people.

Meanwhile, The Daily Telegraph reports a poll showing that one-in-three Sydneysiders is considering leaving in the next five years. This includes more than one-half of renters, who have found moving up to home ownership especially difficult due to Sydney's severely unaffordable housing. It also includes more than one-half of 18 to 25 year olds. This is not terribly surprising. Stuck in traffic, or on crowded rail trips to the central business districts (CBDs), there is plenty of time to contemplate a better life with less expensive housing that an increasingly digital age is likely to make available.

Wendell Cox is principal of Demographia, an international public policy and demographics firm. He is a Senior Fellow of the Center for Opportunity Urbanism (US), Senior Fellow for Housing Affordability and Municipal Policy for the Frontier Centre for Public Policy (Canada), and a member of the Board of Advisors of the Center for Demographics and Policy at Chapman University (California). He is co-author of the "Demographia International Housing Affordability Survey" and author of "Demographia World Urban Areas" and "War on the Dream: How Anti-Sprawl Policy Threatens the Quality of Life." He was appointed to three terms on the Los Angeles County Transportation Commission, where he served with the leading city and county leadership as the only non-elected member. He served as a visiting professor at the Conservatoire National des Arts et Metiers, a national university in Paris.

Photograph: Surfer's Paradise (Gold Coast), Queensland by author.

1 In 5 L.A. Community College Students Have Experienced Homelessness

$
0
0

One would not usually associate homelessness with college students but in the Los Angeles Community College District (LACCD) about one in every five students has experienced homelessness, according to the LACCD Report on Survey of Student Basic Needs.

The Los Angeles Community College District is the nation’s largest community college district, serving 250,000 students every year at its nine colleges in Los Angeles County.

The core of the problem in Los Angeles is unaffordability. Los Angeles has the least affordable rental market in the country, based on the portion of renters’ income that goes toward paying rent.

Homelessness

According to the LACCD Report, 19 percent of students in the LA college district experienced homelessness in 2016. Eight percent were thrown out of their houses, four percent were forcefully evicted, and six percent were reported to have lived in abandoned buildings, cars or other unsuitable housing structures.

As stated in the report, “Homeless indicates that a person is without a place to live, often residing in a shelter, automobile, an abandoned building, or outside.” Students are considered homeless if they answered yes to at least one of the following six items in the figure below.

Food Insecurity

The survey also found that 59% of the interviewed students answered affirmatively to the statement, “The food I bought just didn’t last and I didn’t have enough money to get more,” as shown in the figure below. This is a very bothersome scenario which impacts the quality of learning in the District’s higher education sector.

A survey from March 2017 found that one third of community college students (from a sample of more than 33,000 students at 70 community colleges in 24 states) go hungry. Sara Goldrick-Rob, who led the research team said, “Not only did we find challenges of food insecurity and housing insecurity at the less expensive community colleges, we found it at more expensive colleges. We found it at urban schools and rural schools. It’s all over the place.” The study’s researchers advise colleges to partner with local homeless shelter and food banks to better address students’ needs.

Recommendations

To better understand this problem, we have to look at the origin and larger trends. Several regions are facing the same situation where affordable housing becomes out of reach for the poor and even middle-income families. According to the 2015 Community Learning Partnership (CLP) report, housing inflation and gentrification were found as part of the problem that has led to the student housing crisis and increase in homelessness.

This becomes an even more disturbing trend when the figures keep rising:

Studies show that one major reason for the high dropout rate in community colleges is the shortage of affordable housing for students. In 2014, over 56,000 U.S. college students were classified as "homeless" and this number counts only those students who are registered in homeless shelters or identify themselves as homeless. This figure has increased 75% over the last three years. It is part of a larger picture: there currently are 1.3 million homeless young people in the U.S. This is double the figure for 2008.”

CLP, together with CD Tech, a partner community-based nonprofit organization with 20-years of housing issues experience, are seeking solutions for the student housing crisis in the LA community college district.

Efforts have been made to provide affordable housing units through strategies like Measure H to fight homelessness in LA County. LACCD’s Financial Aid Plan proposes to offer waivers, grants and other forms of support to needy students. However, the details of these projects have not been established yet.

Campus food pantries are “an idea whose time has come,” the executive director of the Orange County Food Bank Mark Lowry said in a recent interview, as more universities in the Cal State system are adding food pantries to their campuses in order to combat the student hunger issues. Approximately 540 campus food pantries have been registered with the College and University Food Bank Alliance, which is closely monitoring the trend across the U.S.

Some food pantries in the campuses are run and managed by paid staff and on a budget while others depend partly or entirely on donors and volunteers. Others started off in tiny closet-sized compartments and have grown into multi-department establishments. UCLA food bank is dubbed the Food Closet and UCI recently remodeled its pantry to over 1,800 square feet, making it the biggest in the UC system. Not only does it offer free food and toiletries, but also sitting areas, a kitchenette with some handy appliances, and a showroom for weekly nutrition talks and food demonstrations.

Recommendations were also made to college officials to at least provide basic hygiene facilities such as showers and restructure openings to public benefits, as well as other resources that could make living conditions tolerable to students in need.

Family Background

Students who come from poor backgrounds, especially foster care students and those coming from homeless families, are especially vulnerable to food insecurity and homelessness.

California’s cash welfare, CalWORKs, offers an aid of $714 per month to families with two kids in order to help pay rent and other sustenance needs. However, this amount does not cover the rent requirements even for low-income housing units which exceed the aid by $150 generally in California and $256 in Los Angeles, the highest per unit low-income housing rent charges.

All this is occurring amidst an upsurge in new college enrollment among low-income students. Most of the colleges seem to systematically miscalculate the off-campus living cost and conditions for students.

The housing problem for college students is a core issue linked to the access to safe and adequate food and nutrition. Thorough research has been conducted and factors responsible have been identified, they remain complex to eliminate. It does not serve society well for so many young people, particularly from working-class families, to face such harsh and debilitating conditions.

Kevin Nelson is a professional educator and a private tutor with over eight years of experience. He is also a content writer for various blogs about higher education, entertainment, social media & blogging. Feel free to connect with him on Twitter, LinkedIn& Google+.

Case Studies in Autonomous Vehicles, Part II: How Do We Accommodate Passengers with Non-Routine Needs?

$
0
0

In Part I of this series, I discussed one of the logistical challenges to broadening the adoption of shared use autonomous vehicles. Specifically, many trips involve multiple, intermediate stops that make it less convenient for people to utilize ride hailing services like Uber and Lyft. This state of affairs won’t change simply because vehicles become automated.

Another key element of this challenge is how to accommodate travelers with non-routine or specialized needs. The ridesharing market currently focuses mostly on professional, often single and young urban travelers. However, there are many other travelers whose needs have been left essentially unmet by the ride sharing market. That is perhaps why ridesharing has only penetrated 1 percent of the US market.

Some claim that autonomous vehicles that are extremely cheap and plentiful will drive people to abandon car ownership and instead buy rides on demand, otherwise known as mobility as a service (MaaS). However, such thinking has not addressed the challenges of passengers with non-routine needs. These needs are based as much on convenience, safety and reliability as on cost.
The following are some examples of a few such classes of passengers.

Travelers with Children

One potential obstacle to widespread use of shared autonomous vehicles is the need for young children to be strapped into car seats, some of which are customized based on age and weight. For example, in California, children under the age of 8 must be secured in a car seat or booster seat in the back seat. Child safety laws across the United States vary but in general require car seats for children until they are least 5 years old (or a certain weight) and in many cases older than that. Canada has similarly strict laws that vary by province. In the United Kingdom, children must normally use a child car seat until they are 12 years old or 135 centimeters (about 4.5 feet) tall, whichever comes first. Many parents continue to deploy car seats beyond the required age. In short, a substantial portion of vehicle passengers need to be in customized car seats.

For a family of 4 with 2 adults and 2 children, one who is 3 years and the other 2 year old, the vehicle will have to provide two “regular” seats for the adults, one car seat appropriate for the 3 year old and 1 car seat appropriate for a 2 year old. For a family of 5 with 3 children of ages 1, 3, and 6, a larger vehicle will be needed with a different car seat configuration. And so on. This requirement presents several logistical challenges to shared use fleets, including the need to customize vehicles to meet the demands of all passengers.

In the United States, personal motor vehicles taking kindergarten through 12th grade students to school accounted for five to seven percent of vehicle miles traveled during the morning peak period (7:00 a.m. to 9:00 a.m.) in 2009. Additional miles are traveled by families to soccer games, gym classes, and play dates or in their vehicles to work and other destinations after dropping off their children.

Will shared autonomous vehicles be customized in sufficient numbers to carry families with young children reliably and swiftly? Will it be profitable to do so? Current ride hailing services do not generally focus on young families which perhaps reflects these logistical and cost challenges. Automation alone will not solve these challenges.

The Disabled

The disabled represent a significant and often overlooked segment of the population from a transportation standpoint. Some disabled individuals are able to function independently on their own. Others utilize shared vanpools or private assistance to get around or use public transit. The disabled can also include the elderly who have trouble getting around.

The United States Census reported that nearly 20 percent of Americans --- more than 55 million people in the United States --- have a disability. According to older data from the United States Department of Transportation, about 23 percent of individuals with disabilities need some sort of specialized assistance or equipment to travel outside the home. And 65 percent of individuals with disabilities drive a car or other motor vehicle.

There has been a lot of discussion about the fact that autonomous vehicles could open up a whole new world to the disabled, permitting those who are blind or have some other disability to travel more easily and frequently. The percent of vehicle miles traveled by those with disabilities may therefore increase. At the same time, the needs of the disabled present several challenges to autonomous shared use vehicles, including the need to customize vehicles, have an attendant available for some passengers, and re-configure cars in special cases.

Travelers with Pets

Many individuals travel in their cars with pets, particularly cats and dogs. They travel to the park, the veterinarian, work, school and on vacations with them. These pets typically do not have any specialized seating: they often sit in the back seat of a car. It is likely that many pet owners will want to continue to own a vehicle for convenience and peace of mind when traveling. From the passenger perspective, there are serious questions about whether other travelers will utilize a vehicle that has the smell, mess or hair left by a pet. One can easily imagine a situation in which all or a certain percentage of shared use vehicles are pet free. The question then becomes whether enough other shared vehicles will allow pets to make it economical and convenient to utilize.

Individuals Requiring Mobile Storage Capacity

Some individuals require a considerable amount of accessible, mobile storage space throughout the day. For example, gardeners need watering and plant care equipment that they must carry around from place to place in a truck from place to place. Construction workers need their tools. Medical sales representatives often carry sizable equipment from medical office to medical office, equipment that cannot be carried on public transit or in shared cars. And those running multiple errands and picking up multiple items, such as groceries and dry cleaning, store goods from the first stop in their vehicle before continuing on to the next stop. Because of their need to make multiple stops per day and carry significant equipment, such individuals typically own a car which has mobile storage capacity in the form of a trunk, back seat, etc. This state of affairs will not change simply because vehicles become automated.

Implications for an Autonomous Vehicle World

The categories above are not all encompassing. The key point is that the cumulative number of travelers with non-routine needs is large. Therefore, failing to address these needs could present a serious threat to the concept of a shared use future - and the potential benefits that flow from that world – less congestion, less parking demands and the ability to repurpose land.

At the same time, passengers with non-routine needs present a unique challenge to future managers of shared use fleets. To expand ride-sharing or at least the use of MaaS, shared use vehicles will need to be customized, available in sufficient quantities and in close enough proximity to service all passengers in a timely manner. However, the more these specialized needs are met, the greater the cost and the more difficult it is to successfully deploy a shared use fleet. This quandary will present unique logistical and profitability challenges for managers of autonomous fleets.

Recommendations

Further study is needed on how best to accommodate passengers with non-routine needs into an autonomous future. However, several initial steps might be taken.

First, all stakeholders, including Original Equipment Manufacturers (OEMs), other fleet owners and government agencies, should evaluate how to accommodate passengers with non-routine needs in autonomous vehicles. OEMs and fleet managers should consider what types of vehicle configurations will be necessary for children, the disabled and those with pets and how they will be serviced to make them attractive to customers. For example, will a specialized fleet be necessary for “child class” vehicles that are larger than standard and accompanied by a human attendant? And what amenities (including cleanliness) will be provided to make shared use of autonomous vehicles compelling?

Government agencies and OEMs should work together to craft autonomous vehicle laws that promote safety while also encouraging vehicle fleets that serve all individuals. One way would be to implement autonomous vehicle certification standards for carrying specialized passengers, such as children in car seats.

In the built environment, cities should look at facilities to help travelers store goods in between stops and make it easier to utilize transit.
Some individuals will continue to own simply because it more sense from a convenience or cost perspective. However, planners should consider how to engineer vehicle trips to appeal to the maximum number of consumers.
Finally, once appropriate procedures are in place, education and outreach will be needed so that passengers understand the safety and availability features of autonomous vehicles.

Conclusion

The need to accommodate passengers with non-routine needs has been overlooked. The amount of miles traveled by families and others with non-routine needs represents a significant percentage of vehicle miles traveled each year.

It is useful to consider the conclusions of McKinsey and Company: “Our research reveals that 83 percent of US rideshare consumers report convenience, not price, to be the primary reason for choosing a provider such as Lyft or Uber over traditional taxi options.” By the same token, convenience may lead passengers with non-routine needs to continue owning a vehicle – unless they are given a compelling reason to choose otherwise.

The needs of such travelers will not be met simply by deploying autonomous vehicles en masse and making them cheap. In short, automation alone will not be enough. Rather, we need to evaluate, from the perspective of the traveling passenger, how to make shared vehicles or rides as convenient as owning a vehicle. Only then will we be in a better position to achieve some of the hoped for goals as a result of this emerging technology.

Blair Schlecter is based in Los Angeles and writes about transportation policy and innovation. He can be reached at schlecterblair@gmail.com.

Photo: Gust, via Flickr, using CC License.


Radicalism Is On The Rise In American Politics

$
0
0

The Republican Party’s road to the 2018 mid-terms looks increasingly like Pickett’s Charge, the Confederate assault on fixed Union positions that marked the high-water mark for the southern cause. After achieving its greatest domination of elective office in 80 years, the GOP seems likely to get slaughtered.

As at Gettysburg, bad generalship, an unpopular, clumsy Donald Trump, constitutes one cause for the imminent Republican decline. But the officer corps is also failing, as the congressional delegation seems determined to screw its middle class base in favor of the remnant of those corporate plutocrats who finance their campaigns and the Goldman Sachs crowd to whom Trump has outsourced his economic policy. Steve Bannon’s support for demagogues like Roy Moore can only further weaken the party’s appeal, rapidly turning much of the business community, out of sheer embarrassment, into de facto Democrats.

Only one thing can save the Republicans from themselves: the Democrats. Although they have shown remarkable unity as part of the anti-Trump resistance, the Democrats themselves suffer deep-seated divisions. Most critically they are moving left at a time when more voters seek something more in the middle. Certainly this progressive tilt has done little to reverse their own declining popularity; public approval of the party has sunk to the lowest levels in a quarter century.

Read the entire piece at The Orange County Register.

Joel Kotkin is executive editor of NewGeography.com. He is the Roger Hobbs Distinguished Fellow in Urban Studies at Chapman University and executive director of the Houston-based Center for Opportunity Urbanism. His newest book is The Human City: Urbanism for the rest of us. He is also author of The New Class ConflictThe City: A Global History, and The Next Hundred Million: America in 2050. He lives in Orange County, CA.

Photo: Via wkrg.com.

Houston Market HOUSTON HOUSING 3Q17: Impact of Harvey Strongest in the Resale Market; New Home Sales Should Surge in 2018

$
0
0

•  Houston’s new home market and general economic conditions cannot be discussed without touching on the impacts of Hurricane Harvey, which damaged 167,000 single family homes throughout the Greater Houston Area.

•  By and large Harvey was a resale market phenomenon due to the locations of most flooding impacts. In general, Metrostudy does not anticipate any significant increase in new home sales demand generated by Harvey victims until 1Q18.

•  Despite the impact of the hurricane, Houston remains the second highest volume new home market in the country, with just Dallas/ Fort Worth achieving a greater number of starts over the 3Q17 trailing twelve months.

•  The sweet spot of the market in Houston continues to be in the $200k – $400k price bands. Starts and closings volume of homes base priced above $400k continue to show YoY declines, which are most pronounced in the $600k and above bands.

Metrostudy’s 3Q17 survey of the Houston housing market shows that Houston has maintained its number two position behind Dallas / Fort Worth in terms of annual new home starts. Houston achieved 27,713 starts, representing a growth rate of 6.4% year over year. Metrostudy anticipates a total year over year 5% to 6% increase in Houston single family starts at the conclusion of 2017 followed by a more modest 2% to 3% increase at the end of 2018. This differs from Metrostudy’s previous 2017-2018 projections: strong starts volume in 2Q and 3Q 2017 combined with current lack of focused growth direction in the energy industry has resulted in Metrostudy projecting a stronger starts rebound in 2017 with a slower continued growth trajectory for 2018.

“Houston’s new home market and general economic conditions cannot be discussed without touching on the impacts of Hurricane Harvey,” said Lawrence Dean, Regional Director of Metrostudy’s Houston market. “In general, Metrostudy does not anticipate any significant increase in new home sales demand generated by Harvey victims until 1Q18. These potential future buyers are simply focused on managing their damaged homes, temporary housing, insurance claims, and FEMA assistance to be able to move forward on purchasing new homes until this timeframe.”

Below are key statistics focused on Harvey’s impact on Houston:

  •Harvey dumped one year’s typical rainfall on the Houston region in five days (49”).

  • Moody’s Analytics estimates total economic losses to the Texas Gulf Coast (including Houston) of $97B, $87B of which is property losses.

  • Upstream Energy, Health Care, and Aerospace, the three pillars of Houston’s economic base saw relatively minimal impact from Harvey.

  • Downstream energy saw greater impact as more than ¼ of the nation’s refining capacity was offline on August 30th due to Harvey. As of September 7th 16% of capacity was offline, and this number continues to improve.

  • Only 40 of the region’s 1,200 office buildings received damage.

  • Apartment Data Services found that 9,662 apartment units in 177 properties, or 1.6% of the overall market inventory, were damaged. Apartment occupancies have improved slightly….but for how long?

  • The Houston region is anticipated to lose approximately 300,000 vehicles with a total value of $2.4B.

  • 167,000 single family homes were damaged throughout the Greater Houston Area.

  • Most of the top thirty builders reported flood damage to between 0% and 4% of their homes under construction or in inventory. By and large Harvey was a resale market phenomenon due to the locations of most flooding impacts.

Starts surpassed closings in the third quarter, for the second quarter in a row. Builders closed 7,540 homes in 3Q17, 113 more than in 3Q16. Builders have generally expressed being pleased with their overall sales volume in 2017 but saw more consistent strong sales volume in the first quarter of the year than they did in the 2Q. Houston continues to experience a very competitive new home sales environment although builders have been succeeding at selling through previously built up spec home inventory.

Annual new home starts volume continues to be greatest in the $200,000 to $299,999 price band. Sales volume in the $300,000 to $399,999 price band has also continued to grow year over year. The sweet spot of the market in Houston continues to be in the $200,000 – $400,000 base price bands. Starts and closings volume of homes base priced above $400,000 continue to show year over year declines. These declines are most pronounced in the $600,000 and above base price bands.

Quarterly lot deliveries were nearly identical to quarterly new home starts in 3Q 2017, with 8,006 new lots being delivered while 8,008 new home starts occurred. On an annual basis growth in new lots delivered remains very tight and similar in volume to lots absorbed. Over the last twelve months 27,798 new lots were delivered while 27,713 lots were absorbed by new home starts. Market-wide inventory of vacant developed lots (VDL) remains constant at 44,460 (down five from the previous quarter), or 19.3 Months of Supply.

Inventory of resale single family homes market wide has grown by 9.3% year over year. Currently there is an inventory of 20,487 true resale listings which is consistent with inventory levels seen one year ago. This reflects 3.7 months of supply which is the lowest level seen in twelve months.

This piece originally appeared on Metrostudy.com.

Photo: D.L., via Flickr, using CC License.

Playgrounds for Elites

$
0
0

The revival of America’s core cities is one of the most celebrated narratives of our time—yet, perhaps paradoxically, urban progress has also created a growing problem of increasing inequality and middle-class flight. Once exemplars of middle-class advancement, most major American cities are now typified by a “barbell economy,” divided between well-paid professionals and lower-paid service workers. As early as the 1970s, notes the Brookings Institution, middle-income neighborhoods began to shrink more dramatically in inner cities than anywhere else—and the phenomenon has continued. Today, in virtually all U.S. metro areas, the inner cores are more unequal than their corresponding suburbs, observes geographer Daniel Herz.

Signs of this gap are visible. Homelessness has been on the rise in virtually all large cities, including Los Angeles, New York, and San Francisco, even as it declines elsewhere. Despite numerous exposés on the growth of suburban poverty, the poverty rate in core cities remains twice as high; according to the 2010 census, more than 80 percent of all urban-core population growth in the previous decade was among the poor. For all the talk about inner-city gentrification, concentrated urban poverty remains a persistent problem, with 75 percent of high-poverty neighborhoods in 1970 still classified that way four decades later.

Clearly, then, the urban renaissance has not lifted all, or even most, boats. San Francisco, arguably the nation’s top urban hot spot, is seeing the most rapid increase in income inequality of any metropolitan area in the nation, according to a Bloomberg study. The ranks of the country’s most bifurcated cities include such celebrated urban areas as San Francisco, New York, Chicago, and Los Angeles, where the poverty rate is higher now than before the 1992 riots, both in the city proper and in the riot zone.

The new urban demographic—a combination of poor residents, super-affluent households (many childless), and a younger generation with limited upward mobility—has created conditions peculiarly ideal for left-wing agitation. This marks a sharp contrast with the early 1990s, when urban voters embraced pragmatic mayors like Rudy Giuliani in New York, Bob Lanier in Houston, and Richard Riordan in Los Angeles. Even San Francisco in 1991 elected Frank Jordan, a middle-of-the-road Democrat and former police chief. In some cases, these pioneering mayors were followed by less groundbreaking but highly effective leaders like New York’s Michael Bloomberg or Houston’s Bill White. The resulting golden era of urban governance helped foster safer streets and more buoyant economies, attracting immigrants and a growing number of young and talented people to the urban core. Ironically, though, the urban revival fostered demographic changes that would make it much harder for these reform mayors to win today.

The new urban demographics have also occasioned a huge drop in civic participation in cities like New York and Los Angeles; in such Democrat-dominated cities, little motivation exists for any but the most ideologically driven or economically dependent voters to go to the polls. Bill de Blasio, for example, won the 2013 New York mayoral election with the lowest-percentage turnout since the 1920s, while Los Angeles mayor Eric Garcetti won reelection with only 20 percent of voters casting ballots—less than half of the turnout when Riordan won in 1993.

The electorate has not only shrunk but has also become demonstrably more left-leaning. In 1984, for example, Ronald Reagan garnered 31 percent of the vote in San Francisco, while winning 27.4 percent in Manhattan and over 38 percent in Brooklyn. By 2012, Mitt Romney, a more moderate Republican, won barely 13 percent of the vote in San Francisco, and he garnered less than half of Reagan’s share 28 years earlier in Manhattan and Brooklyn. Donald Trump did even worse in all these areas.

Cities today are about as politically diverse as the former Soviet Union; they are increasingly dominated by “the civic Left,” for which pragmatism and moderation represent weakness and compromise. The emergence of Trump seems to have deepened this instinct, with mayors such as de Blasio and Garcetti, Seattle’s Ed Murray, and Minneapolis’s Betsy Hodges all playing leading roles in the progressive “resistance” against the president. Their anti-Trump posturing is mostly for show, but these mayors are pushing substantive—and increasingly radical—agendas of social engineering. Their initiatives include, in Los Angeles, imposing “road diets” on commuters to reduce car usage (while making traffic worse), as well as “green-energy” schemes that raise energy prices. Most are committed to serving as “sanctuary” cities and enacting unprecedented hikes in the minimum wage in an effort to eliminate income inequality by diktat.

Graphs by Alberto Mena

Many of these efforts clash with the aspirations of middle-class residents, who tend to drive cars, want to preserve their human-scale neighborhoods, and own small businesses highly sensitive to wage levels. Regulatory policies that seek to limit lower-density housing have led to escalating home prices in areas such as San Francisco, Los Angeles, and Portland. In these areas, housing costs (adjusted for income) are roughly two to three times higher than in places like Dallas, Atlanta, Charlotte, and Raleigh.

At the same time, high income taxes work against upper-middle-class entrepreneurs, who are usually stuck footing the bill for the “civic Left” playbook. These businesspeople often don’t have access to tax shelters, and they usually don’t earn most of their money through capital gains. Particularly vulnerable are those paying higher local income taxes, most of them living in and around the big coastal metros and the Midwest’s new basket case, Chicago.

No surprise, then, that many of those leaving California, New York, and other blue havens are people in their mid-thirties to early fifties—precisely the age when people are raising families, buying houses, and launching businesses. For many, an escape from the Left means heading to places where the political climate is, if not outwardly conservative, more moderate and business-friendly.

Nor is the progressive agenda likely to help its intended beneficiaries: the poor. The prospect of rapidly rising wages for mid-level jobs is undermining sectors like the Los Angeles garment industry, for example, where an exodus of employers is already occurring. Overall, as documented in a Center for Opportunity Urbanism study, economic prospects for minorities are much brighter in metro areas other than New York, Los Angeles, and San Francisco. This is particularly true for homeownership, where the rates for blacks are at least 20 percent higher in cities like Atlanta, Nashville, and Charlotte, compared with those more glamorous cities. Adjusted for income, homes are less than half as expensive for blacks and Hispanics in metropolitan Atlanta or Dallas–Fort Worth, compared with Los Angeles and the Bay Area. Meantime, heavily white cities with rising real-estate values like Portland, Boston, San Francisco, and Seattle are seeing what remains of their minority neighborhoods disappear.

Crime poses a conundrum for the new Left urban politics. The decline in crime in the 1990s reduced homicides dramatically, likely helping to reverse population loss in most cities. Now homicides are back on the rise in many large cities—but instead of bolstering law enforcement, most mayors have embraced the Black Lives Matter critique, which blames crime on institutionalized police racism. They do so despite measurable evidence that the main victims of this outlook, which has led to “de-policing” of vulnerable communities, are minorities and the poor.

Seattle, a city that has benefited mightily from the recent tech boom, epitomizes the tendency to pursue a left-wing agenda that undermines the very people it is intended to help. A city-funded University of Washington study found that Seattle’s minimum-wage increase actually reduced incomes and jobs for lower-wage workers. In a state with no income tax, Seattle’s city council unanimously passed a law that applies a 2.25 percent tax on income above $250,000 for individuals and above $500,000 for married couples filing together. Developers outside the city limits, such as in nearby Bellevue, are eager to accommodate the inevitable exodus of residents.

There is nothing inevitable about the future trajectory of urban economies. The suburbs, consigned to the dustbin of history by many urban boosters, have rebounded from the Great Recession. Demographer Jed Kolko, analyzing the most recent census numbers, suggests that most big cities’ population growth now lags their suburbs, which have accounted for over 80 percent of metropolitan expansion since 2011. Even where the urban-core renaissance has been strongest, ominous signs abound. The population growth rate for Brooklyn and Manhattan fell nearly 90 percent from 2010–11 to 2015–16.

The disposition of the millennial generation, on which so many urban dreams rest, will be critical. Roughly 70 percent of millennials already live outside core-city counties and, Kolko suggests, as they head into their thirties, many appear to be moving back to suburbia. USC demographer Dowell Myers suggests that we have reached “peak urban millennial” as the generation, albeit more slowly, becomes adult householders, not hipsters seeking a great “urban experience.”

Economic trends follow a similar trajectory. Nearly 80 percent of all job growth since 2010 has occurred in suburbs and exurbs (see chart, page 45). Most tech growth takes place not in the urban core, as widely suggested, but in dispersed urban environments, from Silicon Valley to Austin to Raleigh. Despite the much-ballyhooed shift in small executive headquarters to some core cities, the most rapid expansion of professional business-service employment continues to happen largely in low-density metropolitan areas such as Dallas–Fort Worth, Nashville, and Kansas City.

And most young people are not doing well in elite cities. For example, in New York City, millennial incomes (ages 18–29) have dropped in real terms compared with the same age cohort in 2000, despite considerably higher education levels, while rents have increased 75 percent. New York, Los Angeles, and San Francisco have three of the nation’s four lowest homeownership rates for young people and among the lowest birthrates.

Housing costs might be the biggest driver of millennial migration in the future. According to Zillow, for workers between 22 and 34, rent costs claim up to 45 percent of income in the Los Angeles, San Francisco, New York, and Miami metropolitan areas, compared with closer to 30 percent of income in metros like Dallas–Fort Worth and Houston. This may be one reason, notes a recent Urban Land Institute report, that 74 percent of Bay Area millennials are considering a move out of the region in the next five years, while a recent survey by the UCLA Luskin School suggests that 18-to-29-year-olds were the group least satisfied with life in Los Angeles.

If the flight of moderate, middle-income homeowners continues, along with the growth in population of poor residents and childless hipsters, urban centers will be destined to serve as sandboxes for the progressive political class. Most urban leaders and media boosters have been slow to recognize such trends, which call for a thorough change in policy. Urbanist Derek Thompson suggests that cities like New York are wonderful for new immigrants, hipsters, and the ultrarich but “not a great place for middle class families.” Yet young families, not single hipsters, will now be increasingly critical to urban success.

Rather than indulging feel-good radical experiments in social justice, cities need to rediscover their historical role as creators of the middle class, as Jane Jacobs put it. If they don’t, some extraordinary areas—in brownstone Brooklyn, much of Manhattan, Seattle, west Los Angeles, and San Francisco—will likely become ever more exclusive, divided between the rich and the hip (many of whom are their subsidized children) and surrounding poor populations working in low-end services (or not working). The policy emphasis should shift to middle-income areas—whether in the Sunset district of San Francisco, Los Angeles’s San Fernando Valley, Queens, or South Brooklyn—and closer suburbs, which could keep some younger families in the urban orbit. Such a shift will require a new kind of urban politics, one that encourages grassroots industries and corporate relocations that create more middle-income jobs, promotes the flourishing of human-scale neighborhoods, and accommodates families with good schools and low crime. The appeal of urban living remains viable, though today’s urban political class sometimes seems determined to kill it.

This piece originally appeared in City Journal.

Joel Kotkin is executive editor of NewGeography.com. He is the Roger Hobbs Distinguished Fellow in Urban Studies at Chapman University and executive director of the Houston-based Center for Opportunity Urbanism. His newest book is The Human City: Urbanism for the rest of us. He is also author of The New Class ConflictThe City: A Global History, and The Next Hundred Million: America in 2050. He lives in Orange County, CA.

Wendell Cox is principal of Demographia, an international public policy and demographics firm. He is a Senior Fellow of the Center for Opportunity Urbanism (US), Senior Fellow for Housing Affordability and Municipal Policy for the Frontier Centre for Public Policy (Canada), and a member of the Board of Advisors of the Center for Demographics and Policy at Chapman University (California). He is co-author of the "Demographia International Housing Affordability Survey" and author of "Demographia World Urban Areas" and "War on the Dream: How Anti-Sprawl Policy Threatens the Quality of Life." He was appointed to three terms on the Los Angeles County Transportation Commission, where he served with the leading city and county leadership as the only non-elected member. He served as a visiting professor at the Conservatoire National des Arts et Metiers, a national university in Paris.

Photo: Bernard Gagnon (Own work) [GFDL or CC BY-SA 3.0], via Wikimedia Commons

The Price of Texas Growth: Housing Affordability

$
0
0

The strong recovery from the Great Recession, fueled by the shale oil boom, propelled the demand for single-family homes in Texas. Homebuilders have been unable to keep pace with increasing demand. Supply is limited by the availability of land and labor constraints, pushing up home prices. Since 2012, Texas housing prices have been rising faster than incomes (Figure 1).


Prices Rise to New Highs

Texas has a vast supply of land suitable for development and relatively few building regulations. Construction typically responds quickly to demand, resulting in smaller home price swings than other large states. During the U.S. housing boom in the mid-2000s, Texas recorded modest home price appreciation, while prices nationwide climbed to record levels (Table 1). Similarly, when the housing market peaked and home values collapsed across the U.S., price declines in Texas were muted.

During the housing recovery, Texas price gains uncharacteristically outpaced those at the national level from December 2010 to June 2017, pushing home prices to record highs. Prices rose 43.8 percent in second quarter 2017 from fourth quarter 2007—the high before the housing bust, according to Federal Housing Finance Agency (FHFA) data. In contrast, U.S. home prices did not surpass their prerecession peak, registered in first quarter 2007, until first quarter 2016 and were only 9.3 percent above their previous high.

Driven by Population and Economic Growth

Texas has been a leading state for domestic migration since the mid-2000s, only losing the top spot to Florida in 2015 (Figure 2). California is by far the leading “sending” state as both companies and people have increasingly departed for Texas. This influx of people isn’t limited to domestic transfers; Texas has been consistently among the top five states for international migration.

This mass migration to Texas has propelled strong population growth. According to the U.S. Census Bureau, since 1990, the state’s population has grown on average almost a full percentage point faster than the U.S. Texas’ relatively low cost of living, strong economic growth due to the most recent oil boom, and lightly regulated commercial environment have attracted businesses and people. Naturally, this has increased demand for housing, particularly in the major metros. The number of households in Texas grew 1.6 percent on average annually from 2006 through 2016, compared to 0.6 percent in the U.S. and 0.6 percent in California. The number of housing units (including apartments) also increased 1.6 percent, dragging existing-home inventories to record lows.

The strong recovery from the Great Recession catapulted the Texas economy to breakneck job growth from 2012 through 2014. Demand for housing increased as home sales began climbing in mid-2010. Employment continued to grow despite the oil bust at the end of 2014 but briefly below the national pace. After fourth quarter 2016, Texas job growth once again surpassed the U.S., fueled by the recovery in the oil sector and continued U.S. economic growth. This put pressure on housing supply.

This picture is even more pronounced when home sales are divided into price ranges. Since 2011, growth in sales of homes priced between $200,000 and $499,999 have jumped in Texas (Figure 3). Sales of lower-priced homes have been constrained by the tightening supply.


In January 2011, homes under $200,000 represented 67 percent of total sales that go through the Multiple Listing Service (MLS) compared with 41 percent in June 2017. Inventory for these entry-level homes has fallen to historically low levels of about three months (Figure 4). Around 6.0 months of inventory is considered balanced. Inventories are even tighter at the Metropolitan Statistical Area (MSA) level, coming in at around two months for Houston and San Antonio and about one month in Austin and Dallas-Fort Worth (DFW).


Because of tight inventories, home sales in Texas’ major metros have been flat or declining in the under-$200,000 price range while growing rapidly at higher price points. This trend is most evident in Austin, which has experienced a noticeable drop in sales of homes priced below $200,000 since 2011. DFW and Houston have reported similar trends. San Antonio has fared better.

Declining Housing Affordability

With more inventory at the higher price points, sales growth at the higher end of the market has taken off. This has shifted the composition of homes sold. In 2011, 68 percent of homes sold in Texas were under $200,000. By 2017, they represented only 41 percent of the market. Table 2 compares the percentages of homes sold in each price range in the major metros for the same periods in 2011 and 2017. The lowest price range experienced largest shift is in, falling by 24 to 39 percentage points. Noticeable increases are seen in both the $200,000–$299,000 and $300,000–$399,000 price ranges. Houston and Fort Worth have similar distributions, while Austin and Dallas are skewed higher and San Antonio lower.

Supply Constraint, Accelerated Price Growth

This low-inventory, high-demand market has contributed to median home prices rising faster than incomes. This is a break with the past as income growth would exceed housing price growth. From 2012 through 2016, Texas household incomes rose at an average annual rate of 2.8 percent, while the median sales price of existing homes increased by more than twice that—7.4 percent per year on average.

As a result, Texas housing is less affordable, particularly in certain metros. Dallas, according to the Real Estate Center’s Housing Affordability Index, suffered the steepest decline in affordability, while Austin was a close second, followed by Houston. Fort Worth dropped as well but remains the most affordable and San Antonio had the smallest decline in affordability since 2011.

Worryingly, single-family permits in Texas remain below highs recorded during the U.S. housing boom. Despite strong demand for single-family homes since the end of 2011, building has been limited, something exacerbated by increased local government-imposed impact fees, lot costs from regulatory processes, and tight credit for land development.

Initially during the housing recovery, vacant, developed lots were plentiful. Supply dwindled in most major metros as delays in land permitting and shortages of skilled construction workers extended lot delivery times. Available lots fell consistently from 2011 through 2013 in Texas’ major metros (Figure 6). Total lot supply appears to have stabilized and in first quarter 2016 stood at around 20 months supply or more in most major Texas metros, signaling a nearly normal market. Austin and DFW are the exceptions, with supply remaining somewhat tight below 20 months.

The decline in lots has been particularly evident in the under $200,000 price range. Lot supply for housing at this price point is tight as higher land, labor, and material costs have shifted developers and builders from entry-level to higher-priced homes.

Growth in Texas residential construction employment has been slow despite strong statewide job gains. It took Texas about eight and a half years for jobs to reach its pre-Great Recession high of 50,550 workers, registering 900 more jobs in March 2017. This slow labor recovery was partly due to the shale oil boom, which created nonresidential construction jobs such as downstream energy plants and offices.

Labor Constraints Drive Costs

Strong demand for single-family homes combined with a tight construction labor market has resulted in stronger wage growth in residential construction in Texas than in the nation. Inflation-adjusted average weekly wages in residential construction climbed 22.3 percent from first quarter 2012 through first quarter 2017. Meanwhile, residential construction wages in the U.S. increased 16.8 percent, and Texas’ total private industry wages were up 1.1 percent (Figure 7).

Affordability an Issue Going Forward

Entry-level Texas homes constitute a smaller share of the market today than they did when the housing recovery began following the Great Recession—a result of unprecedented home-price appreciation. The accelerated price gains are due to the constrained supply in the presence of strong housing demand.
After the Great Recession, the lack of developed lots caused by financial constraints on commercial loans for land development and regulation by local government authorities affected homebuilders’ production capabilities. The lack of lots has pushed up prices for developed land creating an incentive for a homebuilder to build more expensive housing to make a profit.
Anecdotal evidence suggests small homebuilders are hurt the most as they must purchase land from third parties at higher prices. Major homebuilders, on the other hand, can purchase and develop their own land. In addition, labor constraints for skill labor has put pressure on homebuilders to supply new housing, also pushing up costs.

If Texas’ housing supply dynamics do not change as the state’s economy grows, the state will lose some of its comparative advantages in affordable housing. It may be far from the drastic situation in California, but should be leery of anything that puts the Lone Star into a similar trajectory.

Dr. Luis Torres is the Research Economist at the Real Estate Center Texas A&M University, which focuses on real estate economics, regional economics, macroeconomics and applied econometrics. Formerly with Mexico's central bank, Banco de Mexico, Luis previously served four internships with the El Paso office of the Dallas Federal Reserve. Luis understands the workings of central banking, a key driver of U.S. and world economies.

Photo: La Citta Vitta, via Flickr, using CC License.

To Revitalize Rust Belt Cities, First Stabilize Their Budgets

$
0
0

We seem to be in the process of rediscovering the Rust Belt, as a result of Donald Trump’s surprise victory in the 2016 presidential election. Anyone who has recently visited Detroit, Youngstown or Erie can understand what Trump meant when he spoke in his inaugural address of “American carnage.”

As the President suggested, America’s urban revival has been as uneven as it has been dramatic. On crime, job growth, and numerous other fronts, New York has outperformed what even its boosters were predicting back during the city’s “bad old days,” to say nothing of its doomsayers. But other cities, such as Youngstown, Gary and Flint, would happily turn back the clock to the 1970s, when poverty rates were much lower and population counts about twice or more than at present.

One consequence of cities’ divergent fortunes in recent decades has been a variety of definitions of “urban revitalization.” Too often, our conception of what it means to be a successful city relies on subjective factors such as how nice this or that downtown looks compared with the last time we visited.

But urban revitalization cannot be left entirely to the eye of the beholder. At bare minimum, it should mean solvency. A healthy city pays its bills in full and on time and delivers an adequate level of basic municipal services.

As they seek to revitalize themselves, dozens of Rust Belt cities’ budgets are now under strain. In a new research report, I survey conditions in 96 major, poor cities in the northeast and Midwest. Most have a smaller population than they had at some point during the 20th century—in several cases by more than over 50 percent—and all have seen their poverty rates increase since 1970. Still more troubling, about three-fourths of the cities I looked at have seen their real, per capita debt loads increase over the last forty years. In other words, the general trend for Rust Belt cities has been to take on more debt even while tax bases and populations have shrunk.

But whether the federal government can do much about revitalizing the Rust Belt is questionable. Any honest discussion about what former industrial cities need must take into account their legacy costs which are comprised of both bonded debt and retirement benefit obligations (the latter was a greater burden in most of the cities I surveyed for which data were available).

Legacy cost burdens have driven some cities into insolvency. Five cities have gone bankrupt since 2008: Stockton, San Bernardino and Vallejo in California, Central Falls, Rhode Island and Detroit Michigan. Hartford, Connecticut and Atlantic City, New Jersey are still teetering on the brink of insolvency. The 1970s may have been dismal for many cities, but the threat of municipal bankruptcy is greater now than at any time since the Great Depression.

Most cities will not go bankrupt. But all cities face tension between funding current services and the costs of the past. Costly obligations for bonds and retirement benefit liabilities keep tax burdens high and claim space in government budgets that could otherwise go towards strengthening current services. In the municipal finance world, this is sometimes referred to as the “crowd out” effect.

Can Rust Belt cities grow their way out of their legacy cost struggles? It would be risky to assume so, given their persistently high poverty rates. The most significant employers in nearly all the Rust Belt cities are focused the education and healthcare industries, or “eds and meds.” While these industries do not seem poised for a collapse anytime soon, reliance on them has come at a steep cost. Many “eds and meds” employers are non-profit and thus exempt from property taxes. The expansion in Rust Belt cities’ non-profit industries, and stagnation of the traditional for-profit economy, has created imbalances in local tax bases and left city officials scrambling to tap new revenue sources. That 40 percent of Pittsburgh’s tax base is exempt from property taxes is one reason why, despite that city’s heralded revival, it has been in Pennsylvania’s Act 47 program for “financially distressed municipalities” since 2003.

Instead of hoping for growth or a federal solution, advocates for Rust Belt cities should turn more of their attention to state governments. States have a responsibility to address fiscal distress because all local decisions regarding debt, taxes and spending are ultimately regulated by states. Almost by definition, municipal insolvency is evidence of a failed fiscal policy at the state level. When a city is on the verge of insolvency, a reluctance to intervene by state government risks a “contagion” effect whereby other cities in the same state face higher borrowing costs on municipal bonds.

A city that can’t pay its bills is also likely already experiencing “service delivery insolvency,” meaning it cannot provide its citizens with an expected level of public safety and infrastructure . Thus, if we are serious about meeting the threats of insolvency and declining city services, we can’t avoid more extensive and assertive forms of state involvement in cities.

It’s fair to say that most city officials view financial restructuring as less exciting than landing Amazon’s “HQ2” or opening a new downtown sports stadium. But, after shedding billions in long-term obligations through bankruptcy, a process that was directed by a state-appointed receiver, Detroit’s future now looks brighter than at any point in decades. New York City began its long road to revitalization when state government imposed a financial control board in 1975 and thereby instituted a culture of relative fiscal responsibility that persists to this day. These examples and other suggest that policymakers, both at the state and local level, should start viewing fiscal health as a prerequisite to extending the urban renaissance in the American heartland.

Stephen Eide is a Senior Fellow at the Manhattan Institute and author of “Rust Belt Cities and their Burden of Legacy Costs.”

Photo: Shawn Wilson [CC BY-SA 1.0], via Wikimedia Commons

COU Standard of Living Index 2017 – 2nd Annual Edition

$
0
0

In this policy brief, The COU Standard of Living Index, COU provides cost of living estimates for new entrants to metropolitan markets, including prospective home buyers as well as renters. See the report to understand the detailed criteria used to create the standard of living index.

Read the report (PDF) here.

The Urban Revival Is an Urban Myth, and the Suburbs Are Surging

$
0
0

The past decade has seen a gusher of books arguing for and detailing the supposed ascendency of dense urban cores, like the inimitable Edward Glaeser’s influential Triumph of the City: How Our Greatest Invention Makes Us Richer, Smarter, Greener, Healthier, and Happier, and about the ‘burbs as the slums of the future, abandoned by businesses and young people, like Leigh Gallagher’s The Death of Suburbia: Where the American Dream Is Moving.

But as we show in Infinite Suburbia, the new book we co-edited, the vast majority of American economic and demographic growth continues to take place there.

Let’s start with people.

Cities are about people. Where they move suggests their reasonable aspirations.

Even when Levittown was being built 70 years ago, there has always been a portion of the population — particularly the young, well-educated, affluent and often childless — that craves the density and excitement of downtown (CBD) life. But this group — heavy with members of the media — consequently attracts vastly outsized attention.

In fact, 151 million people live in America’s suburbs and exurbs, more than six times the 25 million people who live in the urban cores (defined as CBDs with employment density of 20,000+ people per square mile, or places with a population density of 7,500+ people per square mile—the urban norm before the advent of the automobile) of the 53 metropolitan areas with populations over one million.

In fact, ten of those 53 metropolitan areas (including Charlotte, Orlando, Phoenix and San Antonio) have no urban core at all by this measure, according to demographer Wendell Cox. The New York City metropolitan area is America’s only one where more people live in the urban core than in the suburbs — and it’s about an even split there.

In the last decade, about 90% of U.S. population growth has been in suburbs and exurbs, with CBDs accounting for .8% of growth and the entire urban corps for roughly 10%. In this span, population growth of some of the most alluring core cities — New York, Chicago, Philadelphia--- has declined considerably. Manhattan and Brooklyn, have both seen their rate of growth decline by more than 85% since 2011. Nationally, core counties lost over 300,000 net domestic migrants In 2016 (with immigrants replacing some some of those departees), while their suburbs gained nearly 250,000.

The canaries in the coal mine

Three key groups — seniors, minorities and millennials — all prefer the suburbs.

More than 10,000 boomers turn 65 each day; between 2015 and 2025, the number of senior households, according to the Joint Center on Housing Studies at Harvard University, will grow by 10.7 million. By 2050, the over-65 population will have doubled to 80 million.

Despitemuch talkabout seniors moving “back to the city,” the Census numbers suggest the opposite. Since 2010, the senior population in core cities has gone up by 621,000 —compared to 2.6 million in the suburbs. The share of seniors in both the inner core and older suburbs (those built before 1980) dropped between 2000 and 2010, while it’s grown substantially in newer suburbs and exurbs. A recent survey by Pulte Homes found that most boomers are seeking places near nature and with large garages; not exactly what you are likely to find, much less afford, in San Francisco. The “back to the city” phenomena, like many urban trends, is largely restricted to the wealthy.

Minorities, too, have headed for suburbia. Already the majority of African-Americans in the nation’s one hundred largest metros live in the suburbs; in 1990, 57 percent lived in inner cities. Since 2000, reports Brookings, the percentage of immigrants living in suburbs has shot up five points, to 61 percent. Overall,76 percent of the growth in the foreign-born population between 2000 and 2013 in the largest metro areas occurred in the suburbs.

More than one-third of the 13.3 million new suburbanites between 2000 and 2010 were Hispanic, with whites accounting for one-fifth of suburban growth in that period. And as Asians have become the biggest immigrant group arriving in America, many are skipping cities altogether. The Asian population in suburban areas grew 66.2 percent between 2000 and 2012, nearly twice the 34.9 increase in the core urban population.

But the most significant shift relates to Millennials. Roughly two-thirds of them, according to a recent Wall Street Journal survey, want a suburban experience for their future families. Census data, as analyzed by the website 538, shows that not only are people aged 25 to 29 about 25% more likely to move to a suburb than city, but that 30 to 44 year olds are leaving cities for suburbs at a much faster clip than they did in the 1990s. The National Association of Realtors sees the same trend, with young buyers shifting to suburban locations.

Some of this reflects the consequence of success in some cities, expressed in soaring prices, but much of the change is fundamentally about growing up. Research by economist Jed Kolko shows that urban residence continues to drop precipitously with age. This also comports with the findings of surveys from the Conference Board, the Urban Land Institute, and the National Association of Homebuilders, which found that 75% of millennials favor settling in a suburban house, but only 10% in the urban core.

This process will accelerate as millenials begin, albeit often later than previous generations, to start families. Some 1.3 million millennial women gave birth for the first time in 2015, raising the total number of U.S. women in this generation who have become mothers to more than 16 million.

The economic equation

Given the population numbers, much of the argument for cities boils down to the idea that dense, vibrant urban cores are by nature far more productive than their suburban counterparts. Again, the economic numbers tell a different tale. Less than 20 percent of the jobs in metropolitan America are in CBDs and inner rings — a share that’s held steady since 2010.

And despite suburban population growth, the poverty rate there remains roughly half what it is in the core cities. What suburbia dominates is the geography of the professional middle class. Primarily suburban areas account for 16 of the top 20 big counties with the highest percentage of households earning over $75,000 annually. Similarly, all but a handful of the counties with the highest percentage of households earning over $200,000 annually are suburban.

Nor is tech becoming more urban. With the exception of San Francisco (now the Silicon Valley’s urban annex, with young employees bused out from the urban core to suburban campuses) and to some extent Seattle (although much of the tech workforce there lives in the surrounding suburbs), the most rapid expansion of tech has been in suburban areas, including in sunbelt cities like Charlotte, Raleigh and Austin. Urban theorist Richard Florida estimates that three-quarters of patents come from areas with 3,500 of fewer people per square mile—less than half of the density associated with urban cores.

The financial elites in Manhattan or the tech billionaires in San Francisco may be more conspicuous, but when the Center for Demographics and Policy at Chapman University surveyed professionals earlier this year, we found that most young and middle aged professionals are more focused on family lifestyle issues like good schools, open space and affordability than on cultural amenities and nightlife.

Suburbs and health

A few years ago, The Wall Street Journal published an article with the headline “City vs. Country: Who Is Healthier?” It neglected to mention that it appears that suburbs are healthier than either. In research supported by the County Health Rankings and Roadmaps Program, a joint program of the Robert Wood Johnson Foundation and the University of Wisconsin Population Health Institute, suburbs topped both urban and rural areas in ten of twenty-nine factors that influence health, and had residents who generally enjoyed a better health-related quality of life.

Planners, policy makers, and those who shape our metro areas should acknowledge the ways that suburbs can be healthier, and work to reinforce these factors while helping to mitigate the bad ones. For instance, Los Angeles’ planners keep squeezing people into denser housing along congested highways despite overwhelming evidence that many people living there will develop health problems.

Dense urban living has been linked to many new diseases (including psychosis, cancer, and cardiovascular disease) over the past decade, and new research contradicts the old narrative some architectural and urbanists are still spreading about the supposed healthiness of city living. Research shows that proximity and exposure to parks and outside spaces is linked to better health outcomes and life expectancy— and that the best place for most people to have this is in suburbia, given how difficult and expensive it would be to dramatically expand park spaces in densely populated cities.

Are suburbs killing the planet ?

The mass movement that environmentalism became in the United States arose mainly in suburbs. As historian Chris Sellers details in Infinite Suburbia, The Nature Conservancy was an invention of the suburban East Coast. The fight against pollution—the single-most critical issue for US environmentalists by the late 1960s—was largely led and supported by suburbanites.The environmental political project defended a nature that was not remote, pristine, or “out there", but an immediate and suburbanized nature.

There are many environmental benefits latent within suburban open space, capacities that can contribute to the reduction of the overall environmental impact of metro areas. Suburban space has the potential for constructed wetlands to improve water quality and resiliency in metropolitan areas at large. Carbon sequestration can be done better by large trees in suburbia than almost any other landscape type. City centers can import surplus suburban renewable energy captured through rooftop solar, access locally grown organic food and or stored and recycled water. In these ways the suburb becomes crucial to the environmental part of the entire urban enterprise.

Looking forward

As American families and business continue to vote with their lives and dollars for the suburbs, the only way to stop suburban growth is “forcefully,” as The Economist recently put it and as the political class is attempting to do in increasingly feudalized California. Yet to kill suburbs — or try and convert them into high density cities— is to stomp on the aspirations of middle class families, immigrants, minorities and seniors. It is not, to say the least, a long-term winning political formula.

To be sure suburbs, already more diverse, could also become more interesting, and add more open space and commons, particularly with the onset of autonomous cars which can significantly reduce the paving in such environments. They could also serve as a safety valve for people priced out of the premier urban areas.

The legendary landscape architect Frederick Law Olmsted, who designed both Central and Prospect Park as well as several iconic suburban neighborhoods, considered suburbs a natural progression of urbanization: He said in 1868: “no great town can long exist without great suburbs.”

The challenge today remains making great suburbs to fulfill the potential of full urban life. The suburbs — where most Americans experience urban life — deserve not the disdain of planners and politicians and pundits, but their full respect and attention.

This piece originally appeared on The Daily Beast.

Joel Kotkin is executive editor of NewGeography.com. He is the Roger Hobbs Distinguished Fellow in Urban Studies at Chapman University and executive director of the Houston-based Center for Opportunity Urbanism. His newest book is The Human City: Urbanism for the rest of us. He is also author of The New Class ConflictThe City: A Global History, and The Next Hundred Million: America in 2050. He lives in Orange County, CA.

Alan Berger is Professor of Landscape Architecture and Urban Design at Massachusetts Institute of Technology where he teaches courses open to the entire student body. He is founding director of P-REX lab, at MIT, a research lab focused on environmental problems caused by urbanization, including the design, remediation, and reuse of waste landscapes worldwide. He is also Co-Director of Norman B. Leventhal Center for Advanced Urbanism at MIT (LCAU).

Photo: Via http://www.talentrealty.com/.


Eric Garcetti for president? Really?

$
0
0

Someone may be putting something in the Los Angeles water supply. In the past months, two unlikely L.A.-based presidential contenders — Mayor Eric Garcetti and Disney Chief Robert Iger — have been floated in the media, including in the New York Times.

But before we start worrying about how an L.A.-based president might affect traffic (after all this is the big issue in Southern California), we might want to confront political reality. In both cases, the case for our local heroes’ candidacies is weak at best, and delusional at worst.

The Disney fantasies

The Iger case is, if anything easier to dismiss. Iger can sell himself, like Trump, as a business success story, and with probably far-fewer questionable business transactions. Yet Iger, trying to run as a progressive in an increasingly left-wing Democratic Party, will face numerous challenges that dwarfs those faced by Trump.

Iger, for example, will have to run against the sad record of his company’s self-serving interference in Anaheim. Disney is generally a low-wage employer, and, in Orange County, this can be seen as contributing to the enormous disparity between cost of living and low salaries. I don’t suggest that companies should be primarily social justice warriors, but when a corporate executive runs, he’s going to be subject to their scrutiny.

Other problems also abound. For example, in 2016 the firm laid off 250 of its Orlando tech employees, replacing them with H-1B visas holders from an Indian outsourcing firm, and then, insisted that some train their replacements before being laid off. Let’s just say that won’t play well if Iger had to run against populists like Bernie Sanders, Elizabeth Warren, or even Joe Biden.

Read the entire piece at The Orange County Register.

Joel Kotkin is executive editor of NewGeography.com. He is the Roger Hobbs Distinguished Fellow in Urban Studies at Chapman University and executive director of the Houston-based Center for Opportunity Urbanism. His newest book is The Human City: Urbanism for the rest of us. He is also author of The New Class ConflictThe City: A Global History, and The Next Hundred Million: America in 2050. He lives in Orange County, CA.

Photo: Mayor of Los Angeles [CC BY 2.0], via Wikimedia Commons

#MeToo Solidarity

$
0
0

Sexual harassment is both a labor and gender justice issue. After all, the workplace is the epicenter of women’s recent outrage about sexual harassment and assault. Hollywood titans, respected reporters, and celebrity chefs all used their power over women’s paychecks in order to gain power over their bodies. Women (and some men) have responded by speaking out individually, yet their inspiration is decidedly collective; strength in numbers is what’s fueling the revelatory headlines. Women’s #MeToo tsunami, in fact, is perhaps the largest collective labor action of the early twenty-first century. In order for this riveting social movement to have a lasting impact, #MeToo solidarity must impact more than the elite. Workplace culture and expectations must shift for average, working-class women, too.

Women have been struggling to make the workplace safer for decades. They first made sexual harassment an issue in the 1970s when feminist workers and rape crisis activists united efforts, according to one recent account. By 1980, it seemed there was progress. Under the leadership of Eleanor Holmes Norton, the Equal Employment Opportunity Commission (EEOC) first issued explicit guidelines on sexual harassment. But then Ronald Reagan appointed Clarence Thomas chair of the EEOC in 1982, and he led the agency’s back peddling, well before Anita Hill accused the Supreme Court nominee of sexually harassing her in 1991. Hill endured fraught public scrutiny of her claim, and Thomas’s appointment laid bare how little headway women had really made.

It’s worth examining what has changed to make this workplace issue burn so brightly in 2017.

First, of course, there’s the Trump factor. Many women were stunned and appalled when Trump won the election despite bragging about groping women. The fact that his opponent was the first viable female candidate made the loss all the more bitter. Millions turned out last January for the Women’s March; their sea of pink pussy hats marked the original #MeToo moment. Incensed, many women have begun to speak out about the injustices they have kept quiet for too long.

But there are larger historical developments at play. In an era of heightened rights awareness, the Black Lives Matter and immigrants’ rights movements have led the way, launching fresh and innovative attacks on structural racism well before the 2016 election. Millennials are at the forefront of these fights, waging movements online and in the streets, well outside the traditional civil, labor, and human rights organizations.

Millennial outrage may be providing the energy behind the current tipping point on sexual harassment, too. After all, millennials are now aged 18 to 35 and so have come into their own in America’s workplaces. This generation of women must hold jobs; few really have a choice. They grew up with moms who worked, and recent research shows that young people are more accepting of working mothers today than even those in the 1990s. Nearly half of mothers are now the sole or primary breadwinners in their families. If paid work is something you and everyone else expects of you in life, then it’s all the more intolerable when men routinely make the worksite a dangerously sexualized realm. Millennials just aren’t taking it, and many older women find themselves inspired by these young women’s indignation.

Can women harness the solidarity impulse of the millions of women who posted the #MeToo hashtag? Will millennials finish what earlier generations started and build enduring change on the job? Their success is far from certain. Elite and professional women are receiving the lion’s share of the attention, and few long-term solutions are being discussed. An effective social movement on workplace sexual harassment can’t stop there. It must broaden to include women of all backgrounds and should channel the outrage into organizational and legal transformation.

While Hollywood actresses and elite journalists dominate the headlines about sexual harassment, research reveals that working-class women are the most likely victims of workplace sexual intimidation and assault. The Center for American Progress looked at a decade’s worth of EEOC claims and found that waitresses and retail clerks are the most likely to face sexual harassment on the job, followed closely by manufacturing workers and those in health care. A full 80 percent of restaurant workers deal with harassment on the job, including two-thirds who have to fend off management predators. Women are the most likely to work low-wage jobs where power imbalances are sharpest, and that’s especially true for women of color.

Effective solutions to workplace sexual abuse must empower women on the job, especially young, working-class women who are the most vulnerable. The Restaurant Opportunities Centers (ROC) United is playing a leading role, demanding an end to the sub-minimum wage that leave so many tipped workers vulnerable to intimidation. Jane Fonda and Lily Tomlin have even joined the group’s crusade, speaking out and posting viral videos on the topic.

Union women, too, can demand that their organizations lead the nation’s response on sexual harassment; after all, more than half of the nation’s union members will soon be women. The hotel workers union in Chicago found that well over half of hotel workers reported harassment from guests; their #handsoffpantson campaign demands that management equip hotel maids with panic buttons and ban guests who sexually harass a worker. After many female janitors in California found themselves alone at night in empty buildings alongside abusive male managers, the United Service Workers West won contract language and a law requiring cleaning and security employers to offer training on sexual harassment.

A union isn’t an automatic defense against sexual harassment. After all, some unions have been at the center of the recent storm. The SEIU and the AFL-CIO have both ousted top male staff for workplace sexual abuse. Unions also have a fraught relationship to the issue because their duty of fair representation requires them to defend workers accused of sexual harassment, even when another union member makes the allegation.

Nevertheless, women union members can — and should — take a leading role, and sexual harassment is an issue through which they can build power for all working women, not only the 10 percent who hold a union card. They could take a cue from the millennials’ movement against campus sexual assault, for instance, and partner with the new online group Callisto to build an online tool allowing women workers to document harassment and unite against repeat offenders. They could also convene a big tent coalition of unions, workers’ centers, policy experts, and women’s groups to strategize the next best legislative and policy steps.

Many women say they aren’t surprised by the breadth of the accusations that dominate the news headlines. As the #MeToo hashtag wave made clear, millions have endured this in some form. What’s new is that we are openly recognizing and naming the hidden dangers that women have long navigated at work wordlessly and alone. The #MeToo moment demonstrates collective action’s raw power. The question is whether women will be able to turn their next-generation solidarity into a broad-based and inclusive movement that can win enduring workplace transformation.

This piece originally appeared on Working-Class Perspectives.

Lane Windham is the Associate Director of Georgetown University’s Kalmanovitz Initiative and co-director of WILL Empower (Women Innovating Labor Leadership.) She is author of Knocking on Labor’s Door: Union Organizing in the 1970s and the Roots of a New Economic Divide.

Photo: HERE Local 1 Members

St. Louis and the Consequences of Consolidation

$
0
0

Brian Feldman’s piece about how consolidation killed St. Louis got a lot of attention when it came out last year. He argues that a rollback of anti-trust regulations that allowed industrial consolidation was the silent killer of what were once key regional business capitals like St. Louis.

Interestingly, his focus was on something you may not know ever existed in St. Louis, major advertising agencies.

If there is a living embodiment of the St. Louis advertising industry, it’s Charles Claggett Jr. The former creative director at D’Arcy, long one of the city’s largest agencies, he retired in 2000, two years before the French firm Publicis acquired the agency. One of his many claims to fame is that in 1979, he and his team penned “This Bud’s for You”—the slogan widely credited for helping St. Louis-based brewing staple Anheuser-Busch eclipse Miller during the 1980s beer wars….Another claim to Claggett’s fame is his father, Charles Claggett Sr., who led the city’s oldest and largest agency, Gardner, in the late 1950s and the 1960s. During his tenure, the elder Claggett oversaw accounts such as John Deere, Ralston Purina, and Jack Daniel’s.

And it wasn’t just Gardner and D’Arcy—whose twelve offices now fanned out across North America, as far as Havana—that flourished in mid-century St. Louis. With its ample supply of locally owned businesses as potential clients, the city supported a vibrant start-up ad agency scene. These new firms trained up-and-coming talent, developed cutting-edge campaigns, and often grew to become regional or national in scope, enriching the metro area by bringing in revenue from outside of it.

By the 1960s, St. Louis’s advertising industry had effectively developed into what economists call an “industry cluster.” Though the city’s agencies competed with each other, their sheer number created citywide competitive advantages: a deep bench of talent that moved in and out of agencies, spreading ideas and transferring know-how; a network of experienced, low-cost suppliers (printers, recording studios); and a reputation for quality that attracted national and international clients. All of it was built on the foundation of locally owned companies. These firms provided a steady supply of commissions facilitated by personal connections: account executives at the agencies and the senior executives at the corporations knew each other—from charitable events, from rounds of golf, or from attending the same high school.

D’Arcy followed a similar trajectory. In 1985, it merged with NYC-based Benton & Bowles to become DMB&B, a deal that saw the headquarters and executive decision-making shift to New York. The St. Louis office still handled long-standing accounts like Mars/M&M and Anheuser-Busch, but NYC now made “above-the-rim” decisions. As Claggett put it, “The agency slowly became just a branch office competing for accounts.”

The turning point came one day in 1994, when, unbeknown to the St. Louis office, the agency’s NYC-based media-buying unit signed a $25 million deal with Anheuser-Busch’s archrival, Miller, then lied about it. Anheuser-Busch’s volatile owner, August Busch III, immediately cut ties with D’Arcy, costing the agency $422 million in billings. One D’Arcy copywriter quipped, “When you lose Bud, you’ve lost it all.” Two years later, the office lost its $140 million Blockbuster account to New York. The agency closed its St. Louis doors in 2002.

In the years since the St. Louis advertising cluster disintegrated, the entire industry has taken a major hit as the Internet has disrupted its traditional business model. U.S. ad agencies today have fewer employees than they did in 2000.

One of the companies that got bought out in St. Louis was Anheuser-Busch itself, a company so synonymous with the city that its name might as well be “Anheuser-Busch, St. Louis, Missouri.” The buyer was Belgium-based InBev, which was controlled (and still is I believe) by a group of Brazilian investors. Three years after the 2008 deal, the St. Louis Post-Dispatch looked back at the consequences for the company and the city.

They still make big decisions here, the kind of big-spending, imaginative deals that made this place so envied. But now executives in New York City sometimes sign off on them, too….Three years out, some things are clear. A-B is a diminished but still huge, powerful presence. The worst of the cost-cutting appears over. The brewery and some executive functions have remained in St. Louis. But the corporate culture of the old A-B — tradition-bound, perfectionist, focused more on dominating the beer market than making money — has given way to an aggressive austerity.

The extensive cost-cutting has squeezed more profits out of A-B, but questions remain over whether the company’s new bosses can grow brands and sell more beer. And St. Louis is no longer the center of the company universe. A-B is now the U.S. subsidiary of A-B InBev. With that, old assumptions — and wistful illusions — about the relationship between the company and the city have changed, too.

This is pretty well known, I believe. What’s less known, perhaps outside of St. Louis, is that in 2014 Anheuser-Busch announced it would be moving brand management and other functions from St. Louis to New York City, opening what it termed its “commercial strategy office.”

Today the A-B commercial strategy office employs about 400 people in a very cool modern office in Chelsea. While the firm is still technically based in St. Louis and employs a lot of people there, including a lot of management people such its supply chain leadership, this represents a significant loss of high talent positions for that city.

Why did A-B open an NYC? Well, InBev was already there. Chicago, the most logical place for a consumer business like A-B, had already landed the Miller-Coors HQ. I don’t have any insights on that, but would speculate it played a role in the choice of New York.

But what’s most troubling for St. Louis and many other similar cities is that A-B’s main reason for staffing up in New York was to be closer to its ad agency partners. In other words, we are seeing knock on effects from previous consolidations and the rise of global cities as key financial and producer services nodes.

First consolidation wiped out St. Louis’ national scale ad agencies. Then the loss of those agencies make it hard to keep ahold of corporate marketing and other functions.

This was one of the key things I honed in on back in 2008 when I first wrote about the trend of HQs moving back to the global city. Saskia Sassen’s work on the revival of the global city noted the growth in specialized financial and producer services (like advertising). The rebirth of the global city was not built on traditional corporate HQ growth.

But then down the road, corporations started to restructure their HQs into what I term “executive headquarters”, with only top executive functions – generally only 500 at most – now part of the HQ. And that the HQ was now being drawn back to the global city in order to take advantage of the services infrastructure there. I noted how Mead-Johnson Nutritionals (makers of Enfamil baby formula) had followed this formula when it moved from Evansville, Indiana to Chicago. Here’s what the media said at the time:

Working in a large city will make it easier to conduct business throughout the world. Mead Johnson makes Enfamil and similar products and about half of its sales come from overseas. Having offices near Chicago, for instance, will place executives in close proximity to global-business consultants, leaders in the field of nutrition and an international airport.

Today we see that proximity to services providers, international airports, and the ability to recruit top global talent are all drivers of this. To date I’ve mostly noticed that the losing locations were clearly subscale cities like Evansville or Peoria. Now with Connecticut losing GE, it’s affecting larger business markets as well.

A-B’s New York office isn’t technically an executive headquarters, but it has some of the same characteristics. This isn’t about anything nefarious. It’s about companies doing what they think they need to do to address market realities. Mass market beer brands like Bud Light are in decline industry-wide. These kinds of moves are part of trying to stay market relevant. (A-B also just changed CEOs in response).

This is definitely a trend to keep an eye on since it will have a big effect on whether or not legacy business cities like St. Louis in the 1-3 million metro area range will be able to continue conducting business as the same level they’ve been used to doing. I think there is a ton of risk here in many cities, especially in the Midwest.

This piece originally appeared on Urbanophile.

Aaron M. Renn is a senior fellow at the Manhattan Institute, a contributing editor of City Journal, and an economic development columnist for Governing magazine. He focuses on ways to help America’s cities thrive in an ever more complex, competitive, globalized, and diverse twenty-first century. During Renn’s 15-year career in management and technology consulting, he was a partner at Accenture and held several technology strategy roles and directed multimillion-dollar global technology implementations. He has contributed to The Guardian, Forbes.com, and numerous other publications. Renn holds a B.S. from Indiana University, where he coauthored an early social-networking platform in 1991.

Photo: Anheuser-Busch’s offices in New York.

The Cities Where A Paycheck Stretches The Furthest 2017

$
0
0

We often conflate high salaries with prosperity, but that can be deceptive. Someone who lives in New York or San Francisco might make more money than a counterpart in the same profession in Houston or Dallas-Fort Worth, but when the cost of living is factored in, their Southern colleagues may actually come out ahead.

At the Center for Opportunity Urbanism, we developed a Standard of Living Index to get a better sense of where workers are getting the most for their paychecks. We began with the Bureau of Economic Analysis regional price parities for the 107 metropolitan statistical areas with more than 500,000 residents, added the costs for purchasing the average house and weighted the index based on the national distribution of renting and owning (63 percent owning, 37 percent renting). Housing plays a disproportionate role in the difference in costs between the most and least expensive metro areas, as we will detail later.

The picture that emerges is one of a very varied set of regional economies, all seeking to boost pay and the standard of living faster than costs. Some do this well, while others are getting left behind.

The Top 10

As the world capital of technological innovation, the San Jose metropolitan area, which includes much of Silicon Valley, has by far the highest average salary -- $116,000 -- among the 107 largest metropolitan areas. That‘s more than twice the national average, and $31,000 more than the metro area with the second-highest average pay, Bridgeport-Stamford, Conn.

The cost of living in the San Jose area is also impressively high, nearly 60% above the national average, driven by outrageous real estate prices. Factoring that in, the average paycheck there is worth $67,485– much lower than nominal pay, but still high enough to rank first in the nation.

Three other tech-oriented metro areas rank in the top 10: Boston (seventh) and Seattle (ninth), where high salaries compensate for prohibitive costs, and Durham, N.C., in third place, where costs are slightly above average. In all three, the cost of living adjusted pay varies from around 10% to 18% above the national average.

Houston retains its second-place rank from last year, with a cost of living 9% above the national average, but with pay that’s nearly 20% above. The nominal average pay there of $64,000 pencils out to $58,400 when adjusted for cost of living.

Fourth place Atlanta has a cost of living 2% above the national average but with pay 14% above. The rest of the top 10 is rounded out by Detroit (eighth), Hartford (ninth) and Dallas-Ft. Worth (10th), which are not on the minds of most venture capitalists, but offer relatively higher salaries and reasonable costs that benefit residents.

The metro area where a paycheck buys the least: Honolulu, where the high costs of all the necessities shipped in from the mainland, not to mention high housing costs, erodes the value of the average $50,200 wage to $32,500.

California’s Conundrum

One thing that screams out to anyone looking at the numbers: the preponderance of California metro areas that inhabit the bottom rungs of the survey.

California’s recovery has been driven largely by the Bay Area, which includes San Francisco and San Jose.

Yet the rest of state, whose growth rate has now slowed to the national average after several years playing above par, is not keeping up as well. The clear culprit: housing costs so high that San Francisco's wages are not nearly high enough to cover the costs. San Francisco, ranks 19th, second best among California metropolitan areas. It shares prohibitive costs that are almost as high as San Jose -- some 50% above average -- but with pay nearly $16,000 lower, barely 6% above the national average.

A remarkable five of the bottom 10 metro areas on our rankings are from the Golden State. These include both interior metropolitan areas -- No. 101 Fresno and No. 104 San Bernardino-Riverside -- that suffer from rising house prices and California’s draconian regulatory and tax regime but without the benefit of above average salaries. Other interior areas hurting include Modesto, ranked 91st, and Stockton,95th. Both have seen home prices rise as newcomers, fleeing the Bay Area’s insane costs, have settled in for long commutes but still working there. Indeed, Stockton has now been included in the Bay Area combined statistical area by the Office of Management and Budget.

Yet the coast is not in the clear either, as No. 102 Oxnard’s ranking suggests. But perhaps more surprising is the poor showing by No. 92 San Diego, which has a strong technology economy, and even worse the massive Los Angeles area, home to Hollywood, which ranks 100th, by far the worst among the 10 largest metropolitan areas on our list. The reason? An average salary that is barely above the national average but with a cost of living, driven by high housing prices that drops the value of the paycheck to 20% below the national average.

Full List: The Cities Where A Paycheck Stretches The Most And Least

What The Future Holds

The widening divergence in housing costs -- an issue which has occupied much of the recent tax reform debate -- is becoming an increasingly determinative factor in the evolution of metropolitan economies. The largest cost difference in goods and services other than rents among the 107 metropolitan areas is 35%. The spread from lowest to highest in rents is 255%. The biggest gap, however, is in the cost differences for purchasing the average-priced house – a whopping 624%, nearly 2.5 times the differences in rents. This drives the overall cost of living difference up to 124% between the least and most expensive metropolitan areas.

As we have seen some areas -- notably San Jose, Boston and Seattle -- have been able to cope with higher costs because industries there are able to offer relatively fat paychecks. But even these storied areas may face challenges as the cost gaps rise. Already growth has slowed, and even gone into reverse in the Bay Area, a downturn at least somewhat tied to bloated housing costs. A 2015 survey found some 74 percent of millennials in the area were contemplating leaving, largely due to high rents and home prices.

These issues will become larger as millennials begin to look to buy houses for their young families. We have calculated the difficulty of transitioning from renting to purchasing, by comparing annual average housing costs for renters to average housing costs for a newly purchased house. The gaps tend to be much wider in places like the Bay Area, Los Angeles and New York, than for example, in Chattanooga, Tampa-St. Petersburg, Indianapolis, Orlando, San Antonio, Atlanta or Birmingham.

Some people are moving in large numbers from the more expensive areas to areas where costs are lower.. The 10 most expensive metropolitan areas (including San Jose), where the cost of living is 25% or higher than average, exported 1.4 million domestic migrants to other parts of the country from 2010 to 2016. In contrast, the 77 metropolitan areas with costs of living below average attracted more than 2,000,000 net domestic migrants. This could also accelerate the flow of business investment to these places, as skilled labor becomes more constrained, or the demands for compensation more extreme, as people struggle to meet costs.

This piece originally appeared on Forbes.com.

Joel Kotkin is executive editor of NewGeography.com. He is the Roger Hobbs Distinguished Fellow in Urban Studies at Chapman University and executive director of the Houston-based Center for Opportunity Urbanism. His newest book is The Human City: Urbanism for the rest of us. He is also author of The New Class ConflictThe City: A Global History, and The Next Hundred Million: America in 2050. He lives in Orange County, CA.

Wendell Cox is principal of Demographia, an international public policy and demographics firm. He is a Senior Fellow of the Center for Opportunity Urbanism (US), Senior Fellow for Housing Affordability and Municipal Policy for the Frontier Centre for Public Policy (Canada), and a member of the Board of Advisors of the Center for Demographics and Policy at Chapman University (California). He is co-author of the "Demographia International Housing Affordability Survey" and author of "Demographia World Urban Areas" and "War on the Dream: How Anti-Sprawl Policy Threatens the Quality of Life." He was appointed to three terms on the Los Angeles County Transportation Commission, where he served with the leading city and county leadership as the only non-elected member. He served as a visiting professor at the Conservatoire National des Arts et Metiers, a national university in Paris.

Photo: Adam Simmons, via Flickr, using CC License.

Mind the Gap

$
0
0

I spent the last several years on an extended tangent exploring land use policy, the dynamics of a shifting economic and political landscape, and popular interpretations of how things should be. I’ve come to a peculiar set of conclusions and it’s not what I expected.

We have a collection of rules, regulations, social expectations, and a cost structure that reinforces and mandates a very specific set of arrangements. Here’s one example of how these things shape our lives. A family bought an old fire station a few years ago with the intention of turning it in to a Portuguese bakery and brew pub. They thought they’d have to retrofit the interior of the building to meet health and safety standards for such an establishment. Turns out, the cost of bringing the landscape around the outside of the building up to code was their primary impediment.

Mandatory parking requirements, sidewalks, curb cuts, fire lanes, on site stormwater management, handicapped accessibility, draught tolerant native plantings… It’s a very long list that totaled $340,000 worth of work. They only paid $245,000 for the entire property. And that’s before they even started bringing the building itself up to code for their intended use. Guess what? They decided not to open the bakery or brewery. Big surprise.

I’ve heard many officials and professionals get very derisive in their assessment of such efforts. “Oh, they were idiots. They didn’t do their homework before they started their project. What? They thought they could just do whatever they want with the place? There are rules you know.” These are precisely the same individuals who butter their bread each day with impact fees and billable hours. They have no skin in the game.

Meanwhile the space has been pressed in to service as a printing shop for the family’s specialty advertising business. It’s a productive and profitable use of the existing space that doesn’t require structural changes or special regulatory approval. But it’s significantly lower down on the economic food chain, creates less taxable revenue, employs far fewer people, and does nothing to activate the town’s social or cultural life. And if anything were to happen to the building it wouldn’t be cost effective to rebuild so the lot would most likely remain vacant. There are plenty of empty parcels all around that attest to this reality.

Here’s an example of the kinds of things that are now required in order to open a new business. Each element of the design is based on an accumulation of amendments to the code over many decades. Individually it’s impossible to argue against each of the particulars. Do you really want to deprive people in wheelchairs of the basic civil right of public accommodation? Do you really want the place to catch fire and burn? Do you want a barren landscape that’s bereft of vegetation?

In this case the business in question is a gas station and an automated car wash.

And here’s the larger context. Can you spot the human? Look closely. She’s there. All our collective legislation to make individual establishments achieve specific goals are in direct conflict with the larger development pattern which is also institutionally mandated. There is zero chance that any of these laws and procedures will be changed in my lifetime. However, it’s highly likely that before I die this gas station will close and the property will work its way down to a series of lesser uses until it remains vacant. After fifteen years the building will be fully amortized for tax purposes and the corporation that operates it will probably move on. That’s just good business. And before I shuffle off this mortal coil the cost of maintaining the road and associated sewer and water infrastructure will outstrip this town’s tax revenue – especially after the disposable chain businesses close down.

I was in Hamtramck, Michigan a couple of years ago to participate in a seminar about reactivating neighborhoods through incremental small scale development. A young woman had just bought a century old bank building for $50,000. It was a Roman temple made of carved stone, elegant wood, stained glass windows, and beautiful tile work. The place was enormous. But it had worked its way down the value chain for decades as Detroit declined.

While the event was underway the fire marshal happened to drive by and noticed there were people – a few dozen actual humans – occupying a commercial building in broad daylight. In a town that has seen decades of depopulation and disinvestment this was an odd sight. And he was worried. Do people have permission for this kind of activity? Had there been an inspection? Was a permit issued? Is everything insured? He called one of his superiors to see if he should shut things down in the name of public safety. Fortunately the woman he called was in the meeting at the time and talked him down.

One of the side conversations included an exploration of how to activate the space without doing the kinds of things the building code required. There was already a kitchen in the back of the building from when the place had been a Chinese restaurant. But the current rules required a long list of upgrades including a $20,000 fire suppressing hood for the stove and new ADA compliant bathrooms. It could all be done, but at a price point that would grossly exceed both the purchase price of the building and any conceivable cash flow the business might generate.

One work-around was to have a certified and inspected food truck park in the back alley and deliver food into the building for temporary events. ADA portable toilets could be rented as needed. The building – now called Bank Suey – has continued along these lines as a rental hall for pop up events while the owner waits for the value of the neighborhood to increase enough to justify the required investment in physical upgrades. It’s not a bad plan, but it’s going to be a while folks.

I noticed an array of cell phone antennas on the roof of a nearby building. Rent on those things generates serious revenue – far more than what these empty buildings are likely to collect from commercial or residential tenants. Too bad Bank Suey isn’t taller.

On a walking tour of town officials and development consultants pointed to empty buildings and described all the things that could be done to bring them back to productive activity: open up the blank walls and re-install windows, incubate all kinds of new businesses, paint, outdoor seating… I rolled my eyes. None of those things make any economic sense given the regulatory hurdles involved and the likely negative return on the up front investment. I’ve seen this scenario play out many times before.

The buildings that most appeal to me are the anonymous blank inscrutable structures that could quietly contain storage facilities or a non retail live/work space under-the-radar without attracting the attention of officialdom. If the inhabitants were really discrete they might be able to carry on unmolested for a number of years. Meanwhile the usual big money developers might buy enough of the neighboring buildings and vacant land – with the accompanying subsidies and tax breaks – to rapidly transform Main Street at a much higher economic level. There’s no in-between. You either get permanent stagnation or massive redevelopment. Baby steps are essentially illegal. “Hold, wait, and do nothing” works for the little guy.

The same officials who decry this kind of obstructionist “land-banking” that gums up the works of their revitalization dreams do exactly nothing for small scale operators who run straight in to the buzz saw of multiple opaque unresponsive bureaucracies and inspectors hungry for violations. The only tool they have to offer is loans to bring things up to code. That’s a great plan if you want to go in to a huge amount of debt and declare bankruptcy in a couple of years. No thanks.

There are all sorts of things individuals can and should do at a low price point without much debt to build up their personal household economies and contribute to a better community. But this ain’t it. Mind the gap.

This piece first appeared on Granola Shotgun.

John Sanphillippo lives in San Francisco and blogs about urbanism, adaptation, and resilience at granolashotgun.com. He's a member of the Congress for New Urbanism, films videos for faircompanies.com, and is a regular contributor to Strongtowns.org. He earns his living by buying, renovating, and renting undervalued properties in places that have good long term prospects. He is a graduate of Rutgers University.

Viewing all 3794 articles
Browse latest View live


Latest Images