Quantcast
Channel: Newgeography.com - Economic, demographic, and political commentary about places
Viewing all 3794 articles
Browse latest View live

The Emergence of Texas Urbanism; The Triangle Takes Off

$
0
0

This essay is part of a new report from the Center for Opportunity Urbanism titled "The Texas Way of Urbanism". Download the entire report here.

Throughout the history of the United States, much of the nation’s economic vitality can be traced to specific regions and their mastery of the productive sectors which propelled the country forward. Today we see this most evident in the remarkable emergence of the “Texas Triangle” encompassing Houston, Dallas-Ft. Worth, and Austin-San Antonio.

The role of metropolitan regions reflects a steady theme of shifting economic power throughout American urban history. The early stages of commercial growth and then the first wave of industrial innovation established the economic strength of the New York-Connecticut-Massachusetts region; the global roles of New York City and Boston owe much to this early start, in part due to the talent networks and capital that clustered in these cities.

Heavy industry, the next phase of industrial growth --- autos, steel, and appliances --- blossomed in the early Twentieth Century, transforming metros from Cleveland to Chicago into global economic powers. These areas provided the country much of the wherewithal to win the Second World War. Over the last 75 years, technology breakthroughs and Asia-Pacific trade relationships have steadily accelerated the importance of the extended West Coast region from Seattle to San Diego.

More recent has been the rise of other regions, many which were once backwaters. This includes Miami, with its strong ties to the Caribbean and South America; the Southern belt of cities reaching in an arc from Charlotte and Raleigh to Atlanta and Nashville. Then there’s the rising Intermountain West, centered largely in the metros of Denver, Salt Lake City and Phoenix.

But no place has seen more dramatic and steady economic and demographic growth than the Texas Triangle, formed by the Dallas-Fort Worth metro at its northern point in North Texas; the Houston metro at its southeastern edge on the Gulf Coast; and Austin-San Antonio at its western tip in Central Texas.

The growth of these areas has transformed Texas from a largely agricultural and commodities-producing state into a highly urbanized and economically sophisticated place. Together the metropolitan areas of the Texas Triangle have a population of more than 18 million residents. The Texas Triangle metros together account for more than 66% of the population of Texas and 77% of the GDP of the nation’s second largest state.

This emergence is now globally acknowledged. In terms of economic strength, each of the Texas Triangle metros ranked among the top six strongest urban areas in the nation in a post-recession analysis by the Praxis group and their economic output together would position the Texas Triangle as the fifth strongest regional economy in the U.S. in a framework created by metropolitan scholar Richard Florida. The fact that these measurements use a variety of factors suggests the powerful and pervasive nature of the Texas urban ascendency.

One way to look at the importance of the Texas Triangle is to examine the vital and often quite unique economic contributions which each metropolitan area contributes to the nation’s well-being.

• Houston is the acknowledged energy capital of the world with its complex of energy headquarters, financing institutions, research centers, and petroleum processing and transportation facilities. Its medical center houses more clinical institutions and life sciences research facilities than any other medical complex in the world.

• Dallas-Fort Worth is an established financial center, telecommunications pioneer, and its two airports are the hubs of flights connecting the Southwestern U.S. to the nation and to the world. It has become a favored location for corporate expansions and relocations for both domestic and foreign companies.

• Austin and San Antonio are connected by 75 miles of continuous urbanization, including the vital region around San Marcos and a string of the fastest growing small cities in the nation. Austin is home to world-class companies, particularly in technology, the University of Texas, and also is home to the government of the nation’s second largest state. San Antonio is home to the nation’s second largest concentration of cybersecurity companies, to three major Armed Forces commands, to an international automotive manufacturing hub centered on Toyota, and to the most visited destinations in the state, the Alamo and the Riverwalk.

Although not as established as a global center as the metropolitan networks on the East and West coasts, the Texas Triangle now occupies an increasingly important place among the world’s commercial centers. There are now 53 Fortune 500 firms headquartered in the Triangle metros, including American Airlines, AT&T, and Exxon Mobil in Dallas-Fort Worth; USAA and Valero, and Whole Foods in San Antonio and Austin; and Conoco-Phillips and Halliburton in Houston. Global headquarters, such as Occidental Petroleum, and national operational headquarters, such as those of Toyota USA and Mitsubishi Heavy Industries, underscore that the global role of the Texas Triangle is ascendant.

The Texas Triangle is also home to a concentration of high-quality higher education. Nationally-ranked research institutions such as the University of Texas at Austin and Rice University in Houston are joined by such major public institutions as the University of Houston; the University of Texas campuses at San Antonio, Dallas, and Arlington; and the Texas A&M campus in San Antonio. Excellent private institutions include Southern Methodist University in Dallas, Texas Christian University in Fort Worth, and Trinity University and Incarnate Word University in San Antonio. Within the geographic expense of the Texas Triangle are such powerhouses as Texas A&M University in College Station and Baylor University in Waco.

The Texas Triangle is connected to the commercial centers of the globe through its impressive transportation assets. The Port of Houston is the second largest port by volume of tonnage in the U.S. The state boosts major airline hubs for American Airlines at DFW Airport, for United Airlines at George Bush Houston International, and for Southwest Airlines at Love Field in Dallas, as well as extensive international airline connections from Austin and San Antonio. Major cargo volumes flow on the state’s highway grid, most notably on the NAFTA Highway, IH-35, which delineates the western spine of the Texas Triangle and expedites the greatest volume of international freight from any inland port to markets across the nation.

This economic ascendency owes much to pro – business Texas policies, largely embraced by both major political parties, that stress job creation and wage growth as the best strategies for continued and broadened prosperity. Investments in roads, water, power, broadband, ports and essential public facilities, such as higher education campuses, remain priorities in state and municipal budgets.

But what really makes the Triangle grow is its people, animated by the spirit of new opportunity luring work-ready in-migrants from other states and ambitious immigrants from around the world. Texas attracts investors, entrepreneurs, researchers, inventors, and workers who recognize a state committed to reducing barriers to economic success and to creating the financial, educational, and physical conditions for growth and upward mobility.

That combination of the policy regime, the physical facilities, and the human energies has created an economic juggernaut now claiming its place among the great commercial networks of the world. The nation can look to the Texas Triangle for future breakthroughs in innovative products and creative services. But beyond that the world can look to the Texas Triangle for examples of cities that combine a passion for growth with a determination to improve the lives of people.

Henry Cisneros is Chairman of City View companies, which have invested in and built more than 90 urban residential projects since 2000 in 13 states. Mr. Cisneros is also Chairman of the Executive Committee of Siebert Cisneros Shank, one of the nation’s most successful minority-owned public finance and capital markets firms, having participated in more than $2.5 trillion in municipal and public authority issuances and corporate transactions. Mr. Cisneros was Mayor of San Antonio for four terms and was Secretary of the U.S. Department of Housing and Urban Development in President Clinton’s Cabinet from 1993-97. He is a corporate board member of Univision Communications and La Quinta Holdings and is Vice Chairman of Habitat for Humanity International and a board member of the Bipartisan Policy Center in Washington D.C.

Photo: NASA [Public domain], via Wikimedia Commons


The Texas Urban Model

$
0
0

This essay is part of a new report from the Center for Opportunity Urbanism titled "The Texas Way of Urbanism". Download the entire report here.

The future of American cities can be summed up in five letters: Texas. The metropolitan areas of the Lone Star state are developing rapidly. These cities are offering residents a broad array of choices — from high density communities to those where the population is spread out — and a wealth of opportunities.

Historically, Texas was heavily dependent on commodities such as oil, cotton, and cattle, with its cities largely disdained by observers. John Gunther, writing in 1946, described Houston as having “…a residential section mostly ugly and barren, without a single good restaurant and hotels with cockroaches.” The only reasons to live in Houston, he claimed, were economic ones; it was a city “…where few people think about anything but money.” He also predicted that the area would have a million people by now. Actually, the metropolitan area today is well on the way to seven million.

It would no doubt shock Gunther to learn that Texas now boasts some of the most dynamic urban areas in the high income world. Approximately 80 percent of all population growth since 2000 in the Lone Star state has been in the four largest metropolitan areas. People may wear cowboy boots, drive pickups and attend the big rodeo in Houston, but they are first and foremost part of a great urban experiment.

The notion of Texas as an urban model still rankles many of those who think of themselves as urbanists. Most urbanists, when thinking of cities of the future, keep an eye on the past, identifying with the already great cities that follow the traditional transit dependent and dense urban form: New York, London, Chicago, Paris, Tokyo. And yet, within these five urban areas, there are large, evolving, dynamic sections that are automobile oriented and have lower density.

Measuring Employment Success

Since 2000, Dallas and Houston have increased jobs by 31 percent, growing at three times the rate of increase in New York and five times as rapidly as Los Angeles. Texas’ smaller but up-and-coming metropolitan regions are also thriving, with San Antonio and Austin, for example, boasting some of the most rapid job growth in the country.

This growth is not all at the low end of the job market, as some suggest. Over the past fifteen years Texas cities have generally experienced faster STEM (Science, Technology, Engineering and Math-related) job growth than their more celebrated rivals. Austin and San Antonio have grown their STEM related jobs even more quickly than the San Francisco Bay Area has grown theirs, while both Houston and Dallas-Fort Worth have increased STEM employment far more rapidly than New York, Los Angeles or Chicago.

The Texas cities also have enjoyed faster growth in middle class jobs, those paying between 80 percent and 200 percent of the median wage at the national level. Since 2001, these jobs have grown 39 percent in Austin, 26 percent in Houston, and 21 percent in Dallas-Fort Worth, a much more rapid clip than experienced in San Francisco, New York or Los Angeles, while Chicago has actually seen these kinds of job decrease.

Recent Pew Research Center data illustrates that between 2000 and 2014, out of the 53 metropolitan areas with populations of more than 1,000,000, San Antonio had the second largest gain in percentage of combined middle-income and upper-income households; the percentage of households in the lower-income segment dropped. Houston ranked 6th and Austin ranked 13th, while Dallas-Fort Worth placed 25th, still in the top half.

Much of the credit for this growth in jobs goes to the state’s reputation for business friendliness. Texas is consistently ranked by business executives as the first or second leading state. Needless to say, New York, California and Illinois do not fare nearly as well. The Texas tax burden ranks 41st in the country. Compare this to New York, which has the highest total state tax burden, Texas rates are also far lower than those in New York, neighbors Connecticut and New Jersey, or in California.

The Demographic Equation

No surprise, then, that people are flocking to the Texas cities. Over the last ten years, Dallas-Ft. Worth and Houston have emerged as the fastest growing big cities of more than five million people in the high-income world, growing more than three times faster in population than New York, Chicago, Los Angeles or Boston. Among the 53 US major metropolitan areas, four of the top seven fastest growing from 2010 to 2015 were in Texas.

Foreign immigration, a key indicator of economic opportunity, is now growing much faster in Texas’ cities than in those of its more established rivals. Between 2000 and 2014 alone, Texas absorbed more than 1.6 million foreign born citizens. In numbers, that’s slightly less than California took in, but in proportion to Texas’ population it is 60 percent more.

During that same time period the Latino population of Austin grew by 90 percent; Dallas-Fort Worth and Houston each grew by about 75 percent. In contrast, the Latino population in Los Angeles grew only 17 percent.

Houston now has a far higher percentage of foreign born residents than Chicago does. Dallas-Ft. Worth draws even with Chicago in that measurement, with an immigrant population that has grown three times as fast as that of the Windy City since 2000.

Economic opportunity explains much of the difference. Texas’ vibrant industrial and construction culture has provided many opportunities for Latino business owners. In a recent measurement of best cities for Latino entrepreneurs, Texas accounted for more than one third of the top 50 cities out of 150. In another measurement, San Antonio and Houston boasted far larger shares of Latino-owned businesses than Los Angeles, which also has a strong Latino presence.

Texas is not a totally successful environment for minorities. Poverty levels for blacks and Hispanics remain high, and education levels lag in Houston, Dallas-Fort Worth and San Antonio. But the key factor is that Texas cities present superior prospects for upward mobility.

Domestic Migration Trends

Since 2000, Dallas-Ft. Worth has gained 570,000 net domestic migrants, and Houston has netted 500,000. In contrast, the New York area has had a net loss of over 2.6 million people, while Los Angeles hemorrhaged a net 1.6 million, and Chicago nearly 900,000. Dallas-Fort Worth, Houston, Austin and San Antonio were all among the top eleven in total net domestic migration gains. The smaller Texas cities have also experienced large gains in migrants.

Many newcomers come from places — notably, California — where many Texans once migrated. Between 2001 and 2013, more than 145,000 people (net) have moved from greater Los Angeles to the Texas cities, while about 80,000 have come from Chicago and 90,000 from New York.

As Dallas Morning News columnist Mitchell Schnurman says, “If oil prices don’t go up, Texas can always count on California — and New York, Florida, Illinois and New Jersey.”

Creating the Next Generation of Urbanites

Texas urban growth has occurred more or less in conjunction with market demand, without the strict controls and grandiose ‘visions’ that dominate planning in New York and California. Overall housing prices in Texas cities remain, on average, one-half or less than those in coastal California cities such as San Francisco, San Jose, San Diego and Los Angeles. They are a third below those in New York, and have not experienced the huge spikes in housing inflation seen elsewhere in the Northeast Corridor, such as in Boston.

The lower house prices in Texas facilitate greater aspirations to home ownership, particularly among young people. The financial leap from renting to owning is far less daunting in Texas than it is the Northeast, or in some western US cities.

These lower prices have been a boon to ethnic minorities, who make up an ever-growing percentage of the population in cities nationwide. Latinos and African-Americans are far more likely to be home owners in Texas cities than in New York, Los Angeles, Boston or San Francisco.

A review of US Department of Commerce Bureau of Economic Analysis data indicates that housing costs are responsible for virtually all of the cost-of-living differences between the nation’s approximately 380 metropolitan areas. Consequently, it is far cheaper to live in Texas cities — even Austin — than in Boston, New York, Los Angeles, San Diego, Chicago and, most of all, the San Francisco and San Jose metropolitan areas.

Some observers lament that, due to market forces, the vast majority of Texas metropolitan growth — nearly 100 percent — has taken place in the suburbs and exurbs. Yet the Texas cities mirror nationwide experiences: there is essentially no difference between the share of metropolitan development in the Texas suburbs and the share in most other areas. The average share for all major metropolitan areas is 99.8 percent, including in Portland, Oregon, the much ballyhooed model for densification.

Ironically, dense housing development has grown more rapidly in Texas cities than it has in California, where the state has tried to mandate dense development. Building permit rates indicate that Texas cities have led the nation in both low density single family housing and in high density multifamily development. Between 2010 and 2015, Texas’ largest cities held three of the top five positions among the 53 major metropolitan areas in the issuance of multifamily building permits. Austin led the nation in these permits, while Houston and Dallas-Fort Worth had higher multifamily building permit rates than San Jose, Denver, Portland, Washington, or Los Angeles. At the same time, these three Texas cities also were in the top 10 in single-family building permits. Who occupies these new residences? Between 2010 and 2014 Texas cities, led by Austin and San Antonio, experienced higher rates of growth among college educated 25 to 34 year olds than did traditional ‘brain centers’ like New York, Boston, Chicago and even San Francisco. During the tech boom of the late 1990s, more people moved from Texas to the Bay Area than vice versa; in the current one, the pattern is reversed. A recent San Jose Mercury poll found that one-third of all Bay Area residents hope to leave the area, primarily citing high housing costs and overall cost of living.

As young people mature, Texas’ major urban areas provide them with an array of choices. Texas city-dwellers, unlike many New Yorkers or San Franciscans, do not need to choose between living a middle class family lifestyle or staying in a city they love. Texas housing policies that allow organic growth driven by the market are attractive to young people seeking to establish careers or families, and to those who are already newly-established.

These trends will have a long-term demographic impact, and suggest a continuing Texan ascendency. According to the American Community Survey’s ranking of elementary-age school children per family, Austin, Dallas-Fort Worth, Houston and San Antonio rank in the top six among the 53 major metropolitan areas. By comparison, Chicago ranks twenty-second, Los Angeles twenty-seventh, New York thirty-sixth, and San Francisco 45th.

The Lone Star State is already home to two of the nation’s five largest metropolitan areas, the first time in history that any state has so dominated the nation’s large urban centers. At its current rate of growth, Dallas-Ft.Worth, could surpass Chicago in the 2040s, as would Houston a decade later. By 2050 the Lone Star state could dominate America’s big urban centers even more than it does now.

Joel Kotkin is executive editor of NewGeography.com. He is the Roger Hobbs Distinguished Fellow in Urban Studies at Chapman University and executive director of the Houston-based Center for Opportunity Urbanism. His newest book, The Human City: Urbanism for the rest of us, will be published in April by Agate. He is also author of The New Class ConflictThe City: A Global History, and The Next Hundred Million: America in 2050. He lives in Orange County, CA.

Wendell Cox is principal of Demographia, an international public policy and demographics firm. He is a Senior Fellow of the Center for Opportunity Urbanism (US), Senior Fellow for Housing Affordability and Municipal Policy for the Frontier Centre for Public Policy (Canada), and a member of the Board of Advisors of the Center for Demographics and Policy at Chapman University (California). He is co-author of the "Demographia International Housing Affordability Survey" and author of "Demographia World Urban Areas" and "War on the Dream: How Anti-Sprawl Policy Threatens the Quality of Life." He was appointed to three terms on the Los Angeles County Transportation Commission, where he served with the leading city and county leadership as the only non-elected member. He served as a visiting professor at the Conservatoire National des Arts et Metiers, a national university in Paris.

Welcome To Texas” flickr photo by David Herrera is licensed under CC BY 2.0

The Dallas Way of Urban Growth

$
0
0

This essay is part of a new report from the Center for Opportunity Urbanism titled "The Texas Way of Urbanism". Download the entire report here.

Dallas-Fort Worth (DFW) has started the 21st century with a bang. Like the other major metro areas in Texas, the DFW area has grown far faster than most large U.S. cities: 35 percent population growth for the DFW metro area between 2000 and 2014, compared to an average growth rate of 21 percent for America’s top 40 cities. GDP per capita growth in the metro area has also handily outpaced the average of its “Top 40” peers as well, 46 percent versus 39 percent.

It’s not just numbers, but also strong qualitative growth. Dallas-Fort Worth has consistently ranked as one of the premier destinations for corporate relocations and facilities growth. It has built on its central location and efficient transportation infrastructure to become ever more pivotal to the nation’s commerce across a wide variety of industries. The DFW area just reached the milestone of housing 7 million people, making it the fourth largest metropolitan area in the country. Looking ahead, DFW is increasingly challenging Chicago, currently number three at 9.6 million, as the leading business center in the interior of the United States. Texas state and local authorities project that the DFW population will reach 10.5 million by 2040. This economic and demographic success has arguably positioned greater Dallas as the next great American metropolis.

Why has DFW grown so fast, particularly since 2000? How does the growth of DFW fit into the larger story of how the system of American cities has evolved in recent years? And how has the type of growth and urbanism which characterizes the leading cities in Texas contributed to the success of the DFW area?

DFW has gotten many things right, particularly with respect to taxes, land use policies, airports, and other infrastructure. But it has also benefited enormously from a confluence of long-term economic changes transforming the whole landscape of urban America. To sum up our argument, the DFW area has grown so fast because it has proved a more hospitable environment to middle-income individuals and families than most other large U.S. cities in recent years.

Who's Coming?

The field of urban economics starts from the premise that people can move from one city to another relatively easily, so the configuration of people across cities at any moment in time reflects what urban economists call a “spatial equilibrium,” that is, people are where they want to be and cannot readily improve their lives by moving elsewhere. Urban economists go on to break down the considerations that people take into account in deciding where to live into three categories:

• Productivity - which drives how much people can earn in a given place

• Amenities – which are the natural or man-made features which make a city a desirable place to live

• Costs - which range from housing and other direct costs of living to traffic congestion, long commutes, and other ills associated with high urban density

A large shift in population from one group of cities to another over a period of time prompts the question of what’s changed during the period, and specifically how the relative configuration of productivity, amenities, and costs has evolved.

We put the data on DFW in comparative perspective, looking at the top 40 metropolitan statistical areas, as the U.S. Census calls them. We also divide this group into the top 20 “coastal” cities and the top 20 “interior” cities, since one of the big 21st century demographic stories in the United States has been a large migration of people from the largest coastal cities to somewhat smaller interior cities. This migration has reversed the dominant trend of the 20th century – which saw large migrations to the coasts, especially California – and provides a larger context for the recent growth of DFW and other Texas metro areas.

Since the DFW region has been the recipient of tremendous inbound net migration, one question to address is who’s been moving to the area. Demographic data suggests three general patterns. Inbound migrants to the area:

• Come from everywhere, to a greater degree than has been the case in most other large cities

• Disproportionately include young families with children

• Are less educated, on average, relative to the Top 40 cities

First, DFW has been exceptionally successful in attracting both domestic and international migrants. Of DFW’s 35 percent population growth since 2000, 10 percent is from net migration from elsewhere in the United States and 8 percent consists of net immigration from abroad — in both cases well above the Top 40 city average (the rest of DFW’s growth is from natural population growth - more births than deaths). This pattern is unusual. The biggest beneficiaries of net domestic migration, adjusted for their size, are generally smaller, relatively inexpensive interior cities like Nashville, San Antonio, and Phoenix, which have tended to attract disproportionately small immigration by foreign-born people. Meanwhile, the largest coastal cities have attracted more than their share of foreign-born immigrants, while mostly losing native-born people to net outbound migration.

Figure 1 illustrates the largest sources of inbound domestic migration to DFW, as well as the largest destinations for outbound migration, by county. The largest source of inbound domestic migration is Southern California, followed by the New York-to-Boston corridor, Chicago, and, to a lesser extent, Midwestern cities like Kansas City and St. Louis. Mexico, India, and China are the most important sources of international migration to the area.

A second pattern is that migrants to DFW disproportionately include young families with children. DFW, along with Houston, has the highest proportion of under-18 people in its population of any Top 40 metro area. Big coastal cities like New York, San Francisco, and Seattle, meanwhile, continue to do reasonably well in attracting single, well-educated Millennials, even as married people with children move out in droves.

Third, migrants to the area are less educated, on average, relative to the Top 40 average. DFW ranks somewhat behind the Top 40 average in the share of 25-34 year-olds with a Bachelor’s degree or higher (32.7 percent versus 37.6 percent in 2014) and the share of the total population with an advanced degree (9.4 percent versus 11.8 percent). All major metro areas have seen these educational attainment rates increase since 2000, but DFW and other Texas cities have experienced smaller-than-average growth, in large part because the population of inbound migrants ranks lower than average in education levels. The metro areas which have experienced the greatest increases in education levels are generally the ones with already high levels in 2000, mostly in the Northeast and on the West Coast. That said, although DFW’s growth in the share of people with degrees has been slower than some other cities, its total number of people with a Bachelor’s degree or higher has grown by more than 500,000 since 2000 – fourth highest among all metro areas — simply because the region has added so many people.

Towards an Explanation

Traditional explanations for the relative success of DFW typically focus on its warm weather, its central location, its vast airport (the 9th busiest in the world), its transportation infrastructure, and its business-friendly political climate. These assets are very real, but they do not do a very good job of explaining the city’s unusual growth since 2000, for two reasons. One is that a number of other interior cities have similar advantages but have grown at more pedestrian rates. The other reason is that DFW already had these assets in 2000 and indeed well before then. To explain the dramatic population shifts since 2000, one must focus on what has changed over the last 16 years.

Productivity

The data on relative productivity, amenities, and urban costs across America’s top 40 cities point to a great deal of change. Consider, first of all, productivity. Average personal income per capita in DFW is very close to the Top 40 average, and has also experienced nearly identical growth since 2000 (Table 1). However, it has moderately outperformed the “Interior” Top 20 in income growth, and currently has higher average income levels than most interior peers. Perhaps most relevant are differences across cities for the same occupational category, since people deciding where to live and work are presumably most interested in comparisons within their own occupation.

Productivity in DFW is higher than that of the Interior Top 20 average in finance and business operations and computer operations, two of the fields most heavily represented in DFW. Productivity growth in DFW has outpaced the Interior Top 20 average in finance and business operations since 2000, though not in computer operations. In sum, the data suggests that DFW has performed modestly ahead of most Interior Top 20 metro areas in productivity growth, though not ahead of the Coastal Top 20.

Population and productivity growth feed off each other. Urban economists have regularly found that large cities offer residents opportunities to be more productive and earn higher wages than they could in smaller, less dense locations. Generally speaking high population growth tends to promote high productivity growth. High productivity and wages, in turn, attract more people. So, DFW’s productivity growth is undoubtedly a consequence, in part, of the area’s rapid population expansion.

But there are deeper reasons why it has achieved above average productivity growth, relative to other interior cities. One is the long-term trend towards increasing geographic concentration of service-sector activities, a global trend that runs counter to the rising geographic dispersion of manufacturing activity. DFW has been fortunate to see financial services and professional- business services, its two fields of greatest comparative advantage, grow from 30.2 percent to 31.9 percent of the U.S. economy between 2000 and 2014, and become more geographically concentrated in a handful of large urban centers, including its own. Specialist healthcare services have also become increasingly concentrated in major medical centers, another trend that has benefited the region.

Another factor lies in the diversity of DFW’s industrial base. An insight from urban economics is that diversity of industries and employment turns out to be good for productivity growth in modern cities. Industrial concentration is helpful if it is in the right industries, as in Silicon Valley, at least for today, but not if it is in (say) automobiles, as in Detroit, or steel, as in Pittsburgh. But diversity provides more than a hedge against decline in a city’s primary job engine. The author Jane Jacobs famously argued that large, industrially diverse cities promote cross-fertilization of ideas and make residents more productive on average. Research by the urban economist Edward Glaeser of Harvard and others has confirmed this relationship in U.S. data in recent decades.

DFW has reaped the fruits of having an exceptionally diverse economy. According to comparisons of industrial diversity published by Moody’s, the area economy’s diversity index has grown from 0.72 in 2000 to 0.80 in 2013 (with the aggregate U.S. economy normalized to an index value of 1.00). Over the same period, the diversity index for the Interior Top 20 rose only from 0.69 to 0.71 on average, while the Coastal Top 20’s average index value increased from 0.52 to 0.58. New York, Los Angeles, San Francisco, and Seattle, all relatively concentrated cities in terms of their employment base, have generally remained as concentrated as ever over the last 16 years. Site Selection magazine has found that DFW is among the top five “most competitive” cities in 10 of 12 sectors. DFW is first in business and financial services as well as in food and beverages, second in communications and in transportation, and third in aerospace. DFW, moreover, hosts multiple large employers in each of these industries, another source of urban success in recent decades.

DFW is growing its base of innovative activities and startups along with the rest of its economy. But innovation is not as convincing an explanation of why the region is growing so much faster than others. DFW is a solid performer but in the middle of the pack in terms of innovativeness, compared to the average Top 40 city. DFW ranks 21st of the Top 40 in patents per employed person. It is also roughly average in terms of the share of metro area jobs in “creative” or “STEM” occupations and in venture capital investments per capita. Similarly, DFW is 15th among the Top 40 in startup activity, as measured by a Kauffman Foundation index, and is just below the Top 40 average in the number of startups per capita and in growth in the number of business establishments, according to U.S. Government data. DFW does have a tremendous amount of innovative and entrepreneurial activity – but so do all large, successful cities. And while DFW is friendly to innovation such as high-tech startups, one of its virtues is its friendliness to a broad spectrum of other activities as well. So innovation is not the major driver of the region’s outsized growth rate.

Amenities

Turning to amenities, any effort to rank cities according to their desirability as a place to live is inherently subjective. Still, virtually all rankings find that DFW has good, but not standout, amenities. DFW ranks 11th of the Top 40 cities in Mercer’s 2015 “quality of life” rankings, 17th in a similar ranking published by U.S. News and World Report in 2016, and 8th in a ranking devised by economists Michael Cox and Richard Alm of SMU’s Cox School of Business.

These rankings tend to evolve slowly, and there is little evidence that DFW has moved up very much in the rankings since 2000. DFW has built out very distinguished arts facilities in both the cities of Dallas and Fort Worth, as well as a premiere football stadium, during the past 16 years. But again, large metro areas typically feature top-notch amenities. What would have been more remarkable is if DFW had failed to develop amenities in keeping with its large size, rapid growth, and new economic stature.

The Key Advantage: Costs

Without question, the most significant divergence between DFW and the major coastal cities has been in the cost of living and doing business. This divergence is most obvious in the cost of housing. Between 2000 and 2012, the Case-Shiller house price indices for the 11 cities among the Coastal Top 20 for which Case-Shiller indices exist rose an average of 41 percent (Figure 2). The average increase for the seven cities among the Interior Top 20 for which indices exist was 6 percent, while DFW prices appreciated 13 percent. So during that time, coastal city housing prices went up far faster than those in DFW or other interior cities.

But this trend changed starting around 2012. Over the next three years, DFW prices increased by the same amount as the average of the coastal cities – 39 percent. Other interior cities are only slightly behind, at an average of 35 percent.

The research organization Demographia, which measures housing affordability across U.S. cities on a comparable basis, arrives at similar results. Based on Demographia indices, DFW housing costs declined from 60 percent of the Top 40 average in 2004 to 51 percent in 2007, then went up to 76 percent in 2012 and 77 percent of the U.S. level by 2015 (Figure 3). Average housing costs in the Top 20 interior cities fell from 72 percent in 2004 to 67 percent in 2007, then went up to 77 percent by 2015. In the coastal Top 20, meanwhile, housing costs increased from 128 percent of the U.S. average level in 2004 to 131 percent in 2007, then fell back slightly to 123 percent by 2015.

These and other measures of housing affordability all point to the same conclusions: DFW began the century with a moderate-sized edge relative to other interior cities and a very large advantage compared to the large coastal cities, increased its advantage over the next six years or so, then began to give up some of its enormous edge over the last decade. The region still has a large cost advantage over the coasts, but not as large as it used to be, despite well publicized run-ups in the cost of coastal housing.

A look at home price listings on Zillow confirms that the substantial housing cost advantage Dallas has enjoyed relative to other large cities is not a result of comparing “apples to oranges.” As of April 2016, asking prices for condos in the thriving Uptown area of Dallas are some 13 percent below prices for highly comparable condos near Chicago’s “Magnificent Mile” and 62 percent below San Francisco’s Pacific Heights. Asking prices in DFW’s prosperous suburbs of Frisco and Southlake are 39 percent below those in Chicago’s suburb of Highland Park and 83 percent below those in the Bay Area’s Cupertino and Hillsborough.

Comparisons of other categories of urban costs tell a similar story. Office rent levels increased in DFW relative to the average Interior Top 20 city between 2000 and 2014, but they rose much less than rents in New York, Los Angeles, San Francisco, and Miami. Average daily commute times in DFW were close to the Top 40 average as of 2014, but they did not go up between 2000 and 2014. In the large coastal cities, as well as Chicago, by contrast, they were worse than average in 2000, and they have lengthened considerably in the years since. Business taxes plunged in DFW relative to the Coastal Top 20 average between 2000 and 2014, and fell somewhat relative to the average Interior Top 20 city as well. The idea that Dallas offers significant cost-of-doing business advantages relative to Chicago and the largest coastal cities appears frequently in media coverage of corporate relocation decisions.

Origins of DFW's Edge

DFW’s sizable cost advantage relative to most other large U.S. cities stems both from its distinctive urban geography and from large and growing divergences in public policies. The geography of the region has always been unusually polycentric, for reasons partly rooted in the city’s history. The city of Dallas grew up primarily not as an oil town but rather as an inland cotton trading and transportation center, while Fort Worth, known as “Cowtown,” developed as a ranching hub. This history helps explain the area’s economic diversity today. However, the DFW area only emerged as a major metro area with the Interstate Highway Act of 1956 and the opening of DFW International Airport in 1974. Relative to most Top 40 cities, the core municipalities of Dallas and Fort Worth had unusually small downtown districts as they entered the postwar age and a vast expanse of countryside into which to expand

Today, DFW is characterized by numerous, widely distributed centers to which people travel to work and play. The traditional central business districts in the cities of Dallas and Fort Worth house 11 and 3 percent of the metro area’s office space, respectively, compared to ratios between 30 and 50 percent in cities like Boston, Philadelphia, Minneapolis, and Seattle, and more than 55 percent in Chicago. Seventeen high-density mixed-use centers away from the two CBDs have been developed in DFW over the last two decades, a pattern now spurring imitation in older cities whose suburbs have generally been known as sleepy bedroom communities. People moving in from California, India, and China are settling disproportionately in DFW’s booming northern suburbs, especially in relatively distant communities with marquee school districts and attractive town centers like Frisco, Allen, and McKinney. Migrants from New York and Mexico, by contrast, disproportionately settle in the city of Dallas proper.

Contrary to the widespread view that well-educated Millennials prefer living in densely populated enclaves in the central city, a variety of national, as well as local studies, have shown that Millennials turn out to have conventional housing preferences once they get older and particularly when they have children. So, a large and growing share of them live and work relatively far from central business districts. This plays to DFW’s strengths as a polycentric region. While urban areas such as the central core of Dallas, particularly its Uptown area, have thrived, many other nodes have too. This pattern of distributed geography has almost surely helped to keep housing and other urban costs lower than they would otherwise be given the metro area’s size and productivity, since proximity to the CBD or other employment centers is inherently less critical than it is in more traditional “monocentric” metro areas. It also provides a variety of different environments catering to diverse residential preferences.

Dallas-Ft. Worth vs. Chicago

Dallas-Ft. Worth and Chicago, America’s largest two interior metro areas, make an interesting comparison. In some respects, they are very similar: diversified economies; major hub airports and important transportation infrastructure; very diverse populations in a statistical dead heat in their foreign-born population share (DFW at 17.9 percent and Chicago at 17.6 percent).

But, in other ways, they present an especially stark contrast to one another. Chicago has a dense CBD with numerous corporate head offices and real estate costs far above DFW levels. The metro area’s employment base disproportionately consists of senior management people and professionals who work closely with them in fields like marketing and law. On the other hand, Chicago is severely under-represented in many of the medium-skilled but well-paid occupations which figure most prominently in DFW, like credit analysts, insurance appraisers, systems analysts, database administrators, and other “back-office” jobs. Chicago has recently scored just ahead of DFW in attracting corporate relocations, but, according to Chicago press coverage, the typical relocation has often amounted to moving the head office into the CBD with (say) 300 employees. By contrast, typical corporate expansions in the DFW area – such as recent moves by Toyota, State Farm, and Liberty Mutual – have generally consisted of building major headquarters or back-office centers in DFW’s northern suburbs and creating more than 1,000 jobs.

The net result is that while Chicago’s CBD and select suburbs are performing well, the DFW region is far outpacing the Chicago area in growth. DFW’s job growth from 2000 to 2015 was 21.1 percent, compared with Chicagoland’s 0.4 percent. In the professional and business services sector in which both cities specialize, DFW ranked as the 5th best of the top 40 metros as a place to do business according to a 2016 New Geography survey, while Chicago ranked 27th. DFW’s ranking improved since the previous survey, while Chicago’s declined.

Since 2000, the DFW metro area’s population has grown 35 percent, compared to 5 percent growth in the Chicago area. And from 2000 to 2014, Dallas per capita incomes increased by 45.8 percent, compared to 41.6 percent in Chicago.

What’s more, the urban core of Dallas has also seen something of a development boom of its own. While it’s not as large as Chicago’s Loop, areas like Uptown provide an urban environment for those who prefer it. And they do so within an overall region that is both affordable and thriving economically.

Public policy has also played an important role in containing urban costs in DFW. Based on a new index developed by Dean Stansel of SMU’s Cox School of Business which focuses on government spending, taxes, and labor market regulation, the DFW metro area ranks fourth among the top 40 cities in “economic freedom,” behind only Tampa, Jacksonville, and Nashville – all growing cities – but far ahead of all the largest coastal cities. Relatively low taxes have not imposed any evident cost on DFW’s public finances. Although bond rating agencies downgraded the city of Dallas in 2015 due to its underfunded pension liabilities (a challenge bedeviling many American cities), Dallas and its surrounding towns enjoy better credit ratings than all but a handful of U.S. cities.

Critics of Texas urban growth argue that a low tax burden has an undesirable flip side, in the form of heightened poverty rates, inequality, and poor education systems. It is true that DFW has a large pocket of entrenched poverty in the southern sector of the city of Dallas and in several largely African-American suburbs to the south. That said, income inequality in DFW as measured by the so-called “Gini coefficient” was exactly in line with the average for the top 40 metro areas in 2013. DFW’s inequality index was well below that of Chicago, New York, and Los Angeles, as well as several cities that are slightly smaller than DFW like Atlanta, Boston, and Philadelphia. Income inequality has increased in virtually all U.S. cities this century, but it has grown at a less-than-average rate in DFW and a greater-than-average rate in the big coastal metro areas.

A prominent recent study of the American middle class by the Pew Research Center arrived at a similar result. According to the Pew study, the “middle class” share of the population declined between 2000 and 2014 in all of America’s 40 largest metro areas, but it declined less in DFW than in most metro areas. In absolute terms, the middle-class population share in DFW was slightly below the Top 40 average in 2014, but considerably higher than in New York, Boston, Washington, Los Angeles, or San Francisco.

As for education, the city of Dallas school district performs moderately below average among the Top 40, though roughly in line with Chicago and ahead of several high-tax cities like Baltimore and Cleveland, according to the “Mayors’ Report Card on Education.” Districts in northern suburbs like Plano perform much better, though not quite as well as comparable districts in some of the “best-educated” metro areas, in towns like Northbrook/Glenview (outside Chicago), Weston (outside Boston), or Cupertino (outside San Francisco). Poorly performing school systems undoubtedly constitute a major challenge for the DFW area as they do for all large U.S. cities, but the evidence does not suggest that DFW has so far suffered from either unusually poor public services or unusually high inequality as a result of its relatively low tax rates. Still, the increasing importance of human capital in the success of the world’s leading cities suggests that improving education is essential to ensure DFW’s future growth.

In addition to tax policy, relatively unrestrictive land use regulations have played a crucial role in containing urban costs as DFW and other Texas cities have grown. Wendell Cox of Demographia has demonstrated a close relationship between land use policies and housing affordability across cities in the U.S. and other countries. Based on an index of land use regulation published by the Wharton School of Business, DFW has the fifth most relaxed regulatory environment among the top 40 cities.

Meanwhile, studies by urban economists show that a number of the largest coastal cities have tightened already-restrictive land regulations further in recent years. Such policies have driven up housing prices and caused a decline in migration to these cities, which has resulted in increased “sorting” because the highest-skilled young people can justify living in cities like New York and San Francisco but medium-skilled people, or those without access to family funds, cannot.

To some, the big coastal cities are inadvertently turning themselves into de facto gated communities for the very rich and the people who take care of their various needs. Jason Furman of President Obama’s Council of Economic Advisors has started to criticize the tight land use regulations increasingly pursued by many local governments along similar lines, saying that “excessive or unnecessary land use or zoning regulations” can give “exceptional returns to entrenched interests at the expense of everyone else.” DFW is attracting people, but it’s also benefiting as coastal cities repel them.

Sustaining the Middle Class Dream

Summing up, the rapid growth of the DFW area since 2000 is closely connected with pervasive changes in the whole system of U.S. cities. American cities have grown more industrially diverse, but also further specialized in terms of the kinds of people who gravitate to them. Large, high-density cities foster greater innovation and productivity growth than other places, but many of the densest, most productive cities are increasingly unaffordable for all but the most highly skilled. DFW, on the other hand, presents a broader spectrum of people a winning package – moderately higher wages than they can make in most other interior cities, a diverse range of growing industries, and drastically lower urban costs than what people face in the major coastal cities. Like other Texas cities, DFW attracts enterprises aiming to run competitive, labor-intensive operations in a business-friendly environment, and families striving to attain a middle-class lifestyle with a medium-sized paycheck. DFW has grown as fast as it has because the middle-class “American Dream” is alive and well there, at least relative to most other large cities.

Looking to the future, this analysis highlights several significant challenges to the DFW growth model. The metro area’s luck might change, if, for instance, increased automation or offshoring reverses the growth of the last couple decades in the kinds of back-office operations in which DFW currently excels. Education and workforce readiness issues might start to constrain the city’s growth. Most important, the divergence in urban costs across metro areas which so shaped the landscape of American cities during the first decade of this century has given way to mild convergence, as housing and other urban costs in high-growth cities like DFW and Austin have begun to spiral upwards as fast as in the large coastal cities, and even faster in some comparisons. And, substantial gaps are opening up between DFW and cheaper interior cities like Kansas City and Columbus in terms of the costs of living and doing business, raising the possibility that a new wave of cities which don’t yet receive much attention may step up as serious challengers.

These issues point to larger questions for the region. The breakneck growth of the DFW area is, after all, an experiment, testing whether a city so geographically dispersed, so polycentric, and so automobile-dependent can grow from 7 to 10 million people without generating unmanageable increases in congestion and other urban costs. Some suggest that increased residential density might mitigate some of these costs, and indeed DFW is experimenting with increased density in the Uptown area and even in suburban Plano. However, the literature on urban economics suggests that large migration from one city to another is likely to reduce urban costs in the former city and raise them in the latter to the point at which net migration stops. It is impossible to tell how close the system of U.S. cities is to this point.

The other big question for DFW, usually unvoiced, is whether growing to 10 million is a good thing. If doing so means following in the footsteps of the largest cities in the Northeast and on the West Coast, Dallasites may start to have their doubts. But this would be a problem of success. Managing such rapid growth in jobs and population is a challenge most other regions would dearly love to have.

Klaus Desmet is the Altshuler Centennial Interdisciplinary Professor of Cities, Regions and Globalization at Southern Methodist University and a Research Fellow at the Centre for Economic Policy Research in London. He holds an MSc in Business and Engineering from the Université catholique de Louvain and a PhD in Economics from Stanford University. He previously was professor at Universidad Carlos III de Madrid. His research focuses on regional economics, urban economics, international trade, and economic growth. He has published in leading academic journals such as the American Economic Review, the Journal of Political Economy and the Journal of Development Economics, and his work has been covered by the BBC, The Economist and The Times.

Cullum Clark is the President of Prothro Clark Company, a Dallas family investment firm, and is also a doctoral student in the Economics Department at SMU. At Prothro Clark Company, Cullum oversees an investment program comprising public equities, bonds, real estate, hedge funds, private equity, and venture capital. His research in economics focuses on monetary policy, financial economics, economic history, and economic geography.

Top photo by: fcn80 (http://www.flickr.com/photos/fcn80/105065297/) [CC BY-SA 2.0], via Wikimedia Commons

Houston, City of Opportunity

$
0
0

This essay is part of a new report from the Center for Opportunity Urbanism titled "The Texas Way of Urbanism". Download the entire report here.

Creative friction – unchaperoned and unprescribed – is Houston’s secret sauce.

At a time when Americans’ confidence in all major U.S. institutions – minus the military and small business – has sunk below the historic average, and only about 20 percent of Americans say they spend time with their neighbors, one would expect pessimism to be universal. But come to the concrete sprawl just north of the Gulf and you’ll find a different vibe, one that other cities would do well to emulate.

Of course things aren’t perfect in Houston, and the region is taking it a bit on the chin due to the drop in oil prices. But look over the mid- and long-term and the place has consistently lured people from around the country and the world.

People continue to move to the flat and humid city in higher numbers than any other metropolis. According to the United States Census Bureau, from 2014-2015 metro Houston attracted 159,083 total and 62,000 net domestic migrants, topping the Census list on new metro area residents. Critically, the newcomers represent those population groups most telling of a metro’s future: millennials, immigrants, and families.

“The American Dream is still alive here,” say those migrants, one after another. 81 percent of Houston residents rate the city as a good or excellent place to live, according to the 2016 Kinder Houston Area Survey. That’s up from 70 percent a decade ago. And despite the recent economic slowdown, 62 percent of Houston-area residents rated the local economy as “excellent” or “good.”

Even the most conventional of popular figures have begun to figure this out. “Houston will surprise you,” wrote Katie Couric when she stopped here on a nationwide tour of up-and-coming cities. It was a more iconic statement than perhaps she realized. Outsiders often misperceive Houston as politically conservative and totally dependent upon the energy business, but the city consistently busts internal expectations, too. In Houston, you don’t have to drive far to run into unexpected languages, unexpected restaurants, a huge informal economy and just a pervasive – and bracing – sense of random.

“It’s a cat city,” says Bill Arning, director of Houston’s celebrated Contemporary Arts Museum. He moved here in 2009 from Boston. “If you arrive without a tour guide, without a friend who knows the city, it’s hard to figure out where things are. There are no landmarks. Whereas Austin is a dog city – you know where the beautiful people are – Houston is a cat city. Its charms are there, but you’ve got to come to it. You’ve got to take a little time.”

What sets Houston apart? What about the city makes so many residents confident they will find their version of the American dream here? If it is indeed a city of opportunity, what lessons might other cities absorb and weave into their own policies and cultural fabric? Through many interviews, data sleuthing and the everyday experience of living here, I found five traits that define Houston: affordable proximity, multipolarity, social deregulation, an active future orientation, and humility. What follows is a tour of the city that knows no limits.

Affordable Proximity

“There’s always been a haphazard nature to the city, from the beginning,” says Sanford Criner, a native Houstonian as well as vice chairman at CBRE, the world’s largest real estate firm. “Where Chicago – which was founded the same year [1836] – had an economic reason for being the day it was founded, Houston was a real estate play. These guys came down from the northeast – New York, Pennsylvania – and they bought some land and sent out flyers.

“I’ve seen some [of the flyers], and they’re hysterical,” Criner continues. “‘Salubrious environment!’ said one. ‘Well-watered!’ said another. They’d have this picture that looks like a little Swiss valley, with chalets up the hill, and there wasn’t a house here! It was a scam. But that’s how we now date the founding of our city.”

Where others saw only wilderness along the banks of Buffalo Bayou, Augustus Chapman Allen and John Kirby Allen saw promise, and convinced people to take a gamble and move. This rambunctious “come one, come all” attitude continues to define the city’s development, 180 years later.

The city of Houston is famous for its no zoning policies, the fruits of which are visible in the hodge-podge of commercial and residential hubs evident on a first drive in from one of the two airports. The apparent haphazardness may dizzy outsiders, but for Houston residents it’s a gift that my colleague Tory Gattis calls “affordable proximity”: the ability to live near one’s place of employment while keeping the cost of living affordable. It’s a challenge that has become onerous in many cities, but one that Houston manages to tackle with surprising efficiency.

“It’s definitely true that it’s easier to build things here than elsewhere,” says Criner. “We’ve been able to build things relatively inexpensively and rapidly that have generally benefited everybody.”

Since 2010, Houston has expanded its housing stock to issue construction permits for 189,634 new units, paralleling the population growth. This is in sharp contrast to competitor cities such as New York, Los Angeles, Chicago and the Bay Area, where construction tends to lag behind population.

Houston is uniquely able to create housing to meet demand. The populations in both New York City and Houston have grown significantly in the past six years, but New York, like many big cities, has not come close to meeting demand. A lot of this has to do with sheer land availability and willingness to expand outward, but Houston’s light regulatory touch has crucially allowed developers to be in sync with consumer need and preference, without the red tape that slows other cities’ building and adaptability. A key result has been a greater level of affordability, and of choice.

In April of 2016, The Wall Street Journal highlighted groundbreaking research by Issi Romem, chief economist at real-estate site BuildZoom, showing that the cities that have expanded geographically have kept their house prices more affordable.

According to the National Association of Home Builders/Wells Fargo Bank Housing Affordability Index, more than 60 percent of homes in the Houston metro area are now considered affordable for median-income families, compared with only 15 percent in Los Angeles, once ground zero for the dream of homeownership. According to Zillow, renters in New York spent 41.4 percent of their income on housing in 2015, whereas the share for their Houston counterparts was just 31 percent.

The Demographia International Housing Affordability Survey provides ratings for all major metropolitan areas in the U.S., and Houston consistently ranks as more affordable than cities like Portland, New York, San Francisco and San Jose, all of which have more restrictive regulations.

Houston’s housing is also diverse. Houston has become the national leader in new multifamily units, helping to preserve and expand access to urban living. At the same time, the Houston metro has led the country in new single-family houses.

Availability of affordable land and a lighter regulatory environment allowing for outward expansion has made it possible for many to afford a residence near the city’s dispersed job centers. In addition, as City Observatory recently reported, a series of reforms adopted in 1999 shrunk the required residential lot size from 5,000 square feet to 1,400 square feet, enabling town home development in high demand areas proximate to jobs.

Proximity to work is especially appealing to millennials, who have moved to Houston in droves. The U.S. Census Bureau showed a 25 percent increase in millennial residents between 2000 and 2013, with millennials currently making up 24 percent of Houston’s total population. Many of these new adults want to reduce their commutes, or even ditch their cars for the sake of enjoying a more seamless transition between professional and personal life. Houston offers this possibility across urban and suburban areas, the multipolarity of business centers providing flexibility to carve a nice triad of work, residence, and play.

Despite the impression of endless freeways, Houston’s commute times are better than those in metros of comparable populations. One-way commutes were 28.4 minutes in 2014, according to the American Community Survey, making Houston the fourth best out of nine comparable cities.

Houston also does very well on an international scale with respect to traffic congestion, according to TomTom in 2015. The region ranked fifth out of the 38 urban areas that have populations over 5 million.

None of this suggests Houston lacks room for improvement in mobility, but it’s credit to the city’s decision to dramatically increase roadway capacity and arterial streets that it has managed to improve its ranking in traffic congestion while experiencing a huge increase in population. According to the Texas A&M Transportation Institute, in 1984 and 1985 Houston was ranked with the worst congestion in the country, even worse than Los Angeles. Now Houston is ranked 10th, even as it’s nearly doubled its population, from 3.5 million in the mid-1980s to 6.5 million today. Only Atlanta and Dallas can boast similar mobility improvements.

Multipolarity and Economic Diversity

Most Americans think of Houston as an oil and gas town. And while energy still undergirds much of the city’s economy, Houston boasts many other assets as well: the world’s largest medical center, one of the world’s busiest ports, the third largest manufacturing hub in the country, a booming technology sector and a wide range of small to medium-sized businesses, including a thriving informal sector of immigrant-run businesses. This has led to demand for labor at all skill and education levels, unique among the top ten largest cities.

“Best Online Programs in 2016,” said U.S. News & World Report about the University of Houston. “Top Cities for Competitiveness to Attract Investment in Chemicals & Plastics,” said Conway about Houston in 2015. “Best Hospitals for Adult Cancer – University of Texas MD Anderson Cancer Center” said U.S. News & World Report in 2015. “Top Blue-Collar Hot Spots,” said Forbes in 2014. “Most Favorable Metro for STEM Workers [Nationally],” said WalletHub in 2015.

Houston is no stranger to “Best Of” lists that today’s mayors scour. But what’s notable is the cross-sector nature of the superlatives. According to a June 2016 report from the Texas Workforce Commission, 20.3 percent of Houston’s workers are in Trade, Transportation and Utilities, 15.5 percent are in Professional and Business Services, 12.8 percent in Government, 12.7 percent in Education and Health Services, 10.2 percent in Leisure and Hospitality, 8 percent in Manufacturing and 7.4 percent in Construction.

The city has learned from its mistakes. The 1980s, which saw a slump in oil prices much greater than that in 2015, bulged in profligate building and overconfidence. According to the Greater Houston Partnership, from 1982 to 1986, developers built more than 100,000 single-family homes, many of them without a signed contract from a purchaser. Even when the region lost more than 200,000 jobs, office developers continued to build, including adding more than 71.7 million square feet of office space while companies were laying off staff and declaring bankruptcy. Today, the office market is tighter, banking is better regulated and better capitalized, and few homes are built without a signed contract. Most importantly, the region is creating jobs that aren’t in energy, including in health care, business and professional services.

Social Openness: A City for Everyone

Houston is deregulated economically, but it’s of greater note that it’s deregulated socially. People come here from many walks of life and culture, and the relative youth of the city combined with its scrappy DNA means that there really isn’t a dominant Establishment, certainly not one that wants to block the efforts of ambitious newcomers.

“If you talk to [old] Houstonians about social mobility,” says Sanford Criner, “they kind of give you this quizzical look. Like, ‘what do you mean?’ Like, ‘Sure, of course.’ It seems obvious.”

This city’s always been a mixer; you just have to be willing to share what wakes you up in the morning. Marlon Hall is an African American filmmaker and native Houstonian who started Folklore Films, a documentary production company created to “tell better stories to our city about our city.” He and fellow filmmaker Danielle Fanfair have featured former Mayor Annise Parker, arts patron Judy Nyquist, internationally recognized musical artist DJ Sun and other community figures. As the Folklore Films crew has gotten better acquainted with Houston residents from across the social spectrum, Marlon locates the vocational “why” as central to the city’s currency.

“Houston isn’t driven by who you know,” he says, “but by how you want to be known. It isn’t about what pedigree you have received, but about the possibilities you want to bring to bear.”

This kind of invitation has attracted the motivated from all over the world, with the city now pulsating with 145 languages. An international city since the day it was founded, now more than one in five Houstonians are foreign-born, with the 2014 American Community Survey reporting that 63.9 percent of the foreign born population were Latin Americans, 25.2 percent were Asian, 5.1 percent were African and 4.6 percent were European. As of the 2010 Census, Greater Houston does not have a majority racial or ethnic group.

People come to Houston seeking opportunity, and because they sense in the visible randomness the potential for surprise ingredients to leaven the traditions they’re bringing with them. This is as true for immigrants as well as domestic migrants, with the city’s celebrated restaurant scene born out of the unexpected merging of flavors from cultures that don’t typically mix. Underbelly’s Chris Shepherd, Bistro Menil’s Greg Martin and Lucille’s Chris Williams all cite Houston’s diversity as a major factor behind the city’s flavorful palate, in both story and succulence.

“This is edible history,” says Chris Williams, the founding chef at Lucille’s, a restaurant that takes a modern approach to Southern classics. “The food that we do here pays homage to my great-grandmother, who was a chef and a pioneer and an American icon.”

It’s not soul food, but Southern. With a rustic European style, and a multi-generational American story at the heart.

“Like all chefs in [my great-grandmother’s] time, your style of food was defined by what was available to you. What you could afford to work with. The flavors that I grew up with…married with the techniques and the flair that I picked up working in Europe for four years. Everywhere from London to Lithuania. …I’m influenced by the simple rustic dishes – the ones about the culture, not the flashy ones. The perfect piece of fish fresh caught, served with good potatoes, great olive oil, fresh garlic, and a little bit of parsley.”

Bistro Menil is another spot that takes a slice from Europe and re-interprets the classic dishes for Houstonians. Its patrons come from Rice University, the Medical Center, the Museum District and beyond, the attraction of the world-renowned Menil Collection standing just across the street. Inspired by the concept of cask wine, which head chef Greg Martin discovered on a trip to Rome, Bistro Menil relies heavily on relationships with cosmopolitan – yet locally centered – Houstonians.

“I don’t want to compete with that dish that you had in Rome,” Martin says, aware of ingredient limits this side of the Atlantic. “I want to reinterpret it with more of a New American approach, with some fresh eyes on our market, using our ingredients. Our ingredients and produce come from everywhere…I work really closely with a local importer. We’ve been working together for 30 years. He brings in our duck legs from Canada, our jamón Serrano from Spain. He brings all of our cheese in from France, Italy and Spain.”

It’s not just the food that shows Houstonians willing to work together across silos and lift up the local talent. “We have a very supportive gallery scene,” says Bill Arning, of the Contemporary Arts Museum. “Even the galleries that show a lot of major international and national artists, like the Texas Gallery and McClain Gallery, will not only show local artists, they’ll place them in the top collections in town. That’s unusual.”

The social egalitarianism combined with a pervasive “show me what you got” curiosity creates something very unique. Hipster cocktail bars seem no more privileged than authentic Vietnamese restaurants than classic barbecue and the iconic Rodeo. The lack of zoning makes thoroughfares like Westheimer Road, which stretches for miles from the city center to the distant suburbs, an avenue of cultural mismatches: The New York Times’-celebrated Underbelly is sandwiched between three tattoo parlors, a Catholic guild clothing store and the latest in coffee-roasted curation. There are so many opportunities to mix with those different from you that only the snobby find themselves bored and excluded. Creative friction – unchaperoned and unprescribed – is Houston’s secret sauce.

“This is a city that does not believe in censorship,” says Arning.

Agile, Active, and Future-Orientated

Houston is not Silicon Valley, but its entrepreneurial DNA is unmistakable, dispersed across many fields. The city emanates a conviction that people should have the freedom to determine their destiny, sometimes to the point of overlooking those that don’t have such clear vision, nor the resources and social networks to make it happen. The city is growth- and future-oriented, embracing change and risk. True to its namesake in Sam Houston – himself a failure before reinventing himself – Houston grants permission to fall hard.

“Houston is the only town where a person with no prior experience in a particular vocation can get joint venture capital for something they’ve never done before,” says local arts patron Judy Nyquist in one of Marlon’s Folklore Films. “Simply by virtue of their commitment to their idea, and how it can make the city better.”

This is true across sectors – for-profit, social service, and philanthropic.

Ella Russell of E-dub-a-licious Treats was an African American single mom working for AT&T when a breakup with her partner caused significant financial hardship. Her two boys, then age 3 and 9, came home from school asking to bring in treats for a holiday party. Russell felt helpless, all disposable income had run dry. But she did find sugar, flour and eggs in her pantry.

“I scraped up change to buy a bag of chocolate chips,” Russell recalls, “so I could make chocolate chip cookies. The kids took them in, and then I brought the leftovers in to work. My coworkers loved them, saying every future potluck would have to have my cookies.”

Three years later, her friends urged Russell to turn the sweetness into a business.

“I had no business experience other than what I knew working in corporate America,” Russell says. “I really winged it; I had no basis but the support of my friends.” In a couple years, she went from serving family and friends to delivering in seven different states.

In the burgeoning scholarship entrepreneurship of the last decade, the work of Saras D. Sarasvathy of the Darden Business School at the University of Virginia stands out. She’s coined a term called “effectual reasoning” to describe the mindsets of master entrepreneurs, one that pairs well with Houston’s soil:

Brilliant improvisers, the entrepreneurs don’t start out with concrete goals. Instead, they constantly assess how to use their personal strengths and whatever resources they have at hand to develop goals on the fly, while creatively reacting to contingencies. By contrast, [highly successful] corporate executives use causal reasoning. They set a goal and diligently seek the best ways to achieve it.

Sarasvathy likes to compare expert entrepreneurs to Iron Chefs: “[They are] at their best when presented with an assortment of motley ingredients and challenged to whip up whatever dish expediency and imagination suggest,” she writes. “Corporate leaders, by contrast, decide they are going to make Swedish meatballs. They then proceed to shop, measure, mix, and cook Swedish meatballs in the most efficient, cost-effective manner possible.”

If we could take her comparative study and extrapolate from it particular civic traits, you might see Chicago as the sort of personality for corporate leaders, Houston for the entrepreneurial. The city is rife with improvisers, fueled by a deep prioritization of human relationships, an affection for eccentrics and a perennial optimism that loves to build before over-planning. The fact that there are lots of open spaces to create, and fill, encourages new entrants into any kind of market, be it technological, artistic, or consumption-oriented.

This goes well beyond profit-seeking ventures. The Chronicle of Philanthropy identifies Houston as one of the country’s most generous cities, ranking at #11 for giving as a percentage of adjusted gross income – three stops behind Dallas.

“As [Dallas-Fort Worth and Houston] have each become centers of gushing economic production, and matured as communities, an energetic competition has grown up in their creation of impressive new parks, museums, hospitals, universities, and arts centers,” wrote Ari Schulman in the Fall 2015 issue of Philanthropy Magazine. “Burgeoning circles of local patriots wielding newly minted fortunes have dramatically changed the quality of life in both cities over the past decade or so.”

This enhanced quality of life has involved a deeper renaissance in the arts, a proliferation in family-friendly green spaces, advancements in medical facilities and, increasingly, innovative educational ventures. Houston’s acclaimed Museum of Fine Arts is currently undergoing a $450 million redesign, two-thirds of that already raised with the help of giant gifts from pipeline entrepreneur Richard Kinder and money-manager Fayez Sarofim. Kinder and his wife Nancy have also given $30 million to a public-private partnership aimed at reviving a snaking bayou from a stagnant waterway to an attractive waterfront graced by 20 miles of hike-and-bike trails, canoe launches, playgrounds, art installations, and outdoor performance venues.

“This kind of public-private partnership happens all the time,” says Criner. “In lots of other cities, philanthropic organizations tend to be run by the same group of guys that have been running stuff for a long time, and they treat them like their own turf. You don’t see that here at all. This is way more like, “if you can help, come on! What can you do? We’ll put you to work.”

“We have a tradition of philanthropy that my colleagues in other cities [envy],” agrees Arning, of the Contemporary Arts Museum. “Privileged young people here feel they need to find their philanthropies early on. That is something uniquely Houston.”

Humility and Cultural Accessibility

Long considered the unattractive hothouse of the south, Houston has suffered from a long-running inferiority complex when comparing itself to other cities. Even since rising to the top of dozens of “Best of” lists in the last five years, the residue from generations of modesty remains.

Before Marlon Hall was running Folklore Films, he and Danielle began something called the Eat Gallery, an incubator for budding chefs around the city that sought to turn food trucks into restaurants. In ramping up for this effort, they went around and asked Houstonians questions about where they found meaning, where they felt they fit, where they felt they made a difference. They discovered that people had low city esteem.

“They’d go to a great ballet, and they’d be like, wow, this reminds me of Chicago, Hall recalls. “They’d go to a musical performance and be like, oh, this feels like New York. People were telling the worst stories to the city about the city.

“So we said, what if we told better stories to Houstonians about Houstonians, featuring people that folks know and celebrate? But what if we began their stories with their brokenness, so that people would know that there’s something inherently broken about every beautiful person? So that’s what we did, that’s why we started Folklore Films. To raise the city esteem.”

Folklore discovered that Houston is a city of new beginnings. When you move here, the past intrigues less than how you intend to exploit the future. Whether you’re an immigrant from overseas or a fellow American that’s left some entrenched failure behind, Houston pulses with a forward-looking frankness grounded in a humility shaped by whatever came before. This drive paired with an individual and corporate self-awareness defines the city’s character – culturally, spiritually and even economically.

“There’s this at-homeness that people from Houston have,” Hall says. “When I think about people who have left Houston to do other things, like Beyonce, there’s this comfort to be who one is. She walks around with hot sauce in her purse – I mean, who else can say that from where else?”

“There’s something about Houston that’s like…I’m not afraid to be who I am, even if it’s full of seeming contradictions.”

“The collective body in Houston is significantly more adventurous than most cities,” Arning of the Contemporary Arts Museum says. “Both in use and collection. In most collection cities, you hear who supported or recommended the collection before going. Houstonians, because of their wildcat nature, [will try anything] they like.”

Houston’s increasing diversity keeps the city vibrant and ever ready to accept change and innovation. There is no room for insularity because there is no homogeneity. Your ideas are constantly being chiseled and countered by the Other. No one has the luxury of feeling superior because everyone’s in a gem tumbler with folks not like them. It makes the city competitive, but not in a way that produces monopolies.

“I think that Houston has come to this place where it’s a ‘My Space,’” says Marlon. People want to take ownership of their lives and creations here. “There’s a desire to own who you are in Houston, which is different from owning a business, a house a car.”

Houston residents tend to be proud of their individual accomplishments, and feel an affection toward the place that allowed those accomplishments to happen. But there’s a recognition that success is the result of many different pieces coming together, usually organically and iteratively. The environment invites people to fulfill their individual destiny, and almost discourages any person or governing body to take credit for Houston’s successes as a whole.

“I hesitate to say things like ‘I’m proud of Houston,’” Sanford Criner says. “What gives you the right to take pride in a place? Did you build it? Did you do it?”

Challenges to Sustaining Opportunity

Houston continues to beat the odds to this day. And while its adventurous impulse is what continues to draw people to Houston and make it the emblem opportunity city for 21st century dynamics and demographics, it must still be said that what you put into the world must survive. Houston is a much better place to live than it was 30 years ago. But will it continue on this trajectory, or even sustain the fruits of its triumphs?

Houstonians recognize there needs to be a concerted effort to reform and improve Houston’s educational opportunities, its transportation and traffic infrastructure, and a more general care to respect tradition and an intensive effort toward more inclusive mobility. The city’s grown so big, so fast, it could inevitably buckle under its own weight.

“We are not on track to make headway on a lot of the issues that are facing us,” says James Llamas, of Traffic Engineers, Inc. “We’re growing way faster than we’re adding transportation capacity or options, at the same time there does seem to be recognition that we need to do something and what we’ve been doing isn’t going to continue to work.”

Despite precedent, massive infrastructure may not be the answer, especially given the shifting preferences of a younger population and the costs of maintenance. New mayor Sylvester Turner is considering expanding to two HOV lanes and providing express bus service. Others advocate for densification of the more traditional gridded neighborhoods that are far from holding their population capacity – but without adding infrastructure, and without pushing anyone out.

And then there’s the perennial education challenges.

“We are now in a different economy where education is critical,” says Stephen Klineberg, founding director of the Kinder Institute. “It never used to be critical, especially not in Texas. You made money by land – by exploiting all the natural resources you needed on the land. The great cattle, timber, oil. The source of wealth in the 21st century Houston, is knowledge. …If you don’t have education beyond high school, with the technical skills that allow you to get the jobs of the 21st century, and compete, you’re not going to make it. Texas hasn’t come fully to grips with it.”

Conclusion

In the last 20 years, Houston has cultivated a series of signaling mechanisms that continue to draw people into its orbit. It’s a welcoming city, supported by affordability and diversity. Majority opinion says “anything is possible if you’re willing to work hard,” a conviction increasingly on the decline in the rest of the country. And, crucially, it’s cultivated the conditions necessary for entrepreneurs to have a field day. “The assortment of motley ingredients” noted by innovation scholar Sarasvathy describes Houston in a nutshell, and the regulatory instinct has been to stay light, allowing imported imaginations to run experiments without interference.

The city’s not beautiful upon first blush, nor does it offer the charm of pedestrian fancy that denser cities boast. But in an era of civic unrest, with many up and down the social spectrum feeling disconnected and robbed of agency, Houstonians can still shape their destiny. The city’s the clay; residents the potters. The wide range of home sizes and work-life arrangements makes Houston like the cowboy boot its Rodeo celebrates – adaptable to the needs of each life stage as residents progress through singleness, marriage, family and retirement. Residents are not trapped by the regulatory, financial or even social limits that other cities increasingly impose. The mindset is one of abundance, not scarcity.

“This is the genius of this place,” wrote Cort McMurray in the Houston Chronicle in January of 2016, in a profile of an Iraqi refugee who had come to Houston with a B.S. in Chemistry, currently cleaning pools. “Houston will always be shambolic and stretched and not quite finished. We will never be the most beautiful city, or the most pedestrian-friendly city, or the most efficiently planned city: The heat and soul-sapping humidity, our adolescent fascination with cars and speed and shiny things, our perpetual craving for something new, all conspire against our best civic aspirations. Houston is a place to start over, and we do starting over better than any other city on the planet.”

In an age of heightened political frustration, a sclerotic economy and shifting structural tectonics, it could be that the “starting over” ethos that Houston embodies is precisely what the country itself needs, and what other cities should seek to foster in their own policies and cultural climates. Innovation, reinvention and reinterpretation, after all, lie at the heart of the American genius.

Anne Snyder is a Fellow at the Center for Opportunity Urbanism, a Houston-based think tank that explores how cities can drive opportunity and social mobility for the bulk of their citizens. She is also the Director of The Character Initiative at The Philanthropy Roundtable, a pilot program that seeks to help foundations and wealth creators around the country advance character formation through their giving. She previously worked at The New York Times in Washington, as well as World Affairs Journal and the Ethics and Public Policy Center. She holds a Master’s degree in journalism from Georgetown University and a B.A. in philosophy and international relations from Wheaton College (IL), and has published in The Atlantic MonthlyNational JournalThe Washington PostCity Journal and elsewhere.

Top photo: Photo by Chris Doelle, Licensed under CC License.

Opportunity Urbanism: The Tech Edition

$
0
0

This essay is part of a new report from the Center for Opportunity Urbanism titled "The Texas Way of Urbanism". Download the entire report here.

Any observer of urbanism in America knows that Austin tops numerous rankings of urban dynamism. Austin --- defined as a metropolitan area, not just the city --- is consistently atop Forbes’ annual list of Best Cities for Jobs in America over the past five years, which is why so many people move there in the first place.

In other surveys Austin has been ranked the number one city for young entrepreneurs, small businesses, jobs, millennial homebuyers, singles, dog owners, and food trucks. Its central downtown ZIP code has more bars per capita than any other ZIP code in the country by a long shot. Last year, Savills ranked Austin over San Francisco as the nation’s best technology city, and college information aggregator Niche ranked the University of Texas, situated on the north end of downtown, as the top public university in America. And, of course, Austin has long claimed the title of “live music capital of the world.”

No surprise then that a visitor to a gathering of technology entrepreneurs in any mid-size to large American city will hear someone talking about how we need to be more like Austin. And Austin is indeed a success story, but one that on examination does not look exactly how outsiders may expect.

Our conclusion here is that although Austin’s urban vibe is critical, its success has more to do with some distinctly Texan features, including development on the periphery, low taxes, affordable housing (particularly in comparison with coastal California) and less stringent regulation. It is the culture of opportunity, as much as anything else, that defines the Texas capital, and makes it so distinct from its other “hip and cool” rivals.

The New Dynamism

When George W. Bush was watching the 2000 presidential election results from the governor’s residence in Austin, Texas, he was sitting in a city of 1.2 million people. Since then, Austin has grown 60 percent to over 2 million residents. Only Raleigh, NC, has come close to matching that rate of growth over 15 years. Austin and Raleigh are 20 percentage points ahead of fifth place Houston. Perhaps most remarkable, however, is Austin’s growth since 2010, the worst financial meltdown since the Great Depression. The city grew by 16.6 percent, while Raleigh grew 12.7 percent. Austin has largely defied gravity since the economic collapse.

Among the nation’s 53 metro areas with populations over 1 million, the fifteen that have experienced double-digit growth since 2000 are all located in the south and west, including Texas’s four largest metros. And of the top 25 fastest-growing cities since 2010, the only city not in the south, west, or northwest is Columbus, Ohio, in 24th position. Columbus is the only city east of the Mississippi River and north of the Mason-Dixon line growing at a rate above six percent.

Weather is a factor but America’s fast-growing cities attract aspiring workers and business owners through a blend of favorable economic conditions, new infrastructure, and increasingly, proximity to talent. Political sclerosis and economic elitism in coastal and northern cities have served as a helping hand, pushing workers away from a toxic blend of rising expenses and falling quality of life. Using a mix of Census data, cross-metro moving requests on moving.com, and cross-metro searches on realtor.com, a recent Realtors study found New York, Chicago, San Jose, and Los Angeles are among the top five cities losing the most domestic migrants to mostly smaller, newer Sun Belt cities. In the same study the top ten gainers are Sun Belt cities, with the exception of Portland, Oregon, all who offer newer, more affordable housing stock than in the prime metro areas of New York, Illinois, and California.

Arguably no city in the country has taken advantage of these conditions more than Austin. Since 2009, the low point of the Great Recession, its metro area GDP has grown 31 percent. By comparison, San Francisco and Boston each grew by 13 percent during the same period. The national average for U.S. metro areas was 11 percent.

Demographically, domestic migration drives Austin’s economy. Austin has had to innovate and import a lot of talent. Austin has become a quintessential knowledge economy that thrives not so much by cultivating natural and historical resources, but by absorbing ideas, innovation and talent from elsewhere and selling them as products back to the world.

Anyone who has spent any time in Austin understands the tension that exists in the city between the defenders of its erstwhile charm as an unconventional music and college town and boosters of its high-growth technology cosmopolitanism. Whatever the community’s gatekeepers contend, however, Austinites themselves think that the massive influx of people is inextricably bound to its economic growth.

An annual survey of Austin residents casts this phenomenon in clear relief. When asked what they think Austin has gained by its population growth over the past five years, residents cite a stronger economy as their top pick. Compared to the 22 percent of Austinites who cite “more diversity” and 7 percent who say “more creativity,” 42 percent say Austin’s explosive population growth has been a boon to the city’s economy. Even those who have lived in Austin for more than 20 years believe the economy has benefited from great migration to the city.

An openness to newness, strangers, and change are hallmarks of Austin’s economic culture. Perhaps rooted in the city’s past as a music-centric, indie-friendly college town, these hallmarks have translated well economically for the city.

The Great Migration Game

Austin’s migration story can perhaps be understood best in contrast with Silicon Valley. No metro area in America can compare to the Bay Area in terms of the sheer size and force of its technology community, Austin’s attractiveness has grown, in large part , unlike in San Francisco and San Jose, tech workers in Austin are able to afford housing close to the office, raise kids close to good school options, and enjoy a variety of cultural amenities in close proximity.

Between 1991 and 2013, people moved between Austin and 304 MSAs. Of these, Austin only experienced a net loss to eleven. Compare that to San Francisco. The gem of the Bay Area lost population to 133 of the 242 MSAs with which it “traded” population. For San Jose, the figures are 127 out of 253. In other words, while the Bay Area lost population to well over half of the MSAs it has traded with across the country, Austin’s loss was just 3.6 percent.

Figures 5 and 6 show clearly how the Bay Area has dispatched population to a number of western and southern boomtowns, whereas Austin has pulled in workers and families from every population centers all across the country.

Silicon Valley is renowned for its high-level talent pool. It attracts the best and the brightest from around the world to work in the most vibrant technology ecosystem in the world. However, when one looks at where U.S. cities export most of their talent, the numbers tell a slightly different story.

First, Austin is more of a regional talent destination than Silicon Valley. Since 1991, Austin has seen a net population increase of more than 33,000 people from Houston and 21,000 from Dallas. San Jose has lost thousands of people to both Texas cities over the same period of time. So has San Francisco. Perhaps that is expected, given Austin’s proximity to its fellow Texan metropolitan areas.

But the pull is much greater from California than one would suspect. During the same period, Austin attracted nearly 20,000 migrants from the Los Angeles metropolitan area, which sent only 15,000 to San Jose. Austin also saw thousands of arrivals from San Diego during the same period.

The other tech-heavy, talent-centric cities in the Northwest also prefer Austin. Net migration from Seattle to Austin has been positive since 1991, while San Francisco and San Jose have lost a combined 25,500 people to Seattle in the same time period. Portland tells an even more dramatic story. A city frequently compared to Austin, Oregon’s commercial capital has lost more people to its Texas peer than it has gained, while Silicon Valley has lost tens of thousands of residents to their northern neighbor. In contrast, since 1991, San Jose and San Francisco have exported nearly 51,000 people to Portland and Austin combined.

Second, looking at talent centers nationwide, Austin outperforms the Bay Area quite decisively as cities with a high proportion of college-educated residents have consistently chosen the Texas capital as an ultimate destination over Silicon Valley. Raleigh, for example, the only other American city to come close to matching Austin’s rate of growth over the past five years, has lost more people to Austin than it has gained since 1991, but both San Francisco and San Jose have lost population to Raleigh over the same period. In other words, plenty of people are choosing to leave the Bay Area for North Carolina, but the talent base in North Carolina has a fonder eye for Austin.

Other talent centers display a bias for Austin as well. The three largest cities on Wallet Hub’s 2015 list of the educated cities in America --- New York, Los Angeles, and Chicago --- have all sent more people to Austin than to the Bay Area, despite an enormous tech-led boom in the area. Washington, D.C. has become a talent boomtown in its own right, owing to the stability of employment for the knowledge workers the federal industrial complex increasingly needs and rewards. Yet it has exported more workers to Austin than to San Jose and San Francisco combined over the past twenty years. Provo and Colorado Springs, the mountain West’s talent hubs, have also lost people to Austin but gained people from San Jose and San

Francisco.

Opportunity Cities Win

For cities aspiring to grow as Austin has grown, the first order of business is to understand Austin as an opportunity city, not just a technology center or music capital. So what are the hallmarks of an opportunity city?

First, Austin, like other Texas cities, is friendly to those who want to start and grow a business. These are cities in which small businesses not only participate in, but also drive economic growth. A recent study conducted by the American City Business Journals ranked cities with 500,000 or more residents according to 16 indicators constructed to measure the vitality of the small business sectors in American cities. Austin ranked number one on the list because of the relationship between small business job growth and overall economic growth. San Francisco and San Jose ranked sixth and ninth, respectively, bested by nimbler hot spots such as Miami and Provo. Austin has also made other high-level appearances over the past few years on similar rankings, such as CNBC’s “Friendliest Cities for Small Business” list.

Small businesses are woven into the fabric of Austin’s economic ecosystem. Austin’s small businesses are ahead of the national average and a significant source of the tireless job creation engine for which Austin has earned a national reputation. Companies in Austin with fewer than 100 workers account for 35 percent of the area’s workforce, and yet they created enough jobs in 2009-2011 to offset the job losses caused by Austin’s largest employers after the Great Recession.

Second, an opportunity city is a jobs city. Small businesses by themselves do not necessarily guarantee that a city will have a healthy jobs environment, but a critical mass of new small companies typically does, especially if a significant minority grow into larger companies.

Austin reflects the growing body of academic literature on the impact of new firms on the labor market. Startups and other young companies generate the vast majority of net new jobs in America and spur income growth, especially for younger workers. New companies in Austin are the fuel that powers the creation of new jobs at a rate impressively above the national average.

New firm formation in Austin tracks with general national trends, but it does so at a consistently higher rate. As figure 7 shows, Austin has produced a significantly greater share of new firms per capita compared to the rest of country over the past 20 years, and it rebounded faster post-recession than the nation as a whole. The tech centers of Raleigh, San Francisco, and San Jose have all had lower startup rates than Austin since 2010.

Austin is the only major metro in Texas creating as many or more new firms than it was pre-recession. Just three years after the nation’s economic nadir, Austin created more new firms in absolute terms than it ever had. It also produces a disproportionately high number of startups for its size. In the Kauffman Foundation’s Index of Startup Activity, Austin has been in the top two spots for a few years running.

In addition to its startup culture, Austin is a premier relocation destination, especially for companies looking to expand operations in a business-friendly atmosphere with an abundance of talent. Since 2004, nearly one-third of all high-tech company relocations and expansions to Austin from elsewhere have come from California. Among these are household name giants such as Apple, Google, eBay, Oracle, PayPal, and Facebook.

A churning startup culture drives a dynamic job-creation ecosystem. Austinites work more hours per week than the national average, enjoy the lowest unemployment rate among the nation’s top 50 metro areas and experienced non-farm payroll growth at the 3rd fastest rate last year.

This has a lot to do with a healthy balance between job growth in all sectors of the economy with particularly strong performances in higher-growth sectors of the economy. Between 2014 and 2016, every sector of Austin’s economy added jobs, except manufacturing, which only declined by less than a percentage point. Since 2010, job growth in professional business services has grown 42 percent and information jobs by 34 percent, and over the past two years Austin has outperformed growth rates nationally in sectors diverse as wholesale trade, construction, leisure and hospitality, and retail.

Third, an opportunity city attracts professionals on the front end of their careers. One of the best ways to test the dynamism of a region is to look at the degree to which young professionals in their 30s are moving there. Immediately after college, 20-somethings will often move to big cities to get their professional footing and enjoy the fruits of cosmopolitan living. As they approach their thirties, they begin to think about affordability more seriously and consider other opportunity-related factors such as the quality of neighborhoods and schools if they are in the marriage and-kids market. Looked at this way, Austin is the preferred destination for upwardly mobile, aspirational 30-somethings looking to make a life for themselves.

A recent Niche.com ranking of the 25 best cities for millennials used as its key metric the percentage of 25-34 year olds living in each city. Austin, which ranked second overall on the list, had the highest percentage of 25-34 year olds among the top 25 cities.

When we compare 25-34 year olds moving to the Bay Area versus Austin, we see several sharp contrasts. Between 2000 and 2014, this group grew by 49 percent in Austin but declined by nearly 4 percent in Silicon Valley. There are now more 25-34 year olds living in Austin than in the San Jose metro area.

A greater share of 25-34 year-olds in Silicon Valley have a bachelors degree than in Austin, but Austin has been growing its educated young population at a much faster rate. The 25-34 year-old population with at least a bachelors degree has grown in Austin by nearly 61 percent since 2000, compared to 18 percent in San Jose.

Balancing the Basics: Why Austin Works

Austin’s success as an opportunity city differs from what has occurred in the Bay Area’s anchor metros, San Francisco and San Jose. These places have led the nation in job creation and startups in recent years and are growing their share of highly-educated young professionals. Yet they are losing population --- and company relocations --- to Austin. Why is Austin succeeding where San Francisco and San Jose, at some level, are not?

The answer lies somewhere in the answers provided by those who have made the move from the Bay Area to Austin.

Vasili Triant, CEO of LiveOps, moved his company from Silicon Valley to Austin after concluding that quality of life and cost issues would keep his company from achieving its growth objectives. Before assuming the helm of LiveOps, Triant moved to the company’s Austin office to direct sales. He and his family were able to buy a home and attend schools in the kind of district that would be utterly uaffordable in the Bay Area. The easy-going yet ambitious nature of Austin’s workforce provided a solid talent pool.

Meanwhile, back in Silicon Valley, employees at Triant’s company were constantly pushing for pay raises to accommodate the cost of housing, complaining about the multiple hours a day they spent commuting, and worrying about the schools their kids would have to attend. Employees earning over $200,000 were in debt and not contributing to their 401ks.

Once he was elevated to CEO, Triant confronted his board with the built-in costs of doing business in the Bay Area. He proposed moving the company to Austin, to which the board agreed after reviewing the numbers. Triant likens the difference between the Bay Area and Austin to a difference in premise about what makes a good life worth living in each place. In Silicon Valley one gambles that he or she will make it big, has family money, or just wants to be near the ocean and the mountains. “If your premise about a good life involves saving money for the future and having a good community and school for your kids, then Austin is for you – and the Bay Area won’t be unless you’re phenomenally wealthy,” Triant says.

Pradeep Vancheeswaran, a Senior Vice President of Global Business Operations at VMWare, lived in California for his entire U.S. professional career, including seven years in the Bay Area, before moving to Austin. The cost of living and the rat-race culture of the Bay Area prompted him and his wife to reconsider whether it was the best place to raise their kids and make a life. On a scouting trip to Austin he saw the kind of home his money could buy, the kind of neighborhood he could live in, and the quality of the schools, and the decision was made. Friends said he was committing career suicide. The opposite has happened, and the family is flourishing in Austin. “Texas gets a bad rap in the Bay Area,” he says. “But the truth is Austin is an inclusive place. We have great neighbors, people are friendly, and I have been able to hire talent here with no problems. In fact, Austin ranks at the top of our global talent assessment and has been a great place to hire for our company.”

Triant’s and Vancheeswaran’s stories are not uncommon in Austin and exemplify the fundamental pillars supporting Austin’s sustained growth.

More for Your Money

Underneath the vibrant regional economy, Austin’s bedrock, not often mentioned in the hype about the city, has been its affordability.

As Triant and Vancheeswaran’s personal accounts attest, Austin’s diverse and affordable housing stock is a key lure for upwardly mobile professionals. Housing in Austin is growing more expensive but still remains a reasonably good deal, particularly in comparison with the Bay Area, Los Angeles and San Diego, where housing costs more than double that of Austin, adjusted for income.

The key to maintaining housing affordability is to allow supply to keep up with demand. This requires avoiding the restrictions on suburban housing development that have been adopted in places like California, Portland and Seattle, and avoiding the high development charges typical of more restrictively regulated markets. As Figure 8 shows, affordability was nearly identical in Austin, Portland, and Denver in 1990. Since then, unaffordability has grown faster in the latter two markets, which place more restrictions on housing than Austin does. And in the Bay Area, of course, California’s notorious penchant for restricting housing is breaking records for unaffordability.

Using Demographia’s International Housing Affordability Survey, we find that single-family homes in Austin remain more affordable than rival talent centers such as Portland, Denver, Seattle, and Washington, DC. When compared to San Jose, which is the United States’ most unaffordable housing market, it is not hard to see the appeal for Bay Area technology transplants. The median house price in San Jose and San Francisco is nearly ten times the area’s median income, compared to four times in Austin. Technology executives in the Bay Area cite housing costs as the biggest threat to their continued success.

Still, at four times median income, Austin is facing the beginning of affordability problems. It has grown from an affordable to moderately unaffordable housing market since 2000 and is presently on the cusp of becoming severely unaffordable according to Demographia’s calculations. Trulia’s chief economist agrees, arguing that Austin is on the verge of denting its continued growth trajectory should housing prices climb much farther relative to income.

When it comes to total cost of living advantages, though, the story improves somewhat for Austin. According to BEA data, between 2008 and 2013 the overall cost of living actually decreased slightly in Austin even as it rose in New York and Washington, DC. Austin’s workforce enjoys a 20 percent cost advantage over residents of New York, who labor under the highest cost of living standards in the nation. Austin costs about the same as Phoenix or Orlando. The Bay Area, by contrast, is an indistinguishable percentage point more affordable than New York. Therefore, it is not surprising that San Francisco and San Jose have seen positive net migration from New York in recent years. If life must cost an unbearable amount, the weather and scenery might as well be better.

Follow the Money

Austin’s real median income is the highest of Texas’s four largest metros and even surpasses the New York metro area. Of the nation’s 53 cities with more than one million residents, Austin’s median household income is the tenth highest adjusted for cost of living. African American and Asian median incomes in Austin are fourth and fifth respectively among the largest U.S. cities, and salaries in Austin typically track slightly above the national average for most job categories.

Given Austin’s emergence as a technology center , the region now has twice as many high-tech jobs as a percentage of all jobs than the national average. Nearly one-quarter of all payrolls in Austin are in the high-tech sector, with an average salary greater than $100,000, nearly double the average salary for all other industries. Though high tech salary growth has slowed in Austin in the past few years compared to the rest of the nation, the average high tech worker in Austin still earns more than the national average. Before the Great Recession, there were more high-tech manufacturing than IT jobs in Austin, but the past five years have seen an explosion of information and other IT-related high tech jobs. The number of IT jobs in Austin has nearly doubled in the past ten years, totaling more than 56,000.

High-tech manufacturing jobs remain the highest-paying, though, with an average annual salary fetching $122,000. Income growth outside of high tech jobs has grown at a faster rate than tech jobs. Between 2010 and 2015, Austin had the second-highest annual job growth across all industries at 3.7 percent, just a click behind San Francisco’s 3.8 percent growth rate. Austin’s high tech job growth rate of 5.7 percent was also the second-highest nationally, once again behind San Francisco’s peerless 10.7 percent growth rate. These rates of growth have been matched by healthy income growth that makes Austin a premier opportunity city.

Good Place for the Kids

Austin’s relative affordability and earning power is buttressed by two additional factors that are especially important to families and young people planning to have children: safety and schools. As Austin has grown, the sheer influx of families with children has placed a premium on the availability of strong educational options and a safe environment.

Between 2000 and 2014, the number of households in Austin with children under the age of 18 grew 35 percent. By contrast, such households grew 4 percent in San Jose. This does not mean that Austin is necessarily more pro-family or pro-marriage in the sense of cultural norms. The percentage of married adults in Austin has declined just as it has across most urban areas in the past 15 years, as has the percentage of young couples with children.

But, as sheer volume of families with children moving to Austin in absolute terms shows, the overall environment is very family-friendly. Austin’s schools fare better on most assessments of public school quality than Texas’s other large cities, and families have public school options all across the metro area. For instance, consumer-oriented data analysis sites such as FindtheHome.com rate Austin’s city schools ten points or more ahead of Dallas, Houston, and San Antonio, and the State of Texas’s overall rankings show a substantial percentage of high-performing schools in the metro area. Whether a family chooses to live downtown or the suburbs, there are strong public school options unlike ones one would normally find in large urban areas.

An annual survey of residents shows that Austinites value choices in education as well. A majority of adults believe the public schools in Austin are a good value for their tax dollars. Yet 59 percent of 18-34-year-olds support school vouchers, as do 50 percent of adults over 35. Fifty-nine percent of all adults either send their kids to charter schools or would consider doing so. Sixty percent of respondents say they chose where to live based on school options.

Austin is also one of the safest cities in Texas. According to the FBI’s Uniform Crime Reports, Austin ranks 21 out of Texas’s 24 metro areas in the report in crime incidents, well below the other larger metros.106 As a state capital and university town Austin’s growth has “skipped over” the debasements that accompany deindustrialization and largescale losses within working-class economies. But Austin’s growth patterns, variegated and multi-nodal as they are across the metro area, have also created diverse economic centers that have prevented large swaths of the city from falling into decline.

Option Urbanism: Austin's Polycentric Character

The thing that ultimately makes Austin’s population and economic growth work is the multi-nodal quality of the metro area’s growth. Despite its reputation as a “hip” and dense urban area, in reality Austin is a city of districts that balances and disperses urban-style amenities across its urban and suburban landscape.

Austin’s reputation as an urban hotspot is well-deserved. The Austin City Limits concert venue and annual festival are in or immediately across the Colorado River from downtown. South By Southwest, the global technology, film, and music festival, occurs mostly in venues spread across Austin’s urban core. The heart of the Austin music scene along 6th Street downtown is only a short walk from the Texas state capitol and a mere 13 blocks from the University of Texas at Austin, the state’s flagship university whose iconic tower is a fixture along the Austin skyline. Visitors to Austin over the past decade are always greeted by construction cranes that dot the downtown landscape, as high rises compete with one another to make a new mark on the skyline.

Suburban Austin

Demand for downtown living has never been higher in Austin, and yet the cranes and construction zones tend to hide the true locus of Austin’s dynamism—the area’s lively suburbs. This is where the vast majority of the region’s population growth in the past 15 years has occurred. Not merely appendages to downtown, Austin’s suburban communities have done a notable job of incorporating elements of the city’s urban identity into the quality of life its suburban residents experience. One can find food trucks, coffee shops, new restaurants, indie shops of various kinds, music, and festivals dispersed across the metro area. The Barton Creek Greenbelt that stretches southwest off the Colorado River downtown spreads outdoor recreational opportunities, for which Austin is also well-known, across multiple access points through a variety of neighborhoods.

In 1990, when Austin metro’s population was less than one million, 45 percent of residents lived in the suburbs. Today, 53 percent of Austinites live in the suburbs. The city grew 47 percent between 1990 and 2000, and then another 37 percent between 2000 and 2010. The vast majority of this growth has been suburban in nature.

Using Demographia’s City Sector Model, we see the urban core and urban core’s ring, defined as the central business district and original downtown ring pre-dating World War II, experienced healthy rates of growth but added little in absolute terms between 2000 and 2012. What most people think of as today’s booming downtown Austin only accounted for 1.6 percent to the metro area’s entire growth during this period. Of the 588,000 new residents to Austin during this period, 564,700 of them moved into suburban neighborhoods.

Figure 11 shows how this growth looks geographically. Central Austin grew very little between 2000 and 2014. The fastest growth, depicted by the grey and blue areas, is largely suburban.

Homeownership in Austin follows this suburban trajectory. Compared to 30 percent among the nation’s 52 largest metro areas, 62 percent of the owned housing stock in Austin can be found in suburbs in which the median home construction year was after 1980. That figure is less than 10 percent in Silicon Valley. By contrast, 77 percent of owned housing in Silicon Valley is in older suburbs with a median home construction year before 1980, compared to 14 percent in Austin and 41 percent nationally. Another 23 percent of Austin’s owned housing is located in exurban communities, compared to 19 percent nationally and 13 percent in Silicon Valley.

Austin’s success as an urban model is closely tied to its ability to meet population demand with new housing in new communities. The increasing difficulty to build and afford housing in the Bay Area is effectively making homeownership a phenomenon of aging suburban communities, as greater shares of aspiring homeowners leave the area altogether, as seen earlier.

Multi-Nodal Tech City

Austin’s suburban expansion also dominates much of the economy. Nearly half – 43 percent – of tech jobs are in the suburbs and much of the rest in areas outside downtown. Local markets for urban-style amenities such as bars, cafes, and events have arose to meet the demand of a highly-educated, relatively young workforce that nonetheless prefers lower-density suburban living. This creates a district effect that has worked relatively well with Austin’s zoning codes and allowed for either mixed-use, or regional mixes of uses, in various points across the metro area.

Figure 12, an Austin Chamber of Commerce map of the city’s 100 largest high-tech companies, paints a picture of a multi-nodal tech community that is both urban and suburban. Since 2014, 37 percent of high-tech companies that have moved to Austin have relocated downtown, while the rest are dispersed across the various hubs.

The heavily concentrated hub downtown and the corridor stretching southwest of downtown offer a diverse array of living options. South Austin interweaves leafy residential neighborhoods around its three north-south district roadways: South Congress, South First, and South Lamar. To the west are rolling, leafy suburban-style communities that offer proximity to downtown. Downtown increasingly offers dense, high-rise living with ample amenities. The Bartin Creek Greenbelt and trails around Lady Bird Lake (created by two dams in the Colorado River) are the centerpieces of Austin’s esteemed outdoor fitness culture.

Between downtown and the concentration of tech firms along and north of route 183 are patchworks of neighborhoods and districts that blend homes, apartments, restaurants, shops and bars, once again creating options for families and single workers. The Domain, the mixed use complex near the intersection of Routes 1 (Mopac) and 183, is beginning to serve as a kind of “city center” north of downtown. Suburban neighborhoods west, north, and east of the northern tech hub offer an array of suburban options for families and workers. Apple is completing its second-largest campus outside of its California headquarters in the community, and other tech giants such as Google and Oracle have nearby offices.

Dell anchors the tech community in Round Rock to the north, which effectively functions as a separate city center. Round Rock, with a population of more than 100,000, has more than tripled in size since 1990. Dell employs more than 13,000.

Austin’s rapid growth, coupled with lagging investments in transportation infrastructure, accounts for why Austinites frequently rank traffic congestion as the biggest problem facing the city. Viewed comparatively, however, average work commute times in Austin match the national average at 25.5 minutes one way, compared to 31.2 minutes in San Francisco and 28.1 minutes in San Jose. Atlanta’s car commute times take a full five minutes longer than Austin’s, and in Washington, DC, an extra ten. Overall, Austin’s average commute times – whether by car, transit, bike or foot – is on part with Indianapolis or Charlotte. For transplants from New York or the Bay Area, commutes are likely to contribute to Austin’s appeal rather than the other way around. Car commute times are lower in Austin than either of those areas, as one might expect, but so are walk-to-work times.

Despite this relatively good performance, over time traffic congestion along with housing affordability could begin to chip away at the city’s magnetic appeal. But for now, despite the frequent grousing one hears from locals about the traffic, Austinites on average are not worse off than other Americans living in cities larger than 1 million people.

Austin’s still reasonable commute times reflect the polycentric quality of its economic geography. With commercial and cultural locations spread across the metro area, together with an array of single- and multi-family housing options nearby, Austin offers choices. If a young professional couple wants a single family home with a yard, proximity to restaurants and shops and good schools, they have options. If they want to live in more of a mixed-use apartment community close to work, they have options. Downtown living is increasingly becoming harder for people not commanding top salaries, but it still remains an option for young workers that other cities do not offer.

Conclusion

Austin is well-known as a talent center, but students of urbanism would do well to study the geographic nature of the talent economy in Texas’s capital. It is a dispersed talent pool, spread across a relatively affordable metro area with proximity to urban-style amenities.

Austin has managed to encourage and allow the concurrent development of its central core and inner and outer rings in a way that has made variety a central feature of the Austin model. People, young and old, have options in Austin. Good schools can be found across the metro area meaning people rarely have to sacrifice amenity preferences in order to live close to a good school, which is a conventional understanding of what “moving to the ‘burbs” often entails in most cities.

Austinites have work options, too, in two ways. The diverse economy, with a high proportion of high tech and other educated workers, offers opportunities in the job market for workers who decide what they are doing is not the right fit for them. Workers also have choices where they work. The polycentric nature of Austin’s commercial hubs makes this possible.

And even as affordability problems present unprecedented challenges to Austin, the city still offers alternatives for where people want to live. Because of the timing and trajectory of Austin’s population growth, a lot of new housing is available, as well.

The key to the Austin model’s continued success will be to preserve its core features as an opportunity city and the fundamentals that have made it work until now. Over-planning or limiting growth, concentrating economic strength in too few places, allowing school quality to erode – these are precisely the things that have done significant damage to other previously successful cities in America. Austin’s strength has been in going in the other direction. Its continued success depends upon continuing along the same path it has traveled until now, but with a vision to accommodate what seems as inevitable greater growth.

Ryan Streeter is the Executive Director of the Center for Politics and Governance at the University of Texas at Austin and Clinical Professor of Public Policy at the LBJ School of Public Affairs. Streeter has conducted policy research projects for think tanks, institutional nonprofits, and public agencies at the federal, state, and local levels. He served as a Special Assistant for Domestic Policy to President George W. Bush, Deputy Chief of Staff for Policy and Strategy to Indiana Governor Mike Pence, and Policy Advisor to Indianapolis Mayor Stephen Goldsmith. He was a Senior Fellow at the Legatum Institute in London, has served as a Transatlantic Fellow with the German Marshall Fund, and was a Research Fellow at the Hudson Institute.

Top photo: Photo by jdeeringdavis, Licensed under CC License

Military Employment and the Upward Mobility of Latinos in San Antonio

$
0
0

This essay is part of a new report from the Center for Opportunity Urbanism titled "The Texas Way of Urbanism". Download the entire report here.

The long presence of military installations extending back approximately a century has led to the designation of San Antonio as Military City USA. The military continues to be one of the city’s major employers. The area’s six military bases — Fort Sam Houston, Lackland Air Force Base, Randolph Air Force Base, Brooks City-Base, Camp Bullis, and Camp Stanley — together represent one of the largest active and retired military populations in the country. A 2011 study found that the Department of Defense (DoD) had a $27.7 billion impact on the city’s economy; supported 189,148 jobs in the city; granted $4 billion in contracts locally; and provided support for 55,000 DoD retirees in the community.

The military presence has touched the lives of countless of San Antonians, particularly Latinos in the city. Especially important was the role played by Kelly Air Force Base (AFB) (officially renamed from Kelly Field in 1948)—located in the city’s heavily Latino Westside. Former San Antonio mayor and former secretary of the Department of Housing and Urban Development, Henry Cisneros, who grew up on the Westside, recently recalled with affection that his own father as well as neighbors worked at Kelly.

Nelson Wolfe, Bexar County judge and former mayor of San Antonio, notes that “For generations of Hispanic families, probably more so than anybody, …it [Kelly AFB] pulled them out of poverty, it gave them hope…. Kelly was the key factor in offering upward mobility for Hispanics.” Kelly provided opportunities for Mexican Americans who for generations had been excluded from opportunities for advancement. Employment at Kelly offered steady work and allowed Mexican American workers—many who were veterans—to buy a home and send their children to college.

Local artist, Jesse Treviño, himself a veteran of the Vietnam War where he lost his right hand, aptly captures the image of the Latino worker at Kelly in his painting titled “No Te Acabes Kelly Field” meaning “Do Not End Kelly Field.” Sarah Fisch describes the Latino worker featured in the painting: “Here’s a guy with a government desk job, in his cubicle, manning his part of the federal territory, meeting you face to face. You’re forced—challenged—to meet his eyes, to meet this portrait’s subject on his terms. It’s a bracingly powerful image….”

The 1995 Defense Base Closure and Realignment Commission (BRAC) ordered the closing of Kelly. In 2001, it became part of nearby Lackland AFB, with the majority of operations becoming Port San Antonio, an industrial business park.173 Port San Antonio today is housed on 1,900 acres and is home to 70 private and public organizations along with 12,000 employees working in the aerospace, logistics/ manufacturing, and government/military industries.

The long-term impact of Kelly on the community and the city’s Latino population remains significant. For example, Arturo V. Perez, who passed away earlier this year, worked for Kelly AFB beginning in the mid-1950s. Perez rose through the ranks from supply clerk to senior engineer. Through his work at Kelly, he was able to make sure that all of his five children graduated from college. While working at Kelly, he earned his GED and completed electronic training, which opened an opportunity for him to work on radios and televisions in the evenings. After he retired from Kelly, Perez opened his own business—Arturo’s Barbacoa (barbacoa is a slowed-cooked version of barbeque), a very popular restaurant that he operated for twenty years.

Manuel J. Jimenez, who passed away in October 2015, worked at Kelly AFB as an aircraft mechanic after returning from serving in the Philippines during World War II. His work at Kelly helped him provide well for his family. After 36 years, Jimenez retired and opened Pipo’s Lounge, a small bar that grew into a popular family-oriented dancehall.

A generation of activists, like Luz Medina Escamilla, learned organizing skills at Kelly. Escamilla, who passed away in June 2014, had a successful career spanning four decades at Kelly AFB, rising from key puncher to system analyst. She was a community activist with a deep passion for issues concerning women and education, serving as a delegate at the first United Nations International Conference on Women, held in Mexico City in 1975. Escamilla mentored many local women activists, including María Antonietta Berriozábal, the first Mexican American woman elected to the San Antonio City Council (1981-1991).

Military employment no longer plays as dominant a role in nurturing upward mobility for Latinos in the city. In their study of Mexican Americans in San Antonio and Los Angeles, Edward Telles and Vilma Ortiz observed a significant drop in military employment in San Antonio from 16 percent among parents in 1970 to 1 percent among their children in 2000. Still, according to the 2010-2014 American Community Survey, Latinos who are U.S. citizens are more likely to hold a federal government job in the San Antonio-New Braunfels Metropolitan Area (4.3%) than in the other three major metropolitan areas of the state (Austin-Round Rock, 2.3%; Dallas-Fort Worth-Arlington, 1.9%; and Houston-The Woodlands-Sugar Land, 1.4%).

The legacy of military presence in San Antonio remains a critical element for the Latino community. For a generation of Latinos excluded from social and economic opportunities in the private sector, employment in the city’s military bases helped them attain a middle-class life for themselves and their families. Many Latinos in San Antonio today retain a familial link to the military bases in the city. This legacy remains, and constitutes an important part of the success story of this great American city.

Rogelio Sáenz is Dean of the College of Public Policy and holds the Mark G. Yudof Endowed Chair at the University of Texas at San Antonio. He is also a Policy Fellow of the Carsey School of Public Policy at the University of New Hampshire. Sáenz has written extensively in the areas of demography, Latina/os, race and ethnic relations, inequality, immigration, public policy, social justice, and human rights. He is co-author of Latinos in the United States: Diversity and Change and co-editor of The International Handbook of the Demography of Race and Ethnicity. Sáenz regularly writes op-ed essays on social, demographic, economic, and political issues with his contributions appearing in such newspapers as the Austin American-Statesman, El Paso Times, New York Times, Rio Grande Guardian, and the San Antonio Express-News.

Top photo: United States Air Force [Public domain], via Wikimedia Commons

San Antonio: Growth and Success in the Mexican-American Capital

$
0
0

This essay is part of a new report from the Center for Opportunity Urbanism titled "The Texas Way of Urbanism". Download the entire report here.

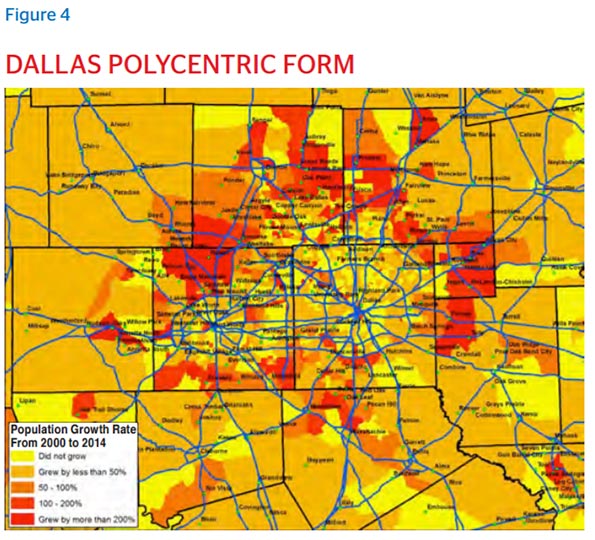
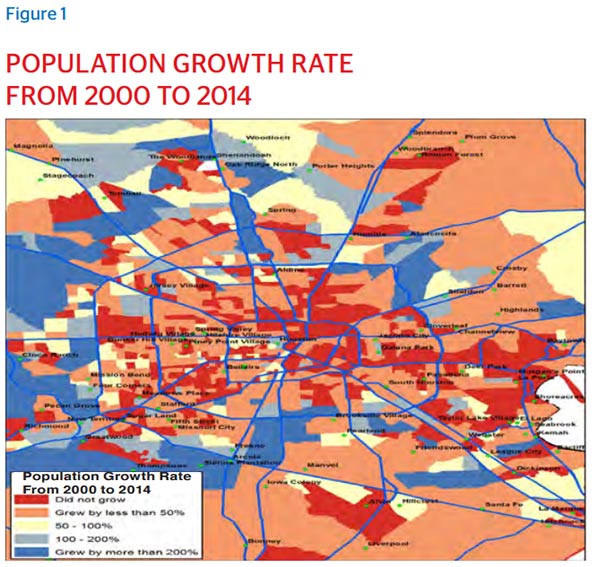
For decades, as many U.S. cities declined, and others became overly exclusive, cities in Texas evolved into places of opportunity. Due in large part to liberalized economic policies, the state’s “Big Four” metro areas — Houston, Dallas, Austin and San Antonio — consistently rank among the nation’s leaders in population growth and job growth, experiencing the rapid urbanization once common among America’s legacy cities. In a state once defined by cowboy towns, these metros have become intense human and business agglomerations, growing more global and ethnically diverse in the process.

In many ways, the newcomer to these ranks of opportunity cities is Texas’ oldest urban area, San Antonio. In recent decades, San Antonio has been considered the underdog of the foursome, able to outshine other Texas cities in professional basketball, but not in economic or cultural reputation. Houston, a mega wealthy oil town, has reached remarkable heights in health care, luxury shopping and housing development. Dallas has emerged as a mid-American banking center. Austin has become Texas’ yuppie capital, full of educated techies who are turning the city into “Silicon Hills.” But San Antonio, as America’s northernmost gateway with Mexico, has been viewed as a magnet for poor immigrants and thus a place of low incomes and education levels.

“There has been a long perception of San Antonio as a poor city with a nice river area,” says Rogelio Sáenz, dean of the public policy school at the University of Texas-San Antonio. “Even today, despite being the seventh-largest city in the country, many people outside Texas have little information about our city.”

But as I discovered while living in San Antonio for six weeks this spring, these negative stereotypes are outdated. Thanks to a commitment toward growth by the city’s political and business establishment, San Antonio in 2016 offers a much more diverse urban profile, catching up to some degree with Texas’ other major cities and surpassing many in other states.

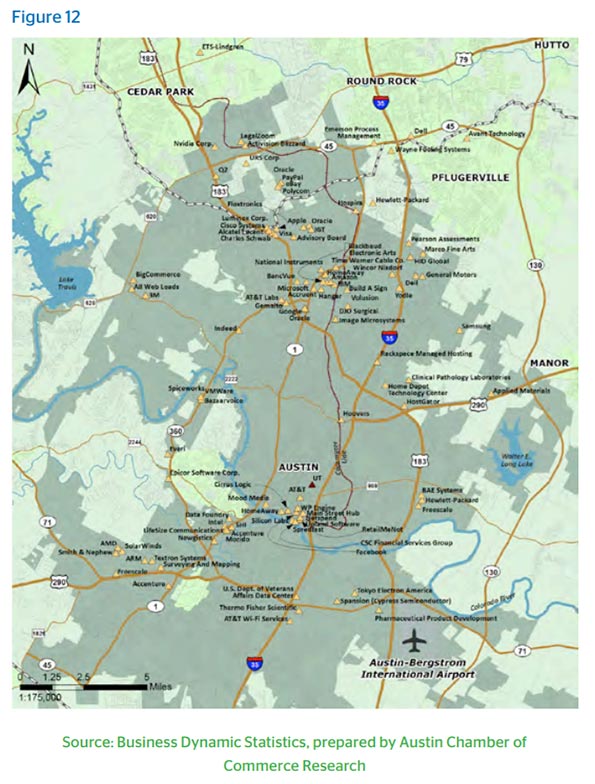
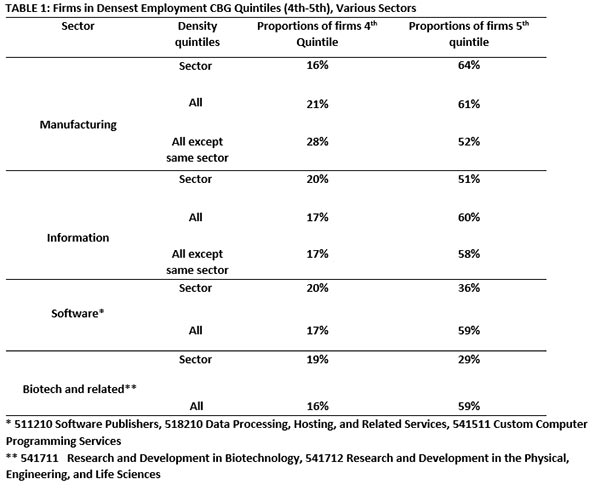
The leading cause has been a good economy. San Antonio first grew thanks to a few key sectors, most notably its voluminous military presence, which earned it the nickname “Military City USA.” But its economy has diversified recently, seeing growth in sectors that benefit both from proximity to the military and from the broader Texas growth machine. The city’s financial industry has been propelled by providing banking for service members. The tech industry, which had overlooked San Antonio for trendier cities like Austin and San Francisco, now has a presence here; since 2010, San Antonio’s information sector has expanded by over 15 percent, placing the city 17th among the 70 largest U.S. metros in a 2016 Forbes magazine survey. The city has even seen manufacturing growth, as corporations take advantage of Texas’ corporate welfare and proximity to Mexico’s supply chains. Along with San Antonio’s more traditional economic drivers, such as health care and tourism, this expanding private sector has turned the city into a jobs engine.

And this is impelling people to move here, creating a more interesting demographic mix. The city’s historic ties to Mexico have long cemented it as the Mexican-American capital, viewed as much a part of “northern Mexico” as of the United States. It remains a majority-Hispanic city, but this, rather than being a liability, has infused San Antonio with a young, energetic population, making it a case study for how an increasingly diverse America can function. This includes “Tejanos” — native Texans of Mexican descent — and the more recent increase in Mexican nationals, professional-class immigrants escaping the violence in their homeland. Meanwhile, people throughout the U.S. seeking well-paying jobs and low living costs — including young white professionals, African Americans, Asian Americans and immigrants of every variety — are flooding into San Antonio.

This explosive job and population growth has bred all the familiar elements underpinning an urban renaissance. Indeed, just like in other rapidly growing Texas cities, there is a certain buzz about San Antonio, as it has become denser, more global and more cosmopolitan than when I previously visited in 2007. The new developments emerging in and around downtown fuel restaurants and bars that are slammed during weekends with everybody from international jet-setters to Tejano ranchers in cowboy hats. This imprint has extended to outlying areas, where new country clubs and luxury shops spring up on formerly virgin land.

Yet amid this new shine sits a more traditional culture. Just as parts of modern-day San Antonio were built during the first stirrings of civilization within Texas, the city is dominated by families who have lived here for generations, instilling a small-town, community feel. This combination of old and new — which extends across a landscape largely built by, and for, people of Mexican descent — is what makes San Antonio the most compelling of Texas’ urban success stories.

Evolution into the Mexican-American Capital

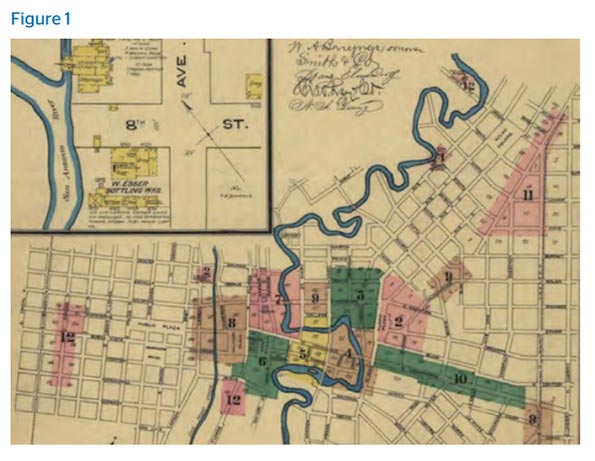
San Antonio’s Hispanic ties date to the late 1600s, when Spanish explorers mixed with the native Yanaguana population.115 The Spanish founded the city in 1718, built several missions, including the Alamo, and by 1773 made San Antonio de Bexar the capital of Spanish Texas.

By the 19th century, these religious structures were transformed into forts, as San Antonio became a prime battleground for Spain’s imperial ambitions. The city suffered from numerous battles in the early 1800s, with Spain defending its territory against ragtag armies of Anglos and natives. In 1821, Spain granted independence to Mexico,relinquishing much of modern Mexico and the U.S. Southwest, and San Antonio became the new nation’s foremost northern entryway.116 Several years later, Mexico adopted a constitution, but leaders soon violated it by forming a centralized government even more oppressive than Spain’s.

In response, many Texas towns, which were peripheral Mexican territory anyway, revolted, and San Antonio became ground zero in the Texas war for independence. This climaxed in February and March 1836, when 200 defenders encamped inside the Alamo held out nearly two weeks against a several-thousand-man Mexican militia that ultimately overwhelmed and killed them. Texas seceded soon after and became a republic, before the U.S. annexed it in 1845.

In following decades, rail connections made San Antonio an industrial crossroads. Culturally, it enjoyed influences from European and American frontiersmen and indigenous people from Mexico. By 1900, San Antonio had 53,000 residents, making it Texas’ largest city.

San Antonio’s major step forward, however, came during the Mexican revolution of 1910, an event supported by city residents. In 1876, Porfirio Diaz became Mexico’s president, overseeing a multi-decade dictatorship. In 1910, a popular dissident candidate named Francisco Madero ran for president and was imprisoned. After his family posted bail, Madero fled to San Antonio, joining other expats fomenting revolution. They organized an armed struggle that lasted for decades within Mexico, causing a refugee surge. From 1900-30, the Mexican population in the U.S. grew from 100,000 to 1.5 million, and San Antonio’s total population more than quadrupled, with refugees viewing it as a safe and culturally familiar city.

“At that time, San Antonio was the center, not Los Angeles,” T.R. Fehrenbach , a Texas-based historian, told the San Antonio Express-News in 2010. “San Antonio was the capital of the Latin American world outside of Latin America.”

Newcomers consisted largely of Mexico’s business elite. For example, the grandparents of former San Antonio mayor Henry Cisneros, and the parents of famed former local congressman Henry Gonzalez, came to San Antonio during this period. The influx of Mexican business savvy helped make San Antonio a modern city.

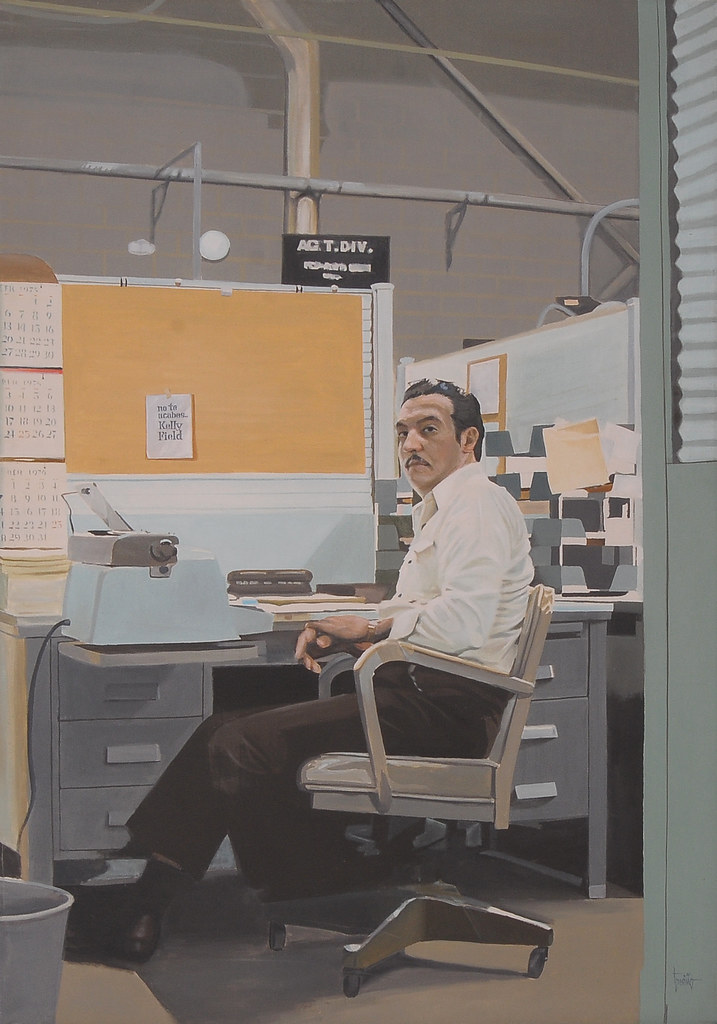
After slowing during the Great Depression, San Antonio resumed growth during World War II. From its inception, San Antonio was a military city, the linchpin in the defenses of Texas. This continued following statehood, as San Antonio became a prime location for military installations. Fort Sam Houston, which still sits on the city’s east side, was founded in 1845. Kelly Air Force Base opened during World War I. Other military functions would follow, and by World War II they were running on all cylinders.

The large civilian workforce that flooded into San Antonio during this time created severe labor shortages in rural areas. The federal government responded with the Bracero Program. From 1942-64, 4.6 million Mexican agricultural guest workers entered the U.S.121 Like with past Mexican migrations, many gravitated to San Antonio, and by 1970 the dusty old Spanish colonial outpost had become a 654,000 person city.

Postwar Economic Growth and Political Equality

Since then, the region has added an average of approximately 300,000 new residents per decade. Much of the influx has resulted from the organic movement between America’s colder and warmer climes. But much also stemmed from local sources and initiatives.

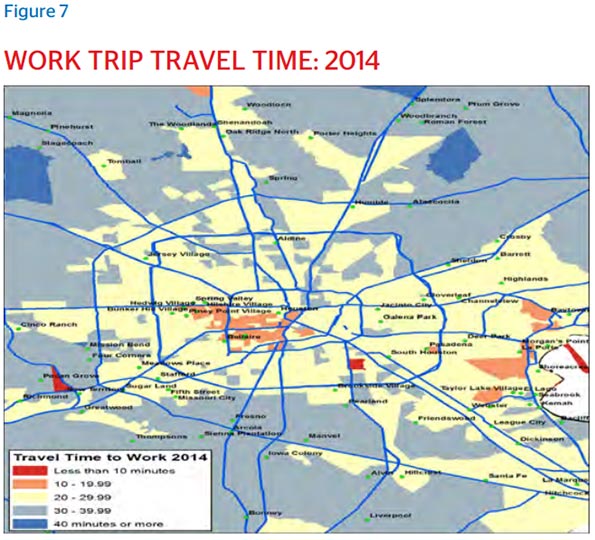
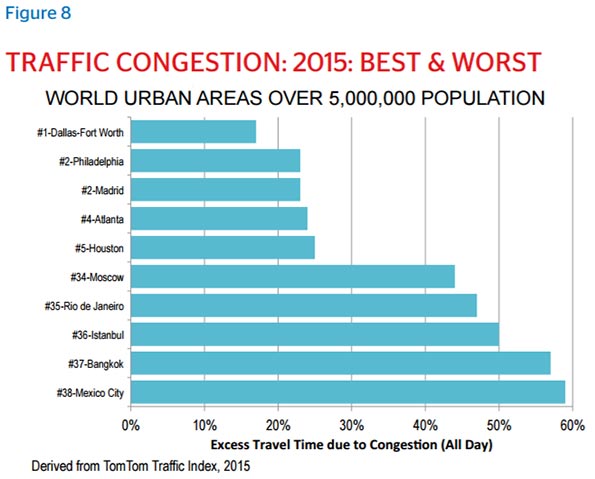
Economic growth and job creation are enhanced by transportation systems that allow people to reach employment and other destinations throughout the metropolitan area. Metro San Antonio has a highly ranked roadway system, with comparatively light traffic congestion. San Antonio ranks 10th in per-capita freeway capacity among the 53 U.S. metropolitan areas with 1-million-plus populations. This contributed to San Antonio’s ranking of 22nd best in overall traffic congestion delay among 172 urban areas in 30 nations, according to the 2015 Tom Tom Traffic Index. The metropolitan area has two freeway beltways (ring roads), like a number of other cities.

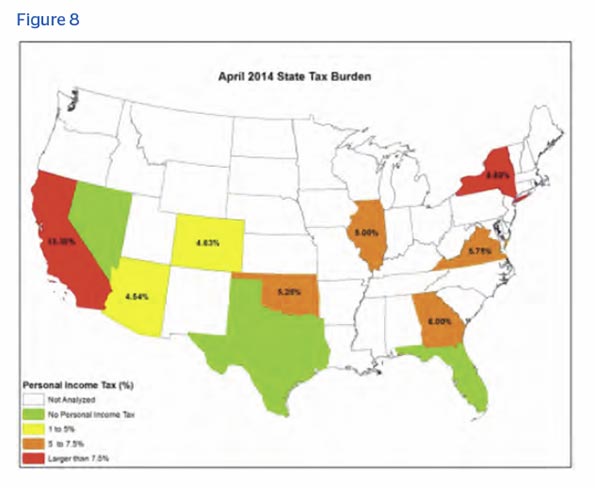
Like Texas’ other cities, San Antonio has also benefited from pro-growth state policies. Texas has no income tax and has the fifth-lowest overall state tax burden. Texas routinely ranks near the top in surveys tracking ease of doing business. Such liberalization has produced statewide in-migration of people and businesses, mostly to the major metros.

But the city’s establishment has also embraced the growth agenda. This is because San Antonio, says Cisneros, who in 1981 became the first Hispanic mayor of a large U.S. city, perceives itself as an opportunity zone for Hispanics.

“For a good part of its history, San Antonio was a poor city,” he suggests. The establishment has responded by making economic development “the central current of San Antonio’s political discourse and electoral politics … [giving] us the basis on which we decide other questions.”

This has meant, on one hand, subsidizing a number of flashy projects. San Antonio’s famed River Walk, first restored in 1941, has been serially expanded to connect key downtown tourist spots. San Antonio hosted the World’s Fair in 1968, rebranding itself as the northernmost Latin American gateway into the United States. And public money was used to retain the San Antonio Spurs, who proceeded to win five NBA titles, putting the city on the map perhaps more than anything else.

But growth has mainly occurred because local and regional officials embraced the unsexy projects needed to enhance San Antonio’s infrastructural footprint. For example, the city pumps water from the vast Edwards Aquifer that spans central Texas. Thus San Antonio has more reliable water access — and cheaper water rates — than other cities, who rely on surface-level infrastructure and are more subject to droughts.

In the 1970s, San Antonio joined its municipal energy company — CPS Energy — with a south Texas regional nuclear power network. Unlike other cities that joined, CPS entered the partnership to generate its own power, rather than renting it from a third party, making it the nation’s largest city-owned utility for gas and electricity. This has helped the company eradicate the middle man, selling energy to San Antonio residents and businesses at 10 percent to 20 percent less than in Dallas and Houston.

Another area has been key to San Antonio’s political development and the rise of Hispanics. From 1955-75, San Antonio’s City Council was controlled by the Good Government League, a mostly white group that endorsed pro-business candidates. The group fought patronage politics, but was exclusionary in nature. In the early 1970s, San Antonio became ground zero for La Raza Unida, a national movement dedicated to increasing Hispanic representation within government. Working against the GGL, the movement organized voter drives throughout the early 1970s, and by 1977 had helped inspire council elections by district, rather than at-large. This meant that following the 1977 election, the majority-minority city had filled five of 10 council seats with Hispanics and another seat with an African American. This diversity at City Hall has continued.

But, according to Michael Cary, a writer for the San Antonio Current, the political establishment has still championed the pro-growth leanings of the GGL, thus merging two constituencies that otherwise remain divided. This merger was embodied by Cisneros, who was elected to council in 1975 and later served four terms as mayor.

“Cisneros broke with the liberal Chicano ranks and ran on the West Side Good Government League ticket,” wrote Cary, serving “as a bridge between Anglos and Hispanics.”

The former mayor agreed that this unity remains intact, thanks to the citywide “political consensus” favoring growth.

“We’re not going to do it with welfare, we’re not going to do it with income maintenance, we’re not going to do it remaining contentious and divided,” Cisneros said, summarizing the Latino and Anglo establishments’ attitudes. “We’re going to do it if we come around a single theme — jobs.”

Diversifying Economy

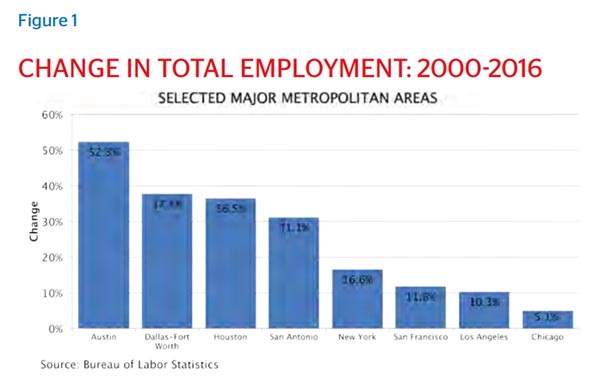
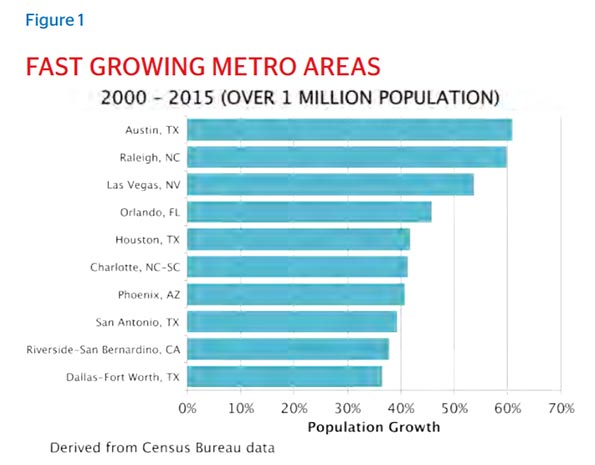
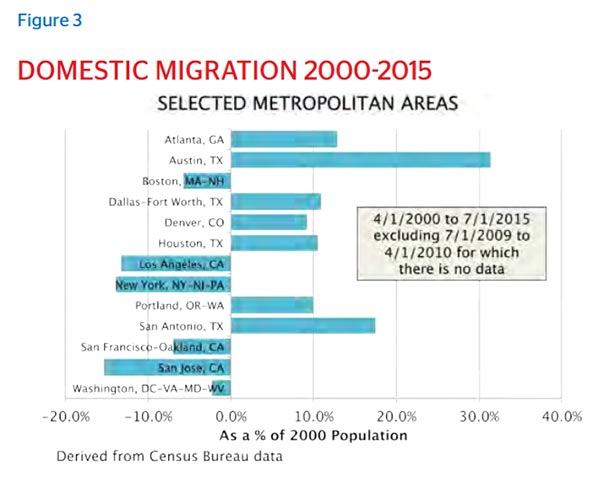
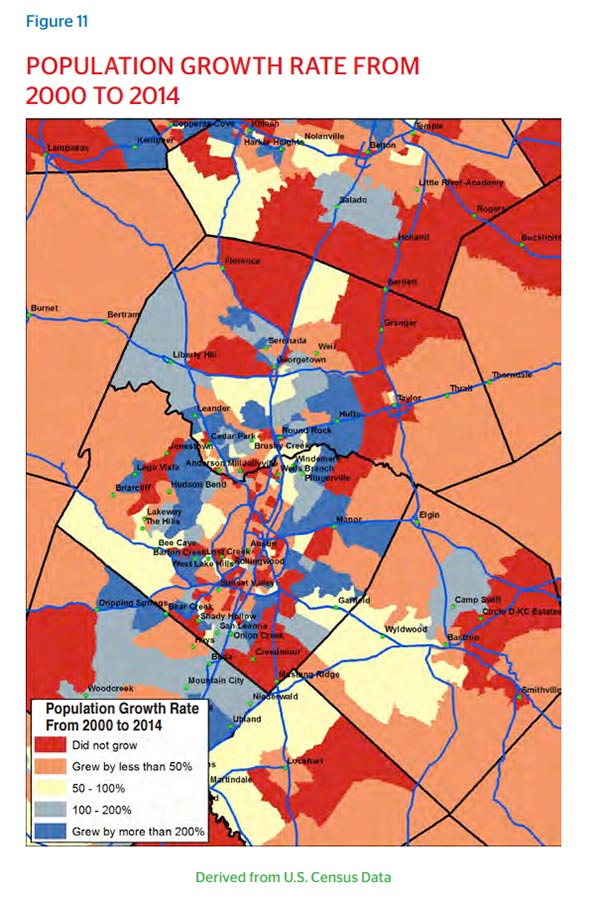
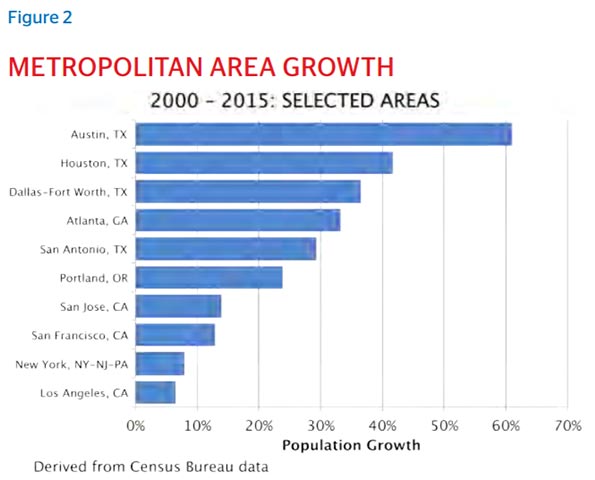
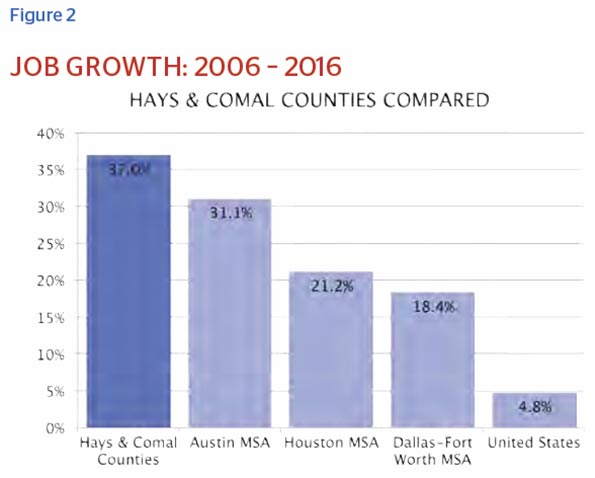
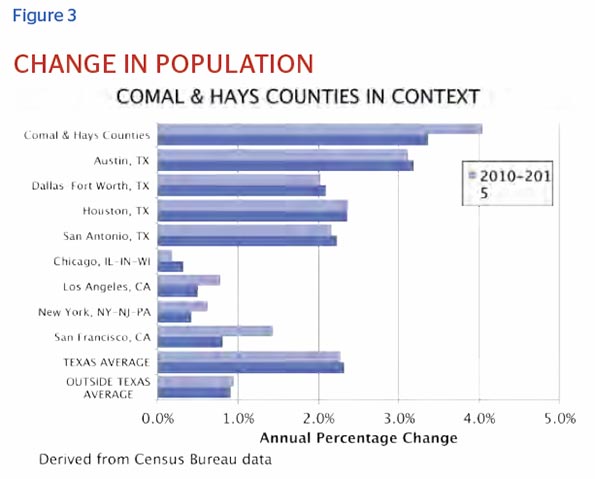
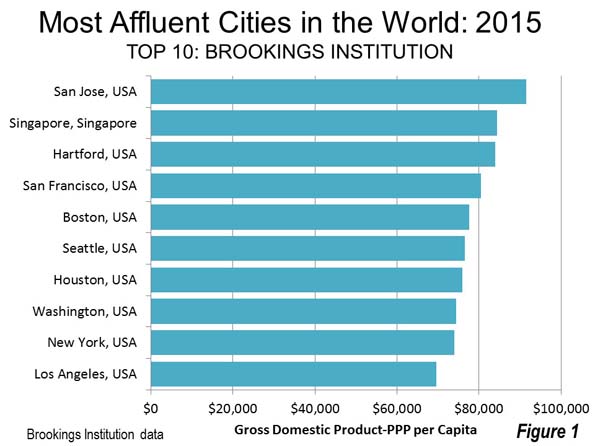
This approach has powered San Antonio near the top on various growth and prosperity metrics. Since 2000, San Antonio has been No. 8 among the 50 major U.S. metro areas in population growth rate.

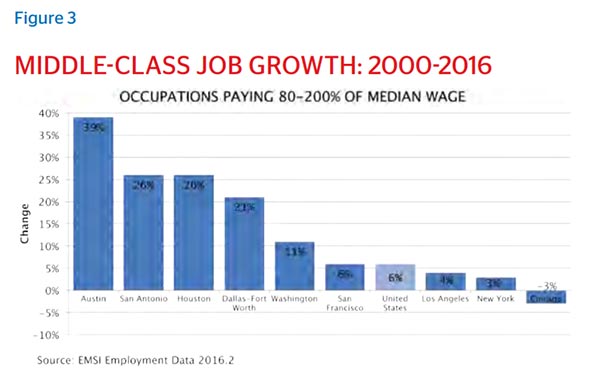
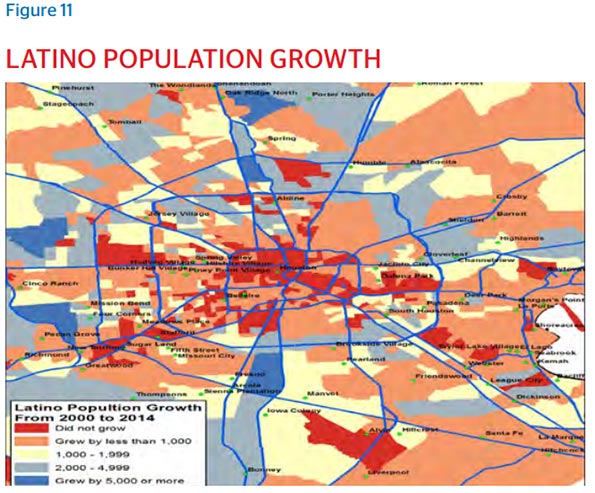
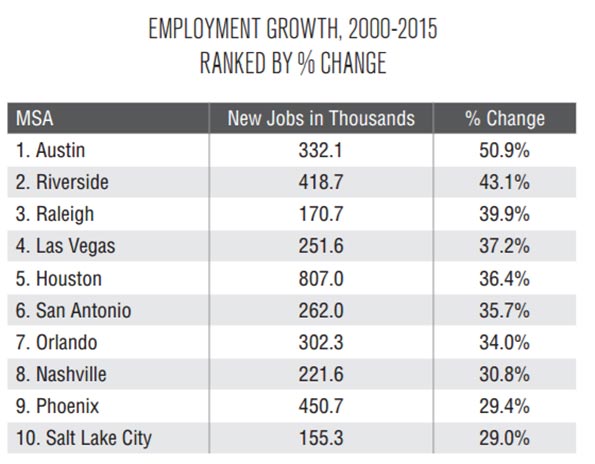
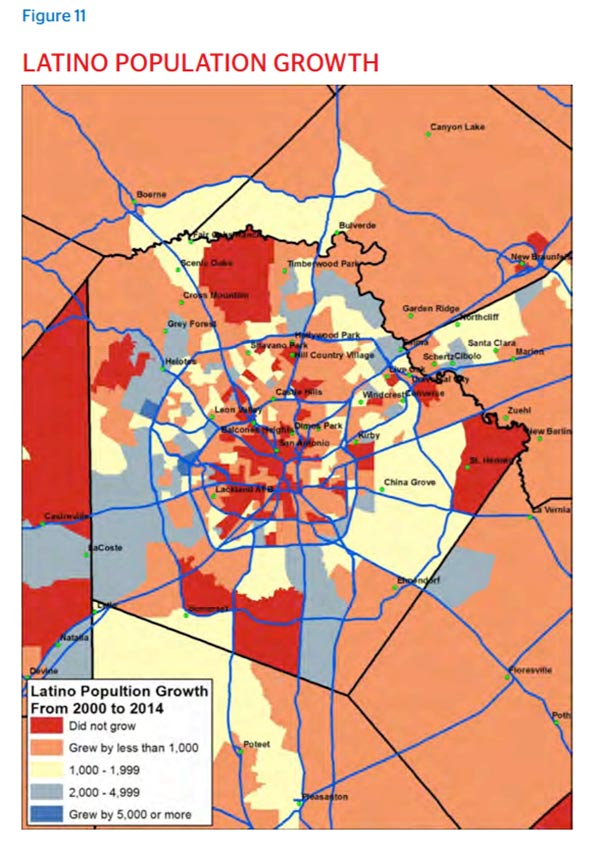
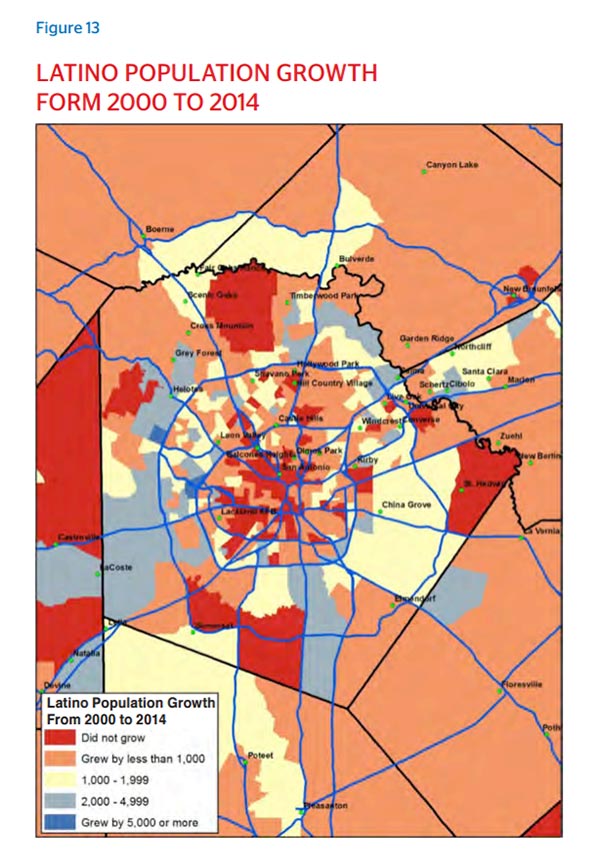
Critically, this growth has been due largely to Latinos. Since 2000, the area has been among the leaders in net Hispanic population growth, adding over 400,000 residents. Economic prosperity explains much about why people are coming. Over this time, San Antonio has been No. 6 in job growth rate among these metros, and the highest income growth among major metropolitan areas since 2005, according to Forbes magazine. When comparing Hispanic populations in the 53 largest metros, San Antonio has been one of only four to see median household income gains since 2000 and has the 15th-highest median household income for Hispanics when adjusted for living costs. According to the Kauffman Foundation, San Antonio is No.10 in startup activity, and the area unemployment rate is nearly two percentage points below the national average. The Milken Institute ranked San Antonio No. 12 among its best-performing major metros, although it has ranked higher in previous years.

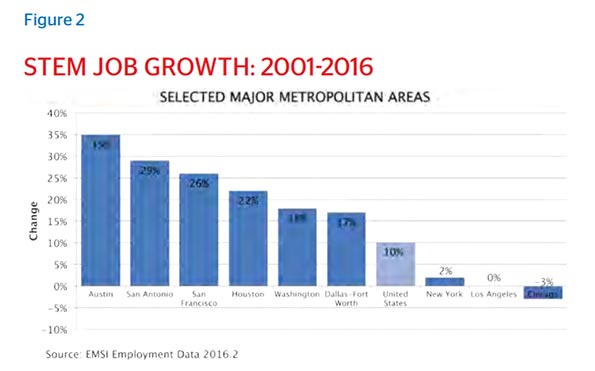
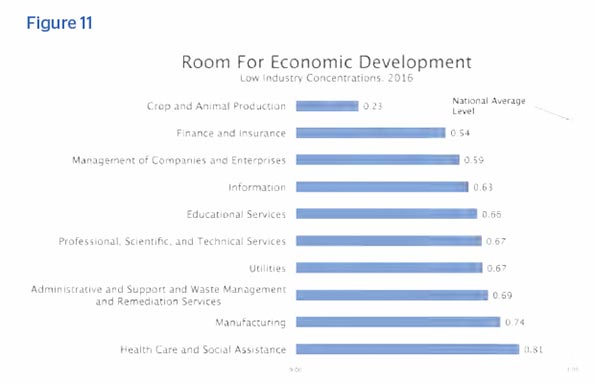
The backbone of this growth is an economy that has strengthened and diversified. In 2011, Mario Hernandez, former CEO of the San Antonio Economic Development Foundation, wrote about how San Antonio was evolving beyond its “big three” industry sectors — tourism, military and health care. His points have only strengthened since.

Among the original big three, military remains the strongest. According to a study by the city government, San Antonio “is home to more Department of Defense students and active runways than any other military installation.” The metro area also includes 55,000 military retirees. The military has a $27.7 billion economic impact and employs 189,148 people. Lackland Air Force Base and Fort Sam Houston are by far the area’s largest employers, at 37,000 and 32,000 workers, respectively, while other significant installations include Randolph Air Force Base and Camp Bullis (the names of all four begin with the moniker “Joint Base San Antonio”). There is also a special relationship between the military and the city’s Hispanics, who have historically viewed military service as an opportunity for well-paying jobs, free educations and integration into mainstream American society.

Bioscience and health care is another vast sector, having grown from $12 billion to $30.6 billion in annual economic impact since 2003.136 The industry employs 164,000, or one of six San Antonians.137 In many ways, the sector is an outgrowth of the military, as medical workers receive training for — and often operate on — personnel preparing for, or returning from, battle. Following the federal Base Realignment and Closure Commission’s report in 2005, many of the Pentagon’s medical functions were concentrated in San Antonio, infusing billions of dollars into the city. This was highlighted by the new Medical Education and Training Campus built at Fort Sam Houston, the world’s largest facility for military medical education, research and training. The center’s students often apply their knowledge at nearby Camp Bullis, a site that specializes in combat training. Just down the block within Fort Sam Houston, meanwhile, is Brooke Army Medical Center, an inpatient hospital that is the military’s largest health care organization.

Yet the military’s medical functions only scratch the surface of San Antonio’s health care sector, with much of the private and nonprofit institutions located on the northwest side. The city benefits from the South Texas Medical Center, the Baptist, Methodist and University Health Systems, the University of Texas Health Science Center, the Children’s Hospital of San Antonio, and numerous other hospitals, research labs and medical startups.

Tourism has been the city’s third economic staple, employing one in eight San Antonians. This is centered on traditional attractions like the Alamo and the River Walk, and outlying lures like Six Flags and SeaWorld. The impact will surely expand, because last year San Antonio’s five former Spanish missions were given UNESCO World Heritage status.

Aside from the big three economic drivers, San Antonio is expanding into manufacturing, aviation, finance, technology and education, all tied somewhat to the military. While not traditionally a manufacturing city, San Antonio is now Texas’ fourth-largest manufacturing market, with the industry accounting for 57,000 jobs. One notable coup came when San Antonio, thriving on the corporate relocation momentum throughout Texas, compelled Toyota to build its largest manufacturing plant on the city’s south side in 2003. There was a combination of factors involved — the state offered $133 million in corporate welfare; the city government made infrastructure upgrades; local entrepreneurs stepped up to create a supply chain; and the city is proximate to the strong truck-buying markets in Texas and Mexico. As The Rivard Report, a local news website, noted 10 years later, “the company’s total direct investment in the plant has reached $2.1 billion, with $1.5 billion or more invested by the supplier community.”

The aviation industry, an offshoot of both the military and manufacturing, has also grown exponentially in recent decades. Key to this has been Port San Antonio. In 1995, following the Cold War’s end, Kelly Air Force Base was closed. A government entity was created to repair and lease out the vast space to private companies, and the port has become a profitable facility, avoiding the graft and waste endemic in other American ports. Port San Antonio, which is located not near water but near heavily trafficked I-35, is dedicated to heavy industrial and aerospace uses and includes tenants like Boeing, Lockheed Martin and StandardAero, although it also houses cybersecurity and IT companies.

The military has also brought growth to San Antonio’s financial industry, specifically through the rise of niche companies that loan to military members, who are traditionally seen as higher risk. The granddaddy of them all is USAA, a Fortune 500 firm headquartered in northwest San Antonio that employs 17,000. Significant mainstream banking institutions include JP Morgan Chase, which employs 5,000 locals, and Frost Bank, based in San Antonio. By year’s end, the latter company will break ground on a new 23-story downtown headquarters.

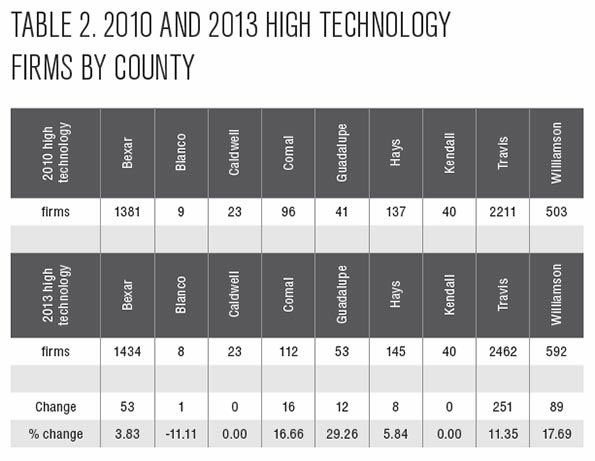
The military has driven tech growth, as well. Some of this $10 billion impact is generated by federal agencies that contract with local IT and cybersecurity firms, making San Antonio No. 2 in the country in concentration of data centers. Much of the rest comes from a more subdued private startup scene, which has benefited from the city establishment’s focus on tech, and the energy of one man, city native Graham Weston. In 1998, Weston co-founded Rackspace, a cloud computing company in northeastern San Antonio that employs 3,300 and is valued at $3.29 billion. Weston has since made it his mission to grow a tech scene downtown, renting out incubator space and filling it with small organizations that collaborate on ideas, including Weston Urban, the 80/20 Foundation, Geekdom, Techstars and Tech Bloc.

Lastly, the military — and San Antonio’s wider network of STEM enterprises — is inspiring educational growth. While San Antonio has historically enjoyed several small, renowned liberal arts schools, it more recently strengthened its public higher education. A University of Texas branch opened in 1969, and a Texas A&M branch followed in 2009. UT San Antonio, has an enrollment of 28,000. Its cyber security program is ranked first in the nation by tech industry professionals, meaning that graduates can plug into the region’s tech and military scene. The local community college system, Alamo Colleges, has partnered with Port San Antonio to establish workforce development programs, and the general focus for its roughly 60,000 students is on aerospace, manufacturing and IT.

One industry in San Antonio that has not been particularly strong — likely to the benefit of the others — is local government. In many major U.S. cities, the largest employers are some combination of city governments, county governments and various civil service authorities. In San Antonio, the city government is the ninth-largest employer at 9,145.

But perhaps the biggest economic driver has been population growth itself, with the city proper adding 325,000, and the metro area growing by 673,000 since 2000, creating a greater demand for housing, cars, services and food. San Antonio’s most inspiring private-sector story provides a window into that growing consumption. The region’s largest private employer, at 20,000 people, is H-E-B, a San Antonio-headquartered supermarket chain. Founded in 1905 by Florence Butt, who opened a small shop in nearby Kerrville, it has skyrocketed under her grandson Charles’ leadership, largely by remaining based in one of America’s consistently fastest-growing states. H-E-B has 316 stores in Texas and 52 in Mexico, and is one of America’s most highly

valued companies, at $22 billion.

Demographic Momentum

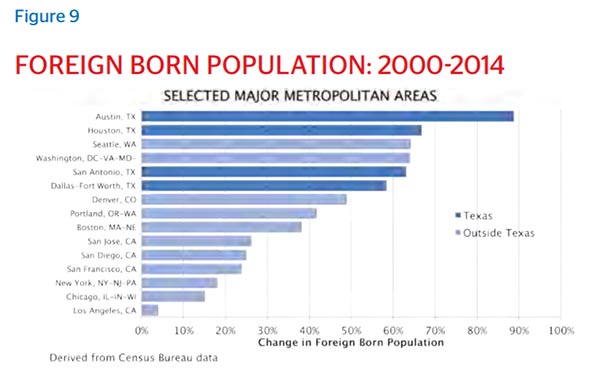
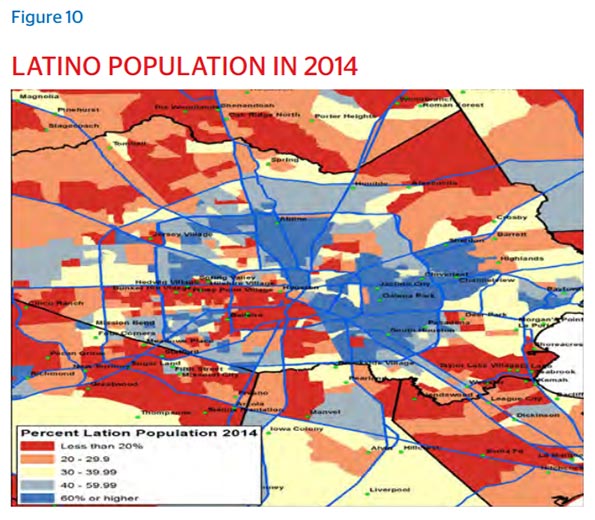
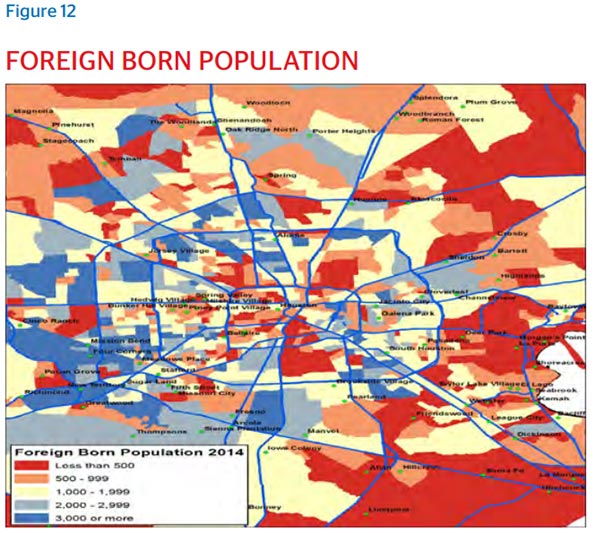
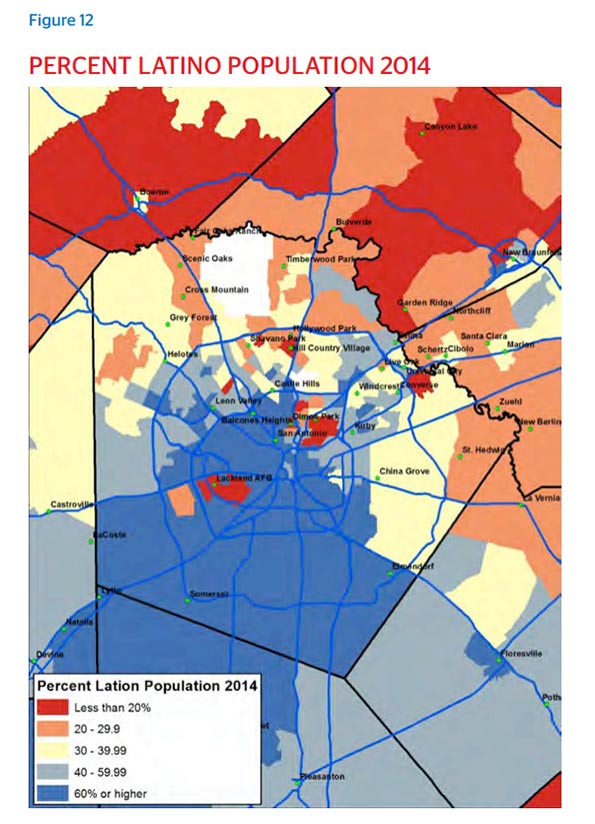
So which groups are driving this population increase? The San Antonio area , at 63.2 percent, is the most Hispanic major MSA in the country, well ahead of Miami MSA at 43.8 percent. San Antonio’s Hispanic population largely consists of Tejanos, a south Texas term describing native Texans of Mexican descent. According to Pew Research Center data, 89.6 percent of San Antonio’s Hispanic population is Mexican. This is the largest share among Texas’ Big Four cities. But, notably, San Antonio has by far the lowest percentage of Hispanics who were foreign-born. While the share of foreign-born Hispanics is 32.4 percent in Austin and around 45 percent in Houston and Dallas — not to mention 42 percent in Los Angeles and New York City, 54 percent in Washington, D.C., and 66 percent in Miami — it is only 17 percent in San Antonio. This is because many of them have lived in San Antonio for generations.

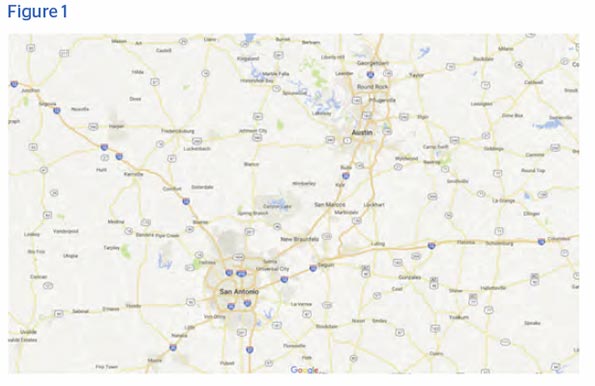
Additional Mexican-American influxes originate from Texas border towns like Laredo, Brownsville, McAllen, and other parts of the Rio Grande Valley. Tejanos have traditionally viewed San Antonio as a destination for jobs, education and entertainment. At the same time, the city is a short drive from their families. This proximity is important, explains Stephanie Reyes, a public-affairs staffer at the San Antonio Chamber of Commerce and a Brownsville native.

“In most Hispanic cultures, [families] want you to stick around, they want to see you grow, especially if there’s that possibility of you raising a family elsewhere that they’re not going to get to take part in, seeing them grow up or seeing them every weekend. Here in San Antonio, [south Texas Tejanos] have that opportunity.”

Nonetheless, there is still a lot of Mexican immigration into San Antonio, although the profile has changed. The stereotypical Mexican entering the city postwar was the poor agricultural worker. More recently, San Antonio has seen an explosion of professional-class Mexican migrants from major cities like Monterrey, five hours south on I-35. This group’s wealth has made them targets for kidnappings in their homeland. So they have moved to the U.S., with over 50,000, according to a Los Angeles Times report, coming to San Antonio, thanks to its proximity and ingrained Mexican culture. They have worked in white-collar professions and inhabited north-side gated communities, becoming known for lavish consumption. This is evident on any weekend in the upscale north-side mall of La Cantera, where parking lots are jammed with luxury cars and the walkways with Spanish-speaking shoppers in designer clothing.

Javier Paredes, a local architect who grew up in Morelia, Mexico, epitomizes some of these trends. Eight years ago, his mother, an influential mining broker, was kidnapped and forced to reveal company secrets. After her release, the family settled together near downtown San Antonio, because of the city’s cultural familiarity.

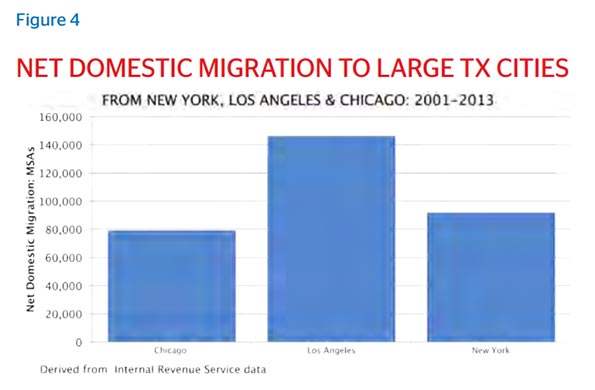
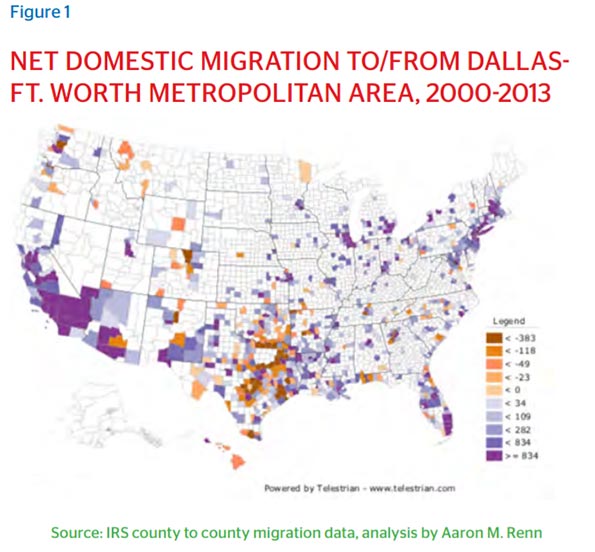
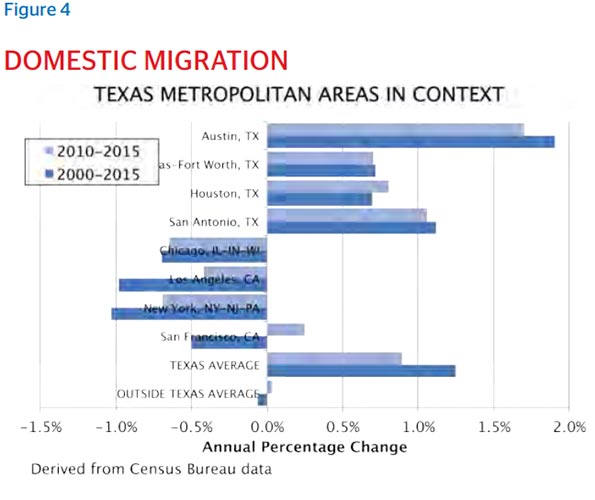
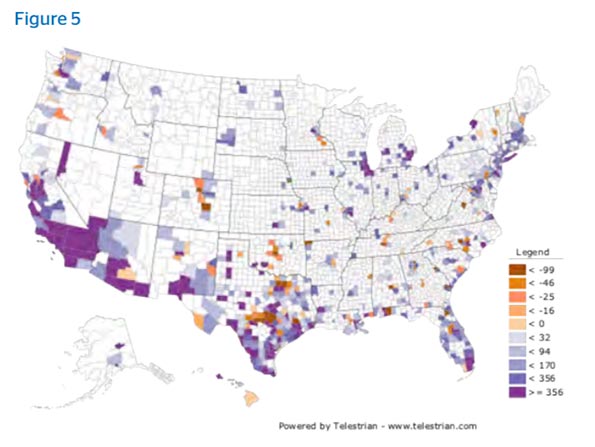
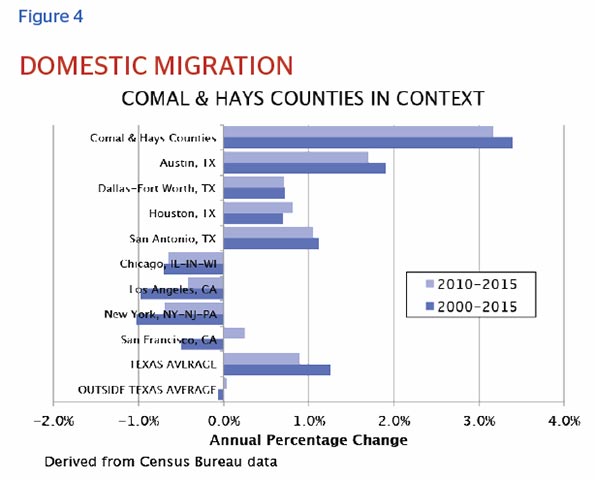
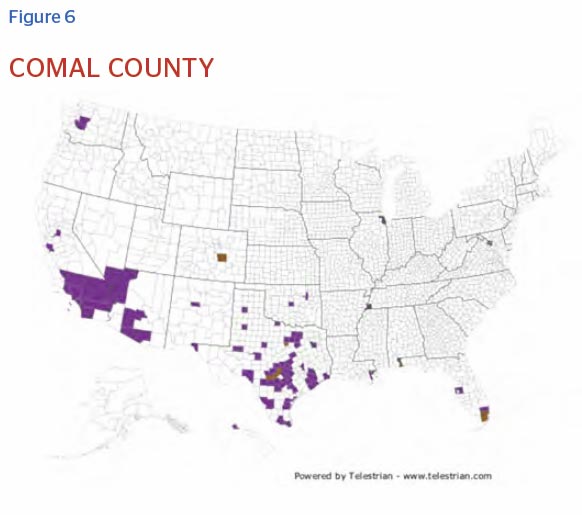
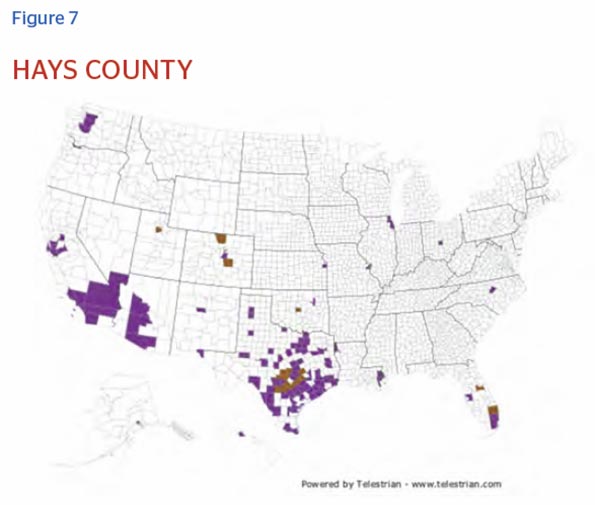
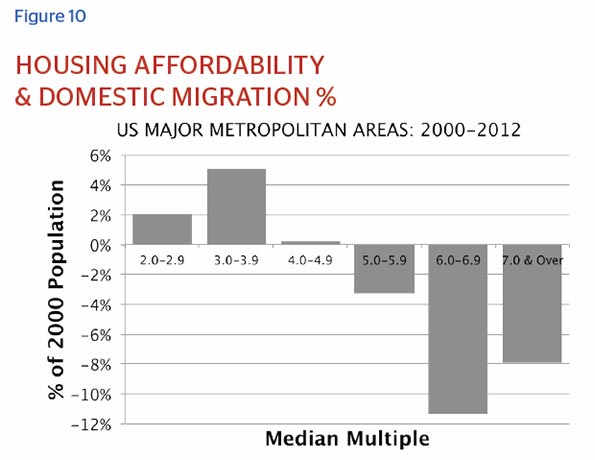
There has also been substantial in-migration from many races and places throughout America. San Antonio has become, like the other Texas cities, a major lure for domestic migrants. This is in stark contrast with major ocean coastal cities such as New York, Los Angeles and Chicago.

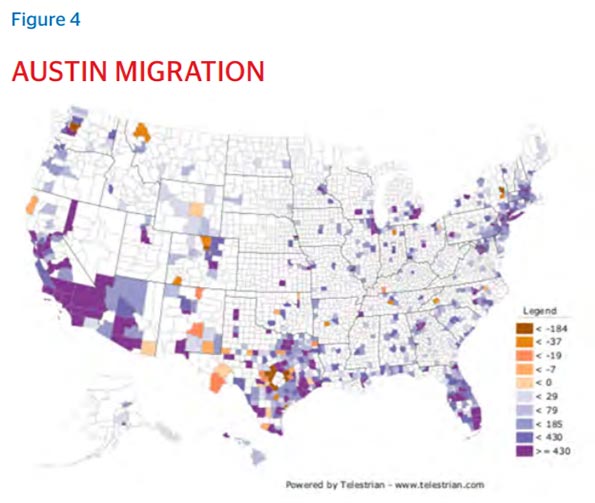
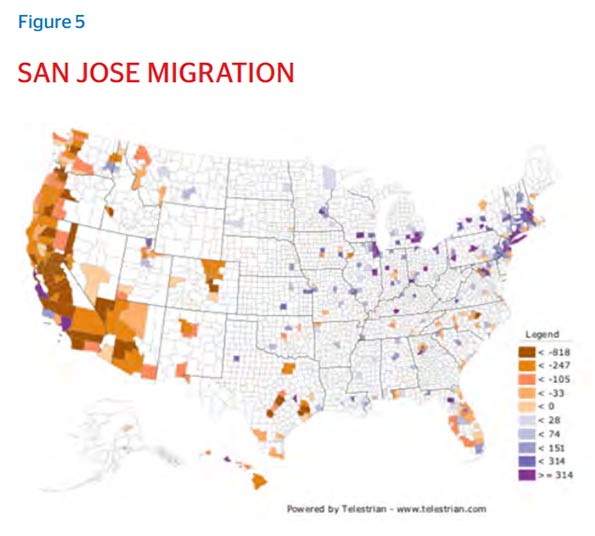
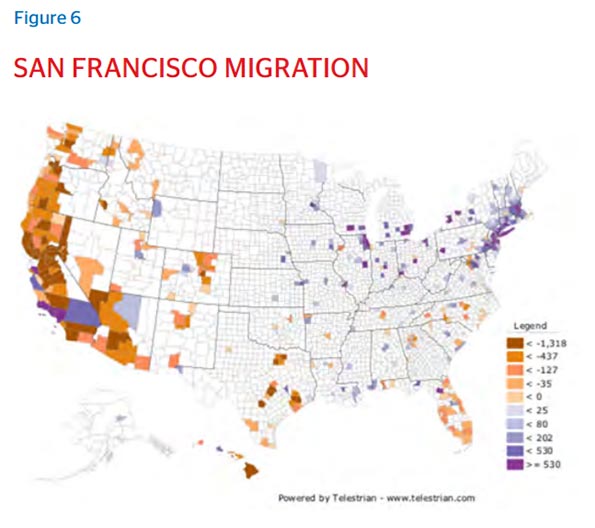
This domestic growth was displayed in a map by Manhattan Institute senior fellow Aaron Renn, showing which parts of America people net are leaving for San Antonio. There are only a handful of areas that had positive net migration from San Antonio, most notably Austin, 80 miles to the northeast. Meanwhile, whole swaths of the country — including much of California, Cascadia, Florida, the Southwest, the Northeast and the Rust Belt — are pushing people out and into San Antonio.
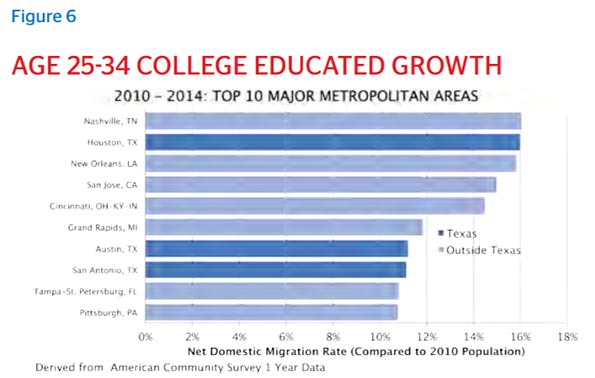
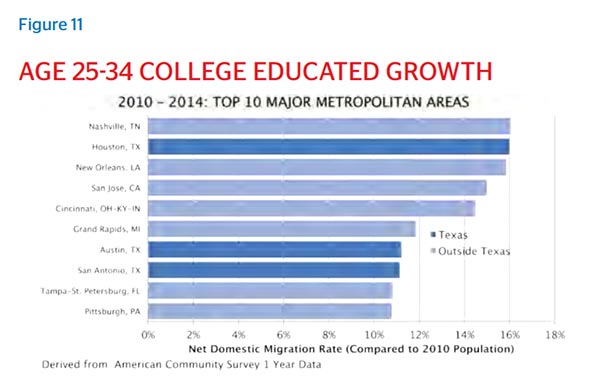
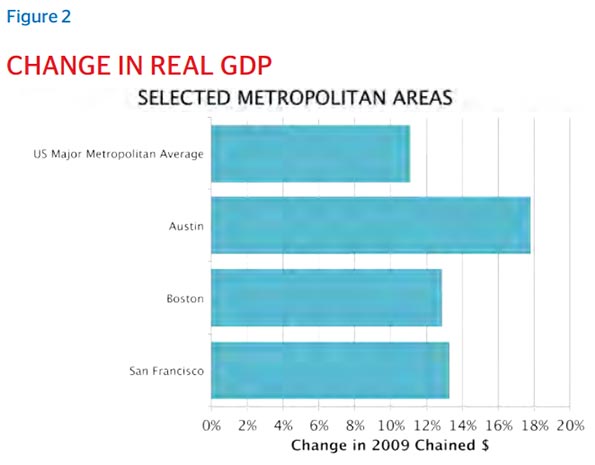
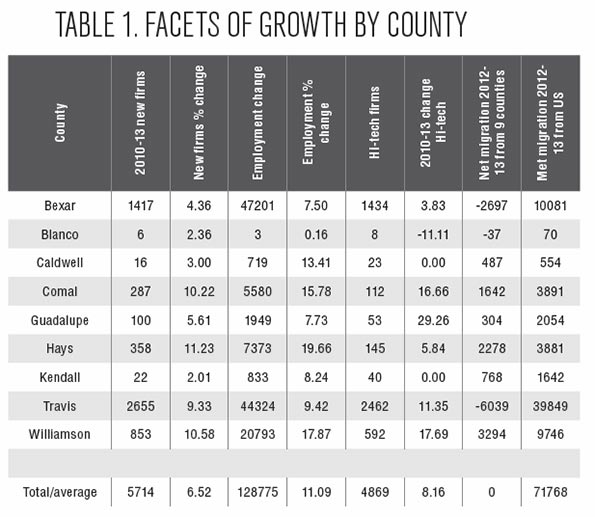
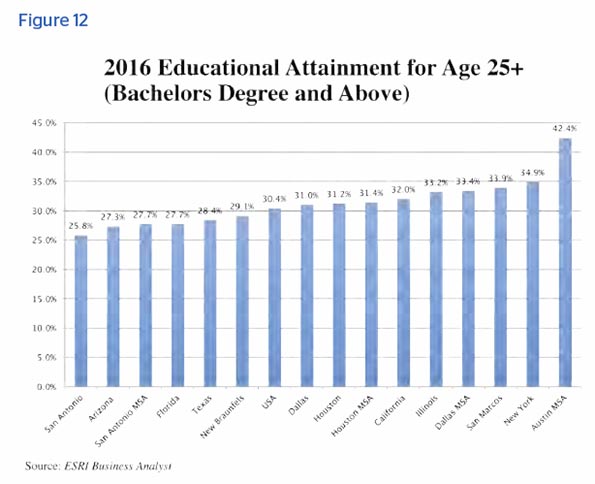
This is particularly true for the young. Once an area that had trouble holding onto younger educated people, the region has now emerged as one of the fastest-growing destinations for them, outpacing in terms of growth such traditional “brain gain” centers as New York City, Boston and San Francisco. From 2010-13, San Antonio had the second-highest percentage growth among college-educated persons ages 25-34, and the fastest growth rates over that period for 20-to-29–year-olds of all education levels.

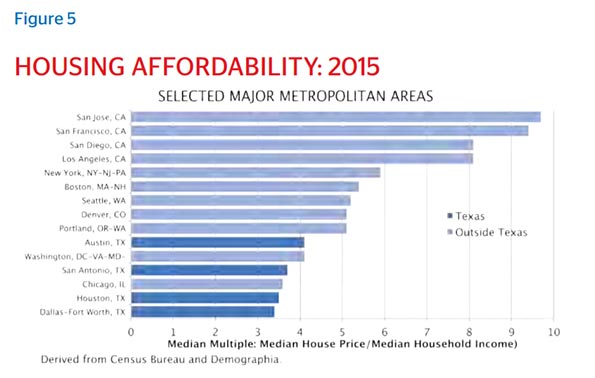
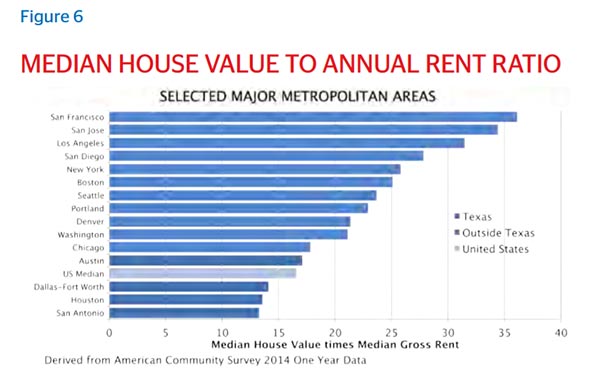
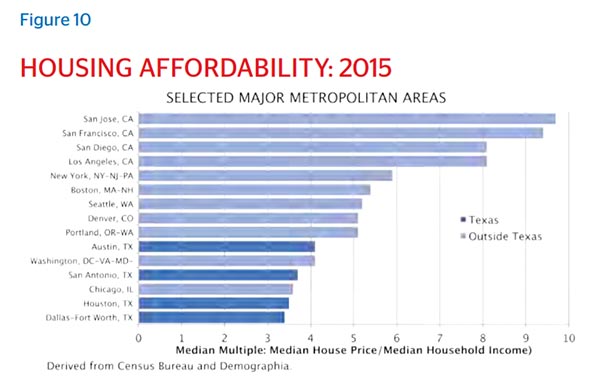
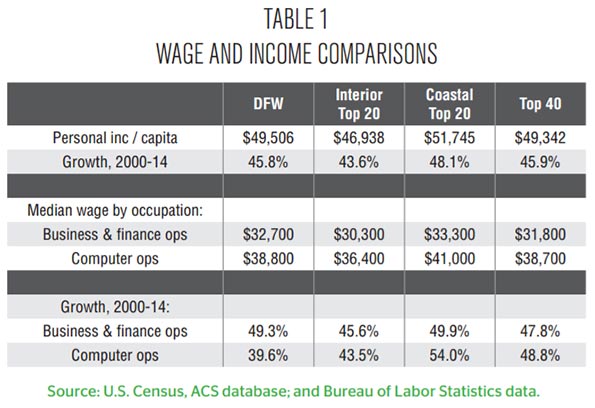
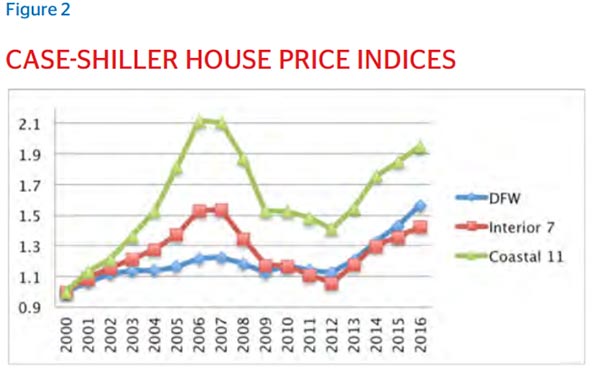
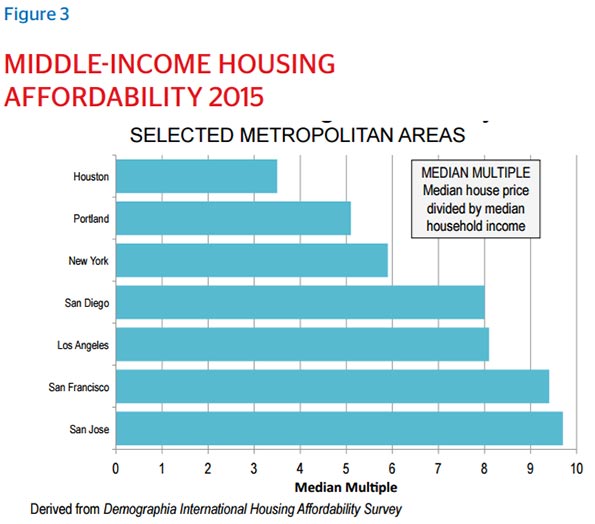
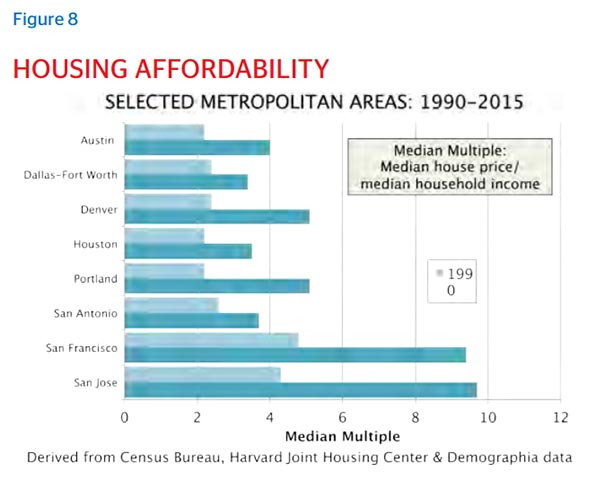
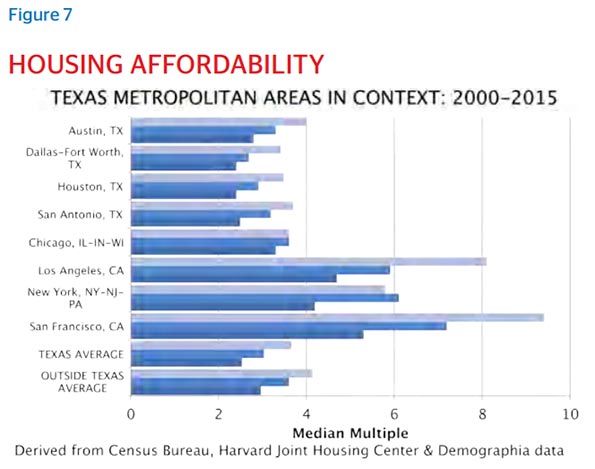
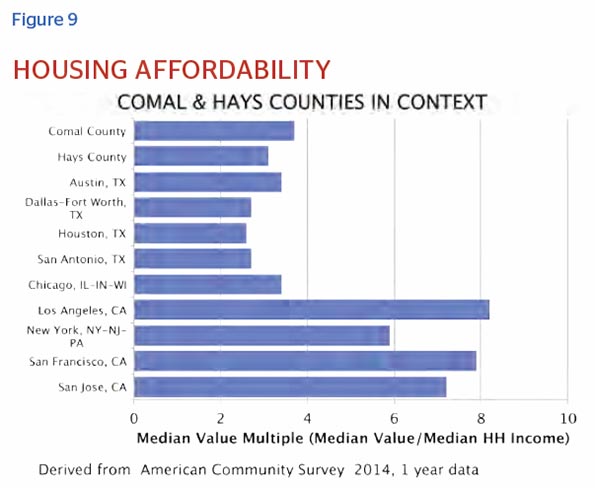
The reasons are multifaceted: Some people may be seeking warmer weather, better amenities or a historical setting. More likely, migrants are drawn to San Antonio for pragmatic reasons. The cost of living is relatively low, highlighted by median home prices that, at $131,000, are $55,000 below the national median. San Antonio also has strong employment opportunities and companies desperate to hire, explaining the wage growth.

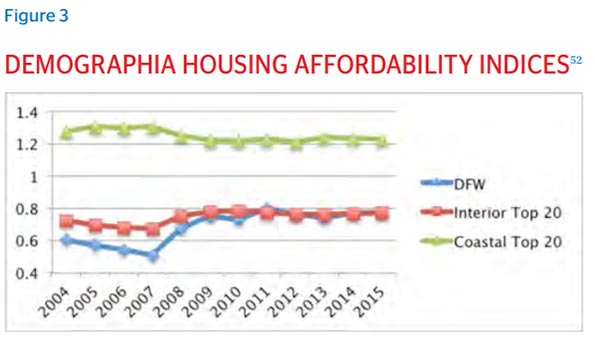
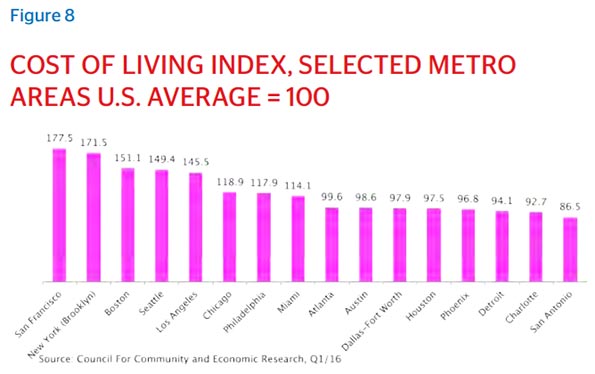
These low housing prices explain much of San Antonio’s relatively low cost of living. According to the Council For Community and Economic Research, San Antonio’s living costs are less than half those of New York or San Francisco, and considerably less even than sunbelt boom towns such as Houston, Dallas-Ft. Worth, Austin, and Phoenix.

“We don’t have enough people,” says Tony Quesada, editor-in-chief of the San Antonio Business Journal, “so we wind up importing talent from other parts of the country.”

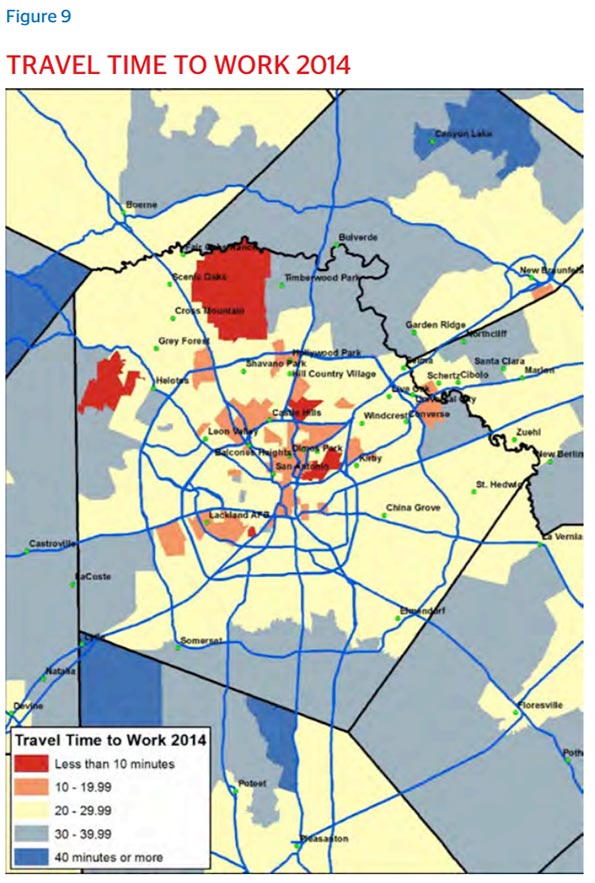
Then there are quality-of-life factors: Average one-way commute times are several minutes below the U.S. average, at 22 minutes. And, once drivers get off the city’s highways, they will likely be strolling through any number of quiet, secluded neighborhoods.

But complementing these factors is an attraction that you hear repeatedly during interviews and will find anecdotally while navigating the streets — “comfort.” San Antonio is a big city with a small-town feel, where people are friendly, and community relations are tight. This was reaffirmed in July, when Travel + Leisure magazine named San Antonio America’s Friendliest City, based on reader surveys.

Former mayor Cisneros called this dynamic the city’s “secret sauce,” claiming that it has helped unify whites and Hispanics, as well as competing factions of the business and political communities. The sentiment was echoed by outsiders, including 31-year-old real estate developer Juan Cano. By his mid-twenties, he’d grown frustrated with San Diego’s traffic, high costs and mediocre job market. So he studied what city he should relocate to, and, after combining several economic and quality-of-life factors, chose San Antonio.

He said the best thing he’s encountered in his seven years here is the city’s homey atmosphere.

“What San Antonio beats people out on is not weather, is not number of activities or amenities; but what they beat out other cities and states on is congeniality,” he said. “People here really care about how your day is going.”

Cano agrees with Cisneros that this openness also bolsters the business climate, including for small entrepreneurs like him, looking to make connections.

Formation of a New Kind of City

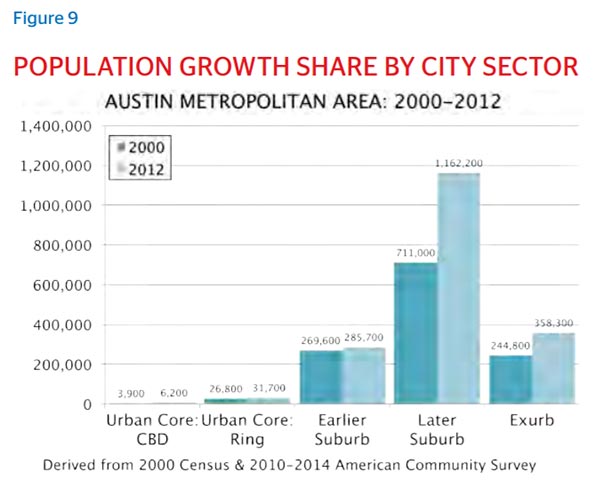
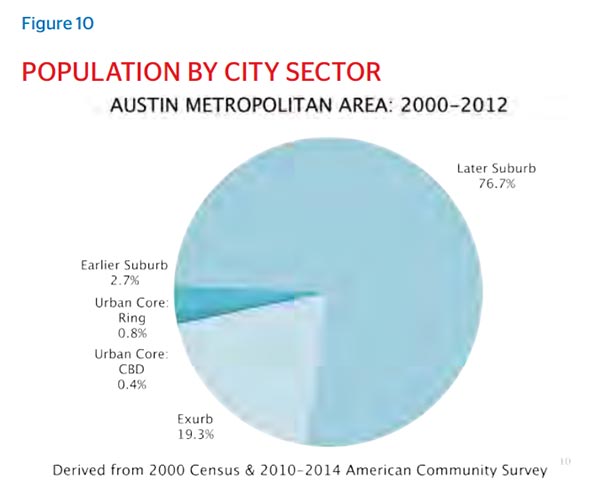
Of course, growth doesn’t occur in a bubble; when various factors drive lots of people into an area, there will be tangible changes at street level. A traditional urban commentator might guess that such growth would produce infill densification, as it did for the coastal cities that boomed during America’s industrial era.

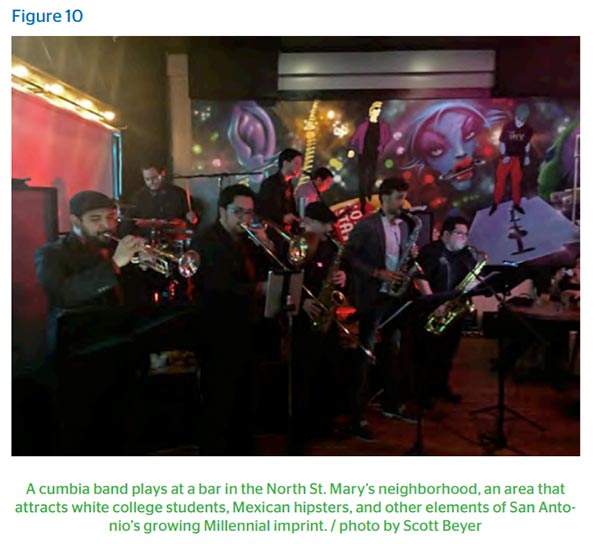
And to some degree, such “buzz” is now felt in Texas’ opportunity cities, including San Antonio. While its downtown remains largely for tourists, adjacent areas are growing more vibrant and cultured, thanks to millennial population growth and city-funded enhancements. The River Walk has been extended north and south of downtown, sparking mid- and high-rise development. Along the “Southtown” portion of the route, new condos mix with historic homes and mostly unpretentious nightlife. Along the route’s northern portion, the city pursued a public-private partnership to create the Pearl District, a mixed-use, master-planned development that has become one of America’s leading warehouse revitalization stories. Other interior neighborhoods — North St. Mary’s, Tobin Hill and the Market Square area in west downtown — are slowly filling in.

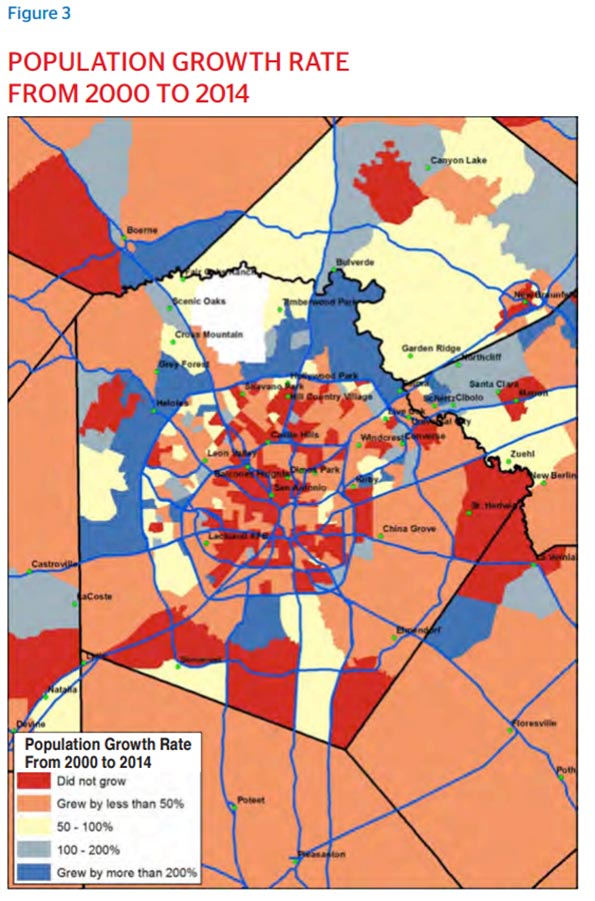
But if San Antonio is showing some welcome growth in its inner ring, the city’s trajectory continues further outward, primarily to the north. This section of town long was the exclusive white area, while lower-income Mexican-American families dominated the west and south sides, and African Americans the east side. This segregated pattern still defines San Antonio, although things are changing.

Stone Oak is the prototypical example: Once a stretch of undeveloped Texas Hill Country extending north from the state Highway 1604 loop circling the central city, it has become a gargantuan master-planned community of 31,000 residents in just two decades.159 It features densely packed single- and multifamily housing and retail rolling for miles.

Stone Oak accommodates much of San Antonio’s new money, which is to say that it is one-third Hispanic. The community is populated by health workers, techies, staffers at nearby UTSA and most notably, Mexican nationals.

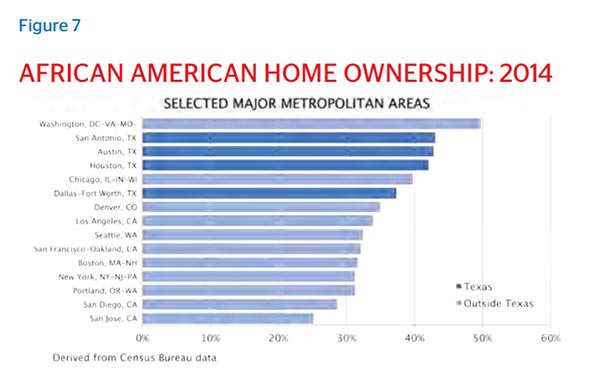
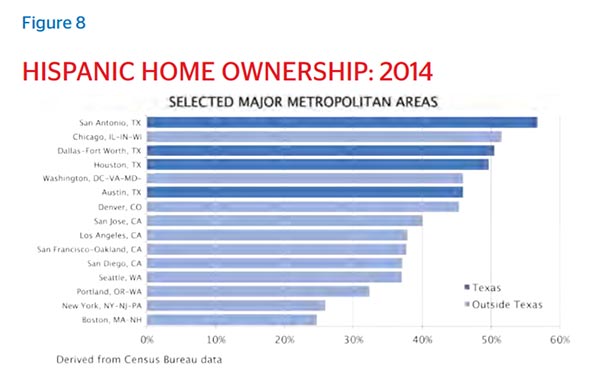
Growth is even occurring in the historically hyper exclusive suburbs carved out within San Antonio’s city boundaries, like Alamo Heights and Terrell Hills. According to Sáenz, these areas were once forbidden to minorities. Today, there is a Hispanic presence in both suburbs, and generally throughout San Antonio’s north side. This suggests that the city is providing upward mobility for large portions of its Hispanic population.

Future Challenges

Cities that enjoyed the rapid growth now experienced by San Antonio have also suffered the downsides. New York, San Francisco and Los Angeles, among others, are economically dynamic and culturally interesting, yet overwhelmed by overloaded infrastructure, service failures, growth-killing regulations and patronage-ridden political machines that only worsen these problems. When I asked community leaders how San Antonio could avoid this fate in coming decades, two answers surfaced.

The first was that San Antonio needed to continue expanding infrastructure, a point emphasized by local billionaire and Spurs owner Red McCombs. This could mean everything from doubling down on housing and highway construction to exploring 21st-century solutions like green energy. While there have been recent expansions, the San Antonio-Austin corridor lacks a top-notch airport, which may explain why neither city has had the same success attracting corporations as had Houston and Dallas. In other cases, however, the city is taking the initiative in infrastructure growth. In May, the San Antonio Water System board approved the takeover of the Vista Ridge Pipeline, a new project that will diversify the water supply. San Antonio also recently launched SA2020, a plan designed to improve the city on 58 quality-of-life indicators.

Fortunately, San Antonio is in a financial position for such expansion; while other U.S. cities’ pension debts have prevented them from even providing well-paved streets. San Antonio has among the lowest per capita unfunded pension liabilities of any major city. For six consecutive years, the city has received a perfect bond rating. It also has a population, said McCombs, while overlooking the downtown skyline from his north-central office, that understands intuitively the connection between capital investment and prosperity.

“You give Texans a good reason for paying taxes,” he said, “and they’ll pay them.”

Secondly and perhaps even more critically, San Antonio needs to continue mobilizing its minority population, mainly by improving its K-12 education system. While there are countless success stories here, there are also Mexican-Americans and African Americans who have lived in multigenerational poverty on the city’s west, south and east sides, and low-skilled, non-English-speaking immigrants are still arriving. Many of their neighborhoods, while certainly nicer than most urban American slums, are nonetheless rundown and have lower-performing public schools than those in outlying areas. The city and the state have taken several recent measures to address the problem, including a city voter-approved sales tax increase for Pre-K schooling, and charter school expansion.

Other K-12 measures have been more innovative. The SA Works program, for example, is a partnership between the city and the Chamber of Commerce to connect high school and college students with local companies and other supporting agencies, who then offer internships and job-shadowing opportunities.

In June, a partnership was launched between the San Antonio Independent School District and H.E.B. to open five specialty schools that will plug students into the local employment scene.

If San Antonio continues embracing new ideas to address its infrastructure and education challenges, it will remain a regional growth engine, and an example for other cities. America, after all, is slated to become 23 percent Hispanic by 2035. San Antonio represents an extreme early version of this demographic shift, and an example of how it can work.

“San Antonio,” concluded Cisneros, is “driven by the understanding that jobs and incomes are the way we’re going to progress, and, in fact, we have. I see it in the quality of restaurants, the [more diverse] crowd at the Spurs [games], in the retail mix of the city, the integration in neighborhoods, with Latinos and African Americans moving into neighborhoods once beyond their reach. Intermarriage. It’s almost as if a new culture has emerged. … It’s one culture adapting the things that it likes about another culture.”

These same economic and cultural improvements can be observed in other big Texas cities, suggesting that they are the outcome of liberalized polices. San Antonio, as the Mexican-American capital, has long been the underdog of the four great Texas cities. But today its Latino character is proving to be yet another asset, contributing a unique wrinkle within Texas’ broader urban growth story.

Scott Beyer is a Forbes columnist and cross-country traveler who covers U.S. urban issues. For three years, he’s circling America to live for a month each in 30 cities, starting from Miami and ending in New York City. The point is to write a book about revitalizing cities through Market Urbanism — which is the intersection of classical liberal economics with urban issues. But he also writes articles on multiple other city subjects.

Top photo: Zereshk [GFDLCC-BY-SA-3.0 or CC BY 2.5], via Wikimedia Commons

A Summary of the Analysis and Motivators of Growth in the Austin - San Antonio Corridor

$
0
0

This essay is part of a new report from the Center for Opportunity Urbanism titled "The Texas Way of Urbanism". Download the entire report here.

A new economic corridor is emerging in the center of Texas. Hays and Comal Counties are part of the Austin and San Antonio metropolitan areas respectively. But they are not merely suburbs capturing overflow from larger cities. They are becoming part and parcel of an emerging 80-mile long economic corridor between San Antonio and Austin, along the I-35. In the process, this region centered around San Marcos and Hays County, is emerging as a hub in its own right.

This new corridor is beginning to resemble another Texas style “metroplex” between Dallas and Ft. Worth. It is a development that can also be compared, in some aspects, to other growth corridors, such as the San Jose to San Francisco strip, the Raleigh-Durham area and the Wasatch Front stretching from Ogden through Salt Lake City to Provo.

Texas State Demographer Lloyd Potter foresees an additional 1.5 million people in the corridor by 2030, a nearly 34 percent jump. In Hays and Comal counties, the state projects between 69 and 44 percent in population growth during that period. “Over the next 50 years, Austin and San Antonio will become a single mega-metro area,” Austin Mayor Steve Adler says. “The corridor in between will be the first reflection of this coming future, providing greater connectivity to serve the increasing interdependence and joint economic potential as the two cities grow together.”

As occurs in many emerging regions, the Austin-San Antonio can be considered multi-directional, extending to and from both larger cities, but also from the emerging hub around San Marcos.

The San Marcos segment of the Corridor is already more than a bedroom and retail community. Amazon decided to build an 855,000 square foot fulfillment center in San Marcos (Hays County) that will eventually employ 1,000 people. Sysco Corporation opened a distribution facility in New Braunfels (Comal County) that employs 650 people. More importantly, Texas State University in San Marcos, with nearly 40,000 students and a growing research profile, is anchoring an emerging high tech base for the corridor.

Something big is starting to happen in this once rural region of Texas. This report is divided into three sections that explore – the what, the why, and the future. The best predictor of the future is usually what has happened in the past, let us begin there.

Dimensions of Regional Growth

The rate of growth in Hays and Comal Counties is exceptional, even by the standards of Texas. They are far outpacing the nation in both population and jobs, and growing at twice the rate of Texas as a whole. The two counties exceed even the rest of metro Austin, which has historically been among the leaders in job growth nationally. Three of the 25 fastest growing counties in the country are located in the Austin-San Antonio Corridor.

The table below highlights the dimensions of this very rapid growth.

Employment Growth. There has been a pattern of positive employment growth in all counties, with Hays the leader followed by Williamson then Comal. The entire corridor is among the national leaders in job creation, out-distancing not only the nation but Texas as well.

New Firms. We see more new firms in all counties, with the highest percentage growth in new firms occurring in Hays, then Williamson and Comal counties. The definition of new firms used here includes opening of new branches or plants by existing firms that operate multiple establishments.

High-Tech Firms. Growth of high-technology firms occurred in 6 of the 9 counties, with Guadalupe the leader in percentage terms followed by Williamson then Comal and Travis counties.

Population. The entire San Antonio-Austin corridor has some of the most rapid growth in the country, as we can see in the first slide. The region also contains many of the fastest growing counties not only in Texas but the country.

Migration. Williamson County gained the most population from those living in the nine county region, followed by Hayes and Comal. Overall the entire Corridor has experienced large domestic in-migration, well above Texas averages, and even more so in comparison with large metropolitan areas like New York, Los Angeles and Chicago.

The following sections provide more detail on this out-sized performance.

Industries Driving Regional Employment Growth

Employment growth has been broad across several industries, with the fastest growing industry being Electronic Shopping and Mail-Order Houses. Another cluster of fast growing industries are private (not public) firms involved in education and training (Elementary and Secondary Schools, Other Schools and Instruction, Technical and Trade Schools, Business Schools and Computer and Management Training). This does not include the significant role played by Texas State University in education related to business and computer management and engineering.

This job growth, of course, has been driven by population growth. In terms of location quotient, the area remains much stronger in lower-end service industries. For example, Hays and Comal counties have 26 and 16 percent of employment in retail industries compared to only 13 percent nationally.

But this appears to be changing, as evidenced by the growth of key “export” industries --- that is goods and services largely consumed elsewhere. This includes key manufacturing fields, such as Industrial Machinery, Motor Vehicle Parts, and Metalworking Machinery. Overall the area is enjoying a manufacturing boom that far exceeds the national average.

This growth is also evident in several key service industries such as Management Services, Educational Services, and Professional, Scientific and Technical services. Particularly critical has been the logistics and wholesale industry, which serves not just the local economy but the entire regional and nation, with the massive new Amazon facility representative of this type of growth. Although much of the region’s growth has been in traditionally lower-wage service industries, the fastest growing sectors tend to be higher wage, information fields like management of companies and enterprises, educational, professional, scientific and technical services.

Is a High Technology Corridor between Austin and San Antonio Emerging?

Located between the high-tech hub of Austin and the emerging one centered in San Antonio, the region between the two is also showing growth in high-tech firms, as show in table 2 below.

The most rapid growth has been in Basic Chemical Manufacturing, Software Publishers, Computer Systems Design and Related Services, Commercial and Service Industry Machinery Manufacturing, Scientific Research and Development Services, and Pharmaceutical and Medicine Manufacturing.

The high-technology industry with the largest number of establishments was Computer Systems Design and Related Services, consistent with the reputation of Austin as an emerging leader in this area of economic activity. Architectural, Engineering, and Related Services had the second largest number of establishments, followed by Scientific Research and Development Services, Oil and Gas Extraction, and Software Publishers.

The total number of firms in Hays and Comal remains much lower than in the far larger Travis and Bexar Counties, but their growth shows that the San Marcos Corridor segment is already participating in the regional high tech cluster, with potential future upside from its growth.

If the region is to develop into a larger high tech center, Texas State University will play a vital role in powering that transformation as it continues to expand its research reputation and the funding that goes with it. Texas State has already helped launch an important tech industry venture with the establishment of the Science, Technology and Advanced Research (STAR) Park which sits on 58 total acres dedicated by Texas State for future expansion. Executive Director Stephen Frayser describes the park as an accelerator, now helping eitht for-profit companies to market, including three student startups. STAR One, the first building, broke ground with 14,000 square feet, but filled up quickly. Frayser says, “We have had to expand twice since opening in November, 2012 and will have 36,000 square feet operational by September 1, 2016."

How the future growth of Texas State, its research funding quest, and initiatives such as STAR Park play out will do much to determine the degree to which San Marcos’ high tech ambitions take off.

Population Growth and Migration

People are an increasingly critical raw material for economic growth in San Marcos (Hays County) and New Braunfels (Comal County). Overall Hays and Comal have enjoyed among the fastest growth rates of any counties over 100,000 in the nation, easily outpacing even the torrid growth experienced by Austin and other Texas cities. The following map tells us the regions and feeder states from which Hays and Comal Counties have been drawing net migration.

Outside Texas, California was the largest source of in-migration and also the largest destination for out-migration. (In the case of Travis County, California is the second largest source of in-migration with Florida being first.) Focusing on California and Florida, we see total net gains from California equal to 6,182. In the case of Florida, we see total net gains equal to (9,776 during the 2012-2013 period.

Explaining Regional Growth: A Geographically Advantaged Region

What accounts for the growth of the San Marcos Corridor? Three factors loom large: the region’s unique geographic advantages and exceptional quality of life that set it apart from other suburban regions, and the high quality public policy environment of Texas.

Just as Dallas-Ft. Worth benefitted from being a highly multi-polar “metroplex” that evolved from two formerly distinct urban areas, a similar (if smaller scale and more nascent) effect is taking place between Austin and San Antonio.

Dallas and Ft. Worth are 33 miles apart. Austin and San Antonio are 80 miles apart. Despite the greater distance, much of the I-35 corridor is already developed between the two. It makes logistical and financial sense to locate some facilities, such as Amazon’s fulfillment center, in the San Marcos Corridor segment to easily serve both markets.

The same effect applies to people too. Those who live in the corridor have the ability to commute to either major city to work, giving them access to more potential employment opportunities. San Marcos is about 30-45 miles from downtown Austin or San Antonio – a long but doable commute – which is shorter than in many suburban areas. However, in both Austin and San Antonio, there are many jobs located in suburban areas that are closer to San Marcos.

A look at job growth by occupational category reveals the Hays and Comal advantage. Nationally, the largest 21 broad occupational categories account for one third of all employment. In Austin and San Antonio, 21 broad occupational categories (not necessarily the same) also account for around one-third of all employment.

Of these 21 categories of jobs, 16 were in common to Austin and San Antonio, and the percentage change in these types of jobs were compared for Austin and San Antonio. Somewhat remarkably, 8 of the 16 job categories show a pattern where either Austin or San Antonio has higher than national employment growth while the other city has lower than national growth.

This may explain the attraction of Hays and Comal counties where residents can commute to work in either metro area. In the face of jobs requiring specific skills disappearing in one city, workers find new jobs appearing in the other city. They simply need to commute to a new job in the other city, rather than being forced to move.

This effect is magnified for households with more than one worker. One spouse can work in Austin, the other in San Antonio. Outside of pricey Austin neighborhoods, inexpensive suburban housing can be found throughout the Corridor.

The Quality of Life Advantage

Perhaps nothing drives growth in the region more than the quality of life offered by the Corridor. When we asked several business leaders what brought people here it wasn’t too long in the conversation before the discussion turned from the tangible reasons to the intangible, the big intangible being quality of life.

Dan Stauffer, Vice President of Marketing/Real Estate of McCoy’s Building Supply (which moved its headquarters from Houston to San Marcos decades ago) was quick to bring up the quality of life draw that Austin and San Antonio has for people who move to the area. Again the geographic advantage of the region is key. Austin and San Antonio are culturally very different cities; residents of the San Marcos Corridor visit both and enjoy all they have to offer – then come home and live in the relative peace and tranquility of Central Texas.

The overpowering quality of life factor in the Corridor is the Texas Hill Country. Bordered west of the Austin/ San Antonio Corridor the Hill Country is immense and very unique. It covers 11,111 square miles, offering plenty of recreational options including tubing opportunities in the Guadalupe River (Comal County), The Blanco (Hays County) and a lot more. Overall the elevation goes from about 510 feet above sea level, just east of San Marcos, to 853 feet in Wimberley to its highest elevation of 2,460 feet further in.

The Hill Country’s attraction ranges from residents and CEOs who want to move their company to be close to their ranch full time, to city dwellers who have second homes they visit to get away from it all. The Wall Street Journal’s recent article describing a “land rush for the rich” in the Hill Country testifies to its red-hot appeal.

Near New Braunfels is the Town of Gruene – which features one of America’s oldest Dance halls – Gruene Dance Hall (established 1878). It attracts over 1.2 million guests per year according to Rusty Brockman, Economic Development Director of the Greater New Braunfels Chamber of Commerce. Many artists - legends such as Chubby Checker, Lyle Lovett, and Willie Nelson and relative newcomers like Kevin Costner have performed there according to the Gruene Dance Hall website.

The Texas Policy Advantage

Although the region has generally outpaced other Texas cities in terms of the growth, the area’s emergence has much in common with the same things that have driven the growth of other Texas cities.

There are a unique set of conditions that exist in both Texas and the emerging Central Texas Corridor which do not exist in very many other places. We’re not saying that they individually don’t exist throughout the other 49 states, but together this complete set of free market oriented set of rules and tax rates would be hard to find in too many places. These include being a no income tax state, a right to work state, and having biannual legislative sessions that limit the opportunity for regulatory mischief.

These reasons provide a base of attraction for businesses and people to consider Texas – and the Austin – San Antonio Corridor – to relocate, expand and grow.

Source: Tax Policy Advantage, 2015

Texas also does not impose a traditional corporate income tax, though it does impose a modified gross receipts tax, commonly known as the Margin Tax. However, in 2014, this rate was only 0.975%.

When doing the math, you can see that individuals and businesses coming from the area’s large feeder states can look forward to keeping more of their own money – a worker or investor from California gets a raise of 13.3% for starters, not to mention much lower property prices. The pretax incomes in some feeder states may be higher, but will in most cases be lower once tax burdens are accounted for.

Overall, Texas’ tax climate is ranked 10th by the Tax Foundation.188 California, the state sending the most people to the area, ranks 48th. Other key feeder states to the region also score lower than Texas, include Colorado (18th), Illinois (23rd), Arizona (24th), Virginia (30th), Oklahoma (33rd), Georgia (39th) and New York (49th).

Beyond low taxes, Texas also has a regulatory system that’s friendly to business and housing development. In part this comes from a state legislature that meets only once every two years. Only four states still do this (the others are Montana, Nevada, and North Dakota). The legislatures of every other state meet annually.

A biannual legislative session does not necessarily guarantee less burdensome regulations, though legislators do have fewer opportunities to regulate. But Texas’ biannual legislature is indicative of its business friendly mindset, which we see clearly in the output. This includes a right to work law, which prohibits employees from being forced to join a labor union.

Even within Texas, the counties at the center of the Corridor maintain distinct advantages. One key advantage can be seen in such things as property taxes, which comprise the bulk of the tax burden in Texas. Hays and Comal counties, and their cities, offer favorable numbers that attract not only feeder states migrants, but feeder Texas cities and county migrants.

Home prices constitute an advantage for most Texas cities, but even here, the Hays-Comal hub provides even a higher level of affordability. Low taxes and low housing prices make a very convincing case for companies, and individuals, coupled with strong job growth.

Housing affordability has become one of the key determinants that attracts new migrants to a region. Those areas with high prices relative to incomes tend to lose migrants while those with lower costs --- a median multiple of four or less --- tend to attract newcomers.

The Future of the San Marcos Corridor: A New Start for Texas?

Lee Graham, President of Mensor LP, a market leader in pressure calibration that moved from Houston in 1978, suggests, “There’s a lot of similarities between what happened with Dallas and Fort Worth 30 years ago with all the communities that filled in between there…. It all developed and filled in.” He went on to say that there is more industry coming on line in the Corridor - even talks about the viability of a future regional airport in Hays or Caldwell County.

Austin’s Culture Map prognosticated recently with the headline “Could Austin and San Antonio be the Next Dallas-Fort Worth?” They interviewed Austin entrepreneur, author, and speaker Gary Hoover who thinks that by 2050 the US Census Bureau will label Austin and San Antonio as precisely this kind of meg-metro area. He notes: “Just the natural growth of the two cities will cause them to collide”.

However, for this vision to become reality, there needs to be greater focus on higher paying jobs in business and professional services, manufacturing and technology. Today Hays and Comal County employment is concentrated in construction (including residential and multifamily), retail trade, accommodation and food services and arts, entertainment and recreation -which has fueled the 37% job growth from 2006-2016. Yet, as we have seen above, the fastest growing sectors are in higher-wage, skilled and technical fields. Despite growth in these fields, the area still lags the national average in many key fields like information, management of enterprises, finance and professional, business and technical services.

It is critical to note that the Corridor --- particularly the Hays-Comal area --- has only recently emerged from an essentially rural past. The key is to make sure that this pastto-the-future transition is tilted towards higher wage, high skilled sectors.

Yet the past does not define the future. Silicon Valley was largely agricultural as late as the 1960s and Raleigh-Durham even later. In contrast Boston’s 128 beltway grew amidst the oldest industrial area in North America, and yet ultimately lost preeminence to the Valley.

The formula that needs to be applied here is forward looking. An agrarian past is no barrier, and may even, to some extent, be an advantage to a region that wants to capture expanding growth from already strong metropolitan economies. The room to expand, lower cost of living associated with less developed economies, and a commitment to preservation of some open space could prove advantageous over the long term.

Key Future Challenges

However, just being at the right place at the right time may not be enough. Hays and Comal Counties face many challenges that must be overcome to achieve long-term success. Education has been a big part of all high-tech corridor successes, and Texas State University is certainly a piece of it. But there is also the challenge of training the existing workforce; although improving, the education level of the counties remains below national standards but competitive to the city and county comparisons nearby (see charts 1 and 2). Efforts to upskill the existing workforce will be critical in the future. Just as important is keeping up with infrastructure needs, particularly transportation.

Perhaps the greatest vulnerability of the corridor lies with educational attainment. Although the Austin area is very strong, and well above the national average, the San Antonio region is lagging, as is New Braunfels. In contrast, in large part due to Texas State, San Marcos is above the national average in educational attainment. Expanding the area with high concentrations of college educated people seems a critical step to fulfilling the vision of a thriving Corridor between Austin and San Antonio, and the emergence of Hays and Comal as key players in the new regional configuration.

Fortunately, there are positive efforts and activity in all three areas.

The Greater San Marcos Partnership, according to President Adriana Cruz, has developed a five-year regional economic development strategy (Vision 2020) aimed at growing the region’s economy to attract the high skilled and wage jobs critical to the region’s future.

Since 2006, ten new schools have opened in the four Hays County School districts: Hays, San Marcos, Wimberley and Dripping Springs. Three new schools are to open soon in both the Hays and Dripping Springs school districts.

In Hays County the three workforce development players are Gary Job Corps Center (US Department of Labor), Workforce Solutions Rural Capital Area (multi county community partnership) and Austin Community College (ACC - Hays County falls into their 7,000 square mile service area). Texas State University was recently added to this roster having been named part of the Tech Hire community by the White House. TechHire is designed to train and develop a homegrown information technology workforce that includes ACC, Capital and Rural Capital Workforce Solutions, the City of Austin and the Greater San Marcos Partnership.

In Comal County, the Central Texas Technology Center in New Braunfels is undergoing a 25,000 square foot expansion (opening for classes in 2016) that will double the size. This is part of the Alamo Community College District. Schools in both Comal school districts have been building new schools at a rapid rate. Comal County has had seven new schools come on line since 2006 with four more due to open within the next few years.

Then there is the challenge of infrastructure and transportation. Two major highways serve the region. One is I-35, connecting San Antonio to New Braunfels to San Marcos to Kyle to Buda to Austin. The other is State Highway 130, a 90-mile toll way connecting Seguin to Lockhart to North Austin - and boasting an 85 miles per hour speed limit. Capacity is presently adequate, but future growth may put strain on these facilities. Failure to expand infrastructure has already produced traffic problems in Austin.

There is an ongoing discussion of a commuter rail line connecting Austin to San Antonio that would serve San Marcos. The proposal suffered a serious setback when Union Pacific elected not to support it, and the history of new rail projects is not necessarily encouraging.

If the area can continuously improve these critical must-haves - work force, education and transportation – the trajectory for the area seems to be very positive indeed. The corridor has many things that are likely to accelerate its growth in the years ahead: the continued growth of Austin and San Antonio, the attraction of the Hill County, Texas State University’s emergence and, the overall business climate of Texas. Of course many things could change but the future looks bright for now.

When the future becomes the past, we’ll know if we’re right.

John C. Beddow served as publisher of the Houston Business Journal from 1998 to last year. He successful turned the HBJ fromjust a weekly print product to a 24/7 digital first multi-platform business news channel. He serves on the advisory board of the Houston Technology Center and a recently started his own consulting company – Real Time Consulting, specializing in sales, marketing, media relations and project management. He lives part time in the Hill Country.

Jim LeSage received his PhD in economics from Boston College and a Master’s degree from University of Toledo, where he was a faculty member from 1988 to 2005. Since 2006 he has been the Jerry and Linda Gregg Fields Endowed Chair in Urban & Regional Economics at Texas State University. He is a Fellow of the Regional Science Association International, Spatial Econometrics Association and Southern Regional Science Association, and a past president of the North American Regional Science Council. He has published over 100 scholarly journal articles, and is co-author with R. Kelley Pace of a 2009 book entitled Introduction to Spatial Econometrics. His research has received past support from the National Science Foundation, and he has given workshops on spatial econometrics in Austria, China, France, Germany, Portugal, Spain and several American universities.

Top photo: Larry D. Moore [CC BY-SA 3.0 or GFDL], via Wikimedia Commons


How the Left and Right Can Learn to Love Localism: The Constitutional Cure for polarization

$
0
0

The ever worsening polarization of American politics—demonstrated and accentuated by the Trump victory—is now an undeniable fact of our daily life. Yet rather than allowing the guilty national parties to continue indulging political brinkmanship, we should embrace a  strong, constitutional solution to accommodating our growing divide: a return to local control.

Such an approach would allow, within some limits, local constituencies to follow their own course, much as the Founding Fathers suggested, without shaking the fundamentals of the federal union. Localism, as I label this approach, would address the sentiments on both right and left by reversing the consolidation of central power in Washington.

What Americans across the political spectrum need to recognize is that centralizing power does not promote national unity, but ever harsher division. Enforced central control, from left or right, polarizes politics in dangerous ways. The rather hysterical reaction to Trump’s election on the left is a case in point, with some in alt-blue California calling for secession from the union. Had Clinton and the Democrats won, we would have heard other secessionist sentiment, notably in Texas.

This is no way to maintain a “United” States. Under Obama, conservative states resisted ever expanding federal executive power; now it’s the progressives’ turn to worry about an overweening central state. Some blue states are already planning to go on their own in such areas as health care and somewhat less plausibly, immigration. Progressives may also face potential federal assaults on such things as legal marijuana by a now GOP-controlled central government.

Do people want Washington to rule everything? The real issue is not the intrinsic evil of government itself, but how we can best address society’s myriad problems. For decades, many progressives have embraced an expansive central government as the most effective method of changing society for the better. Yet it is far from clear that most Americans prefer that alternative. A rough majority in November cast their votes for either Trump, who attacked President Obama’s executive orders, or libertarian Gary Johnson, a candidate with an even stronger localist tendency. Since 2007, the percentage of people who favored expanding government has dropped from 51 to 45 percent.   

In contrast, localism is widely embraced by a broad majority of the American public. By 64 percent to 26 percent, according to a 2015 poll—Americans say that they feel “more progress” on critical issues take place on the local rather than the federal level. Majorities of all political affiliations and all demographic groups hold this same opinion.  

The preference for localism also extends to attitudes toward state governments, many of which have grown more intrusive in recent years. Some 72 percent of Americans, according to Gallup, trust their local governments more than they do their state institutions; even in California, where executive power has run riot, far more people prefer local control to that of Sacramento.  

Critically, millennials, notes generational analyst Morley Winograd, generally  favor community-based, local solutions to key problems. Indeed, a recent National Journal poll found that less than a third of millennials favor federal solutions over locally-based ones. They are also far less trusting of major institutions than their Generation X predecessors. 

Any party, right or left,  that wishes to expand federal power will face broad political headwinds. Roughly half of all Americans, according to a 2015 Gallup poll, now consider the federal government “an immediate threat to the rights and freedoms of ordinary citizens”; in 2003, only 30 percent felt that way. The federal bureaucracy is held in such low regard that 55 percent of the public says “ordinary Americans” would do a better job of solving national problems.

The election of Trump and his “deplorables” is leading more progressives, after years of cheering on President Obama’s ever increasing policy of rule by decree, to seek ways of preserving their own progressive bubble. Cheerleaders for Barack Obama’s imperial presidency, such as The New Yorkerare now embracing states’ rights with an almost Confederate enthusiasm. There are increasing plans to promote new progressive measures, for example on energy as a means to counter the nefarious, anti-planetary intentions of the new monarch.

Yet in reality, progressivism and localism are hardly incompatible. The progressive Justice Louis Brandeis invoked the notion that the states, not the federal government, should serve as “laboratories of democracy,” empowering them to “try novel social and economic experiments without risk to the rest of the country.”  

This more decentralized progressive approach was also expounded by David Osborne in his 1990 book, Laboratories of Democracy. Notably, Osborne’s book featured a foreword by the then-governor of Arkansas, Bill Clinton. The future president praised “pragmatic responses” to key social and economic issues by both liberal and conservative governors. Such state-level responses, he correctly noted, were critical in “a country as complex and diverse as ours.”

Localism also has fans among grassroots leftists. Some embrace the ideal of localism as a reaction against globalization and domination by large corporations. For example, grassroots progressives often support local merchants and locally produced agricultural products. Some have adopted localist ideas as an economic development tool, an environmental win, and a form of resistance to ever-greater centralized big business control.   

Yale Law professor Heather Gerken makes the case that progressive social causes like racial integration, gay marriage, marijuana legalization, and others have historically tended to be adopted first at a local level before spreading to other areas. Gerken argues that it’s necessary for cities and states to have these powers so that local “cities upon a hill” of social reform can be allowed to flourish and lead by example.

With Trump and the GOP ensconced in Washington for a likely four more years, more progressives can be expected to adopt Gerken’s strategy. Longtime Washington insiders such as Brookings’ Bruce Katz already have made a strong pitch for a supplanting federal control with a regional approach. Although this usually leads to the dominance of regions by well-connected urban elites, Katz’s approach at least leaves smaller cities and towns free to govern themselves.  

President-elect Trump needs to recognize there is no great clamor to replace one “imperial president” for another. The authoritarian tendencies of some of his key allies, notably Senator Jeff Sessions, to perhaps overturn state marijuana, abortion and gay rights measures would simply extend, in different fields, the pernicious federalization of daily life. This is not exactly a consistent message for a party that often promotes itself as the voice of “liberty” and local choice.

We have already seen some harbingers of right-wing centralism on the state level, notes analyst Aaron Renn, where conservative state legislators contravene the progressive agenda of their core cities. Already in some states such as North Carolina and Texas, conservative legislatures have overturned actions adopted by certain cities on issues as diverse as transgender bathrooms and fracking. A better solution would be to allow blue places to reflect their values on as many issues as possible, while granting to conservative places the same right.

When it comes to preserving the character of our communities, there is often no red or blue. We choose places for their character and, if they need to change, this is preferably shaped along the lines favored by local residents. What may be fine with residents of Portland or Brooklyn does not necessarily work for people in suburban reaches of Dallas, Houston, or, for that matter, New York. As far as I am concerned: vive le difference!

Localism, of course, is not a panacea for all issues, some of which are indeed better addressed on a larger scale. And some basic rights need to be protected from local overreach. But overall, nothing is more basic to the American identity than, whenever feasible, leaving control of daily life to local communities, and, as much as practical, to individuals and families. Effective policy can only be shaped where there exists a “common civic culture” of shared values, something far more evident today on the local than the national level.

In his drive to make America “great” again, the new president needs to revitalize our flagging democracy not by doubling down on federal power but by empowering local communities to determine what’s best for them. Anything else gives us a choice between ideological despotisms that can only enrage and alienate half of our population by forcing down their throats policies they can’t abide, and, in most cases, should not be forced to accept.

This piece first appeared in The Daily Beast.

Joel Kotkin is executive editor of NewGeography.com. He is the Roger Hobbs Distinguished Fellow in Urban Studies at Chapman University and executive director of the Houston-based Center for Opportunity Urbanism. His newest book, The Human City: Urbanism for the rest of us, will be published in April by Agate. He is also author of The New Class ConflictThe City: A Global History, and The Next Hundred Million: America in 2050. He lives in Orange County, CA.

Babes In Trumpland: The Coming Rise Of The Heartland Cities

$
0
0

Contrary to the media notion that Donald Trump's surprising electoral victory represented merely the actions of unwashed “deplorables," his winning margin was the outcome of rational thinking in those parts of the country whose economies revolve around the production of tangible goods.

And their economies stand to gather more steam in the years ahead.

Trump’s victory was largely minted in the suburbs and smaller cities of the new American Heartland, from Pittsburgh to Omaha to Dallas-Ft. Worth. The heartland regions depend on agriculture, home construction, manufacturing and energy, all of which could benefit from the policies of the new presidential administration and Republican Congress. In contrast, Hillary Clinton favored extending the Obama administration's policies on fossil fuels and housing that may win support in the dense progressive bastions of the East and West coasts, but were viewed with alarm by many tied to heartland industries, some of which have been under pressure from a global decline in commodity prices.

Trump's pro-fossil fuel stance may be anathema in the coastal cities, but will have a very positive effect on the many cities in the “oil patch” that extends from Texas’ Permian Basin to North Dakota, Ohio and western Pennsylvania. This is not just a matter of roughnecks out on the Gulf or West Texas; many of the 100,000 or so jobs lost in the energy industry over the past few years were located in major cities, such as Houston, where many of the employees are both well-educated and dwell close to the urban core.

Most important of all, manufacturing matters in the heartland in ways that no longer resonate in coastal areas, particularly New York and San Francisco. Since 2000, two of America’s historic centers for manufacturing, Los Angeles and New York together have lost over 600,000 manufacturing positions. Trump’s call for more U.S. industrial jobs could turn out a swan song, but every job that stays in America due to his cajoling is more likely to benefit people in suburban St. Louis or Detroit than Manhattan or Malibu.

Building on Momentum

Critically, Trump’s election comes at a time when heartland cities already had economic momentum, including in the Rust Belt.

The stock, real estate and tech booms on the coasts, as well as increased regulation and taxation there, have made interior cities increasingly attractive to relocating companies and migrants. This is most evident in Texas' leading metropolitan areas -- Dallas-Ft. Worth, Austin, San Antonio and, until recently, Houston -- which have consistently led the nation in job and population growth.

When California companies like Apple look to add middle-class jobs, they don’t often do it in the Golden State, but in more affordable places like Austin. Every big Texas city in recent years can show you a big scalp from my adopted home state: Occidental to Houston, for example, or Toyota America and Jacobs Engineering to Dallas.

Similar patterns can be seen in the rapid expansion of such smaller cities as Nashville, Charlotte, Columbus, Salt Lake City --- all in states that Trump won handily. These cities have developed impressive central cores, but have seen larger scale growth on their periphery. Resilient Great Plains cities like Fargo, Omaha and Sioux Falls have spiffed up and attracted investments in everything from tech and financial services to health care.

Other industries, such as financial services and business and professional services, are also moving increasingly to heartland cities, and some are building impressive presences in health care.

Voting With Their Feet

Perhaps the most underreported, but significant shift towards heartland cities has been a human one. Before, educated people generally clustered in favored blue cities such as San Francisco, New York, Boston, Washington, D.C., and Chicago. This thesis was well documented by urban analyst Richard Florida in his “Rise of the Creative Class.”

Yet when Richard and I were together in Kansas City last month we were treated to a tour of the region’s ascendant neighborhoods, both in the city and in adjacent parts of Kansas.Cities like Kansas City have seen their downtown residential populations surge, but the vast majority of growth there, as well as in the rest of heartland, tends to be on the periphery.

As growth in New York and other “hip” cities has slowed, populations are shifting to less expensive ones. Research by demographer Wendell Cox has found that since 2010 over 1.45 million people net have moved from Clinton states to those that favored Trump.

This increasingly includes young people, according to research conducted at Cleveland State University. There has been a sea change in the migration patterns of educated millennials since 2010, with faster growth in heartland cities than the Bay Area, Washington or New York.

The biggest drivers for migration to Trumpland tends to be housing prices and rents. Housing prices across the New heartland overall Is 3.4 times the median household income (this is a price-to-income ratio called the "median multiple"). This compares to 7.5 times in California and 4.3 times in the Northeast Corridor (Washington to Boston).Given the choice between more expensive locales on the coasts and less expensive ones in the interior, many people have begun to flock to places like Des Moines, Omaha, Indianapolis and Columbus.

These trends may become more pronounced when the bulk of millennials enter their 30s and begin to start families and buy homes. Derek Thompson of the Atlantic observes: “The great irony of national migration is that media headquarters overwhelmingly reside in the same dense urban areas that other Americans are desperately trying to escape (or cannot afford).”

A similar trend may soon take place among immigrants. The Trump campaign may have sought to demonize some of the foreign born, notably the undocumented and Muslims, but many of the cities now growing their immigrant populations most rapidly are in the heartland.

Houston has been gaining more foreign-born residents than Los Angeles; Dallas now has a higher share of foreign-born residents than Chicago.

Now the immigrants are expanding to other mid-American outposts such as Nashville, Indianapolis and Columbus. Trumpian politicians may seek to exploit xenophobic sentiments, but metropolitan boosters across the heartland are quick to promote their appeal with foreign-born residents, seeking their entrepreneurial energy and enriching cultural influences. When in Nashville, boosters take you not just to the old country music haunts, but to thriving Kurdish, Somali,  and Mexican enclaves.

Can Trumpland take success?

Yet for Trump and his allies in the Republican Party, the resurgence of heartland cities will also bring with it risks. Some of those who now find their future in Kansas City or Houston also bring with them attitudes shaped in blue states, something some progressives are counting on. They may have escaped the worst aspects of ultra-high taxes and abusive regulations, but sometimes this does not stop them from wanting to repeat the old patterns in their new homes.

the core cities in most of the larger heartland metropolitan areas are either deep blue, as is the case in the Great Lakes, or are turning blue, including Dallas and Houston. The suburbs, particularly the new, further out ones, have remained deeply conservative, but this also could change over time as more young people and immigrants migrate there. Heartland success could undermine some of the very reasons for their resurgence.

Success also has strange impacts on people’s thinking, and ultimately a resurgent heartland, populated by newcomers and immigrants, could take a very different turn in the decades ahead.

But this can only happen if Democrats somehow learn to craft their appeal to places outside their current deep-blue bastions. Trump may have won in large part due to the misfortunes heaped on these in the past, but, unless challenged, he ultimately may further consolidate his base by riding on the ascendancy.

This piece first appeared in Forbes.

Joel Kotkin is executive editor of NewGeography.com. He is the Roger Hobbs Distinguished Fellow in Urban Studies at Chapman University and executive director of the Houston-based Center for Opportunity Urbanism. His newest book, The Human City: Urbanism for the rest of us, will be published in April by Agate. He is also author of The New Class ConflictThe City: A Global History, and The Next Hundred Million: America in 2050. He lives in Orange County, CA.

Photo by Max Goldberg from USA (Trump Cedar Rapids) [CC BY 2.0 (http://creativecommons.org/licenses/by/2.0)], via Wikimedia Commons

World’s Most Affluent Areas: Dominated by Low Population Densities

$
0
0

The Brookings Institution is again out with data on the world’s most affluent metropolitan areas. The GDP data is in Redefining Global Citieswhich contains a treasure trove of data. Again, United States metropolitan areas dominate the highest rankings, capturing nine of the top 10 positions. San Jose is rated with the highest gross domestic product (GDP) per capita, at $91,400 (purchasing power parity or PPP). This is an improvement from third in 2014 and second in 2012 (Figure 1). The top 10 is dominated by cities with relatively low urban densities, like those that characterize San Jose (core of the world’s leading information technology center , Silicon Valley).

In 2015, San Jose finally passed even less dense Hartford, which had ranked second and first in the two previous reports. In 2014, Macau, the smaller of China’s two Special Administrative Regions (SAR) had ranked number one (the larger SAR is Hong Kong, ranked 32nd). There was a methodology change in 2015 that established a population threshold higher than that of Macau, however the government’s anti-corruption campaign was credited with reducing Macao’s gaming revenue substantially and dropping the GDP per capita by about 15 percent. If it had been rated, Macau’s GDP per capita would have remained in the top 10, but would have fallen from the top.

Singapore broke into the top 10, positioning itself between San Jose and Hartford, rising from 14th place, with a GDP per capita of $84,300. The Hartford, metropolitan area, which lead the list in 2012 and ranks second in 2014 fell to third place, with a GDP per capita of $84,000. San Francisco rose from nine in 2014 to 4th, with a GDP per capita of $80,600. Boston ranked fifth, with the GDP per capita of $77,700, dropping from fourth place. The top 10 was rounded out by Seattle, Houston, Washington, New York and Los Angeles (Note 1).

The US dominance was far less in the second 10, with positions 11, 12 and 13 being captured by Zurich, Perth (Australia) and Munich. Paris, often rated highly as a world city, ranked 17th, while Stockholm ranked 19th. The five US entries were Portland (14th), San Diego (16th), Minneapolis St. Paul (17th), Dallas-Fort Worth (18th), and Denver (20th).

Thirty of the 50 most affluent cities were in the United States, and 16 were in Europe. Australia had two entries, while East Asia had two, Singapore and Hong Kong (Figure 2).

As usual, the rankings produced results that would surprise people who do not regularly follow this data.  London, which is routinely in a neck and neck competition with New York as the strongest “world” city ranked 35th, just behind Columbus Ohio. Tokyo, home of the world’s largest urban area, ranked 60th, behind Shenzhen, China (59th). Toronto, Canada’s principal city, ranked 53rd, just behind San Antonio. Sydney, Australia’s largest city ranked 47th, just behind St. Louis and just ahead of Detroit.

Expanded Contents: Redefining Global Cities

The new Brookings Institution report contains far more data than is indicated above. There is labor productivity data, indicated by GDP per worker. San Jose also leads in this category, and again, nine US metropolitan areas are included in the top 10. The only non-US entrant is the industrial powerhouse of Dongguan, China, one of the world’s least known metropolitan areas, located between Hong Kong, Shenzhen, Guangzhou and Foshan (the latter three municipalities in Guangdong Province).

The report also contains data on economic growth, tradable clusters, innovation, talent and connectivity (with multiple indictors in each category). With the three reports since 2012, the Brookings Institution has positioned itself as a premier source for regularly published world urban data.

The Highest Productivity in the Lowest Urban Densities

There have often been suggestions that productivity and innovation are associated with high urban densities. This year’s data provides ample refutation of any such claim. San Jose, the top city in both GDP per capita and labor productivity, is virtually all suburban, as is indicated by the City Sector Model (Figures 3 and 4). San Jose, without a pre-World War II core and world-class dispersion is illustrated in the photograph at the top.

The highest built-up urban area density among the top 10 metropolitan areas in GDP per capita is in Singapore, which is also the only one exceeding the world average urban density in the top 30. All of the US metropolitan areas in the top 10 have urban population densities well below that of Singapore (Figure 5) and below that of the average Chinese and Western European urban areas. Indeed, US metropolitan areas, which dominate world affluence, have the lowest urban population densities in the world as is indicated in Figure 6 (Note 2). 

Note 1: US city data not adjusted for PPP (regional price parities) within the United States. Application of regional price parities to personal or household incomes would yield considerably different rankings.

Note 2: Built -up urban area data are the only reliable measure for comparing urban densities at the organic city level, which in the economic or functional sense is metropolitan areas, and in the physical sense is contiguous built-up urban areas . This excludes the administrative unit or “municipality,” which is simply a political construct. For further information see: Paul CheshireMax Nathan and Henry G. Overman of the London School of Economics in their recent bookUrban Economics and Urban Policy: Challenging Conventional Policy Wisdom. Virtually all metropolitan areas contain a principal built-up urban area and extensive rural areas (commuting sheds), which may also contain smaller urban areas. Thus, any comparison of metropolitan densities is not an urban comparison, but a mix of urban and rural densities. In most of the few countries that designate metropolitan areas, the rural land areas are substantially greater than the urban land areas. The matter is further complicated by the lack of international “building block” standards for metropolitan areas. These standards produce hugely different mixes of urban and rural in metropolitan areas. For example, the New York urban area represents only 42 percent of the land area. In Riverside-San Bernardino, the principal urban area has 2 percent of the metropolitan land area. In Paris, the land outside the principal urban area represents 83 percent of the metropolitan area. A recent post in the respected Marginal Revolution blog (“China Fact of the Day”) indicated that China’s metropolitan area densities were lower than those of the United States. As noted above, metropolitan density comparisons are not reflective of urban densities. China’s urban densities are nearly five times that of US urban areas (Figure 5).

Wendell Cox is principal of Demographia, an international public policy and demographics firm. He is a Senior Fellow of the Center for Opportunity Urbanism (US), Senior Fellow for Housing Affordability and Municipal Policy for the Frontier Centre for Public Policy (Canada), and a member of the Board of Advisors of the Center for Demographics and Policy at Chapman University (California). He is co-author of the "Demographia International Housing Affordability Survey" and author of "Demographia World Urban Areas" and "War on the Dream: How Anti-Sprawl Policy Threatens the Quality of Life." He was appointed to three terms on the Los Angeles County Transportation Commission, where he served with the leading city and county leadership as the only non-elected member. He served as a visiting professor at the Conservatoire National des Arts et Metiers, a national university in Paris.

Photo by Michael from San Jose, California, USA (Santa Clara Valley - California) [CC BY 2.0], via Wikimedia Commons

Agglomeration in Los Angeles

$
0
0

The Economy of Cities

Cities have been called “engines of growth”.  What does that mean?

Fly over a major city and what do you see? Not well defined centers and sub-centers. More likely, an amazing complexity. We argue that what is actually down there, but hard to actually see, is a large number of superimposed and spatially realized supply chains.

In big cities like Los Angeles, we are well served by large numbers of people (mostly strangers) arranged in complex and usually unfathomable supply chains Their incredible (and hidden) complexity is not a problem.  Shopping is simple; we look at prices and the reputations of sellers and products.  Markets illustrate the stark contrast between how much we get vs how little we have to know.

Market competition also means a scramble for new ideas. The best performing firms form new ideas first. There are supply chains for things and supply chains for ideas. The latter are harder to identify but clearly essential. New ideas come before new things. Mokyr (2002) notes that we are all on the lookout for useful knowledge.

Managers are charged with the challenge of deciding what to make vs what to buy.  But the choices require a decision of what to buy where? What is available where?

Cities are engines of growth because the settlement patterns that evolve (survive) are ones that provide good access – to things we may want to buy and to ideas we may want to hear about and learn about.

What Kind of City?

The question here is what kind of city is most congenial to the kind of network formation required for all this to work?

Urban economists and geographers once described the evolution and spread of cities as an evolution from “pedestrian city” to “streetcar city” to “automobile city” (Mueller, 2004).  But this has been elaborated and updated. Baldwin (2016) describes how economic geography changed as various advances lowered trading costs and communications costs. He separates face-to-face costs from communications costs; the former are the constraint to a “flat world”. The partition recognizes the special nature of tacit information exchange. We do many things electronically but we still travel to meetings, near and far.

This has led some to assume that dense, traditional cities possess intrinsic advantages. Although some of these are relevant, evidence is that different urban forms can also function successfully.  

Cities can achieve efficiencies in different ways. Delivering goods or ideas can occur via many modes or media. Possibilities, costs and choices change as technologies evolve, e.g. transactions costs, location choice and urban form evolve. All this suggests that evolving and adapting cities --- of differing forms— constitute an essential part of durable economic growth. Just as price discovery is a market process, so is supply chain formation -- and chains’ spatial arrangements.

What matters more than form is the ability to allow the market to function. Economic efficiencies cannot be achieved top-down; top-down involvement must maintain a light touch. Rules should be simple and clear. Approvals that are complex and politicized must be clarified and simplified. There might also be a balance whereby landowner’s rights are not swamped by neighbors’ rights to stop (politicize) development.

We all have many chains in our lives; we participate in many supply chains as buyers and as sellers. This includes going to work, where we sell our labor. All of us choose (compete for) locations in light of these many interests. This suggests that we are eager to find and secure locations that facilitate our performance in the many supply chains we are involved in. This defines how   we get the cities we have.

Boundaries and Geography

Drawing boundaries is never simple. Where does the city or region begin and end? The same is true for important features within cities. What constitutes or defines the center, the downtown, the major sub-centers? Where do “suburbia and “exurbia” begin and end? And what happens beyond these centers, sub-centers, clusters and agglomerations?

Economists who study cities often describe them via just one number, the (average) density. How can that be adequate?  Cities are complex and distinguished by their peculiar locational arrangements. Most studies of city success rely on simple metropolitan area average densities for the simple reason that these are easily found. Yet it is a leap to describe large and complex places via one single number. Consider that Los Angeles --- which does not achieve almost anywhere the densities common to Manhattan or San Francisco ---  has been the densest urbanized area in the U.S. since approximately the mid- 1980s. The factoid illustrates the problem of relying on just one number. 

Map 1 of the location San Francisco Bay Area software firms illustrates the complexities. Does the Bay Area’s overall population density – considerably less than that of Los Angeles, much less than Manhattan – signify anything? Where does the  Silicon Valley a “cluster” or an “agglomeration” begin and where does it end?  Were the map a three-dimensional density surface, there would be peaks as well as low-rise hills. Which ones are sub-centers or clusters?

The standard labels fall short. Settlement patterns are complex -- and emergent. Being near or far from “the action” can be many things. It also involves many possible trade-offs. Less expensive homes for workers? Better schools? Less commuting? Any industry includes many players who will avail themselves of many choices along the ranges of many possible trade-offs.

Map 2 plots locations of software firms in Los Angeles County. The same variety of arrangements and the same questions apply. But both of our maps show that the spread of software firms is always lumpy, but is also dispersed widely.

Here is one example, from a large literature, of the challenges. Bumsoo Lee (2007) applied several centers identification strategies to the study of employment in major U.S. metropolitan areas. According to one such method, MSAs of more than 3 million inhabitants had roughly 7 percent of jobs in the central business district, 15 percent in the various sub-centers and the remaining 78 percent “dispersed”, outside of any identified center.  

What L.A. Data Tell Us

Data on production functions are widely available. Geographically detailed data on the locations of firms are becoming available. In a recent study of Los Angeles, we used two data sources. The first was InfoUSA 2011 with data on businesses in 6,395 census block groups in Los Angeles County. The InfoUSA data indicate business locations with number of employees by NAICS (2007) industrial sector. These were aggregated to create the sectors we wanted to study such as Software and Biotech.  

We tabulated Los Angeles area co-locations of firms. Employment and firms were spatially aggregated by Census Block Group. The aggregated jobs and firms are divided by the size (acres) of the Census Block Group to calculate employment and firm densities. The median-size Census Block Group in L.A. County is 79 acres. These data were useful for, among other things, calculating pair-wise co-location coefficients. These became dependent variables in multiple regression tests.

The second data source is US IMPLAN input-output 2013, originally with 536 sectors which were also aggregated to the industrial sectors we were interested in. The technological coefficients, proportions of sector-to-sector purchases, were the independent variables used to test their effects on the observed co-locations of firms. 

What kind of spatial arrangements do we see? To avoid the problem of identifying centers and subcenters – and leaving out all the other places, people and jobs -- we computed density quintiles. Looking at the number of firms and their sizes in each density quintile, we found that they might or might not be arranged in compact geographic clusters. That’s what our two maps suggest.

Table 1 summarizes our findings on firm location in the two densest quintiles. For the large sectors, three kinds of densities were tabulated: for all firms of the sector, for all firms in all sectors and for all firms in all sectors except the sector being studied.

The two subsectors studied here, Software and Biotech, are prominent in the modern world and unique enough to merit their own categories. They employ about the same number of people in LA County. But these two sectors differ in important ways. Software firms have service as well as research functions. Biotech is more weighted toward the research side. In addition, biotech is the more regulated of the two, most significantly subject to Federal Drug Administration vetting and ruling. “The estimated average pre-tax industry cost per new prescription drug approval (inclusive of failures and capital costs) is: $2,558 million.” (DiMasi, et al 2014). All this suggests greater risk and generally larger firm sizes.

When it comes to total industry clusters, medium-sized Biotech firms are in the least dense areas; this cannot be said of Software firms. As in the story of the more aggregated sectors, clustering (with same sector firms as well as with others) is apparent. But there are prominent exceptions. Scooping up ideas can be initiated remotely.   Some firms are able to do less up-close interacting and complementing it with the virtual alternative. The blends vary.

Large proportions of Software and Biotech firms choose the dense quintiles in similar proportions. These agglomerate even though economizing on shipping is not their big concern. As expected, more of the larger Biotech firms are less likely to seek clusters.  

Firm size differences are also interesting. The largest Software firms (by number of workers) prefer the highest density quintile, whether densities refer to all firms or just same-sector firms. It is not the same for Biotech firms, where many of the medium-sized firms prefer the lowest density quintile, as defined for sectors of all firms. In this sector, that size may be good for internal R and D and information gathering and creation.

Does density matter? By all means but it is complex. Even for firms in sectors that deal more in information than physical product, nearby densities (of same-sector and well as other-sector) do affect location choice. An interest in establishing networks by which ideas can be shared can explain this. Idea sharing is complex and still requires some degree of nearness. Over 50 years ago, Mel Webber wrote about “Community without Propinquity” (1963). This was years before there was an internet but Webber deserves credit for calling our attention to the fact that we seek and form a variety of very complex links that help explain our locational preferences.

Peter Gordon is Emeritus Professor, USC Price School of Public Policy. His current research addresses how the nature of cities impacts economic growth prospects. John Cho is Associate Regional Planner at the Southern California Association of Governments. His interests involve transportation networks and their effects on regional development.

REFERENCES

Baldwin, Richard (2016) The Great Convergence. Cambridge, MA: Belknap.

DiMasi, Joseph A. and Henry G. Grabowski and Ronald W. Hansen (2014) Innovation in the Pharmaceutical Industry: New Estimates of R&D Costs. Boston: Tufts Center for the Study of Drug Development, Tufts University.

Lee, B. (2007). "Edge" or "edgeless" cities? Urban spatial structure in U.S. metropolitan areas, 1980 to 2000. Journal of Regional Science, 47(3), 479-515.

Mokyr, Joel (2007) “The Market for Ideas and the Origins of Economic Growth in Eighteenth Century Europe” Tijdschrift Voor Sociale en Economische Geshiedenis, 4.

Muller, Peter O. (2004) “Transportation and Urban Form: Stages in the Spatial Evolution of the American Metropolis” in S. Hanson (ed.) The Geography of Urban Transportation (3rd ed.) Guilford Press.

Webber, M.M. (1963) “Order in Webber Diversity: Community without Propinquity” in Cities and Space, Lowdon Wingo (ed.) Baltimore: Johns Hopkins University Press.

The Future of Racial Politics

$
0
0

From its inception, the American experiment has been dogged by racial issues. Sadly, this was even truer this year. Eight years after electing the first African-American president, not only are race relations getting worse, according to surveys, but the electorate remains as ethnically divided as in any time of recent history.   

Donald Trump has emerged in most media accounts as the candidate of Anglo voters, with a margin of 21 percentage points over Hillary Clinton among that segment of the electorate. Clinton’s embrace of “identity” politics may have played a role in turning off many of these white non-Hispanic voters, who might otherwise had voted Democratic.

Many Democrats maintain still, with some justification, that as demographics evolve over the next decade, the increasingly diverse electorate will reward their identification with racial minorities. The country, and the electorate, seem destined to become ever less white in the coming decades.  Between 2000 and 2015, the nation’s population makeup became increasingly minority, from 31 percent to 38 percent. This trend will continue, with the country conceivably becoming 45 percent non-white by 2030 and 53 percent by 2050.

White Men Can’t Jump, But They Can Still Vote

It may well be that Democrats this year jumped the demographic gun. Even as the white population diminishes, it retains a dominant influence in elections. One reason: Whites tend to vote more. Most critical, the African-American share of the electorate, which reached record highs with Barack Obama atop the ticket,  actually dropped by a percentage point in 2016. Latino turnout, widely seen as a surge that would elect Clinton, represented  about the same percentage --11 percent -- in 2016 as in 2012.  

 Thesedynamics keyed the Trump victory, particularly in heavily white working-class precincts in the Midwest, Pennsylvania and Florida, where he secured his electoral victory. Many of the pivotal states electorates remain very white indeed. In Wisconsin, for example, more than 80 percent of voters are white, and most of them are not residents of liberal college towns like Madison. This is also the case for Pennsylvania, where more than 75 percent of voters are Caucasian. Even Florida – itself a very diverse state -- still has a heavily white electorate, accounting for more than 55 percent of voters.  

 These patterns will remain critical past what might be seen as their sell-by date for two critical reasons. One has to do with the concentration of minority voters. Nearly 60 percent of African-Americans live in Southern states where Trump won by dominating a very conservative white electorate. Other minority voters are clustered in big cities in the Northeast, which are not remotely contestable for Republicans.

 Latino voters, and also Asians, are likewise heavily concentrated, particularly in California,   now essentially a non-GOP zone, as well as the similarly politically homogeneous Northeastern cities and Chicago. To be sure, Latinos are also critical in Texas, and Asians too (increasingly so), but for now the Texas white population still outvotes them by a considerable margin.

 Another problem for the much-ballyhooed “emerging Democratic majority” lies in one stubborn fact: The elderly, most of whom are white, are not dying out quickly enough for Democrats to win. Although the extension of life spans may have slowed, or even slightly reversed in some demographic segments, seniors are clearly living longer than before.  

The Limits of Identity Politics    

Ignoring the reality of economic decline in the states that swung to Trump, some observers maintain that the increased conservatism among white working-class voters reflects deep-seated racial antagonisms. But this does not explain the considerable movement of these voters, particularly in the Rust Belt, from support for Obama to support for Trump, as seen in such places as Youngstown, Ohio, Wheeling, W.Va., Macomb County, Mich., and Erie, Pa.

The Democratic Party made things easier for Trump by adopting identity politics as its mantra. This is particularly maddening when charges of racism are leveled by affluent professionals, academics and bureaucrats, many from elite universities, who are themselves privileged.

To their credit, some progressives suggest shifting away -- at least in the short run -- from identity politics. But racial determinism may now be too central to their ideological core. Bernie Sanders’ campaign spokesperson Symone Sanders, for example, said that when it comes to picking a new leader for the  Democratic National Committee, whites need not apply.    

 Matthew Yglesias, always an excellent window on progressive dogma, insists that “there’s no other kind of politics” but identity politics; Democrats, he asserts, simply need “to do it better.” Progressives seem about as ready to ditch racialist politics as Southern segregationists were willing to abandon Jim Crow in 1948.

The Coming GOP Crisis

For Republicans, identity politics is the gift that keeps giving, but the question is for how long. If you want a nightmare racial scenario for the GOP, just look at California. Since 1994, when the state passed Proposition 187, a measure widely perceived as anti-Hispanic, the Anglo population has dropped by more than 2 million as the state has added 9 million people, including more than 7 million Hispanics. Minorities now account for 62 percent of the population, compared to 43 percent in 1990. The shift in the electorate has been slower but still significant. In 1994, 49 percent of the electorate was Democratic and 37 percent Republican. Due in large part to ethnic change, by 2016 the Democratic margin was 45 percent-26 percent.

In California this surge in minority voters has accompanied a gradual erosion of the white population, a large portion of which has left for other states. The Golden State  also has gone out of its way to encourage immigration of undocumented aliens by offering them driver’s licenses, subsidized health care and  financial aid for college; 74 percent of all California children under 15 are  now minorities, compared to 66 percent in 2000, and  25 percent of them live below the poverty line. This is 2.5 times the white non-Hispanic rate in California.  

Despite largely positive results outside the blue coastal states, potentially the biggest long-term problem facing Republicans is in a dominant aspect of geography:  suburbia. Trump lost   some largely affluent suburban areas like Orange County, where 55 percent the population is Latino or Asian, up from 45 percent in 2000.  Perhaps most emblematic of potential GOP problems was Trump’s -- and the GOP’s --  loss of Irvine, a prosperous Orange County municipality that is roughly 40 percent Asian.

Republicans should be even more worried about trends in Texas, where Latinos are already close to a plurality and the Asian population is surging. There are still enough conservative whites to win elections in Texas -- Trump won by 10 percentage points -- but the margins will continue to shrink. This trend can already be seen in Houston’s sprawling, increasingly multiracial suburbs. Trump, for example, lost solidly middle-class Fort Bend County, by some estimates among the most diverse in the country, which voted Republican in every presidential elections since 1968.

If this pattern continues, the die may indeed be cast for the GOP. As most minorities now live in the suburbs -- a trend that continues to increase -- a loss of suburban voters, given the total Democratic lock on inner city electors, would be too much for rural and small-town whites to overcome.  Simply put, by 2030, losses in the multicultural suburbs could make dreams of progressive long-term dominance all but inevitable.

How Republicans Can Withstand the Racial Shift

Republicans must reverse these trends if they don’t want to go the way of the dinosaur. They can take some limited satisfaction in knowing that Trump did somewhat  better than Mitt Romney or John McCain among Hispanics and blacks  as well as improving slightly among Asians.

To expand on these modest gains, Republicans need to focus not on race but economics.  Our recent study for the Center for Opportunity Urbanism demonstrates clearly that minorities generally do far better in red states than in blue ones, based on such factors as income, homeownership, entrepreneurship and migration. Minorities all continue to move in ever larger numbers to red states because their economic climate and regulatory regime work better for them.

Conservatives can make a case that Barack Obama’s progressive agenda actually favored the highly affluent, who tend to be disproportionately white.  According to a 2016 Urban League study,  African-American levels of economic equality are lower now than in 2009, surely a disappointment for a black middle class so understandably proud of Obama’s elevation.

The best role model for the GOP could be in Texas. Latinos in the Lone Star State generally do better than their counterparts in California -- as measured by homeownership, marriage rates, incomes -- and also tend to vote more conservatively. In 2014, for example, Republican Gov. Greg Abbott won 44 percent of Texas Latinos. In contrast, that same year Democratic Gov. Jerry Brown won 73 percent of the Latino vote in California.  

Other factors, notably upward mobility among  Latinos, African-Americans and Asians, could play a transformative role. As they continue to move to the suburbs, buy houses and start businesses, they may become less likely to support a high-regulation, high-tax and redistributionist agenda. Since 2000, more than 95 percent of the minority growth (black, Asian and Hispanic) in the 52 largest metropolitan areas has been in suburban and exurban areas. Trump did much better among college-educated black males, for example,  than those with no college education -- 16 percent vs. 11 percent.

If more minorities enter the middle class, particularly under Trump, this  could provide an opening for Republicans, just as occurred after the World War II when Italian, Irish, Polish and other eastern European voters moved to the suburbs and assimilated, even intermarried, after years of living apart. A message that targets the middle class aspirations of minorities could be more effective in the long run than appealing merely to xenophobic sentiments shared by an inexorably diminishing population.

Critically, in the coming  decades, the vast majority of Latinos and Asians will be native-born. They will have spread out increasingly not only within regions but to more conservative parts of the country, notably Texas and the Southeast. At the same time, the population of undocumented workers, the least assimilated and generally the poorest demographic, is already declining, down by 300,000 since 2008. If it continues to decline, which may be likely under Trump, immigration may soon fade away as a primary issue for Latinos.

Perhaps even more critical, however, may be the growing trend toward intermarriage among minorities. Among second-generation Latinos and Asians, interracial marriage is creating what could become an increasingly fluid racial identity. Intermarriage involving African-Americans is also on the upswing. The new generation of ethnic hybrids, most with one Anglo parent, will no longer be easily pigeon-holed ethnically. Overall, 15 percent of marriages were between partners of different ethnic groups in 2012.

These are all opportunities to succeed, but the GOP can only prolong itself if it finds a way to reach minority voters based on an appeal of economic mobility. Whether they take this tack, or simply play for time until white voters lose their primacy, may determine whether it is the stupid party that some suggest, and one that, even at its great moment of opportunity, is destined to remain permanently so.

Ultimately, Republicans could build on Trump’s economic message by demonstrating its efficacy for minority voters. This may be the party’s only hope in the future, given the demographic trends. The competition could also encourage Democrats to focus more on “bread and butter” issues. If future presidential campaigns are waged over key economic issues, rather than pitting ethnicities against one another, the nation will be both unified and stronger.

This article first appeared on Real Clear Politics.

Joel Kotkin is executive editor of NewGeography.com. He is the Roger Hobbs Distinguished Fellow in Urban Studies at Chapman University and executive director of the Houston-based Center for Opportunity Urbanism. His newest book, The Human City: Urbanism for the rest of us, was published in April by Agate. He is also author of The New Class ConflictThe City: A Global History, and The Next Hundred Million: America in 2050. He lives in Orange County, CA.

Wendell Cox is principal of Demographia, an international public policy and demographics firm. He is a Senior Fellow of the Center for Opportunity Urbanism (US), Senior Fellow for Housing Affordability and Municipal Policy for the Frontier Centre for Public Policy (Canada), and a member of the Board of Advisors of the Center for Demographics and Policy at Chapman University (California). He is co-author of the "Demographia International Housing Affordability Survey" and author of "Demographia World Urban Areas" and "War on the Dream: How Anti-Sprawl Policy Threatens the Quality of Life." He was appointed to three terms on the Los Angeles County Transportation Commission, where he served with the leading city and county leadership as the only non-elected member. He served as a visiting professor at the Conservatoire National des Arts et Metiers, a national university in Paris.

Photo: Steve White, Creative Commons

The End of Eyes on the Street

$
0
0

Jane Jacobs talked about the “sidewalk ballet” of her neighborhood and the importance of eyes on the street. But her conception of that, one where shopkeepers policed the sidewalks in front of their stores and kept an eye out for neighborhood kids, is far away from what we have today.

My latest post looking at this is over at City Journal and is called “The End of Eyes on the Street“:

“The bedrock attribute of a successful city district is that a person must feel personally safe and secure on the street among all these strangers,” wrote Jane Jacobs in The Death and Life of Great American Cities. Jacobs is revered as an urban prophet, but key facets of her prescription for how to keep streets safe and maintain thriving urban neighborhoods are increasingly being ignored in New York today.

Key to safe and thriving sidewalks is what Jacobs called “eyes on the street”: people taking an active interest in what’s happening around them. Citizen vigilance, she believed, was even more important than the police. Public peace, she wrote, was “kept primarily by an intricate, almost unconscious network of voluntary controls and standards among the people themselves, and enforced by the people themselves.” Some eyes on the street were more important than others–especially those belonging to local business owners. “Storekeepers and other small businessmen are typically strong proponents of peace and order themselves,” Jacobs observed. “They hate broken windows and holdups; they hate having customers made nervous about safety.”

Click through to read the whole thing.

What’s amazing to me is that at the same time we’re told we can’t do anything about things like a panhandler following my wife a block down the street cursing at her because she refused to give him money (which happened recently), or when we can’t stop mentally ill people from pushing people in front of subway trains and killing them (as happened yesterday at Times Square), we have immense effort being put into farcical items like stopping “microaggressions.” It certainly belies a lot of the rhetoric around what we can and can’t do in society.

Aaron M. Renn is a senior fellow at the Manhattan Institute, a contributing editor of City Journal, and an economic development columnist for Governing magazine. He focuses on ways to help America’s cities thrive in an ever more complex, competitive, globalized, and diverse twenty-first century. During Renn’s 15-year career in management and technology consulting, he was a partner at Accenture and held several technology strategy roles and directed multimillion-dollar global technology implementations. He has contributed to The Guardian, Forbes.com, and numerous other publications. Renn holds a B.S. from Indiana University, where he coauthored an early social-networking platform in 1991.

Photo: Andy C (Own work) [CC BY-SA 3.0 or GFDL], via Wikimedia Commons

Are We Going fascist?

$
0
0

The rise, and then the improbable election, of Donald Trump have reawakened progressive fears of a mounting authoritarian tide. With his hyperbole and jutting chin, he strikes some progressives as a new Benito Mussolini who will threaten free speech and other basic human rights.

Some aspects of Trumpism do exhibit some classic fascist modalities — emphasis on personal charisma, attacks on vulnerable minorities, rage against comfortable and self-satisfied elites. Yet, at the same time, some of the most histrionic attacks on Trump come from people who, rather than rejecting authoritarianism, really fear only his politically incorrect version of it.

During the election, Trump supporters did not generally disrupt Clinton rallies, but disturbances by progressives were somewhat common. After the election, the most hysterical forebodings about free speech came from the very college campuses — along with the left-leaning social media — that have not exactly been friendly to free speech.

At the same time, the powerful green lobby has made a point of trying to marginalize even distinguished scientists who differ in any degree from its climate change orthodoxy. In some cases, these scientists are not only demonized by fellow academics, but have been targeted for prosecution by “right-thinking” politicians. Sounds pretty fascist to me.

Read the entire piece at The Orange County Register.

Joel Kotkin is executive editor of NewGeography.com. He is the Roger Hobbs Distinguished Fellow in Urban Studies at Chapman University and executive director of the Houston-based Center for Opportunity Urbanism. His newest book, The Human City: Urbanism for the rest of us, was published in April by Agate. He is also author of The New Class ConflictThe City: A Global History, and The Next Hundred Million: America in 2050. He lives in Orange County, CA.

Photo by Gage Skidmore from Peoria, AZ, United States of America (Donald Trump) [CC BY-SA 2.0], via Wikimedia Commons


TruMpISSION Impossible: Deportation

$
0
0

This is the first in an occasional series of articles that will look at some of the campaign promises made by Donald Trump in his run-up to November 8, 2016. I will be taking a “by the numbers” look at ideas ranging from immigration and border security to trade and infrastructure. I will not be taking a position on whether these are good ideas or bad ideas – this is not a normative analysis. Instead, I will be outlining the feasibility and the economic consequences of several potential policies. In economics, we call this a “positive analysis” – that doesn’t mean it is optimistic, only that the analysis leaves judgment about good versus bad policy to the reader.

These are also only potential policies – Trump is not yet President and has yet to articulate a coherent action plan for any of these ideas. For all we know, they may end up being the same sort of campaign rhetoric that George H. W. “Read My Lips” Bush was using when he promised “No New Taxes.” I begin with deportation.

Whatever label you want to put on the foreign-born residents of the United States who do not have visas, green cards or citizenship papers, the idea of deporting all illegal aliens has been around for a more than a decade – it isn’t something Donald Trump invented to win votes. A 2006 bill in the House of Representatives, championed by Tom Tancerdo (R-CO, 1979-2009) and James Sensenbrenner (R-WI since 1979) attempted to stop the flow of migrants, expel millions and construct a fence along the Mexican border – sound familiar? President George W. Bush was adamantly opposed to any legislative proposal that included mass deportation. “…[W]e’re talking about human beings – decent human beings that need to be treated with respect,” he told the Orange County Business Council in California at the time.

In his 2007 State of the Union address, George Bush addressed the issue again, saying: “It is neither wise nor realistic to round up and deport millions of illegal immigrants in the United States.” Subsequently, The Comprehensive Immigration Reform Act of 2007 (S. 1348) was introduced in the United States Senate on May 9, 2007. It was never voted on. After several amendments, the Senate failed 34-61 to end debate and call for a vote. A related bill (S. 1639) failed 46-53 on June 28, 2007.

Being a numbers nerd, my initial thought in 2006 was: are there even enough buses available in the United State that could take 11 million people to Mexico?

A typical school bus in the US holds about 55 people (without luggage or a toilet). On most school days in the US, there are over 480,000 school buses transporting more than 25 million students to school. Allowing room equivalent to one-half person each for luggage, you would need approximately 300,000 buses or 62.5% of the buses in use.

Let’s assume you take everyone to the national capital, Mexico City. You don’t just want to dump 11,000,000 people at the border – that would be a recipe for disaster if they decided to walk back in en mass! Assuming some of the schools are private or semi-private and could not (easily) be coerced by government to relinquish their buses, you would need to count on getting a little more than one-half of all the school buses in the US to move 11,000,000 people.

The drive from Bangor, Maine to Mexico City would take 51 hours. Assuming driving 9 hours/day, including 3 1-hour breaks for meals, that drive would take almost 9 days each way. The buses would be unavailable to take children to school for almost 3 weeks. There are no fall, spring or holiday breaks during the school year that would accommodate such a long period of time without buses to take children to school. Still, it might work if you did it during the summer, although many schools run summer sessions and use school buses for summer educational events.

The real impossibility is that there are 14,000 school districts in the US, each with an independent structure of authority (principal, school board, etc.). It might be tempting to think you could just work out a deal with 50 states who could then dictate participation to the school districts, but there are also private and semi-private schools.

An alternative might be to use buses from public transportation systems, all of which would be under the control of government authorities. According to the American Public Transportation Association (APTA.com) there are 1,078 bus public transportation systems in the United States (2011 date) operating 67,288 vehicles. The 300,000 bus-trips required to deport illegal aliens would require each bus to make about 4.5 trips each – meaning they would not be available to provide regular public transportation services for 81 days (or nearly 3 months). For those 3 months, about 7 million American workers would have to find another way to get to work.

TruMpISSION Impossible!

Susanne Trimbath, Ph.D. is CEO and Chief Economist of STP Advisory Services. Dr. Trimbath’s credits include appearances on national television and radio programs and the Emmy® Award nominated Bloomberg report Phantom Shares. She appears in four documentaries on the financial crisis, including Stock Shock: the Rise of Sirius XM and Collapse of Wall Street Ethics and the newly released Wall Street Conspiracy. Dr. Trimbath was formerly Senior Research Economist at the Milken Institute. She served as Senior Advisor on United States Agency for International Development capital markets projects in Russia, Romania and Ukraine. Dr. Trimbath teaches graduate and undergraduate finance and economics.

Photo by Gage Skidmore [CC BY-SA 3.0], via Wikimedia Commons

Sydney Lurches to Housing Affordability Disaster

$
0
0

Now and again Australia erupts in controversy about housing affordability. Each time it follows the same course. Some new statistic or media story confirms that prices are out of control. A senior politician is prompted to call for deregulation and more supply, and is backed-up by the property industry. Then come progressive policy wonks saying no, the issue is high investor demand stimulated by tax concessions. Next emerge the welfare lobby, calling for tax reform as well as more social housing and “inclusionary zoning”. After a round of claims and counter-claims, it all fizzles out.

From the surveyed general public to the Reserve Bank, almost everyone agrees Sydney has a critical problem. The wrangling isn’t over whether to reduce prices, but how. And that depends on where you fit in the city’s system of interests with a stake in property development and construction.

Conflict of interests

Generally, these fall into three groups, with their distinct agendas.

First, the producers and beneficiaries of Big Projects; large-scale housing and urban renewal schemes, particularly high-end apartment developers, top-tier architectural practices, urban planners, rail transport engineers and “sustainability” consultants. Joining them are governments levying value-based property charges, financial institutions with large home mortgage books, and media groups dependent on luxury apartment advertising. “Three of the biggest forces pushing up dwelling prices (the banks, state governments and councils) are like drug addicts”, writes Robert Gottliebsen, “they are hooked on keeping dwelling prices at the current levels or increasing them further”.

The high-land-value coalition's agenda encompasses residential densification, preferably on infill or brownfield sites, transit-oriented-development (TOD), and a tendency to CBD-centrism. On the whole, they are supply-solution advocates and support tax concessions.  

Second, progressive policy analysts and welfare advocates, closely aligned with the university system and highly educated knowledge-worker elite. They, too, promote inner-urban infill development, higher core and middle-ring densities, and public amenities associated with TOD. While the Big Project coalition is mostly driven by finances, cultural-lifestyle factors loom large for knowledge-welfare types. Hence their demands for more housing near “consumer city” localities crammed with trendy bars, pubs, nightclubs, restaurants, cafes, art galleries, theaters, museums and cinemas. This plays into “creative-class” perspectives on economic growth and an aversion to suburbanization as “unsustainable”. Some of them are supply-solution sceptics, leaning toward demand-management, and most are aggressive critics of tax concessions. They urge more social housing schemes and inclusionary zoning, which Big Project lobbies oppose (with good reason; the evidence suggests it reduces supply and raises prices).  

Third, fringe or greenfield detached house builders, the mass of low-to-middle income industrial or routine service workers, low-level government employees, marginal small traders, in industries like retail, wholesale, logistics, transport, distribution, manufacturing, construction and trades. This worker-trader class is particularly sensitive to input costs, including the impact of high land values on commercial rents. Many rely on real estate as security for financing and gravitate to homes, offices and plant in low-cost, peripheral, auto-oriented regions like Greater Western Sydney.

There is some overlap between the groups, with elements of the Big Projects coalition, architects, urban planners, sustainability consultants and engineers, crossing over to the knowledge-welfare elite. Apartment developers routinely deploy creative-class and green arguments for proposals which are integrated into broader densification—TOD zoning and infrastructure arrangements.

Past affordability eruptions were blown off course by the tax issue. Eventually, Labor embraced reform of negative gearing and CGT concessions as policy, urged on by think tanks like Grattan Institute and McKell Institute, prominent knowledge-welfare voices. Yet according to their own estimates, prices would fall by a measly 2 and 0.49 per cent respectively.

Considering that Sydney prices have escalated by a staggering 64 per cent since 2012, the focus on tax reform is a distraction. Economists like Judith Sloan and Stephen Koukoulas maintain that if there are any tax impacts at all, they are secondary to supply constraints rather than vice versa.

Most of the Big Projects coalition and worker-trader class subscribe to a supply-solution in principle. But there are differences on what this means in practice. An explicit apportionment of new housing between brownfield-infill sites and greenfield development was dropped from the NSW Government’s A Plan For Growing Sydney. An outcome is achieved by focusing on 14 Priority Growth Areas and Precincts, only 5 of which contain substantial greenfield potential.

Growth Areas inside established built-up localities are Rhodes East, St Leonards and Crows Nest, Greater Parramatta to Olympic Peninsula, Sydney Metro Northwest, Sydenham to Bankstown Corridor, Western Sydney Employment Area, Epping and Macquarie Park, Arncliffe and Banksia, and Ingleside Precinct. The outer, peripheral areas with most capacity for new land release or greenfield development are North West Growth Area, South West Growth Area, Greater Macarthur Growth Area, Western Sydney Growth Area and Wilton New Town, which lie within seven Local Government Areas (LGAs); Blacktown, The Hills, Camden, Campbelltown, Liverpool, Penrith and Wollondilly Shire.  

Under A Plan for Growing Sydney, the authorities are planning for an additional 1.6 million people and 664,000 dwellings across the Sydney metropolitan region by 2031. According to NSW Department of Planning “state and local government area household and implied dwelling projections” to 2031, Blacktown LGA will have 48,300 new dwellings, The Hills LGA 28,650, Camden LGA 38,250, Campbelltown LGA 19,450, Liverpool LGA 32,400, Penrith LGA 20,900 and Wilton New Town, in Wollondilly Shire, 16,000 dwellings. In other words, these fringe priority areas are to accommodate an additional 203,950 dwellings, or around 30 per cent of the extra 664,000 dwellings across metropolitan Sydney.

Of course, not all construction in the 7 peripheral LGAs will be on new land, so the share of total dwellings on greenfield sites will be even lower. The Urban Development Institute of Australia (UDIA) estimates that Sydney greenfield lot production is running at 11,600 a year and will reach 12,355 a year in 2017/18. If achieved, that translates to 185,325 or 27 per cent of the 2031 metropolitan dwelling forecast (equating a fringe lot to a single dwelling). 

This month, the Department of Planning released accelerated forecasts totaling 184,300 new houses and apartments across the 33 metropolitan LGAs by 2021. Of these, 8,350 are assigned to The Hills LGA, 13,600 to Blacktown LGA, 11,800 to Camden LGA, 6,700 to Campbelltown LGA, 8,050 to Liverpool LGA, 6,600 to Penrith LGA and 1,450 to Wollondilly Shire. Together, these represent 30 per cent of the metropolitan total. Large increases are channeled into established areas, including 21,450 in Parramatta LGA, 18,250 in Sydney LGA (covering the CBD and surrounds), 12,200 in Canterbury-Bankstown LGA and 10,000 in Bayside LGA. NSW Planning Minister Rob Stokes boasted“we are getting the balance better … getting over the greenfield issue was the biggest thing that needed to be done”. The targets were to be fleshed out in Draft District Plans administered by a new planning politburo, the Greater Sydney Commission (GSC).  

Within days, however, the GSC announced its own strategy and targets. The total housing target is distributed to 6 Districts across the city, Central, North, West Central, West, South West and South, rather than Priority Growth Areas. Based on a metropolitan total target of 725,000 dwellings for 2 million more people, each Draft District Plan nominates a 20 year target to 2036. The South West District contains 4 of the peripheral LGAs with most potential for greenfield construction, Camden, Campbelltown, Liverpool and Wollondilly. Its 20 year housing target is 143,000 dwellings, or 19 per cent of the metropolitan total. Of the other 3 LGAs with most greenfield potential, Penrith accounts for just part of West District’s target of 41,500 dwellings or 5 per cent of the metropolitan total, while Blacktown and The Hills are in West Central District, which is dominated by Parramatta LGA with minimal new land release capacity.

Higher the density, higher the prices

Suppression of greenfield development reflects a view that location and density don’t condition the benefits of supply. Yet this is contrary to a body of economic analysis on the land value impacts of urban containment. Citing LSE economist Paul Cheshire, commentator Phil Hayward gives a cogent account of this in “The Myth of Affordable Intensification”.

Hayward explains that the more density allowed, the higher the average housing unit price becomes. Cheshire put this down to a bidding-war at the margins of each income-level cohort of society for slightly more space. The less average space available per household, the more intense is the bidding-war effect. Site development potential in an urban land market with a regulatory limit on land supply, writes Hayward, seems to capitalise into site values. When the market allows people to consume as much space as they want, the bidding-war effect is absent.

Urban land economists like Cheshire and Alan Evans at Reading University consider housing a complex good … consisting of many attributes bundled into one composite good. The land base is a particularly important attribute. With rising population and incomes, restrictions on the quantity of land at the periphery ratchet up values across the whole urban region. The evidence that fixed urban growth boundaries put upward pressure on land and thus house prices is clear. While no formal boundary is proposed for Sydney, delimited Priority Growth Areas and GSC Districts have the same effect, operating as land value traps. Between 2009 and 2014, the Sydney median greenfield lot price ballooned from $269,000 to $339,750, reports the UDIA, even though lots released per annum rose from 2503 to 8597.

To subdue prices, Cheshire argues in a 2009 paper, it isn’t enough to rezone and release enough residential land to meet anticipated demand:

If we are to provide stable prices … what we need to predict is the effective demand for housing and garden space given that it is the quantity of land that the system allocates. Then we have to allocate not just the quantity of land predicted as being compatible with price stability but more. Not all the land allocated as available for development will actually be developed. One rule of thumb suggested is that this implies allocating 40 per cent more land than the estimated demand indicates is needed.

In Sydney’s case, the authorities aren’t just failing to supply a buffer of land above population and demand projections. Worse, their targets and greenfield-infill ratio are shaped by bureaucratic value judgements on where people should settle, rather than land markets.

On top of this, proximity to amenities is another housing attribute which capitalises into prices. Advocates of TOD demand more housing near public transport hubs, or, better coordination of land use and transport infrastructure, as they put it. But evidence from the US suggests that land values within 800 metres of mass transit can rise by up to 120 per cent. Adjacent property prices can rise by 32 to 45 per cent. 

Opponents of fringe development object that the housing will be too far from jobs, assuming monocentricity or concentration of jobs in the urban core. Yet the Long-Term Public Transport Plan For Sydney found that of the jobs supposedly in centres, 37.1 per cent were actually spread over 33 dispersed locations. Only the CBD with 12 per cent and South Sydney with 2.5 per cent had more than two per cent of the total. The other 62.9 per cent were scattered randomly.  

Investigating whether outer suburban workers have extra long commutes, in fact, Alan Davies concluded average commute times don’t vary a lot geographically within large Australian cities. Peter Gordon of the University of Southern California has researched commute times in American cities over decades, reporting remarkable stability of travel times across inner and outer metropolitan sectors despite population growth. Many individual households and firms ‘co-locate’ to reduce commute time, he explains, and this spatial adjustment [is easier] in dispersed metropolitan space.

One advocate of inner-ring densification denied that it relies on price-hiking growth boundaries, claiming that relaxing floor space regulations in an Alonso-type model will give the same [densification] effect, with infinite city size. However, the Alonso model incorporates an artificial assumption of monocentricity. Higher paying professional jobs may locate closer to the core, on average, than lower paying jobs. But it’s lower paid workers who are most in need of cheaper housing. Recently, Grattan Institute’s John Daley wrote“it’s important that new supply is focused on the inner and middle rings – 2-20km out of the CBD – of our large cities … new developments on the edge tend to be a long way from where additional jobs are being created”.

In other words, he propagates the myth of monocentricity and implies that worker-trader jobs don’t count.

NSW Treasurer Gladys Berejiklian has announced that residential construction activity in NSW has hit an all-time high. But if that construction is funneled into increasingly expensive sites, Sydneysiders face a recurring home ownership nightmare.

This is an edited version of an article first published on The New City.

John Muscat is a co-editor, along with Jeremy Gilling, of The New City, a web journal of urban and political affairs.

Photo: Photograph by Gnangarra [CC BY 2.5 au], via Wikimedia Commons

Advancing the Texan City-Building Model

$
0
0

Reading the recent report “The Texas Way of Urbanism” promptly reminded me of my status – twice a migrant; from small town to big city (Athens) and from big city to another country. These moves were propelled by a singular motivation: seeking opportunity to better my lot. I knew next to nothing about the cities I moved to: their shape and history, their culture, their social divisions and even language were absent from my viewfinder. All that mattered was the chance for a new start. And that’s how Texan metropolises emerge from the report’s pages – gates to opportunity. I carry this typical migrant perspective as a fact-checker to all discussions about cities – magnet-cities.

It also rekindled an irritation about how warped the conversation about cities often is; as if a group of dilettantes in a pageant give cities points and declare winners. Points are given for: “urban/suburban”, “dense/spacious”, “compact or not”, “grid or not”, “beauty/ugliness” and so on. These arbitrary, spurious abstractions do not register with the migrant – the city’s wealth generator. A professor moves to a post away from home, a multinational corporation executive to another continent, and an oil rig specialist to a small-town with black gold – they are all wealth generators; they move to pursue a goal and, in the process, they build cities unwittingly. They shape them by their actions.

In admitting that Houston “[….]is not beautiful upon first blush, nor does it offer the charm of pedestrian fancy that denser cities boast”, the report affirms that Texan cities have the right approach: first mind how to generate wealth, then empower citizens to achieve the good life. What follows is a city like no other in history, one that reflects its time, culture and values. It is not Paris, or London, or Tokyo, it is Houston or Austin. The model works. And just as all its predecessors, the new city is never static, not a stage set, it’s a movie in slow motion – it evolves.

Evolution means adaptation to new pressures. It does not have a destination, a preordained ultimate goal, or shape. In that light, it is a reactive process, constantly responding to emergent conditions.

   The pressure for movement space and its distribution in cities like Barcelona is intense

From that perspective, the model that builds Texan metropolises is neither final or complete. It inevitably misses unanticipated, emergent factors that today play a role in a functioning city. It has, for sometime, incorporated responses to the pressures of a motorized economy by building infrastructure sufficient to move people and goods to their destinations and it does that better than other U.S. cities. But as the combined effects of automobility are tallied up, a new pressure point has built up. It demands an adaptation to the nature and function of non-motorized mobility and its realm – the foot realm. The pressure is not about more “beauty” or “charm” or a nostalgia for old times, it is about space: redressing the imbalance between space assigned for speeds exceeding 20 miles and space for those below. These two spaces are incompatible. A response to this pressure would add functionality to the Texan model of city making.

   Redistribution of space with controls

Adaptations to rectify this imbalance need not be invented; they already exist mostly in older cities but also in Texan urban areas. However, they have been mostly sporadic and unsystematic. Nevertheless, all these case-by-case changes nurtured an appreciation for the vast improvement in the quality of the daily city experience, the heightened sociability and the intensified economic activity. In turn, this new appreciation generated greater demand for spaces and places endowed with these qualities.

Two systematic, universal versions of a layout model – call them “hybrid” grids – have appeared; one in Barcelona, Spain and the second in Calgary, Canada. One for fixing built-up areas and the other for greenfield development.

That the city of Barcelona would propose a model for transformation might have been expected. It has an expansive, regular grid that is under perilous pressure: extremely dense, congested, mired in emissions and all its surface space taken for motorized movement and parking. The only option was to reallocate the available space. And that reassignment is now underway.

A team of Barcelona planners have started the implementation of the “superilles” (superblock) model to the classic Barcelona square grid, (see drawing). The principles underpinning the concept are simple and intuitive:

     •  No through motor traffic means that streets at the walking scale (400x400 m) serve as capillaries only; they occupy the lowest rank in the network hierarchy, where circulation essentially stops. They serve the residents of a “quadrant” (or “quartier”) only, are unmistakeably local and, thanks to lighter traffic, can be made narrower, freeing up space for other functions.

     •  Full accessibility for active transport within the quadrant: people circulation is switched “on” while motorized transport is “off” by means of looping cars back to its perimeter. This preferential filtering manages the permeability of the quadrant to its residents advantage. Additional switches, such as card-activated bollards and the scheduling for entry, parking and deliveries, would add accuracy and flexibility of the “on-off” switching and refine the filtering.

     •  Surface space gained from the circulatory function is then assigned to nature and to recreational/social activities thereby strengthening cohesion within each quadrant.

These typical modular layouts are then applied to the entire grid of the city with appropriate modifications for circumstantial conditions.

Houston and Austin are two among many U.S. cities that sport square grids just like Barcelona’s. Houston in particular has inherited exceptional 80-foot right-of-ways that offer considerable design flexibility for rearrangement.

The adaptation that will address the imbalance between vehicular and non-vehicular space in a city is here awaiting adoption. Texan cities can advance their already effective city-building models to a higher state of completion and of responsiveness to current pressures.

Fanis Grammenos heads Urban Pattern Associates (UPA), a planning consultancy. UPA researches and promotes sustainable planning practices including the implementation of the Fused Grid, a new urban network model. He is a regular columnist for the Canadian Home Builder magazine, and author of Remaking the City Street Grid: A model for urban and suburban development. Reach him at fanis.grammenos at gmail.com.

Top image: Augustus Koch (1840-?). [Public domain], via Wikimedia Commons

Everyday Encounters: Antagonism in the Sharing Economy

$
0
0

Much has been written about the growth of the sharing economy where information technology, such as mobile apps and automated software facilitate interactions between businesses, individual workers, and customers. Proponents argue that the system provides greater access to goods and services at lower prices while reducing costs for employers and independent contractors. They also claim that, in the gig sector of the sharing economy, workers gain flexibility because they determine their own hours, tools, and working conditions while raising potential earnings.

Regardless of whether we buy these claims about benefits to workers, there are numerous signs that the sharing economy creates antagonism between workers and customers. The apps and automated systems that underlie these new work structures require both workers and customers to rely on technology, yet the systems are often faulty and poorly designed.  While these systems promise transparency and trust, they also create tensions. For example, such systems unfailingly include algorithmic performance assessment of service industry workers. As technology writer and software engineer Tom Slee has argued, “Rather than bringing a new openness and personal trust to our interactions, [such shifts are] bringing a new form of surveillance where service workers must live in fear of being snitched on, and while the company CEOs talk benevolently of their communities of users, the reality has a harder edge of centralised control.”  The increasing antagonism resulting from the perpetuation of inequality among “stakeholders” has received insufficient attention.

Service industry workers have long operated as the front-line interface with customers, having to respond to complaints about company practices that they don’t control. Now service workers have even less control due to structural and technological platforms.  When platforms fail, inconveniencing and frustrating customers, workers have little power to resolve disputes.  At the same time given the dependence on technology and lacking access to customer information, they cannot build relationships with customers over time. Indeed, it is almost impossible to contact the same customer service representative twice, so consumers then become obliged to give the same information over and over again. The interactions between customers and workers often predictably devolve, generating frustration, impotence, and anger on both sides and voiceless workers  subjected to performance review by customers following interactions. Dependence on technology estranges service workers from customers, undermining the possibility of finding satisfaction on the job because of increased misunderstandings and conflicts.

Just as proponents ignore the way automation undermines the quality of work, they also misrepresent what the sharing economy offers to consumers. Although they claim that automation generates a high degree of efficiency and autonomy to customers, they overlook time-consuming administrative inefficiency and poor customer service.  For example, in the gig sector, where a few companies dominate particular markets, companies have little reason to worry about consumer rights. No doubt this contributes to the increasing conflicts and complaints associated with technology and social media in air travel, banking and other financial institutions, cable television and communications companies, insurance and health firms, and universities.

To make matter worse, customers in the sharing economy must go to great lengths to seek basic information and answers to queries. Even when customers succeed in reaching customer service representatives, they are often treated with robotic indifference or a stilted hyper-courtesy that barely conceals institutional disdain. Customer service representatives often speak in a language of faux-camaraderie that couches authoritarian directives as suggestions as in the ubiquitous “Why don’t you go ahead and. . .” Corporations exacerbate the problem by pairing this passive-aggressive treatment with service fees and other administrative charges, so that customers are not only treated poorly, they pay for that privilege.  This problem affects less educated and less well-off customers, especially, who may have less access to or experience with technology and the Internet and are less able to afford fees or phone charges.

Some companies will not make themselves available at all, having developed bureaucratic systems that cultivate inaccessibility. For example, Amazon has refused to engage with customers directly by phone. Other companies have trained call center employees to repeat marketing mantras and to speak like machines giving pre-scripted answers that may or may not match a customer query. These bureaucratic obstructions, including automated customer service and phone banks and the outsourcing of customer service “chat” and email services, only deepen the antagonism of customers toward corporations and their intermediaries.

The antagonism generated by these practices affects working- and middle-class people far more than it does the elite, who often enjoy preferential treatment through concierge services in hospitals or all business-class airports.  Such VIP/concierge services help elites navigate organizations, technology, and services, while most customers must work harder to gain access to restaurants,  hotels, sports and other entertainment events, and a range of other services and sites.  As Cathy O’Neil in Weapons of Math Destruction has noted, “The privileged, we’ll see time and again, are processed more by people, the masses by machines.”

Non-elites unable to “opt-out” of the antagonistic service economy may find consolation in the techno-future conjured up by Amazon Go, which showcases the pleasures of never having to interact with other humans at all. In glossy ads for what Amazon deems the “world’s most advanced shopping technology,” checkout is eliminated – as are retail clerks — as shoppers employ an app that simply charges them for the items they select.  Privileged relationships with commodities dominate the scene in an ad in which hardly anyone speaks to or even looks at anyone else.

In the past few months, commentators have explained support for Donald Trump in the US or  “Brexit” in the UK as expressions of populist rage.  One source of that rage may well be everyday encounters of the kinds sketched here.  If working-class people feel like they don’t matter in contemporary capitalism, that may reflect the challenges of working in the sharing economy, with its low wages, limited autonomy, and inherent conflicts, but also the challenges of an antagonistic service culture that mounts daily micro-assaults on people’s dignity and rights.

Diane Negra is Professor of Film Studies and Screen Culture and Head of Film Studies at University College Dublin.John Russo is a visiting fellow at Kalmanovitz Initiative for Labor and Working Poor at Georgetown University and at the Metropolitan Institute at Virginia Tech. He is the co-author with Sherry Linkon of Steeltown U.S.A.: Work and Memory in Youngstown (8th printing).

Photo by Colin@TheTruthAbout - https://www.flickr.com/photos/thetruthabout/15172340596/, CC BY-SA 2.0, Link

How Silicon Valley’s Oligarchs Are Learning to Stop Worrying and Love Trump

$
0
0

The oligarchs’ ball at Trump Tower revealed one not-so-well-kept secret about the tech moguls: They are more like the new president than they are like you or me.

In what devolved into something of a love fest, Trump embraced the tech elite for their “incredible innovation” and pledged to help them achieve their goals—one of which, of course, is to become even richer. And for all their proud talk about “disruption,” they also know that they will have to accommodate, to some extent, our newly elected disrupter in chief for at least the next four years.

Few tech executives—Peter Thiel being the main exception—backed Trump’s White House bid. But now many who were adamantly against the real-estate mogul, such as Clinton fundraiser Elon Musk, who has built his company on subsidies from progressive politicians, have joined the president-elect’s Strategic and Policy Forum. Joining Musk will be Uber’s Travis Kalanick, who half-jokingly threatened to “move to China” if Trump was elected.

These are companies, of course, with experience making huge promises, and then changing those promises to match new circumstances. Uber, for instance, touted itself as a better deal than a cab for both riders and drivers before it prepared to tout a better deal for riders by replacing its own soon-to-be obsolete drivers with self-driving cars.

Silicon Valley and its leading mini-me, the Seattle area, did very well under Barack Obama, and expected the good times to continue under Hillary Clinton. Tech leaders were able to emerge as progressive icons even as they built vast fortunes, largely by adopting predictably politically correct issues such as gay rights and climate change, which doubled as a perfect opportunity to cash in on Obama’s renewable-energy subsidies. Increasingly tied to the ephemeral economy of software and media, they felt little impact from policies that might boost energy costs or force long environmental reviews for new projects.

No wonder Silicon Valley gave heavily to Obama and then Clinton. In 2016, Google was the No. 1 private-sector source of donations to Clinton, while Stanford was fifth. Overall the electronics and communications sector gave Democrats more than $100 million in 2016, twice what they offered the GOP. In terms of the presidential race, they handed $23 million to Hillary, compared to barely $1 million to Trump.

Yet, there is one issue on which the Valley has not been “left,” and that is, predictably, wealth. It may have liked Obama’s creased pants and intellectually poised manner, but it did not want to see the Democrats become, God forbid, a real populist party. That is one reason why virtually all the oligarchs favored Clinton over Sanders, who had little use for their precious “gig economy,” the H-1B high-tech indentured-servants program, or their vast and little-taxed wealth.

Jeff Bezos, the Amazon founder with a net worth close to $70 billion, used his outlet, The Washington Post, to help bring down Bernie, before being unable, despite all efforts, to stop Trump. So now Bezos sits by Trump’s side, hoping perhaps that the president-elect’s threats to unleash antitrust actions against Amazon will be conveniently forgotten as an artful “deal” is struck.

For these and other reasons, there’s little doubt that the tech elite would have been better off under Clinton, who likely would have, like Obama, disdained antitrust actions and let them keep hiding untaxed fortunes offshore. Now, they will have to share the head table with the energy executives they’d hoped to replace with their own climate-change-oriented activities.

The tech oligarchs have long had a problem with what many would consider social justice. Although the tech economy itself has expanded in the current period, its overall impact on the economy has been less than stellar. For all of its revolutionary hype, it’s done little to create a wide range of employment gains or boost worker productivity.

To be sure, there have been large surges of employment in the Bay Area, Seattle, and a handful of other places. California alone has more billionaires than any country in the world except China, and nearly half of America’s richest counties.

But for much of the country, notably those areas that embraced Trump, the tech “disruption” has been anything but welcome news. This includes heavily Latino interior sections, home to many of America’s highest employment rates. Overall, the “booming” high-wage California economy celebrated by progressive ideologues like Robert Reich does not extend much beyond the Valley. In most of California, job gains have been concentrated in low-wage professions.

Despite its vast wealth, California has the highest cost-adjusted poverty rate in the country, with a huge percentage of the state’s Latinos and African Americans barely able to make ends meet. California metropolitan areas, including the largest, Los Angeles, account for six of the 15 metro areas with the worst living standards, according to a recent report from demographer Wendell Cox. Meanwhile, the middle and working class, particularly young families, continue to leave, with more people exiting the state for other ones than arriving to it from the, in 22 of the past 25 years.

Even in Silicon Valley itself the boom has done little for working-class people, or for Latinos and African Americans—who continue to be badly underrepresented at the top tech firms as many of those same firms aggressively promote diversity. A study out of the California Budget and Policy Center (PDF) concluded that with housing costs factored in, the poverty rate in Santa Clara County soars to 18 percent, covering nearly one in every five residents, and almost one-and-a half times the national poverty rate. Since 2007, amidst an enormous boon, adjusted incomes for Latinos and African Americans in the area actually dropped (PDF).

Much of this has to do with change in the Valley’s industrial structure, which has shifted from manufacturing to software and media. The result has been a kind of tech alt-dystopia, with massive levels of homelessness, and housing costs that are prohibitive to all but a small sliver of the local population.

With a president whose base is outside the Bay Area, and dependent on support in areas where jobs are the biggest issue, the tech moguls will need to find ways to fit into the new agenda. The old order of relentless globalization, offshoring, and keeping profits abroad may prove unsustainable under a Trump regime that has promised to reverse these trends. In some senses the Trump constituency is made up of people who are the target of Silicon Valley’s “war on stupid people.” Inside the Valley, such people are seen as an obstacle to progress, who should be shut up with income supports and subsidies.

So can Silicon Valley make peace with Donald Trump, the self-appointed tribune of the “poorly educated”? There are two key areas where there could be a meeting of minds. One is around regulation. One of the great ironies of the tech revolution is that the very places that are home to many techies—notably blue cities such as San Francisco, Austin, and New York—also tend to be the very places most concerned with the economic impacts of the industry.

Opposition to disruptive market makers in the so-called sharing economy like Uber, Lyft, and Airbnb is greatest in these dense, heavily Democratic cities. What’s left of the private-sector union movement and much of the progressive intelligentsia is ambivalent if not downright hostile to the “gig” economy. Ultimately, resistance to regulations relating to this tsunami of part-time employment could be something that Trump’s big business advisers might share in common with the techies.

More important will be the issue of jobs. It may not work anymore for firms to lower tech wages by offshoring jobs or importing lots of foreign workers under the H-1B visa program, since Trump has denounced it. IBM’s Ginni Rometty, who had been busily replacing U.S. workers with ones in India, Brazil, and Costa Rica, has now agreed to create 25,000 domestic jobs. Other tech companies—including Apple—have also been making noises shifting employment to the United States from other countries. Trump may well feel what “worked” with Carrier can now be expanded to the most dynamic part of the U.S. economy.

If the tech industry adjusts to the new reality, they may find the Trump regime, however crude, to be more to their liking than they might expect. Companies like Google may never again have the influence they had under Obama, but many techies may be able to adjust. As long as the new president “deals” them in, the techies may be able to stop worrying about Trump and begin to embrace, if not love, him.

This article first appeared on The Daily Beast.

Joel Kotkin is executive editor of NewGeography.com. He is the Roger Hobbs Distinguished Fellow in Urban Studies at Chapman University and executive director of the Houston-based Center for Opportunity Urbanism. His newest book, The Human City: Urbanism for the rest of us, was published in April by Agate. He is also author of The New Class ConflictThe City: A Global History, and The Next Hundred Million: America in 2050. He lives in Orange County, CA.

Photo by Gage Skidmore from Peoria, AZ, United States of America (Donald Trump) [CC BY-SA 2.0], via Wikimedia Commons

Photo: MCR World

Viewing all 3794 articles
Browse latest View live


Latest Images