Quantcast
Channel: Newgeography.com - Economic, demographic, and political commentary about places
Viewing all 3794 articles
Browse latest View live

New Report: Putting People First

$
0
0

This is the abstract from a new report “Putting People First: An Alternative Perspective with an Evaluation of the NCE Cities ‘Trillion Dollar’ Report,” authored by Wendell Cox and published by the Center for Opportunity Urbanism. Download the full report (pdf) here.

A fundamental function of domestic policy is to facilitate better standards of living and minimize poverty. Yet favored urban planning policies, called "urban containment" or "smart growth," have been shown to drive the price of housing up, significantly reducing discretionary incomes, which necessarily reduces the standard of living and increases poverty.

This makes the alleviation of poverty, the opportunity for better living standards and aspirations for upward mobility secondary to contemporary urban planning prescriptions. Despite this, calls to intensify land use regulations are becoming stronger and more insistent.

A New Climate Economy report (NCE Cities report), by Todd Litman, "Analysis of Public Policies that Unintentionally Encourage and Subsidize Urban Sprawl," contends that the failure to implement urban containment policy (smart growth) costs more than $1.1 trillion annually in the United States. The urban containment policies favored by the NCE Cities report seek substantially increase urban population densities and transfer urban travel from cars to transit, walking and cycling.

There are serious consequences to such policies, which lead to lower standards of living and greater poverty. This report evaluates the NCE Cities report which places urban containment policy as its most important priority. This Evaluation report offers an alternate vision, focused on improving living standards for all, while seeking to eradicate poverty.

The NCE Cities report relies heavily on social costing and externality analysis of lower density development. While these are useful tools, they are ultimately subjective and should be used with great caution.

This Evaluation identifies a number of issues with respect to the NCE Cities report cost analysis.

1. Nearly 90% of the cost is attributable to personal vehicle use, and is based on a fixed cost per mile differential between the Most Compact (densest) quintile of US urban areas and the four quintiles that are less dense. This Evaluation finds a range of differences in per capita mileage among the quintiles that is far smaller than the NCE Cities report estimates. Adjustment for this and other issues would reduce the NCE Cities report cost estimate by nearly 85 percent, to a maximum that is under $200 billion. Other, unquantified issues are identified that could reduce the reduced estimate even further.

2. The NCE Cities report largely dismisses the housing affordability consequences of urban containment policy. By rationing land, urban containment policy drives up the price of housing and has been associated with an unprecedented loss of housing affordability in a number of metropolitan areas in the United States and elsewhere. Urban containment policy has also been associated with greater housing market volatility. This is a particular concern given the role of the 2000s US housing bubble and bust in precipitating the Great Financial Crisis that resulted in a reduction of international economic output.

3. Urban containment policy has significant negative externalities. A recent economic analysis associates an annual loss of nearly $2 trillion in gross domestic product in the United States with more stringent housing regulation. This estimate would nullify the NCE Cities report cost of dispersion estimate by more than 1.5 times. More significantly, it would dwarf the NCES Report cost estimate as adjusted in this Evaluation.

The purpose of public policy in cities is not to focus a particular urban form, planning philosophy, type of housing, population density, or mode of transport. The purpose is rather to seek better lives for people. The most appropriate form of urban planning policy is that which facilitates better living standards and less poverty. There is increasing evidence that urban containment policy is not only irreconcilable with housing affordability and price stability but also with better standards of living and reduced poverty.

Download the full report (pdf) here.

Wendell Cox is Chair, Housing Affordability and Municipal Policy for the Frontier Centre for Public Policy (Canada), is a Senior Fellow of the Center for Opportunity Urbanism (US), a member of the Board of Advisors of the Center for Demographics and Policy at Chapman University (California) and principal of Demographia, an international public policy and demographics firm.He is co-author of the "Demographia International Housing Affordability Survey" and author of "Demographia World Urban Areas" and "War on the Dream: How Anti-Sprawl Policy Threatens the Quality of Life." He was appointed to three terms on the Los Angeles County Transportation Commission, where he served with the leading city and county leadership as the only non-elected member. He served as a visiting professor at the Conservatoire National des Arts et Metiers, a national university in Paris.


Providing Electricity to Africa by 2050

$
0
0

How many Africans will have access to electricity by 2050?

According to the World Bank’s latest figures, 64.6% of the population of sub-Saharan Africa lacked access to electricity in 2012, or a total of 572 million people. Across the world, 1.09 billion have no access to electricity. So, sub-Saharan Africa accounts for more than half the total.

Given the expected boom in the African population and the likely increase in access, the demand for electricity infrastructure is going to explode between now and 2050. On UN estimates (medium variant), the sub-Saharan population will jump from 886 million in 2012 to 2.1 billion in 2050. Assuming that each country’s current access rate remains the same, 381 million additional people will have access to electricity and 855 million additional people will not.

Screen Shot 2015-09-15 at 4.33.48 PM (2)

In order to maintain its current low rate of access, sub-Saharan Africa would have to increase its power generation by at least 100%, and more likely by 200% or more if one accounts for the frequent power outages across the continent.

In order for the subcontinent to raise to 50% the percentage of people who have electricity on a reliable basis, it would need to increase its electricity generation by a factor of 3 to 5.

Power Africa

Then there is President Obama’s Power Africa initiative launched in 2013 which seeks to “double access to power in sub-Saharan Africa”. At first, Power Africa focused on six countries – Ethiopia, Ghana, Kenya, Liberia, Tanzania and Nigeria – and its goal was to add 10,000 megawatts of electricity generation and 20 million new connections.  But during the US-Africa Leaders Summit of 2014, the program was expanded to other countries and its scope was tripled to 30,000 megawatts and 60 million new connections. (Note: this assumes 2,000 connections per megawatt. In developed countries, the ratio is often closer to 1,000 connections per megawatt).

July 2015 fact sheet from the White House states that Power Africa has helped bring on line 4,100 megawatts to 4 million connections. But critics claim that these projects were already in progress before the program was introduced and that new projects have been slow to get off the ground. As reported in this New York Times article, Sam Amadi, chairman of the Nigerian Electricity Regulatory Commission, the country’s electric power regulator, recently said that he was “not aware of any concrete plans for power plants that have emerged as a result of Power Africa.”

In the long term, if ‘double access’ means doubling the number of people who have access to electricity without necessarily increasing individual consumption, that would translate into access for an additional 314 million people, roughly equivalent to the current size of the US population.

But if ‘double access’ means doubling the percentage of people who have access to electricity, that would mean enough new electricity to reach an additional 1.19 billion people on the continent in 2050. This number exceeds the 2015 combined populations of the USA and Europe.

If Africa reaches 100% access in 2050, it will have built enough infrastructure to reach 1.8 billion additional people, a near six-fold increase from the number that have access today.

Other populous nations of the world already enjoy higher access rates. But here also, there is likely to be significant new demand from rising population numbers. Assuming the same access rates in 2050 as in 2012, there would need to be new infrastructure to reach an additional 708 million people living in Mexico, Brazil and several Asian countries.

Per Capita Consumption

At the same time, ‘access’ can mean different things to different people. In the United States, per capita consumption of electricity stands at nearly 13,000 kWh. In China, it is 3,475 kWh. In India, 744 kWh and in much of sub-Saharan Africa, it is less than 500 kWh. Below are per capita consumption numbers for Africa.

Screen Shot 2015-09-23 at 2.25.54 PM (2)

And here are per capita consumption numbers for other emerging nations:

Screen Shot 2015-09-23 at 2.26.12 PM (2)

As usual, financing and execution will be the main hurdles but it is clear that the demand for new electricity infrastructure is going to be very very high in Africa and in Asia.

Sami Karam is the founder and editor of populyst.net and the creator of the populyst index™. populyst is about innovation, demography and society. Before populyst, he was the founder and manager of the Seven Global funds and a fund manager at leading asset managers in Boston and New York. In addition to a finance MBA from the Wharton School, he holds a Master's in Civil Engineering from Cornell and a Bachelor of Architecture from UT Austin.

Photo by DIVatUSAID via Flickr

The Energy Election

$
0
0

Blessed by Pope Francis, the drive to wipe out fossil fuels, notes activist Bill McKibben, now has “the wind in its sails.” Setting aside the bizarre alliance of the Roman Catholic Church with secularists such as McKibben, who favor severe limits of family size as an environmental imperative, this is a potentially transformational moment. 

Simply put, the cultural and foreign policy issues that have defined U.S. politics for the past have century are increasingly subsumed by a divide over climate and energy policy. Progressive pundits increasinglyenvision the 2016 presidential election as a “last chance,” as one activist phrased it, to stop “climate change catastrophe.” As this agenda gets ever more radical, the prominence of climate change in the election will grow ever more obvious.

The key here is that the green left increasingly does not want to limit or change the mix of fossil fuels, but eliminate them entirely, the faster the better. The progressive website Common Dreams, for example, proposes eliminating fossil fuels within five or six years in order to assure “reasonable margin of safety for the world.”

This new militancy is a break from the recent past, when many greens embraced natural gas and nuclear power as practical, medium-term means to slow and even reverse greenhouse gas growth. But the environmental juggernaut, deeply entrenched within the federal bureaucracy and pushed by a president with seemingly limitless authority, is committed increasing to the systematic destruction of one of the country’s most important, and high-paying, industries. One goal is to demonize fossil fuel producers along the lines of the tobacco industry.

The pope’s intervention has bolstered the tendency within the environmental movement not to allow any challenge to its own version of infallibility. This, despite discrepancies between some models of climate change and what has actually taken place.

As we have moved from a rational discussion of the issue toward an increasingly dogmatic agenda, we have lost sight of more pragmatic, and less economically painful, ways to reduce greenhouse gases through methods such as conservation, the substitution of natural gas for coal, and a re-embrace of nuclear power. As the Breakthrough Institute has shown, most reductions in greenhouse gases in the United States have not come from subsidized renewable energy sources but instead from improved efficiency and the rise of natural gas at the expense of coal. Overall, solar and wind, the favorites of the greens, account for barely 1.35 percent of the world’s energy.

The Breakthrough Institute’s pragmatism intends to create a middle ground between the left, which demonizes even the slightest criticism of green policy dogma, and the right, which equally mistakenly dismisses climate change as essentially a fabrication. But with the extremes in control of the debate, we can expect next year to mainly hear divisive discourse instead of solutions.

The Geography of Energy

In some parts of the country, most notably the Northeast and the West Coast, the imperatives of climate change demand the destruction of the fossil fuel industry. In others, those that depend the most on low-cost energy, the attack on fossil fuels represents a moral threat to local economies, jobs and well-being. The battleground will be in the Great Lakes, arguably the most critical region for the next election. Contrary to its sad sack image, the economy there has been on the rebound for years. Virtually every Great Lakes state except Illinois now enjoys unemployment rates below the national average. Several, led by the Dakotas, Minnesota, Nebraska, and Iowa, boast job rates that are among the nation’s highest. 

Three key factors are propelling this comeback: an energy boom, a resulting jump in manufacturing, and relatively low housing costs. Energy firms have been a major source of new work for industrial firms, and lower electricity costs have provided U.S. manufacturers with an energy price advantage over European and Asian firms. German electricity prices, a result of their “green” energy policies, are almost three times the average of those in the United States.

The administration’s directive to all but ban coal could be problematic for many Midwest states, including several—Iowa, Kansas, Ohio, Illinois, Minnesota and Indiana—that rank among those most reliant on coal for electricity. Not surprisingly, much of the opposition to the EPA’s decrees come from Heartland states such as Oklahoma, Indiana, and Michigan.  

Politically, the energy-rich states running from Texas, Oklahoma, and Louisiana up to the Dakotas may be all but lost to the Democrats. Before the decline in oil prices, these areas enjoyed a gusher in energy jobs, providing high wage employment (roughly $100,000 annually) that exceeds compensation for information, professional services, or manufacturing. Due largely to energy, they have enjoyed the highest jobs growth since 2007 and were among the first states to gain back the jobs lost in the recession. 

In contrast, the areas that form the solid base of the progressives—basically the Northeast and the West Coast—have an increasingly small stake in fossil fuel industries. California, which has the fifth largest oil reserves among the states, has basically decided to abandon the industry, gradually pushing the remnants of what was once a thriving sector out of the state.

For the most part, with the notable exception of Pennsylvania, Northeastern states have little in the way of fossil fuels, and have gradually been eliminating much of their manufacturing base for over a half century. Nor do they have much need for electricity for industry as they continue to deindustrialize. Manufacturing accounts for barely 5 percent of state domestic product in New York and 8 percent in California—but 19 percent in Michigan and 30 percent in Indiana.

Rise of the Climate-Industrial Complex

Climate activists such as hedge fund billionaire Tom Steyer increasingly couch their policies on theological grounds, one reason why the pope’s intervention was so timely. Stark self-interest is also at work. Many of the Silicon Valley and Wall Street supporters of green policies have been among those most anxious to capitalize on big oil’s demise. 

This includes cash-rich firms such as Apple, as well as many high-tech financiers and venture capitalists. Some of the biggest new fortunes, notably that of Elon Musk, are largely the creatures of subsidies. Neither SolarCity nor Tesla would be so attractive—and might even not exist—without generous handouts from taxpayers.

In contrast to traditional manufacturers, capitalists like Musk have a well-developed interest  in taking advantage of the most draconian energy legislation. Other tech figures, including top executives atGoogle, have benefited from government-subsidized renewable energy schemes, including a remarkably inefficient and expensive solar project that has obliterated a huge part of the Mojave Desert. 

No surprise, then, that the crony capitalists of Silicon Valley and their Wall Street financiers have emerged as primary funders of the green left. Much like the oil firms that help finance Republicans, particularly those who are climate change skeptics, the new oligarchs have solid business reasons to embrace the pontiff’s environmental dogma, though they seem unlikely to follow his admonitions to eschew corporate greed.

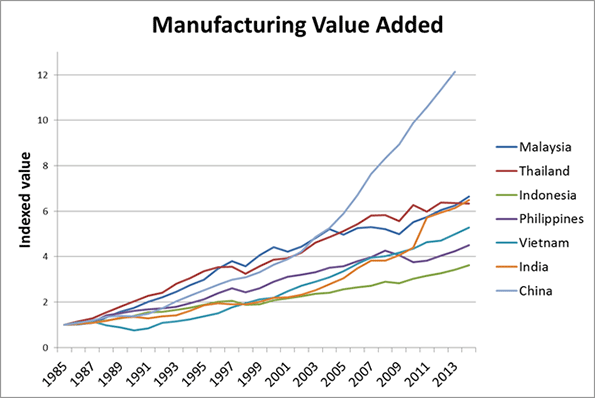
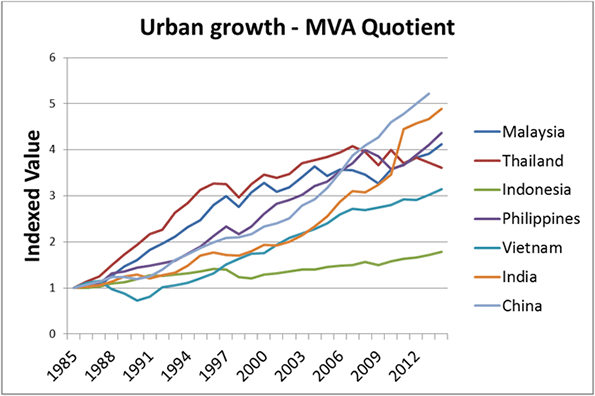
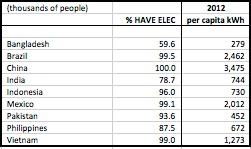
Ironically, the new militancy among greens is likely to hurt most the poor and working class with whom Pope Francis takes pains to identify. A rapid ban on fossil fuels in the developing world would hurt efforts to increase access to electricity. Today, some 1.3 billion people  are off the grid, and not by choice. In sub-Saharan Africa, where much of the world’s population growth is expected to take place, roughlytwo-thirds of the population lacks regular access to electricity.

As Bjorn Lomborg has pointed out, whatever the negative effects of climate change on the poor, the impact of no electricity and poor sanitation are infinitely greater. Climate change policies, he notes, are an inefficient way to accomplish such things as reducing malaria; the Kyoto Protocol’s carbon cuts could save 1,400 malaria deaths for about $180 billion a year. More traditional approaches could save 300,000 people for about $500 million year.

Greens seem to have little idea what the poor want or need. When asked, people in developing countries prioritize such things as education, health care, job opportunities and better food; climate change ranked 16th—dead last on the list—according to a UN survey.

But the green gentry retain their catechisms. Prince Charles embraces the “intuitive grammar” of ultra-dense slums such as Mumbai’s Dharavi, which, he claims, have perfected more “durable ways of living” than those in the suburbanized West.San Francisco’s Friends of the Earth  similarly applauds slum-dwellers as an “inspiration” for the low-carbon urban future, while Stewart Brand openly endorses the notion, “Save the Slums,” because they will save the planet.

Needless to say, it’s unlikely these apostles of urban squalor would want their children to live like that and it is absurd to suppose that leaders of such emerging powers as India and China have any intention of giving up on their gains in reducing poverty. We cannot expect they will accommodate the passions of wealthy Westerners at the expense of their own people.

A War on the Western Working Class?

Those most likely to pay for the new green agenda will be middle- and working-class populations in what are now rich countries. Germany spends hundreds of billions of dollars on solar panels and wind turbines that provide only an unreliable 15 percent of its electricity and 3 percent of its total energy. German consumers pay three times more for electricity than the average American. It’s so bad that Germans have added a new term to the language: “energy poverty.”

Perhaps the best test case for the impact of draconian climate policies is in my adopted home state of California. Here, high energy costs brought about by renewable mandates have devastated manufacturing growth and boosted electric bills, particularly in the poorer, and hotter, inland areas. Asone recent study found, the summer electrical bills in rich, liberal Marin come to $250 monthly while in impoverished Madera, the average is twice as high.

Of course, energy policy is just one of the things raising poverty in a state where many of the world’s greatest fortunes are being minted. But it’s part of a climate change-driven agenda that is also somewhat responsible for the state’s absurdly high housing costs by consciously limiting affordable suburban growth. Overall, nearly a quarter of Californians live in poverty, the highest percentage of any state, including Mississippi, and, according to a recent United Way study, close to one in three are barely able to pay their bills.

With the blessings of the pope and broad support in the media, few Democrats are likely to stand up against the green policies. Hillary Clinton’s shift against the Keystone XL Pipeline, despite strong union support for the project, shows that she is willing to trade blue-collar workers in the Heartland for the approval of the coastal gentry, among whom climate change has acquired something of a religious aspect. “Whether it’s eating vegetarian or wearing organic eye shadow, we're all shopping for absolution,” observes Daniel Engber in Slate.

Ultimately Democrats will embrace the determined attempt by President Obama to secure his “legacy” as the great calmer of the Earth’s climate. Yet there’s some question how effective these policies will prove. Invariably, efforts will follow to silence those skeptical of the current course, particularly regarding the economic impact on working-class voters. In California, Steyer and his allies have worked overtime to suppress any potential dissent from politicians who hail from the largely Latino, blue-collar districts hit most directly by these policies.

Despite a massive investment in Latino “grassroots” front groups, as well as politicians, this effort is not foolproof. This month a handful of largely Latino and inland Democrats, some of them backed by the state’s residual energy industry, killed Jerry Brown’s attempt to force a 50 percent reduction in fossil fuel use by 2030, a measure that would have allowed the state impose gas rationing.

To be sure, this rebellion may prove short-lived, as state regulators now seem determined to impose by decree what could not even make it through the state’s Democratic-dominated legislature. Steyer loyalists such as State Senate President Kevin de Leon will continue to mollify his impoverished constituents–nearly half of all households in his district earn less than $34,000 a year—with handouts from “cap and trade funds” and the ever illusive chimera of “green jobs.”

In truth, if anyone has benefited from green policies and subsidies, it’s been the well-off.

They are the ones who benefit from subsidized solar, electric vehicles, and fuel-efficient cars; a recent UC Berkeley study found the top fifth of households received 60 percent of these wealth transfers, compared to barely 10 percent of those in the bottom quintile. Generally speaking, barrio residents don’t drive $100,000 Teslas.

So will climate change be an effective issue for the Democrats next year? There is room for skepticism. In 2014 Steyer and his acolytes spent some $85 million on “green” candidates, only to fail impressively. Geography and class work against their efforts, driving longtime working and middle-class Democrats, driving voters in places like Appalachia, the Gulf Coast and some areas of the Great Lakes increasingly out of the Democratic Party.

It is not even certain that Millennials, faced with diminishing prospects for good jobs and home ownership, will prove reliable backers of a draconian climate agenda. One recent survey suggested that young voters are actually less likely to identify as “environmentalist” than previous generations. 

Like extreme social conservatism on the right, climate change thrills the coastal “base” of the Democratic Party, but threatens to lose support from other parts of the electorate. Despite the duet of hosannas of both the hyper-secular media and the Bishop of Rome, a policy that seeks, at base, to reduce living standards may well not prove politically sustainable.

This piece originally appeared at Real Clear Politics.

Joel Kotkin is executive editor of NewGeography.com and Roger Hobbs Distinguished Fellow in Urban Studies at Chapman University, and a member of the editorial board of the Orange County Register. He is also executive director of the Houston-based Center for Opportunity Urbanism. His newest book, The New Class Conflict is now available at Amazon and Telos Press. He is also author of The City: A Global History and The Next Hundred Million: America in 2050. He lives in Orange County, CA.

Midwest drilling rig photo by Bigstock.

Running The Numbers On Transport Options

$
0
0

Households are offered a great deal of advice which seems intended to dissuade them from using private, motorised transportation — that is, cars. Information about the negative fallout of car ownership — environmental and otherwise — has often been coloured with ethical overtones. Yet, despite those exhortations and the many well-known and indisputable reasons to cut back, extensive reliance on personal motor transport remains unchanged, if not growing. For example, the rate of car ownership since 1962 has doubled in the US, Canada, Australia and New Zealand; quintupled in Switzerland, Norway and Belgium and tripled in Sweden. This persistent growth alone undermines the claim of a high cost of ownership.

Other trends also back up the notion that cost is not a key issue, and does not belong among the arguments in favour of reducing driving.


Chart 1. Source: Joyce Dargay, Dermot Gately and Martin Sommer: Vehicle Ownership and Income Growth, Worldwide: 1960-2030. Institute for Transport Studies, University of Leeds

In the US, for example, the costs of buying and operating a car have been continuously dropping. An analogous trend can be seen in the UK (Chart 2), where car costs have risen more slowly than the general retail price index, and slower than rail and bus fares (Note: The UK sustains higher tax levels and gasoline prices than the US.) It stands to reason that lower purchase and operation costs increase the car’s affordability.


Chart 2. Source: UK Department for Transport Statistics 1997-2011 report Table TSGB0123 Retail Prices Index: Transport Components.

Since 1979, incomes in developed countries have been on a rising trend, despite transient periods of economic stagnation. Increased buying power has made numerous commodities — including cars — more accessible.

The obvious affordability of personal motorized transport does not mean that it will or should obliterate other, more affordable transport options: public transit in all its forms, and bicycling or walking.

Public transit’s drawbacks are inflexibility and tardiness. Its reach often excludes employment sites at peripheral locations; as a Brookings Institute report has noted, “...Among very large metro areas, the share of jobs accessible via transit ranges from 37 percent in Washington and New York to 16 percent in Miami.” This limits access to employment for those disadvantaged households that rely entirely on transit for transportation. Though this inflexibility is shared by subway systems, subways generally have a speed advantage over cars in central, congested districts.

The almost no-cost options of walking and cycling are limited by their low maximum speed, and by the effort required. Commuting distances in large cities can often exceed 8 to 12 miles as their diameters range between 15 to 30 miles. Those distances, when undertaken by foot or bike, become untenable because they break the universal half-hour threshold and may require excessive effort. These modes are also ill-suited to trip chains, which involve multiple tasks and destinations on a single trip (e.g. combining work commuting with school drop off/pick-ups, shopping, etc). As with transit, biking and walking has a limited reach of employment destinations. Moreover, a percentage of households may also find it difficult to accommodate all their transportation needs based entirely on these two modes.

For these and many more reasons, reliance on private vehicles is extensive. That fact is supported by statistics on mode choice among Europeans, who typically have large shares of walking and bicycle trips. The data shows that, when looking at the total kilometers traveled by mode, personal motorised transport takes the lion’s share.


Chart 3. Source: Modal Split of Passenger Transport [tran_hv_psmod] – Eurostat, last update 2015

New ideas in transport that include transit, biking, and new forms of car use are emerging. The innovative solutions that follow are consistent with city-building and environmental objectives. Here are a few possibilities, still in a nascent stage:

Shared car enterprises have sprung up in many urban centers, and offer the convenience of a car without the financial burden of ownership. They reduce total personal driving, and therefore greenhouse gasses (GHGs), as their use is intermittent.

Pay as you drive car insurance and, a recent entry, pay by how you drive insurance. Both provide an incentive to drive less and better. They could reduce car ownership costs, congestion and GHGs.

Electric cars are more economical to operate than conventional vehicles, while reducing pollution and city noise—all positive attributes.

Ride-share services, though controversial, have the potential of reducing the cost of transport by improving its economic efficiency and performance. Both the driver (car owner) and the passenger(s) lower their respective costs, as cars occupancy increases and chained trips become the norm.

Bicycle parking at subway/rail stations increases the potential universe of a subway or rapid-transit bus line (BRT) to four times or more the area of pedestrians within easy reach. This combined personal and communal transport yields excellent affordability.

Bike lane systems on existing streets and paths off the streets increases the perception of safety, which typically increases bike commuting.

Enlarging and enhancing city core sidewalks increases the comfort, safety and pleasure of walking in the city by reducing or removing traffic and, in a similar vein, introducing lanes and passages in the middle of long city blocks reduces walking distances.

Uni-tickets (e.g. London’s Oyster, or New York’s MetroCard) for all public transit services increase the convenience and affordability of public transit and lead to higher ridership.

That's a short, unsorted excerpt of a longer and growing list of opportunities for transportation planning initiatives. What is not growing — and needs to — is the extent and speed of implementation; a great, worthwhile challenge for planners.

Fanis Grammenos heads Urban Pattern Associates (UPA), a planning consultancy. UPA researches and promotes sustainable planning practices including the implementation of the Fused Grid, a new urban network model. He is a regular columnist for the Canadian Home Builder magazine, and author of Remaking the City Street Grid: A model for urban and suburban development. Reach him at fanis.grammenos at gmail.com.

After twenty-four years at Canada Mortgage and Housing Corporation, Tom Kerwin now leads an active volunteer life, including being the Science and Environment Coordinator for the Calgary Association of Lifelong Learners. He holds a Master’s degree in Environmental Studies from York University.

Special thanks to Luis Rodriguez for collaborating in shaping this article.

Flickr photo by Fraser Mummery; Golden Gate Traffic: Auto drivers, pedestrians and a bus on one of the most recognizable structures in the world... the Golden Gate Bridge in San Francisco, California.

Is This Hell or Indianapolis?

$
0
0

I’ve observed many times that cities outside of the very top tier almost always come across as generic, cheesy, and trying too hard in their marketing efforts. They highlight everything about their city that is pretty much a variant on things everybody else already has (beer, beards, bicycles, etc) while downplaying the things that truly reflect their community. Call it “aspirational genericism.”

Most places are extremely desperate to be part of the cool kids club, and so they buy the right preppy clothes, etc. and treat the things that are authentic and true about themselves as something to be ashamed of instead of celebrated.

Today lots of cities produce videos to showcase themselves. But a while back it was cities commissioning songs, hoping for something like Frank Sinatra’s standards about New York and Chicago. These were for the most part embarrassingly cringe worthy.

Indianapolis did the same a while back, in an effort I won’t given specifics on to protect the guilty, who were, after all, operating with the utmost sincerity.

What I do want to highlight is though is that Indianapolis has one of the greatest songs ever recorded about a city, the Bottle Rockets’ “Indianapolis.” I have not, however, ever heard anyone in the city actually bring it up.

And it’s easy to understand why. The song is an extremely negative take on the city in every respect. The refrain is:

Can’t go west

can’t go east

I’m stuck in Indianapolis

with a fuel pump that’s deceased

Ten days on the road

Now I’m four hours from my hometown

Is this Hell or Indianapolis

with no way to get around?

He proceeds to regale us with a series of humorous but negative observations about the city, such as:

Who knows what this repair will cost

Scared to spend a dime

I’ll puke if that jukebox

Plays John Cougar one more time.

Having seen the Bottle Rockets in concert many times, I can tell you that songwriter and lead singer Brian Henneman really does seem to dislike Indianapolis, where he apparently had an actual bad experience. (His hometown is somewhere near St. Louis, and he spent a lot of time with the Uncle Tupelo crew in Southern Illinois – and environment one would not expect to encounter someone looking down on Indy).

Nevertheless, this is an amazingly great song. Here’s a 1991 acoustic demo version recorded with Jeff Tweedy and Jay Farrar. If the video doesn’t display, click over to listen on You Tube.

While it’s probably a bridge too far to suggest that the city should embrace this song as a branding anthem, I’d like to point out that many nicknames and branding aspects of cities started out as digs. And let’s be honest, the idea of being trapped in Indy without a car isn’t that far from the truth. I might also observe that gangster rap became a phenom precisely because it did not deny the reality of life in the inner city.

Here’s another, though not a song but a TV commercial. This one is a local legend. You’ll have to watch it to believe it. It’s a TV ad for local institution “Don’s Guns.” The eponymous Don was famous for his slogan, “I don’t want to make any money, folks. I just love to sell guns.” If the video doesn’t display for you, click over to watch on You Tube.

If you search “Don’s Guns” on You Tube you can watch a variety of other colorful ads.

Again, this is not likely to be something that will be used in the chamber of commerce’s marketing materials anytime soon. But if you don’t live in Indy, wouldn’t you find the idea of a bunch of people there who love guns believable? Of course you would, because it’s true. Indiana is a state that explicitly includes a right to bear arms for self defense in its constitution. Now, many people locally may not like guns, but at some point people are going to discover the actual reality of the place, even if you don’t tell them about it. And believe it or not there’s a large market of people who have an interest in guns. If you want to try to market to the gun-free crowd, are they likely to put Indy at the top of their list anyway? You’re probably fighting an uphill battle.

Then lastly back to music. If there’s one thing that people around the world know about Indianapolis, its the Indianapolis 500. So it’s no surprise that the city and race were featured in the 1983 song “Indianapolis” by Puerto Rican boy band Menudo. There’s even a music video for it. You should click over to watch on You Tube as this copyrighted music has playback restrictions.

This one, it’s true, is a cultural relic that has not stood the test of time, other than for retro flourish purposes (though it’s not a bad song). But it seems to be little known locally. I didn’t know about it until a message board commenter linked some years back. And I haven’t seen a marketing campaign around the city focused on auto racing in a long time.

The struggles of working class life in a car dependent town, guns, and auto racing. Not the makings of glamour, but certainly authentic. Jim Russell and others have written a lot about rembracing the industrial heritage of the Midwest as “Rust Belt chic.” Indy is not really Rust Belt in the same sense as Cleveland or Pittsburgh. But these items are part of its own unique take on the formula. What could potentially be done with them?

Certainly Texas has done well by being Texas. And Nashville has succeeded by being unapologetic about country music. And I’ll point out again that the Midwest repudiated its own heritage of agriculture, workwear, and blue collar lagers only to have them picked up by Brooklyn hipsters and made cool again. The Midwest threw its culture away and Brooklyn bought it out of the thrift store. Now the region is reimporting is own birthright after it has been made “safe” by the embrace of the cool kids. Midwest cities should have owned local and urban agriculture. But of course, in a region of places like Columbus that are deeply ashamed of being seen as “cow towns”, that was simply impossible. If Brooklynites ever start buying up old Chevy Vans, expect that only then will a place like Indy embrace the reality of that culture as well.

Aaron M. Renn is a senior fellow at the Manhattan Institute and a Contributing Editor at City Journal. He writes at The Urbanophile, where this piece first appeared.

It's Becoming Springtime for Dictators

$
0
0

In a rare burst of independence and self-interest, the California Legislature, led by largely Latino and Inland Democrats, last month defeated Gov. Jerry Brown’s attempt to cut gasoline use in the state by 50 percent by 2030. These political leaders, backed by the leftovers of the once-powerful oil industry, scored points by suggesting that this goal would lead inevitably to much higher fuel prices and even state-imposed gas rationing.

Days later, however, state regulators announced plans to impose similarly tough anti-fossil-fuel quotas anyway. This pronouncement, of course, brought out hosannas from the green lobby – as well as their most reliable media allies. Few progressives today appear concerned that an expanding, increasingly assertive regulatory state, as long as it errs on the “right side,” poses any long-term risks.

Welcome to the new age of authority, in which voters’ mundane concerns are minimized, and the bureaucracy – backed by an elected executive – rules the roost, armed with full confidence that it knows best. Nor is this merely a California phenomenon. Rule by decree has become commonplace in Washington, D.C., as President Obama seems to dictate policies on everything from immigration to climate change without effective resistance from a weak Congress and a listless judiciary.

While no modern leader since President Richard Nixon has been so bold in trying to consolidate power, this centralizing trend has been building for decades. Since 1910, the federal government has doubled its share of all government spending to 60 percent and grows ever more meddlesome in people’s daily lives. Its share of GDP has now grown to the highest level since the Second World War.

Read the entire piece at The Orange County Register.

Joel Kotkin is executive editor of NewGeography.com and Roger Hobbs Distinguished Fellow in Urban Studies at Chapman University, and a member of the editorial board of the Orange County Register. He is also executive director of the Houston-based Center for Opportunity Urbanism. His newest book, The New Class Conflict is now available at Amazon and Telos Press. He is also author of The City: A Global History and The Next Hundred Million: America in 2050. He lives in Orange County, CA.

Flickr photo by Pranav Bhatt of drivers in Los Angeles.

The Green Urbanization Myth

$
0
0

Once a fringe idea, the notion of using technology to allow humanity to “decouple” from nature is winning new attention, as a central element of what the Breakthrough Institute calls “ecomodernism.” The origins of the decoupling idea can be found in 20th century science fiction visions of domed or underground, climate-controlled, recycling-based cities separated by forests or deserts. A version of decoupling was promoted in the 1960s and 1970s by the British science writer Nigel Calder in The Environment Game (1967) and the radical ecologist Paul Shepard in The Tender Carnivore and the Sacred Game (1973). More recent champions of decoupling include Martin Lewis, Jesse Ausubel, Stewart Brand, and Linus Blomqvist.  

Proponents of decoupling point out correctly that the greatest threat to wilderness is not urban sprawl, but agricultural sprawl. The amount of the earth’s surface devoted to the unnatural, simplified ecosystems of agriculture—that is, farms and ranches—dwarfs the small amount consumed by cities, including low-density suburbs. Industrial, energy- and fertilizer-intensive agriculture has permitted us to grow far more food on far less land—with costs, to be sure, including water pollution from fertilizer runoff. Genetically modified crops will make it possible to shrink the footprint of global agriculture altogether, and if human beings ever derive most of their diet from laboratory-synthesized foods like in vitro meat and vegetables created from stem cells, most of today’s farmland can be freed for other uses.

The decouplers are right to predict that technology will free up vast amounts of land for purposes other than farming. But many of them go wrong, I believe, when they assume that the decline of agricultural sprawl will be accompanied by the decline of urban sprawl, for two reasons. First, as societies become richer, more and more people choose low-density housing and can afford it. Second, whatever may be the case in other countries, in the United States, the private market for land—including retired farmland—ensures that little if any of the land freed by technology from agriculture will be turned into public wilderness preserves.

One of the great urban legends of our time is the claim, endlessly repeated by urban gentry journalists, that Americans are tired of the suburbs and are moving back into the city in the search of walkable neighborhoods. The data disprove the claim. As Wendell Cox points out at Newgeography:

But the core municipalities now contain such a small share of major metropolitan area population that the suburbs have continued to add population at about three times the numbers of the core municipalities…Indeed, if the respective 2010-2013 annual growth rates were to prevail for the next century,  the core municipalities would house only 28.0 percent of the major metropolitan area population in 2113 (up from 26.4 percent in 2013).           

Thanks to decoupling, the low-density metro areas will probably become even bigger and even less dense. As farmland on the periphery of metro areas is retired from agriculture, much of it will be converted into cheap housing, low-rent office parks and inexpensive production facilities.

The rise of robocars may accelerate metro area decentralization. Congestion will be reduced, and the greater safety of driverless cars may permit higher speeds on metro area beltways and cross-town freeways. Once taxi drivers are replaced by robot taxis, the cost of taxis will plummet and the greater convenience of point-to-point personal travel anywhere in a sprawling metro area will make rail-based mass transit obsolete except in places like airports and tourist-haven downtowns.  As in the past, most working-class families with children will probably prefer a combination of a longer commute with a bigger single-family house and yard to a shorter commute and life in a cramped apartment or condo. 

Nor will most working-class and middle-class retirees move to walkable downtowns. They won’t be able to afford to. And robocars plus in-home medical technology will make it much easier for the elderly to age in place in car-based suburbs. 

As great numbers of middle- and low-income Americans move to bigger, cheaper homes on the former farmland that rings expanding metro areas, they will be leap-frogged by the rich. Absent a reversal of today’s top-heavy income concentration, much of America’s wealth will continue to be concentrated in the hands of a few people. And when farmland is retired, thanks to GM crops, in vitro food, or other new land-sparing technologies, a lot of the former farm acreage will be bought by One Percenters and turned into rural retreats.

The decouplers hope that retired farmland will be “rewilded” and transformed into nature parks that everyone can enjoy. But how realistic is this hope? At least in the United States, it is impossible to imagine federal or state governments buying more than a negligible portion of retired farmland and turning it into public parks. What is more likely, that most retired Midwestern farmland will be turned into rewilded public prairie preserves—or that it will be divided into the vast baronial estates of super-rich bankers, tech oligarchs, and trust-fund heirs and heiresses, who commute from their downtown skyscraper penthouses to their high-tech Downtown Abbeys?

A certain amount of the former farm acreage owned by the plutocracy may be rewilded, with the encouragement of tax incentives like conservation easement laws. But rewilding on the scale imagined by some environmentalists is unlikely. For one thing, the former farmland will still be chopped up by fences, roads, power lines, and other structures. And all but the greatest recreational ranches will be too small to support self-sustaining populations of bison and other megafauna. Nor are voters likely to smile on the restoration of predators like wolves, coyotes, bears, and mountain lions, even if a few of eccentric rich landowners fancied the idea.

And then there is the aesthetic factor. The biologist E.O. Wilson has suggested that, because we are descended from hominids who evolved on African savannahs, we naturally prefer vistas with grassy expanses to forests, deserts, and other biomes. Some evidence for this comes from the work of the Russian artists Komar and Melamid, who polled members of different nationalities and then painted the “Most Wanted Paintings” based on the results. In most countries, if they are to be believed, the favorite sofa painting shows a grassy landscape with a river and some woods in the background. 

As Paul Shepard pointed out, the country-house landscape of 18th century Britain was anything but natural. The natural landscape of most of Britain, as of most of Western Europe, is dense forest. But the British rural upper class cleared the forests to create grassy vistas—the ancestors of the modern British and American suburban lawn. Shepard blamed this on the influence of Renaissance Italian landscape painting, which showed once-forested Mediterranean coast land that had been denuded by goats and sheep. But the Wilson theory may provide another explanation.

Whether for cultural or instinctive reasons, the rich who buy up most of the land spared by technology may wish to keep open spaces, even if the area would naturally be forest. The late architect Philip Johnson waged a constant war on the New England forest in order to maintain grassy lawns over which to view his Glass House and other iconic buildings on his 47-acre New Canaan, Connecticut, estate. In prairie biomes, conversely, the rural rich are likely to plant some trees, to make the land conform to conventional notions of the scenic.   

If the American rich are given a free hand to shape the former farm acreage they have bought, the most likely result will be a park-like landscape, with open vistas and clumps of trees—regardless of what the natural environment of the area would look like. The rewilding would be limited chiefly to small animals and birds, like raccoons and turkeys. No bison herds and no wolf packs. And as acreage was converted from farmland to One Percenter parkland, the already excessive deer population, freed from natural predators and rural American hunters alike, would swell even more. 

The decouplers are right, I believe, to predict that advances in food production technology will free enormous amounts of former farmland for other uses. But very little of that land will be converted into the public wilderness preserves envisioned by Calder and Shepard and others. A minority of the former farmland will be converted into single-family housing on the edges of major metro areas. Most of the land retired from farming, instead of being spared for nature, will become rural estates for the plutocracy, surrounded by signs reading PRIVATE PROPERTY: KEEP OUT and overrun by starving deer.

Michael Lind is the Policy Director of the Economic Growth Program at the New America Foundation in Washington, D.C., editor of New American Contract and its blogValue Added, and a columnist forSalon magazine. He is also the author of Land of Promise: An Economic History of the United States. Lind was a guest lecturer at Harvard Law School and has taught at Johns Hopkins and Virginia Tech. He has been an editor or staff writer at the New YorkerHarper's Magazine, the New Republic and the National Interest.

Image from BigStockPhoto.com

The Cities Americans Are Thronging To And Fleeing

$
0
0

Cities get ranked in numerous ways — by income, hipness, tech-savviness and livability — but there may be nothing more revealing about the shifting fortunes of our largest metropolitan areas than patterns of domestic migration.

Bright lights and culture may attract some, but people generally move to places with greater economic opportunity and a reasonable cost of living, particularly affordable housing.

So who moves? Census data suggests that it is primarily the young — those aged 25 to 34 — followed by people approaching retirement. Family and friends are a big motivating factor in both age groups. According to the moving company Mayflower,   one in four millennials aged 18 and 34 moved back to their hometowns over the past five years. At the same time seniors also express a strong desire to live close to their children and grandchildren; most elderly who do not make such moves age in place.

Forbes took a close look at the most recent data on domestic migration — that is movement within the U.S. between metro areas — between 2010 and 2014. We ranked the nation’s 53 largest metropolitan areas based on their annualized rates of population change attributable to migration. What we found is that to a remarkable extent, Americans still seem to be whistling Dixie. Eight of the 10 fastest gainers were in the former Confederacy, led by Austin, Texas, which gained 126,296 more migrants over that time span from other parts of the country than it lost in outmigration, accounting for an annual increase in its population of 1.69%. No other metro area in the country enjoyed anything like this rate of in-migration.

Austin’s high job creation rate — over 3% growth annually since 2010 — has a great deal to do with its ability to lure new residents not only from other Texas cities, but from the coasts as well.

The other Southern standouts are from the northern and western edges of the region. They include several Texas cities — No. 3 San Antonio (1.02% annual increase in population from migration) and No. 8 Houston — which have logged strong job growth and offer housing prices, adjusted for incomes, that are less than half those in coastal California, New York and parts of New England.

The oil bust could slow down the allure of some of these cities, notably Houston as well as No. 9 Oklahoma City. But lower petroleum prices could prove a boon to nearly universally suburbanized cities such as No. 2 Raleigh, N.C. (1.14% annual growth in population from migration), and No. 5 Nashville, Tenn.,  both of which have economies built around technology, manufacturing and business services. Raleigh is growing so strongly that local officials expect the population of the metro area will double over the next 20 years.

It’s a continuation of a longstanding shift to the South, a trend that some pundits were quick to declare was over after the Great Recession amid a perceived rise in interest in urban living. There have certainly been some Southern metro areas that seem to have lost appeal since 2010, notably Atlanta, Tampa-St. Petersburg and Jacksonville, all of whose rates of in-migration have slowed, although they’re still comfortably among the 20 top destinations.

The Rockies And The Pacific Northwest

In this century, the other great migration draw has been two parts of the West: the Mountain States and the Pacific Northwest. This vast region extending from Colorado to Oregon has enjoyed generally strong economic growth and reasonable housing costs, particularly in comparison with coastal California. The big winner here has been No. 4 Denver, which gained a net 103,785 domestic migrants from 2010 to 2014.

The other strong performers in the region include No. 11 Phoenix, which gained 119,000 net migrants since 2010. But this is a slowdown from its previous pace; between 2000 and 2009 (the Census Bureau did not produce migration figures for 2009-2010), Phoenix ranked fifth in the nation. But an even bigger decline has occurred in Las Vegas, the boomtown of the last decade, which has fallen from the No. 2 in the first decade of the new millennium to 16th place in 2010-14. On an annual basis, Las Vegas is now attracting about 9,000 net migrants a year compared to 35,000 in the 2000s.

The Pacific Northwest continues to attract more migrants than it loses, many from California. The big winner here has been No. 15 Seattle, which has gained 60,000 net migrants since 2010; in the last decade, the Emerald City barely managed 40,000 net migrants from 2000 to 2009. Portland has added about 49,000 net migrants, though its annual inflow has dropped somewhat.

Winners And Losers

It is frequently claimed by fiscal conservatives that politics and regulation drive these patterns. Generally speaking, there tends to be more growth in lower-tax states than in higher-taxed ones, but this analysis only goes so far. Blue metro areas like Seattle, Portland and Denver are luring new residents despite somewhat higher costs and stringent regulation. It seems likely that their success is that they are not California, a regulatory state on steroids.

Indeed economic booms can make up for a lot of sins. No. 20 San Francisco may not be drawing newcomers like an Austin or a Nashville, but super-high costs have not been enough to overcome the lure of riches from the current tech boom. Since 2010, the area, which includes suburban San Mateo County, Marin County and the East Bay, has attracted a net 49,000 new migrants, a big turnaround compared to the massive outflow of 347,000 suffered in the first decade of this millennium.

But other expensive and expansive metropolitan areas are not doing as well in the population sweepstakes. The nation’s three largest metropolitan areas fall to the bottom of our list: Los Angeles (46th), Chicago (52nd) and, in last place New York. Since 2010, the New York metro area has lost a net 529,000 domestic migrants, adding to the 1.9 million who departed from 2000 to 2009.

Yet these great metropolitan areas are not shrinking, due to a steady flow of new residents from overseas and a surplus of births over deaths. In this sense, they are less vulnerable to migration losses than cities such as Cleveland, Pittsburgh and Detroit, where the rate of domestic outmigration is lower, but the number of new foreign immigrants is relatively low.

Clearly America’s migration trends are always changing, but for the most part the basics remain the same. Places that are more affordable, and also have thriving economies, tend to attract new residents while those with relatively tepid economies and high costs fare, all things being equal,  far worse.

The Winners: No. 1: Austin, Texas

Metro Area Population, 2014: 1.94 million

Net Domestic Migration Gain, 2010-14: 126,296

Annual Rate Of Pop. Increase Since 2010 From Migration: 1.69%

No. 2: Raleigh, NC

Metro Area Population, 2014: 1.24 million

Net Domestic Migration Gain, 2010-14: 55,920

Annual Rate Of Pop. Increase Since 2010 From Migration: 1.14%

No. 3: San Antonio, TX

Metro Area Population, 2014: 2.33 million

Net Domestic Migration Gain, 2010-14: 94,159

Annual Rate Of Pop. Increase Since 2010 From Migration: 1.02%

No. 4: Denver, CO

Metro Area Population, 2014: 2.75 million

Net Domestic Migration Gain, 2010-14: 103,785

Annual Rate Of Pop. Increase Since 2010 From Migration: 0.95%

No. 5: Nashville, TN

Metro Area Population, 2014: 1.79 million

Net Domestic Migration Gain, 2010-14: 63,477

Annual Rate Of Pop. Increase Since 2010 From Migration: 0.88%

No. 6: Charlotte, NC-SC

Metro Area Population, 2014: 2.38 million

Net Domestic Migration Gain, 2010-14: 83,305

Annual Rate Of Pop. Increase Since 2010 From Migration: 0.87%

No. 7: Orlando, FLA

Metro Area Population, 2014: 2.32 million

Net Domestic Migration Gain, 2010-14: 72,735

Annual Rate Of Pop. Increase Since 2010 From Migration: 0.79%

No. 8: Houston, TX

Metro Area Population, 2014: 6.49 million

Net Domestic Migration Gain, 2010-14: 191,796

Annual Rate Of Pop. Increase Since 2010 From Migration: 0.75%

No. 9: Oklahoma City, OK

Metro Area Population, 2014: 1.34 million

Net Domestic Migration Gain, 2010-14: 37,528

Annual Rate Of Pop. Increase Since 2010 From Migration: 0.70%

No. 10: Dallas-Fort Worth, TX

Metro Area Population, 2014: 6.95 million

Net Domestic Migration Gain, 2010-14: 184,021

Annual Rate Of Pop. Increase Since 2010 From Migration: 0.67%

The Losers: No. 10: Milwaukee, WI

Metro Area Population, 2014: 1.57 million

Net Domestic Migration Loss, 2010-14: 22,597

Annual Rate Of Pop. Decrease Since 2010 From Migration: -.34%

o. 9: Virginia Beach-Norfolk, VA-NC

Metro Area Population, 2014: 1.72 million

Net Domestic Migration Loss, 2010-14: 24,374

Annual Rate Of Pop. Decrease Since 2010 From Migration: -.34%

No. 8: Los Angeles, CA

Metro Area Population, 2014: 13.26 million

Net Domestic Migration Loss, 2010-14: 208,635

Annual Rate Of Pop. Decrease Since 2010 From Migration: -.39%

No. 7: Rochester, NY

Metro Area Population, 2014: 1.08 million

Net Domestic Migration Loss, 2010-14: 17,665

Annual Rate Of Pop. Decrease Since 2010 From Migration: -.39%

No. 6: Memphis, TN-MS-AR

Metro Area Population, 2014: 1.34 million

Net Domestic Migration Loss, 2010-14: 21,999

Annual Rate Of Pop. Decrease Since 2010 From Migration: -.39%

No. 5: Cleveland, OH

Metro Area Population, 2014: 2.06 million

Net Domestic Migration Loss, 2010-14: 38,424 

Annual Rate Of Pop. Decrease Since 2010 From Migration: -.44%

No. 4: Detroit, MI

Metro Area Population, 2014: 4.30 million

Net Domestic Migration Loss, 2010-14: 89,649

Annual Rate Of Pop. Decrease Since 2010 From Migration: -.50%

No. 3: Hartford, CT

Metro Area Population, 2014: 1.21 million

Net Domestic Migration Loss, 2010-14: 27,425

Annual Rate Of Pop. Decrease Since 2010 From Migration: -.54%

No. 2: Chicago, IL-IN-WI

Metro Area Population, 2014: 9.55 million

Net Domestic Migration Loss, 2010-14: 237,666

Annual Rate Of Pop. Decrease Since 2010 From Migration: -.60%

No. 1: New York, NY-NJ-PA

Metro Area Population, 2014: 20.09 million

Net Domestic Migration Loss, 2010-14: 528,742

Annual Rate Of Pop. Decrease Since 2010 From Migration: -.64%

This piece first appeared at Forbes.

Joel Kotkin is executive editor of NewGeography.com and Roger Hobbs Distinguished Fellow in Urban Studies at Chapman University, and a member of the editorial board of the Orange County Register. He is also executive director of the Houston-based Center for Opportunity Urbanism. His newest book, The New Class Conflict is now available at Amazon and Telos Press. He is also author of The City: A Global History and The Next Hundred Million: America in 2050. He lives in Orange County, CA.

Wendell Cox is Chair, Housing Affordability and Municipal Policy for the Frontier Centre for Public Policy (Canada), is a Senior Fellow of the Center for Opportunity Urbanism (US), a member of the Board of Advisors of the Center for Demographics and Policy at Chapman University (California) and principal of Demographia, an international public policy and demographics firm.He is co-author of the "Demographia International Housing Affordability Survey" and author of "Demographia World Urban Areas" and "War on the Dream: How Anti-Sprawl Policy Threatens the Quality of Life." He was appointed to three terms on the Los Angeles County Transportation Commission, where he served with the leading city and county leadership as the only non-elected member. He served as a visiting professor at the Conservatoire National des Arts et Metiers, a national university in Paris.


Who Should Pay for the Transportation Infrastructure?

$
0
0

Urban regions are significantly more important than any one city located within them. Housing, transportation, economy, and politics help produce uneven local geographies that shape the individual identities of places and create the social landscapes we inherit and experience. As such, decisions made within one city can ripple through the entire urban region. When affordable housing is systematically ignored by one city, neighboring cities become destinations for those who cannot afford higher housing costs. Even when the minimum wage is adjusted in one city, others cannot ignore it.

In fact, a differential wage structure can produce diverse economic and labor geographies. Affordable housing and uneven economic development, in their turn, impact the regional transportation and infrastructure: if the cost of living and wages in one city in a particular region are high (as in San Francisco and Seattle), then low and middle-income workers will move to a more affordable neighboring city and pay a higher price, particularly in time spent, for transportation. They also pay more in fuel, and hence taxes that fund infrastructure maintenance and expansion.

In other words, while companies and the more affluent population benefit from the agglomeration economies of alpha cities, it is the lower-wage workers and the population at large that pay for these uneven development. Therefore, a company deciding to locate in Seattle or San Francisco, or any location, does not have to bear the cost their decision imposes on urban transportation and the infrastructure needed to support their operation. Instead it’s their employees, particularly those with lower earning power, who do.

How many LEED certified buildings and downtown redevelopment projects does it take to make up for this inequity?  Should a city be considered green, if a significant portion of its low earners has to commute to neighboring cities to afford a home? Can a city be seen as sustainable, if in a style akin to medieval cities, serfs have to leave every evening and return in the morning to make sure that the ‘creative class’ is adequately served?

As states such as Washington engage with the old “pay as you go” policy of increasing fuel taxes to pay for the infrastructure, the question of what forces created the emergent commuting patterns remains unanswered. Was it just the commuters, acting as informed participants in the market economy, who sought to optimize their housing and transportation trade offs? Or did the locational choices of employers contribute to the growing commuting problems in the region? If commuters are subjected to “pay as you go” policies, shouldn’t employers who locate in expensive housing markets, irrespective of their employees’ income profile, be subjected to “pay as you locate” policies?

Perhaps no metro region will make a better case study for this inequity than the area that ‘serves’ Seattle. The Puget Sound Region consists of four counties; however, to make sure that no one county that might have an economic connection with Seattle is left behind, we can look at six counties: Snohomish, King (where Seattle is located), Pierce, Kitsap, Thurston, and Mason.

The entire urban region is served by a small number of highways, including Interstate 5. According to 2013 economic data, these six counties housed nearly 62% of all firms in the state. Furthermore, a quarter of all businesses in these counties were located within half a mile of a freeway. In terms of total employees, the six counties contained 69% of the state employment, and workplaces within half a mile of a freeway employed 37% of all employees in the counties. The inequity in the regional economic distribution is further exacerbated by the fact that the small area in West King county bounded by I-405 houses 30% of workplaces and 47% of employment, and generates a significant portion of the sales/revenue in the six counties. This area relies on I-5, I-405 and I-90 for the delivery of its employees from near and far.   

The economic calculus of the early days of Interstate construction may have suggested that the trucking industry would benefit from this transportation infrastructure, but 1960s economists might be surprised by the type of companies now located within half a mile of freeways. In the six counties in Western Washington, the economic sectors over-represented in these geographies are: services and finance, real estate, and insurance (FIRE). Anyone driving on I-5 and I-405 (where Microsoft and other corporations are visible) can see this.  None of these workplaces require trucking. While their well-paid employees can afford to live in well-to-do places, including Bellevue and Seattle, many others reside in less expensive places such as Auburn, Tukwila, Tacoma, and Federal Way.

A map of the region clearly suggests that neighboring counties and cities are housing those who work in West King County. Mobility has been the answer to unaffordability in this and other similar urban regions. If a city is unaffordable, is it fair to ask those who search for affordability in ‘other’ geographies pay for their so-called choices? Is this truly a choice? Are employers, current and future, asked to pay for their locational ‘choices?’ 

Surely, we can do better than asking employees to bear the burden of a regional economic imbalance. Freeways should not be freer to some than others.  If this nation is about people paying for choices they make, then everyone should do so: employers and employees alike.

Ali Modarres is the Director of Urban Studies at University of Washington Tacoma.  He is a geographer and landscape architect, specializing in urban planning and policy. He has written extensively about social geography, transportation planning, and urban development issues in American cities.

Seattle photo courtesy of BigStockPhoto.com.

Should Older Americans Live in Places Segregated from the Young?

$
0
0

Demographers frequently remind us that the United States is a rapidly aging country. From 2010 to 2040, we expect that the age-65-and-over population will more than double in size, from about 40 to 82 million. More than one in five residents will be in their later years. Reflecting our higher life expectancy, over 55% of this older group will be at least in their mid-70s.

While these numbers result in lively debates on issues such as social security or health care spending, they less often provoke discussion on where our aging population should live and why their residential choices matter.

But this growing share of older Americans will contribute to the proliferation of buildings, neighborhoods and even entire communities occupied predominantly by seniors. It may be difficult to find older and younger populations living side by side together in the same places. Is this residential segregation by age a good or a bad thing?

As an environmental gerontologist and social geographer, I have long argued that it is easier, less costly, and more beneficial and enjoyable to grow old in some places than others. The happiness of our elders is at stake. In my recent book, Aging in the Right Place, I conclude that when older people live predominantly with others their own age, there are far more benefits than costs.

Why do seniors tend to live apart from other age groups?

My focus is on the 93% of Americans age 65 and older who live in ordinary homes and apartments, and not in highly age-segregated long-term care options, such as assisted living properties, board and care, continuing care retirement communities or nursing homes. They are predominantly homeowners (about 79%), and mostly occupy older single-family dwellings.

Older Americans don’t move as often as people in other age groups. Typically, only about 2% of older homeowners and 12% of older renters move annually. Strong residential inertiaforces are in play. They are understandably reluctant to move from their familiar settings where they have strong emotional attachments and social ties. So they stay put. In the vernacular of academics, they opt to age in place.

Over time, these residential decisions result in what are referred to as “naturally occurring” age-homogeneous neighborhoods and communities. These residential enclaves of old are now found throughout our cities, suburbs and rural counties. In some locales with economies that have changed for the worse, these older concentrations are further explained by the wholesale exit of younger working populations looking for better job prospects elsewhere – leaving the senior population behind.

Even when older people decide to move, they often avoid locating near the young. The Fair Housing Amendments Act of 1988 allows certain housing providers to discriminate against families with children. Consequently, significant numbers of older people can move to these “age-qualified” places that purposely exclude younger residents. The best-known examples are those active adult communities offering golf, tennis and recreational activities catering to the hedonistic lifestyles of older Americans.

Others may opt to move to “age-targeted” subdivisions (many gated) and high-rise condominiums that developers predominantly market to aging consumers who prefer adult neighbors. Close to 25% of age-55-and-older households in the US occupy these types of planned residential settings.

Finally, another smaller group of relocating elders transition to low-rent senior apartment buildings made possible by various federally and state-funded housing programs. They move to seek relief from the intolerably high housing costs of their previous residences.

Is this a bad thing?

Those advocates who bemoan the inadequate social connections between our older and younger generations view these residential concentrations as landscapes of despair.

In their perhaps idyllic worlds, old and young generations should harmoniously live together in the same buildings and neighborhoods. Older people would care for the children and counsel the youth. The younger groups would feel safer, wiser and respectful of the old. The older group would feel fulfilled and useful in their roles of caregivers, confidants and volunteers. In question is whether these enriched social outcomes merely represent idealized visions of our pasts.

A less generous interpretation for why critics oppose these congregations of old is that they make the problems faced by an aging population more visible and thus harder to ignore.

Residents play shuffleboard at Limetree Park in Bonita Springs, Florida. Steve Nesius/Reuters

A better social life

But why should we expect older people to live among younger generations? Over the course of our lives, we typically gravitate to others who are at similar stages in life as ourselves. Consider summer camps, university dormitories, rental buildings geared to millennials or neighborhoods with lots of young families. Yet we seldom hear cries to break up and integrate these age-homogeneous residential enclaves.

In fact, studies show that when older people reside with others their age, they have more fulfilled and enjoyable lives. They do not feel stigmatized when they practice retirement-oriented lifestyles. Even the most introverted or socially inactive older adults feel less alone and isolated when surrounded with friendly, sympathetic, and helpful neighbors with shared lifestyles, experiences, and values – and yes, who offer them opportunities for intimacy and an active sex life.

Moreover, tomorrow’s technology is especially on the side of these elders. Because of online social media communications, older people can engage with younger people – as family members, friends, or as mentors – but without having to live next to what they sometimes feel are noisy babies, obnoxious adolescents, indifferent younger adults or insensitive career professionals.

Age-specific enclaves prolong independent living

Could living in these age-homogeneous places help older people avoid a nursing home stay?

Studies say yes – because here they have more opportunities to cope with their chronic health problems and impairments. Now their greater visibility as vulnerable consumers becomes a plus because both private businesses and government administrators can more easily identify and respond to their unmet needs.

These elder concentrations spawn a different mindset. The emphasis shifts from serving troubled individual consumers to serving vulnerable communities or “critical masses” of consumers.

Consider how many more clients home-care workers can assist when they are spared the traveling time and costs of reaching addresses spread over multiple suburbs or rural counties. Or recognize how much easier it is for a building management or homeowners’ association to justify the purchasing of a van to serve the transportation needs of their older residents or to establish an on-site clinic to address their health needs.

Consider also the challenges confronted by older people seeking good information about where to get help and assistance. Even in our internet age, they still mostly rely on word of mouth communications from trusted individuals. It becomes more likely that these knowledgeable individuals will be living next to them.

These enclaves of old have also been the catalyst for highly regarded resident-organizedneighborhoods known as elder villages.

Their concerned and motivated older leaders hire staff and coordinate a pool of their older residents to serve as volunteers. For an annual membership fee, the predominantly middle-income occupants in these neighborhoods receive help with their grocery shopping, meal delivery, transportation and preventive health needs. Residents also benefit from knowing which providers and vendors (like workers performing home repair) are the most reliable, and they often receive discounted prices for their goods and services. They also enjoy organized educational and recreational events enabling them to enjoy the company of other residents. Today, about such 170 villages are open and 160 are in planning stages.

A question of preference

Ageist values and practices are indeed deplorable. However, we should not view the residential separation of the old from the young as necessarily harmful and discriminatory but rather as celebrating the preferences of older Americans and nurturing their ability to live happy, dignified, healthy and autonomous lives. Living with their age-peers helps these older occupants compensate for other downsides in their places of residence and in particular presents opportunities for both private and public sector solutions.

Tihs piece was first published by The Conversation.

Stephen M. Golant, Ph.D, a gerontologist and geographer, is now a Professor in the Department of Geography at the University of Florida. Previously, he was a faculty member in the Committee on Human Development and in the Department of Geography at the University of Chicago. Dr. Golant has been conducting research on the housing, mobility, transportation, and long-term care needs of older adult populations for most of his academic career. He is a Fellow of the Gerontological Society of America and a Fulbright Senior Scholar award recipient. He earlier served as a consultant to the Congressionally appointed Commission on Affordable Housing and Health Facility Needs for Seniors in the 21st Century (Seniors Commission). He has written or edited about 140 papers and books. His latest book is Aging in the Right Place (Health Professions Press, 2015).

Laed photo by Steve Nesius/Reuters.

Cities That Locate Art In Odd Places

$
0
0

The city sidewalk today is pretty empty, with online shopping and social media having replaced shoe leather on pavement. Restrictions in the name of safety have also become more common since 9/11. One result of these trends is a movement called Art in Odd Places : the work of artists that use public space itself as a huge, blank canvas. Orlando is the most recent city to experiment in this fashion. This month, more than fifty artists there reasserted the right to an unfettered exchange of ideas in public space, reinventing the sidewalk. It was an interesting experiment that led to some bigger questions about the relationship between public space and civic involvement.

Art in Odd Places was started by New York artist Ed Woodham in 1996 during the Cultural Olympiad in Atlanta, which coincided with the Olympics. With the media focused on sports, few recall that the Olympics is a celebration of mind and spirit, as well as of the body. Olympic cities host poets on the street reciting verses, and painters and sculptors exhibiting their pieces. Woodham struggled with officials to bring performance art to the event, and went home determined to keep the town square in its rightful place as the unfettered medium of exchange for art and ideas.

All the way through the nineties, movies and television documented sidewalks thronging with people, parks full of activity, and public plazas alive with protests or festivals. Despite popular rhetoric that accuses the car of killing public space, something different was happening. Sidewalks and plazas have continued as the arena for public encounters in our cities. They reached capacity, but as cities spread out the car had little effect on, for example, Times Square, or on any other city’s sidewalk.

Something funny started happening however; something only a few like Ed Woodham noticed. “In Atlanta, we were placed in a designated ‘free speech zone,’ which I found odd,” he commented to me while preparing for Orlando’s event. “I wondered when the city was no longer a free speech zone in its entirety.” Woodham noted, in particular, the clampdown after 9/11. Any sort of organized activity on the sidewalk was more and more regulated, in part due to a heightened sense of security.

Today the value of public space is open to debate. Nicolett Mall, a pedestrian zone in downtown Minneapolis, is hardwired into the city’s soul and is being rejuvenated. Meanwhile, New York Mayor Bill de Blasio is considering removal of the plazas in Times Square that have attracted a lively crowd and the presence of costumed characters and street performers, many of them seeking tips.

In 2013, Greensboro, North Carolina hosted Art in Odd Places, and the director of downtown Orlando’s Gallery at Avalon Island art curator Pat Greene visited. Two years later, Greene successfully co-curated the Orlando show, along with Voci Dance Director Genevieve Bernard. Between September 17th and 20th this year, Orlando became a host to dozens of artists on the street. The theme in Orlando is “Tone,” which is interpreted by each artist individually; pieces have been created around audio tones, color tones or other meanings of this word (I reviewed the work in a recent critique for the Orlando Weekly).

For example, Forrest MacDonald’s subtle water pipes, inserted next to actual storm water pipes, were sprinkled down Magnolia Avenue, with hands reaching out of the pipes to stroke tufts of grass. Nathan Selikoff fed a microphone into a computer, and then onto a giant screen, projecting an “Audiograph” that mapped the soundwaves of the city like a huge EEG.

On the more ethereal side, performance artist Masami Koshikawa created “Self Portrait as Butterfly Woman,” posing in white while an assistant invited passersby to place gold origami butterflies on her body suit. This gesture broke the barriers between strangers and the taboo of touch, and represented a sublime moment in the festival. Koshikawa eventually collected hundreds of butterflies.

Arvid Tomayko paraded up and down Magnolia Street in his “Wearable Tentacle Horn,” a suit with trumpets coming out the ends of various sleeves. And Chris Scala pulled a wire mesh camper into a parking lot and slept in it, LED lights washing over his sleeping form, in a piece entitled “X-Ray Camper”. These are only a few examples of artists using public space to make a spectacle in a traditional manner.

I visited Art in Odd Places at the height of the lunch rush on one day. A few scattered pedestrians wandered in and out of restaurants, and a preschool teacher led her little ones back to school from a library trip. The artists and their supporters comprised the largest single population group. (More people came by in the evening, according to Greene.)

In the last ten years, the number of people living in downtown Orlando has actually increased, with more and more residential housing available in and around the city’s core. What has sucked the life out of sidewalks, it turns out, isn’t the suburbs; instead, it's the tiny screen and the big screen that have occupied more and more of our lives, taking over the social space that was once reserved for the street. Casual shopping encounters, mixing social and economic activity, walking to business appointments, encounters on the once-active courthouse steps: all of this has become the archaic activity of yesteryear.

Art in Odd Places did interrupt the tiny screen focus of the average pedestrian who braved the sunny weather that day. Some of the artists deliberately sought to enter the cell phones of bystanders: Sound artist Jeff Knowlton created an app called “Sonify: Orlando” which, when downloaded, provided an acoustic narrative with sounds triggered by the immediate location. A new art form, which Knowlton describes as “locative media,” is born. And overall, Woodham, in an optimistic manner, has aroused artists in city after city to reinvent the sidewalk. In Orlando, the event was a success.

The darker issue of the regulation of the sidewalk, has, however, remained unaddressed. Woodham feels that well-meaning but overly stiff regulation has turned people out of their public space, and is working hard to reinvigorate the streets with art. Where a vacuum exists, artists often rush in, and the result reflects our contemporary culture. This type of activist art is not seeking to right a gross injustice or advocate a cause, except for that of free speech. It is spurred by open conjecture about the future use of the sidewalk, and asks pedestrians to re-invent the nature of our public space in the twenty-first century.

Richard Reep is an architect with VOA Associates, Inc. who has designed award-winning urban mixed-use and hospitality projects. His work has been featured domestically and internationally for the last thirty years. An Adjunct Professor for the Environmental and Growth Studies Department at Rollins College, he teaches urban design and sustainable development; he is also president of the Orlando Foundation for Architecture. Reep resides in Winter Park, Florida with his family.

Photos by the author: Anna McCambridge interacting with a piece of "Storm Water;" Koshikawa, right, with butterfly assistant.

Light Rail in the Sun Belt is a Poor Fit

$
0
0

There is an effective lobby for building light rail, including in cities such as Houston. But why build light rail? To reduce car use? To improve mobility for low-income citizens? This certainly seems a worthwhile objective, with the thousands of core-city, low-income residents whose transit service cannot get them to most jobs in a reasonable period of time.

ut rather than accept the flackery that accompanies these projects, maybe we should focus on effectiveness, judged by ridership, and the impact of such expensive projects on the transportation of the transit-dependent.

Take the Dallas light rail system, which serves growing Dallas and Collin counties. The DART light rail system expanded its lines by approximately three quarters between 2000 and 2013, yet the number of transit commuters declined, and transit's commuting market share dropped by one-quarter. More than twice as many Dallas workers are employed at home than ride transit, and do not require the massive capital and operating subsidies of light rail.

Even the widely praised Denver system has barely moved the needle for transit ridership; before opening its massive light rail system in 1990, 4.3 percent of Denver commuters used transit to get to work.

The share did rise - by a total of 0.1 percent to 4.4 percent. Even Portland, considered the Mecca of the "smart growth" strategy, actually has seen a decrease in its transit market share, from 7.9 percent before light rail to 6.4 percent in 2013. San Diego, arguably one of the more successful light rail systems, has seen its transit market share stagnate, from 3.3 percent in 1980 before light rail to 3.2 percent in 2013.

And then there is Los Angeles, a city that was essentially built around the Pacific Electric "Red Car" system in the early 20th Century, and is the densest in the United States, more than twice as dense as Houston. Yet despite this, the regional MTA, which operates its large bus and rail system, as well as a subway, still struggles to reach its ridership record reached in 1985, when transit consisted of only buses. Despite spending over $10 billion in public funds, Los Angeles has seen ridership decline while the once-more thriving bus system has deteriorated. Nearly three quarters of all Angelenos still drive to work.

No surprise then that Houston, where the light rail system opened in 2004, has not been notably successful.

Between 2003 and 2014, Harris County's population grew 23 percent, but transit ridership decreased 12 percent, according to American Public Transportation Association data. This means that the average Houstonian took 30 percent fewer trips on the combined bus and light rail system in 2014 than on the bus only system in 2003.

Finally, in each of these cities, driving alone has increased and, with the exception of Los Angeles, more people now work at home than ride transit to work.

These results reflect stubborn historical facts. Transit works well generally in older cities with historically large downtowns built largely before the ascendency of the car. These "legacy" cities, notably New York, are hard-wired for transit and have the largest downtowns; in New York the Manhattan business districts accounts for about 20 percent of the workforce. Together these legacy cities - New York, Boston, Chicago, Philadelphia, San Francisco and Washington - account for 55 percent of all transit work trip destinations in the nation.

In contrast, most Sun Belt cities have far fewer downtown jobs. In Los Angeles, downtown amount for less than 3 percent of employment and Dallas' downtown accounts for only 2 percent of metropolitan employment. In Houston the number is only 6.4 percent.

With population and jobs concentrating in the periphery, light rail service ends up serving a geography to which relatively few commute. They have not materially increased transit's share of travel, or reduced car travel. Worse still, their intense expense on single lines (routes) has precluded greater and less costly bus expansions that could have provided neglected communities - the young, the poor, the disabled, immigrants and minorities - with access to more jobs. The performance of light rail simply has not justified the expense.

Houston and other metropolitan areas need to take advantage instead of an incipient transportation revolution. Working at home is likely to increase substantially and automated vehicles promise to increase mobility while reducing traffic congestion. Companies like Uber could offer other private-sector based solutions. Houstonians should address the needs of the 21st century city not as some wish it to be but based how things really work.

This piece first appeared in the Houston Chronicle.

Joel Kotkin is executive editor of NewGeography.com and Roger Hobbs Distinguished Fellow in Urban Studies at Chapman University, and a member of the editorial board of the Orange County Register. He is also executive director of the Houston-based Center for Opportunity Urbanism. His newest book, The New Class Conflict is now available at Amazon and Telos Press. He is also author of The City: A Global History and The Next Hundred Million: America in 2050. He lives in Orange County, CA.

Wendell Cox is Chair, Housing Affordability and Municipal Policy for the Frontier Centre for Public Policy (Canada), is a Senior Fellow of the Center for Opportunity Urbanism (US), a member of the Board of Advisors of the Center for Demographics and Policy at Chapman University (California) and principal of Demographia, an international public policy and demographics firm.He is co-author of the "Demographia International Housing Affordability Survey" and author of "Demographia World Urban Areas" and "War on the Dream: How Anti-Sprawl Policy Threatens the Quality of Life." He was appointed to three terms on the Los Angeles County Transportation Commission, where he served with the leading city and county leadership as the only non-elected member. He served as a visiting professor at the Conservatoire National des Arts et Metiers, a national university in Paris.

Eco-Modernism, Meet Opportunity Urbanism

$
0
0

California has always been friendly ground for new ideas and bold proposals. That was a good thing when California’s economic and social policies encouraged middle-class opportunity, entrepreneurship, and social mobility, way back in the 1960s. But the contemporary California political elite tends to pioneer policies that endanger the spirit of opportunity that once made California great.

Fortunately, some alternative ways of thinking are emerging. An environmental policy think-tank in Oakland called The Breakthrough Institute has been pioneering a new, pro-growth environmentalism called Eco-Modernism, premised on the idea of technological decoupling. That is, it is based on the principle that by intensifying the use of resources, human needs could be met with far less material. If technologies that do more with less were to be developed, more of the environment would be allowed to flourish independent of human exploitation.

The Eco-Modernist’s answer to a problem as vast as climate change would not be to reduce emissions through cap-and-trade schemes or to put limits on the use of fossil fuels. Instead, Eco-Modernists would encourage investments in next-generation technologies capable of replacing fossil fuels. Hydroelectric and nuclear facilities have been providing such clean, carbon-free energy for decades. Eco-Modernists support government-funded construction of nuclear plants and hydroelectric systems to reduce carbon emissions and fight climate change while providing affordable energy. Technological advancement and government investment can both promote prosperity and save the environment, if used properly.

Meanwhile, a Houston-based think-tank, the Center for Opportunity Urbanism, (directed by New Geography's Southern California-based Executive Editor, Joel Kotkin, where I am a research associate) has been suggesting that urban planning and macroeconomic policy ought to be conducted with the goal of expanding opportunities for social mobility and a middle-class lifestyle. The center favors policies that maximize the availability of work and minimize the cost of living. In practice, this means promoting business and development-friendly tax, regulatory, and zoning codes, and investments in effective public infrastructure and education. The goals include removing unreasonable land and energy regulations that drive up the cost of housing and utilities, and investment in quality public education and in infrastructure.

These two philosophies offer compelling, positive alternatives to the reigning green-and-blue consensus. Their shared goal: a wealthy, high-tech society, replete with opportunities for upward mobility, leaving little environmental impact. A meld of Eco-Modernism and Opportunity Urbanism could provide a thoughtful, compelling alternative to the California’s current orthodoxy; a path that would neither stifle economic growth, nor be uncaring towards the environment or the working class.
There are at least two policy areas where the philosophies conflict, however, and if such a synthesis were to become viable, these differences would need to be addressed.

Eco-Modernism doesn't particularly support suburban sprawl, because it takes up more land than dense urban cores, while Opportunity Urbanism strongly encourages suburb formation. And Opportunity Urbanists support fossil fuel use for the indefinite future to provide cheap energy, while Eco-Modernists seek a gradual phasing-out of fossil fuels, and their replacement with nuclear energy.

There’s a fairly straightforward policy compromise evident here. Eco-Modernists ought to accept suburban sprawl as important to economic growth and opportunity, and recognize that human housing needs take up comparatively little land. Opportunity Urbanists, for their part, should accept that nuclear energy can provide more sustainable and lasting energy than fossil fuels, and that a more nuclearized power system would be healthier, provide cheaper energy, and would generally provide a better quality of life for more people than fossil fuels ever could.

If Eco-Modernists gave up their hostility to suburbia they would gain a zero-carbon nuclear platform, while Opportunity Urbanists that gave up on fossil fuels would retain an opportunity society with more advanced energy technology.

Aside from this great compromise, Eco-Modernism and Opportunity Urbanism could complement each other very well. Intensive government investments in infrastructure, technology, and education drive the economy; market principles and expanded economic opportunity distribute its fruits. This strong-government/ market-based synthesis begins to resemble the economic philosophy of Henry Clay and Abraham Lincoln, that old Whig tradition that has unfortunately left us for the time being. Perhaps these new ideas will resurrect it.

What better state to articulate new philosophies and a new synthesis based on innovation and opportunity, and put it into practice? California has always been about creating something new, and giving individuals the chance to create themselves anew. The state’s policy should reflect the state’s character. But two recent stories illustrate the lunacy that our political class substitutes for good policy.

In September, a whole raft of Governor Jerry Brown’s anti-climate change legislation was soundly defeated. The boldest of these proposals called for a 50 percent cut in petroleum usage statewide by 2030 (amended later to 2050). The agenda was clear: bring California’s carbon emissions down to lead the fight against climate change through the force of example. An earlier drama occurred in June, when the Los Angeles City Council passed, nearly unanimously, a resolution to raise L.A.’s minimum wage to $15 an hour by the year 2020. Almost immediately, the move was condemned by business leaders and policy wonks across the state and nation on the grounds that it would raise the cost of doing business and drive industries out.

This heavy-handed regulatory mode of problem-solving — a crucial component of what commentator Walter Russell Mead calls the “Blue Model” — dominates areas of California policy from water quality to food prices to pensions.

The Republican alternative isn’t much better. Out of power and lost in the wilderness since the follies of the Pete Wilson administration, California Republicans typically unload pseudo-Reaganite market-based ideas when asked significant policy questions. In the above two cases, their solutions would be don’t put restrictions on carbon emissions, and don’t raise the minimum wage. But the problems still would not be fixed.

New ideas need to be out there in response. Perhaps it's time for Eco-Modernists and Opportunity Urbanists to enter into a dialogue and establish a common policy agenda for the Golden State. The dominant Democratic Party and the floundering Republicans don’t have these ideas. Someone needs to show them the way.

Luke Phillips is a student studying International Relations at the University of Southern California. He has written for the magazine The American Interest and is a research associate at the Center for Opportunity Urbanism.

Flickr photo by Jim Bowen: Sacramento, the California Statehouse.

No Wiggle Room in Housing Market

$
0
0

The salary gap – where top-end incomes are rising faster than middle- and lower-end salaries – plays a large role in the affordability of middle-class housing along with interest rates and prices. Which factor has more influence depends on where you live and how you make your living.

Using some simplifying assumptions (20 percent down payment and a 30-year fixed-rate mortgage), today’s middle-class household increasingly cannot afford a middle-class home. Two things hurt this market: poor job outlook (impacts income) and interest rates (impacts affordability).

Cities

Salary Needed

Mortgage Rate

Salary Gap

Jobs/People Ratio

Unemployment Rate

Cleveland

$33,714.17

3.96

10%

.59

5.3

Pittsburgh

$33,838.57

3.87

7%

.61

5.1

Detroit

$37,544.40

4.05

2%

.54

5.6

Cincinnati

$36,357.35

3.98

1%

.60

4.0

St Louis

$36,784.94

3.94

0%

.62

5.0

Atlanta

$39,356.45

3.97

-7%

.61

5.5

Phoenix

$43,170.07

3.97

-19%

.59

5.3

Tampa

$41,488.22

4.04

-23%

.56

5.0

Minneapolis

$50,969.96

3.96

-20%

.69

3.5

Philadelphia

$54,385.77

3.96

-34%

.59

5.5

Baltimore

$55,842.76

3.89

-34%

.62

5.3

Houston

$53,684.45

3.94

-41%

.64

4.3

Orlando

$46,300.92

3.99

-52%

.61

4.8

San Antonio

$48,092.30

3.99

-50%

.60

3.4

Dallas

$52,947.58

3.97

-44%

.65

3.7

Sacramento

$61,517.63

4.03

-47%

.55

5.6

Chicago

$61,068.50

3.97

-58%

.60

5.5

Portland

$65,009.41

4.01

-61%

.61

5.5

Denver

$69,912.24

4.04

-68%

.67

3.7

Miami

$63,289.86

4.00

-93%

.59

5.2

Washington

$83,027.24

3.90

-61%

.67

4.3

Seattle

$78,118.97

4.05

-69%

.66

4.2

Boston

$86,164.15

3.91

-78%

.63

4.1

New York City

$90,750.14

3.97

-102%

.58

5.1

Los Angeles

$88,315.32

3.94

-124%

.59

6.0

San Diego

$104,839.73

4.04

-161%

.56

4.8

San Francisco

$157,912.06

3.95

-211%

.63

4.0

Salary Gap expressed as percent of Median Salary (that is, Salary Gap = (Median Salary minus Salary Needed) divided by Median Salary); negative numbers mean the salary needed to buy the median-priced home is greater than the median salary in that city. Data on salary needed and mortgage rates from http://www.hsh.com/finance/mortgage/salary-home-buying-25-cities.html; data on median salary from http://www.bls.gov/oes/current/oessrcma.htm. Unemployment rate for August 2015 and Participation rate is 2014 annual average from www.bls.gov.

In some ways, Minneapolis is not unlike San Francisco: both enjoy relatively low levels of unemployment and low mortgage costs. Nationally, the average 30-year mortgage rate is 4.09% (for July 17, 2015). Minneapolis and San Francisco are at 3.96% and 3.95%, respectively. Compared to the national unemployment rate of 5.3%, Minneapolis is at 3.5% and San Francisco is at 4.0%. So how do we explain the difference in affordability, aside from the realtor’s rant of “location, location, location”? San Francisco has a higher jobs/population ratio than Minneapolis, but that is only part of the story. As someone once told me when I was trying to understand why the jobs/housing relationship in Orange County didn’t fit the model: “What makes you think those people have jobs?”

In other words, where a population is less dependent on the traditional economy, higher home prices may be sustainable. This occurs in areas with a concentration of rich (“high-net-worth”) individuals. Some cities, like San Francisco and New York, are also attractive to rich homebuyers from outside the US. About 5% of existing home sales in California were to buyers from China (mainland, Hong Kong and Taiwan), who spent about $12 billion on homes primarily in San Francisco, Los Angeles and San Diego. The Chinese buyers paid an average of $831,000 per home – 69% paid with all-cash. In that sense, San Francisco is more like New York. The New York metro has an unemployment rate slightly below the national average, but only 57.8% as many jobs as there are people, compared to the national average of 59.2%. Foreign buyers from Canada and Mexico – who, along with China, make up about half of all foreign home buyers in the US – tend to buy in lower-priced housing markets in Florida, Arizona and Texas. Although more units are sold to international buyers in Florida (about 21% in 2015), the higher dollar volume is in California and New York. Homebuyers from Canada spent $6.4 billion in Florida and Arizona last year while buyers from China spent a total of $12 billion in California and New York. These statistics hint at a population that is less job-dependent, less “middle-class” than the national average.

The behavior of middle-class households in the decade before the 2008 collapse confirmed what I called a “distinct shift in the paradigm governing the housing market.” In November 2004, the stock market was climbing and the Fed was raising interest rates. The combination brought out talk of a real estate bubble. If investors started moving money away from housing they would be selling houses at a time when higher mortgage interest rates would make it more difficult to find buyers. That was 2004, mind you, not 2008; there were four years of housing prosperity ahead.

Under the new paradigm, rising stock market prices are neither cause nor effect for changes in residential real estate prices. (One exception is the New York metropolitan area, where Wall Street drives home prices by virtue of its impact on employment and income.) The break in the statistical relationship between Wall Street and Main Street started around 1980. In 1979, the Federal Reserve changed their policy away from interest rate targeting. As they attempted to control the supply of money, interest rates began to swing wildly. Households put more money in real estate when they saw more uncertainty in the economy. At the time I dubbed housing “A New Kind of Gold.” It wasn’t that the prices of houses behaved the same way as gold prices but because of the shared attitude from buyers. Gold is a traditional hedge against economic uncertainty. In the 1990s, people started buying homes when other investments seemed uncertain.

Prior to 1995, the Federal Reserve kept secret their monetary policy objectives. Twenty years later, we know that they are using the federal funds rate to reach targets for the money supply. Technically, the federal funds rate is the rate at which the Federal Reserve would like banks to lend to each other (although the banks are free to charge each other whatever they want). Banks also use the federal funds rate as the basis for setting consumer interest rates, like mortgage rates. Real estate investments are sensitive to interest rate changes in very specific ways. The total impact of current events on home prices will come from the Federal Reserve, regardless of what happens in the stock market. When interest rates rise it makes expansion more expensive for businesses by raising their borrowing costs. When businesses don’t expand, neither does employment. In addition to the fact that homes with mortgages become affordable to a smaller portion of the population, the impact on jobs is another reason why rising interest rates would reduce the demand for homes.

The gap between the mean- and median-priced homes was increasing across the country before the 2008 crisis, indicating that prices at the top of the scale were rising faster than the prices of more modest homes. The return of the home price gap to pre-1995 levels could have equalized affordability for middle-class Americans if income had followed suit. In addition to the poor employment outlook, fewer and fewer people will be able to afford the higher priced homes because the gap between mean- and median-income is rising faster than the home price gap is falling.


Median and mean (average) home sales prices are for new homes sold in the U.S. where the sales price includes land. Data from www.census.gov. Median and mean (average) salary from www.census.gov (Table H-13).

If the long-anticipated strengthening in the jobs market had appeared after the Great Recession, it could have made a real difference for middle-America. But so far, the employment recovery has not appeared. As weak job growth appeared in September, the previously encouraging July and August growth numbers were revised downward. The labor force participation rate declined, leaving only 59.2% of the population working. Population growth in the US is less than 1% per year but job growth is not keeping up with it.

Month 2015

Civilian Population Growth

Employment Growth

June

199,362

-56,000

July

205,661

101,000

August

220,858

196,000

September

233,715

-236,000

4-Month Total

859,596

5,000

Civilian Population Growth based on population estimates from www.FactFinder.census.gov, Employment Growth based on number of persons employed from www.bls.gov.


As long as the monthly payments on median-priced homes are out of reach for median-income households, demand in the middle-class housing market cannot strengthen. This is one more reason the Federal Reserve cannot afford to raise interest rates this year. That doesn’t mean that they won’t do; just that they shouldn’t – that don’t always do that smart thing.

Housing photo courtesy of BigStockPhoto.com.

Susanne Trimbath, Ph.D. is CEO and Chief Economist of STP Advisory Services. Dr. Trimbath’s credits include appearances on national television and radio programs and the Emmy® Award nominated Bloomberg report Phantom Shares. She appears in four documentaries on the financial crisis, including Stock Shock: the Rise of Sirius XM and Collapse of Wall Street Ethicsand the newly released Wall Street Conspiracy. Dr. Trimbath was formerly Senior Research Economist at the Milken Institute. She served as Senior Advisor on United States Agency for International Development capital markets projects in Russia, Romania and Ukraine. Dr. Trimbath teaches graduate and undergraduate finance and economics.

Oil Bust? Bah -- North Dakota Is Still Poised To Thrive

$
0
0

Oil and gas companies have the worst public image of any industry in the United States, according to Gallup. But it’s well-loved in a swathe of the U.S. from the northern Plains to the Gulf Coast, where the boom in unconventional energy production has transformed economies, enlivened cities and reversed negative demographic trends.

What now that the good times are over in the oil patch? In North Dakota, the epicenter of the once-hot Bakken shale play, the number of active rigs is down to 68 as of this week from 145 in June of 2014.

Some might argue that it’s now the turn of oil patch cities to suffer, just as they did when prices plunged back in the early 1980s, setting off a decade long decline. But many of these cities have made considerable progress in economic diversification, making themselves far more attractive places for non-energy businesses.

Perhaps no state benefited more from the energy boom than North Dakota. Long known more for its harsh weather, low population and featureless expanses than for anything positive, the massive deposits on the Bakken formation turned the state into the No. 2 energy producer in the country, trailing only Texas. The prairie state gained 45,000 energy jobs between 2007 and 2014. Now the decline in oil prices promises to eliminate quite a few of them.

But few North Dakotans seem to believe that the energy bust will turn the state once again into a poster child for stagnation. For one thing, North Dakota’s job base has also expanded well beyond oil, with a net growth of 155,000 jobs   jobs from 2007 to 2014  — no small beer in a state with a population of 739,000. This growth started well before the oil boom, with employment surging by 50,000 jobs between 2000 and 2007.

Transportation, logistics, wholesale trade and construction are among the industries that have added jobs, and the state’s technology industry has surged, doubling employment since 2009. The state’s engineer count has expanded 41% since 2009, almost seven times the national increase. Fargo, the state’s largest city but hundreds of miles from the Bakken, has thrived in large part due to the expansion in tech and business services. Overall Fargo has 38% more jobs than in 2000.

In the coming years, other industries may help pick up the slack from energy. One prime candidate is aerospace, where North Dakota is touting itself as the “Silicon Valley of drones,” an outgrowth of the conversion of the Grand Forks Airforce Base from launching bombers and tankers to drones. The country’s first drone-only business park is being built on an unused portion of the base. Other industries on the upswing include biomedicine and wind turbine parts.

Although some accounts have focused on the high costs to North Dakota communities of the oil boom, it’s difficult to find many North Dakotans who think it hasn’t been worth it. Over the past decade the state’s per capita income soared from 38th in the nation in 2004 to sixth in 2014. In this surge North Dakotans bought lots of things that once seemed unattainable, including winter homes in places like Phoenix.

Beyond The Buffalo Commons

But perhaps the biggest transition is demographic. A decade ago North Dakotans were being told by geographers like Rutgers’ Frank and Deborah Popper that their state would continue to lose residents and would best be transformed into a “buffalo commons,” a giant park that would be home largely to native Americans and the state’s varied wildlife .

Yet North Dakota has enjoyed a remarkable demographic revival. After stagnating at roughly 640,000 for 15 years between 1990 and 2005, the state’s population now stands at roughly 100,000 higher.

Once among the oldest states, it now ranks as the fourth youngest, with among the highest birthrates and the strongest in-migration per capita in the nation. More important still, the youngest residents are now much better educated, according to an analysis of Census data by Mark Schill of the Grand Forks-based Praxis Strategy group. Some 34% of North Dakotans between the ages of 25 and 34 have college degrees, and 40.8% in Fargo, well above the 31.7% rate nationally.

Critically much of the demographic recovery in North Dakota is concentrated in Fargo and other places far from the energy belt, such as Sioux Falls, Omaha and Des Moines.

Do The Plains Have A Future?

Clearly the drop in price of oil, as well as of some farm commodities, will slow the Plains’ progress. Some sectors, notably the coal industry, seem destined to shrink as the EPA clamps on tighter emissions controls. North Dakota’s now low energy costs could be undermined by such steps, eliminating one competitive advantage. Iowa, Kansas and Minnesota also rank among the states most reliant on coal for electricity.

The decline in key commodity markets could also hit the region’s resurgent manufacturing sector, which specializes in farming and earth-moving equipment; the current problems plaguing Caterpillar and are being felt across the region. The problems in key export markets, such as China and Canada, are being further exacerbated by the strong dollar.

But younger demographics and low business costs suggest that the state will remain attractive for tech and business services companies. The state’s ability to draw businesses from higher-cost coastal areas has been bolstered by strong on the ground improvements. In Fargo there has been substantial downtown development and it boasts cultural attractions and a lively restaurant scene. The same can be said for in many Plains cities, notably Oklahoma City, Des Moines and Omaha. Anyone who had visited these place a decade or two ago would likely barely recognize them.

To be sure with its tough climate and location far from the coasts, the Great Plains cities are not likely to challenge places like California or New York for leadership in media or software. But there’s an opportunity for these metro areas to grow in industries ranging from manufacturing and logistics to customer support that can sustain them until commodity prices once again begin to rise. When that happens, as they say out there, honey, bar the door.

This piece first appeared in Forbes.

Joel Kotkin is executive editor of NewGeography.com and Roger Hobbs Distinguished Fellow in Urban Studies at Chapman University, and a member of the editorial board of the Orange County Register. He is also executive director of the Houston-based Center for Opportunity Urbanism. His newest book, The New Class Conflict is now available at Amazon and Telos Press. He is also author of The City: A Global History and The Next Hundred Million: America in 2050. He lives in Orange County, CA.

Photo "Western North Dakota" by Aaronyoung777 - Own work. Licensed under CC BY 4.0 via Wikimedia Commons.


Techno Fixing the Urban Zone

$
0
0

In 2008, when Chicago inked a deal to privatize its parking meters, a chorus of groans ensued. To say that the deal was widely panned is putting it mildly. Its detractors say the city accepted too little in exchange for turning over the operations of its parking meters for a near-eternal 75 years to a private company that promptly raised the prices and sued the city. To many, the deal appeared desperate and irresponsible; a prime instance of a city in the red buckling to the ambitions of a private operator and getting little in return except for a pittance of one-time cash.

The case of Chicago is not unique. While several other cities have flirted with privatizing large-scale city services, politicians who support even many of the best-constructed of these measures have been rejected at the ballot box.

The argument against privatization has primarily been a financial one. In most cases, it appeared that transferring the development and management of large city networks into private hands would at best yield equally adequate services, but for a much higher price to residents, while creating a barrier to cities’ long-term flexibility. Not long ago the verdict on urban privatization read more like an epitaph. Common sense dictated that city services could best be cared for in public hands. Major movements in city management like New Urbanism’s burgeoning lean urbanism would optimize choices about government decision-making. Public-sector and populist ideas like widespread bike lanes, traffic calming design features, urban farming, and streetcars appeared the best options available for driving future city development, and as the seminal techniques for optimizing livability and resources while eliminating congestion.

The shame about the damage that the perceived failure of the Chicago deal has inflicted on the reputation of urban privatization is that few have noticed the increasingly obvious relationships between privatization, data, and city services in the period since. Many planners continue to present “livability” and “placemaking” as topics best solved through traditional planning approaches, well removed from the explosion of privately developed data technologies. While keeping their eyes on the ever-coveted fractional percentage gains in bicycle ridership in the cores of the largest cities, they’ve largely missed the more significant transformations around us. The public-sector response to the failed privatization ploys of a few years ago has in many cases been to write off privatization forever.

But today, the private sector is offering better products. The Smart Cities Week conference in Washington, DC recently highlighted some of these advances, which range from programs to optimize transit systems (in order to speed up services and reduce the need for investment in hard infrastructure), to Uber-style trash pick-up that allows private waste management companies to electronically compete over who will empty a just-filled dumpster quickest and cheapest. Far from the expensive and resource-intensive pipe dreams that many have ascribed to these kinds of technological innovations (thus writing them off as impractical for the coming post-fossil fuel economy), most of these new products seem designed to reduce inefficiencies, lower costs, and minimize resource usage through precision monitoring and optimization.

Rather than making a key fiscal offering to cities in the form of large, up-front payments in exchange for the rights to take over ordinary city services (a useful tool for paying off debt, but a tough political sell given the high consumer payments needed to make the undertaking worthwhile to the private vendor), the private sector appears to have shifted its commitment towards making the case that technological advances can generate value on both sides of the equation. While the parking vendors in the initial privatization cases were hard-pressed to prove that they were able to offer services even on par with those of the cities’ existing systems, a commitment to research and development in urban scale technology is now allowing private vendors to offer services that are overwhelmingly more user-friendly, more efficient, and more advanced than municipal services.

Because so much of the private-sector focus has been on optimizing network operations, the notion that private management is inevitably more expensive than city management is fast-becoming obsolete. The question has shifted away from whether a city that receives an up-front payment ends up with a greater rate of return than it otherwise would have, and more toward asking how much value the privatization of a service will create for the city’s residents. While up-front payments may still be juicy bait, the real meat lies in across-the-board cost savings and noticeably better service options quickly coming on line.

The answer to many of these questions seems clear. Who is going to accept coin-operated parking meters and confusing, impersonal signage instead of interactive, clear, and usable ones? Who will be satisfied with a 10-minute walk to an inefficient transit system if a self-driving car would come to his or her door for a similar price? Why would a city install conventional street lights if a private operator could more cheaply operate energy-efficient sensor-activated lighting that can simultaneously forestall crime through remote monitoring? And who wants to live in a city where conservation objectives are primarily pursued through inconvenient regulations, parking restrictions, and limits on plastic bag usage, when hyper-local smart grid technology can achieve the same savings by automatically optimizing load storage, green roofs, solar, and wind power block by block, all while lowering prices, eliminating losses, and hedging risk through variable city and local networks? Nearly all of these products are already on the market.

Once city governments and voters realize that the private sector is beginning to offer services that are more efficient, more affordable, more sustainable, and more convenient than even the best conventional optimization practices being pushed today, it’s hard to believe that they will tolerate doing without them. If the newness of such systems also helps attract millennials wooed by ever-fancier gadgetry, then the case becomes even stronger.

The blind spot the planning profession has often shown to this kind of thinking is understandable and justified. Getting a good description of a 'smart city' from the technology industry is an exercise in tooth-pulling. And who really believes that corporate technology firms can make places as livable as those planners that are dedicated to designing for livability? The private sector hasn’t helped itself with years of offerings that seemed designed to bilk bureaucrats out of public money. Luckily, the technological advances are now being paired with better, more creative, and fairer financing mechanisms.

Hesitation by planners may be a good thing, because it has forced the private sector to begin to integrate the livability principles of urban design. Past perceived failures may give cities added pause, allowing a more thoughtful merge between planning objectives and privately-developed data capabilities.

But planners best not wait too long. Popular urban advances are increasingly being forged by technologists with little input (or even sometimes with disdain) from planners. Writing off technology and divorcing big data is not a winning formula. As Silicon Valley continues to boom with large-scale, cost-effective advances, the planning profession may increasingly lose power. Enter cities designed by corporate private-sector technologists, and city budgets rescued by the ever-resilient engines of private capital.

Roger Weber is a city planner specializing in global urban and industrial strategy, urban design, zoning, and real estate. He holds a Master’s degree from the Harvard Graduate School of Design. Research interests include fiscal policy, demographics, architecture, housing, and land use.

Flickr photo by Mark Turnauckas: a smart parking meter in Akron, Ohio.

Jessie: Over-The-Rhine, Cincinnati

$
0
0

This is Jessie. She’s a well educated thirty year old professional with a good income. She could live anywhere she wants. She was offered excellent positions with good companies in San Francisco. While she was excited by the opportunity to live in a top tier coastal city she was smart enough to actually run the numbers before taking a job. Her income would be comparable to what she was already making in Cincinnati, but her cost of living (particularly the astronomical cost of housing) in San Francisco meant that she would actually be accepting a massively lower standard of living in California compared to Ohio.

IMG_3667 (1024x683)

IMG_3661 (1024x683)

Cincinnati isn’t just affordable. It’s also a fabulous place to live. Ten years ago the cost of property in San Francisco was high, but still within the reach of people like Jessie. No more. And ten years ago the urban core of Cincinnati hadn’t yet revived sufficiently to reach a critical mass of livability. But today the scales are tipped decidedly in Cincinnati’s favor as San Francisco (New York, D.C, Boston, Seattle, LA, etc.) have gone off the charts in terms of cost while Cincinnati has matured and proven itself.

IMG_3694 (1024x683)

IMG_3681 (1024x683)

Last year Jessie bought this entire three family building in the Over-the Rhine neighborhood in Cincinnati for $279,000. She then spent $126,000 in renovations. So she’s in for a grand total of $405,000. She lives in the top two floors and rents two apartments on the lower levels. The rental income goes a long way to offsetting her monthly expenses. I just checked the real estate listings here in San Francisco. There’s a 300 square foot studio condo on the market for $399,999, but it will almost certainly sell for considerably more once potential buyers outbid each other. And the monthly HOA fees are ridiculous.

IMG_3705 (1024x683)

IMG_3730 (1024x683)

IMG_3711 (1024x683)

IMG_3718 (1024x683)

IMG_3761 (1024x683)

If you’d like a more detailed account of how older buildings in Cincinnati are being purchased and rehabbed by ordinary people, including Jessie, I encourage you to check out the “Owner Occupied OTR” episode of the Urban Cincy Podcast.

John Sanphillippo lives in San Francisco and blogs about urbanism, adaptation, and resilience at granolashotgun.com. He's a member of the Congress for New Urbanism, films videos for faircompanies.com, and is a regular contributor to Strongtowns.org. He earns his living by buying, renovating, and renting undervalued properties in places that have good long term prospects. He is a graduate of Rutgers University.

Rural Industrialization: Asia’s 21st Century Growth Frontier

$
0
0

A World Bank report released earlier this year featured a jarring statistic: 200 million people moved to East Asia’s cities between 2000 and 2010. That figure is greater than the populations of all but five of the world’s countries. Commentators argue that the urbanization of Asia is inevitable, with one calling recent growth “just the beginning.” Considered alongside figures about urban migration, the fact that only 1 percent of Asia’s land is urbanized (a popular statistic) appears to validate predictions about the increasing densification of cities. However, growth in the capacity of cities to accommodate industrial growth seems to be flattening. With a rising middle class and booming demand for automobiles, Asian cities can expect no relief from congestion, and this may be a deterrent for businesses. Rural areas are increasingly prepared to absorb this potential shift in demand.

Urbanization patterns

In examining Asia’s economic growth through urbanization patterns, it is helpful to consider historic data spanning several decades. Figure 1 compares 54 years of urbanization in Southeast Asia’s five largest economies against India and China, both arguably the 21st century’s most dynamic growth stories and frequent subjects of urbanization research and commentary. Urban population share has been rising consistently in most countries of this study. Malaysia has long seen a population majority living in cities, and China and Indonesia both crossed the 50% threshold in 2011. Thailand has also rapidly urbanized since 2000, and will likely pass 50% this year. By contrast, Vietnam, India, and the Philippines have been slower to urbanize, with the latter declining since 1990. Part of this variation reflects differences in definitions and measurements of urbanization across countries and time, but the underlying pattern remains clear: the past several decades have seen an urban migration of historic scale.

Figure 1 (Data source: World Bank)

That urbanization correlates with economic growth is a point rarely overlooked. Indeed, the two have supported one another since the emergence of capital- and labor-intensive manufacturing during the industrial revolution. Borne of historic growth patterns, this logic has been used to support predictions of continued industrial urbanization and policies that promote it. However, remote penetration of connective infrastructure – including both transportation and communications – is replacing old growth models with a new rural industrialization. The following data support this claim.

GDP and urban growth

The urban growth-GDP quotient (Figure 2) represents urban population growth divided by GDP, and is effectively a measure of how much economic activity countries are extracting from their cities. It is not an absolute measure such as GMP (gross metropolitan product). Rather, it is a measure of how changes in GDP track changes in urbanization, providing a broader look at the relative role of cities in national economies. A time horizon of nearly three decades (1985 – 2014) is chosen to capture the high growth period after market reforms in China (1979) and Vietnam (1985). The indexing approach is necessary to normalize the scale of variables for more meaningful graphical visualization, essentially “controlling” for vast differences in numeric values (e.g. the GDPs of China vs. the Philippines). It also creates a common reference point to compare longitudinal performance across countries.

Figure 2 (Data source: World Bank)

In this metric, China outperforms comparator countries with a particularly rapid increase in the quotient since 2005; it has evidently been successful deriving GDP value from urban areas. By contrast, Indonesia has seen comparatively less urban-based GDP contribution, and Thailand’s contribution has remained roughly the same since outpacing all countries between 1985 and the Asian financial crisis.

Manufacturing and urban growth

One factor underlying these differences is the type of industries contributing to GDP growth, and in particular their location patterns (rural vs. urban). An examination of manufacturing value added (MVA) is necessary to sharpen this analysis, as manufacturing is historically an urban-based activity. Cities provide labor, infrastructure, business services, and global connectivity; their importance to manufacturing is undisputed. The raw MVA numbers (Figure 3) indicate that since 2005, China has far outperformed other countries in the study, most of which showed consistent but not transformative growth. Among the latter, India boasts the lone spike in MVA, and that only recently.

Figure 3 (Data source: World Bank)

To complete the analysis, Figure 4 compares historic patterns of manufacturing growth against growth in urbanization. The indexed quotient replaces GDP (Figure 2) with MVA and can be regarded as a measure of the extent to which countries leverage urbanization to support manufacturing growth. China’s statistical dominance in previous measures vastly diminishes here. Further, growth in the ability of many remaining countries to derive MVA from cities slows after initially rapid growth.

Figure 4 (Data source: World Bank)

The notable exception is India, and this is the critical point in this analysis. India’s competitive advantage is rooted in the country’s tech sector and other higher-value added activities. From call centers to technology R&D, India has developed a defensible regional position in knowledge-based industries, which are increasingly dependent on the by-products of urbanization: an educated workforce, global talent networks, and lifestyle amenities that appeal to higher-income residents. China maintains its position at the top due in part to its particular urban-based industrialization strategy (special economic zones and decentralization reforms empowering cities). However, China’s conversion of rural agricultural land into industrial facilities is an emerging phenomenon, and the line between urban and rural is fading. For example, in many provinces (e.g. Hebei) factory parcels stand alone, surrounded by farms.

Towards rural industrialization

In Southeast Asia, as in parts of China, industrialization is not a fundamentally urban phenomenon. From the industrial estates of Thailand’s Eastern Seaboard to the suburban clusters of Vietnam and Indonesia, companies are now finding most everything they need outside of city centers. The advantages are numerous: cheaper land, lower labor costs, less congestion, and in some cases lucrative business incentives. These suburban and rural industrial clusters are even focusing on quality of life for families, looking beyond hard infrastructure to provide housing, education, and recreation facilities. Such amenities appeal to workers of all skill types, from manufacturing to research and development. As such, rural industrialization need not be only smokestacks and assembly lines; an educated workforce can be recruited if rural living standards match those of cities. This broadens the array and sophistication of industries capable of supporting a new kind of growth.

Hyper-urbanization visits significant inefficiencies on businesses, potentially making rural regions more attractive for operating. In many of Asia’s major cities, snarled traffic grinds life to a near halt and transit infrastructure has provided only modest relief. Aside from Singapore (a frequent statistical exception), Bangkok and Kuala Lumpur are leaders within Southeast Asia in developing urban rail. However, neither system offers the geographic coverage needed to loosen gridlock. Ho Chi Minh City is currently building its first metro line, but construction is delayed and completion appears to be years away. If hyper-urbanization is re-interpreted as a policy challenge rather than a sign of progress, the decentralization of industrial development can be one solution. Asia’s economic fate is not inextricably linked with the size of its cities, and fresh visions of decentralized growth are already proving their value. The potential is vast; for example, Indian Prime Minister Narendra Modi’s “digital push” and recent commitments to rural broadband represent a development path for the country’s remote regions. Technology, expertise, new funding sources, and emerging economic opportunities are ready to support the rise of rural industrialization across Asia.

Kris Hartley is a Visiting Lecturer in Economics at Vietnam National University – Ho Chi Minh City, and a PhD Candidate at the Lee Kuan Yew School of Public Policy, National University of Singapore.

Top Photo: Putrajaya, Malaysia: Seri Gemilang Bridge. Behind the bridge on the right side Ministry of Women, Family and Community and Ministry of Urban Wellbeing, Housing and Local Government © CEphoto, Uwe Aranas / , via Wikimedia Commons

Environmental Activists Turn up the Rhetorical Heat

$
0
0

What is the endgame of the contemporary green movement? It’s a critical question since environmentalism arguably has become the leading ideological influence in both California government and within the Obama administration. In their public pronouncements, environmental activists have been adept at portraying the green movement as reasonable, science-based and even welcoming of economic growth, often citing the much-exaggerated promise of green jobs.

The green movement’s real agenda, however, is far more radical than generally presumed, and one that former Sierra Club President Adam Werbach said is defined by a form of “misanthropic nostalgia.” This notion extends to an essential dislike for mankind and its creations. In his book “Enough,” green icon Bill McKibben claims that “meaning has been in decline for a long time, almost since the start of civilization.”

And you may have thought the Romans and ancient Chinese were onto something!

Rather than incremental change aimed at preserving and improving civilization, environmental activists are inspired by books such as “Ecotopia,” the influential 1978 novel by Berkeley author Ernest Callenbach. He portrays an independent “green” republic based around San Francisco, which pretty much bans fossil fuels and cars and imposes severe limits on childbearing. These measures are enforced by a somewhat authoritarian state.

Read the entire piece at The Orange County Register.

Joel Kotkin is executive editor of NewGeography.com and Roger Hobbs Distinguished Fellow in Urban Studies at Chapman University, and a member of the editorial board of the Orange County Register. He is also executive director of the Houston-based Center for Opportunity Urbanism. His newest book, The New Class Conflict is now available at Amazon and Telos Press. He is also author of The City: A Global History and The Next Hundred Million: America in 2050. He lives in Orange County, CA.

Planning has Become the Externality: New Zealand Deputy Prime Minister

$
0
0

One of the frequently cited justifications for urban planning is to mitigate negative externalities --- detrimental impacts that people or organizations impose on others in society. While acknowledging this, New Zealand Deputy Prime Minister Bill English charged that urban planning itself has become the externality, by virtue of its impact on house prices, equality and the economy in New Zealand.

In a speech to the Victoria University Business and Investment Club in Wellington, the Deputy Prime described the government's program to reverse the decline in housing affordability  that have seen national prices relative to incomes (the median multiple) nearly triple, to 8.0, in Auckland, the largest metropolitan area. He outlined three motivations for the government's policy:

Consequences of Planning: The Economy

English said: "The first is that a housing market that is not properly functioning can have a significant effect on the macro-economy."

"Over the last five years, the Auckland housing market has been the single biggest imbalance in our macro-economic system.

The point is that when the supply of housing is relatively fixed, shocks to demand – like migration flows increasing sharply as they have recently – are absorbed through higher prices rather than the supply of more houses."

He noted the destabilizing effect of strong land use regulation:

"What they’ve [economic researchers] found is that, across different markets subject to rules which vary by state, more-intense regulation of urban development is associated with higher house price volatility.

The effects of planning rules can extend to the macro-economy.

Research indicates that when planning rules prevent workers shifting to higher-productivity locations, then there is a cost in terms of foregone GDP."

It's only relatively recently that economists and politicians have understood the scale of those effects.

So when we're talking about something as apparently dry as the Auckland Unitary Plan [metropolitan land use plan], we're talking about a set of rules that will have a major impact on the city, on current and future residents – but also on the wider economy."

Consequences of Planning: Increased Inequality

English went on to say: The second reason we focus on planning and its consequences is that poor planning drives inequality.

"Poor regulation of housing has the largest proportionate effect on the lowest quartile of housing costs and rents.

So when we're having the debate about whether there is sufficient land available, we have to recognise that the people who lose the most from getting that decision wrong – and who stand the most to gain from fixing those decisions – are those on the lowest incomes."

Housing costs are becoming a larger proportion of incomes – and that matters the most at the bottom end of incomes among people who have few choices.

The new supply of lower-priced, affordable housing has dried up.

There are parts of Auckland where no new houses are entering the market priced at the affordable end of the market.

It is not surprising to see prices and rents rising disproportionately at the bottom end given this lack of supply."

The Deputy Prime Minister also said: "Planning is often seen a public good activity that must address the needs of those who are most-vulnerable and have the lowest income," and noted:

In fact there is a strong argument to say it does exactly the opposite.

Poor planning favours "insiders" – homeowners – on high incomes and who have relatively high wealth.

In particular he mentioned strategies that drive up prices:

Those rules include urban limits [urban growth boundaries], minimum lot sizes which prevent subdivision below a certain size, and maximum site coverage rules which prevent a house covering more than a certain proportion of the lot.

Working in combination, these rules reduce opportunities to develop affordable homes.

He has particular criticism for Auckland's urban growth boundary and its impact on house prices:

"Another indicator relates to Auckland's former Metropolitan Urban Limit, now called the Rural-Urban Boundary.

A study found that the value of land just inside the urban boundary was ten times higher than the value of land just outside it.

That huge price difference around an arbitrarily-selected line on a map indicates that there are housing opportunities outside that boundary that cannot be taken because of planning restrictions.

Consequently, first home buyers trying to access the housing market are being prevented by land prices inflated by an urban boundary."

English also cited the paradox that the higher house prices driven by excessive regulation lead to additional, more expensive requirements (called "inclusive zoning" in the United States).

Now that planners are recognising these consequences, they are now creating even more rules to offset these effects; for example by requiring some developments to include up to 20 per cent affordable housing.

That is implicit recognition that planning rules have driven the costs up so much that another rule is required to offset it.

Consequences of Planning: Higher Government Costs

English said that the third motivation is the fiscal cost to Government: "The impact of these rules on inequality, and on household incomes, leads to a third reason for why the Government is focused on the housing market."

"Today we spend $2 billion each year on accommodation subsidies. 60 per cent of all rentals in New Zealand are subsidised by the Government.

The state owns around $21 billion worth of houses.

One house in every 16 in Auckland is a Housing New Zealand property."

Planning as the Externality

The Deputy Prime Minister says that planning has, in effect, abandoned its public purpose:

"For those among you who are economists, I would go so far as to say that while the justification for planning is to deal with externalities, what has actually happened is that planning in New Zealand has become the externality.

It has become a welfare-reducing activity.

And as with other externalities, such as pollution, the Government has a role to intervene, working with councils to manage the externality.

We're starting to get analysis that shows planning’s costs."

The Costs of Planning

It is not only in New Zealand that urban planning has become a negative externality. From London to Vancouver, San Francisco, Sydney and elsewhere (God forbid, even Liverpool) the land rationing strategies of urban planning policies have been associated with the losses in housing affordability, with an up to tripling of house prices relative to household incomes. These policies have lead to significant economic losses, including expanded inequality and labor market distortions. Important domestic goals shared by nations around the world, such as improving the standard of living and reducing poverty cannot be addressed efficiently or effectively in such an environment.

Wendell Cox is Chair, Housing Affordability and Municipal Policy for the Frontier Centre for Public Policy (Canada), is a Senior Fellow of the Center for Opportunity Urbanism (US), a member of the Board of Advisors of the Center for Demographics and Policy at Chapman University (California) and principal of Demographia, an international public policy and demographics firm.He is co-author of the "Demographia International Housing Affordability Survey" and author of "Demographia World Urban Areas" and "War on the Dream: How Anti-Sprawl Policy Threatens the Quality of Life." He was appointed to three terms on the Los Angeles County Transportation Commission, where he served with the leading city and county leadership as the only non-elected member. He served as a visiting professor at the Conservatoire National des Arts et Metiers, a national university in Paris.

Photo: Auckland Harbour Bridge (by author)

Viewing all 3794 articles
Browse latest View live


Latest Images