Quantcast
Channel: Newgeography.com - Economic, demographic, and political commentary about places
Viewing all 3795 articles
Browse latest View live

Urban Planning For People

$
0
0

The recent publication of the United States Department of Energy, Energy Information Administration's (EIA) 2014 Annual Energy Outlook provides a good backdrop for examining the importance of current information in transportation and land-use planning. I have written about two recent cases in which urban plans were fatally flawed due to their reliance on outdated information. In one case, San Francisco's Plan Bay Area, the planners are ignoring reality, and a court challenge is underway. In the other, a court invalidated the city of Los Angeles Hollywood Plan.

Progress In Automobile CO2 Emissions

The new Annual Energy Outlook forecasts continuing and material progress in improving energy efficiency, reducing fossil fuel consumption and reducing carbon dioxide emissions from cars and light trucks (light vehicles). Per capita carbon dioxide emissions from light vehicles are projected by EIA to fall to 51 percent below the peak year of 2003 (Figure 1).

The gross (not per capita) 2040 carbon dioxide reduction from light vehicles is projected to decline 28 percent in 2040 from 2003. Most significantly, the reduction is to occur as gross driving miles increases 29 percent (Figure 2). The actual 2040 emissions are likely to be even lower, because the 2014 Annual Energy Outlook assumes no vehicle fuel economy improvements after 2025. Improvements in vehicle technologies and cars using alternative fuels, and under government incentives, seem likely.

The emissions forecast improvements have been stunning, to say the least. The 2002 Annual Energy Outlook had expected a 46 percent increase in carbon dioxide emissions from light vehicles between 2000 and 2020. The revised forecast – which takes into account what actually has occurred – says there will be a 9 percent decrease.

This is the result of multiple factors. In 2002, EIA predicted a 55 percent increase in driving between 2000 and 2020. The 2014 Annual Energy Outlook revises that figure to 22 percent (Figure 3). Fuel economy is improving, which is being driven by stronger regulations as well as technological advances.  

Driving is Down

Driving per capita fell nine percent from the peak year of 2003 to 2012. This decline is not surprising given the sorry state of the economy and high unemployment. Gas prices have risen 85 percent (inflation adjusted) over the same period. The decline in driving is modest compared to the increase in gas prices – a 0.9 percent reduction in driving per capita for each 10 percent increase in gasoline (Figure 4), inflation adjusted. This is half or less the reduction in transit ridership that would be expected if fares were raised by the same percentage.  

Meanwhile, little of this reduction in driving has been transferred to transit. The increase in transit per passenger miles per capita captured less than one percent of the driving decline. Indeed, the daily increase in per capita transit use is less than the perimeter of a 20-to-the-acre townhouse lot.

With fewer jobs, higher gas prices and the new reliance on social media, as well as a rise in people working at home, people may have become more efficient and selective in their driving patterns (such as by consolidating shopping trips). Certainly those with jobs use their cars for those trips above as much as before.

Meanwhile, the EIA forecasts that driving per capita will rise gain, once the economy is released from intensive care. However, with the near universality of automobile ownership, the potential for substantial increases is very limited.

Hiding Success?

It might be thought that the planning community, with its emphasis on reducing greenhouse gas emissions, would be rushing to incorporate these into their plans and even to herald the improvements.

Yet, this is not the case. San Francisco Bay Area planners hid behind over-reaching state directives to "pretend-it-was yesterday" and employed out of date forecasts for vehicle emissions. Data in Plan Bay Area documentation shows that 95 percent of the projected improvement in greenhouse gas emissions would be from energy efficiency improvements. These have nothing whatever to do with its intrusive land use and transport strategies. The additional five percent requires social engineering residents into "pack and stack" high density developments, virtually outlaw detached housing on plentiful urban fringe land and will likely cause even more intense traffic congestion.

California's high speed rail planners have made the same kind of mistake, using out-dated fuel economy data in their excessively optimistic greenhouse gas emissions reductions.

The Illusion of Transit Mobility

Part of the problem is an illusion that people in the modern metropolitan area can be forced out of their cars into transit, walking, and biking, without serious economic impacts (such as a lower standard of living and greater poverty).

Transit is structurally incapable of providing automobile competitive mobility throughout the metropolitan area without consuming much or all of its personal income (of course, a practical impossibility). But there is no doubt of transit effectiveness and importance in providing mobility to the largest central business districts (downtowns) with their astronomic employment densities (Note 1). Yet, outside the relatively small dense cores, automobile use is dominant, whether in the United States, Canada, Australia, or Western Europe. The transit legacy cities (municipalities) of New York, Chicago, Philadelphia, San Francisco, Boston, and Washington, with the six largest downtown areas account for 55 percent of all transit commuting in the United States.

The Delusion of Walking and Cycling as Substitutes for Driving

Illusion becomes delusion when it comes to cycling and walking. Walking and cycling work well for some people for short single purpose trips, especially in agreeable weather. However, walking and cycling are inherently unable to provide the geographical mobility on which large metropolitan areas rely to produce economic growth. True, cycling does approximate transit commute shares in smaller metropolitan areas, like Amsterdam, Rotterdam, and Bremen, but still accounts for barely a third of commuting by car according to Eurostat data. Prud'homme and Lee at the University of Paris and others have shown in their research that the economic performance of metropolitan areas is better where more of an area's employment can be reached within a specific period of time (such as 30 minutes). That leaves only a limited role for walking and cycling.

Toward an A Non-Existent Nirvana?

The "Nirvana" of a transit-, walking-, and cycling-oriented metropolitan area proves to be no Nirvana at all. We don't need theory to prove this point. Take Hong Kong, for example, with its urban population density six times that of Paris, nine times that of Toronto, 10 times Los Angeles, 12 times New York nearly 20 times Portland, and nearly 40 times that of Atlanta.

This vibrant, exciting metropolitan area cannot deliver on a standard of living that competes with Western Europe, much less the United States. Despite the high density, the overwhelming dominance of transit, walking, and cycling, Hong Kongers spend much longer traveling to and from work each day than their counterparts in all large US metropolitan areas, including New York and in most cases the difference is from more than 50 percent (as in Los Angeles) to nearly 100 percent.

The problem goes beyond the time that could be used for more productive for rewarding activities. Housing costs are the highest among the major metropolitan areas in the eight nations covered by the Demographia International Housing Affordability Survey. Hong Kong's housing costs relative to incomes are more than 1.5 times as high as in the San Francisco metropolitan area and almost five times as high as Dallas-Fort Worth. Meanwhile, the average new house in Hong Kong is less approximately 485 square feet (45 square meters), less than one-fifth the size of a new single family US American house (2,500 square feet or 230 square meters), though Hong Kong households, are larger (Note 2).

When households are required to spend more of their income for housing, they have less discretionary income and necessarily a lower standard of living. This loss of discretionary income trickles down to people in poverty, whose numbers are swelled by higher than necessary housing costs.

Planning is for People

Contrary to the current conventional wisdom, the prime goal of planning should not be to achieve any particular urban form. What should matter most is the extent to which a metropolitan area facilitates a higher standard of living and less poverty.

------------------

Note 1: In 2000, employment densities in the nation's six largest downtown areas (New York, Chicago, Washington, Boston, San Francisco and Philadelphia) was three times that of the downtowns in the balance of the 50 largest urban areas, and 14 times as dense as outside the downtown areas.

Note 2: According to the 2011 census, the average household size in Hong Kong was 2.9 persons. This is more than 10 percent larger than the US figure of 2.6 from the 2010 census.

-------

Wendell Cox is a Visiting Professor, Conservatoire National des Arts et Metiers, Paris and the author of “War on the Dream: How Anti-Sprawl Policy Threatens the Quality of Life.

Photo: Prius photo by Bigstock.


The Geography of Cultural Attitudes

$
0
0

The cultural and political division of America, the gap between “red” and ”blue” with respect to economic and social liberalism or conservatism is a constant and dominant theme in American discourse. Here’s some narrowly specific measures of social liberalism based on actual votes by citizens or legislatures, not polls or broader indices available.   

We would have liked to use more measures, but data problems restricted us to only 8 measures: women’s suffrage and state votes on the ERA (Equal Rights Amendment), the right to die, the legalization of marijuana, gay sex (sodomy laws), same sex marriage, racial intermarriage, contraception, and abortion (current state).  Data for religion-state separation were inadequate, although we include some extra data on religiosity.

For women’s suffrage our index notes when suffrage was granted (states which did not until after the 19th Amendment get the lowest score).  Similarly for the ERA, we give high scores to states which early granted rights to women, with low scores for states which did not pass the ERA, or rescinded an earlier yes vote. For racial intermarriage, scores were based on when intermarriage became legal, with the lowest scores for those states where it was still illegal before the 1967 Supreme Court decision. Gay sex similarly gives lowest scores with anti-sodomy laws still in force at the time of the Lawrence vs Texas case in 2003. The same sex marriage measure gives high scores to states which now accept same sex marriage. The contraception measure is based on current restrictions on emergency contraception, as data on earlier history were poor. The “right to die” or “death with dignity” cause is more recent. The abortion measure is based on a state by state analysis of when and if it was accepted by states before Roe, and the degree of current constraints. Finally the marijuana measure considers the vote in CO and WA, and also states with medical marijuana provisions. 

These nine values are summed to give a score to the states (listed in table 1 below). The table is arranged in order from the lowest total (most conservative) to the highest (most liberal).

This scaling is compared to the right in the table with a measure of religiosity, two indices of social liberalism from the web (also published) and the Gallup poll. Since the data on the 9 measures and for the other indices were in varying units, I converted all to a simple scale from 1 (extremely conservative) to 10 (extremely liberal).  The Gallup poll was for 2010-2012 surveys, the “religiosity” ranking on a separate Gallup poll on the “importance of religion,” the “Free state liberal” index is from the Free State Project Forum, State Policy Liberalism Rankings,  by Jason Sorens , the social science model rankings from Andrew Gelman , Statistical modeling, causal inference and social science statistics, and based on the 2000 Annenberg Survey.

Since our analysis was based on varying measures, some quite recent and others quite old, our numbers are rather different from most of the other comparison indices. These are broadly similar to contemporary rankings of conservatism or liberalism, with some intriguing differences, which reflect our choice of measures.

Consider our low ranking of Virginia and Florida, which actually voted for Obama in 2008 and 2012! The reason is not that there is a dearth of liberals, but that they have not been very effective.  If the state legislatures and courts don’t pass “liberal” measures because they are consistently controlled by conservative tradition and majorities, then many liberal voters are ineffective and irrelevant, except for statewide votes for senate or governor or president. The same principle applies to a lesser extent to Pennsylvania, Ohio, Michigan, and perhaps even Wisconsin. At the opposite end, there are many conservative voters in states like Washington, Oregon, Maine, California, New York and Vermont, but their effectiveness is low, since the governor and legislatures are often controlled by more liberal majorities. Washington may be the extreme in this respect, where the voters themselves, not the legislatures, twice affirmed  abortion rights, then the right to same sex marriage, death with dignity (right to die), and the legalization of marijuana.  Maine and Minnesota affirmed same sex marriage, and Oregon the right to die.    

The relatively low ranking for the District of Columbia, often the most liberal in other surveys, probably reflects the fact that it was part of the South culturally and perhaps more importantly subject to congressional oversight.

The story is different for the states which are widely proclaimed to be conservative, but are in the lower “liberal” part of my table.  Most noteworthy is Montana, but also Arkansas, Iowa, New Mexico, and Wyoming, noted among the most conservative in polls and other rankings. The reason again is my particular choice of measures.  Western conservative states tend to embrace a libertarian point of view which can translate into social liberalism despite economic conservatism. Wyoming and then Montana were the first to give women the right to vote, and supported the ERA early on. Montana was the 3rd state to recognize a right to die; it also tried to defy the Supreme Court with respect to corporate political contributions (Citizens United).

The other main reason for difference is that my ranking is based solely on social issues, while the other ranking all have some degree of economic liberalism affecting their results. This is why many Northeastern states are lower in my more strictly social liberalism ranking. The data show that some states have become more liberal over time while some states in the wide open west have become more conservative (WY, NV, ID AZ).

The social geography of American states is a fascinating story of tradition and consistency, selective change.  The deeper South (not DE and MD) remains astoundingly monolithic. It is hard to escape the conclusion that to many the Civil War is not over, that race still rules, but also that for less obvious reasons, more fundamentalist religious denominations dominate, while in much of the country, religious adherence has diminished.

At the other extreme, the “Left coast” and the Megalopolitan Northeast, (except for Pennsylvania!) exhibit a remarkable social liberalism. While the root may lie in a New England moralist or ethical tradition of tolerance, associated with the Congregational and Episcopal churches, this somehow became amplified in the 1960s and since through rising levels of education, professional occupations, and societal experimentation.  To some degree this relatively liberal ideology moved westward across the “northern tier” to the rise of a “progressive” movement in the Great Lakes states, and on to Iowa and Minnesota, (still  apparent!) and even on to Washington and Oregon.

The Mountain states, including probably Alaska, are more complex, with increasing conservatism, especially in the “Mormon realm” – Utah, Idaho, Arizona, and Wyoming, while New Mexico and Colorado have even become more liberal. Education?  I’ll leave the explanation to the readers!

This leaves the great Midwestern heartland – the Great Lakes, the northern Plains, and Appalachia. Appalachia was Democratic, a legacy of mining and unions, but social change seemed to pass the region by, as historic forces of fundamentalist religion and traditional values and small-townness, resisted the social change associated with the large metropolis.

The Great Lakes states (MI, OH, IN, WI, IL) are remarkably alike in the middle ground between liberal and conservative on the social dimension, and seem to defy any simple understanding. They are metropolitan, and historically industrially vibrant, but also retain extensive small-town and farming areas, with a stronger religious tradition than the Left Coast or the megalopolitan realm. Thus they are resistant to the more ‘radical’ social changes, like same sex marriage. And Illinois just changed on same sex marriage! Other states may soon follow.

The northern Plains, the region from MO and KS to the Dakotas and Minnesota, is more socially diverse, with Minnesota and Iowa far more socially liberal than the other states, especially the less metropolitan western area from Kansas through the Dakotas.

I would conclude with a warning that this ranking is social, and ignores economic values and votes. Thus while WA maybe the most socially liberal, it is much lower on economic measures. While WA does have the highest minimum wage, it is 50th, yes last, in its regressive tax structure.


Table 1: Index of Social Liberalism by State
StateWomen VoteEqual Rights ActRacial IntermarryGay SexSame Sex MarriageContraceptionRight to DieAbortionMarijuanaTotal Score
AL1111111119
VA1111111119
MS31112111112
FL24111111113
GA21131113114
LA34111111114
NC14111114115
SC14111811119
OK94111111120
AR51131711121
KY64151111121
ID94411111123
TN54152113123
MO69122111124
NE54481111126
UT91411811127
TX59111711127
AZ91432113529
SD94481111130
KS99711111131
ND59481111131
WV19184117133
IN69483111134
MI99711111535
PA19763711136
OH49781711139
WY109483114141
DC59469711143
DE39189116543
MD194410119443
NV94455119543
RI69759114547
WI610963814148
IA69789116148
MT109442189552
IL547109817152
MA39779917153
NH39989917156
MN69939816556
NM39787919558
AK99962919559
NJ39987819559
CO994857161059
CT39989818560
HI599859110561
NY99969819161
CA99489919563
ME697810919564
OR994858109567
VT39989999570
WA99781099101081


Table 2: Comparison to Other Indexes
StateReligious SeparationFreestate LiberalSocsci model rankGallupMy Ranking
AL11311
VA33551
MS11112
FL46452
GA22332
LA13222
NC24442
SC12332
OK11223
AR11122
KY22143
ID82223
TN21233
MO32344
NE43324
UT32314
TX21344
AZ74444
SD32245
KS32445
ND31315
WV34135
IN32335
MI56575
PA4556.75
OH47455
WY71316
DC659106
DE67796
MD49766
NV95476
RI981097
WI35547
IA54547
MT65338
IL67668
MA9101098
NH10677.88
MN56668
NM44478
AK95618
NJ710868
CO76578
CT98999
HI88789
NY810989
CA89769
ME10767.59
OR97799
VT1071099
WA976510
Correlation with My Ranking0.830.740.680.66

Richard Morrill is Professor Emeritus of Geography and Environmental Studies, University of Washington. His research interests include: political geography (voting behavior, redistricting, local governance), population/demography/settlement/migration, urban geography and planning, urban transportation (i.e., old fashioned generalist).

The Abuse of Art in Economic Development

$
0
0

City building is an imperfect process. Poverty, segregation, and income disparities persist, or worsen, despite longstanding efforts to affect change. The unsightliness of these social failures are called “blight”. Blight is commonly thought to be the antithesis to beauty.

Urban revitalization efforts have been infatuated with idea that removing blight creates the conditions for community good. Specifically, the field of aesthetics—or that branch of philosophy that deals with the principles of beauty and artistic taste—has for long been held up as a lens through which society can be ordered, with the thinking that beautification can “rehab” the masses.

For instance, the early 20th-century upper crust framed the conditions of poverty this way: the deprived were laggards on the evolution toward modernity, and they needed aesthetic inspiration. So arose the City Beautiful Movement, whose premise, according to Julie Rose at the University of Virginia, “was the idea that beauty could be an effective social control device”.

Put simply, outside pretty would arouse inside pretty, inspiring civic loyalty and morality in the impoverished.

A line in the 1904 classic “Modern Civic Art, or The City Made Beautiful” puts it frankly: “[M]odern civic art can now hope to banish the slum thus to redeem the tenement and to make its own conquests thorough.”

Cleveland tried its hand with this approach. Back in the early 1900s the city’s elites commissioned then-starchitect Daniel Burnham to create the Group Plan. The Plan called for a City Beautiful civic center, which involved demolishing downtown housing tenements and commercial structures deemed expendable, with a series of elegant Beaux Arts-style buildings eventually being constructed around a plaza-like green space, now known as the “Mall”. It was believed such a central source of civic beauty would radiate out into the city, curing ills of all types. The beauty would be timeless, without half-life—always anchoring Cleveland’s progression, like a compass of godliness.

Courtesy of groupplan.dhellison.com

It didn’t work. Today, Cleveland is wayward, with a poverty rate of over 30 percent, and more vacant houses than perhaps ever before. Such failures made plain the fact that impoverishment cannot be “prettied” out of the city.

The use of aestheticism in city building has not went away. In fact efforts have redoubled over the last decade. The idea is no longer about flushing impoverishment out of the city system, but rather using art—particularly the romanticization of the artist and the act of creation—to spark economic growth.

In the article “Artists, Aestheticisation and the Field of Gentrification”, scholar David Ley discusses this strategy, whereby a neighborhood moves from “from junk to art and then on to commodity”, or form poor to reinvested in. The gist of the process—one with roots in 1960s France to present-day everywhere—goes something like this:

Artists, as members of the bohemian vanguard, historically seek affordable, gritty locations. They do this out of necessity—most of the creative class is paid pittance—but also for creativeness.

“Hardship was the price one paid for being in the thick of it,” wrote artist David Byrne in the article “Will Work for Inspiration”.

Where artists cluster, so does the concept of anti-conformity and “cool”. Here, according to Ley, the space of the artist and the space of middle class youth overlap, bringing an era’s hipsters into a neighborhood’s fold. Things can turn quickly after that. Developers and entrepreneurs constantly sniff out the next big thing so as to buy lower and rent higher, with the scent pegged to “what the kids like”, hence the incessant “Millennial” fixation. Eventually, as gentrification continues, the artists and hipsters give way to professionals, until a landscape of wealth and conformity fills in the “starving artist” romanticism that greased its path.

Notwithstanding which side of the gentrification debate one falls on, the fact of the matter is that this form of city revitalization—from junk, to art, to commodity—is rampant, becoming defacto neighborhood development. In Cleveland, the arts-fueled districts of Tremont, Detroit Shoreway, Collinwood, and St. Clair-Superior speaks to the popularity of this approach.

This isn’t to say it inevitably works. There are only so many artists and hipsters to go around, and not everywhere is Portland, Austin, or Brooklyn. And so when Anywhere, USA does the art-as-development approach, things do not always go as planned.

In the recent piece called the “Best of All Possible Worlds”, writer Mark Lane travels to Evansville, Indiana, where a public art contest sparked “a debate over class, race, and good taste”. The story details how the town’s arts district plan devolved into land-grabbing by a quasi-governmental agency whose attempt at subsidizing housing for artist attraction often turned into the demolition of stately structures, if only because getting artists to move to small town Indiana is hard.

Courtesy of The Believer

Courtesy of The Believer

Beyond the wisdom of such a strategy, the piece examines the role of art as an aesthetic discipline, noting that the use of art in city revitalization is commonly not art for art’s sake, but is rather employed as a means to “fertilize” low-income neighborhoods for the arrival of the creative class.

“It’s not about the art,” noted an Evansville city planner to Lane. “Art is just another tool for economic sustainability.”

Such is a far cry from Picasso’s purpose of art, which is “washing the dust of daily life off our souls”.

Curiously, you don’t hear much from the mouthpieces of the art establishment as to the way the discipline is being used: as a means to create commercial order. Historically, the beauty and need of civic art has been about allowing the brokenness of life to enter into the artist’s realm so that the pain and suffering of humanity could be recast through the value of creation. Here, the soul is the audience, with the ovation meant to reverberate into how we “do” community.

But civic art as “junk, to art, to commodity” achieves something else. It turns the act of creation into the act of “creative classification”. And given our current economic inequalities and the erosion of the middle class, it is fair to wonder why a field that can heal the soul is being used to patch a system that adds dust to our daily living by the day.

Richey Piiparinen is a writer and policy researcher based in Cleveland. He is co-editor of Rust Belt Chic: The Cleveland Anthology. Read more from him at his blog and at Rust Belt Chic.

Top photo courtesy of aaronacker.com

Political, Economic Power Grow More Concentrated

$
0
0

Generally speaking, we associate the quest for central government control to be very much a product of the extremes of left and right. But increasingly, the lobby for ever-greater concentration of power – both economically and politically – comes not from the fringes, but from established centers of both parties and media power.

Recently, for example, an article by Francis Fukuyama, a conservative-leaning intellectual, called for greater consolidation of federal power, most particularly, the Executive Branch. Ironically, Fukuyama's call for greater central power follows a line most often adopted by “progressive” Democrats, who seek to use federal power to enforce their views on a host of environmental, economic and social issues even on reluctant parts of the country.

This rush to concentrate powers in Washington seems odd, given the awful rollout of the Affordable Care Act, which seems almost like a parody of a government-managed big program, overly complex and almost impossible to implement. ACA has led even some honest liberals, like the New York Times Tom Edsall, to wonder if “the federal government is capable of managing the provision of a fundamental service through an extraordinarily complex system?”

To give the Left credit, many liberals would have preferred something less complex, perhaps like the single-payer system, that perhaps would be less amenable to confusion, and exemptions for privileged groups, like congressional staffs. But President Obama and his Democratic allies chose to work with many powerful interests, notably pharmaceutical companies and health insurers, who are in position to capitalize on this bizarre and, in many ways, inexplicably complicated, health care “reform.”

Other cautionary tales of overcentralization of federal power abound. Recent scandals like NSA eavesdropping and IRS political targeting, would have offended progressive defenders of civil liberties. However, with a favorite Democrat in the Oval Office, and conservatives the primary victims of abuse, their response has been far more muted than if, say, Mitt Romney was president.

Top-down economy

Equally critically, many progressives also increasing favor a more centralized economy. With a few brave exceptions, notably Vermont's feisty socialist Sen. Bernard Sanders and incorrigibles such as Ralph Nader, there have been too-few voices willing to challenge the growing corporatization of the Democratic Party and the ongoing concentration of power in ever-fewer hands.

Historically, progressives made much about their objections to both government abuse and unrestrained corporate power. After all, progressives (as well as populists) pushed the earliest restraints on trusts and other large corporate combinations. But, now, the very people Theodore Roosevelt defined more than a century ago as the “malefactors of great wealth” have won powerful friends in the progressive camp.

Take, for instance the growing concentration of banking assets. Over the past 40 years, the asset share of the top five banks has grown from 17 percent to more than 50 percent of the total. This, however, is not enough for some progressive thinkers. Liberal pundits, like Matt Yglesias and Steve Rattner, in fact, think it would be better if we got rid of most smaller financial institutions.

Some of this is Washington-New York “we know best” elitism at its worst. These are the institutions and individuals that a studied corporatist and influence peddler like Rattnerwould identify with, naturally. Yglesias, for his part doesn't like small banks in part because they are run by “less-bright and not-as-good guys” as the benevolent geniuses on Wall Street, who almost cracked up the world economy.

This confluence of large government and big business can be seen in the flow of funds to the Center for American Progress, the Obama-friendly think tank whose head, John Podesta, was just named the president's latest chief of staff. The center's primary funders include a who's who of big corporations, including Apple, AT&T, Bank of America, BMW of North America, Citigroup, Coca-Cola, Discovery, GE, Facebook, Google, Goldman Sachs, PepsiCo, PG&E, the Motion Picture Association of America, Samsung, Time Warner, T-Mobile, Toyota, Visa, Wal-Mart and Wells Fargo.

These donations reflect a growing lurch of bigger businesses toward the corporatist Democrats; this is particularly true in such fields as media, telecommunications, high technology and health care, where looming environmental and labor reforms are perceived as less a threat than among smaller firms.

Rise of regulators

Most worrisome, the increased focus on bigness has engendered growing support for what amounts to government by administrative diktat. As Fukuyama and others argue, our present messy system, particularly Congress, seems incapable of meeting challenges facing the country. This leads to a notion that we need a new “top down” solution through the exercise of greater executive power.

As is increasingly the case, any attempt to push back against centralization elicits a torrent of name-calling. Objecting to a more expansive federal government, suggests some, smacks of “neo-Confederate” ideology, a charge particularly loaded when the agglomeration of power in Washington is being led by our first African-American president.

These assaults mask a more dangerous reality: a dismissal of democracy and embrace of authoritarian solutions. Former Obama budget adviser Peter Orszag and the New York Times' Thomas Friedman have argued that power should shift from contentious, ideologically diverse elected bodies – subject to pressure from the lower orders – toward credentialed “experts” operating in Washington, Brussels or the United Nations. These worthies regard popular will as lacking in scientific judgment and societal wisdom.

There is no adequate political response to this dangerous tendency. Republicans talk about abuse of power, but, when in office, seem more than willing to indulge in it (with the run-up to the Iraq war and with the Patriot Act). Similarly, few Republicans seem to understand that economic concentration – favored by their remaining friends on Wall Street and the corporate community – tends inevitably to lead to the political variety.

So far, Republicans have been forced to choose between their own corporatists, who simply favor shifting government largesse to their favorite causes, such as defense or farm subsidies, and the Tea Party movement, whose members often oppose virtually any government initiative, for example, infrastructure improvement, even at the local level, something sure to limit their appeal to a wider electorate.

Growing distrust

Yet the situation is far from hopeless. Obama's ineffective rule has done little to vouch for centralized government. Trust in governmental institutions – the White House, Congress, the courts – is at the lowest ebb in decades. The percentage of people who see the federal government as being too powerful, notes Galluphas surged from barely 50 percent, when President Obama took power, to well over 60 percent today, the highest level ever recorded.

In such a climate, some thoughtful liberals, such as Yale's Jacob Hacker, suggest that progressives should avoid embracing an authoritarian, top-down ruling philosophy. “The Democrats have the presidency now,” he suggests, “[but] they won't hold it forever.” They are essentially “feeding a beast” that, at some date, may turn against them with a vengeance.

This suspicion of “top down” solutions also extends even to one of the most critical parts of the Democratic base: the millennial generation. Although they have been a core constituency for Barack Obama, they appear to be drifting somewhat away from their lock-step support, with the presidential approval level, according to a recent study by the Harvard Institute of Politics, now under 50 percent.

Much of the problem, notes generational chronicler Morley Winograd, lies with millennials' experience with government, which to them often seems clunky and ineffective. The experience with the ACA is not likely to enhance this view, Winograd suspects. “Millennials,” he notes, “have come to expect the speed and responsiveness from any organization they interact with that today's high tech makes possible. Government, on the other hand, is handcuffed by procurement rules and layers of decision-making, from deploying much of this technology to serve citizens. The result is experiences with government, from long lines at the DMV office to the botched website rollout for Obamacare, causes millennials to be suspicious of, if not downright hostile to, government bureaucracies.”

It may be here, in the meshing of technology and public purpose, that we may find a new focus that is neither reflexively hostile (as some Tea Partiers appear) to government per se or simply interested in expanding the list of self-interested political clients. The key to future effective government lies not so much in its radical downsizing as in dispersing power to the local level, something that fits both into the mentality of the new generation and the decentralist traditions that have animated our history.

This story originally appeared at The Orange County Register.

Joel Kotkin is executive editor of NewGeography.com and Distinguished Presidential Fellow in Urban Futures at Chapman University, and a member of the editorial board of the Orange County Register. He is author of The City: A Global History and The Next Hundred Million: America in 2050. His most recent study, The Rise of Postfamilialism, has been widely discussed and distributed internationally. He lives in Los Angeles, CA.

Barack Obama photo by Bigstock.

Some Implications of Detroit’s Bankruptcy

$
0
0

There’s been so much ink spilled over Detroit’s bankruptcy that I haven’t felt the need to add much to it. But this week the judge overseeing the case ruled that the city of Detroit is eligible for bankruptcy. He also went ahead and ruled that pensions can be cut for the city’s retirees. Meanwhile, the city has received an appraisal of less than $2 billion for the most famous paintings in the Detroit Institute of the Arts.

A couple of thoughts on this:

First, every city in America should be doing a strategic review of its assets, and moving everything it doesn’t want turned into de facto debt collateral into entities that can’t be touched by the courts. In the case of the DIA, the city owns the museum and the collection. Hence the question of whether or not art should be sold to satisfy debts. If it were typical separately chartered non-profit institution, this wouldn’t even be a question.

At this point, I’d suggest cities ought to be taking a hard look at whether they own assets like museums, zoos, etc. that should be spun off into a separate non-profit entity. Keep in mind, the tax dollars that support the institutions can continue flowing to it. But this does protect the assets in the event of a bankruptcy.

In the case of Detroit, it seems inevitable that at least some art work will be sold. Given that worker pensions are going to be cut, it would be pretty tough to say no to selling art. Assuming this is the case, post-sale the museum should be spun off as a separate entity to hopefully reboot its standing the museum world. As the trustees of the group that operates it have been adamantly opposed to any sale, one would hope other museums would not hold any violations of industry standards against them for, particularly if they acquire ownership of the building and artwork away from the city afterward. The city of Detroit doesn’t need to be in the museum business anyway. It has bigger fish to fry.

Secondly, public sector employees will have to start rethinking their approach to retirement benefits. The current mindset has been to grab as much as you can anytime you can because the taxpayer will always be forced to cover the promises no matter what. As the actual results in Central Falls, RI and now this show, that’s no longer a good assumption.

Detroit’s workers don’t have lavish pensions as these things go. But they weren’t shy about abusing the system either. They in effect looted their own pensions by taking out extra, unearned “13th checks”. They also used pensions funds to give a guaranteed 7.9% annual rate of return on supplemental savings accounts workers were allowed to establish. All told these “extra” payments drained about $2 billion out of the pension system.

This was not something the city did through an arm’s length transaction. As the Detroit Free Press reported, Mayor Dennis Archer was alarmed by the practice and wanted to stop it. But “the city doesn’t control its pension funds, which have been largely administered by union officials serving on two independent pension boards.” So he tried to amend the city’s charter to stop the practice. According the Free Press, “Archer backed an effort to block the payments through a proposed new city charter, which actually passed in August 1996. Enraged, several city unions and a retiree group sued and won. Archer tried again to block payments through a ballot initiative, called Proposal T, but it failed.”

The unions could brazenly loot their own pension plan because they felt rock-solid assurance that the taxpayers would ultimately be required to make them whole. This bankruptcy is showing that may not be the case after all. It should serve as a warning to unions everywhere not to get too aggressive with their shenanigans.

They’ll of course appeal the judge’s ruling and may win. But the Michigan constitution says pensions are a contract right. The very definition of bankruptcy is that you can’t pay what you’re contractually obligated to. Bankruptcy is all about breaking contracts. The bondholders have contracts that are not supposed to be impaired too, after all. I’m a fan of local government autonomy as you know, but as Steve Eide rightly points out, any freedom worth its name is freedom to fail. If cities and their various constituencies don’t suffer the consequences of their mistakes, they should be heavily micromanaged from on high.

When individuals fail, we have a safety net (unemployment insurance, for example). Plus we have personal bankruptcy to give people a fresh start. We don’t even worry about whether the person is at fault for their own position or not. We provide that backstop regardless. But that backstop doesn’t allow people to go on living like they did before as if nothing happened. Similarly, cities in trouble shouldn’t be abandoned, but they need to realize that there are genuine consequences for failure. A realization that failure has consequences for pension holders as well as the taxpayer should hopefully promote healthier decisions about how retirement benefits should be offered, funded, and administered.

Aaron M. Renn is an independent writer on urban affairs and the founder of Telestrian, a data analysis and mapping tool. He writes at The Urbanophile, where this piece originally appeared.

The Evolving Urban Form: Charlotte

$
0
0

There may be no better example of the post World War II urban form than Charlotte, North Carolina (a metropolitan area and urban area that stretches into South Carolina). Indeed, among the approximately 470 urban areas with more than 1 million population, Charlotte ranks last in urban population density in the United States (Figure 1) and last in the world. According to the United States Census Bureau, Charlotte's built-up urban area population density was 1685 per square mile (650 per square kilometer) in 2010. Charlotte is not only less dense than Atlanta, the world's least dense urban area with more than 4,000,000 residents, but it is only one-quarter the density of the supposed  “sprawl capital” of Los Angeles (Figure 2).

Over the last seven decades, Charlotte also has been among the fastest growing metropolitan areas in the United States. Charlotte is the county seat of Mecklenburg County, and as recently 1940 as was home to 101,000 residents while with its suburbs in Mecklenburgh County was barely 150,000.

Declining Densities in the Core City

Charlotte is also in example of the difficulty of using the core municipality data for comparisons to the suburban balance of metropolitan areas. With North Carolina's liberal annexation laws, Charlotte has pursued a program of nearly continuous annexation such that in every 10 years since 1940, the city has added substantial new territory.

In 1940, the city of Charlotte covered a land area of 19 square miles (50 square kilometers) and had a population density of 5200 per square mile (2,000 per square kilometer). For a prewar core municipality, this was not at all dense. For example, Evansville Indiana, which had approximately the same population at the time, had a population density nearly twice that of Charlotte. Other larger core municipalities approached triple or more Charlotte's population density, such as Trenton, Buffalo, Providence, and Milwaukee.

Over the last seven decades, the city's population has risen by 6.2 times, while its land area has increased by 14.4 times (Table $$$). The result is a 53% decline in the city of Charlotte's population density, to 2456 per square mile (948 per square kilometer). This is only slightly above average density of the US built-up urban area – which includes the smallest towns and suburbs of every size – of 2,343 per square mile (1,455 per square kilometer). Indeed, the average far flung suburbs (30 miles distant) of Los Angeles, such as Pomona and Tustin, are more than 2.5 times as dense.


City of Charlotte (Municipality)
Population & Land Area: 1940-2010
CensusPopulationArea: Square MilesArea: Square KMDensity (Sq. Mile)Density (KM)
1940          100,899 19.350.0         5,228          2,019
1950          134,042 40.0103.6         3,351          1,294
1960          201,564 64.8167.8         3,111          1,201
1970          241,178 76.0196.8         3,173          1,225
1980          314,447 139.7361.8         2,251             869
1990          395,934 174.3451.4         2,272             877
2000          567,943 242.3627.6         2,344             905
2010          731,424 297.8771.3         2,456             948
Change625%1443%1443%-53.0%-53.0%


Growth by Geography

The core city of Charlotte's ever-fluctuating boundaries make it necessary to use smaller area measures to estimate the distribution of population growth. This can be accomplished using zip code data from the 2000 and 2010 censuses.

Inner Charlotte, for the purposes of this analysis (zip codes 28202 through 28208) covers approximately 28 square miles (73 square kilometers) and had a population of approximately 92,000 in 2010 . This is a larger area than the city of Charlotte in 1940, which covered only two thirds as much land area and had more people. Between 2000 and 2010, this inner area population rose by 6,200 residents. All the gain was in the central zip code that comprises the downtown area (central business district), which in Charlotte is called "Uptown." Outside this small 1.8 square mile area (4.7 square kilometers), the inner area actually lost 1,400 residents.

Overall, the inner area of Charlotte – which has somewhat an obsessive hold on many city leaders – accounted for 1.0% of the metropolitan area growth from 2000 to 2010. This is not unlike other major metropolitan areas, which have experienced slow growth, particularly in areas adjacent to the downtown cores. Among the 51 US metropolitan areas with more than 1,000,000 population in 2010, net gain occurred within two miles of city hall, while this gain was erased by a loss of 272,000 between two and five miles of city hall.

Another 13% (64,000) of the 2000-2010 growth occurred in the middle Mecklenburg County zip codes (28209 to 28217), virtually all of which is in the city of Charlotte. This 185 square mile area, combined with the inner area, exceeds the land area of the city in 1990.

Mecklenburg County's outer zip codes, many of which are in the city, captured 37% of the metropolitan area's growth (184,000). The remaining 49% (247,000) of growth in the Charlotte metropolitan area was outside Mecklenburg County (Figure 3).

From 1990 to 2010, Charlotte was the seventh fastest growing metropolitan area out of the 51 with a population exceeding 1 million. Early data for the present decade shows Charlotte to have slipped to ninth fastest growing; however during this period, Charlotte has displaced Portland, Oregon as the nation's 23rd largest metropolitan area. Between 1990 and 2012, Charlotte added nearly 1,000,000 residents and now has 2.4 million residents.

Uptown: The Commercial Story

Unlike other post-World War II metropolitan areas (such as Phoenix, San Jose, and Riverside-San Bernardino), Charlotte has developed a concentrated, high rise downtown area." Part of this is due to the city's strong financial sector. Charlotte is the home to Bank of America, the nation's second largest bank and the successor to the San Francisco-based California bank of the same name that was the largest bank in the world for decades. Nation's Bank, the predecessor to Bank of America, erected a 60 story tower in 1992 that was among the tallest in the United States.

Charlotte was also home to Wachovia Bank, which built its 42 floor headquarters before, and nearby the Bank of America Tower. Wachovia had intended to move to a larger, 50 story building. However, the time it was completed, Wachovia had been sold to Wells Fargo Bank, a casualty of the US financial crisis. The new building was renamed the Duke Energy Center.

Thus, Charlotte consumed one San Francisco bank, and lost another to San Francisco. Now Uptown Charlotte has six buildings more than 500 feet in height (152 meters). With six buildings of this height,  Charlotte has developed by far the concentrated central business district among the newer metropolitan areas.

However, the high employment density has not converted into a transit oriented business district, as some might have predicted. American Community Survey (CTPP) data indicates that approximately 87% of uptown employees use cars to get to work. Further, more than 90% of the jobs in the metropolitan area are outside Uptown.

Uptown: The High Rise Condominium Story

Uptown's commercial progress has not been replicated in the residential market, as overzealous high rise condominium developers apparently may have confused Charlotte for Manhattan or Hong Kong. One of the more recent 500 foot plus towers was The Vue, a 50 story condominium tower. Too few condominiums were sold, and a foreclosure auction followed. The new owner has converted the condominiums to rental units. A 40 story condominium project ("One Charlotte") was to feature units priced from $1.5 million to $10 million, but was cancelled. Another condominium building, the 32 story 300 South Tryon was also cancelled. A tower base was prepared for a 50 plus story condominium monolith, but this was never built, while depositors were claiming they could not find the developer to get their deposits back. It was also reported that legendary developer Donald Trump had plans for the tallest building in town, a 72 story condominium tower, which would have been joined by another tower. These have also been cancelled (for artists renderings, click here).

Charlotte's Continuing Dispersion

While Uptown condominium developers were unable to sell many units, Charlotte's labor market dispersed so much between 2000 and 2010 that the Office of Management and Budget expanded the metropolitan area by four counties. The net addition to the population of this revision was approximately 460,000.  This is by far the largest percentage increase to a metropolitan area over the period, though much larger New York added counties with 660,000 residents.

Charlotte seems to say it all with respect to the ill-named "back to the city movement" (ill named, because most suburbanites did not come from the city to begin with). Yes, there is growth downtown and yes, it is important and yes, it is healthy. But, in the overall scheme of things, it is small, and relative to the rest of the thriving region, likely to remain less important in the years ahead.

Wendell Cox is a Visiting Professor, Conservatoire National des Arts et Metiers, Paris and the author of “War on the Dream: How Anti-Sprawl Policy Threatens the Quality of Life.

Photo: Uptown Charlotte courtesy of Wiki Commons user Bz3rk

Highway Eye-4, Revisited

$
0
0

Interstate 4. It is a unique highway which is cursed by many drivers in Central Florida, and many more who come here in search of rest and relaxation. While Californians raise all highways to royal status — Interstate 5, for one, is referred to as "the five", as if it were some kind of important personage — Floridians just call their central artery I-four. My decision to chronicle I-4 was sparked by a recent experience. Along with my family, I was caught in a traffic jam as we headed east on I-4 outside of Disney World. I have been stuck on this very spot many times. But on this trip, as we sat listening to Janis Joplin, something new happened.

Along this stretch, one can take an off-ramp that runs parallel to the interstate, linking it to one of Central Florida’s toll roads. It travels for a couple miles in close proximity, and is elevated along a ridge of grass about 10 feet above the surface of I-4.

A ditch and a grassy embankment separate the off ramp and the interstate. As we watched, a driver in the right lane of I-4 turned off of the interstate, crossed the shoulder, went down into the ditch, and climbed up onto the parallel road, speeding away and out of the traffic jam. At first, one person did it, and then others followed. And then, about 500 feet ahead, we saw another stream of cars doing the exact same thing. And then, ahead of that stream, yet another stream of drivers drove over the embankment. It wasn't one or two cars, it was dozens and dozens; an en masse sheet flow ripping up the grass. People, fed up with the traffic mess, had taken matters into their own hands. And they were speeding away.

That is a phenomenon I haven’t seen before: collective abandonment of a pathway, even one that is highly discouraging. But then, maybe it's nothing new. I-4 has inspired bizarre and unusual behavior for years.

Back in 2012, I shared some highlights of this unique roadbed. For example, a haunted part lies, perhaps not coincidentally, close to the Cassadaga Spiritualist Camp. Just a couple of weeks ago, a section of the underbrush along the highway's edge was cleared, revealing a hillside cemetery. At the fence line there was newly painted stucco. In this area, I-4 is rumored to have a ghost or two from an early pioneer family that walks along the side of the road. Whether the highway was paved over part of the cemetery or the high-speed rumblings awakened the dead remains to be investigated.

In the 1980s and 1990s, living in Tampa, I actually kept an I-4 log book in the car. Occasionally an incident was worth writing down, but it ended up mostly as an inventory of objects encountered along the interstate:

• About 300 feet ahead of me a cardboard box tumbled off the rear bed of a pickup truck. The rolling, disintegrating contents included a boat chair on a 2 foot tall post and a light with wires flying off of it. I drove right over them. The chair made a very loud clunk.

• In Lakeland, a road crosses over I-4, with a ramp that goes down the embankment and turns abruptly onto I-4, sort of like a driveway. There is no acceleration lane because a railroad bridge abutment is immediately ahead. At this entrance ramp, one late afternoon I was behind a pickup truck without a gate that rolled down the ramp and accelerated quickly to merge into traffic. As it did, a huge, greasy black transmission fell off of the back. The ground shook when it hit, and I heard the thud.

• Malfunction Junction is the intersection of I-4 and I-275 in Tampa. I was travelling south on I-275 heading underneath I-4, driving my parents' 1972 Ford Torino station wagon. This is a tank of a car, all steel with a 302 V-8 engine. I still have dreams about it. I was going perhaps 50 early on a Sunday morning into downtown. Ahead of me by about 6 car lengths was a rusty pickup truck stacked with bales of hay. As the highway ducks under the I-4 bridge, it curves right and it slopes. The pickup was just under the bridge when a bale of hay fell off of it. With no possible reaction time, I plowed right into the hay. The nose of a Torino actually comes to a point, which sliced into the bale of hay, and blew it apart as I drove through, leaving behind a huge, golden-tan cloud. It didn't leave a scratch on the car — only a single hay straw was stuck in the windshield wiper. What stands out about this incident, even today, was that the hay gave no resistance whatsoever: when the car hit it did not shudder or make any noise at all. It was like driving through smoke. Such was the power of the Torino.

These incidents now seem almost archaic; circus sideshows from a bygone era. They are great Florida folk tales, stories of bubbas for after dinner entertainment. The events are faraway both in time and in spirit from the darker forces that haunt our population on the road today.

Those who are here on vacation, trying to relax and enjoy some family time, are tormented by a solid, stopped-up traffic-choked road full of millions of others who have come here to do the exact same thing. People reached a threshold of pain and crossed it, taking matters into their own hands and seeking stress relief during a vacation that was planned as stress relief in the first place. I-4 has become a metaphor for our times.

2009 and 2010 were years that really beat people up. By 2011 and 2012, many had adjusted their expectations and gotten really cynical about the future. Last year, things changed again. For some, the world has gotten worse. For those who were so swiftly unemployed and have become re-employed, the new working conditions are different. They work much harder, for less than before. They face uncertainty every single day, a holdover from the white-knuckled years. The stress wears on the inner compass, and the temptation to cut corners gets greater and greater.

When brazen self-interest spreads like wildfire, a sort of highway mob rule, if you will, I think that we as a society may be on the edge of something new and wild, as if the guardrails of rationality have weakened.

This little incident on Interstate 4 may be isolated, or it might be a symptom of a sea change. People who have been patient and docile have taken a beating over the last several years. We have put up with mental and emotional abuse as we've tried to make the world better for our children. In doing so, we've — mostly — stayed grimly entrenched in the collective good; the shared social values and the rule of law over men.

But when one or two people break off and steer their own course, how quickly many others follow. These are dangerous times, and our inner moral compasses are more important than ever before. We didn't preserve our collective sanity through all of the wicked and sorrowful events of the recent past, only to lose it all now. In the coming year, we must hold on for a little longer, and rebuild moral capital for future generations.

Richard Reep is an architect and artist who has been designing award-winning urban mixed-use and hospitality projects, domestically and internationally, for the last thirty years . He is Adjunct Professor for the Environmental and Growth Studies Department at Rollins College, teaching urban design and sustainable development. His writing has focused on art and architectural criticism, and on localism and its importance in establishing sense of place. He resides in Winter Park, Florida with his family.

Flickr photo by Dean Shareski: Traffic on I-4, Orlando.

How Silicon Valley Could Destabilize The Democratic Party

$
0
0

Much has been written, often with considerable glee, about the worsening divide in the Republican Party between its corporate and Tea Party wings. Yet Democrats may soon face their own schism as a result of the growing power in the party of high-tech business interests.

Gaining the support of tech moguls is a huge win for the Democrats — at least initially. They are not only a huge source of money, they also can provide critical expertise that the Republicans have been far slower to employ. There have always been affluent individuals who backed liberal or Democratic causes, either out of conviction or self-interest, but the tech moguls may be the first large capitalist constituency outside Hollywood to identify almost entirely with the progressives.

This alliance of high tech and Democrats is relatively new. In the 1970s and 1980s the politics of Silicon Valley’s leaders tended more to middle-of-the-road Republican. But the new generation oligarchs are very different from the traditional “propeller heads” who once populated the Valley. More media savvy and less dependent on manufacturing, the new leaders have less interest in the kind of infrastructure and business policies generally favored by more traditional businesses. They also tend to have progressive views on gay marriage and climate change that align with the gospel of the Obama Democratic Party.

In the process, the Bay Area, particularly the Silicon Valley - San Francisco corridor, has become one of the most solidly liberal regions in the country. The leading tech companies, mostly based in the area, send over four-fifths of their contributions to Democratic candidates.

This tech alliance is creating a pool of potential business-tested candidates for the party, including Twitter co-founder Jack Dorsey, who has said he wants to run for mayor of New York someday, even if he now resides in San Francisco.

The tech oligarchs are also poised to reinforce the media dominance enjoyed by the Democrats. Over the past two years we have seen one tech entrepreneur and Obama ally, Chris Hughes, take over the venerable New Republic, while another, Amazon’s Jeff Bezos, bought the Washington Post.More important, pro-Democratic tech firms such as Microsoft, Yahoo and Google now dominate the online news business, while others, such as Netflix and Amazon, are moving aggressively into music, film and television.

Yet for all the advantages of this burgeoning alliance with tech interests, it threatens to create tensions with the party’s traditional base — minorities, labor unions and the public sector — as the party tries accommodate a constituency that combines social liberalism and environmentalist sentiments withvaguely libertarian instincts. The fact that this industry has a pretty awful record on labor and equity issues is something that could prove inconvenient to Democrats seeking to adopt class warfare as their primary tactic.

Indeed, despite its counter-cultural trappings and fashionably progressive leanings, Silicon Valley has turned out to be every bit as cutthroat and greedy as any gaggle of capitalists. Leftist journalists like John Judis may rethink their support for the Valley agenda once they realize that they have become poster children for overweening elite power and outrageous inequality.

Privacy is one issue that should divide liberals from the tech oligarchs. Historically liberals have been on the front line of the battle to protect personal information. But now tech interests have worked hard, with considerable Democratic support, to block privacy protections that would damage their profits in Europe, and closer to home.

Another inevitable flashpoint regards unions, a core progressive constituency. Venture capitalist Mark Andreesen recently declared that “there doesn’t seem to be a role” for unions in the modern economy because people are “marketing themselves and their skills.” Amazon has battled unions not only in the United States, but in more union-friendly Europe as well.

Avatars of equality? Valley boosters speak of the “glorious cocktail of prosperity” they have concocted, but have been very slow to address, or even seek to ameliorate, the vast social chasm that exists under their feet.

Many core employees at firms like Facebook and Google enjoy gourmet meals, childcare services, even complimentary house-cleaning in an effort to create, as one Google executive put it, “the happiest most productive workplace in the world.”  Yet the reality is less pleasant for other workers in customer support or retail, like the Apple stores, and even more so for contracted laborers in security, maintenance and food service jobs.

Indeed over the past decade the Valley itself has grown almost entirely in ways that have benefited the affluent, largely white and Asian professional population. Large tech firms are notoriously skittish about revealing their diversity data, but one recent report found the share of Hispanics and African-Americans, already far below their percentage in the population, declined in the last decade; Hispanics, roughly one quarter of the local workforce, held 5.2% of the jobs at 10 of the Valley’s largest companies in 2008, down from 6.8% in 1999, according to the San Jose Mercury News. The share of women in management also has declined, despite the headlines generated by the rise of high-profile figures like Yahoo’s Marissa Mayer and Facebook’s Sheryl Sandberg.

The mostly male white and Asian top geeks in Palo Alto or San Francisco should celebrate their IPO windfalls, but wages for the region’s African-Americans and Latinos, roughly a third of the local population, have dropped, down 18% for blacks and 5% for Latinos between 2009 and 2011, according to a 2013 Joint Venture Silicon Valley report. Indeed as the Valley has de-industrialized, losing over 80,000 jobs in manufacturing since 2000, some parts of the Valley, notably San Jose, where manufacturing firms were clustered, look more like a Rust Belt city than an exemplar of tech prosperity.

Overall, most new jobs in the Valley pay less than $50,000 annually, according to an analysis by the liberal Center for American Progress, far below what is needed to live a decent life in this ultra-high cost area. Part-time security workers often have no health or retirement benefits, no paid sick leave and no vacation. Much the same applies to janitors, who clean up behind the tech elites.

The poverty rate in Santa Clara County has climbed from 8% in 2001 to 14%, despite the current tech boom; today one out of four people in the San Jose area is underemployed, up from 5% a decade ago. The food stamp population in Santa Clara County has mushroomed from 25,000 a decade ago to almost 125,000. San Jose is also home to the largest homeless camp in the continental U.S., known as “the Jungle.” As Russell Hancock, president of Joint Venture Silicon Valley, admitted: “Silicon Valley is two valleys. There is a valley of haves, and a valley of have-nots.”

These realities suggest that the tech oligarchs, despite their liberal social views, are creating an environment for the “one percent” every bit as stratified as that associated with Wall Street. Google maintains a fleet of private jets at San Jose airport, making enough of a racket to become a nuisance to their working-class neighbors. Google executives tout its green agenda but have burned the equivalent of upwards of tens of millions of gallons of crude oil, which seems somewhat less than consistent.

At the same time, the moguls have a record of tax evasion — a persistent progressive issue — that would turn castigated plutocrats like Mitt Romney green with envy. Individuals like Bill Gates have voiced public support for higher taxes on the rich, yet Microsoft, Facebook and Apple have all saved billions by exploiting the tax code to shelter profits offshoreTwitter’s founders creatively exploited various arcane loopholes to avoid paying taxes on some of the proceeds of their IPO that they set aside for heirs.

The set of differing rules for oligarchs and everyone else extends even to the most personal issues. Yahoo’s Mayer, a former Google executive, banned telecommuting for employees — particularly critical for those unable to house their families anywhere close to ultra-pricey Palo Alto. Yet Mayer, herself pregnant at the time, saw no contradiction in building a nursery in her own office.

This model of economic development seems it would be more appealing to those who believe in “the survival of the fittest” than people with more traditional liberal values. The alliance with tech may well be a critical boon to the progressive cause and its champions for the time being, but at some time even the most deluded progressives will begin to realize with whom they have chosen to share their bed.

This story originally appeared at Forbes.

Joel Kotkin is executive editor of NewGeography.com and Distinguished Presidential Fellow in Urban Futures at Chapman University, and a member of the editorial board of the Orange County Register. He is author of The City: A Global History and The Next Hundred Million: America in 2050. His most recent study, The Rise of Postfamilialism, has been widely discussed and distributed internationally. He lives in Los Angeles, CA.

Official White House Photo by Pete Souza.


The New Geography of Apartment Rentals

$
0
0

“Supply and demand” describes the interaction between the available amount of a resource and the need for it by consumers. In the world of community development, nowhere is this dynamic more pronounced than in the rental housing market.

Recessionary times have combined with barriers to homeowner financing to spark a surge in rental demand within many U.S. cities and regions. At the same time, erosion in worker salaries over the past decade has led to a record number of households devoting a disproportionate amount of their income towards rental payments. An uptick to increase the supply of rental units and keep pace with an escalating demand needs to occur, but instead, there's been slow movement in rental housing construction. Where are we seeing the most profound results of this combination of factors – and how can communities best accommodate the new flood of renters?

According to a study conducted by the Harvard Joint Center for Housing Studies in conjunction with the MacArthur Foundation, participation in the home rental market is at its highest level in more than a decade for all age groups. The US now has 43 million renter households, representing 35 percent of all households. This report also found that housing affordability issues have soared, since nearly half of renters possess annual incomes below $30,000, including 22 percent with incomes below $15,000. More than half of all renters — 21 million households — dole out more than 30 percent of their income for housing. These figures represent the greatest number of cost-burdened renters on record.

The Colorado Front Range and the Bakken Region of North Dakota and Montana are examples of areas where high levels of population growth have led to meteoric shifts in the rental housing markets. Over the last three years or so, the influx of new residents has driven monthly rates to unprecedented heights.

The Front Range refers to the most populous areas of Colorado: cities like Boulder, Fort Collins, Castle Rock, Colorado Springs, and Denver, which have become the primary hotspots for new resident growth. Much of the development there is a result of incoming highly educated workers, who are arriving in droves from California, Ohio, Texas, Florida, and the Dakotas. Denver has had the distinction of being ranked first among U.S. metros for total population gain in the 25-34 age range between 2008 and 2010, and the Census Bureau estimates that by 2020 Metro Denver’s population will soar from 2.9 to 3.2 million.

Northeast of Colorado is a region that has seen explosive growth due to an oil boom, with a population that now includes thousands of migrated workers filling the numerous jobs. This sudden movement to lucrative location is reminiscent of the California gold rush era. According to the U.S. Energy Information Association, oil production in this region is expected to top one million barrels a day by year-end 2013.

The black gold hotspot is the Bakken Region, which extends from parts of North Dakota into Montana, encompassing 12 counties. The Bakken Region has seen its working population swell by 70% since 2010. While the economic trend has been a boost to fortunes, a chronic shortage of living accommodations for transient workers has led to a serious imbalance in the housing supply/demand equilibrium. The result: home and rental housing costs that boggle the mind and terrify the wallet, sending many arriving workers into hysterics as they try to find a place to rest their heads at night. There is frequent talk of workers that are forced to live in their cars while earning $100,000 a year. Trailer parking spots can be found for rates that have escalated to $800 a month, and hotel prices are even higher; a one-night stay can be $300, or even more.

The operative question for city leaders and planners in these regions is how to build large swaths of new housing without the supporting infrastructure to accommodate the expansion. Michael Leccese, Executive director of Urban Land Institute Colorado (ULI), notes that during the recession the area's boom in apartment living has played a crucial role in keeping real estate development afloat. “The pace of apartment construction has provided needed housing for the region’s growing population of Millennials, as well as for empty nesters and those shut out of the for-sale market for whatever reason,” says Leccese. “Many of these apartments have been constructed in walkable, urban infill and transit-accessible locations, and often feature innovative, green building designs.”

The massive push to expand housing supply has raised the question of whether the market is being overcorrected to the point that supply will exceed demand. As construction begins on more and yet more new apartment buildings, will the Front Range and the Bakken Region continue to see the massive growth that has characterized the last few years?

Leccese asserts, “There is no doubt that we are seeing some concern on the part of our ULI members in terms of this overbuilding, as well as the lack of diversity in product type and price point. Some are, in fact, wondering whether this might be the new housing bubble.” If growth does slow, this will mean good news for renters, who will likely see more affordable rental rates. For rental housing companies, however, it would not be a call for celebration.

Along with the Colorado Front Range and the Bakken Region, cities throughout the nation with growing populations will be facing similar challenges as they strive to insure an appropriate supply of reasonably priced rentals to accommodate regional housing needs. The issue shows no sign of abating in cities and regions possessing rich harvests of jobs that attract new entrants to their area.

Age and cultural demographics also factor in. It's estimated that the number of renters 65 and older will increase by 2.2 million between 2013 and 2023. Hispanics are also projected to account for a substantial share of renter growth over this period.

Addressing this issue will require thoughtful decision-making based on sound information about demographic shifts and job availability — and a firm understanding of trends in regional supply and demand.

Michael Scott is a writer, speaker and researcher specializing on the interconnection between people and their community environments. He can be reached at urbanvisionary@gmail.com

Flickr Photo by Sam Mooney - Rental Sign: Are cheap rents soon to be history?

Build It, Even Though They Won't Come

$
0
0

The recent decision by Los Angeles County Superior Court Judge Allan J. Goodman to reject as “fatally flawed” the densification plans for downtown Hollywood could shake the foundations of California's “smart growth” planning clerisy. By dismissing Los Angeles' Hollywood plan, the judge also assaulted the logic behind plans throughout the region to construct substantial high-rise development in “transit-oriented developments” adjacent to rail stations.

In particular, the judge excoriated the buoyant population-growth projections used to justify the plan, a rationalization for major densification elsewhere in the state. The mythology is that people are still flocking to Los Angeles, and particularly, to dense urban areas, creating a demand for high-end, high-rise housing.

The Hollywood plan rested on city estimates provided by the Southern California Association of Governments, which estimated that Hollywood's population was 200,000 in 2000 and 224,000 in 2005, and would thus rise to 250,000 by 2030. All this despite the fact that, according to the census, Hollywood's population over the past decade has actually declined, from 213,000 in 1990 to 198,000 today. Not one to mince words, Judge Goodman described SCAG's estimates as “entirely discredited.”

This discrepancy is not just a problem in the case of Hollywood; SCAG has been producing fanciful figures for years. In 1993, SCAG projected that the city of Los Angeles would reach a population of 4.3 million by 2010. SCAG's predicted increase of more than 800,000 residents materialized as a little more than 300,000. For the entire region, the 2008 estimates were off by an astounding 1.4 million people.

Similar erroneous estimates run through the state planning process. In 2007, California's official population projection agency, the Department of Finance, forecast that Los Angeles County would reach 10.5 million residents in just three years. But the 2010 U.S. Census counted 9.8 million residents.

Such inflated estimates, however, do serve as the basis for pushing through densification strategies favored by planners and their developer allies. In fact, SCAG's brethren at the Association of Bay Area Governments, seeking to justify their ultradense development plan, recently went beyond even population estimates issued by the Department of Finance.

The problem here is not that some developers may lose money on projects for which there is inadequate demand, but that this densification approach has replaced business development as an economic strategy. Equally bad, these policies often threaten the character of classic, already-dense urban neighborhoods, like Hollywood. Indeed, the Los Angeles urban area is already the densest in the United States, and a major increase in density is sure to further worsen congestion.

Not surprisingly, some 40 neighborhood associations and six neighborhood councils organized against the city's Hollywood plan. Their case against the preoccupation with “transit-oriented development” rests solidly on historical patterns. Unlike in New York City, much of which was built primarily before the automobile age, Los Angeles has remained a car-dominated city, with roughly one-fifth Gotham's level of mass-transit use. Despite $8 billion invested in rail lines the past two decades, there has been no significant increase in L.A.'s transit ridership share since before the rail expansion began.

The Hollywood plan is part of yet another effort to reshape Los Angeles into a West Coast version of New York, replacing a largely low-rise environment with something former Mayor Antonio Villaraigosa liked to call “elegant density.” As a councilman, new Mayor Eric Garcetti proclaimed a high-rise Hollywood as “a template for a new Los Angeles,” even if many Angelenos, as evidenced by the opposition of the neighborhood councils, seem less than thrilled with the prospect.

If the “smart growth” advocates get their way, Hollywood's predicament will become a citywide, even regional, norm. The city has unveiled plans to strip many single-family districts of their present zoning status, as part of “a wholesale revision” of the city's planning code. Newly proposed regulations may allow construction of rental units in what are now back yards and high-density housing close to what are now quiet residential neighborhoods.

“They want to turn this into something like East Germany; it has nothing to do with the market,” suggests Richard Abrams, a 40-year resident of Hollywood and a leader of Savehollywood.org. “This is all part of an attempt to worsen the quality of life – to leave us without back yards and with monumental traffic.”

Of course, it is easy to dismiss community groups as NIMBYs, particularly when it's not your neighborhood being affected. But here, the economics, too, make little sense. New, massive “luxury” high-rise residential buildings were not a material factor in the huge density increases that made the Los Angeles urban area more dense than anywhere else in the nation during the second half of the 20th century. Even in New York City, the high-rise residential buildings where the most affluent live are concentrated in the lower half of Manhattan; they house not even 20 percent of the city's population.

Under any circumstances, the era of rapid growth is well behind us. In the 1980s, the population of Los Angeles grew by 18 percent; in the past decade, growth was only one-fifth as high. Growth in the core areas, including downtown, overall was barely 0.7 percent, while the population continued to expand more rapidly on the city's periphery. Overall, the city of Los Angeles grew during the past decade at one-third the national rate. This stems both from sustained domestic outmigration losses of 1.1 million in Los Angeles County and immigration rates that have fallen from roughly 70,000 annually in the previous decade to 40,000 a year at present.

Nor can L.A. expect much of a huge infusion of the urban young talent, a cohort said to prefer high-density locales. In a recent study of demographic trends since 2007, L.A. ranked 31st as a place for people aged 20-34, behind such hot spots as Milwaukee, Oklahoma City and Philadelphia. It does even worse, 47th among metro areas, with people ages 35-49, the group with the highest earnings.

In reality, there is no crying need for more ultradense luxury housing – what this area needs more is housing for its huge poor and working-class populations. More important, we should look, instead, at why our demographics are sagging so badly. The answer here, to borrow the famous Clinton campaign slogan: It's the economy, stupid. In contrast with areas like Houston, where dense development is flourishing along with that on the city's periphery, Southern California consistently lands near the bottom of the list for GDP, income and job growth, barely above places like Detroit, Cleveland or, for that matter, Las Vegas.

Despite many assertions to the contrary, densification alone does not solve these fundamental problems. The heavily subsidized resurgence of downtown Los Angeles, for example, has hardly stemmed the region's relative decline.

Instead of pushing dense housing as an economic panacea, perhaps Mayor Garcetti should focus on why the regional economy is steadily falling so far behind other parts of the nation. One place to start that examination would be with removing the regulatory restraints that chase potential jobs and businesses – particularly better-paying, middle class ones – out of the region. It should also reconsider how the “smart growth” planning policies have helped increase the price of housing, particularly for single-family homes, preferred by most families.

At the same time, the mayor and other regional leaders should realize that L.A.'s revival depends on retaining the very attributes – trees, low-rise density, sunshine, as well as entrepreneurial opportunity – that long have attracted people. People generally do not migrate to Los Angeles to live as they would in New York or Chicago. Indeed, Illinois' Cook County (Chicago) and three New York City boroughs – Manhattan, Queens and Brooklyn – are among the few areas from which L.A. County is gaining population. Where are Angelinos headed? To relatively lower-density places, such as Riverside-San Bernardino, Phoenix and Houston.

Under these circumstances, pushing for more luxury high-rises seems akin to creating structures for which there is little discernible market. Once demographic and economic growth has been restored broadly, it is possible that a stronger demand for higher-density housing may emerge naturally. Until then, the higher density associated with “smart growth” neither addresses our fundamental problems, nor turns out to be very smart at all.

This story originally appeared at The Orange County Register.

Joel Kotkin is executive editor of NewGeography.com and Distinguished Presidential Fellow in Urban Futures at Chapman University, and a member of the editorial board of the Orange County Register. He is author of The City: A Global History and The Next Hundred Million: America in 2050. His most recent study, The Rise of Postfamilialism, has been widely discussed and distributed internationally. He lives in Los Angeles, CA.

How Houston’s Missing Media Gene Hobbles Its Global City Ambitions

$
0
0

In an upcoming study I am working on with Chapman University’s Center for Demographics and Policy, we show that San Francisco and Houston are North America’s “emerging” global cities. They are also rival representative champions and exemplars of two models of civic development. San Francisco is the world’s technology capital; focused on the highest levels of the economic food chain; paragon of the new, intangible economy; and promoter environmental values and compact development.  Houston is the closest thing to American laissez-faire; unabashed embracer of the old economy of tangible stuff, including unfashionable, but highly profitable, industries like oil, chemicals, and shipping.

San Francisco embraces development restrictions that it sees as environmentally sustainable --- and not coincidentally produced the highest housing costs compared to income in the nation, rendering the region affordable to all but the elite --- whereas Houston has risen as an “opportunity city” for the non-elite; and the land of no-zoning and unrestricted development.  Somewhat unexpectedly, both cities are remarkably socially tolerant. Houston has an openly lesbian Democratic mayor and is extremely diverse, and while San Francisco may be a bit more free wheeling with its Folsom Street Fair and such, it’s also more strictly enforces its intellectual and political orthodoxy.

Yet to date the competition between these two emerging models has been non-existent, at least from Houston’s perspective. Simply put, the Bay Area has played its hand brilliantly, and is lavished with praise in the media. In contrast Houston seems to be missing the self-promotion gene, at least outside what it has to pay for with advertising. The Bay Area has built its own image, often with the avid support of journalists who grant tech moguls demi-god status, and understandably prefer San Francisco’s spectacular scenery, mild weather and world-class restaurants to flat, steamy Houston, whose exciting food scene is typically housed in nondescript strip malls.

In conventional (that is New York or London) terms it’s easy to see San Francisco as a global capital. It has long been established as an elite national center, the financial capital of the West Coast, as well as the traditional center, along with parts of New York, of the American counter-culture. With the comparative decline of Los Angeles, the Bay Area reigns supreme on the west coast. Its technology industry strides the globe like a colossus, its tech titans have managed, at least to date, to play simultaneously the roles of both modern day robber barons and populist heroes.

Houston is less obvious. Though the energy capital of the world, Houston is still emerging as a prominent national and global city. It’s less mature, and was a small, obscure city when San Francisco was already emerging as the uncontested capital of the west coast.  And unlike San Francisco, whose only real rival is much smaller Seattle, Houston competes with an equally large, and in many ways also rising rival in Dallas-Ft. Worth.

Unlike tech, energy has produced few rockstars, but many who are castigated as demons. Although there are 5,000 energy companies and 26 Fortune 500 headquarters in Houston, few of its leaders have achieved public prominence apart from Dick Cheney and Enron’s Ray Skilling and Ken Lay --- not exactly folk heroes.

This is not to say some energy people don’t deserve celebration. For example, few Americans noticed the recent death of George Mitchell, the father of the fracking revolution that has driven America’s greenhouse gas emissions down at the fastest rate in the world, and one of America’s premier developers of master planned developments in the form of The Woodlands near Houston. The Economist said of this son of poor Greek immigrants, “Few businesspeople have done as much to change the world as George Mitchell.”  (Most people hearing the name would probably think of former Maine Senator George Mitchell).

The maturity curve alone isn’t enough to account for the difference. Two additional factors are at work. First, the Bay Area self-consciously sees itself as a leader and moral exemplar. It wants to world to follow where it leads. Houston it seems, perhaps in line with its laissez-faire approach, wants to leave others alone, and be left to its own.  It may boast of having a great model, but whether others adopt has been of no particularly great local concern.

The second big divergence relates to media. After all, the media, understood broadly, is how we come to have knowledge about or opinions of many things. Simply put, San Francisco and the tech industry get the power of media, while Houston doesn’t.

The content creators may still prefer a New York, LA, or DC but the tech moguls are circling the last redoubts of entertainment and information.   Apple now has a dominant position in content distribution for music and is expanding in other areas.  Google generates huge advertising revenues that are greater than the entire newspaper and magazine industry.  Despite its many troubles, Yahoo remains one of the most-visited news sites. Meanwhile in just last year or two, Facebook co-founder Chris Hughes has bought the venerable New Republic while Seattle’s Jeff Bezos  recently bought the Washington Post. Pierre Omidyar, founder of Ebay, recently announced a $250 million new media venture featuring Glenn Greenwald and other well-known leftist media types.

This isn’t just hubris, it’s good business. With Silicon Valley magnates starting to come under the same scrutiny as their 1% peers in other industries, it pays to have the means to control the narrative. Glenn Greenwald helped break the story on NSA snooping, but now that he’s on Silicon Valley’s payroll, how likely is it that he’ll take a similarly tough line on tech company privacy matters?  Give the Bay Area/tech crowd their due – they know what they are doing.

Houston, by contrast, has close to zero media influence or impact and seems not to care. It’s much less an influencer of media than one whose reputation has been shaped by it, and often not in a good way. Though there are many sprawl dominated metropolises in America, it’s Houston that has become the bête noire of urbanists.

It’s easy to understand historically why Houston has so little media influence, but harder to understand why the city is so blasé about it.  Tory Gattis, a former McKinsey consultant and local Houston blogger, suggests that it has to do with the DNA of the energy industry.  Most energy companies in Houston are B2B operations, so have little need for mass media. Energy has always been a political game and the industry’s approach has been a fairly direct one: employ a phalanx of lobbyists and former politicians around the world to help secure deals.  Also, unlike with the latest smart phone or social media app, you don’t need to convince anybody to fill up his gas tank or turn on his furnace in the winter.  The product is already completely understood by the end customer and literally sells itself.

This mindset explains why the city has a blind spot, a missing gene if you will, that keeps it from understanding the necessity of having a robust media presence as part of its ambition to become a true global city. The Bay Area tech community may have been slow to the party when it comes to lobbying, but they are spending big to catch up fast and many of their executives have political as well as media aspirations. But despite its incredible wealth and surfeit of billionaires, Houston is absolute nowhere when it comes to media or thought leadership, and seems indifferent to the fact.

Beyond merely asserting a role on the stage, getting in the media game is critical to the survival of Houston and its model.  The Bay Area sees itself as a model for a future America and world. It is spending big, lobbying big, and invading politics to create the kind of future it wants to see. Its mindset is to dominate.

Houston may be content to let San Francisco go its own way but the reverse does not hold.  Silicon Valley has its sights set on overturning the fossil fuel industry through big investments (and good ol’ government pork) in green tech companies. Legal mandates that favor their investments are popular. It should be no surprise that folks like Bay Area billionaire Thomas Steyer have been vocal opponents of the KeystoneXL pipeline. (Such opposition is not uniform. Mark Zuckerberg’s Fwd.us organization supports KeystoneXL. But there’s clearly a lot of Silicon Valley support for policies that aren’t great for the Houston model).

Houston can brag all its wants about its legitimate accomplishments in important areas like job and population growth and in providing middle-class opportunity. But if it wants to claim the mantle of global city, or even just head off threats to its way of doing business, it needs, like the Bay Area, to self-consciously stake out the role of leader.  For starters, that means putting its bigtime financial and intellectual muscle behind getting its message out. That means, like it or not, investing not only in oil wells, but inkwells.

Aaron M. Renn is an independent writer on urban affairs and the founder of Telestrian, a data analysis and mapping tool. He writes at The Urbanophile.

Photo by telwink.

Britain's Planning Laws: Of Houses, Chickens and Poverty

$
0
0

Perhaps for the first time in nearly seven decades a serious debate on housing affordability appears to be developing in the United Kingdom. There is no more appropriate location for such an exchange, given that it was the urban containment policies of the Town and Country Planning Act of 1947 that helped drive Britain's prices through the roof. Further, massive damage has been done in countries where these polices were adopted, such as in Australia and New Zealand (now scurrying to reverse things) as well as metropolitan areas from Vancouver to San Francisco, Dublin, and Seoul.

A healthy competition has developed between the Conservative-Liberal Democrat coalition and the Labour Party to finally address the problem of the resulting land and housing shortage that has driven prices up so much relative to incomes.

It probably helps that public opinion seems to be changing. A recent MORI poll found that 57 percent of respondents considered rising house prices to be a bad thing for Britain, compared to only 20 percent who though it a good thing.

It has been more than a decade since Kate Barker, then a member of the Monetary Policy Committee of the Bank of England (the central bank) was commissioned by the Blair Labor government to examine the issues. Her conclusions were clear. Britain has a serious housing affordability problem and its restrictive land use policies were the cause. These higher housing costs, the largest element or household expenditure have reduced the standard of living and increased poverty beyond what would have occurred if urban containment regulation had not destabilized house prices. The Economist notes that home ownership is falling and that the number of couples with children who are renting has tripled since the late 1990s.

Planning and Chickens

This week, The Economist weighed into the debate (Britain’s planning laws: An Englishman’s home):

"Now that the economy is at last growing again, the burning issue in Britain is the cost of living. Prices have outstripped wages for the past six years. Politicians have duly harried energy companies to cut their bills, and flirted with raising the minimum wage. But the thing that is really out of control is the cost of housing. In the past year wages have risen by 1%; property prices are up by 8.4%. This is merely the latest in a long surge. If since 1971 the price of groceries had risen as steeply as the cost of housing, a chicken would cost £51 ($83)."

For those of us unfamiliar with the cost of chicken in British hypermarkets, The Daily Mail says it is about £2 ($3). Indeed, even the chicken industry suffers, as planning restrictions  are getting in the way of adding the chicken farms Britain requires.

Moreover, the high costs cited by The Economist are after the house prices increases that had already occurred by 1970. Even then, before such inflationary pressures were seen elsewhere, Sir Peter Hall characterized soaring land and house prices as the biggest failure of the 1947 Act. Hall had led a major research effort on the subject, which produced a two-volume work, The  Containment of Urban England (See The Costs of Smart Growth Revisited: A 40 Year Perspective).

From Affordable to Unaffordable

While the historic relationship between household incomes and house prices (the "median multiple") was under 3.0 across the United Kingdom as late as the 1990s, it has now deteriorated to more than 7.0 inside the London Greenbelt. Unbelievably it has risen to elevated levels even in the less prosperous the north of England. For example, depressed Liverpool has a median multiple over 5.0, which is 60 percent above the maximum historic range and making the metropolitan area "severely unaffordable." Liverpool is probably best compared to Cleveland in the United States for its economic distress.

The shortage of housing in Britain has become acute. There are additional concerns that the globalization of housing markets has hit London particularly hard and is driving households out of the housing market.

More Money, Less House

Through all of this, Briton's are getting less for their money. Since 1920, the average size of a new large family house has been reduced 30 percent. Semi-detached houses are 44 percent smaller and townhouses (terrace housing) is 37 percent smaller (Figure 1). Britain now has some of the smallest new housing in the world. The average new house in continental Europe is 50% or more larger than in England and Wales. New houses are two to three times as large in Canada, New Zealand, Australia and the United States (Note 1). In some US cities, residents can build "granny flats" which are larger than new houses in Britain. For example, San Diego's limit for granny flats of 850 square feet exceeds Britain's average new house size of 818 square feet.

Paving Over Ohio?

Of course, those who see urban expansion (the theological term is "sprawl") as ultimate evil imagine an England and Wales being literally paved over by allowing people to live as they prefer. They need not worry.

For example, England and Wales is less crowded than spacious Ohio, with its rolling hills and extensive farmland. According to the 2011 census, only 9.6% of the land in England and Wales is urban, the other 90.4% is rural. In Ohio, on the other hand, 10.8% of the land is urban and only 89.2% of the land is rural. Even the state of Georgia, with the least dense large urban area in the world, Atlanta, has roughly as much rural land (91.7 percent) as England and Wales (Figure 3).

Every Gram is Sacred?

Originally, urban containment was justified on social and aesthetic grounds. However, curbing greenhouse gases is now used as the raison d’etre for highly restrictive housing policies. Urban policy in England and Wales and elsewhere has been hijacked by a philosophy that any gram of greenhouse gas that can be reduced must be, regardless of its impact on society, the economy, the standard of living or poverty.

One of the worst conceivable strategies for reducing greenhouse gas emissions is to waste money on costly and ineffective measures. The Intergovernmental Panel on Climate Change (IPCC) has indicated that sufficient reductions in greenhouse gas emissions can be achieved for a range of from $20 to $50 per ton. Urban containment policy cannot deliver for this price. In contrast, improving automobile fuel efficiency is forecast improve greenhouse gas emissions, even as driving continues to rise with a growing population (see Urban Planning for People). In addition, the higher house prices associated with urban containment policy are well beyond the IPCC range.

No program can produce substantial greenhouse gas emission reductions that does not focus on higher value strategies. Urban containment has no high value strategies.

Planning, People and Poverty

Britain's land policy competition between the political parties is long overdue. Coalition Communities Secretary Eric Pickles, decries "the way families are trapped in ‘rabbit hutch homes’." The Labour Party opposition has promised that, if elected in 2015, steps will be taken to increase land supply and housing affordability, so that "working people and their children" have the "decent homes they deserve."

The Economist states the issue squarely:

"Building on fields in a country that is as crowded as England will always rile some people, however well-designed the system. But the alternative is worse: a nation of renters and rentiers, where only the rich own houses."

-----------------

Note 1: As Figure 2 indicates, Hong Kong housing is considerably smaller than that of England and Wales. Hong Kong really is the ultimate smart growth or urban containment city. It has the highest urban population density in the high income world. It has the highest share of its commuters using mass transit to get to work. Its traffic congestion is intense. And, predictably, it has the highest house prices relative to incomes yet documented in the high income world.

We need to be spared the "sun rises in the west" economic studies claiming that somehow the laws of economics, that work so relentlessly to drive up prices where supplies are constrained in other industries (such as petroleum, corn, etc.) have no effect on land and housing.

Wendell Cox is a Visiting Professor, Conservatoire National des Arts et Metiers, Paris and the author of “War on the Dream: How Anti-Sprawl Policy Threatens the Quality of Life.

Photo: St. Pancras Station (London), by author

Female Executives Across the European Union

$
0
0

A great divide exists between European countries when it comes to the issues of women’s career opportunities. Some countries have high female work participation and values that promote gender equality, while others lag behind. But a closer look shows that the share of women in managerial positions is in odds with other indicators of equality. Scandinavia, where we might expect to find most female directors and chief executives, has in fact the lowest share. Many more women have reached the top of the business sector in countries with relatively low female labor participation, and far from gender equal attitudes. Other factors, such as the scope of welfare state monopolies and hours invested in work, seem to crucially affect women’s chances to reaching the top of the business world.

The European Union has set the goal to achieve an employment level of 75 percent amongst women. So far, only Sweden exceeds this ambition with an employment level of fully 77 percent. Denmark, Finland, the Netherlands, Germany and Austria follow closely behind. In these five countries seven out of ten women working age are employed. It doesn’t seem a coincidence that these northern European nations share similar cultural and political attributes. The expansion of welfare states has historically encouraged womens’ entry into the workforce. Still today public childcare encourages women to invest time at work, whilst high taxes make it difficult to live on only one salary.

Overall, the Eastern- and Central European countries have a lower share of women working, since it is more common with housewives. The three former Soviet states Estonia, Lithuania and Latvia are in particular interesting to look at. Not only are they Eastern European, and strongly committed to low taxes and free markets, but they also share Nordic cultural attributes. The three Baltic states have a respectably high level of two thirds of women in employment. This is somewhat higher than the European average, and considerably more so than in parts of Southern Europe. In Malta and Greece, fewer than half of the women work. In Italy exactly half of them do.

Northern and Western European countries also tend to have more equal gender attitudes. A special edition of the Eurobarometer has focused on the issue of women in decision-making positions. One key indicator is how many disagree with the statement “women are less interested than men in positions of responsibility”. Sweden again stands out, with 84 percent of the public disagreeing with this notion. Although culturally and politically similar Denmark is found at the other end, with only 49 percent disagreeing with this idea, the overall trend is clear. The general publics in Nordic and Western European countries more strongly reject the notion that women are less interested in reaching positions of responsibility while Southern-, Eastern-, and Central European countries are found at the opposite end of the spectrum.

We would expect to find many more women in top positions in the egalitarian Nordic nations, as well as Germany, the Netherlands and other similar countries. And indeed we do. At least when it comes to politics, the public sector and company boards. All too often the analysis stops here. But it is important to realize that representation on boards is a poor measure of women’s progress in the private sector of many European countries. Many boards in Nordic nations for example have relatively formal roles, meeting a few times a year to supervise the work of the management. The select few who end up on the boards – many of whom reach this position after careers in politics, academics and other non-business sectors – enjoy prestigious jobs.  They are however not representative of those taking the main decisions in the business sector. The latter role falls on executives and directors. Public sector managers tend to have less overall power, working within the scope of large bureaucratic structures.

Chief executives and directors in the private sector are responsible for taking much of the crucial decisions in the business world. One typically only reaches a high managerial position after having worked hard in a certain sector, or successfully started or expanded a firm as an entrepreneur. The share of women reaching this position is a good proxy of women’s opportunities in the business world as a whole.

Astonishingly, the data show that the gender equal Nordic nations all have lower levels of women at the top of businesses than their less progressive counterparts. In Sweden and Denmark, only one out of ten directors and chief executives in the business world are women. Finland and the UK, two other nations with large public sector monopolies, fare only slightly better.

In contrast, in the average Eastern- and Central European country fully 32 percent of the directors and chief executives are women. This can be compared to 21 percent in Western European countries, 17 percent in Southern European nations and merely 13 percent in the otherwise egalitarian Nordic nations. In Bulgaria, with lower than EU-average levels of female work participation, and not a bastion of egalitarian attitudes, women fill almost half the positions.

It should be noted that other measures of the share of women at top of businesses supports this general trend. Eurostat for example also publishes a broader measure of business leaders, including also middle-managers. In the Baltics Estonia has the lowest share of women in these positions, 36 percent. Lithuania and Latvia fare better with 39 and 45 percent respectively. In Sweden the share is 35 percent and in Denmark 28 percent. Based on interviews with 6 500 companies around the world, the firm Grant Thornton estimates that around four out of ten managers in the three Baltic nations are female, compared with around a quarter in the Nordic nations. The overall picture is clear: fewer women in the Nordic nations reach the position of business leaders, and even fewer manage to climb to the very top positions of directors and chief executives.

How can egalitarian Nordic countries, in most regards world leaders in gender equality, have the lowest rates of female directors and chief executives, whilst the nations in Eastern- and Central Europe are leaders in the same regard? I have previously touched upon this perhaps unexpected relation in the Swedish book “Att Spräcka Glastaken” (Breaking the glass window), a short report in English co-authored with Elina Lepomäki for Finnish think tank Libera and also in a column for the New Geography.

Key here is the nature of the welfare state. In Scandinavia  female dominated sectors such as health care and education are mainly run by the public sector. The lack of competition has not only reduced the overall pay, but also lead to a situation where individual hard work is not rewarded significantly (wages are flat and wage rises follow seniority, according to labour union contracts, rather than individual achievement). Some opportunities for entrepreneurship do exist, as private competition has been allowed in particularly the Swedish welfare sector in recent years. But overall, the Nordic political systems still create a situation for many women where their job prospects are mainly   limited to the public sector . Women in Scandinavia can of course become managers within the public sector, but their wages and influence in these positions are typically more limited compared to in private enterprises.

The former planned economies in Eastern- and Central Europe are well behind in terms of female employment and attitudes. But they have also since the times of socialist economies had systems where women who are employed work almost as many hours as the men. During recent years the nations have transitioned to market economies, in many regards more free-market systems than in other European countries. Employed women have continued to invest heavily in their workplaces in the former planned economies.

The situation is quite different in the Nordic welfare states, where high taxes and public benefits create incentives for women to work, but often to work relatively few hours. For example 10 percent of the employed women in Latvia and Lithuania, and 14 percent in Estonia, work part time. In Sweden, the share is fully 41 percent. To put it differently, the average employed man in the Scandinavia works between 16 percent (Finland) and 27 percent (Norway) hours more than the average woman. In Lithuania the same gap is 13 percent, and in Latvia and Estonia merely 7 percent. Bulgaria is unique as the only European Union nation where women actually work more (1 percent more) hours than men. Women in Eastern- and Central Europe reach managerial positions by working hard and, contrary to the men, staying away from alcohol and other social ills.

To reach the top of the business world, high employment and gender equal values are not enough. These factors must be complemented with political structures that allow for competition and entrepreneurship, as well as systems where women in their careers are encouraged to invest the time needed to climb the career ladder. It is quite telling that the Baltic nations, as well as other Eastern- and Central European countries, manage to outperform the rest of Europe in their share of female directors and chief executives. They do so by having systems with limited public monopolies and smaller differences between hours worked by men and women. It is equally telling that the Nordic nations underperform in the same regard, as their Social Democratic systems encourage many women to work, but hinder them from reaching the top of the business world. The map of gender equality in Europe is more complex than it might appear at a first glance.

Dr. Nima Sanandaji has written two books about women’s carreer opportunities in Sweden, and has recently published the report “The Equality Dilemma” for Finnish think-tank Libera.

The Divisions In The One Percent And The Class Warfare That Will Shape Election 2014

$
0
0

There’s general agreement that inequality will be the big issue of this election year. But to understand how this will play out you have to go well beyond the simplistic “one percent” against everyone else mantra that has to date defined discussion of inequality.

Instead our politics increasingly are being shaped by a complex interplay of class interests across the electorate; class, not merely inequality, is emerging as the driving force of our politics. As Marx among others recognized, class structures can be complicated and contain many separate tendencies. For example, even the much-discussed “one percent” is hardly a cohesive group, but one deeply divided in ideology, geography and industry.

For example, out of the 20 richest Americans on the 2013 Forbes 400 list, six have a record of favoring the Democrats in political donations, including the top two, Bill Gates and Warren Buffett. Eleven reliably back Republican candidates and causes, while Google founder Larry Page has only donated to his company’s PAC, Larry Ellison has funded both sides and Michael Bloomberg defies easy categorization.

All three of the top individual political contributors last year— the Soros family, Jets owner Fred Wilpon and Facebook co-founder Sean Parker — also lean to the “party of the people.”

The Democrats’ new and ascendant oligarchy, based in Silicon Valley, Hollywood, Wall Street and the media, are generally concentrated in the country’s most unaffordable cities, places with high degrees of inequality.

This alliance is based not solely on attitude, but also sometimes self-interest. Hedge funds siphon up money from public pension funds desperate for the large gains necessary to meet the extravagant, unfunded benefits increases of Democratic politicians. Venture capitalists and companies and core Democratic supporters invest in “green” technology, made profitable largely by mandates, subsidies and government-backed loans.

These oligarchs represent very different interests than the more traditional plutocracy, based largely in such mainstream endeavors as fossil fuel energy, agribusiness, manufacturing and suburban home development. These worthies, too, are obviously not slum-dwellers, but also live in more dispersed locations such as Houston, Dallas-Fort Worth, Atlanta, Oklahoma City and a host of much more obscure places, at least part of the time. They reflect the somewhat more conservative, fiscally particularly, world view of the broader 1% than their more left-leaning counterparts.

With the power of money and access to media (particularly the new oligarchs), the two competing factions of the “one percent” will pour millions into trying to win over the other classes. The two key ones are what I call the yeomanry — the small property-owning, private-sector middle class — and America’s modern-day “clerisy”: university professors and administrators, government bureaucrats and those business interests tied closest to the governmental teat.

One can expect with fair assurance that the clerisy will strongly support the president and the progressive wing of the Democratic Party. There are few groups as lock-step liberal as the universities, particularly the most important and influential ones. In 2012, A remarkable 96 percent of all donations from Ivy League employees went to the president, something more reminiscent of Soviet Russia than a properly functioning pluralistic academy. Public employee unions, charter members of the clerisy, have been among the biggest contributors to federal candidates, overwhelmingly Democrats over the past decade.

Less certain are the political leanings of the yeomanry. These are not the people who generally benefit from the expansion of government; they are basically stuck being taxpayers. Their distaste for regulation varies, but is most strongly felt when it impacts their businesses or their communities. In 2008, rightfully disgusted by the failures of the Bush administration, they were divided, but in 2012 small business shifted decisively to the right— not enough to save the awful Romney campaign, but they still helped maintain the GOP majority in the House.

The political calculus of the yeomanry, however, is very complex. Those who are older, and those who already own property, are likely to keep shifting toward the right, as long as the Republican lunatic fringe is kept under control. Obamacare taxes and the cancellations of individual insurance plans hit this group directly in the bottom line, and may do so even more in the future. But for younger members of this group, struggling to buy property or launch proper careers, may look to Washington to provide their health care and provide breaks on their student loans.

Arguably the yeomanry will determine the winners in 2014. The big issue here may be over expectations for the future. Today there are many, on both right and left, who are telling the yeomanry that their day in the sun is over. Tyler Cowen suggests in the future “the average” skilled worker can expect to subsist on rice and beans. If they stay on the East or West Coast, they also may never be able to buy a house. On the left, particularly among greens and urban aesthetes, the message is not so different except they tend to think abandoning property ownership is a good thing, since multi-unit rental housing is more environmental friendly and communal.

Sadly many member of the yeoman class — the vast majority of Americans today — believe that the pessimists are correct, and expect their children, will fare worse in the future. If they accept this conclusion, they may be tempted to join the third of Americans who consider themselves “lower” class. With increasingly little prospect of upward mobility, these voters understandably look to Washington and state capitals to redistribute wealth up to them.

How this class politics plays out this year will determine the 2014 results, and likely politics for the generation to come. Oligarchs favoring Republicans will focus on how redistribution takes from the yeomanry to give to the poor and associated crony capitalists. The failings of Obamacare, the rise in taxes and regulations all play to their advantage. This will play well with the income categories– $50,000 to $200,000 annually — that now constitute the class base of the GOP.

In opposition, the new oligarchs, and their allies in the clerisy, will seek to convince enough of the yeoman class that they need the government to enjoy anything like a middle-class life. The Obama cartoon The Life of Julia, with its emphasis on the helping hand of government , is not directed at the poor but what used to be an upwardly mobile class. Julia implicitly rejects traditional American middle-class values such as property ownership, marriage and family and embraces a new vision tied to growing dependency to both the Democratic Party and the state.

Sadly, neither of these approaches addresses the key issue: weak economic growth and a decline in upward mobility. Republicans, in particular, do not tend to associate these things. They seem to believe that faster GDP growth will rebalance our inequality, or at least make it palatable. This misses the fact that we have just gone through one of the most unequal recoveries in history, accelerating the concentration of wealth in ever fewer hands. Growth, clearly, is not enough; what kind of growth must be part of the discussion.

This perspective is critical if we are to address our class divide. Simply put we need to go beyond both “trickle down” economics — which both sets of oligarchs are understandably fine with — and a redistributionist approach, something that strengthens the hand of the clerisy and the politically connected at the expense of the yeomanry. What we need is something that combines largely free-market, libertarian economics with something like the traditional goal of social democracy.

“We can have democracy in this country, or we can have great wealth concentrated in the hands of a few,” noted Justice Louis Brandeis,“but we can’t have both.” Over time, even conservatives and libertarians have to recognize that a republic irrevocably divided between the rich and the dependent poor can not turn out well. And for their part, progressives need to realize that the middle class can not be expected to serve as a piggy bank to assuage their delicate consciousness.

The real issue before us is not inequality per se, but how to spread the ownership of property and improve opportunity; without this America devolves from the world’s exemplar into a second-rate Europe, with less charm, more division, and a national dream finally extinguished.

This story originally appeared at Forbes.com.

Joel Kotkin is executive editor of NewGeography.com and Distinguished Presidential Fellow in Urban Futures at Chapman University, and a member of the editorial board of the Orange County Register. He is author of The City: A Global History and The Next Hundred Million: America in 2050. His most recent study, The Rise of Postfamilialism, has been widely discussed and distributed internationally. He lives in Los Angeles, CA.

Creative Commons photo "Income Inequality" by Flickr user mSeattle.

The Story of How Marin Was Ruined

$
0
0

Marin County is a a picturesque area across the Golden Gate Bridge from San Francisco of quaint walkable towns, with homes perched on rolling hills and a low rise, unspoiled feel. People typically move to Marin to escape the more urbanized South and East Bay and San Francisco. Eighty-three percent of Marin cannot be built on as the land is agricultural and protected open space. 

This is not stopping ABAG, developers, social equity, housing and transit advocates from pushing for high density housing near transit in Marin. Plans for high density housing have sprung up the length of the county - multiple Marin communities found themselves declared Plan Bay Area "Priority Development Areas" (PDAs) making them targets for intense high density development. These designations occurred with little or no consultation by the elected officials that had volunteered them, and without any clear understanding of obligations to develop or impact.

Residents finally came together and said they'd had enough after an unsightly 5 story, 180 unit apartment complex appeared adjacent to an existing freeway choke-point - the city that allowed it had little choice due to onerous ABAG housing quotas that if unmet left the town open to litigation by housing advocates with crippling legal bills and penalties. The last straw was the publication of a station area plan to generate transit ridership that suggested 920 more high density units be built in nearby Larkspur - another freeway bottleneck. 

This video, put together by Citizen Marin, a coalition of neighborhood groups seeking to restore local control, was put together to drive awareness of this accelerated urbanization. For Marinites the video serves as a wake up call - most moved to Marin to live in a more rural / suburban location. Marin offers some of California's most walkable and attractive downtowns already: Sausalito, Mill Valley and San Rafael. All offer the kind of small town charm that are a model for others to emulate and attract visitors and residents.

The video was written and produced by Citizen Marin's Richard Hall. The video's narrator is from San Rafael - not San Rafael in Marin County but San Rafael, Argentina, and the animation was put together by a team from Kathmandu Nepal.


Correcting Priorities: The 10th Annual Demographia Housing Affordability Survey

$
0
0

Alain Bertaud of the Stern School of Business at New York University and former principal planner of the World Bank introduces the 10th Annual  Demographia International Housing Affordability Survey by urging planners to abandon:

"...abstract objectives and to focus their efforts on two measurable outcomes that have always mattered since the growth of large cities during the 19th century’s industrial revolution: workers’ spatial mobility and housing affordability".

This year's edition has been expanded to nine geographies, including Australia, Canada, Hong Kong, Ireland, Japan, New Zealand, Singapore, the United Kingdom, and the United States. A total of 85 major metropolitan areas (of over 1,000,000 population) are covered, including five of the six largest metropolitan areas in the high income world (Tokyo-Yokohama, New York, Osaka-Kobe-Kyoto, London, and Los Angeles). Overall, 360 metropolitan markets are included.

View the map with housing data for all markets created by the New Zealand Herald.

The Affordability Standard

The Demographia International Housing Affordability Survey uses a price-to-income ratio called the "median multiple," calculated by dividing the median house price by the median household income. Following World War II, virtually all metropolitan areas in Australia, Canada, Ireland, New Zealand, the United Kingdom, and the United States had median multiples of 3.0 or below. However, as urban containment policies have been implemented in some metropolitan areas, house prices have escalated well above the increase in household incomes. This is exactly the effect that economics predicts to occur where the supply of a good or service is rationed, all things being equal.

Even a decade ago, there was considerable evidence of the rapidly deteriorating housing affordability in markets with urban containment policy. Yet, governments implementing these policies were largely ignoring not only the trends, but also any reference to the extent of the losses in historic context. Co-author Hugh Pavletich of Performance Urban Planning and I established the Demographia International Housing Affordability Survey to draw attention to this policy driven attack on the standard of living.

The Demographia Survey rates housing affordability as follows:

Demographia Housing Affordability Rating Categories

Rating

Median Multiple

Severely Unaffordable

5.1 & Over

Seriously Unaffordable

4.1 to 5.0

Moderately Unaffordable

3.1 to 4.0

Affordable

3.0 & Under

Affordability in the 9 Geographies

Among the nine geographies and all 360 markets, Ireland emerges has the most affordable, with a median market multiple of 2.8. The United States follows at 3.4, and Canada at 3.9. Japan’s median market multiple is 4.0, while the United Kingdom is at 4.9 and Singapore at 5.1 The other geographies are all well into the severely unaffordable category, including Australia and New Zealand, at 5.5, and far worse Hong Kong, at 14.9 (Figure 1).

Costly Hong Kong & Vancouver, Affordable Pittsburgh and Atlanta

For the fourth year in a row, Hong Kong is the least affordable major metropolitan area, with a median multiple of 14.9, three times its early 2000s ratio. Vancouver is again the second most unaffordable major market, with a median multiple of 10.3, three times its pre-urban containment level. Housing affordability in coastal California is well on the way to the stress of the 2000s. San Francisco ranks third most unaffordable at 9.2 and nearby San Jose is at 8.7, with San Diego (7.9) and Los Angeles (7.7) following closely. Sydney, at 9.0, ranks fourth with Melbourne at 8.4 and Auckland at 8.0.All of these metropolitan areas have had serious deterioration of housing affordability since adopting urban containment policy.

All of the affordable major metropolitan areas are all in the United States. Pittsburgh is the most affordable, at 2.3. There are 13 additional major affordable housing markets, which include growing and over-5 million Atlanta as well as Indianapolis and Columbus, with their strong economies (Figure 2).

Japan

Notably, Japan's two largest metropolitan areas, Tokyo-Yokohama and Osaka-Kobe-Kyoto have avoided the severely unaffordable territory occupied by the other three megacities (New York, Los Angeles, and London). Osaka-Kobe-Kyoto has the best housing affordability of any megacity, at 3.5 (moderately unaffordable) and Tokyo-Yokohama is at 4.4 (seriously unaffordable).

House Size

This year's Demographia Survey also provides information on average new house size in the nine geographies (Figure 3). The largest houses are in the United States, which is second only to Ireland in affordability. The smallest houses are in Hong Kong, which also has the least affordable housing. In living space those who pay the most get the least, while those who pay the least get the most.

The Imperative for Reform

Housing is the largest element of household budgets, and its cost varies the most between metropolitan areas. Where households pay more than necessary for housing, they have less dicsretionary income and lower standards of living and there is more poverty. This is a natural consequence of planning policies that place the urban form above the well-being of people. One of the principal justifications is environmental, but the gains from urban containment policy are scant and exorbitantly expensive.

Virtually all of the geographies covered in the Demographia Survey are facing more uncertain economic futures than in the past. As is always the case in such situations, lower income households tend to be at greatest risk, while younger households have much less chance of living as well as their parents (except those fortunate enough to inherit their wealth or housing).

There is no more imperative domestic policy imperative than improving the standard of living and minimizing poverty. Planning must facilitate that, not get in the way. Bertaud is hopeful:

"But if planners abandoned abstracts and unmeasurable objectives like smart growth, liveability and sustainability to focus on what really matters –  mobility and affordability – we could see a rapidly improving situation in many cities.  I am not implying that planners should not be concerned with urban environmental issues.  To the contrary, those issues are extremely important, but they should be considered a constraint to be solved not an end in itself."

Download the full report (pdf):  10th Annual  Demographia International Housing Affordability Survey

Photo: Suburban Tokyo (by author)

California's Potholed Road to Recovery

$
0
0

California's economy may be on the mend, but prospects for continued growth are severely constrained by the increasing obsolescence of the state's basic infrastructure. Once an unquestioned leader in constructing new roads, water systems, power generation and building our human capital, California is relentlessly slipping behind other states, including some with much lower tax and regulatory burdens.

The indications of California's incipient senility can be found in a host of reports, including a recent one from the American Society of Civil Engineers, which gave the state a “C” grade. Roads, in particular, are in bad shape, as many drivers can attest, and, according to another recent study, are getting worse. The state's shortfall for street repair is estimated at $82 billion over the next 10 years.

Remarkably, given how Californians spend and tax ourselves, we actually bring up the rear in terms of road conditions. Indeed, one recent survey placed California 47th among the states in road quality. In comparison, low-tax Texas notched No. 11, showing that willingness to spend money is not the only factor.

Greater Los Angeles is particularly affected; L.A. roads have been ranked by one Washington-based nonprofit as the worst in the nation. Bad roads cost L.A. drivers an average $800 a year in vehicle repairs, and a full quarter of roadways were graded “F,” meaning barely drivable. The region that gave birth to the freeway and the dream of quick, efficient travel, now has worse roads than some much poorer, less-important, lower-tax cities, such as Houston, Dallas or Oklahoma City. Not surprisingly, Los Angeles has been ranked has having the worst traffic congestion in the nation, but San Francisco and San Jose also make it to the 10 metros with the worst traffic.

But it's not just the roads that are in bad shape. Other basic sinews of the state's infrastructure – ports, water systems, electrical generation – are increasingly in disrepair. Conditions are so poor at Los Angeles International Airport, admits new L.A. Mayor Eric Garcetti, that “there's nothing world class” about the aging facility. This is critical for a city and region with significant global pretensions. Since 2001, LAX traffic has declined by more than 5 percent, while double-digit gains in passenger traffic have been logged by such competitors as New York, Miami, Atlanta and Houston.

Meanwhile the Los Angeles-Long Beach port system, facing greater competition from the Gulf Coast, as well as other Pacific Coast ports, has been beleaguered by regulations that, among other things, mandate moving heavy loads with zero-emission but expensive, underpowered electric trucks that further undermine port productivity. Rather than see the ports as job and wealth generators, ports also have become increasingly sources for revenue for hard-hit city budgets.

Overall, the bills are mounting; California faces an enormous shortfall in infrastructure. One study, conducted by California Forward, puts the bill for the next 10 years at $750 billion.

The case for addressing infrastructure needs should be compelling on its own but, given fiscal limitations, it's critical first to set some sense of priority. California, particularly under the current governor's father, the late Edmund G. “Pat” Brown, spent upward of a fifth of its budget on basic infrastructure; today that share is under 5 percent. Rather than build the infrastructure that might spark the economy, as the elder Brown did, we have chosen, instead, to spend on government salaries and pensions, which, however well-deserved, require a transfer of wealth from the private sector to the public sector that brings only minimal benefits.

These shortfalls are made even worse by ideological considerations that, in this one-party-rule state, overcome even the most rational approach to infrastructure development. The ruling class in Sacramento speaks movingly about the Pat Brown legacy, but has little interest in mundane things like roads, bridges, port facilities and other economically useful infrastructure. Instead, the powerful green and planning clerisy is focused on transforming the state into a contemporary ecotopia, where people eschew cars, live in crowded apartment towers and ride transit to work. Economic considerations, upward mobility and the creation or retention of middle-class jobs are, at best, secondary concerns.

This ideological bent leads to grossly misplaced priorities. Consider, for example, the billions of dollars being proposed for building Gov. Jerry Brown's signature project, a $68 billion, 800-mile high-speed rail system, even as state highways erode. The bullet train, which even liberals such as Kevin Drumm at Mother Jones magazine have pointed out, has devolved into a boondoggle with costs far above recent estimates and, given the lack of interest from private investors, something unlikely to offer much of an alternative to commuters for decades to come. Unlike many liberal commentators, who tend to favor crony-capitalist projects with a “green” cast, Drumm denounced the entire project as being justified with projections, such as for ridership, that are “jaw-droppingly shameless.”

In addition, the project's future has been clouded by legal challenges from a host of complainants stretching from Central Valley farmers to suburbanites on the San Francisco peninsula. In December, Superior Court Judge Michael Kenny in Sacramento County accused the state high-speed rail authority of ignoring provisions in the authorizing legislation for the project designed to prevent “reckless spending.”

Public support for this misguided venture has been fading, thankfully. Even before Judge Kenny's decision, a USC/Los Angeles Times poll showed statewide voter opposition rising to 53 percent, while 70 percent would like to have a new vote on the legislation that authorized the project.

At the same time, federal funding, critical to keeping this failing project afloat, grows increasingly unlikely. California Congressman Jeff Denham, also a former supporter of the project, joined with Congressman Tom Latham to ask the federal Government Accountability Office if further federal disbursements could be illegal, given the uncertainty of the state funding needed to “match” the federal dollars. With Republicans likely to retain the House after the 2014 elections, it seems all but certain that high-speed rail – at least the statewide system proposed by its advocates – is heading to a less-than-spectacular denouement.

This tendency to allow ideological considerations to overcome logic suffuses virtually the entire planning process across the board. For example, devotion to alternative energy sources leads the state to reject the expanded use of clean, cheap and plentiful natural gas in favor of extremely expensive renewable fuels, notably wind and solar. This may have much to do with the investments by crony capitalists close to Democratic politicians – think Google or a host of venture-capital firms– as with anything else. Under the right circumstances, such as government mandates, even unsound investments can make some people rich, or, in this case, even richer.

But the cost to the rest of society of such Ecotopian policies can be profound, and could cost as much as $2,500 a year per California family by 2020. High energy prices will severely affect the state's already-beleaguered middle- and working-class families, particularly in the less-temperate interior of the state.

The commitment to expensive energy also makes bringing new industry – such as manufacturing or logistics – that can provide jobs ever more problematical. Similarly, money poured into follies like high-speed rail also weaken the state's ability to fund, directly or through bonds, more-critically needed, if less-politically correct, transport infrastructure.

Given these clear abuses of the public purse, it is not surprising that some Californians may simply want to close their wallets. Yet this would be a disservice to future generations, who will need new roads, ports, bridges and electrical generation. California needs to rediscover its historic commitment to being an infrastructure leader, but only after acquainting ourselves once again with the virtues of common sense.

This story originally appeared at The Orange County Register.

Joel Kotkin is executive editor of NewGeography.com and Distinguished Presidential Fellow in Urban Futures at Chapman University, and a member of the editorial board of the Orange County Register. He is author of The City: A Global History and The Next Hundred Million: America in 2050. His most recent study, The Rise of Postfamilialism, has been widely discussed and distributed internationally. He lives in Los Angeles, CA.

Why State Economic Development Strategies Should Be Metro-Centric

$
0
0

Globalization, technology, productivity improvements, and the resulting restructuring of the world economy have led to fundamental changes that have destroyed the old paradigms of doing business. Whether these changes are on the whole good or bad, or who or what is responsible for bringing them into being, they simply are. Most cities, regions, and US states have extremely limited leverage in this marketplace and thus to a great extent are market takers more than market makers. They have to adapt to new realities, but a lack of willingness to face up to the truth, combined with geo-political conditions, mean this has seldom been done.

Three of those new realities are:

1. The primacy of metropolitan regions as economic units, and the associated requirement of minimum competitive scale. It is mostly major metropolitan areas, those with 1-1.5 million or more people, that have best adapted to the new economy. Outside of the sparsely populated Great Plains, smaller areas have tended to struggle unless they have a unique asset such as a major state university. Even the worst performing large metros like Detroit and Cleveland have a lot of economic strength and assets behind them (e.g., the Cleveland Clinic) while smaller places like Youngstown and Flint have also gotten pounded yet have far fewer reasons for optimism. Many new economy industries require more skills than the old. People with these skills are most attracted to bigger cities where there are dense labor markets and enough scale to support items ranging from a major airport to amenities that are needed to compete.

2. States are not singular economic units. This follows straightforwardly from the first point. As a mix of various sized urban and rural areas, regions of states have widely varying degrees of economic success and potential for the future. Their policy needs are radically different so the one size fit all nature of government rules make state policy a difficult instrument to get right. Additionally, many major metropolitan areas that are economic units cross state borders.

3. Many communities may never come back, and many laid-off workers may never be employed again. Realistically, many smaller post-industrial cities are unlikely to ever again by economically dynamic no matter what we do. And lost in the debate over the n-th extension of emergency unemployment benefits is the painful reality that for some workers, especially older workers laid off from manufacturing jobs, there’s no realistic prospect of employment at more than near minimum wage if that. As Richard Longworth put it in Caught in the Middle, “The dirty little secret of Midwest manufacturing is that many workers are high school dropouts, uneducated, some virtually illiterate. They could build refrigerators, sure. But they are totally unqualified for any job other than the ones they just lost.” This doesn’t even get to the big drug problems in many of these places. This isn’t everybody, but there are too many people who fall into that bucket.

I want to explore these truths and potential state policy responses using the case study of Indiana. An article in last week’s Indianapolis Business Journal sets the stage. Called “State lags city with science, tech jobs” it notes how metropolitan Indianapolis has been booming when it comes to so-called STEM jobs (Science, Technology, Engineering, Math). Its growth rate ranked 9th in the country in study of large metro areas. However, the rest of Indiana has lagged badly:

Indiana for more than a decade has blown away the national average when it comes to adding high-tech jobs. But outside the Indianapolis metro area, there isn’t much cause for celebration.

Careers in science, technology, engineering and math—typically referred to as STEM fields—have surged in growth compared to other careers in Marion and Hamilton counties. It’s a boon for economic development, considering the workers earn average wages almost twice as high as all others, and employers sorely need the skills. Dozens of initiatives focus on building STEM jobs in the state.

A recent report ranked the Indianapolis-Carmel metro area ninth in the country in STEM jobs growth since the tech bubble burst in 2001. But while the metro area has grown, the rest of Indiana has barely budged from the early 2000s, an IBJ analysis of U.S. Bureau of Labor Statistics found.

Indianapolis grew its STEM job base by 39% since 2001 while the rest of the state grew by only 10% (only 6% if you exclude healthcare jobs). Much of the state actually lost STEM jobs.

This divergence between metropolitan Indianapolis (along with those smaller regions blessed with a unique asset like Bloomington (Indiana University), Lafayette (Purdue University) and Columbus (Cummins Engine)) and the rest of the state is a well-worn story by now. Here are a few baseline statistics that tell the tale.


ItemMetro IndianapolisRest of Indiana
Population Growth (2000-2012)15.9%4.1%
Job Growth (2000-2012)5.9%-7.2%
GDP Per Capita (2012)$50,981$34,076
College Degree Attainment (2012)32.1%20.1%

Additionally, there does appear to be something of a brain drain phenomenon, only it’s not brains leaving the state, it’s people with degrees moving from outstate Indiana to Indianapolis. From 2000-2010 a net of about 51,000 moved from elsewhere in Indiana to metro Indianapolis. As Mark Schill put it in the IBJ:

“Indianapolis is somewhat of a sponge city for the whole region,” said Mark Schill, vice president of research at Praxis Strategy Group, an economic development consultant in North Dakota.

The situation in Indiana, Schill said, is common throughout the United States: States with one large city typically see their engineers, scientists and other high-tech workers flock to the urban areas from smaller towns.

Even I find it very surprising that of my high school classmates with college degrees, half of them live in Indianapolis – this from a tiny rural school along the Ohio River in far Southern Indiana near Louisville, KY.

What has Indiana’s policy response been to this to date? I would suggest that the response has been to a) adjust statewide policy levers to do everything possible to reflate the economy of the “rest of Indiana” while b) making subtle tweaks attempt to rebalance economic growth away from Indianapolis.

On the statewide policy levers, the state government has moved to imposed a one size fits all, least common denominator approach to services. The state centralized many functions in a recent tax reform. It also has aggressively downsized government, which now has the fewest employees since the 1970s. Tax caps, a comparative lack of home rule powers, and an aggressive state Department of Local Government Finance have combined to severely curtail local spending as well. Gov. Pence took office seeking to cut the state’s income tax rate by 10% (he got 5%), and now wants to eliminate the personal property tax on business. Indiana also passed right to work legislation.

I call this “the best house on a bad block strategy.” I think Mitch Daniels looked around at Illinois, Ohio, and Michigan and said, “I know how to beat these guys.” Indiana is not as business friendly as places like Texas or Tennessee, but the idea was to position itself to capture a disproportionate share of inbound Midwest investment by being the cheapest. (I’ll get to Pence later).

The subtle tweaks have been income redistribution from metro Indianapolis (documented by the Indiana Fiscal Policy Institute) and using the above techniques and others to apply the brakes to efforts by metro Indy to further improve its quality of life advantage over many other parts of the state (see my column in Governing magazine for more). One obvious example is a recent move by the Indiana University School of Medicine to build full four year regional medical school campuses and residency programs around the state with the explicit aim of keeping students local instead of having them come to Indianapolis for medical training.

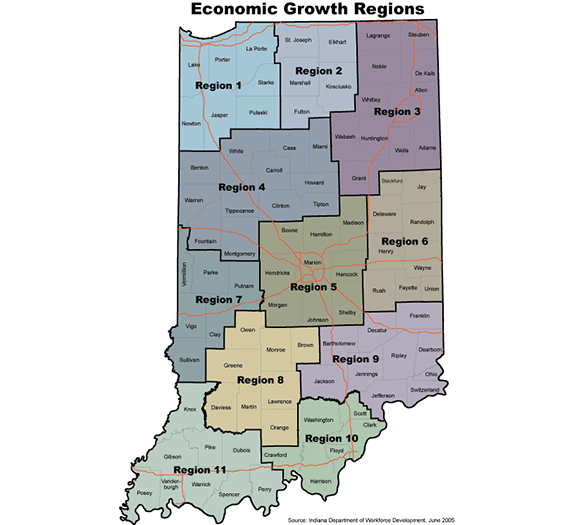
What there’s been next to nothing of is any sense of metropolitan level or even regional thinking. The state does administer programs on a regional level, but the strategy is not regionally oriented and the administrative borders don’t even line up. Here are the boundaries of the various workforce development boards:


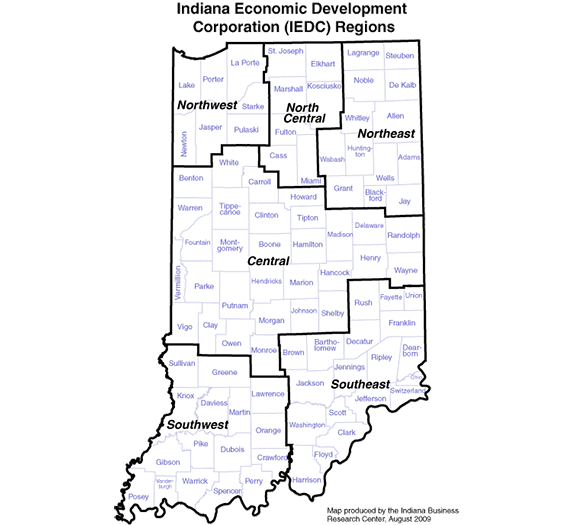
There’s a semi-metropolitan overlay, but as I’ve long noted places like Region 6 are economic decline regions, not economic growth regions. Here’s how the Indiana Economic Development Corp. sees the world:


These are not just agglomerations of the workforce districts, there are numerous differences between them. The point is that clearly the organization is driven by administrative convenience and the political need for field offices, not a metro-centric view of the world or strategy.

Add it all up and it appears that Indiana has decided to fight against all three new realities above rather than adapting to them. It rejects metro-centricity, imposes a uniform policy set, and is oriented towards trying to reflate the most struggling communities. I don’t think this was necessarily a conscious decision, but ultimately that’s what it amounts to.

When you fight the tape, you shouldn’t expect great results and clearly they haven’t been stellar. Since 2000, Indiana comfortably outperformed perennial losers Michigan and Ohio on job growth (well, less job declines), but trailed Kentucky, Wisconsin, Minnesota, Iowa, and Missouri. But notably, Indiana only outpaced Illinois by a couple percentage points. That’s a state with higher income taxes (and that actually raised them) that’s nearly bankrupt and where the previous two governors ended up in prison. Yet Indiana’s job performance is very similar. What’s more, Hoosier per capita incomes have been in free fall versus the national average, likely because it has only become more attractive to low wage employers.

Fiscal discipline, low taxes, and business friendly regulations are important. But they aren’t the only pages in the book. Workforce quality counts for a lot, and this has been Indiana’s Achilles heel. (My dad, who used to run an Indiana stone quarry, had trouble finding workers with a high school diploma who could pass a drug test and would show up on time every day – hardly tough requirements one would think). Also aligning with, not against market forces is key.

I will sketch out a somewhat different approach. Firstly, regarding the chronically unemployed, clearly they cannot be written off or ignored. However, I see this as largely a federal issue. We need to come to terms with the reality that America now has a population of some million who will have extreme difficulty finding employment in the new economy (see: latest jobs report). We’ve shifted about two million into disability rolls, but clearly we’ve to date mostly been pretending that things are going to re-normalize.

For Indiana, the temptation can be to reorient the entire economy to attract ultra low-wage employers, then cut benefits so that people are forced to take the jobs. I’ve personally heard Indiana businessmen bemoaning the state’s unemployment benefits that mean workers won’t take the jobs their company has open – jobs paying $9/hr. Possibly the 250,000 or so chronically unemployed Hoosiers may be technically put back to work through such a scheme – eventually. But it would come at the cost of impoverishing the entire state. Creating a state of $9/hr jobs is not making a home for human flourishing, it’s building a plantation.

Instead of creating a subsistence economy, the focus should instead be on creating the best wage economy possible, one that offers upward mobility, for the most people possible, and using redistribution for the chronically unemployed. You may say this is welfare – and you’re right. But I would submit to you that the state is already in effect a gigantic welfare engine. In addition to direct benefits, the taxation and education systems are redistributionist, and the state’s entire economic policy, transport policy, etc. are targeted at left-behind areas (i.e., welfare). Even corrections is in a sense warehousing the mostly poor at ruinous expense. So Indiana is already a massive welfare state; we are just arguing about what the best form is. I think sending checks is much better than distorting the entire economy in order to employ a small minority at $9/hr jobs – but that’s just me. Again, we are in uncharted territory as a country and this is ultimately going to require a national response, even if it’s just swelling the disability rolls even more. I do believe people deserve the dignity of a job, but we have to deal with the unfortunate realities of our new world order.

With that in mind, the right strategy would be metro-centric, focusing on building on the competitively advantaged areas of the state – what Drew Klacik has called place-based cluster – and competitively advantaged middle class or better paying industries.

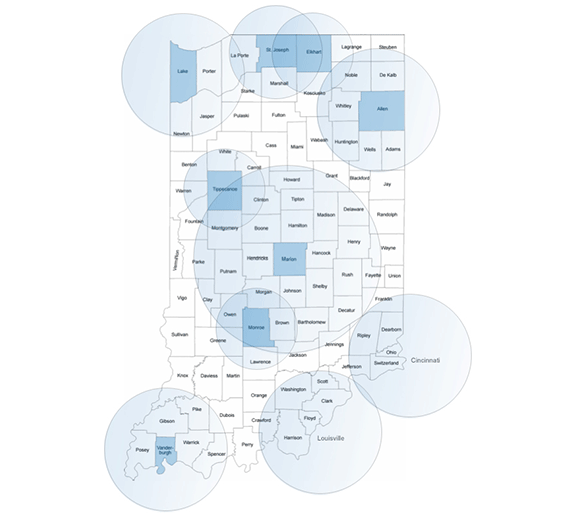
Contrary to some of the stats above, this is not purely an Indianapolis story. Indiana has a number of areas that are well-positioned to compete. Here’s a map with key metro regions highlighted:


This may look superficially like the maps above, but it is explicitly oriented around metro-centric thinking. Metro Indy has been doing reasonably well as noted. But Bloomington, Lafayette, and Columbus (sort of small satellite metros to Indy) have also done very well. In fact, all three actually outperformed Indy on STEM job growth.

Additionally, three other large, competitively advantaged metro areas take in Indiana territory: Chicago, Cincinnati, and Louisville. These are all, like Indy, places with the scale and talent concentrations to win. True, none of the Indiana counties that are part of those metros is in the favored quarter. But they still have plenty of opportunities. I’ve written about Northwest Indiana before, for example, which should do well if it gets its act together.

This covers a broad swath of the state from the Northwest to the Southeast. It comes as no surprise to me that Honda chose to locate its plant half way between Indianapolis and Cincinnati, for example.

The state should align its resources, policies, and investments to enable these metro regions to thrive. This doesn’t mean jacking up tax rates. Indiana should retain its competitively advantaged tax structure. But it should mean no further erosion in Indiana’s already parsimonious services. The state is already well-positioned fiscally, and in a situation with diminishing marginal returns to further contraction.

Next, empower localities and regions to better themselves in accordance with their own strategies. This means an end to one size fits all, least common denominator thinking. These regions need to be let out from under the thumb of the General Assembly. That means more, not less flexibility for localities. Places like Indianapolis, Bloomington, and Lafayette would dearly love to undertake further self-improvement initiatives, but the state thinks that’s a bad idea. (I believe this is part of the subtle re-balancing attempt I mentioned).

It also means using the state’s power to encourage metro and extended region thinking. For example, last year within a few months of each other the mayors of Indianapolis, Anderson, and Muncie all made overseas trade trips – separately and to different places. That’s nuts. The state should be encouraging them to do more joint development.

This also means recognizing the symbiotic relationship that exists between the core and periphery in the extended Central Indiana region, clearly the state’s most important. The outlying smaller cities, towns, and rural areas watch Indianapolis TV stations, largely cheer for its sports teams, get taken to its hospitals for trauma or specialist care, fly out of its airport, etc. Metro Indianapolis and its leadership have also basically created and funded much of the state’s economic development efforts (e.g., Biocrossroads) and many community development initiatives (the Lilly Endowment). Many statewide organizations are in effect Indianapolis ones that do double duty in serving the state. For example, the Indiana Historical Society. (There is no Indianapolis Historical Society).

On the other side of the equation, Indianapolis would not have the Colts and a lot of other things without the heft added from the outer rings out counties that are customers for these amenities. It benefits massively from that, particularly since it’s a marginal scale city. One of the biggest differences between Indy and Louisville is that Indy was fortunate enough to have a highly populated ring of counties within an hour’s drive.

So in addition to aligning economic development strategies around metros, and freeing localities to pursue differentiated strategies, the state should encourage the next ring or two of counties that are in the sphere of influence of major metros to align with their nearest larger neighbor.

Contrary to popular belief, this is a win-win. When I was in Warsaw, Indiana, people were concerned that many highly paid employees of the local orthopedics companies lived in Ft. Wayne. From a local perspective, that’s understandable and obviously they want to be competitive for that talent and should be all means go for it. On the other hand, what if Ft. Wayne wasn’t there for those people to live in? Would those orthopedics companies be able to recruit the talent they need to stay located in small town Indiana?

It’s similar for other places. Michael Hicks, and economist at Ball State in Muncie, said, “Almost all our local economic policies target business investment and masquerade as job creation efforts. We abate taxes, apply TIFs and woo businesses all over the state, but then the employees who receive middle-class wages (say $18 an hour or more) choose the nicest place to live within a 40-mile radius. So, we bring a nice factory to Muncie, and the employees all commute from Noblesville.” Maybe Muncie isn’t completely happy about this, understandably. But would they have been able to recruit those plants at all (and the associated taxes they pay and the jobs for anybody who does stay local) if higher paid workers didn’t have the option to live in suburban Noblesville? Would the labor force be there?

I saw a similar dynamic in Columbus. Younger workers recruited by Cummins Engine chose to live in Greenwood (near south suburban Indy). Columbus wants to keep upgrading itself to be more attractive – a good idea. But the ability to reverse commute from Indy is an advantage for them.

Louisville, Kentucky has one of the highest rates of exurban commuting the country because so many Hoosiers in rural communities drive in for good paying work.

This is the sort of thinking and planning that needs to be going on. Realistically, most of these small industrial cities and rural areas are not positioned to go it alone and they shouldn’t be supported by the state in attempting to do so. They need to a align with a winning team.

There are two groups of places that require special attention. One is the mid-sized metro regions of Ft. Wayne, Evansville, and South Bend-Elkhart. These places are too far from larger metros and aren’t large enough themselves to have fully competitive economies. No surprise two of the three lost STEM jobs. Evansville has done better recently on the backs of Toyota, but has a vast rural hinterland it cannot carry with its small size. The region has done ok of late, but it has also received gigantic subsidies in the form of multiple massive highway investments, and now a massive coal gasification plant subsidy. I don’t believe this is sustainable. These places need special assistance from the state to devise and implement strategies.

The other grouping consists of rural and small industrial areas that are too far outside the orbit of a major metro to effectively align with it. This would includes places like Richmond or Blackford County. They might get lucky and land a major plant, but realistically they are going to require state aid for some time to maintain critical services.

For the last two groups especially, there also needs to be a commitment by the state’s top brain hubs – Indy and the two university towns – to applying their intellectual and other resources to the difficult problem at hand. Part of that involves helping them be the best place of their genre that they can. While cities are competitively advantaged today, not everybody wants to live in one. So there is still an addressable market, if not as large, for other places.

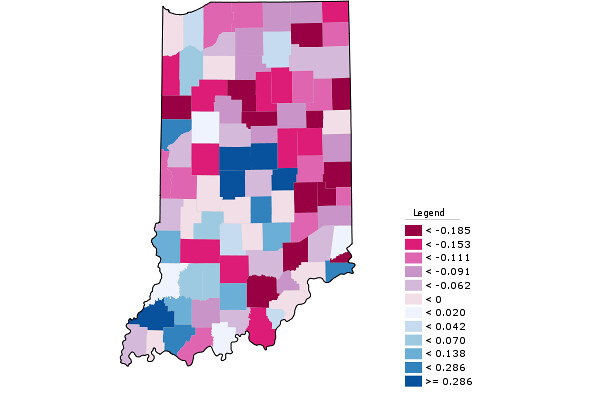
Put it together and here’s the map that needs to be changed. It’s percentage change in jobs, 2000-2012:


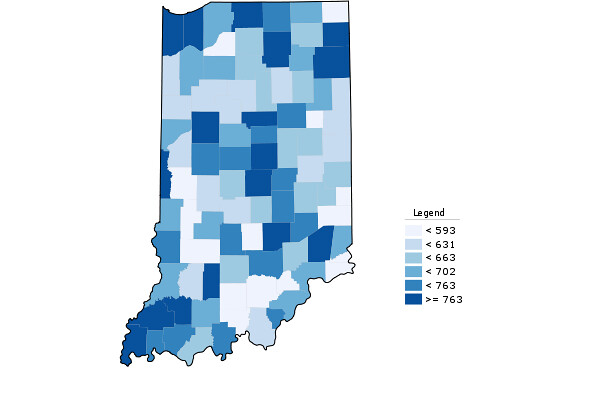
Pretty depressing. Urban core counties had some losses, but suburban Indy, Chicago, and Cincy did decently (Louisville’s less well), plus Bloomington area, Lafayette, and Columbus. You see also the strong performance of Southwest Indiana which is fantastic, but the sustainability of which I think is in question. Wages are higher in metro areas too, by the way. Here’s the average weekly wage in 2012, which shows most of the state’s metros doing comparatively well:


In short, I suggest:

- Retain lean fiscal structure but limit further contractions

- Goal is to build middle class or better economy, not bottom feeding

- Align economic development efforts to metro areas, particularly larger, competitively advantages locations. Align capital investment in this direction as well.

- Greater local autonomy to pursue differentiated strategies for the variegated areas of the state

- Special attention/help to strategically disadvantaged communities, but not entire state policy directed to servicing their needs.

- Utilization of transfers for the chronically unemployed pending a federal answer, but again, not redirection of state policy to attract $9/hr jobs.

This requires a lot of fleshing out to be sure, but I think is broadly the direction.

Back to Gov. Mike Pence, would he be on board with this? He’s Tea Party friendly to be sure and interested in fiscal contraction. But he’s not a one-trick pony. He’s actually taken some interesting steps in this regard. He is subsidizing non-stop flights from Indianapolis to San Francisco for the benefit of the local tech community. He also wants to establish another life sciences research institute in Indy. And he’s talked about more regionally focused economic development efforts. It’s a welcome start. I think he groks the situation more than people might credit him for. Keep in mind that he did not establish the state’s current approach, which arguably even pre-dated Mitch Daniels, and he has to deal with political realities. And if as they say only Nixon could go to China, then although a reorienting of strategy is not about writing big checks, still perhaps only someone with conservative bona fides like Pence can push the state towards a metro-centric rethink.

Aaron M. Renn is an independent writer on urban affairs and the founder of Telestrian, a data analysis and mapping tool. He writes at The Urbanophile, where this piece originally appeared.

The Changing Face of European Economics: Liberalism Moves North

$
0
0

Where do we find the nations with the highest tax levels? In the mid-90s the answer was quite clear: in Western Europe. Both Denmark and Sweden had a tax rate of 49 percent of GDP in 1996, followed closely by Finland with a 47 percent level. The tax burden was somewhat lower in France, Belgium, Austria and Italy, where rates ranged from 42 to 44 percent of GDP. Thanks to its oil-wealth Norway could afford a Nordic welfare model with 41 percent taxes, the same level as the Netherlands which had recently slimmed down its welfare system considerably. These Western European welfare states were the nine OECD countries with the highest tax rates. The tenth country was Eastern European Hungary with a rate of 40 percent.

And where do we today find the high-tax nations? Looking at tax data from 2012, the answer is again amongst the Western European welfare states plus Hungary. At first glance, little seems to have changed with time. The only country to leave the top-10 list is the Netherlands, which has recently been replaced by another Western European nation: Luxembourg. But a closer look shows that Western Europe’s welfare states have indeed changed, and are continuing to do so. With time, a significant convergence has occurred.

In 2012 Denmark still lead the tax league, with a 48 percent rate. France and Belgium had climbed to shared second position, with 45 percent tax rates. Rising levels in Italy and lowered ones in Sweden and Finland resulted in the three countries sharing a 44 percent level. Austria and Norway had increased their levels slightly, whilst the Netherlands had implemented further reductions. So, the welfare states with the highest taxes lowered their levels, whilst those with somewhat lower levels raised them. The Netherlands is the exception, as it continued to reduce relatively low taxes. No surprise then that it is the only country to leave the top-10 tax league.

Of course, taxes are far from the only indicator of economic policy. A range of other factors, such as trade openness, business policy and protection of property rights, affect the opportunities for job creation, competition and growth. The Index of Economic Freedom, published by the Heritage Foundation in partnership with the Wall Street Journal, ranks countries based on a broad set of indicators of economic freedom. The Western European welfare states can overall be said to combine large public sectors and high taxation with relatively free economic policies. But the differences between them are significant, and the direction of change has varied considerably during the last decades.

Tax rate % of GDP

1996

2006

2012

Change 1996-2012

Sweden

49,4

48,1

44,3

-5,1

Finland

47,1

43,5

44,1

-3,0

Netherlands

40,9

39,1

38,6*

-2,4

Denmark

49,2

49,0

48,0

-1,2

Austria

42,8

43,0

43,2

0,4

France

44,2

43,6

45,3

1,1

Norway

40,9

43,1

42,2

1,4

Belgium

43,9

44,4

45,3

1,4

Italy

41,6

40,8

44,4

2,8

* Data given for 2011. Source: OECD Stat Extract and own calculations.

When the index of economic freedom was first published in the mid-90s, it showed that the Netherlands and Austria were the most market liberal of the nine Western European countries listed above. Sweden and Italy were on the other hand found at the bottom. In the latest 2014 edition of the index, Denmark – which compensates for high taxes with market oriented policies, including a liberal labour market – has climbed to become the freest economy amongst the group.

In fact, Denmark ranks on 10th position globally, higher than even the US on 12th position and the UK on 14th. The Netherlands ranks on 15th place globally, followed by Finland and Sweden on the 19th and 20th positions. Belgium on the other hand has gone from being one of the more economically free Western European welfare states to becoming the third least free. Today the country scores on 35th place globally. France is found on a dismal 70th position, and is unique in having reduced its economic freedom score marginally between 1996 and 2014. Italy has merely increased its score by 0.1 points, ranking at 86th place– just below Kyrgyz Republic. The Western European welfare states might seem to have similar policies at first glance, but differences in market adaptation are in fact quite significant.

Heritage/WSJ Economic Freedom Score

1996

2006

2014

Change 1996-2014

Sweden

61,8

70,9

73,1

11,3

Finland

63,7

72,9

73,4

9,7

Denmark

67,3

75,4

76,1

8,8

Norway

65,4

67,9

70,9

5,5

Netherlands

69,7

75,4

74,2

4,5

Belgium

66,0

71,8

69,9

3,9

Austria

68,9

71,1

72,4

3,5

Italy

60,8

62,0

60,9

0,1

France

63,7

61,1

63,5

-0,2

* Data for 1997 given. Source: Heritage/WSJ Economic Freedom Index and own calculations.

The change in economic freedom parallels that of change in taxation, since taxation is an important part of economic freedom and since tax-reforms and other market reforms have tended to go hand-in-hand. The major changes have happened in the Nordics, particularly in the three high-tax countries which lack Norway’s oil-wealth. Sweden has lowered its taxes by over 5 percent of GDP between 1996 and 2012, by far the greatest change. The country has also increased its economic freedom score by over 11 points, again the most significant change. If Sweden had retained its 1996 score, it would score as the 78th freest economy today, just below Paraguay and Saudi Arabia.

Finland has reduced its taxes by 3 percent of GDP, and improved economic freedom almost as much as Sweden. Denmark still leads the tax league, but has also implemented major increases in economic freedom – quite impressive given that the country had a high economic freedom score already in the mid-90s. Norway has liberalized overall economic policy, but increased taxation somewhat. France and Italy have stagnated at a low economic freedom score, and relied on increasing taxation rather than growth-oriented reforms to fund public services. Belgium and Austria have implemented some economic liberalization, but increased taxes. 

The welfare states of Western Europe are quite complex. Their social and economic systems have much in common, but also differ in many ways. Today, as well as during the mid-90s, the countries in the world with the highest tax rates are found amongst this group. Still, major changes have occurred, and more seem on the way. In the upcoming 2014 elections of Sweden, it is more likely than not that the left will emerge victorious. But even the social democrats have, after initial resistance, accepted most of the current center-right government’s reforms. The social democratic government of Denmark is currently focused on reducing taxes, as well as government spending and the generosity of the welfare state. Part of the inspiration at least seem to come from the recent workfare policies of the Swedish right.

As I recently discussed in a New Geography article, the current government of the Netherlands has raised the issue of reforming the welfare state further, to a “participation society” by encouraging self-reliance over government dependency. Finnish policies focus on how new entrepreneurial successes can be furthered. Part of the background is that Nokia, which the country relied so much on, has quickly fallen behind the global competition. On the other hand, the small company behind the game Angry Birds has gained global attention and become a symbol of new Finnish ingenuity. France and Italy still struggle with faltering markets and sluggish development. Perhaps with time the countries will follow the lead of the Nordics and the Netherlands, in reducing the scope of big government, and moving towards lower taxes and increased economic freedom?

It is anything but easy to predict the future development of the Western European welfare states. But one thing is clear: the countries in the region that are doing well today are those that have reformed towards free-market policies and lower tax burdens since the mid-1990s. Given the apparent problems in France and Italy, and the continued interest for market reforms in the more vibrant North, it would seem that increased economic freedom is still the recipe for success.

Dr. Nima sanandaji is a frequent writer for the New Geography. He is upcoming with the book "Renaissance for Reforms" for the Institute of Economic Affairs and Timbro, co-authored with Professor Stefan Fölster.

Creative commons photo "Flags" by Flickr user miguelb.

The Illusions of Charles Montgomery's Happy City

$
0
0

Striking a pose of defiance, contemporary urbanists see themselves as the last champions of happiness in a world plunged into quiet despair, and Canadian writer and journalist Charles Montgomery is no exception. Drawing on the emerging ‘science of happiness’, his new book Happy City, subtitled ‘transforming our lives through urban design’, joins a wave of anti-suburban literature spurred on by climate fears and the financial crisis. ‘As a system’, writes Montgomery, the dispersed city ‘has begun to endanger both the health of the planet and the well-being of our descendants.’   

Happy are the poor

Repeating the fashionable wisdom, he says ‘cities must be regarded as more than engines of wealth; they must be viewed as systems that should be shaped to improve human well-being.’ Soon enough it’s apparent that to this way of thinking, well-being and poverty are by no means incompatible. ‘If a poor and broken city such as Bogota can be reconfigured to produce more joy’, he writes, ‘then surely it’s possible to apply happy city principles to the wounds of wealthy places.’    

Montgomery starts off with ‘the happiness paradox’, arguing that ‘if one was to judge by sheer wealth, the last half century should have been a happy time for people in the United States and other rich nations … More people than ever got to live the dream of having their own detached home … The stock of cars far surpassed the number of humans who used them’. But, he is eager to explain, ‘the boom decades of the late twentieth century were not accompanied by a boom of happiness.’

For evidence, he refers to ‘surveys’ showing that ‘people’s assessment of their own well-being’ had ‘flatlined’, and cites a few others reporting rising rates of mental conditions related to depression. None of these inculpate suburban affluence, however, or suggest people yearn to turn the clock back to before they acquired it. And nor does he explore the problems surrounding measurement of these trends.

Moreover, such direct evidence as exists points in the opposite direction. A Pew Research Center survey, for example, found that far higher percentages of suburbanites than inner-city dwellers rated their communities as ‘excellent’ (Montgomery does concede that ‘residents in America’s central cities report being even less satisfied and even less socially connected than people in suburbia’, but does his best to explain it away).   

The book openly admits that the idea of a link between unhappiness in the affluent west and urban form came from the rhetoric of Enrique Penalosa, former mayor of ‘poor and broken’ Bogota. Mr Penalosa declares that the unhappiest cities are not 'the seething metropolises of Africa or South America', but places like Atlanta, Phoenix and Miami in the US, 'the most miserable cities of all'. Montgomery acknowledges this ‘is not science’, and ‘does not constitute proof’, but still sets out to show that ‘the decades-long expansion in the American [and Australian] economy’ and sagging levels of mental well-being aren’t just simultaneous developments, but connected, especially on the plane of ‘migration … from cities to the in-between world of sprawl.’ 

Suburban Straw Man

Before such a connection is anywhere near proven, though, Montgomery rushes in to assume it exists. Early in the first chapter, he is already asking ‘everything … would suggest that this suburban boom was good for happiness. Why didn’t it work?’ The habit of asserting yet-to-be or never-to-be established conclusions is commonplace throughout the book, and shapes the structure of his argument. Opening chapters set the scene with a case study of outer-suburban life which turns out to be a terrestrial version of Dante’s inferno.

We’re introduced to the hapless Randy Straussner, a ‘super-commuter’ who drives 4 hours each workday on a round trip between his home in exurban Mountain House, California and his job 60 miles away in the San Francisco Bay Area. Most days he hits the road at 4:15 am to avoid the rush, putting off breakfast until he gets to work, and makes it back home at around 7:30 pm if ‘he was lucky.’ We’re told Randy won’t drink coffee or listen to talk radio, since ‘those just made him angry’ and aggravated ‘the pressures of the freeway.’ On arriving home, he would sometimes ‘grab a hose and water the garden until he calmed down’. Often he would hop ‘onto the elliptical trainer to straighten out his aching back’. When ‘the drive calcified his fatigue and frustration’, he drove to the gym where he could ‘sweat out his aggression.’

Further, Randy ‘did not know, like or particularly trust his neighbours’ who ‘didn’t get to know one another’, so ‘he disliked his neighbourhood intensely.’ Montgomery adds that Randy felt ‘his own family paid the price for his stretched life’. His first marriage failed and his son ‘slid off the rails’, ending up in the county jail.

Assuming this accurately accounts for Randy’s circumstances, just how representative is he of the typical outer-suburbanite? Peter Gordon, an urban economist at the University of Southern California, refers to empirical studies showing that ‘dispersed spatial structure was associated with shorter commute times’, suggesting “many individual households and firms ‘co-locate’ to reduce commute time [which] can be more easily [done] in dispersed metropolitan space …’

This is borne out by the surprising stability of commute times over extended periods. According to the US Nationwide Household Travel Survey, explains Gordon, the average metropolitan commute time was 25 minutes 2009, just one minute more than in 2001, despite relevant population growth of 12 per cent. The averages for sub-area types described as ‘suburban’ and ‘second city’ were actually lower than for the ‘urban’ or core sub-area. Analysing the INRIX Traffic Congestion Scorecard and urban density data, demographer Wendell Cox also finds support for links between higher population densities and longer commute times.

What about Randy’s other travails, are most suburbanites so estranged from their neighbours? A study cited by geographer Joel Kotkin found that for every 10 per cent drop in population density, the likelihood of people talking to their neighbours once a week rose 10 per cent. What about marital failure? Writing in the mid-2000s, Sue Shellenberger noted that ‘couples from central cities are 9 per cent more likely to crash and burn than couples from the suburbs, according to the National Center for Health Statistics.’ How about the prospect of winding up behind bars? On the basis of Brookings Institution research, Kotkin and Cox say suburban areas generally have substantially lower crime rates than ‘core cities.’

(With their painstaking attention to statistics, Kotkin and Cox are the bêtes noires of pro-density urbanists, who tend to fall back on anecdotal evidence).

‘The masses will still need suburbia’  

Use of Randy Straussner’s plight to discredit life on the urban fringe constitutes a classic Straw Man fallacy.

From there, Montgomery proceeds to zig-zag between the fictional extremes of super-commuting hell and an opposite notion of high-rise ‘verticalism’, which he claims to reject. This dialectical type of approach has the advantage of inoculating him against the charge of ignoring inconvenient facts. In coming out for ‘a hybrid, somewhere between the vertical and horizontal city’, he gets to concede many pro-suburban realities, while clinging to his firmly anti-suburban conclusions.

Concessions to suburbia on job location, home ownership and affordability, the popularity of driving, and economic dynamism are scattered throughout the book, intermixed with the general tone of disapproval.

After many pages railing against ‘super-commuting’ and ‘detached houses with modest lawns … far from employment’, for instance, Montgomery is ready to admit that: ‘the US population is projected to grow by 120 million by 2050. Where will those people live? Downtowns and first-ring, streetcar-style suburbs will be able to accommodate only a fraction of the new demographic tidal wave. Most jobs have already moved out beyond city limits anyway.' Then, quoting, he writes 'the masses will still need suburbia.’

This is noteworthy, since other green urbanists hold fast to the myth that jobs are concentrated in the urban core. Data in the 2011 American Community surveysuggests that the ‘job-housing balance’, measuring the number of jobs per resident employee in a geographic area, is ‘nearing parity’ in suburban areas of US metropolitan regions with more than a million people. This isn’t dramatically different from the position in Australia’s 6 major cities, which have some of the world’s most dispersed patterns of employment (and will share an estimated 20 million more people by 2050). It’s all consistent with Gordon’s co-location thesis.

In one chapter, Montgomery applauds his home town of Vancouver, which ‘has spent the past thirty years drawing people into density in a way that radically reversed a half century of suburban retreat.’ But he is forced to admit that ‘in 2012 Vancouver won the dubious honour of becoming the most expensive city for housing in North America. This means many people who work in the city … can’t afford to live there … '

More generally, he says ‘the forces of supply and demand have helped make housing in some of the world’s most liveable cities’ –  for which read dense cities – ‘the least affordable.’ Again: ‘as the wealthy recolonize downtowns and inner suburbs, and property values rise accordingly, millions of people are simply being excluded.’ (Always dialectical, Montgomery mostly heaps praise on dense places like Vancouver and Portland, usually rated severely or seriously ‘unaffordable’ in the Demographia International Housing Affordability Survey, while singling out dispersed Atlanta for rebuke, despite a consistent rating of ‘affordable’.)

And noting the influence of Vancouver’s high-rise density, spawning the label ‘Vancouverism’, Montgomery feels compelled to mention that ‘people living in towers consistently reported feeling more lonely and less connected than people living in detached homes.’ Later he writes that ‘most of us also want to live in a detached home with plenty of privacy and space.’

On driving, the book is full of complaints that ‘governments have continued the decades-old practice of pouring tax dollars into highways … while spending a tiny fraction of that amount on urban rail and other transit service.’ Yet there is also the qualification that: ‘drivers experience plenty of emotional dividends. When the road is clear, driving your own car embodies the psychological state known as mastery: drivers report feeling much more in charge of their lives than transit users or even their own passengers.' Montgomery lets slip the truth on popular preferences with the comment, 'roads left to the open market – in other words, dominated by private cars.'

Accordingly, the American Community Survey reports that between 2007 and 2012, ‘driving alone’ increased as the dominant mode of commuting in the United States, rising from 76.1 to 76.3 per cent of work trips. This bears some relation to the co-location of suburban residents and businesses.

‘A marvellous thing’

Amidst his oscillations, Montgomery sketches an overview that reads like an encomium to the blessings of suburbia:

The rapid, uniform and seemingly endless replication of this dispersal system was, for many people and for many years, a marvellous thing. It helped fuel an age of unprecedented wealth. It created sustained demand for the cars, appliances and furniture that fuelled the North American [and Australian] manufacturing economy. It provided millions of jobs in construction and massive profits for land developers. It gave more people than ever before the chance to purchase their own homes on their own land, far from the noise and haste and pollution of downtown.

Having acknowledged the housing, transportation, employment and wider economic advantages of dispersion and suburbanisation, Montgomery could have come to the conclusion that they offer opportunities for a better life to millions of people, and should be embraced as a legitimate option by officials and planners. But that’s not where he ends up. Insisting that the dispersed city is now ‘inherently dangerous’, he signs on for pro-density ‘new urbanism’, calling for an overhaul of zoning codes, approval processes, infrastructure planning, tax incentives and funding practices to stimulate denser and less car-dependent redevelopment, aiming for transit-friendly, walkable, mixed-use, town centres and clusters of attached town-houses and low-rise apartments.

While ‘new urbanism’ sweeps aside the advantages of dispersion, Montgomery’s misconceived ideas show that it offers nothing better. Take housing affordability. At first he toys with the faddish notion of ‘a by-law stating that 15 per cent of dwellings in every new subdivision ... must be suitable for people of low or moderate income’, a costly burden on new construction for developers and the majority of home buyers. As the Australian experience attests, this type of planning fails to offset the spike in land values which accompanies density.

Then, sensing this is far from enough, his demands escalate to the socialisation of housing supply: ‘it’s not enough to nudge the market towards equity … Governments must step in with subsidized social housing, rent controls, initiatives for housing co-operatives, or other policy measures.’ The destructive impacts of these sorts of measures on investment, market efficiency, public finances, and freedom of choice are passed over.

Later in the book, Montgomery discusses ways to draw developers into density and social housing, including changes to ‘infrastructure-funding rules, tax incentives and permit requirements.’ He contends that ‘if this sounds like a big fat bonus for property developers well it is … but the truth is, as long as we inhabit a capitalist system, the future of suburbia depends on them.’

It’s just that this isn’t capitalism as much as rent-seeking at the expense of consumers and other businesses, suppressing economic growth, opportunities and living standards. But that’s not a bad outcome for someone who extols the joys of poverty.

John Muscat is a co-editor of The New City, where this piece first appeared.

Viewing all 3795 articles
Browse latest View live


Latest Images