Quantcast
Channel: Newgeography.com - Economic, demographic, and political commentary about places
Viewing all 3794 articles
Browse latest View live

Is Portugal Facing a “Shortage Of Japanese"?

$
0
0

So, about the slow growth/debt connection: I’ve done a quick and dirty mini-RR for the period 1950-2007 ……focusing only on the G7……and if you look at it, you see that most of the apparent relationship is coming from Italy and Japan……And it’s quite clear from the history that both Italy and (especially) Japan ran up high debts as a consequence of their growth slowdowns, not the other way around.” – Paul Krugman, Reinhart-Rogoff, Continued

Despite so much intense debate about the ailment from which Portugal suffers, and the mountain of sacrifices currently being borne by the Portuguese people one fact has gone virtually unnoticed in amongst all the noise - for the first time, at least in the modern era, Portugal’s working age population has started to shrink. Demography and its possible impact on economic growth is a topic which has been largely ignored by practitioners of economic science in recent decades as population growth has by-and-large been on an upward trend. However, as we enter a new period in human history, one in which the upward trend has shifted towards stagnation or even in some cases towards long run decline, the economic and financial implications of this transformation can no longer be ignored. As Nobel economist Paul Krugman indicates in the above quote, some countries have large debt simply because they have low growth.

So what is the common thread that runs through these low-growth high-debt countries? Could it be decelerating labour force growth and eventual labour force contraction? The cases of Italy and Japan are well known. In the case of Portugal, it will be argued here, demographic trends can not only explain a significant part of the slow economic growth the country experienced during the first decade of this century, they can also help us understand the depth of the current recession. More important still, we need to think about the consequences of this continuing lose-lose dynamic for the country’s future in both the short and much longer term.

Economists didn’t always take the view that population dynamics were irrelevant to economic performance. The 1930s gave birth to a serious debate about the possible problem that would arise if many decades of strong population growth were followed by population stagnation and then decline, a debate which was provoked by the fact that birthrates in a number of countries fell below replacement level for the first time in human history during the economic depression. And among the names of those economists who took the problem seriously enough to think and write about it was none other than John Maynard Keynes.

There are, indeed, several important social consequences already predictable as a result of a rise in population being changed into a decline. But my object this evening is to deal, in particular, with one outstanding economic consequence of this impending change; if, that is to say, I can, for a moment, persuade you sufficiently to depart from the established conventions of your mind as to accept the idea that the future will differ from the past.” J.M. Keynes, Eugen Rev. 1937 April; 29(1): 13–17.

While the phenomenon has arrived largely unnoticed Portugal’s total population has long been near to stationary.


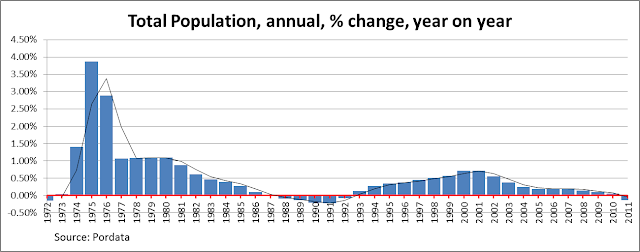
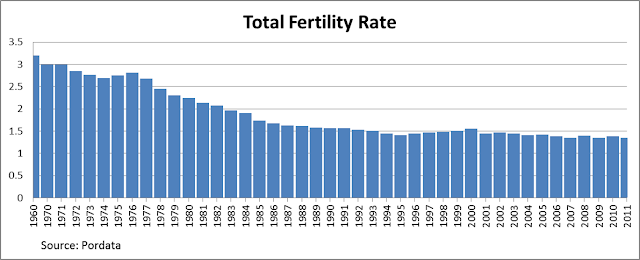
As can be seen in the above chart, Portugal’s population has been struggling to find growth momentum since the mid 1980’s (the first time numbers actually dipped downwards) but the years 2010/2011 seem to mark a more fundamental turning point, since it was in that time interval that Portugal’s population started on a long, and possibly irreversible, path of decline. Having long had a total fertility rate of below 1.5 this was a more than predictable outcome, and one that should have been expected ever since the total fertility rate fell (and stayed) below the 2.1 replacement level in 1982.


As is well known, population change is comprised of two major components: natural growth and net migration. Natural growth, births minus deaths, became negative in 2007 and thereafter population growth has become exclusively dependent on having sufficient positive net migration. Up to 2010 this condition was satisfied given the continuing influx of immigrants into the country as can be seen in the chart below.


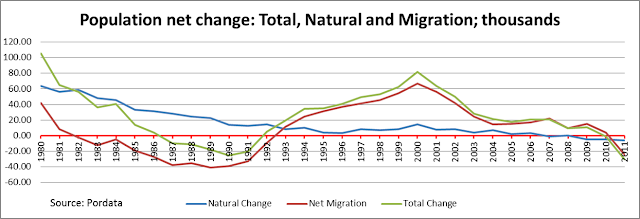
However, since the onset of the 2008 recession, not only have the immigration flows reversed completely, but emigration has started to increase again, thus reanimating a trend that has been constantly present in Portuguese history over decades, even centuries. This is perhaps the most critical factor driving the recent population decline. In fact the decline would have occurred much earlier had it not been for the return of thousands of refugees from the Portuguese colonies in the 1974-1981 period.


According to the European Commission's 2012 Ageing Report, projections for the Portuguese population during the period 2010 - 2060 anticipated that population would peak in 2034, but as we have seen, the latest data show the population unexpectedly reached its peak in 2010 (total population, previous chart), the year in which the population began to decrease (a similar phenomenon seems to have occurred in Spain in 2012, with again a reversal in migrant flows in an otherwise stagnant population being the trigger). This fact that this turnaround comes as a surprise is clearly the result over optimistic assumptions on the net migration front since the numbers for natural growth are well known and change little (although birth numbers are now dropping in many EU countries under the impact of the long recession). Clearly the unexpected factor here is the severity of the recession from which the country is suffering and the size of the exodus of young people who are leaving.

Just to highlight even more the speed with which all this is happening, in Japan, the interval between the beginning of the decline of the working age population and the beginning of total population decline was a full decade. In Portugal this interval was only two years.

Even more relevant than the decline in total population for the purpose of the present discussion is the decline in the working-age population. While the former gives us a good proxy for domestic consumption, it is the later which is important in terms of potential national output. All other things being equal a reduction in the working-age population means a reduction in output. Therefore, the most important detail to catch from the chart above is that the working-age population, defined as the population with ages ranging from 15-64, declined for the first time in Portugal between 2008 and 2009. As highlighted by both Daniel Gros and Paul Krugman if you want to compare economic growth performance as between countries with growing populations and those with declining ones the best indicator to use is undoubtedly GDP per Working Age Person (GDP/WAP).

In the Portuguese case if we take this ratio and compare it with both Real GDP growth and Working Age Population change (my calculations VM), we can get an impression of how variations in the Working Age Population affect the economic growth of a country. Surprisingly or otherwise, the data for Portugal viewed graphically not only confirms the existence of the “workforce effect” – the relationship seen between Real GDP and GDP/WAP - but also suggests that Portugal has already passed the point where this effect is beginning to have a negative impact on GDP growth.


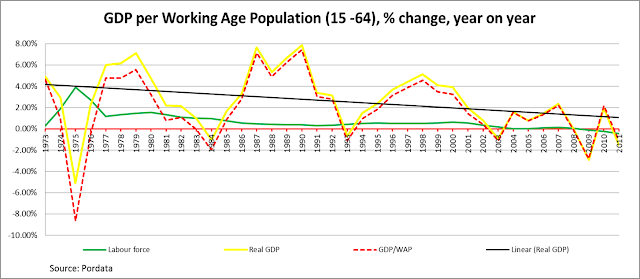
As can be seen in the above chart, until 2008 the growth rate of Real GDP was always higher than the rate for GDP/WAP offering a strong suggestion that labour force growth was having a positive impact on GDP growth. It is noteworthy, however, that both in the period 1986 - 1991 and in the period 2003 - 2008, the growth rates of Real GDP and GDP/WAP almost overlapped. This phenomenon coincided with very low or zero rates of working age population growth and as such the “workforce effect” was mostly neutral. The first of these periods, 1986 - 1991, the stagnation in the workforce was the direct result of the increase in emigration that followed the entry of Portugal in the European Union. The second one coincides with the arrival of the turning point in long term WAP growth, as the size of the working age population irrevocably turns negative.

Indeed, during this early period of emigration towards the EU Portugal’s total population decreased, as shown in the chart Population by age group (above, blue line), but at the time, since the population in general was much younger, and many more new labour force entrants were arriving at working age, the growth rate of the workforce remained slightly positive. In other words, there were still enough Portuguese entering the labour market to replace those who were leaving it (either to retire or to seek a future abroad). In the second period, 2003 - 2008, the large exit of Portuguese nationals, about 700,000 between 1998 and 2008 according to research by the now Economy and Employment Minister Álvaro Santos Pereira, was to some extent offset by an inflow of immigrants, but these were only sufficient in number to maintain the workforce at a stationary level.

All this calm and stability disappeared, however, after 2008 when the growth rate of Working Age Population turned negative, i.e. the labour force began to decline (see graph below). Where the growth rates of Real GDP and GDP/WAP overlap we can surmise that working age population change is having no effect on real GDP growth. Subsequently, however, the growth rate of GDP/WAP becomes higher than the growth rate of Real GDP and thus the "workforce effect” starts to act as a drag on the economy steadily bringing the potential overall growth rate down. In other words, Portugal is now suffering from a "Shortage of Japanese" as Edward Hugh has called the phenomenon, after Paul Krugman originally coined the term to describe the underlying problem which has been afflicting the Japanese economy since the mid-1990s.


The fact that the three lines in the above chart happen to intersect at zero is perhaps just an unfortunate coincidence but is consequences are disastrous, since the downward trend that was already evident accelerated greatly after the onset of the recession. The resulting rise in unemployment not only caused a collapse in the immigration flow, it also led to a sharp increase in emigration. As a result workforce shrinkage intensified even further, as can be seen in the above chart by looking at the growing distance between the Real GDP and the GDP/WAP lines. That is, if the workforce had remained stationary the economy would be growing at similar rates to the GDP/WAP, i.e. above the current level as indeed happened in the period 2003 – 2008.

Naturally, the argument can be advanced here that the recession is a cyclical phenomenon, and this is surely true, there is an ongoing cycle, but the argument being used refers to long term trends – a reversal in direction (or change of sign) for inputs from the labour force component brings down the overall trend growth rate making booms weaker and recessions deeper, all other things being equal. This would seem to be a simple conclusion which stems from elementary growth accounting theory. Naturally, there are other factors which contribute to growth, like multi factor productivity, but again other things being equal you would need more of this to achieve the same growth rate as before under conditions of weakening in the labour force growth component.

Thus the argument is not that economic growth becomes impossible with a stagnant or slowly declining workforce, but simply that it becomes harder to achieve because it relies more on other factors, such as productivity and raising participation rates, but these change slowly over time, and more so in already developed countries. As such trend growth will surely steadily fall. This can be clearly seen in the following chart: while workforce growth was an important source of growth when Portugal was a developing country, its importance fell back as the workforce started to stagnate even as Portugal was approaching converge with other developed countries in terms of productivity. Other factors took over and increased their importance steadily as the economy started to converge with more advanced ones. Now that this catch up process seems to have come to a standstill as well the economy simply can’t growth, at least at rates considered normal. With a stagnant workforce, low growth or no growth is the new normal.


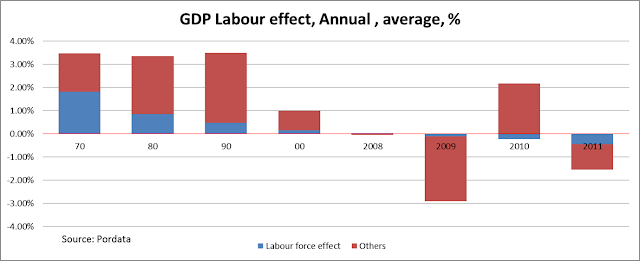
Following standard growth accounting procedures, during the 1970s workforce growth accounted for more than half of Portuguese economic growth (see chart above, my calculations VM), and this contribution had fallen to only 16% in the first decade of this century. However, since 2008 not only has this contribution reversed sign but also the magnitude of the negative effect has begun to increase rapidly. Such that, by 2011 the “workforce effect” could be considered to explain more than 29% of the GDP decline. This “negative drag” will continue, and the effect possibly become greater, as the working age population shrinks further. Had the workforce remained stationary we could surmise the 2010 recovery would have been more pronounced and the 2011 recession wouldn’t have been so deep. This is the principal reason why official growth forecasts have been being constantly revised to the downside, and this will continue to happen until the models the forecasters use adequately incorporate the effects of population decline on economic growth. Adding insult to injury, ignorance of the existence of such effects recently led Portugal’s Prime Minister Pedro Passos Coelho to suggested young unemployed Portuguese resort to emigration as an escape route from the crisis, advice thousands have now followed thus making a bad situation even worse.

Economic growth in Portugal appears to be on a long downward trend, a trend which will only be made worse by the onset of the decline in its working age population. Economic output is now at 2001 levels and thus we can now conclude that the last decade has been completely lost. More worryingly though, is that after such a bad start to this decade, it might not be unreasonable to conclude that this one is also in the process of being lost too.

At best the economy will stagnate in the years to come but the possibility is there that it will continue to regress – especially if nothing is done to stem the outflow of young educated people - and by 2019 it might even be back somewhere in the 1990’s. This is scenario simply cannot be excluded since, in addition to all the other problems the country faces, a situation that would be in any circumstance challenging is now being aggravated by one more variable whose contribution cannot be easily reversed in the short term – the decrease in the working age population. More than the fact in itself, it is the speed at which this is happening which is alarming, and the fact that policymakers appear unaware of the problem. In analyzing the low Portuguese economic growth issue the decrease in the country’s working age population can no longer be ignored! Or at least it is hoped that this will be one of the outcomes of this short report.

To return to where we started, Keynes concluded in his pioneering presentation that a stationary or slowly declining population could increase its standard of life while preserving the institutions society values most if, and only if, the process was managed with the necessary strength and wisdom. On the contrary, he argued, a rapid decline in population, of the kind that we are seeing in Portugal today, would almost inevitably result in a serious decline in living standards and a breakdown in highly valued social security mechanisms. The distinction Keynes drew some 80 years ago between rapid and managed rates of decline seems plausible, reasonable and highly relevant today. What we now need to see are urgent measures taken – initiated by the EU and the IMF - to counter the exodus which lies behind this dramatic decline which is occurring before our eyes, measures which at least try to decrease its speed, because once a process like this gains full velocity it will be very difficult to stop, and we have already seen it gather considerable traction. Ireland is a pointer and a great example to learn from, since it took that country more than a century to recover the population decline precipitated by the Great Famine which hit the country in the middle of the nineteenth century.

Valter Martins is a self-taught economist and his research interests include demographics and its impact on economic growth. He holds a degree in International Business from University of Minho, Portugal and a Professional Diploma in Financial Advice (QFA) from Ireland.


City Leaders Are in Love With Density but Most City Dwellers Disagree

$
0
0

People care deeply about where they live. If you ever doubt that, remember this: they staged massive protests over a park in Istanbul. Gezi Park near Taksim Square is one of that ancient city’s most beloved spots. So in June, when Prime Minister Recep Tayyip Erdogan threatened to demolish the park to make room for his grandiose vision of the city as “the financial center of the world,” the park’s neighbors and supporters took to the streets. The protests were directed against what has been described as “authoritarian building”—the demolition of older, more-human-scaled neighborhoods in favor of denser high-rise construction, massive malls, and other iconic projects.

Other protests, usually more peaceful, but sparked by a similar revulsion against gigantism, have erupted in cities as various as Sao Paolo, Singapore, and Los Angeles. But what is most striking are the eerily similar reactions of mayors, city planners, architects, and developers, all of whom seem remarkably tone deaf to the wishes of their constituents.

New York’s Mayor Michael Bloomberg, for example, is a tireless advocate for more density in the Big Apple. Along with many of the world’s leading academic, media, and real estate leaders, Bloomberg dreams of a future where urban dwellers live cheek by jowl in ever-closer proximity. Bloomberg’s notions are supported not only by developers but also a large cadre of academics, such as Columbia University’s Kenneth Jackson, who considers dissent from the mayor’s plans an affront to “Gotham’s towering ambitions” by reactionary “opponents of change.”

There’s just one problem with this brave new condensed world: most urban residents aren’t crazy about it. In the United States and elsewhere, people, when asked, generally say they prefer less dense, less congested places to live. The grandiose vision of high-rise, high-density cities manifestly does not respond to the actual needs and desires of most people, who continue to migrate to the usually less congested, and often less expensive, periphery. And as the people’s desires continue to run counter to what those in power dictate, the urban future is likely to become increasingly contentious.

Protests over urban development priorities similar to Istanbul’s occurred earlier this year in São Paulo, where the government is accused of putting mega-projects ahead of basic services such as public transport, education, and health care, particularly in the run-up to the 2014 World Cup and the 2016 Olympics.

Singapore, often held up as a role model for densification, has seen growing concern about the destruction of historic structures, ever-more crowded subways, escalating house prices, and lack of open space. Similarly in Los Angeles, neighborhood councils have rallied against attempts to build denser buildings, which generate more congestion and erode local character. In London, too, attempts to build what the Independent describes as “the tall, the ostentatious, the showy and ‘iconic’” have been widely criticized for undermining the human-scaled nature ofLondon. Densification may be revealed religion to British planners, but this faith is not well accepted by citizens who live nearby. Novelist Will Self noted the “Wizard of Oz–hollowness” of these structures that seek to inspire but also “belittle us” with the mass, scale, and stand against this great city’s historic grain.

Even in Manhattan, the red-hot center of American ultra-density, eight of the island’s 10 community boards oppose Mayor Bloomberg’s attempts to densify midtown. The midtown project has prompted Yale architect Robert Stern, a devoted urbanist and no opponent of density, to warn that too much high-rise development creates a dehumanized aesthetic that chases away creative businesses and tourists, while preserving older districts attracts them.

Voting With Their Feet

The growing disconnect between people and planners is illustrated by the oft-ignored fact that around the world the great majority of growth continues to occur on the suburban and exurban frontier, including the fringes of 23 out of 28 of the world’s megacities. This, notes NYU professor Shlomo Angel in his landmark book A Planet of Cities, is true both in developing and developed countries.

In Europe, immigration has slightly boosted populations in urban cores, but the flow of domestic migration still heads towards the periphery. The evidence is even more telling in the U.S. In the last decade, nearly 90 percent of all metropolitan growth in this country took place in suburban locations, up from the previous decade. At the same time, a net 3.5 million people left our largest metropolitan areas—those over 10 million—while the majority of growth took place in cities under 2.5 million. Between 2000 and 2010, a net 1.9 million left New York, 1.3 million left Los Angeles, 340,000 left San Francisco, and 230,000 left both San Jose and Boston.       

This is not what you read regularly in the New York Times or the Wall Street Journal. Young reporters, virtually all of whom live in dense, expensive places like New York or Washington, believe the world is the one they know first-hand, the one in which they and their friends reside. Yet most Americans are not young, highly educated Manhattan residents. Many downtown areas may have experienced a substantial boost in numbers over the last decade, but this accounted for less than 1 percent of the 27 million in population growth experienced by the nation between 2000 and 2010. The total population increase in counties with under 500 people per square mile was more than 30 times that of the increase in counties with densities of 10,000 and greater.

All of this flies in the face of the argument, made by a well-funded density-boosting industry, that people want more density, not less. Lobbies to force people back into cities enjoy generous funding provided by urban land interests and powerfulmultinationals that build subways and other city infrastructure to bolster the cause of ever greater density.

These interests speak about cities as if they were giant Lego constructions to be toyed with at the whim of planners or developers. But they neglect the things that matter to people in their daily lives: privacy, room to raise children, the desire for a backyard, decent schools, and safe streets. Roughly four in five home buyers, according to a 2011 study conducted by the National Association of Realtors and Smart Growth America, for example, prefer a single-family home, something that is anathema to the densifiers.

The Political Economy of Density

In the Obama era, the cause of densification has gained strong support at HUD, EPA, and other agencies. Yet this is hardly an issue any sane politician—outside New York anyway—wants to run with. People pretty much everywhere naturally resist increasing densification and gigantism—and favor what the Taksim Squareprotesters call a drive for “healthy urbanization and livable city.” 

Densifiers also claim their work makes cities richer, yet the nation’s greatest wealth-creator—Silicon Valley—is essentially suburban, and the world’s wealthiest metropolitan area—greater Hartford, Connecticut—is largely a collection of bucolic towns and suburbs with a density nearly as low as Atlanta’s. In addition, nearly all urban cores, including New York and Chicago, have considerably higher unemployment rates than their much-dissed suburban rivals. Overall, notes demographer Wendell Cox, 80 percent of the last decade’s urban population growthcame from people below the poverty line, compared with one third in suburbs.

The new urban densification also shifts the role of the city from an aspirational model to what might be called the geography of inequality. Economists such as Ed Glaeser speak about density as an unalloyed factor in wealth creation, but they rarely factor in such things as cost of living, or in how such factors affect the middle and working classes.  

Glaeser’s favorite city, New York, is also America’s most unequal metropolis, where the 1 percent earn roughly twice as much of the local GDP than is earned in the rest of country, and where the average paycheck, when controlled for costs, is among the lowest among the nation’s 51 largest metro areas, behind not only San Jose, but Houston, Raleigh, and a host of less celebrated burgs. These inequalities are precisely what opened the door for the previously obscure leftist Bill de Blasio to make his impressive mayoral run. And Gotham’s great rival, London, according to one recent study, now may be the most unequal major city in the Western world.

Yet rather than re-think density, planners and powerful urban land interests continue to force ever higher-density development down the throats of urban dwellers. In the already pricey San Francisco Bay Area, for example, municipal planners have embraced what is known as a “pack and stack” strategy that will essentially prohibit construction of all but the most expensive single-family homes, prompting one Bay Area blogger to charge that “suburb hating is anti-child,” because it seeks to undermine single-family neighborhoods.

Unsustainable Post-Familial Cities of Asia

Perhaps the key measurement of social sustainability is the willingness of people to have children. Historically we fear overpopulation, but increasingly, at least in high-income countries, the real challenges may be over rapid aging and a diminished workforce. There is a countries, the real issue is now below replacement birthrates and rapid aging. High-density environments such as Manhattan, San Francisco, Seattle, Washington, D.C., or Boston invariably have the lowest percentages of children in the country, with Japan-like fertility rates (by 2050 there may well be more Japanese over 80 than under 15).

The negative impacts of densification are even more evident in the fast-rising cities of the developing world, where most of new high-rise office and residential towers are being erected. In 1980 the world’s 10 tallest buildings were found in New York, Chicago, Houston, and Toronto. Today, only one building in North America—the Sears Tower in Chicago, built in 1973—ranks among the world’s tallest. The rest are located in Dubai, Mecca, Kuala Lumpur, Shenzen, Nanjing, Taipei, Hong Kong, and Shanghai, where the world’s second-tallest building is nearing completion.

These towers symbolize Asia’s economic ascendency, but they also seem to diminish grassroots economies and discourage family formation. The ultradense cities of East Asia—Hong Kong, Singapore, and Seoul—have among the lowest fertility rates on the planet. Tokyo and Seoul now have fertility rates around one child per family while Shanghai’s has fallen to 0.7, among the lowest ever reported, well below the “one child” mandate and barely one-third the number required simply to replace the current population. Due largely to crowding and high housing prices, 45 percent of couples in Hong Kong say they have given up having children.

Some Asian urban residents, if they can, now seek to leave these cities—among the most widely praised by urbanists—for more affordable and lower density locales. This is evident in rising emigration from China’s citiesHong Kong, and Singapore, where roughly one in 10 citizens now chooses to settle abroad, mostly in lower density countries like Australia, Canada and the United States.

To some, this boils down to an issue of health. Dense urbanization, notes a recent Chinese study, engenders more obesity, particularly among the young, who get less exercise, and spend more time desk-bound. Stroke and heart disease have become leading causes of death. These concerns have led, even in authoritarian China, to growing grassroots protests, many of them targeted at new industrial plants located near cities, including Shanghai.

Perhaps no developing city better reflects the brutalism of Asia’s emerging urban paradigm than Seoul, the densest of the high-income world’s urban areas over 10 million (megacities). The Korean capital is more than 2.5 times as crowded as Tokyo, twice as dense as London and five times as crowded as New York. No surprise then that urban pundits love the place, as epitomized by a glowing report in Smithsonianon Seoul as “the city of the future.” Architects, naturally, join the chorus. In 2010, the International Council of Societies of Industrial Design named the Seoul the “world design capital.”

Rarely considered, however, is whether this form of urbanization creates a good place for people, particularly families. Korea is already among the unhappiest places on earth, according to a recent  study by the Organization for Economic Cooperation and Development (OECD) and, not surprisingly, suffers a birthrate even lower than Singapore’s.   

Seoul is, as its boosters claim, fully modern but also both highly congested and aesthetically barren. The result, notes one recent Korean newspaper article is one of the most dehumanized and aesthetically unappealing cities on the planet. MIT architecture professor Lee Kwanghyun charges that over the past decade, development has effectively replaced Seoul’s once unique neighborhoods with seemingly endless blocks of 200-foot high white concrete boxes.     

Public opposition to this approach has been mounting, and Seoul’s city government recently suspended a “new towns” proposal that sought to knock down the city’s last remaining low-density areas. Not surprisingly, Koreans have been rejecting the hyper-dense core of Seoul, which has lost nearly 1 million residents (10 percent) in 20 years, with residents and migrants from elsewhere in the country heading for the relatively less dense suburbs.

The City of Disappointment

The damage done to people by megacity urbanism is most pronounced in poorer countries. My colleague Ali Modarres calls places like Tehran “cities of disappointment.” There, he notes, high housing prices and lack of space have already reduced the birthrate to well below the replacement level, a phenomena he also sees in such unlikely places as urban Tunis, Istanbul, and many otherdeveloping cities in the Islamic world. As in Asia, Modarres says, marriage rates are dropping and increasingly many women are choosing to remain single—heretofore something rare in these countries.

In cities like Tehran, Modarres says, housing has become equated with living in a small apartment/condominium in a residential building. Rarely does the younger population think about housing in terms of a detached single-story building. And the exorbitant cost of housing in such a high-density city in turn creates constant worries about money and housing—having even one child is prohibitively expensive.

Gigantism’s effects in the developing world—where much of the most rapid urban growth is now taking place—is even more profound. In Mumbai, home to 20 million people, life expectancy for city residents is at least 10 years below the life expectancy of their country cousins, even though urban residents have much better access to health care. And nearly four of five urban households complain about contaminated water. In 1971, slum dwellers accounted for one in six Mumbai residents. Today, they constitute an absolute majority.

Indeed, much of the population of most developing country cities—such as Mexico City, Cairo, Jakarta, Manila, Lagos, Mumbai, and Kolkata, megacities all—continue to live in “informal” housing that is often unhygienic, dangerous, and subject to all kinds of disasters, natural or man-made. Moreover, many of these unmanageable megacities—most notably Karachi—offer ideal conditions for gang-led rule and unceasing ethnic conflict.

Remarkably, many Western pundits find much to celebrate in megacities mushrooming in low-income countries. To them, the growth of megacities is justified because it offers something more than unremitting rural poverty. But surely there’s a better alternative than celebrating slums, as one prominent author did recently inForeign Policy.

In the mainstream press, there’s even a tendency to engage in what one critic has labeled “slumdog tourism.” A recent National Geographic article, for example, celebrated the entrepreneurial spirit of Kinshasa’s slum dwellers, which is understandable, but underplayed the miserable conditions in which the majority of Kinshasa’s eight million residents are forced to live. That city, which Belgian researchers described as an example of “aborted urban development,” suffers from high crime, poor drinking water, and pervasive informal housing. Similar conditions exist in virtually all of Africa’s largest cities, which are growing as fast as any in the world.

Toward a Human City

Rather than concocting sophisticated odes to misery, perhaps we might consider a different approach to urban growth. Perhaps we factor in what exactly we are inflicting on people with “pack and stack” strategies. Planners often link density with community, notes British social critic James Heartfield, but maintaining that “physical proximity that is essential to community is to confuse animal warmth with civilization.” When University of California at Irvine’s Jan Brueckner and Ann Largey conducted 15,000 interviews across the country, they found that for every 10 percent drop in population density, the likelihood of people talking to their neighbors once a week goes up 10 percent, regardless of race, income, education, marital status, or age.  In 2009, Pew recently issued a report that found suburbanites to be the group far more engaged with their communities than those living in core cities.

A market—or simply human—approach would permit a natural  shift towards smaller, less dense cities and, yes, the suburbs, where more people end up wanting to live. Those who prefer high-density living would still have their opportunity if they so desire. In the developing world, we might to find ways of making villages and smaller cities more attractive, perhaps through the development of local industries, farm-to-market agriculture, and even high-tech development. “We are copying the Western experience in our own stupid and silly way,” says Ashok R. Datar, chairman of the Mumbai Environmental Social Network. “For every tech geek, we have two to three servants. The villages pour out and the city gets more crowded.”

The primary goal of a city should not be to make wealthy landlords and construction companies ever richer, or politicians more powerful. Instead, we should look for alternatives that conform to human needs and desires, particularly those of families. Urbanism should not be defined by the egos of planners, architects, politicians, or the über-rich, who can cherry-pick the best locales in gigantic cities. Urbanism should be driven above all by what works best for the most people.

This story originally appeared at The Daily Beast.

Joel Kotkin is executive editor of NewGeography.com and Distinguished Presidential Fellow in Urban Futures at Chapman University, and a member of the editorial board of the Orange County Register. He is author of The City: A Global History and The Next Hundred Million: America in 2050. His most recent study, The Rise of Postfamilialism, has been widely discussed and distributed internationally. He lives in Los Angeles, CA.

Skyline photo by Bigstock.

Fast-Growing Mining and Oil & Gas Industries, and the Huge Number of Supply-Chain Jobs They Create

$
0
0

The fastest-growing industry in the U.S since 2010 isn’t large or well-known. In fact, nearly half of the estimated 5,100 jobs in support activities for metal mining are located in one state: Nevada. Nonetheless, employment in this niche mining industry has ballooned 53% since 2010, and it creates a huge number of supply-chain jobs in other parts of the economy.

Four of the five fastest-growing industries from 2010-2013, based on EMSI’s 2013.2 employment dataset, are related in some form to mining and oil & gas. These industries (e.g., oil & gas pipeline construction and support activities for oil & gas operations) have been carried by the boom in oil and natural gas production in pockets of the U.S., from North Dakota to Pennsylvania to Texas. And their growth has sparked new jobs in other sectors.

This is especially the case for support activities for metal mining. For every job in this industry, another 6.1 supply-chain jobs are created elsewhere. That means the tiny industry accounts for a much more significant 36,180 jobs in all. (Note: This does not count the induced effects that come when employees and other income claimants spend what they make on food, clothes, and other goods and services.)

NAICS CodeDescription2013 Jobs % Change Since 2010Supply-Chain Jobs MultiplierTotal Supply-Chain Jobs
Source: EMSI Wage-and-Salary and Self-Employed Workers (2013.2) and EMSI Input-Output Model
213114Support Activities for Metal Mining5,10353%7.0936,180
212322Industrial Sand Mining5,24149%1.759,172
237120Oil and Gas Pipeline and Related Structures Construction145,87049%1.68245,062
213112Support Activities for Oil and Gas Operations302,07743%2.15649,466
212234Copper Ore and Nickel Ore Mining15,10937%2.740,794
532412Construction, Mining, and Forestry Machinery and Equipment Rental and Leasing70,15136%2.74192,214
333132Oil and Gas Field Machinery and Equipment Manufacturing78,50232%2.12166,424
212221Gold Ore Mining15,73832%1.8629,273
211112Natural Gas Liquid Extraction6,37428%1.8511,792
TOTAL644,1651,380,376

Mining and similar extraction-based industries take a lot of equipment and materials to operate, so their growth is felt by a wide variety of suppliers. Altogether, the nine mining and oil & gas industries highlighted above — all of which have grown at least 28% since 2010 — account for 644,165 estimated jobs. And when you consider the spin-off jobs in their supply chain, the employment number more than doubles to 1,380,376. (As reader Gene Hayward calculated, when you add the direct and supply-chain jobs created since 2010, these nine industries account for nearly 600,000 total jobs created in three-plus years. Keep in mind EMSI’s 2013 job numbers are estimates and are based on historic and projected data).

To understand what we mean by “supply-chain jobs,” it’s helpful to look at the different components of EMSI’s job multiplier:

  • Initial: Jobs in the focus industry (e.g., support activities for metal mining).
  • Direct: Jobs in the supplying industries.
  • Indirect: The subsequent ripple effect in further supply chains. These are the suppliers of the suppliers.
  • Induced: This change is due to the impact of the new earnings created by the initial, direct, and indirect changes (otherwise known as the income effect). These earnings enter the economy as employees spend their paychecks in the region on food, clothing, and other goods and services.

As we mentioned earlier, we’ve only included the first three components in this analysis. These are the jobs directly related to these industries’ supply chains, and the indirect suppliers of their supply chain. So these industries, especially support activities for metal mining, have deep roots in the economy — the more they grow, the more the economy as a whole grows. But how do the supply-chain job multipliers in these mining and oil & gas industries compare to other export-based industries?

Comparing Supply-Chain Multipliers

Support activities for metal mining packs serious job-creation punch, and its 7.1 supply-chain job multiplier compares favorably with other industries with hefty multipliers. The largest supply-chain multiplier in the mainstream manufacturing sector belongs to light truck and utility vehicle manufacturing (a whopping 15.0), while cyclic crude and intermediate manufacturing and cheese manufacturing are both at 10.2. This means that every job in these these heavyweight sectors leads to between nine to 14 new jobs in the U.S.

supplychainmultipliers

Impressive. But various processing and refining industries have even larger supply-chain multipliers. The largest supply-chain multiplier in the U.S. is petroleum refineries (20.8), followed by soybean processing (19.1). What makes an industry’s multiplier so large (or so small)? Here’s an explanation from EMSI co-founder and chief economist Hank Robison:

The size of supply-chain employment multipliers generally reflects a mix of three things: 1) the number and complexity of steps involved in producing the good, 2) capital requirements, and 3) the vertical integration of the production process (in a vertically integrated industry most of the production steps occur within the industry itself). Producing a quart of common motor oil provides a good example of a process resulting in a large employment multiplier. Producing refined oil products entails a complex many-stepped process – starting with exploration, and then drilling, oil field to refinery transportation, testing, treating and refining, and finally packaging of the end product. Oil refining is as capital intensive as it gets; refineries represent enormous capital investments, with sophisticated cracking towers, gauges, piping and more. And finally the production of refined oil products reflects a very disintegrated production process: the bulk of the labor embodied in the final product is added in the earlier production steps, e.g., in exploration, drilling, transport, etc. It is little wonder then that at 20.83, the supply-chain employment multiplier for the petroleum refining (NAICS 324110) sector is the largest of all employment multipliers in the US IO Model.

Consider now an industry at the other end of the supply-chain employment multiplier spectrum, soil preparation, planting, and cultivating (NAICS 115112). Operating under contract from farmers, firms in this sector conduct a variety of basic farm support activities. Their capital investment in tractors, tillers and such is relatively modest, and they often use the equipment of the contracting farmer. Compared to manufacturing, and most other sectors, their production process entails few steps: buy some fuel, maybe some seed, and go to work. There is little room for vertical integration as they add all but the smallest sliver of the labor entailed in delivering their end product – season-ready land. It is little wonder that their supply-chain employment multiplier is a mere 1.02, one of the lowest of all supply-chain employment multipliers in the US IO Model.

SupplyChainMultipliers_Low

Joshua Wright is an editor at EMSI, an Idaho-based economics firm that provides data and analysis to workforce boards, economic development agencies, higher education institutions, and the private sector. He manages the EMSI blog and is a freelance journalist. Contact him here.

Health, Happiness, and Density

$
0
0

The proponents of currently fashionable planning doctrines favouring density promulgate a variety of baseless assertions to support their beliefs. These doctrines, which they group under the label of “Smart Growth”, claim, among other things, that from a health and sustainability perspective, the need to increase population densities is imperative.

With regard to health these high-density advocates have seized upon the obesity epidemic as a reason to advocate squeezing the population into high-density. This is based on a supposition that living in higher densities promotes greater physical activity and thus lower levels of obesity.  They quote studies that show associations between suburban living and higher weight with its adverse health implications. But the weight differences found are minor – in the region of 1 to 3 pounds. Nor do the studies show it is suburban living that has caused this.

The suburbs, after all, have been with us for 70 years and reached its mature development over 40 years ago. Obesity, on the other hand, is a much more recent phenomenon and is primarily due to people eating too much fattening food.

Less discussed, however, are other facets to human health and it is important to consider the results of research on the association with high-density living of mental illness, children’s health, respiratory dsease, heart attacks, cancer and human happiness.

A significant health issue relates to the scourge of Mental Illness. There is convincing evidence showing adverse mental health consequences from increasing density.

A monumental Swedish study of over four million Swedes examined whether a high level of urbanisation (which correlates with density) is associated with an increased risk of developing psychosis and depression. Adjustments were made to cater for individual demographic and socio-economic characteristics. It was found that the rates for psychosis (such as the major brain disorder schizophrenia) were 70% greater for the denser areas. There was also a 16% greater risk of developing depression. The paper discusses various reasons for this finding but the conclusion states: "A high level of urbanisation is associated with increased risk of psychosis and depression".

Another analysis, in the prestigious journal Nature, discusses urban neural social stress. It states that the incidence of schizophrenia is twice as high in cities. Brain area activity differences associated with urbanisation have been found. There is evidence of a dose-response relationship that probably reflects causation.

There are adverse mental (and other) health consequences resulting from an absence of green space. After allowing for demographic and socio-economic characteristics, a study of three hundred and fifty thousand people in Holland found that the prevalence of depression and anxiety was significantly greater for those living in areas with only 10% green space in their surroundings compared to those with 90% green space.

High-density advocates seem most oblivious to the needs of children. Living in high-density restricts children’s physical activity, independent mobility and active play. Many studies find that child development, mental health and physical health are affected. They also find a likely association of high-rise living with behavioural problems.

An Australian study of bringing up young children in apartments emphasizes resulting activities that are sedentary. It notes there is a lack of safe active play space outside the home – many parks and other public open spaces offer poor security. Frustrated young children falling out of apartment windows can be a tragic consequence. Children enter school with poorly developed social and motor skills. Girls living in high-rise buildings are prone to increased levels of overweight and obesity.

A British study found that 93% of children living in centrally located high-rise flats had behavioural problems and that this percentage was higher than for children living
in lower density dwellings. Anti-social behaviour often results. An Austrian study showed disturbances in classroom behaviour higher for children living in multiple-dwelling units compared to those living in lower densities. 

There is also evidence of other potential health impacts on children living in higher density housing. These include short-sightedness due to restricted length of vision, and diminished auditory discrimination and reading ability due to exposure to noise.

Air pollution increases with density. This results from higher traffic densities together with less volume of air being available for dilution and dispersion. Nitrogen oxides in this pollution have adverse respiratory effects including airway inflammation in healthy people and increased respiratory symptoms in people with asthma. There is consistent evidence that proximity to busy roads, high traffic density and increased exposure to pollution are linked to a range of respiratory conditions. These can range from severe conditions (such as a higher incidence of death) to minor irritations. Moreover, these respiratory health impacts affect all age groups.

Several studies relate low birth weight to air pollution. A South Korean report, for example, found the pollutants carbon monoxide, nitrogen dioxide, sulfur dioxide, and total suspended particle concentrations in the first trimester of pregnancy pose significant risk factors for low birth weight.

Air pollution particulates are associated with killing more people than traffic accidents. Pollutants such as those emitted by vehicles are significantly associated with an increase in the risk of heart attacks and early death.

Cancer is a major health scourge and a relationship between increased colon cancer, breast cancer and total cancer mortality with population density has been found.

There is an association between overall Human Happiness and density. Professor Cummins’ Australian Unity Wellbeing Index reports that the happiest electorates have a lower population density. A United States study finds the satisfaction of older adults living in higher density social housing reduces as building height increases and as the number of units increases. By contrast, in lower densities there are higher friendship scores, greater housing satisfaction, and more active participation. This does not apply only to single family houses: Residents of garden apartments have a greater sense of community than residents of high-rise dwellings.

An example of misinformation on this issue can be found in R.D. Putnam’s famous book “Bowling Alone”.  Putnam states that "suburbanisation, commuting and sprawl" have contributed to the decline in social engagement and social capital.  However I have shown that data from charts in his book indicate quite the opposite:

Adapted from Figure 50, Putnam R D, Bowling Alone, Simon & Schuster, New York, 2000

This shows that involvement in these social activities are more common in the suburbs than in the denser centres of cities (and that they become more common as the community size and density decreases).

Community contentment relating to the density of surroundings is revealed by a study in New Zealand that asked people if the type of area they would most prefer to live in is similar to the area they currently live in. The responses are shown in this table.


So 90% of rural residents would prefer an area similar to their current area but only 64% of central city dwellers would prefer an area similar to their current surroundings.  It can be seen that satisfaction decreases as density increases.

Thus evidence from a variety of sources points to greater human happiness and better health in lower densities --- the exact opposite of the theories of the advocates for “cramming” people into ever small places.

(Dr) Tony Recsei has a background in chemistry and is an environmental consultant. Since retiring he has taken an interest in community affairs and is president of the Save Our Suburbs community group which opposes over-development forced onto communities by the New South Wales State Government.

Sydney suburb photo by BigStockPhoto.com.

The Next Urban Crisis, And How We Might Be Able To Avoid It

$
0
0

Urban boosters are rightly proud of the progress American cities have made since their nadir in the 1970s; Harvard economist Ed Glaeser has gone so far as to proclaim “the triumph of the city.” Yet recent events — notably Detroit’s bankruptcy and the victory of left-wing populist Bill de Blasio in the Democratic primary of the New York mayoral election — suggest that the urban future may prove far more problematic than commonly acknowledged.

Detroit’s bankruptcy revealed the unsustainable fiscal problems facing most major urban centers, including, most importantly, President Obama’s political base of Chicago. This summer, Moody’s downgraded the Windy City’s credit rating three notches, noting the unsustainable nature of its pension obligations. Some 37 cities have filed for bankruptcy since 2010, most of them small, and as many as 20 others may be on the verge, including larger places like the California cities of Oakland and Fresno, and Providence, R.I.

My hometown of Los Angeles may not be far behind. Perhaps the most union-dominated big city in America, the City of Angels’ pension obligations have gone from 3% of the city budget a decade ago to 18% last year. They are rising at a phenomenal 25% annual rate, according to a recent report by an independent watchdog, California Common Sense.

Given this background, the political tides in New York suggest a worsening of the crisis. Thanks to the Bernanke-inspired Wall Street boom, the New York economy has not suffered the extreme fiscal distress of other big cities. But its fiscal condition is far worse than Mayor Michael Bloomberg and his well-oiled media machine might suggest. Under Bloomberg city spending grew 55% while pension costs have grown 300%.

With de Blasio likely to be the next mayor, we can expect the bleeding to get worse. Many business people rightly fear a de Blasio’s administration will raise taxes in order to meet public employee demands. Faced with financial shortfalls, de Blasio’s response, notes historian Fred Siegel, is likely to be similar to that of his hero, former Mayor David Dinkins, who consistently gave in to public unions and raises taxes.

But it’s not enough to dismiss de Blasio as a throwback. His victory reveals the depth of a profound social crisis beneath the glitz and glitter of Bloomberg’s luxury city. Similar class and geographic divisions can be seen throughout the country but inequality seems most egregious in New York. A recent analysis of inequality by University of Washington demographer Richard Morrill found New York to be the least egalitarian big metro area in America.

This is borne out by other research: the New York City comptroller’s office found that the top 1% account for roughly a third of Gotham’s income, twice as high a share as in the rest of the country. Incomes have surged on Wall Street but most New Yorkers — two-thirds of whom are racial minorities — have struggled to keep pace. Controlling for cost, in fact, the New Yorker’s average paycheck is among the lowest among the nation’s 51 largest metro areas. Nearly half the city’s residents, notes theNation, are either below the poverty line or just above it.

Bloomberg’s policy focus on ultra-dense development geared to Wall Street, the global rich, and the needs of the all-powerful, largely Manhattan real estate community has done very little for the vast majority of New Yorkers. This reality has lent credibility to de Blasio’s “tale of two cities ” stump speech and the growing rejection of Bloomberg’s legacy.

Not that all of this can be laid at Bloomberg’s feet. New York’s economy has been changing for decades. New York of the 1950s was a manufacturing, trade and fashion superpower, employing hundreds of thousands of middle- and working-class residents. Large corporations employed large numbers of white- and pink-collar workers. This made New York, although always with its extremes, still a very middle- and working-class city.

New York’s blue-collar economy has withered to a degree unmatched in most other U.S. cities. The port, the city’s original raison d’etre , lost its primacy to Los Angeles-Long Beach by 1980 and now ranks third in cargo value behind Houston-Galveston as well. The manufacturing sector, which employed a million in 1950, has shriveled to 73,000 jobs today (note that a small part of the decline is due to the BLS’ reclassification of some jobs to other sectors, and other statistical changes). Manufacturing employment in NYC has shrunk 39% since 2004, the worst performance of any major metropolitan area.

A similar, albeit less dramatic decline has occurred in white-collar employment, in part due to the movement of large companies out of the city. In 1960 New York City boasted one out of every four Fortune 500 firms; today there are 46. And even among those keeping their headquarters in Gotham, many have shipped most of their back office operations elsewhere. Employment has even dropped in the “booming” financial sector, down 7.4% since 2007. The big employment gains have been almost entirely concentrated in the low-wage hospitality and retail sectors.

If inequality is now greater in New York, the overall economic situation in other cities is, if anything, worse. New York at least has Wall Street, media and a constant infusion of wealth from the rest of world to keep its economy going and stave off the bond-holders. Yet even New York’s economy is underperforming its periphery. The city’s unemployment rate is 8.7% while the surrounding suburbs stand at 7.5%. This gap exists in almost all major metropolitan areas ; among the 51 largest metros the core unemployment rate is 8.8 percent compared to 7.1% in the suburbs.

The gap is wider in other major cities. In the Chicago area, unemployment in the city is 2 percentage points higher than in the suburbs; in Los Angeles, the city unemployment rate is near 12%, three points higher than in suburbs. This, of course, all pales to Detroit where the city jobless rate stands at over 18% compared to 10% in the suburbs.

Rather than “cure poverty” or export it to the suburbs, as is regularly claimed, cities retain a poverty rate twice as high as in the suburbs. And although hipsters and the global rich dominate media coverage, the vast majority of the population growth in urban cores over the past decade — upward of 80% — has come not from hipsters but the poor.

These woes have been largely ignored by the press, but, as de Blasio’s primary victory shows, cannot be hidden forever. True, big investments aimed at attracting the “hip and cool” urban element have helped real estate speculators in selected districts, but has precious little positive impact on the neighborhoods where most urbanities reside.

Unless addressed, the inequality in core cities suggests a similar lurch to the left could be seen in other cities. What is needed now is a new strategy that promotes the kind of broad-based economic growth that would make the urban “triumph” more than an empty one.

This story originally appeared at Forbes.

Joel Kotkin is executive editor of NewGeography.com and Distinguished Presidential Fellow in Urban Futures at Chapman University, and a member of the editorial board of the Orange County Register. He is author of The City: A Global History and The Next Hundred Million: America in 2050. His most recent study, The Rise of Postfamilialism, has been widely discussed and distributed internationally. He lives in Los Angeles, CA.

Photo courtesy of Bill de Blasio.

Is Scandinavia Female Friendly?

$
0
0

Scandinavia is often hailed as the best place on the planet for women. Yet in reality --- despite being frontrunners in gender equality --- Nordic countries have not been so successful when judged by women’s career progress.

A few years ago Professor Alison Wolf, director of Public Services Policy and Management at King's College, remarked:“the statistics are clear: among young, educated, full-time professionals, being female is no longer a drag on earnings or progress”. Her view is supported by the research of demographer Andrew Beveridge, who has shown that full-time working single women in New York aged 21-30 years went from earning 19 percent less than their male counterparts in 1970 to having the same median income in 2000. Five years later a 17 percent wage gap resurfaced, this time to the favor of the young women. Similar trends have been shown for many metropolitan areas in the US.

Even when we include smaller cities and the countryside, it is clear that the glass ceiling has been broken by US singles. The latest figures show that the average single American women aged 22-30 earns $27,000 annually, eight percent more than the average single man in the same age group. In the UK figures from the Office for National Statistics show that young women have 2 to 3 percent higher hourly wages than young men.

Nordic nations are characterized by early labor market entry of women, the least gender-biased attitudes in the world and a culture where men take much of the responsibility for care of children and household work. The emergence of a large public sector has historically played an important role in women's entry into the labor market. One reason is that many women have found jobs in the public sector. Another is that public services such as childcare facilitate the combination of work and family life. But in the long run, women's career success has been hampered by the fact that the labor market entry of women has been so intimately connected with public sector monopolies.

In 1998 the International Labour Organization noted that an unusually gender-segregated labor market had developed in Nordic countries, since many women worked in the public rather than the private sector. The report concluded: “in terms of differences amongst industrialized countries, several studies comment on how Nordic countries, and in particular Sweden, have among the greatest inequalities”. A similar conclusion is reached by Swedish economists Magnus Henrekson and Mikael Stenkula in their paper“Why are there so few female top executives in egalitarian welfare states?”.

Sweden is a case in point. Much of the progress that women are making throughout the world relates to their success in higher education. Women make up the majority of university students in Sweden. But although Sweden has fully tax-financed higher education, calculations by the OECD show that a young Swedish women opting for higher education will only earn the equivalent of 5,000 U.S. dollars more than if she would have worked right after high school – over her entire lifespan. In the U.S. the corresponding increase in earnings is $75,500. Swedish women who work for public sector monopolies, and monopolies often have a negative premium, as education is simply not sufficiently rewarded to compensate the income lost while in school.

But change is coming, albeit slowly, in the Nordic nations. Between 2007 and 2011 the share of female Swedish entrepreneurs rose from 18 to 22 percent, partially due to greater opportunities for private businesses in female dominated welfare services such as education and health care. The majority of the new firms in these sectors, which have been opened up for private business as previous public monopolies have been replaced by voucher systems, are run by women. Studies show that increased competition from private firms also pushes up wages and reduces sick-leave for employees.

The gender equal Nordic societies clearly have the potential to be world leaders also when it comes to women’s success in the business sector. The question is what policies will be used to reach that goal. The state mandated affirmative action which has been in place in Norway has not yet produced a ripple effect – only benefiting a handful of powerful women often filling positions in many boards.

The market approach taken in Sweden seems a wiser way. Perhaps there is also a good lesson here for the UK. While women do thrive in the private service sector in Britain, women’s entrepreneurship is, similarly to Nordic nations, hampered by public monopolies on welfare services. Opening up these services for private businesses can create a much needed boost for women owned businesses. Reducing women’s reliance on the welfare systems thus seems central for promoting gender equality.

Dr. Nima Sanandaji has written two books about women’s carreer opportunities in Sweden, and has recently published the report “The Equality Dilemma” for Finnish think-tank Libera.

Creative commons photo "Flags" by Flickr user miguelb.

Thinking Outside the Rails on Transit

$
0
0

To many in the transit business – that is, people who seek to profit from the development and growth of buses, trains and streetcars – Southern California is often seen as a paradise lost, a former bastion of streetcar lines that crossed the region and sparked much of its early development. Today, billions are being spent to revive the region’s transit legacy.

Like many old ideas that attract fashionable support, this idea, on its surface, is appealing. Yet, in reality, the focus on mass transit, however fashionable, represents part of an expensive, largely misguided and likely doomed attempt to re-engineer the region away from its long-established dispersed, multipolar and auto-dependent form.

Traditional transit works best when a large number of commuters work in a central district easily accessible by trains or buses. New York and Washington, D.C., where up to 20 percent of the regional workforces labor downtown (the central business district), are ideal for transit. Even in those metropolitan areas, however, the auto is king.

In contrast, less than 3 percent of Southern Californians work in downtown Los Angeles. Overall, despite all the money sunk into new rail lines around the country, Americans’ transit commuting is overwhelmingly concentrated in a few older “legacy” cities. Altogether, 55 percent of transit work trips are to six core cities: New York, Chicago, Philadelphia, San Francisco, Boston and Washington, and 60 percent of those commutes are to downtown.

In contrast, in the Los Angeles-Orange County region, barely 6 percent of workers take transit, one-fifth the rate in New York. Yet we’re a bunch of committed strap-hangers compared with Phoenix, Atlanta, Charlotte, N.C., and Dallas-Fort Worth, where, despite surfeits of new trains and streetcars, 2 percent or less of commuters use public transit. Even in Portland, Ore., widely proclaimed the exemplar of new urbanism and transit investment, the percentage of commuters taking transit is less today than in 1980. Portland is now contemplating cutbacks that could eventually eliminate up to 70 percent of its transit service.

Imposing Past on Future

This miserable record reflects how trains, a largely 19th century technology, have limited utility in a contemporary setting. Indeed, the only way to make it work, planners insist, is if the population is moved from their low-density neighborhoods to high-density “pack and stack” areas near transit stops, while suburban businesses are dragooned to denser downtown locations. This is the essence of the recently approved Bay Area Plan.

Although these kinds of strategies have never materially reduced automobile use – the Bay Area Plan itself says automobile use will still increase by 18 percent over 30 years – the bureaucratic logic here is almost Stalinesque in the scope of its social-engineering ambitions. As Bay Area journalist and plan advocate John Wildermuth puts it, people know they should take transit but don’t because it’s very inconvenient. But by forcing three quarters of new residents into dense housing, some with no parking, he reasons, it then will be “easier for them to either give up their cars or, at least, use them a lot less.”

Yet getting people to change their way of life, as many central planners have discovered, is not as easy as it seems. The highly dispersed San Jose-Silicon Valley area, the economic epicenter of the Bay Area and worldwide information technology, has a commute trip market share barely a third of major metropolitan area average… . Building “one of the longest” light rail systems in the United States in 50 years has barely moved the percentage of transit commuters over the past three decades.

What the Bay Area Plan will probably accomplish is to boost housing prices ever further out of reach, both in urban areas and in the suburbs. With new single-family development effectively all but banned, prices of homes in the Bay Area already are again rising far faster than the national average and now are approaching two and half times higher, based on income, than in competitor regions such as Salt Lake City, Phoenix, Dallas-Fort Worth, Austin, Tex., Houston or Raleigh, N.C.

Environmental Imperative?

Greens and their allies in the high-density housing lobby long have suggested that “peak oil” and rising prices will inevitably drive suburbanites out their cars. But, clearly, recent advances in U.S. oil and natural gas production may have already made this moot. Transit activists increasingly have focused on climate change to justify massive spending on expanding transit and forcing recalcitrant suburbanites from their cars.

This logic is largely based on the notion that suburbanites must travel greater distances to work. Yet, a study by McKinsey & Co. and the Conference Board found that – largely because of the impact of higher energy standards for cars forecast by the Department of Energy – sufficient greenhouse gas emission reductions can be achieved without reducing driving or necessitate “a shift to denser urban housing.”

The fundamental limitations of transit in dispersed cities further weakens environmentalists’ claim. Ridership on some transit systems is so sparse that cars are more energy efficient. Then, there’s the oft-mistaken assumption that higher-density housing will reduce congestion and travel. But in multipolar areas like Southern California, traffic congestion and resultant pollution generally becomes worse with higher density.

There may be other, more technologically savvy ways to reduce emissions and energy use. People have cut automobile use the past three years but their reduced travel is not showing up so much in transit usage, but, rather, is driven by other factors such as unemployment and the high price of gasoline.

But, arguably the biggest reduction can be traced to the rise of telecommuting. Over the past decade, the country added some 1.7 million telecommuters, almost twice the much-ballyhooed increase of 900,000 transit riders. In Southern California, the number of home-based workers grew 35 percent, three times the increase for transit usage. By 2020, according to projections from demographer Wendell Cox, telecommuting should pass transit, both nationally and in this region, in total numbers.

What About the Poor?

Perhaps the most compelling argument for transit stems from serving those populations – the poor, students, minorities – who often lack access to a private car. Yet, for workers in newer cities, public transit often is not an effective alternative. Brookings Institution research indicates that less than 5 percent of the jobs in the Los Angeles and Riverside-San Bernardino areas are within reach of the average employee within 45 minutes, using transit. The figure is less than 10 percent in the San Jose metropolitan area, the same percentage as for cities nationwide. Moreover, 36 percent of entry-level jobs are completely inaccessible by public transit.

Not surprisingly, roughly three in four poorer workers use cars to get to work. Recent work by University of Southern California researcher Jeff Khau finds that car ownership is positively correlated with job opportunities; no such relationship can be proven with access to transit.

At the same time, we should look at more-flexible systems, notably, expanded bus and bus rapid transit, which work better in dispersed areas and are less costly. Most rail systems tend to cannibalize most of their riders from existing bus lines, which explains the small net increases in total transit ridership.

Transit too expensive

Costs matter, and will become more important as cities and counties face the looming threat of fiscal defaults. In this respect, rail systems essentially steal from other transit – notably, the buses used mostly by the poor– and from hard-pressed city and county general-fund budgets. Gov. Jerry Brown’s outrageously expensive high-speed rail, which will principally serve the affluent, takes this unfairness to an extreme.

Instead, we should push far more cost-effective ways to provide transportation options, including those from the private sector, such as the successful Megabus, which provides efficient, quicker and far-less expensive transport between cities than either existing rail or short-haul airline flights. USC’s Khau suggests the private sector also could enhance solutions for lower-income commuters through car loans and car-sharing services such as ZipCar and and Lyft, a mobile app that links riders with drivers.

As we attempt to figure out ways to improve both the environment and people’s economic prospects, innovative 21st century solutions – from telecommuting to car-sharing – may prove more effective than relying on the 19th century technology of rail. We should not blindly follow transit ideology but focus on how to improve people’s mobility in ways other than the overpriced, inefficient and often far-less-equitable solutions being bandied about today.

Joel Kotkin is executive editor of NewGeography.com and Distinguished Presidential Fellow in Urban Futures at Chapman University, and a member of the editorial board of the Orange County Register. He is author of The City: A Global History and The Next Hundred Million: America in 2050. His most recent study, The Rise of Postfamilialism, has been widely discussed and distributed internationally. He lives in Los Angeles, CA.

This piece originally appeared at The Orange County Register.

Photo by biofriendly, Metro Bus Campaign, Los Angeles

“Unblocking Constipated Planning” in New Zealand

$
0
0

One of the National Party’s principal objectives since coming to power in New Zealand has been to address that nation’s terribly deteriorated housing affordability problem.  Deputy Prime Minister Bill English explained the problem in his Introduction to the 9th Annual Demographia International Housing Affordability Survey:

“It costs too much and takes too long to build a house in New Zealand. Land has been made artificially scarce by regulation that locks up land for development. This regulation has made land supply unresponsive to demand. When demand shocks occur, as they did in the mid-2000s in New Zealand and around the world, much of that shock translates to higher prices rather than more houses.”

In the largest markets (Auckland, Christchurch and Wellington), house prices had doubled relative to incomes over the past two decades, as land prices were driven up by urban containment land-use policies (Note), that severely restrict the supply of land available for new housing. Across New Zealand, this rationing of land has led to the destruction of the competitive supply of land the Brookings Institution economist Anthony Downs says is essential to maintaining housing affordability. The relationship between urban containment policy and higher house prices is documented in a large body of international research. Economists Richard Green and Stephen Malpezzi succinctly summarized the issue:

“When the supply of any commodity is restricted, the commodity's price rises. To the extent that land – use, building codes, housing finance, or any other type of regulation is binding, it will worsen housing affordability.”

On September 5, the government took an important step toward improving housing affordability, with the enactment of ground-breaking land use regulation reform. In the Parliamentary debate, Housing Minister Dr. Nick Smith expressed the imperative for passage by describing the regulatory situation in Auckland, the nation’s largest city (metropolitan area):

Auckland has just 1,300 sections (lots) currently available for housing. That’s a third of what it had 10 years ago.

We need 13,000 each year just to keep up with population growth.

We’ve got a rigid Metropolitan Urban Limit (urban growth boundary) prohibiting any new housing developments beyond the artificial line drawn 15 years ago.

We’ve got a few lucky land owners sitting on the last few parcels of developable residential land holding prospective homebuyers to ransom.

Section (lot) prices have trebled and gone up by more than any other part of the housing cost equation.

We’ve got a convoluted RMA (Resource Management Act) planning system where it takes an average of seven years to get a plan changed by the time you get through all the consultation and appeal processes.

And even when you get a plan change, it takes an average of another three years to get a consent for a greenfields development and a year for a brownfields development.

We’ve got a constipated planning system blocking new residential construction and this bill is a laxative to get new houses flowing.

The passage represents an important step in the campaign by Dr. Smith and the National Party government to improve New Zealand’s housing affordability.

According to Dr. Smith: “The increased land supply will help take the pressure off the over-heated Auckland housing market and help the economic recovery. It will enable tens of thousands of kiwi families to realise the dream of owning their own home.”

Housing Accords and Special Housing Areas Act

The new Housing Accords and Special Housing Areas Act permits the government to establish special housing districts that permit bypassing expensive planning regulations. Initially, the Act will be applied in Auckland, where an urban growth boundary (the “Metropolitan Urban Limit”) has been blamed for driving house prices to more than double their historic relationship to household incomes. Smith indicated that the Act would “over-ride Auckland’s Metropolitan Urban Limit” and that  ”…it would enable low-rise greenfield developments to be consented in six months, when they previously took three years, and low-rise brownfield developments to be consented in three months, when they previously took a year.”

Smith also noted that support for the act was based on advice from the New Zealand Productivity Commission, the Reserve Bank of New Zealand (the central bank), the Organization for Economic Cooperation and Development (OECD) and the International Monetary Fund (IMF), which have indicated that “increasing supply is crucial to addressing housing affordability.”

The government intends to move quickly, according to Minister Smith:

“The main initial focus of the new law would be to enact the Auckland Housing Accord through which it is planned to build 39,000 new houses in a three year period in the Auckland region. Housing Minister Nick Smith says he expects the Auckland Council to approve the accord next Tuesday and is talking about having special housing areas approved by Christmas that would be able to cater for 5000 houses.”

Housing Affordability in New Zealand

The housing affordability crisis problem is the most severe in Auckland. The most recent Demographia International Housing Affordability Survey reported that median house prices were 6.7 times median household incomes in 2012 (this is the “median multiple”). This price to income ratio has more than doubled since the early 1990s. This is a particular problem because housing cost is by far the largest element of household budgets in New Zealand (as well as in Australia, Canada and the United States).

The extent of the problem in Auckland is illustrated by the fact that across the urban growth boundary, values are one-tenth per acre for comparable land, according to research by Dr. Arthur Grimes, Chairman of the Board of Reserve Bank of New Zealand. In a competently governed market, there would be little difference.

The higher land prices of urban containment also encourages builder “up-market,” to achieve competitive returns on the required larger investments. This is illustrated in New Zealand Productivity Commission research by Guanyu Zheng for the New Zealand Productivity Commission found that the higher prices generated by Auckland’s urban growth boundary were more severe for lower cost housing: “…when the supply of land on the urban periphery is restricted, the price of available residential land rises and new builds tend to be larger and more expensive houses.”

High house prices are not limited to Auckland. Like in the United Kingdom, where exorbitant house prices occur from depressed Glasgow and Liverpool to dynamic London, house prices are high from the top of North Island to Invercargill in the South, irrespective of the economy.

The provisions of the Act will also be applied in other more expensive markets in New Zealand. The Minister said: “The Government is also having discussions with other councils in high cost housing areas on how the tools in this law can assist in addressing the housing supply and affordability issues in their communities.”

The Campaign

The extent of New Zealand’s housing affordability problem has been known for some time and has been cause for serious concern.

The long-time Governor of the Reserve Bank, Donald Brash wrote in 2008 that “the one clear factor that separates all of the” affordable and unaffordable housing markets “is the severity of the artificial restraints on the availability of land for residential building.” Later, Brash zeroed in on the cause., which he characterized as the extent to which urban containment policy “has pushed the price of residential land well beyond the reach of far too many New Zealanders.”

For the last decade, Christchurch’s Hugh Pavletich (co-author of the Demographia International Housing Affordability Surveys) has been drawing attention to the problem: “We are currently paying near double per square metre build costs because of this…”

More recently, Governor Graeme Wheeler of the Reserve Bank of New Zealand raised concerns about house price increases and implemented stronger loan qualification requirements to cool the market. Similar action was taken by the Bank of Canada last year, though monetary policy is severely limited in reigning in bubbles in the face of regional policies that drive up land prices.

Moreover, urban containment is a poor strategy for reducing greenhouse gas emissions, because of its exorbitant costs per ton and its meager results.


Getting Priorities Right

By these reforms, the New Zealand government has given priority to the quality of life of its households over the more peripheral issues of city form and how people travel. In an increasingly globalized and competitive world, this sends an important signal.

Wendell Cox is a Visiting Professor, Conservatoire National des Arts et Metiers, Paris and the author of “War on the Dream: How Anti-Sprawl Policy Threatens the Quality of Life.

-----

Note: Urban containment is also referred to as “smart growth,” growth management,” “compact cities” and other terms.

----

Photograph: Downtown Auckland (by author)


Cincinnati: Bridging Downtown and the Suburbs

$
0
0

One of the most contentious under-the-radar mayoral races heated up in Cincinnati on September 10th, with former city council representative John Cranley surging to a huge 55%-37% primary victory over previously presumed frontrunner Vice Mayor Roxanne Qualls. The primary eliminates minor candidates; now, both Cranley and Qualls are still alive for November’s general election. Cranley's huge primary victory is a notable development for planners everywhere.

Cincinnati, long lumped together with many “declining” rust belt cities, is hot on the trail for “solutions” to cope with its dropping municipal population, along with its gaping budget deficit and struggling competitiveness. Many assumed an easy Qualls victory would spur a continuation of the city’s rampant recent investments in a litany of trendy new planning schemes, seen by some as the key to the city’s future. Down the road, a November loss would deal an unexpected blow that would potentially threaten that future

These schemes include a citywide form-based code, a $130-million streetcar system, the gentrification of two key neighborhoods adjacent to downtown, and a plan to privatize the city’s parking meters in exchange for a $92 million windfall. All of the ideas have all been initiated under the belief that the city needs to grow its population, and that the key to doing so is to make the region stand out nationally. The presumption that the best way to do this is to invest heavily in the core neighborhoods, primarily downtown, presumes that hoards of new residents, especially young graduates will be lured by the array of hip new developments. With the exception of the parking deal, all of these projects were initiated with significant state or federal grants and tax credits.

As Vice Mayor, Qualls has been one of the most vocal proponents of these efforts. Her particular affinity for the parking and streetcar initiatives as essential to economic development and maintaining regional competitiveness has been a hot topic throughout the election season because Cranley, her opponent, is opposed to them. By contrast, he’s built a campaign around “jobs and core services” to meet the needs of the existing population. And while he hasn’t objected to all of the downtown redevelopment schemes, he’s much more adamantly backing a approach featuring several highway projects, including a major bridge and a new interchange

The fight for Cincinnati is important not just because it’s a battle over dollars, but because Cincinnati has suddenly become a guinea pig for the broader redevelopment of the Rust Belt. If the city reverses its primary leanings and chooses to move forward on its current path behind Qualls in the general election, it will become perhaps the foremost national testing ground on whether “Portlandization” is the key to growing regions against national competition by kindling latent demand for dense, urban living to their city cores.

The real dynamism of the region is and will continue to be well outside the Cincinnati core. City leaders have argued that reduction in the pace of the city’s population decline from at least 2 percent every year between 2000 and 2010 down to 0.2 percent between 2010 and 2011 proves that city living really is the future of the area, they simultaneously seem to miss noticing the rapid regional growth that for several decades has dwarfed the relatively minuscule population changes occurring within the city itself.

The race to claim victory in the rejuvenation of Cincinnati among the “city core” crowd has now spurred a goal to reach 100,000 new residents by 2023, an aspiration that virtually everyone recognizes as extreme. Never in the city’s history has Cincinnati added more than 52,000 residents in a decade, even in its heyday as a national riverboat transportation hub a century and a half ago.

Coincidentally, as a region, the Cincinnati area hasn’t added fewer than 100,000 new residents since regional statistics became reliably available in the 1950s. In fact, Cincinnati is one of the fastest-growing Rust Belt areas since 1980. The idea of a need to “solve” Cincinnati’s “decline” is inaccurate; it says far more about the aesthetics of saving the city’s central area and shoring up municipal finances than about a benevolent intent to help the city’s broader regional growth, though the latter is typically the stated motive.

Even more pertinent to the objective of adding population by luring residents from other cities is the fact that between 2000 and 2010 no city in the nation that lost population regionally gained population in its core city or in its central downtown. There is almost no evidence of any city successfully rejuvenating its region through downtown reinvestment. While Cincinnati (the region) has been growing, adding 100,000 people to the city core would do little to increase net demand for the area that the region isn’t providing for already, and would most likely represent a heavily subsidized “redistribution” of people from the region’s outlying cities and towns. While just as good for Cincinnati’s municipal tax rolls, it’s hardly realistic to link that to any sort of push to lure “the talent that every city competes for”.

Clearly, the growth Cincinnati leaders are seeking is already coming, and in volumes far exceeding their wildest projections. Unfortunately for downtown's cheerleaders, people choosing to live have overwhelming chosen the densities best found in the suburbs. And while more choice is of course terrific, the development of a mix of densities and housing options should happen naturally, not as the product of the yearnings by some to increase a city’s dwindling piece of the regional pie for financial reasons.

Lofty talk of a region that needs dynamism downtown to lure talent from other cities, hence more population to help pay for budget deficits, doesn’t really make sense. The talent that wants to come is already coming — it's just not coming to downtown, and it’s coming at a rapid (for the Rust Belt) rate. Any downtown investment may lure growth from the suburbs, but is unlikely to lure growth from outside.

While many would contend that luring growth from a city’s own suburbs is a good thing to combat sprawl and undue “suburban flight”, the situation in regional Cincinnati suggests that there really is a happy density that people are choosing, and that people really do like what they’re getting in the suburbs.

Cincinnati's suburban growth over the last several decades has far outpaced population loss from the city by taking advantage of the region’s infrastructural assets: developing along the I-75 corridor north to Dayton, and filling the I-275 loop around the city. Contrary to conventional wisdom, neither the growth nor the emerging densities have been radial. The region’s hubs have become less dense, while the more lightly-populated areas around the highways have become more dense. The average difference in the densities of the region’s many cities and towns is dropping rapidly. In other words, outside of the city core, Cincinnati is settling into a comfortable regional density.

Uniquely well-served by exurban highways, development has continued at these remarkably consistent low densities. There's been little pressure on home values, and virtually zero formation of any new “nodes” of higher density, all because high-speed highway transportation to the major job centers is quickly accessible from a huge land area, and Dayton and Cincinnati, the region’s two largest job hubs, are only 45 minutes apart. Commute times have stayed shorter in Cincinnati than in nearly all other cities. Congestion is low by national standards, and the profile of transit use as opposed to other means of travel is virtually unchanged.

Clearly, adequate room and infrastructure exists: the densities emerging in regional Cincinnati reflect broadly emerging preferences for the future of this part of the country. Coincidentally, they also reflect almost exactly the idyllic utopian idea espoused by Frank Lloyd Wright of one family per acre.

Roger Weber is a city planner specializing in global urban and industrial strategy, urban design, zoning, and real estate. He holds a Master’s degree from the Harvard Graduate School of Design. Research interests include land use, demography, political geography, economics, freight transport, environmental planning, urban design, and architecture.

Flickr photo of a Cincinnati bridge by Jim Orsini

America's Fastest-Growing Counties: The 'Burbs Are Back

$
0
0

For nearly a half century, the death of suburbs and exurbs has been prophesied by pundits, urban real-estate interests and their media allies, and they ratcheted up the volume after the housing crash of 2007. The urban periphery was destined to become “the next slums,” Christopher Leinberger wrote in The Atlantic in 2008, while a recent book by Fortune’s Leigh Gallagher, The End of Suburbsclaimed that suburbs and exurbs were on the verge of extinction as people flocked back to dense cities such as New York.

This has become a matter of faith even among many supposed development professionals. “ There’s a pall being cast on the outer edges,” John McIlwain, a fellow at the Urban Land Institute, told USA Today. “The foreclosures, the vacancies, the uncompleted roads. It’s uncomfortable out there. The glitz is off.”

Yet an analysis by demographer Wendell Cox of the counties with populations over 100,000 that have gained the most new residents since 2010 tells us something very different: Suburbs and exurbs are making a comeback, something that even the density-obsessed New York Times has been forced to admit. Of the 10 fastest-growing large counties all but two — Orleans Parish, home to the recovering city of New Orleans, and the Texas oil town of Midland— are located in the suburban or exurban fringe of major metropolitan areas.


Fastest Growiing US Counties: 2010-2012
Counties over 100,000 Population
RankCounty Equivalent JurisdictionGrowth
1Williamson, TX7.94%
2Loudon, VA7.87%
3Hays, TX7.56%
4Orleans, LA7.39%
5Fort Bend, TX7.16%
6Midland, TX7.14%
7Forsyth, GA7.07%
8Montgomery, TN7.04%
9Prince William, VA7.04%
10Osceola, FL6.97%


Not surprisingly several of these fast-growth areas are in burgeoning Texas metro areas. The population of Williamson County, on the outskirts of Austin, has expanded 7.94% since 2010, the strongest growth in the nation over that period. Far from turning into a slum, over the past 25 years the county’s residents have enjoyed the Lone Star state’s fastest rate of income growth and the sixth-highest in the nation. With a strong tech scene – Dell is headquartered in the Williamson town of Round Rock — the county has increased employment by 73% since 2000, the third highest rate in the country.

Another Austin outer suburb, Hays County, ranks third on our list, with population growth of 7.6% since 2010 and 67% since 2000. Also impressive has been the growth of another Texas exurb, Fort Bend County, to the west of Houston.

Since 2010 the county’s population has grown 7.2%, and since 2000 employment has increased 78%, in part due to the expansion of energy companies outside Houston. Fort Bend County is now home to 625,000 people, considerably more than the total population of most major core cities, including Atlanta, Cleveland, Baltimore and Portland. Like many of the boom counties, Fort Bend is alsoincreasingly diverse, with a rapidly growing Asian population that is approaching 20% of the total. It is now the unlikely home to one of the nation’s largest Hindu temples.

In second place is Loudon County, 25 miles from Washington, D.C., where the population has expanded 7.87% since 2010 and the number of jobs has grown 83% over the past decade. Much of this has come from tech and telecommunications companies, as well as growing numbers of jobs tied to Dulles Airport as well as the nation’s capital.

They are not on the road to “next slum” status: Loudon is one of the nation’s wealthiest counties. Another D.C. exurb on our list in ninth place, Prince William County, Va., ranks among America’s 10 wealthiest counties in terms of per capita income.Most of the other fastest-growing counties have a similar profile, attracting large numbers well-educated residents to the fringe of urban regions.

What these findings demonstrate is that more people aren’t moving “back to the city” but further out. In the last decade in the 51 largest U.S. metropolitan areas, inner cores, within two miles of downtown, gained some 206,000 people,  while locations 20 miles out gained over 8.5 million. Although the recession slowed exurban growth, since 2011, notes Jed Kolko at Trulia, suburbs have continued to grow far faster than inner ring areas as well as downtown. Americans, he concludes, “still love their suburbs.”

Rather than an inevitable long-range shift, the post-crash slowdown of suburban growth seems to have been largely a response to economic factors. The retro-urbanist dream of eliminating, or at least undermining, suburban alternatives depends very much on maintaining recessionary conditions that discourage relocation, depress housing starts, as well as lowering marriage and birthrates.

Where incomes are growing along with rapid job growth , suburban and exurban growth tends to be strong.  The metro regions that contain our fastest-growing counties — Austin, Houston, Nashville and Northern Virginia — all epitomize this phenomenon. For example, nearly 80% of all housing growth in greater Houston takes place in the areas west of Beltway 8 (the outer beltway). A similar pattern can be seen in the D.C. area, where the number of units permitted in Loudon has more than doubled since 2007. In 2012 permit issuances were the highest since 2005, and the vast majority were for either detached or attached single-family houses.

This doesn’t mean the central areas of  thriving Washington or Houston are in decline; both core areas    enjoy modest population growth not seen in many more hard-pressed cities. But this highly visible and relentlessly promoted growth has not altered the fundamental pattern of faster development on the fringes.  As the economy strengthens, these trends will become evident in other areas.

It now seems clear that the preference for single-family houses did not change in the recession, but was just stunted by it. With construction starts up again— more than two-thirds single family — this trend is beginning to re-assert itself. Mortgage lending is now at the highest level in five years.

Indeed suburbia — or sprawl to use the perjorative term — is back even in the anti-suburban stretches of the San Francisco area, where suburban and exurban developers are once again pushing plans to develop new housing for the area’s expanding workforce. In long-suffering areas such as the Inland Empire, east of Los Angeles, there has been a steady housing recovery, leading to talk of new development.

Other signs suggest that the widely predicted dense city nirvana may need to be put on hold. For example, car sales  — automobiles dominate transportation in most suburbs and exurbs — have been on the upswing, hitting a record in August. And despite predictions that the size of new homes would shrink, the median home size in the country has continued to rise, reaching a record high in 2012.Even shopping malls, long seen as doomed, are experiencing something of a resurgence.

Demographic forces should accelerate suburban and exurban growth. As the economy has improved, we are starting to see an uptick in the birthrate, and household formation.

Given the tendency of families to move to suburbs, this should spark further growth there in the future. High-density neighborhoods and the densest U.S. cities may be good for many things, and certain individuals, but not so much for families. During the last decade, suburbs and exurbs accounted for four-fifths of all household growth, a pattern that does not seem likely to change.

Indeed, what we are seeing now is not the “end of suburbs” but the end of a brief period in which peripheral development was quashed by the severity of the Great Recession. With the return of even modest economic growth, we can expect that most demographic growth will continue to favor suburbs and exurbs, as has been the case for the better part of the last half century.

This story originally appeared at Forbes.

Joel Kotkin is executive editor of NewGeography.com and Distinguished Presidential Fellow in Urban Futures at Chapman University, and a member of the editorial board of the Orange County Register. He is author of The City: A Global History and The Next Hundred Million: America in 2050. His most recent study, The Rise of Postfamilialism, has been widely discussed and distributed internationally. He lives in Los Angeles, CA.

Georgetown, Texas Town Square photo by Jeffrey W. Spencer.

New Report: Enterprising Cities - A Force for American Prosperity

$
0
0

The inaugural edition of Enterprising Cities: A Force for Prosperity that was recently released examines best practices in municipalities taking proactive measures to support job creation and economic growth together with the private sector. The U.S. Chamber of Commerce Foundation’s Enterprising States and Cities program takes an in-depth look at the policies and programs being implemented to promote economic growth at the state and local levels.

The cities highlighted in the Enterprising Cities report—Dayton, OH, Irving, TX, Memphis, TN, Minneapolis, MN, Salt Lake City, UT, San Antonio, TX, Sioux Falls, SD—each, in their own unique way, are examples of how enterprise-friendly leadership, strategies, and partnerships can be put into action to achieve meaningful results.

Cities, both large and small, play a pivotal role as drivers of America’s economy by creating and sustaining the local ecosystem for innovation, competitiveness, and productivity through enterprise-friendly policies that create jobs, enhance economic development, and build prosperity. Pragmatic leaders at the city level can often take on the issues that Washington will not, or cannot, solve. Enterprise-friendly policies at the city level can indeed facilitate local economic growth by supporting entrepreneurs and mobilizing effective partnerships for improving the conditions for business and job growth. Working together with businesses, city leaders can bolster expansion into national markets and exports to reach global markets.

City policies and practices that will help strengthen our free enterprise system—the system that has served as the foundation of America’s prosperity and the only system capable of creating the jobs we need for the long haul—are those that do the following:

  • Allow businesses to grow and thrive.
  • Free businesses from excessive taxes, unnecessary regulations, and onerous local government processes.
  • Focus government on the critical tasks that are the foundation of economic opportunity, such as infrastructure and protective services.
  • Help educate, cultivate, and equip the next generation of young entrepreneurs and the workforce of the future.

Enterprising cities use policy inputs, well-designed community programs, and economic development best practices to create an environment where free enterprise creates jobs and prosperity. Economic prosperity creates fiscally sustainable local governments capable of supporting the infrastructure and workforce that free enterprise needs. 

Is your city an enterprising city? The 2013 Enterprising Cities were selected based upon their approach to local governance, fiscal management, and program deployment. You can use the criteria upon which these seven cities were selected to assess your own city. 

  • Explicit involvement of the local business community, citizens, and local education institutions.
  • A sound approach to fiscal management and the deployment of government services, often based upon private sector best practices.
  • Strong leadership, communication, and cooperation from the mayor, chamber of commerce, or other civic entities.
  • A focus on metrics to measure outcomes.
  • Open communication between local residents and city leaders, and strong city response to citizen input.
  • Evidence of a plan of action or community strategy carried out by multiple public and private partners.
  • Recognition that local business activity drives the economy, providing the fiscal stability that allows local governments to focus on the safety, education, and infrastructure that the private sector needs to thrive.   

Praxis Strategy Group is an economic research, policy, strategy and development company.  Praxis and its partner Joel Kotkin conducted the Enterprising Cities study and the four annual Enterprising States studies for the U.S. Chamber of Commerce Foundation.

To Rebuild, the Midwest Must Face Its Real and Severe Problems

$
0
0

Despite well-publicized problems that earned it the nickname of the “Rust Belt”, on paper the Midwest possesses some formidable strengths. These include the largest concentration of engineers in America, world class educational institutions, a plethora of headquarters of global champions ranging from Proctor and Gamble to Caterpillar to the Chicago Mercantile Exchange, the world’s greatest reserves of fresh water, and an expanding immigrant population.

Yet with limited exceptions, these have been around for a while, but haven’t produced much growth across the region. Instead, outside of an archipelago of successful outliers (mostly select parts of major metros or college towns), the region has seen its population, job, and income growth badly trail the nation.  During the 2000s US population grew by 9.7%, the Midwest* 3.8%. For jobs, the US lost 1.5% but the Midwest 7.8%.

Reversing this requires not just leveraging strengths and building on assets, but facing the very real and severe structural challenges that plague the region. However, most of the strategies out there remain outside the region’s essential DNA:

  • Economic clusters like high tech startups or water industries are in effect attempts to build new success enclaves outside the system.
  • Rebuilding downtowns into urban playgrounds for the upscale often takes place against a backdrop of vacant lots, abandoned structures, and depopulation – in other words, empty space.
  • The Rust Belt Chic movement suggests that many of the problems are actually the solution.  But while there are intriguing and important elements to this, it bypasses core issues.

These are all good as far as they go, but they require little broad-based reform (as opposed to district or enclave based solutions) to structural problems and thus are limited in what they can achieve.

What are these structural problems? Among the key ones are:

1.Racism. The modern history of Midwest cities is enmeshed in the history of race relations, particularly between black and white. Places like Chicago and Milwaukee remain among the absolutely most segregated in America. Race riots have been defining feature of cities ranging from Detroit to Cincinnati (which had a race-influenced riot as recently as 2001). In all of these places, a large population of black residents live in segregated neighborhoods plagued with problems ranging from poor schools to low quality housing to a lack of jobs.  Significant social distress has resulted. 

There are signs the Great Migration that brought blacks north in search of factory work is reversing, with black residents actually seeing more welcoming environments and better economic opportunities in Southern metro areas like Atlanta, Houston, and Charlotte. As well, historically it’s been the more ambitious who leave, not such a good thing for the people and places left behind.

2. Corruption.  Midwest cities ranging from Chicago to Detroit to Cleveland are famous as cesspools of corruption and cronyism. Systems like Chicago’s “aldermanic privilege” tradition that gives city council members almost dictatorial control over their districts produce environments of almost required tacit corruption even if no laws are violated. In other cities, it’s well known that your approvals will go much faster if you hire the right wired-up subcontractors, lawyers, or lobbyists. While this type of environment exists at some level everywhere, it’s very bad in many Midwest cities and badly degrades an already challenged business climate.

3. Closed Societies. Contrary to the assertions of Robert Putnam and Bowling Alone, a lot of Midwest places suffer from an excess of social capital. As Sean Safford noted in Why the Garden Club Couldn’t Save Youngstown, excessively dense social networks can create a hermetically sealed environment into which new ideas can’t penetrate or get a hearing.  There are many reports of newcomers to Midwest cities saying that they have difficult making friends and penetrating the social networks in places as diverse as Minneapolis and Cleveland. In Cincinnati and St. Louis expect that the first question you’ll be asked is “Where did you go to high school?” which tells you everything you need to know about those cities.  Immigration has ticked up in recent years, but overall the Midwest has done a poor job of attracting outsiders.

4. Two-Tier Environment and Resulting Paralysis.  Despite the plethora of high end companies, educated workers, and top quality universities, the Midwest economy was traditionally based on moderately skilled labor in agriculture and industry. This forged a work force that places too low value on education and which can even be suspicious of people with too much of it. Today’s agriculture and manufacturing concerns, at least the ones with jobs that pay more than subsistence wages, require much higher levels of skills and education than in the past. What’s more, with the global macro-economy favorable to larger cities and talent based industries, larger metros have comparatively done well while most smaller towns have struggled. As a result, their quality of life and services have so badly degraded they are no longer attractive to “discretionary residents” (those with the means and opportunity to leave), which perpetuates a downward spiral as the educated flock to bigger cities. That’s why manufacturers complain they can’t find workers with skills, even if those skills are just passing and drug test and showing up to work everyday. This produces massive inequities, resentment, and policy confusion. What’s more, realistically many very poorly performing communities may never recover.

Beyond these core issues, many places have aging infrastructure, massive blight issues, a regulatory environment not suited to the 21st century, and severe fiscal problems. All of these are extremely difficult problems to resolve, but that does not mean they don’t need to be faced, and overcome.

Unsurprisingly, the Midwest has not been a particularly competitive region.  There will continue to be bright spots ranging Des Moines to Madison to the greater Chicago Loop to the fracking fields of western Pennsylvania, but until the region faces up to its problems don’t expect a major turnaround anytime soon.

Aaron M. Renn is an independent writer on urban affairs and the founder of Telestrian, a data analysis and mapping tool. He writes at The Urbanophile.

Is America Flying Europe's Flag?

$
0
0

Consider the recent government shutdown as a disagreement about how much influence Europe should have on the continuing American revolution. Who would have predicted that, more than 237 years after the United States threw off the English yoke, disagreement over European approaches to life and government would be strong enough to shutter the democratic experiment, or downgrade the nation's credit? And yet, Congress is divided, as it was in 1797, between Royalist Republicans and Jacobin Democrats, arguing about which model of government best suits the young and restless American republic.

Never far from the lips of Tea Party stalwarts is the accusation that the Obama administration is bent on importing European socialism to the fair shores of free enterprise.

The Republican right sees supporters of the health care act, immigration reform, and deficit spending as the equivalents of English levelers, idle Greek pensioners or French syndicalists. They fear that as these ideas anchor in the lee of the Statue of Liberty, it will perhaps soon be rededicated as Our Lady of Communal Redistribution, Occupational Safety, and Bureaucratic Oversight.

Democrats, too, have fears inspired by their transatlantic neighbors. Many believe that only additional legislation can keep the United States from turning into another constitutional European monarchy, rife with income inequality, sweetheart tax breaks for the aristocracy, and enough gated suburban Downton Abbeys to impress even the noble lordships on Fox & Friends.

I spend much of my time shuttling between Europe and the US, and thought it might be useful to see if there is any rationality in the fear that the Monroe Doctrine might no longer be strong enough to hold off creeping European influence. Here's a short, idiosyncratic list, not at all definitive, of a few of the divisions between the continents:

Store Hours: In many European countries, shops are closed whenever management has the sense that someone might want to buy something. In Italy and in parts of France it is not uncommon to find restaurants that close for lunch, and few establishments in Europe are open between Saturday afternoon and Monday lunchtime. In the US, AM/PM and 24/7 set the retail bar.

Vacations: Europeans live for them. They take time off for Christmas, New Year’s, Easter, and a raft of saint days, not to mention their entitled four weeks of work leave and the occasional long weekend or bank holiday. By contrast, Americans fear time off from work more than they fear trade unions or, well, family vacations.

Political parties: In the US, third or independent parties hint at irredentist change. In Europe, most countries have dozens of political parties, from communists, socialists, and greens on the left to near fascists on the right. Nevertheless, neither multiparty Europe nor two-party America can escape parliamentary paralysis, in part because both are dealing from insolvent decks.

Suburbanization: Around many European cities suburbs have never taken root, and it is not unusual for the last stop on the metro (as in Munich or Geneva) to leave passengers in the wild. In the US, major cities have the qualities of a sprawling suburb, where cars are needed to shop or get to school. Even Spanish Harlem now has a Target.

Churches: Except for the spread of Islam in countries like the United Kingdom and France, organized religion is on the wane in Europe. I bike a lot in France, and pass dozens of shuttered churches that appear to have neither a congregation nor a priest. Italians love the papacy a lot more than they do morning mass. In the US, however, many new churches need lots for overflow parking.

Religion: Americans have married their love of promotion, organization, and public faith to create all sorts of new sects and churches, and with them religious academies, summer camps, bible study groups, cable channels, and ecclesiastical conferences. In Europe, the established religions -- Protestant, Catholic, Orthodox, and Judaism — hold the most sway; the only holy rollers are Bentleys.

Television: In America, the village square is its community of television programs, which have now wormed their presence into portable handsets. There, gossip, information, advertisements and entertainment are shared at all hours. In England, France, and Germany — to name a few — the daily newspaper remains competitive.

Lunch: In the US — as Gordon Gekko says in Wall Street— the business lunch is for wimps, while in Europe you still count yourself lucky if the noontime meal lasts less two hours.

Dinner: Americans take their suppers (standing up) with Coke Zero in front of the TV, while Europeans take their evening meals (seated) in the company of wine.

Getting Around: Usually I drive more on a two week trip to the States than I do all year in Europe, which has buses, trains, and bike lanes across most countries and cities. In Switzerland I often go to a small mountain village where 36 trains stop daily at its tiny station. For comparison, the city of Houston has two trains a day.

Militarism: Save for the British hanging on to their lancer regiments, Europe’s armies are home guards and dads’ armies. The US, meanwhile, is dispatching aircraft carriers to the seven seas and branding its navy (at least on Monday Night Football commercials) as “a global force for good.”

Adultery: The French may still disconnect their cell phones between the hours of five and seven PM (“cinq à sept,” as the phrase has it), but an extramarital affair will never cost anyone a job or political office. Even the lascivious French politician Dominique Strauss-Kahn is plotting his comeback. In the US, adultery is a bigger barrier to political office than foreign birth.

Sex: In the US it is welcome as a sales agent — Mad MenÜber Alles — but somewhat less forgiven when it mixes with politics. If only Anthony Weiner had the good sense to confine his online dalliances to a reality show (The Onanist?), he would be accepting an Emmy Award for best actor. Because he chose the stage of politics, he was seen as Pee-wee Herman running for mayor from the back of a virtual theater.

Marriage: Americans marry to have children. Europeans have children so that later they can get married.

Education: Most European universities, except for those in the UK, are free, provided you can make the grades. In the US, acceptance and graduation rates are more a function of capital allocation. Americans choose their aristocracy from privately-funded academies — costs at many four-year colleges are approaching $250,000 — while Europe prefers a meritocracy that combines public universities blended with a fading aristocracy.

Healthcare: Although many Americans think all medicine in Europe is socialized, few countries have the equivalent of Britain’s National Health Service. Obamacare most closely resembles the Swiss system, which requires all citizens to buy health insurance from private companies, although in Switzerland deductibles are so high (to reduce premium prices) that most families never see a dime back from their insurance payments, unless they are dragged by a truck.

Transatlantic Balance Sheet: I would say that the US fosters more inventive thinking, creative entrepreneurs and capital markets. And it is always open for business (including on Christmas).

Europe has better public schools, infrastructure, railroad networks, and work-life equations. Of course, it has many drawbacks. No continent can fight wars for four hundred years or have an Iron Curtain down its middle and not have residual side affects, notably unresolved ethnic conflicts and crammed cemeteries.

But the next time you have to work through lunch or vacation, ask yourself if you would rather be weathering the economic crisis in Detroit, or on a Mediterranean beach.

Flickr photo: Brussels, by Eszter Hargittai

Matthew Stevenson, a contributing editor of Harper's Magazine, is the author of Remembering the Twentieth Century Limited, a collection of historical travel essays. His new book, Whistle-Stopping America, was recently published.

The Dutch Rethink the Welfare State

$
0
0

When the Netherlands’ newly coronated king made his first annual appearance before parliament, he turned some heads when he addressed the deficiencies of the Dutch welfare state.   “Due to social developments such as globalisation and an ageing population, our labour market and public services are no longer suited to the demands of the times”, the king said in a speech written by Liberal prime minister Mark Ruttes cabinet. “The classical welfare state is slowly but surely evolving into a ‘participation society’”, Willem-Alexander continued. By this he meant that the public systems should start encouraging self-reliance over government dependency.

It is worthwhile to reflect on the challenges faced by the Dutch welfare system. In a knowledge based economy, influenced by strong global competition and dynamic economic development, public policy must encourage thrift, education and build-up of social capital. Discouragingly high taxes and encouragingly high benefits are no way of doing so. Such policies are therefore likely to become even greater obstacles to social and economic development as they are today.

Concern over the welfare state is not new in the Netherlands. 

During the beginning of the 1980s the Netherlands ranked as a top spender in terms of welfare policy. Whilst the US and the UK allocated some 22 and 27 percent respectively of GDP to welfare spending, the Netherlands spent fully 40 percent – the same level as the famously generous Swedish public system.  But since then the pattern has been to reduce the welfare state. Indeed as most OECD-countries public spending rose significantly from the 1980s a  report from the OECD notes that the Netherlands, alongside Ireland, gradually scaled theirs down. A combination of economic growth, tightening of welfare state generosity and privatization of sick-pay led to a decline in public social spending in these two countries. In 1980 public social spending was 25 percent of GDP in the Netherlands, much higher than the OECD-average of 16 percent.

In the beginning of the 2000s the average OECD-country had expanded its welfare state, so that public social expenditure had reached 21 percent of GDP – whilst the Netherlands had reduced its share to the same level. According to another study, benefit expenditure was reduced from 27 to 22 percent of GDP in the Netherland between 1980 and 2001, compared to the EU15 average which rose from 21 to 24 percent during the same period.

Although the Netherlands does not lie in Scandinavia, there are significant similarities between this advanced European nation and the Nordic countries. The similarities go beyond the fact that the Dutch are tall and blond, and live in a small trade-dependent nation. Shared cultural traits and political beliefs can explain why the Dutch adapted similar welfare policies as the Nordic nations. Similarly to as in Denmark and Sweden, the Netherlands has with time reformed its system, for example by introducing legislation which increases employer’s responsibility for the provision of sickness benefits. In some ways the Dutch have been even keener to reform than the Nordic countries.

Privatisation of social security and a shift from welfare to workfare have been coupled with the introduction of elaborate markets in the provision of health care and social protection. Not only other European welfare states, but in some regards even the US, can learn much from the Dutch policies of combining a universally compulsory Social health insurance scheme with market mechanisms. Netherlands has, similarly to Denmark, moved towards a “flexicurity” system where labour market regulations have been significantly liberalized within the frame of the welfare system. Taxes in the country peaked at 46 percent of GDP in the late 1980s, but have since fallen to ca. 38-39 percent. The Netherlands has moved from being a country with a large to a medium-sized welfare system, something that still cannot yet be said about culturally and politically similar Sweden and Denmark. The Dutch seem to have been earlier than their Nordic cousins in realizing that overly generous welfare systems and high taxes led to not only sluggish economic growth, but also exclusion of large groups from the labour market. 

Societal challenges are not difficult to find in the Netherlands, at least not if we look at the difficulty to integrate foreign-born individuals and those with low skills. These problems are shared with other European welfare models, not least the Scandinavian ones. However, the Netherlands overall continues to rank highly  in terms of societal measures such as good school results, high life expectancy, strong civic participation and high life satisfaction. Reforming the welfare state to a smaller size, and introducing more market mechanism within the system, have clearly not lead to a social disaster as some would like to believe.

The Dutch continue to support the welfare society. This does however not mean supporting an overly generous “cradle to grave” system, with demands that everybody have similar living standard regardless of their individual achievements. As shown in the book “Contested Welfare States: Welfare Attitudes in Europe and Beyond”, Netherlands ranks at second place, following closely after Switzerland, in having the most limited support for the idea that government should be responsible for peoples’ life prospects. A likely reason is that whilst the Dutch are in favor of welfare policies in general, they believe in fostering individual responsibility within the system. The “participation society” that the Dutch king recently spoke about has thus already gained ground.

There is a strong case to be made that the Dutch can benefit in going further in reducing the size of the state, introducing market reforms and liberalizing the labour market. Such changes would indeed be in line with OECD recommendation. Recently even the IMF recommended the nation to continue structural reforms to enhance growth potential. In addition, considerable savings seem to be possible in the Dutch welfare state, in areas such as health care and education. Luckily, the country can rely on previous positive experience with reforms.

There is a good chance that the Netherlands will continue on a long-term route towards smaller government and greater prosperity. This does not mean abandoning the idea of public welfare for its citizens but focusing more on enabling people to take care of themselves. The positive experience of past changes, coupled with the realization that change is needed, can catalyze change. If change indeed happens, it will likely not occur over-night. Continuous small steps towards change are more likely. The direction of European nations such as the Netherlands might not excite a US audience, but perhaps there is a lesson to be learned about the value of pragmatic and steady reforms? 

Dr. Nima Sanandaji has written several books and reports in Sweden, Finland and the UK about subjects such as urban development, entrepreneurship and women's career opportunities.

L.A. Ports Face Challenge from Gulf Coast

$
0
0

In this strange era of self-congratulation in California, it may be seen as poor manners to point out tectonic shifts that could leave the state and, particularly, Southern California, more economically constrained and ever more dependent on asset bubbles, such as in real estate. One of the most important changes on the horizon is the shift of economic power and influence away from the Pacific Coast to the Gulf Coast – the Third Coast – a process hastened by the imminent widening of the Panama Canal. Over time, this could represent a formidable challenge to our status as a critical global region.

It is easy to live in Southern California – particularly in the more-affluent, coastal sections or the middle-class inland valleys – and hardly know how critical international trade is to our regional economy. Invisible to denizens of Malibu or Newport Beach, the ports of Long Beach and Los Angeles together account for almost 40 percent of U.S. container imports. Along with Hollywood, and our climate, it represents arguably the region's greatest asset.

Overall, the ports are the critical linchpin of the roughly 500,000 jobs tied to logistics, warehousing and trade services. These jobs, notes economist John Husing, provide a wide range of generally higher-paying blue-collar employment compared with, for example, hospitality or retail. This is critical in a region with a large undereducated, but motivated, workforce.

Southern California's emergence as the nation's largest trading center has been unlikely, tied more to ingenuity and ambition than natural geography. Unlike its West Coast rivals – San Diego, Seattle and, most particularly, San Francisco – the Los Angeles region does not boast a great natural harbor. Its construction, starting in the early decades of the previous century, was completely man-made and conceived.

By the 1980s, sparked by a shift of trade from Europe to Asia, the ports of Los Angeles and Long Beach started to overtake, in merchandise trade value, New York, which had dominated U.S. trade since the first decades of the 19th century. Along with trade came business connections, direct air travel and a surge of Asian immigration. Today, Los Angeles, with roughly 1.5 million Asians, ranks first among America's counties for Asian population, while Orange County, with more than 530,000 Asian residents, ranks third, just behind the Santa Clara-Silicon Valley region.

Wider canal coming

These advantages, human as well as geographic, are critical to the region's global status. But this could change, in part due to the expansion of the Panama Canal – set for completion in late 2014 or in 2015 – which will open to Asian businesses the opportunity to send megaships directly to the Gulf Coast or the Southeast.

“Trade will shift,” predicts Khalid Bachkar, a professor at the California Maritime Academy.

There are other challengers to our supremacy, including port expansions in both Western Canada and Mexico that could offer newer facilities and rail connections directly within their own countries and the vast U.S. market. But the greatest challenge seems likely to come from the Gulf, which offers excellent access to trains that carry goods directly to the vast majority of the United States.

Demographic trends will also play a role. In the 1970s and 1980s, the Pacific Coast seemed like the premier growth market, but high housing prices, taxes and regulatory restraints – and, most importantly, outmigration – have slowed regional business growth.

In the next four years, notes Pitney Bowes, Houston is expected to have the largest household growth in the country: some 140,000 people, an increase by 6.7 percent. Most of the other fast-growth regions in the nation – Dallas-Fort Worth, Austin, Texas, Raleigh-Cary, N.C., San Antonio, Jacksonville, Fla., and Charlotte, N.C. – are located either along the Gulf or are natural markets for their ports.

In contrast, Los Angeles is projected to grow by only 1.5 percent and Orange County by less than 2 percent the next four years.

Critically, the Gulf is, for the first time, attracting a critical mass of Asians. Over the past decade, Houston has enjoyed some of the nation's fastest growth in Asian population, up some 70 percent, and its Asian community is now the eighth-largest in the country. Houston's Asian population is now growing three times as rapidly as that of the San Francisco or Los Angeles areas.

Energy exports

At the same time, the expansion of oil and natural gas production in Louisiana, Texas and the Plains makes the Gulf ports major players in the emergence of the U.S. as an energy exporter. The Gulf Coast also is home to many of the nation's largest industrial investments, including from overseas. The Port of Houston, for example, posted a 28.1 percent jump in foreign trade in 2012, and trade at reached records levels at the Port of New Orleans (I work as a consultant in that city).

Agriculture has also been on a roll in terms of exports, and 50 percent of the nation's grain shipments through Louisiana ports. Combined with rising energy and industrial growth, the Third Coast now claims a growing share of U.S. trade. Since 2003, the value of exports from the Gulf ports has more than tripled; the region's share of U.S. exports over that period grew from roughly 10 to nearly 16 percent.

Once an industrial backwater, the Gulf region has attracted new steel plants, petrochemical plants and facilities involved in everything from airplanes to food processing. All these locations export such items as cars and chemicals, and all import goods, such as car parts and iron ore. According to Site Selection magazine, the Gulf includes four of the top 12 states – led by No. 1 Texas, No. 7 Louisiana, No. 10 Florida and No. 12 Alabama – in attractiveness to investors. Texas and Louisiana ranked first and third among the states for new plants.

Standing pat

Ultimately, this is a challenge that our region cannot afford to ignore, particularly with completion of the Panama Canal expansion in as soon as roughly a year. In anticipation, ports along the Gulf, as well as in the Southeast, are almost all improving and expanding their ports. In contrast, Southern California ports – largely because of labor and environmental concerns – may be slow to make the “intense capital improvements,” such as dredging and new road connections. This largely results from environmental pressures that, notes economist Husing, are not nearly as powerful along the Gulf or in the Southeast. A history of labor disputes by highly paid, politically powerful California port workers also has reinforced the notion that the L.A. area ports are becoming an increasingly unreliable place to do business.

The Third Coast is also positioned to benefit from commerce with Latin America, the Gulf's historic leading trade partner. Latin America, notes Bill Gilmer, has been home to many of the world's fastest-growing economies. Since 2002, about 56 million people in Latin America,according to the World Bank, have risen out of poverty.

Trade with these partners – including Mexico – are ramping up growth in Houston, as well as other Gulf ports. Brazil, notes Jimmy Lyons, has risen to become a trading partner of Mobile, Ala. Strong Latin immigration to virtually all the Gulf cities, particularly Houston and, increasingly, New Orleans, can only strengthen these economic ties.

Southern California, with its vast Hispanic population and proximity to Mexico, also should be able to serve as a hub for this trade, but this can only happen if the region attaches greater priority to port development. Historically, this region was built by people taking risks on big infrastructure – covering everything from the water delivery systems to the port and freeways – that literally paved the way to economic progress, and growth.

The key question now is: Do we still have the spirit and willingness to build, as our competitors are on the Third Coast, the Southeast, Mexico and Canada. If we fail to meet the challenge, Southern California could surrender desperately needed potential sources of new employment and a critical linchpin to our continuing status as one of the world's great global centers.

This story originally appeared at the Orange County Register.

Joel Kotkin is executive editor of NewGeography.com and Distinguished Presidential Fellow in Urban Futures at Chapman University, and a member of the editorial board of the Orange County Register. He is author of The City: A Global History and The Next Hundred Million: America in 2050. His most recent study, The Rise of Postfamilialism, has been widely discussed and distributed internationally. He lives in Los Angeles, CA.

Port of Los Angeles photo courtesy of NOAA's National Ocean Service.


Density, Unpacked: Is Creative Class Theory a Front for Real Estate Greed?

$
0
0

“The heresy of heresies was common sense”—George Orwell

The stories we tell affect the lives we lead. I do not mean to be abstract here. I mean, literally, the stories that are told make up a kind of meta-reality that soaks in us to form a “truth”. This “truth” affects policy, which affects investment, which affects bricks and mortar, pocketbooks, and power. Eventually, the “truth” trickles down into a more real reality that defines the lives of the powerless.

The story du jour in urban policy is one of density. The arc of the story is that cities are places where “ideas come to have sex”. The lovechild is innovation. The mood lighting is creative placemaking.

The Kama Sutra of density reads this way: creative people cluster in cities that are good at lifestyle manufacturing. The more people that are sardined the higher likelihood there will be “serendipitous” encounters. The more serendipity in a city the better chance the next“big thing” will occur. The next “big thing” will lead to a good start-up, which will lead to an agglomeration of start-ups, termed an “Innovation District”. Detroit becomes Detroit 2.0 then.

The story of density is a seductive story. Society-making is sobering and full of harsh realities. The story of density is seamless, velvety. It is no wonder the story gets sold, implemented, and then told and re-told, despite the validity and logic of the story being pretty awful.

Take the recent New York Timespiece entitled “What It Takes to Create a Start-up Community”. In it, the writer interviews urbanist Richard Florida. “Population density, [Florida] said, allows for the serendipitous encounters that inspire creativity, innovation and collaboration,” reads one key passage in the piece.

The story goes on to highlight the emerging tech hub of Boulder as the exemplar of the story of density. One problem: Boulder, a city of less than 100,000, isn’t dense, with a population per square mile of 3,948. The writer moves the goal posts a bit and says the city “is an unusual case of density”, before going on to question whether a start-up community can be created in a city like Detroit that “lacks density”. Yet Detroit, despite being a land mass comprised of one-third vacant land, is denser than Boulder, at 5,144 people per square mile. In all, Aristotle would have a field day with the piece.

Such illogic peppers the story of density, particularly as it relates to the correlation—to say nothing of the causation—between household clustering and tech growth. For instance, in a recent analysis of America’s top “high tech hot spots” by the Progressive Policy Institute, the top 25 counties experiencing the highest percentage of tech job growth reads like a “Where’s Waldo” list, if Waldo was Thoreau-like. There’s Madison County in Alabama (417 people per sq. mile). Utah County in Utah (258 people per sq. mile). Denton County in Texas (754 people per sq. mile). Fayette County in Kentucky (1,043 people per sq. mile). Snohomish County in Washington (342 people per sq. mile).

To be fair, also on the list are San Francisco, Boston, and New York. In the case of Boston and San Fran, the tech clustering is a legacy asset---including large venture capital funds --- from decades prior, not the result of the story of density. New York, under Mayor Bloomberg, has supposedly gone whole hog on the “idea-sex in the city” script, yet tech is but a speck on the universe that is New York City’s economy.

For example, Kings County, home to Brooklyn, numbers 25 on the list of places with highest percent of tech job growth, yet Brooklyn’s Job Index—calculated as new tech/information jobs between 2007 and 2012, as a share of 2007 total private sector employment—is just 0.4, meaning the number of new tech jobs in Brooklyn represents less than half a percent of total private employment. Given the information sector as a whole is hemorrhaging jobs according to a recent Harvard Business Review, the scaling of fledgling tech towns is unlikely. This is especially true for cities like New York that—while enriched with the chattering class buzz stoking the story of density—simply lacks the engineering talent of Boston, Silicon Valley, Houston and yes, Detroit , to make the “scene” something than just that: a scene.

But let’s play along anyway, as that’s the power of the story of density: reality doesn’t bite. So, say Brooklyn can become the next Silicon Valley. This likelihood depends on two assumptions that define the story of density: “cooling” a city will draw top tech talent, and then packing them in to luxury condo towers and mixed use districts will form creativity incubators.

First, the idea that manufacturing cool spurs a start-up scene is spurious at best. I mean, has this ever worked? Please don’t say Austin, or any number of college towns or state capitals or places with boutique streets that depend largely on transfers from taxpayers --- and parents! --- to their privileged burgs. Many of these place, like Austin and Raleigh, are themselves far from dense urban nodes, but are exceptionally spread out.

What about Boulder? In the piece“How Boulder Grew Into a Hub for Start-Ups”, the writer questions venture capitalist Brad Feld, a huge player in the Boulder tech scene, about what brings entrepreneurs to communities like Boulder. Feld throws his hands in the air:

“People want to live where they want to live. You should figure out where you want to be and build a life around it. Different geographies attract different people.”

Why did Feld move to Boulder?

Actually, I moved here in 1995 because Amy said "I'm moving to Boulder - you can come with me if you want." And I did.

There are things that do appeal to innovators, however. Affordability is an appeal, so says a recent survey of London techies who are decamping from the capital, if only because outrageous rents prevent a “start-up” of anything.

Over in Berlin, the tech scene is struggling despite the “Berlin geek chic” culture that unfolded. The city’s tech leaders think Berlin needs to be more conventional than cool. “[T]he jury is still out on whether [Berlin’s] a great place to truly grow that company into a mature startup," notes Marc Strigel, head of SoundCloud. "Both the authorities and startups could do much more in promoting Berlin for families, for these world-class talents we definitely need."

The second assumption relates to the idea that sardining people will ultimately lead to serendipity and innovation. I smell underpants gnomes. Specifically, in an episode of South Park, creators Trey Parker and Matt Stone expose the blind loyalty attached to the façade of “expertise”. The episode goes like this: the characters need a presentation for class. One of the boys talks about a group of gnomes that inexplicably sneak into his house to steal underpants. There’s got to be a reason, right? They confront the gnomes who, claiming to be business experts, explain their business plan as thus: Step 1: Collect Underpants. Step 2: ?. Step 3: Profit.

The story of density has the same logic gap. Step 1: Population density. Step 2: ?. Step 3: Innovation. Density gurus will claim Step 2 relates to serendipity. But serendipity is chance. How do you plan for chance? Even if you could, creative classification is largely a process of homogenization by class, age, and profession, which, according Rita King of Science House, erodes the possibility of meaningful chance encounters. “Artists bumping into other artists or business people bumping into other business people or Mormons bumping into other Mormons, etc., isn’t real serendipity,” notes King. San Francisco in many ways is more a monoculture than the highly diverse suburbs that surround it.

Okay, so if the story of density really isn’t about innovation then what is it about? The answer can be found in a recent article entitled “Urban Prophet” in the real estate trade mag Property Week. The piece quotes Albert Ratner, chairman of US real estate firm Forest City Enterprises, on his reading of Florida’s The Rise of the Creative Classes, the first book in the story of density. “You have given real estate developers the playbook,” notes Ratner.

Put simply, the point of sardining is to make as much money as possible for those who already  have the most . This is the raw truth that fuels the hype, and of course pays for it as well. But it’s a tough sell to neighborhoods and cities increasingly experiencing the negative effects of real estate wealth jamming, and more broadly wealth inequality. Enter the story of density to make another “truth”.

In reality, the story of density is a fiction and it’s high time we start rewriting the book.

Richey Piiparinen is a writer and policy researcher based in Cleveland. He is co-editor of Rust Belt Chic: The Cleveland Anthology. Read more from him at his blog and at Rust Belt Chic.

American Cities May Have Hit 'Peak Office'

$
0
0

Despite some hype and a few regional exceptions, the construction of office towers and suburban office parks has not made a significant resurgence in the current recovery. After a century in which office space expanded nationally with every uptick in the economy, we may have reached something close to “peak office” in most markets.

The amount of new office space in development is extraordinarily low by historical standards, outside of a handful of markets. Back in the mid-1980s, according to the commercial real-estate research firm CoStar, upward of 200 million square feet of office space was built annually. After dropping precipitously in the early 1990s, construction rose again to 200 million square feet a year in the early 2000s before dropping well under 150 million square feet in 2006, and lower after that. This year, in what is purported to be the middle of an economic recovery,  we will add barely 30 million square feet,according to Reis Inc.

Even with this paltry construction, vacancy rates nationwide have barely moved, hovering around 17%. This is nowhere near low enough to justify much more construction in the vast majority of markets, where office rents remain well below 2007 levels.

Indeed, the trend in real estate remains to convert office spaces to other uses,particularly residential. Large-scale office construction is happening in just a handful of markets; New York and Houston are the only ones with 10 million square feet being built, with smaller amounts in the works in Boston, Washington, Dallas-Ft. Worth and the San Francisco Bay Area.

Most of the current anemic growth is happening outside downtown areas. Silicon Valley, which is essentially a sprawling suburb, currently has about as much construction as San Francisco. In Houston, another big metro area with robust job growth, there is a new 47-story high-rise being developed downtown, but much of the action is taking place on the periphery, notably in the Energy Corridor. ExxonMobil’s massive new campus, at 3 million square feet, ranks with One World Trade Center in Manhattan as the nation’s largest new office projects.

Through the third quarter this year, the amount of new office space under construction in suburban areas was roughly double the amount being built in central business districts, by CoStar’s count. Furthermore, only 7.1 million square feet of office space was absorbed downtown in the first nine months of 2013, compared to 51.5 million in suburban areas, CoStar says. But overall there is still 100 million square feet less space being used today than in 2007, and at current absorption rates, it could take six or seven years just to get back to where we were before the recession.

The Weak Economy

The key question here is not the geography of office space but why so little is being built. As long as economic growth is modest, don’t expect much change in the skyline in most downtowns, or suburbs. Job growth has been mediocre at best, and much of that has been in the low-wage and part-time category. McJobs and part-time workers do not generally fill office towers.

The dirty little secret of this recovery is that labor participation rates are at the lowest level since 1978. Underemployment is rife, at around 18% to 20%, and much of that likely includes large numbers of people who used to work in offices.

This is true even in New York City, where the rate of “office-using employment” has been dropping since the late 1960s and even in the recovery, has yet to rebound to the levels of 2000.

Changing Use of Space

Just as we have gotten used to more fuel-efficient cars, companies now utilize space more efficiently than before, largely through information technology. This is a trend many companies plan to accelerate. In the past, for example, your average mid-level executive had his own secretary; now it’s more common to have perhaps one aide for several managers. Historically office developers assumed that each worker would require 250 square feet of space; by the end of the decade this could drop to 100 to 125 square feet.

Even the most notoriously bureaucratic of professions, law, is scaling back. A recent Cushman and Wakefield survey  found that most firms — many already downsizing — were working to reduce their office footprint per attorney from 800 to 500 square feet. Almost two out of five expect to use “hoteling,” or the sharing of offices among attorneys, something very rare a decade ago.

At the same time, some of the sectors that are the best bets for expansion, such as information technology and media, are increasingly seeking out unconventional office space. Mayor Mike Bloomberg’s drive to upzone large parts of Midtown Manhattan to create ever-taller towers works operates on the assumption that new users will be much like the old ones. But some experts, such as New York-based architect Robert Stern, suggest that ultra high-rise development does not appeal to either creative businesses and tourists, while preserving older districts, with already developed buildings, does.

Self-Employment and Home-Based Businesses

Perhaps the biggest long-term threat lies in the shift from corporate to self-employment. From 2001 to 2012, the number of self-employed workers grew by 14%, according to a recent study by Economic Modeling Specialists. This is occurring not only in the metro areas that suffered the worst during the recession, such as Phoenix, Los Angeles and Riverside-San Bernardino, but also in the healthiest economies such as Houston and Seattle.

Some of these now self-employed workers may end up in small offices, but many don’t leave home at all. Working at home is growing far faster than commuting by either car or transit, and in most U.S. metro areas, far exceeds those who get to work by public conveyance, most often to downtown areas. Over the past decade the number of U.S. telecommuters expanded 41% to some 1.7 million, almost double the much-ballyhooed increase of 900,000 transit riders.

Are We Blowing Another Bubble?

In some specialized, fast-growing markets, new office construction may well be justified. Raleigh is seeing some new construction in its small downtown, as are hot job markets such as Austin and oil-rich Midland, Texas, where a proposed 53-story office tower would be the tallest building between Dallas and Los Angeles.

But in New York, plans for massive new office tower construction seem to contradict an unemployment rate considerably above the national average. Financial services, the primary driver of the Manhattan market, is showing signs of economic distress, with firms moving middle-management jobs to more affordable places such as Richmond, Va.; Pittsburgh; St. Louis; and Jacksonville, Fla.

Perhaps even more worrisome, less than half of the space in new buildings in Manhattan is preleased, compared to over 70% in both Houston and Boston, and a remarkable 92% in San Jose/Silicon Valley. This reflects an apparent dearth of large employers in New York who could conceivably afford and fill ultra-expensive office space in the coming years, a recent article in Crain’s New York points out. Tech companies might be expected to help fill the gap, but we have to remember that after the last boomlet Silicon Alley suffered asteep contraction; it has since recovered, but could be hit hard again if the current bubble pops.

San Francisco, the other current darling of office developers, is even more dependent on the current dot-com boom. The IPOs of Frisco-based firms such as Twitter appear to suggest the prospect of a whole new generation of office occupants. By one account, there is as much as 12 million square feet of new office space in the pipeline in the city, enough to satisfy historical demand for the next 16 years.

Yet past experience shows many of these companies will likely dissolve or merge in the next few years. They may be fewer in numbers and longer established than last time around, as some local boosters eagerly suggest, but most are still unprofitable and many may never be truly viable. Following the 2000 dot-com crash, San Francisco office occupancy dropped roughly 10 million square feet, while tech employment crashed from a high of 34,000 in 2000 to barely 18,000 four years later.  As one real-estate executive put it at the time, “The office-space market here ”reminds me of the Road Runner cartoon where the Coyote runs into the wall.”

Observers also point out that more traditional businesses, such as banks, continue to ship jobs elsewhere, in large part due to extraordinarily high costs. The fact that pre-leasing for SF’s new office buildings is barely 33% should add to the caution.

None of this suggests there are not some good opportunities for new construction, but the office building’s role as a key indicator of the strength of the U.S. economy has faded. In great cities, rather than a ballyhooed era of new office skyscrapers we will see more conversions and the construction of residential high-rises, as well as medical buildings. The secular trend is for the dispersion of business service employment to smaller markets, and into people’s homes. The glory days of the American office tower are over, and not likely to return soon, given technological trends and a persistently tepid economy.

This story originally appeared at Forbes.

Joel Kotkin is executive editor of NewGeography.com and Distinguished Presidential Fellow in Urban Futures at Chapman University, and a member of the editorial board of the Orange County Register. He is author of The City: A Global History and The Next Hundred Million: America in 2050. His most recent study, The Rise of Postfamilialism, has been widely discussed and distributed internationally. He lives in Los Angeles, CA.

Photo by Mark Lyon -- Full Floor For Rent.

Playing Musical Chairs with World Economies

$
0
0

The world’s largest economies seem engaged in something like the children’s game of “musical chairs.” For years, the United States has been the world’s largest national economy, though in recent decades the integrated economy of the European Union has challenged that claim given that the region   includes four of the ten top national economies, Germany, the United Kingdom, France and Italy. The most recent data, reflecting the deep European recession, indicates that the top position has been retaken by the United States.

The International Monetary Fund (IMF) has released its semi-annual World Economic Outlook Database for October 2013. Information is provided for 189 country-level geographies, from 1980 to the present, with projections to 2018. Despite the economic malaise, the IMF data shows the US gross domestic product, adjusted for purchasing power parity (GDP-PPP), to be greater than that of the combined 28 member European Union (EU). This development, however, is at least partially due to accounting revisions, which are described below.

2012 Gross Domestic Product (Purchasing Power Parity)

The new data shows the United States to have a 2012 GDP-PPP of $16.245 trillion (current international dollars), two percent above the EU’s $15.933. This difference is relatively minor – the equivalent of Maryland’s GDP. In 2011, the EU led the US by a small margin, before the accounting methodology change. The IMF expects the US lead to be lengthened to approximately 10 percent by 2018. For comparison, in 1980, the same 28 EU economies had a GDP nearly one-quarter larger than that of the United States (Figures 1 and 2). However, it must be noted that in 1980, the European Union had only nine members and had an economy 8 percent smaller than that of the US.           

China’s reduced, but still strong economic growth has propelled it to a GDP-PPP of $12.3 trillion, reaching 75 percent of the US figure. By 2018, the IMF expects China to reach 96 percent of the US GDP. If the IMF projected GDP increase rates of China and the US were to continue, China would be a larger economy than the United States by 2020. While this may be seem to be occurring sooner than expected, it is consistent with the expectation of former IMF economist Arvind Subramanian, in his book Eclipse: Living in the Shadow of China’s Economic Dominance. The scale of Chinese economic miracle that started under Deng Xiaoping can be seen by the fact that in 1980 its GDP was barely 10 percent of the US economy (See Ronald Coase and Ning Wang, How China Became Capitalist).

India’s economy also continues to progress. Now the world’s fifth largest economy, India’s GDP-PPP is estimated at $4.7 trillion. By 2012, India’s economy had reached 29 percent of that of the United States, nearly triple the 1980 figure. IMF expects India to close the gap by another five percentage points by 2018.

Japan has fallen to the fifth largest economy, at approximately $4.58 trillion. Japan had grown strongly after World War II, having reached 35 percent of the US economy by 1980. A number of experts, such as Harvard’s Ezra Vogel, expected that Japan would continue to close the gap with the United States. But Japan’s ascendency stopped by 1991, when it reached a size 41 percent of the US economy. In the subsequent economic slide, Japan’s economy fell to 28 percent of the US by 2012. IMF expects another two point drop by 2018.

Gross Domestic Product per Capita (Purchasing Power Parity)

The United States remains dominant in personal affluence among the world’s largest economies. In 2012, the US GDP-PPP per capita was $51,700. The European Union had a GDP-PPP of $31,600 in 2012, but is declining relative to the United States. In 2012, the EU GDP per capita was 61 percent of the US figure. This is down from a peak of 66 percent in 1982. IMF projects a further three percentage point loss by 2018 (Figures 3 and 4). The GDP-PPP per capita of the nations in the 9 nation European Union of 1980 was higher, at $36,100 in 2012 (Figure 5).

Despite China’s potential for becoming the world’s leading economy by the beginning of the next decade, its huge population makes the GDP per capita much lower. In 2012 China’s GDP per capita was $9,100, about 18 percent of the US figure. This is, however, far higher than the 1980 figure of 2 percent. IMF expects China’s GDP per capita to rise to $14,900 by 2018, 23 percent of the US figure. 

India’s GDP per capita was $3,800 in 2012, or seven percent of the US GDP per capita. India’s progress has been rapid, though   strongly overshadowed by China. India’s GDP per capita was 70 percent higher than China’s in 1980, but now China’s is now 60 percent higher. However, India has gained five percentage points on the US since 1980.

Japan’s GDP per capita stood at 69 percent of the US figure in 2012 ($35,900), down significantly from 1991, when Japan’s GDP per capita reached 84 percent of the US level. IMF projects about a 1.5 percentage point further decline by 2018.

Accounting Revision

As is noted above, the accounting changes implemented by the United States have changed the world rankings and their prospects

Data in the IMF’s last release (March 2013) placed the European Union slightly ahead of the United States in GDP-PPP. The United States is the first country to fully implement internationally agreed upon changes to national accounts (United Nations’ System of National Accounts 2008).  The IMF summarizes the revisions and its impact on the US economy as follows:

“…expenditures on research and development activities and for the creation of entertainment, literary, and artistic originals are now treated as capital expenditures. Furthermore, the treatment of defined-benefit pension plans is switched from a cash basis to an accrual basis. The revisions increase the level of GDP by 3.4 percent and boost the personal savings rate.”

The US Department of Commerce, Bureau of Economic Analysis indicates that Europe will convert to the new methodology in 2013 and it is to be expected that other nations will quickly follow.

Before the accounting revision IMF data predicted that US would not pass the EU until 2015. Further, the previously lower GDP figures predicted that China would pass the United States just two years later (2017). China may have to wait to assume the top chair, but perhaps not. It all depends on how fast China converts to the new accounting and the impact of the revision on GDP figures.

An Uncertain World

Of course, economic projections cannot be “taken to the bank.” The world economy is volatile and uncertain and more so now that in more stable times.

The US economy continues to sputter along with lagging growth. The European economy is doing even more poorly. Mixed signals continue to be heard from China, where astronomic growth rates are being replaced, at least for the moment, by more modest ones. President Xi Jinping says that China can create sufficient employment for its growing urban workforce with a 7.2 percent growth rate (See: “China Needs 7.2% Growth to Ensure Employment” in The Wall Street Journal) – a rate that would be the envy of each of the world’s strongest economies.

The big high income world nations also have reason to envy India. According to the Organization for Economic Cooperation and Development (OECD), the economy of India “clocked a low growth rate of 4.4 percent” in the April to June quarter. The OECD characterized India’s immediate economic prospects as “weak,” yet India’s growth rate is far above those of the US, EU and Japan.

The Bank of Japan (BOJ), the nation’s reserve bank, is optimistic about the nation’s new growth-seeking policies under “Abenomics” (named after Prime Minister Shinzo Abe). But the BOJ predictions of economic growth at 1.5 percent in 2014 and 2015 are favorable only in the light of Japan’s anemic recent growth.

All of these predictions, combined with accounting changes, paint a blurred picture. This is the nature of a world economy that the IMF refers to as being stuck in “low gear.”

Wendell Cox is a Visiting Professor, Conservatoire National des Arts et Metiers, Paris and the author of “War on the Dream: How Anti-Sprawl Policy Threatens the Quality of Life.

----

Photo: Bank of China (right) and Peace Hotel, Shanghai (by author)

The Tough Realities Facing Smaller Post-Industrial Cities

$
0
0

A couple weeks ago the Economist ran a leader and an article on the plight of smaller post-industrial cities, noting that these days the worst urban decay is found not in big cities but in small ones. They observe:

Partly, this reflects the extraordinary success of London and continuing deindustrialisation in the north of England. Areas such as Teesside have been struggling, on and off, since the first world war. But whereas over the past two decades England’s big cities have developed strong service-sector economies, its smaller industrial towns have continued their relative decline. Hartlepool is typical of Britain’s rust belt in that it has grown far more slowly than the region it is in. So too is Wolverhampton, a small city west of Birmingham, and Hull, a city in east Yorkshire.


And even with growth, the most ambitious and best-educated people will still tend to leave places like Hull. Their size, location and demographics means that they will never offer the sorts of restaurants or shops that the middle classes like.

Their editorial forthrightly embraces a policy of triage, saying “The fate of these once-confident places is sad. That so many well-intentioned people are trying so hard to save them suggests how much affection they still claim. The coalition is trying to help in its own way, by setting up ‘enterprise zones’ where taxes are low and broadband fast. But these kindly efforts are misguided. Governments should not try to rescue failing towns. Instead, they should support the people who live in them.”

This same dynamic is clearly evident in the United States as well. Bigger cities have tended to weather industrial decline far better than smaller ones. There seems to be some threshold size below which it is difficult to support the infrastructure, the amenities, and the thick labor markets that attract the people and businesses in 21st century growth industries. My “Urbanophile Conjecture” heuristic suggests that you need to be a state capital with a population greater than 500,000 to be thriving. But even larger places that aren’t capitals and conventionally viewed as failures like Detroit retain powerful metro area economies and large concentrations of educated workers, especially in the suburbs. Conversely, smaller places like Youngstown, Ohio and Flint, Michigan face much bleaker circumstances.

There are exceptions to the rule, including many delightful college towns or the occasional oddball like Columbus, Indiana, but for the most part smaller post-industrial cities have really struggled to reinvent themselves.

In part this is because a rising tide hasn’t lifted all boats, only some of them. As economist Michael Hicks noted, “Almost all our local economic policies target business investment, and masquerade as job creation efforts. We abate taxes, apply TIF’s and woo businesses all over the state, but then the employees who receive middle class wages (say $18 an hour or more) choose the nicest place to live within a 40-mile radius. So, we bring a nice factory to Muncie, and the employees all commute from Noblesville.”

In short, growth actually fuels divergence because a) the growth disproportionately accrues to the places that are doing well in the first place and b) even when struggling cities can attract jobs, people earning middle class wages frequently live elsewhere. Doug Masson likened this to Jesus’ statement that “For he that hath, to him shall be given: and he that hath not, from him shall be taken even that which he hath.” I think there’s a lot of evidence that for bigger cities a lot of activity is exhibiting a convergent or flattening effect. That’s why so many places today have decent startup scenes, quality food, agglomerations of talent, etc. But for smaller cities my observation is that it’s still a divergent world.

You see this on full display in central Illinois, where the town of Danville (population 33,000) and Champaign-Urbana (combined population 124,000) are only about half an hour’s drive apart on I-74. Danville is one of the bleakest towns I’ve ever visited in the Rust Belt. When your Main Street is a STROAD, you know you’re in trouble. Champaign-Urbana by contrast, is a fairly healthy community. It’s home to the main campus of the University of Illinois, seems to be reasonably thriving, has many high quality residential streets, a direct rail connection to Chicago, etc. As a college town, it’s one of those “exception” smaller places.

Anyone within reasonable driving distance with a choice would almost undoubtedly choose to live in Champaign over Danville, unless they had a family or personal connection to the latter. It’s an easy slam dunk decision. In effect, proximity to Champaign acts as kryptonite to Danville’s revitalization. Again, a rising tide only fuels this divergence.

This sort of divide between communities mirrors the divide in society as well. The question is, what approach should be taken to address these disparities? One approach is to focus on the people, and leave the places to rot. Jim Russell has noted that “people develop, not places” thus most place based economic strategies are destined to fail. This approach has also been advocated by economist Ed Glaeser, who in an article title, “Can Buffalo Ever Come Back?” answered his own question by saying, “probably not—and government should stop bribing people to stay there.”

This is obviously unpalatable to policy makers of either the left or the right, as no one has yet embraced it openly. How then have the left and right responded? The response of the left seems to be what Walter Russell Mead has labeled the “blue model” solution. His basic view is that the post-war economy was based around a policy consensus he labeled the blue social model (and which Urbanophile contributor Robert Munson has simply labeled the New Deal). This involved large corporations, powerful unions, extensive industrial regulation, and an expanding safety net. Those who wish to retain the model suggest allowing divergence to continue, but raising taxes on the wealthy and successful in order to redistribute them to sustain those at the bottom of the ladder (via an expanded welfare state), who are in effect seen as lost causes in the modern global knowledge economy, though few of them will openly say it. So the idea is to invest in success, and redistribute the harvest aggressively. That’s why you see lots of left advocacy in favor of tax increases on higher income earners and against food stamp and other benefit cuts, but a paucity of ideas for how to provide the left behinds with jobs and opportunity.

Mead suggests there’s no such thing as the red social model, and perhaps he’s right in that there’s never been a national policy consensus we could label as such, but there’s certainly a red model response to current conditions and it’s called the Tea Party, or what Mead has labeled a “Red Dawn” in many places like KansasNorth Carolina, and New Mexico. This is a type of single factor determinism model. In these kinds of models, a single factor like education, transportation infrastructure, climate, etc is treated as overwhelmingly determinant in driving the economic structure and outcomes. The factor posited by the Red Dawn model is government, therefore the red model response is to slash and burn government (with the potential exception of highway spending) to lower costs, taxes, and regulatory barriers that are perceived to be holding the economy back. In other words, government is the base, and the economy and everything else is the superstructure. Fix the base and the superstructure will correct itself. That’s the theory.

Broadly speaking, these are the paths that Illinois and Indiana have followed. Chicago’s size enables it and its values to political dominate the state in the modern era. With only a rump of a Republican Party, the Democrats are free to do what they like. Conversely, in Southern influenced Indiana it is the outstate areas that are numerically superior to the successful urban regions, thus the state follows their policy preference, and Republicans overwhelmingly dominate the state so there’s little real opposition to red model policies.

What have the results been? Most obviously, Illinois is nearly bankrupt while Indiana is sitting on a AAA credit rating and a $2 billion surplus in the bank. (It has a pension deficit, but it’s manageable and there’s a funding strategy in place). Clearly Indiana has a more functional political system than Illinois, which somehow manages to remain gridlocked despite a “four horseman” style legislative system and overwhelming Democratic dominance. So score two for Indiana.

Finances aside, what have the results been? Illinois has poured massive quantities of cash into building on success, with items like the O’Hare Modernization Program and Millennium Park. The successful side of the economy, epitomized by the global city portion of Chicago, has soared to incredible heights. This is a city that earned at seat at the table of the global elite. On the other hand, the overlooked areas like much of the south and west sides of Chicago and places like Danville, are in horrific shape. The goal of allowing divergence clearly worked. However, with the state’s finances in abysmal shape, the redistribution portion did not happen. Indeed, the social safety net and basic services depended on by the rest of Illinois are being shredded. Even if you believe that it’s viable to simply support a large lumpenproletariat in perpetuity on welfare – which is doubtful – financial extremis means Illinois isn’t even able to try.

Meanwhile in Indiana, pretty much the entire state policy has been reoriented towards making the left behind areas attractive to lower wage businesses. Policies that would cater to higher end businesses in successful urban areas have been less popular. That’s not to say there’s been nothing. Gov. Pence recently agreed to subsidize a non-stop flight between Indianapolis and San Francisco to help the local tech industry, for example. And he’s supported efforts to boost the life sciences sector. But I think think it’s fair to say low costs and low taxes are the watchword, with right to work, light touch environmental regulation, mass transit skepticism, etc.

However, most of Indiana’s left behind type places have not recovered. Overall the state has retained a stubbornly high unemployment rate significantly above the US average, and, even more worrying, incomes have been declining relative to the US. Metropolitan Indianapolis, Lafayette, Bloomington, and Columbus have done reasonably well. Much of the rest of the state has continued to struggle, particularly in adding jobs with middle class wages. As the recent commentary by Brian Howey, Michael Hicks, and Doug Masson shows, Indiana retains its “Noblesville-Muncie” divides mirroring Illinois’ “Champaign-Danville” ones.

In short, the blue and the red model produced some success, albeit in different modes (think San Francisco vs. Houston, Chicago vs. Indianapolis), for the “haves” side of the equation but haven’t yet proven equal to the “have nots.” The Economist makes it clear the totaly different policy configurations of the UK haven’t made a dent in it either. Post-industrial blight in much of Europe tells a similar tale. This suggests that there are powerful macro forces at work that are extremely difficult if not impossible to overcome. It’s no surprise then that the Economist suggests giving up.

Again, that’s not likely, so what should we do? I won’t pretend to have all the answers to a very difficult question. However, I’ll suggest a few possibilities:

  • Seek to stop the civic death spiral. This means getting ahead of the decline curve by seeking to halt the cycle of people and businesses leaving, leading to revenue declines and degraded quality of place, leading in turn to to service cuts and tax increases and disinvestment, which leads to more people and businesses leaving. This involves getting ahead of decline and restructuring government to a place where you can hold a defensible position on services and taxes from which you can seek to rebuild.
  • Integrate with metropolitan economies. Rather than Muncie trying to hold Noblesville/Metro Indy at bay, or Danville the same to Champaign, closer connectivity is the key. I’ve written on this before regarding Indiana. In the short term losing the highly paid employees to a nearby municipality is a good thing. Without those living options for the managers, etc. you’d never be in play for the plant in the first place. That connection expands your labor pool, provides trade opportunities, etc. Just the property taxes from the plant is valuable, and can be used in rebuilding. Fostering these connections would require decisions that seem counter-intuitive on the short run. For example, Ball State University in Muncie should clearly expand its downtown Indianapolis presence. That isn’t necessarily taking away from Muncie. It’s building new connections and opportunities for Muncie where they don’t exist today.
  • Find a claim to fame around which to rebuild. Carl Wohlt says that every commercial district needs to be known for at least one sure thing. Similarly, what’s Danville’s sure thing? Some towns like Warsaw or Elkhart already have it and need to build on it. Others need to find one. That’s not to say one thing is the only thing you’ll ever need or that you aren’t opportunistic around potentials deals that come your way. But you have to start somewhere. Where do you put your limited available civic funds?

I’m not so naive as to think this it the complete answer. But if there’s to be a genuine attempt to rescue places, then new thinking is needed and a turnaround will take a long time. In the meantime in parallel, clearly people-centric solutions also need to be pursued, to give people the best opportunity to realize their potential and dreams in life, where ever that may take them. No city is a failure that does this for its citizens.

Aaron M. Renn is an independent writer on urban affairs and the founder of Telestrian, a data analysis and mapping tool. He writes at The Urbanophile, where this piece originally appeared.

Photo by Randy von Liski

Long Island's Flawed Housing Policy is the Real Brain Drain

$
0
0

Affordable housing is Long Island's greatest regional failure and the key to our success in the 21st century. Yet, for such an important topic, there is still a fundamental lack of understanding of the problem, and a marked lack of standardization in studying it. We don’t have a regional standard when it comes to affordability, nor do we have an accurate assessment of how many existing units can be considered “affordable.”

Worse, the approach in which we’re addressing the problem is significantly flawed. This flawed approach is the byproduct of two larger trends in urban planning that I’ve seen on Long Island: shoehorning urban solutions onto suburban problems and allowing stakeholders to dominate the discussion of the issues.

Recently, I attended a housing design forum hosted by a group that is spearheaded by a development firm that is actively working to “cultivate a spirit of community-driven visioning, entrepreneurship and local investment.”

In general, I support any initiative that seeks to discuss and address Long Island’s regional issues, and think it’s an important effort. It is critical that the topics of housing, our economy and reversing suburban decline are discussed with the general public. I enjoy attending the events and participating in the discussion. Yet, time and time again, it’s been the same trend – stakeholders, be it developers, environmentalists or so on, all of which have “a dog in the fight” or something to lose or gain, dominate the conversation regarding our regional issues and push to benefit their own agendas.

We get the policy we deserve

The group I mentioned earlier has recently a launched a focused campaign to build attainably priced housing. The crux of their proposed solution is the creation of micro-unit apartments across Long Island’s downtown areas. These hypothetical micro-units range in size from 300- to 400-square-foot (roughly three times the size of the average prison cell) unit studios, up to two-bedroom units in the 800- to 900-square-foot range. The theory is that the smaller units, located in a transit-oriented development in the heart of a downtown area, will lead to a more efficient lifestyle. This efficiency will promote sustainable living that is the opposite of suburban waste, reduce energy consumption (because the units are so small) and so on.

This is all well and good, but when it comes to dollars and cents, the plan makes no sense.

DLI Pricing

The hypothetical units, as proposed during a design forum, could rent for between $1,000 and $1,400 for 300- to 400-square foot units up to $2,000 to $2,500 for the 800- to 900-square-foot variants. These rents do not include utilities or cable/internet. To be fair though, the projected rents do not reflect any government subsidies either.

Regardless, in what world is this considered “affordable?” Um… I mean… workforce. Or is it ”attainable” housing these days?

Give me a break.

Granted, these are hypothetical units, but the fact these were presented as a viable option to get excited about in an absolutely serious manner with a straight face, is insulting.

This is what we get for allowing developers, not planners, economists and others detached from the process, to take the lead when it comes to addressing our regional housing issues. When developers helm the discussion we get proposals such as these.

A mentor of mine raised a good point when we were discussing the issue. Can the real estate industry play a constructive role in the discussion of housing issues on Long Island? Can the goals of the real estate industry (make as much profit in as short a time frame as possible) harmonize with the goal of planners (to keep land use in balance with the socio-economic needs of residents and the environment)? Often, no; the goals of private industry conflict with the planning ideals.

One could say, “Well, Mr. Know-it-all, Long Island’s young professionals need different options or they’ll leave. There is a brain drain you know.” The only brain drain I’ve seen is our approach to housing policy.

If we are losing the young, why not focus on job creation that goes beyond low-wage retail. Stop advocating for mixed-use with integrated retail and create wealth and opportunity that will allow Long Island’s younger generations to stay, be single and eventually start a family. With each Target superstore built, we lose the opportunity to create a strong manufacturing, green or tech base. Land on an island is finite. We must ask ourselves, are we maximizing our open space? Are we creating a business climate that will appeal to startups and entrepreneurs?  What can be done to lower costs, drive up business and allow for a multitude of housing options?

Enough is Enough

Drop the buzzwords, drop the flowery language such as “attainable” or “workforce” and let’s actually start to tackle our problem.

Here is a newsflash: A thousand bucks for a 300-square-foot closet will not fly with millennials raised in homes with bedrooms larger than that. Long Island’s young people are getting priced out of a restricted, stagnant housing market with high costs of living, high property taxes and a distinct lack of affordable housing. They can’t afford nicer living because our job opportunities stink, but don’t insult young islanders with shoe boxes priced astronomically high. If we wanted to live in a tight space, Manhattan is a train ride away.

We Long Islanders have driven ourselves into a ditch and expect to build our way out of it. Well, you can’t build your way out of a recession. Maybe it’s time to enact a “fair-share” housing policy that requires each and every municipality on Long Island to create a quota of truly affordable development. Perhaps it’s time to stare our property tax problem in the eye, buck up and start looking into consolidation.

Problems aren’t solved by tip-toeing around the issues and giving us gilded solutions that sit on a shelf and gather dust. The public, especially Long Island’s millennials, deserve better. Why is suburban growth stagnant? It’s because of the stakeholders and their stagnant solutions.

This piece originally appeared on LIBN's Young Island.

Richard Murdocco is a digital marketing analyst for Teachers Federal Credit Union, although the views expressed in this post are Murdocco’s alone and not shared by TFCU. Follow him on Twitter @TheFoggiestIdea, visit thefoggiestidea.org or email him atrich.murdocco@gmail.com.

Photo by cinderellasg.

Viewing all 3794 articles
Browse latest View live


Latest Images