Quantcast
Channel: Newgeography.com - Economic, demographic, and political commentary about places
Viewing all 3795 articles
Browse latest View live

Children and Cities

$
0
0

Central cities are not likely to regain their former population. However, some of them may have reached an important inflection point—population growth has returned to at least some of the largest (and longest-declining) cities. For example, New York City’s population has increased by more than one million since 1990, after declining by about one million between 1950 and 1980. Over the past decade, nine of the ten largest (and 17 of the 20 largest) cities in the United States have gained population.

Many observers attribute the population turnaround to changes in the residential attractiveness of the city, although cause and effect are blurry since new residents themselves have instigated many changes to the urban landscape.   Prominent urban researchers have described particular features of urban areas that have attracted households back to the core. These features include new housing in city centers, amenities such as specialized restaurants and night life, restoration of architectural gems, and myriad cultural activities. Such features are enticing increasing numbers of (mostly young) college-educated singles to call city centers home.

If one goes back in time, studies on urban household location tended to focus on the tradeoff in the cost of commuting from suburban areas and the lower price of land and housing in suburban communities.  Research indicated that about half of the suburbanization in the post-World War II period was driven by higher income that increased the demand for suburban housing relative to city housing.  It is still the case that suburbanization is partly driven by the demand for larger, detached houses that are more prevalent in suburban communities.   

To be sure, amenities alone do not explain recent trends. Other studies have documented the ability of urban cores to foster jobs and businesses characterized by intense information exchange and creativity, thereby attracting college-educated workers to live in nearby neighborhoods. In a recent study, we show that central cities are an increasingly important work site for the most highly educated workers in all of the metropolitan areas that we examined, even bankrupt Detroit.¹

Income, education, and human capital are all important elements in city revival. In a recent study, Alan Ehrenhalt calls the return to city living the “great inversion” that reverses trends present in cities since the mid-twentieth century. He hypothesizes that some American metropolitan areas are beginning to resemble nineteenth century European cities, where the more affluent lived in city centers and households of more modest means lived in the suburbs. Some of the reasons that he offers for the heightened attractiveness of many central cities as a place to live are the decline of manufacturing in cities (making them more livable); lower crime rates; growth in the single, never-married population; lower fertility rates; and a bulging cohort of relatively affluent and educated seniors.

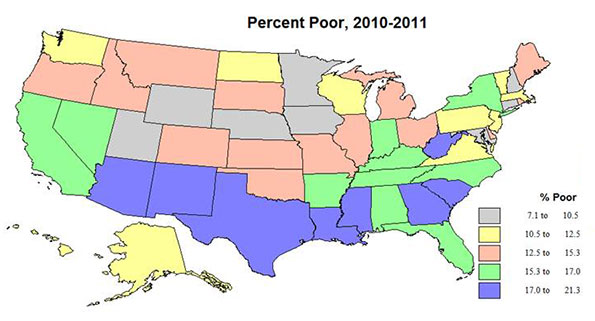
Although many cities still have a disproportionately number of the poor, poverty has become more suburban over the past decade.  For example, the number of poor in suburbs of Chicago about doubled over the past decade.  Thus, although the poverty rate in cities such as Chicago remains much higher, it has declined relative to suburban areas.

Conspicuously absent from recent discussion is the role and attractiveness of central cities for families with children. In the past, research and observation both indicated that suburbs provided families with cheaper land and housing, as well as safer neighborhoods and higher quality schools.

In many MSAs, the central city’s share of college-educated adults approaches or exceeds the city’s share of all persons aged 25 and older, with the exception of some older industrial cities, such as Detroit, Milwaukee and Philadelphia (see table). But for educated adults with children, only Seattle and Charlotte buck the trend, or come close to it.                                  


Percent of MSA residents aged 25 years and older living in central cities, 2009


All Persons Age 25+


All College- Educated


Parents with School-Age Kids

College-Educated Parents with School-Age Kids

Baltimore

           17

           14

          17

            6

Boston

           19

           20

          13

            8

Charlotte

           31

           38

          28

          33

Chicago

           30

           30

          27

          16

Cincinnati

           13

           16

             9

            7

Detroit

           22

           12

          24

            9

Milwaukee

           25

           19

          27

          11

Minneapolis

           19

           22

          16

          13

NYC

           49

           46

          47

          36

Philadelphia

           33

           24

          30

          13

Pittsburgh

           12

           14

             8

            8

Seattle

           24

           33

          14

          21

St. Louis

           16

           14

          13

            7

San Francisco

           22

           27

          14

          12

Washington, D.C.

           14

           16

             8

            5

Source: American Community Survey 2009.


Yet today, central cities undoubtedly have more to offer households with children. Many cities have made significant strides in improving their public safety, or they have simply benefitted from general trends toward lower criminal activity. However, with regard to public education, it is unclear whether most cities have achieved much traction in this regard, though efforts towards these ends are widespread.  In the case of the city of Chicago, more affluent and educated families with school-age children continue to migrate to suburban communities.  This has resulted in a 16.5% decline in the school-age population in the city of Chicago over the past decade.

Urban school improvement initiatives range from a host of teacher pay-for-performance reforms, to “small schools” reconfiguration, to charter school choice and high-achieving academies.  In some instances, where highly educated parents with children have chosen to live in the city, parents have opted out of the public school system. For example, in Manhattan about 1 in 4 school-age children attend private schools. In the more affluent areas within Manhattan the percentage is much higher — about 1 in 2 children in families that live in either the Upper East Side or Upper West Side.

As they aim to encourage further population growth in city centers, policy leaders would do well to understand the residential choices being made by affluent and educated households with children and work to provide the amenities and services important to these families. They represent a population segment that may be significant in attracting jobs and building a tax base to provide public services for all city residents.  Otherwise, working parents who must commute from suburb to city may demand higher wages as compensation for the additional time and cost of getting to work, thus having a negative effect on employment and investment in the city.

The recent influx of young (mostly well-educated) adult singles represents an opportunity for central cities. These urban homesteaders begin with a preference for urban living; policymakers might want to consider ways to keep them in the city as they marry and raise children.

In a current study, we are exploring the relationship between higher education, income, and the location of families with school-age children within a city-suburban area context for 15 large metropolitan areas in the United States, including Chicago, New York City, Philadelphia, and San Francisco.² In particular, we highlight the effects of various levels of higher education on household location and how education effects vary for different types of households. We compare our results with estimates for married respondents without school-age children and for never-married respondents without school-age children. Thus, we are able to highlight the heterogeneity in the effects of education on household location by household type and city-suburb location.

A key variable in our study is whether adults have at least a bachelor’s degree. In about half of the metropolitan areas we examine, educational attainment levels of householders are higher in central cities than in suburban areas. In some cases, the differences are relatively large—for example, the share of population with a college degree is 15 percentage points higher in the city of Seattle than in the suburbs. However, the share is 18 percentage points higher in the suburbs of Detroit than in the city.

But when it comes to college-educated parents, the apparent residential advantage of the city mostly evaporates. In most cases, college-educated parents with school-age children are far less concentrated in central cities relative to all parents with school-age children, with the exceptions of Charlotte, Pittsburgh, and Seattle. For example, 30 percent of college graduates in the Chicago MSA live in the city of Chicago, but only 16 percent of college-educated parents with school-age children live in the city. About half of these parents send their children to private schools.

On the face of it, the key reason that parents live in central cities is the location of their work. A high percentage of parents who work in central cities also live there. For example, 59 percent of parents with school-age children who work in the city of Chicago also live there. This declines to 43 percent for college-educated parents with school-age kids.

How do these numbers hold up to closer statistical scrutiny? To put them to the test, we conducted multivariate analyses with respect to individual household location in city versus suburb. We analyzed each of 15 city-suburb MSA pairs separately for the very recent past. Our study data are drawn from the Census Bureau’s American Community Survey for 2009. According to our results, the ongoing migration of educated, mostly young, adults into the city has not carried over into their child-raising years. Our findings are negative for higher education and income effects on living in a central city for families with school-age children for the largest cities within metropolitan areas in our sample, including Chicago, New York City, and Philadelphia. This contrasts with more positive higher education effects on living in cities for married and never-married respondents without school-age children.

In most of our study MSAs, households with high educational attainment lead the way in living in central cities, but the presence of school-age children negates this effect. Overall, having either a bachelor’s degree or a master’s degree has a negative effect on families with school-age kids living in a city, although there are a few cases where the effect is positive. Having very high levels of educational attainment (a professional degree or a Ph.D.) is negatively associated with living in a city only in a few cases, suggesting that parents with the highest levels of educational attainment tend to have a greater preference for living in cities than other college-educated parents.

To what extent should cities pursue households with children as a focus of strategic development? Clearly, the benefits of good schools and safe neighborhoods accrue to all population segments, so these are important goals for policy in any case. Social returns to education and safety are high; today’s children are tomorrow’s citizenry and work force. Now that more college-educated households are choosing to live in the city during their pre-child-raising years, city leaders may want to explore ways to entice more of them to remain in the city after they become parents.

William Sander (Ph.D., Cornell University) is professor of economics at DePaul University in Chicago.  He has also taught at the University of Illinois at Urbana-Champaign and the University of the Philippines.

William A. Testa (Ph.D., Ohio State University) is Vice President and Director of Regional Programs, Federal Reserve Bank of Chicago.  He has also taught at Tulane University.

References:

¹William Sander and William A. Testa. 2013a. “Education and the Location of Work: A Continued Economic Role for Central Cities.” Annals of Regional Science.

²William Sander and William A. Testa. 2013b. “Parents’ Education, School-Age Children, and Household Location in American Cities.” Paper prepared for the European Regional Science Association Congress, Palermo, Italy.

Crossing the street photo by Bigstock.


125 Years of Skyscrapers

$
0
0

Skyscrapers have always intrigued me. Perhaps it began with selling almanacs to subscribers on my Oregon Journalpaper route in Corvallis. I have continued to purchase almanacs each year and until recently, the first thing I would do is look in the index for "Buildings, tall” in the old Pulitzer The World Almanac, the best source until the Internet.

My 1940 edition is the first in which “Buildings, tall” appears. The world of skyscrapers has changed radically through the years. This article provides a historical perspective on the world’s tallest buildings, using information from almanacs and the Internet (See Table Below). Extensive hyperlinking is also used, principally to articles on particular buildings.

The Rise of Commercial and Residential Buildings

Throughout most of history, the tallest habitable buildings have been religious edifices, or mausoleums, such as the great pyramids of Egypt. But in the middle to late 19th century, taller commercial and residential buildings were erected in the United States. For four years, from 1890 to 1894, the New York World Building, itself was the tallest in the world, at 309 feet (95 meters) and 20 floors. But it was not until the turn of the 20th century that a commercial or residential building exceeded the tallest religious building, Ulm Cathedral in Germany. This was Philadelphia's City Hall. In its wisdom, however, Philadelphia outlawed any building higher than William Penn’s head at the top of City Hall. It was not until the late 1980s that a taller building appeared in Philadelphia (One Liberty Place).

Tallest Buildings in 1940

Despite Chicago's claim as birthplace of the skyscraper, by 1940, nine of the 10 tallest buildings in the world were in New York. Manhattan was so dominant that the World Almanac listed the city at the top of the list, out of alphabetical order. The five tallest buildings, the Empire State Building, the Chrysler Building, 60 Wall Tower (now 70 Pine), 40 Wall Tower (now the Trump Building) and the RCA Building (now the GE Building) all  opened in the 1930s and represent Art Deco at its zenith. The sixth tallest, the Woolworth Building, had been the world’s tallest from 1913 to 1930 and is neo-Gothic.

Cleveland's Terminal Tower was 7th tallest, and the tallest building in the world outside New York. Cleveland's Union Terminal was in the building and served the legendary New York Central Railroad’spremier New York to Chicago 20th Century Limited.

Tallest Buildings in 1962

Things changed little by 1962. The five Art Deco skyscrapers that where the tallest in 1940 remained so in 1962. There were two newcomers to the top 10 list, both modernist monoliths, the Chase Manhattan Bank Building in lower Manhattan and the Pan Am Building (later the Met-Life Building). The Pan Am Building is despised by many New Yorkers as Parisians despise the Tour Montparnasse. This led to banning similar behemoths in the ville de Paris (most of the skyscrapers in the Paris urban area are in La Defense, a nearby suburban “edge city”). But all of the 10 tallest buildings in the world were in the United States.

Tallest Buildings in 1981

Just two decades later, New York's dominance eroded. By now, The World Almanac listed New York in alphabetical order, between New Orleans and Oakland. For the first time since before 1908 when the Singer Building opened, New York was not the home of the world’s tallest building. That title had gone to Chicago’s, Sears Tower (later Willis Tower), which opened in 1974. Chicago gained even more respect with two other buildings appearing in the top 10, the Standard Oil Building (nowAon Center) and the John Hancock Center, which was the tallest mixed use (residential and commercial) building in the world. The twin towers of the former New York World Trade Center were tied for second tallest in the world.

For the first time, a non-American skyscraper was in the top 10. Toronto's First Canadian Place was the eighth tallest in the world. Only three of the former five New York Art Deco buildings remained in the top 10, with 40 Wall Tower and the RCA Building no longer on the list.

Tallest Building in 2000

By 2000,   Kuala Lumpur, which is not among the largest cities in the world, emerged with both of the tallest buildings, in the Petronas Towers. The Petronas Towers ended America's long history of having the tallest building. These distinctive postmodern towers were just two of six Asian entries in the top 10, including another postmodern structure, the Jin Mao Tower in Shanghai’s Pudong, which is probably the world’s largest edge city.

I recall my surprise at exiting the Guangzhou East Railway station in 1999 to see the CITIC Tower, the 7th tallest building in the world. There could have been no better indication of that nation's modernization. The Pearl River Delta had two other of the tallest buildings, one in Shenzhen (Shun Hing Square), the special economic zone that became the economic model for the rest of China, and the second in Hong Kong (Central Plaza).

Tallest Building in 2013

By 2013, the world of skyscrapers had nearly completely overturned. Dubai, with a population little more than Minneapolis-St. Paul, is now home to the world's tallest building, the Burj Khalifa. The Burj Khalifa is not just another building. Never in history has a new tallest building exceeded the height of the previous tallest building by so much. Even the long dominant Empire State Building had exceeded the Chrysler building by only 200 feet (64 meters). The Burj Khalifa was nearly 1050 feet higher (320 meters) than the then tallest building, Taipei 101, and reaches to more than 1/2 mile (0.8 kilometers) into the sky. The world’s second tallest building (the Mecca Royal Hotel Clock Tower) is also on the Arabian Peninsula.

The Shanghai World Financial Center is now the fourth tallest in the world, and when it opened had the highest habitable floor and the highest observation deck in the world. Its unusual design has earned it the nickname "bottle opener" among residents (Photo 1). Hong Kong has a new entry in the list, the International Commerce Center, across the harbor in Kowloon. Nanjing’s Greenland Financial Complex (Photo 2) ranks 8th, and Shenzhen’s Kinkey 100 ranks 10th.


Nine of the 10 tallest buildings in the world are now in Asia. The last American entry is the Sears Tower (Willis Tower), in Chicago, which ranks 9th. Skyscraperpage.com maintains a graphic of the world's tallest buildings (Note 1).

Under Construction: A number of super-tall buildings (Note 2) will soon open. Earlier this month, the Shanghai Tower was “topped out.” This structure is across the street from the Jin Mao Tower and the Shanghai World Financial Center, forming by far the greatest concentration of super-tall skyscrapers in the world (Photo 1). The Ping An Finance Center in Shenzhen and the Wuhan Greenland Center in Wuhan are also under construction, and will rank, at least temporarily, second and third tallest in the world when completed. The Goldin Finance Building in Tianjin and the Lotte World Tower in Seoul will be somewhat shorter. One World Trade Center in New York will be completed before most of these, which will allow it brief entry into the top ten.

Another entry, Sky City in Changsha (Hunan) could be on the list, slightly taller than the Burj Khalifa. This building is to be constructed in 210 days, following site preparation and work began last month. It was, however, halted by municipal officials and there are conflicting reports as to the building’s status.

Skyscraperpage.com also maintains a graphic of the world's tallest under-construction buildings.

Tallest Buildings in 2020?

None of the tallest buildings in the world are predicted to be in the United States by 2020, according to a graphic of current plans posted on the Council on Tall Buildings and Urban Habitat website. The Burj Khalifa is expected to be replaced as tallest by another Arabian Peninsula entry, the Kingdom Tower in Jeddah, which will be 0.6 miles high (3.3 kilometers). The torch has been passed to Asia.


WORLD'S TALLEST COMPLETED BUILDINGS: 1940-2013
1940BuildingCityFeetMetersStories
1Empire StateNew York 1,250 381 102
2ChryslerNew York 1,046 319 77
360 Wall Tower (70 Pine Street)New York 950 290 66
440 Wall Tower (Trump)New York 927 283 90
5RCANew York 850 259 70
6WoolworthNew York 792 241 60
7Terminal TowerCleveland 708 216 52
8Metropolitan LifeNew York 700 213 50
9500 5th AvenueNew York 697 212 60
1020 Exchange PlaceNew York 685 209 54
1962BuildingCityFeetMetersStories
1Empire StateNew York 1,250 381 102
2ChryslerNew York 1,046 319 77
360 Wall Tower (70 Pine Street)New York 950 290 66
440 Wall Tower (Trump)New York 927 283 71
5RCANew York 850 259 70
6Pan Am (Met-Life)New York 830 253 59
7Chase ManhattanNew York 813 248 60
8WoolworthNew York 792 241 60
920 Exchange PlaceNew York 741 226 57
10Terminal TowerCleveland 708 216 52
1981BuildingCityFeetMetersStories
1Sears Tower (Willis Tower)Chicago 1,454 443 110
2World Trade Center-North TowerNew York 1,350 411 110
2World Trade Center-South Tower New York 1,350 411 110
4Empire StateNew York 1,250 381 102
5Standard Oil (Amoco)Chicago 1,136 346 80
6John Hancock CenterChicago 1,127 344 100
7ChryslerNew York 1,046 319 77
8Texas Commerce TowerHouston 1,002 305 75
9First Canadian PlaceToronto 952 290 72
1060 Wall Tower (70 Pine Street)New York 950 290 66
2000BuildingCityFeetMetersStories
1Petronas Tower 1Kuala Lumpur 1,483 452 88
1Petronas Tower 2Kuala Lumpur 1,483 452 88
3Sears Tower (Willis Tower)Chicago 1,454 443 110
4Jin Mao TowerShanghai 1,381 421 88
5World Trade Center-North TowerNew York 1,350 411 110
5World Trade Center-South Tower New York 1,350 411 110
7Citic PlazaGuangzhou 1,283 391 80
8Shun Hing CenterShenzhen 1,260 384 69
9Empire StateNew York 1,250 381 102
10Central PlazaHong Kong 1,227 374 78
2013BuildingCityFeetMetersStories
1Burj KhalifaDubai 2,717 828 163
1Mecca Royal Hotel Clock TowerMecca 1,971 601 120
3TaipeiTaipei 101 1,670 508 101
4Shanghai World Financial CenterShanghai 1,614 592 101
5International Commerce CenterHong Kong 1,588 484 118
6Petronas Tower 1Kuala Lumpur 1,483 452 88
6Petronas Tower 2Kuala Lumpur 1,483 452 88
8Greenland Financial ComplexNanjing 1,476 450 89
9Sears Tower (Willis Tower)Chicago 1,454 443 110
10Kinkey 100Shenzhen 1,450 442 100
  Outside United States
  United States, Outside New York
  New York


Wendell Cox is a Visiting Professor, Conservatoire National des Arts et Metiers, Paris and the author of “War on the Dream: How Anti-Sprawl Policy Threatens the Quality of Life.

---------------------

Note 1: There are a number of sources for information on tall buildings, such as the Council on Tall Buildings and Urban Habitat, Skyscraperpage.com, Emporis.comand Wikipedia.com. Of course, my favorite will always be The World Almanac, even if the Internet provides faster access. Wikipedia also has fascinating articles on individual buildings (Wikipedia’sutility is limited to recreational research for identifying original sources, and should never be used in serious research, or God forbid, used in a footnote).

Note 2: The Council on Tall Buildings and Urban Habitats defines a super-tall building as being over 980 feet (300 meters) high.

------------------------------

Photo 1: Jin Mao Tower (left) and Shanghai World Financial Center (right), Shanghai. Construction began later on the recently topped out Shanghai Tower to the right of the Shanghai World Financial Center.

Photo 2: Greenland Financial Center, Nanjing

----------------------------

Photograph: The New York World Building (1890-1955).

America Hanging in There Better Than Rivals

$
0
0

To paraphrase the great polemicist Thomas Paine, these are times that try the souls of optimists. The country is shuffling through a very weak recovery, and public opinion remains distinctly negative, with nearly half of Americans saying China has already leapfrogged us and nearly 60 percent convinced the country is headed in the wrong direction. Belief in the political leadership of both parties stands at record lows, not surprisingly, since we are experiencing what may be remembered as the worst period of presidential leadership, under both parties, since the pre-Civil War days of Franklin Pierce and James Buchanan.

Yet, despite the many challenges facing the United States, this country remains, by far, the best-favored part of the world, and is likely to become more so in the decade ahead. The reasons lie in the fundamentals: natural resources, technological excellence, a budding manufacturing recovery and, most important, healthier demographics. The rest of the world is not likely to cheer us on, since they now have a generally lower opinion of us than in 2009; apparently the "bounce" we got from electing our articulate, handsome, biracial Nobel laureate president is clearly, as Pew suggests, "a thing of the past."

But as the Romans used to say, don't let the bastards get you down. After all, it's not like our competitors are stealing the march on us. Start with Europe. Just a few years ago, writers like Jeremy Rifkin and Steven Hill were telling us that Europe was the "model" for the world. Expand the welfare state, curtail capitalist excess, provide a comfortable partner to the rising nations of the world, and, well, enjoy a long and comfortable early retirement.

Now, that early retirement is quickly turning into a kind of senility. Not only is Europe continuing to age– particularly along its Southern rim – but the fiscal pressures of ultrahigh unemployment, approaching 30 percent or above, among the young and the costs of maintaining a strong welfare state could create what urban analyst Aaron Renn has labeled "a demographic Lehman Brothers."

At the same time the near-collapse of the Southern-rim countries threatens the viability of Europe's banks, including those in Germany. Increasingly, Germany lives largely so the rest of Europe can die more quickly. Like a prototypical science-fiction villain, Germany – with fewer children than it had in 1900 – relies increasingly on the blood taken from the decaying Southern rim countries. By 2025, Germany's economy will need 6 million additional workers, likely from such countries as Spain, Italy, Greece and Portugal, to keep its economic engine humming, according to government estimates.

Asian anemia

What about our prime Asian competitors? Japan has been the sick man of Asia for more than two decades. It's now desperate enough to unleash Bernanke-like money-printing policies to supply some desperately needed economic Viagra. With a weaker currency, and more money from the Tokyo exchange, there could be a temporary recovery, but Japan's long term prognosis is not good.

What Japan really needs is more animal spirits – particularly the kind that produce offspring. By 2050, according to UN estimates, Japan will have 3.7 times as many people at least age 65 than 15 and younger. By then, there will be 10 percent more Japanese over 80 than under 15. Without an unlikely embrace of immigration, Japan is destined to become the nation in wheelchairs.

China poses a more serious challenge, but the Middle Kingdom appears headed toward what one analyst calls "the end" of its amazing and profound economic miracle. Growth, once projecting Chinese global preeminence, is slowing precipitously. The country now faces a growing rank of competitors from lower-wage countries poised to take market share from the Middle Kingdom.

China faces growing political instability at the grass-roots level, a mountain of state-issued bad debt and a festering environmental crisis, which threatens long-term food supplies and could create massive health problems. China is rapidly aging. It will have 60 million fewer people under age 15 by 2050, while gaining nearly 190 million people at least 65, approximately the population of Pakistan, the world's fourth-most populous country.

The so-called BRICS (Brazil, Russia, India, China and South Africa), once the darlings of the investment banking set, all are facing slowing growth and rising political instability. It doesn't help that most are either total or partial kleptocracies, dependent on commodity exports or cheap labor. This is not a solid foundation for ascendency as newer emerging nations – Myanmar, Indonesia, Vietnam – ramp up.

ENERGY SHIFT

On all these accounts, North America, including our Canadian and Mexican neighbors, looks best-positioned. The first, and, arguably, most important game-changer is the energy revolution that could realign the economic stars for decades to come. The shale oil and natural gas boom, as the Economist recently noted, is as illustrative of America's future, and genius at reinvention, "as the algorithms being generated in Silicon Valley."

The energy boom's best aspect, besides the emergence of relatively cleaner natural gas, is making global tyrants, such as those ruling Saudi Arabia and Russia, nervous about their future place in the world. These worries alone should send a three-word message to our leaders: Go for it.

But North America is not, like Russia, a one-trick pony. The U.S. remains the world's leading food producer and exporter, sending out more of such critical commodities as soybeans, corn and wheat than any other country. After decades of decline, the U.S. industrial base is growing again, and, although job growth is likely to be limited, our manufacturing sector is already the most productive in the world. With the advantages of a decent legal order, a huge domestic market and available workforce, the U.S. has remained the largest recipient of foreign investment on the planet, roughly five times that so far accumulated in China.

Technology can be a fickle industry, but at this point of the game, it's fair to say the U.S. is winning that race. As potentially dangerous as the tech giants may become over time, the U.S. dominance in everything from software code (Microsoft) and design (Apple), search (Google), e-retailing (Amazon), and social networking (Facebook) is nothing short of astounding. We even lead in the coffee business (Starbucks) that keeps all those nerds typing code late into the night.

Cultural influence

Then there's the matter of culture. For years, Asian, Third World and European cultural warriors have plotted to knock the U.S. off its pre-eminent perch. But the European film industry is a shadow of its once-glorious efflorescence; much the same can be said about the once-splendid Japanese cinema. To be sure, Chinese films, Korean pop stars and Bollywood are rising forces, but U.S. exports more than $14 billion annually in film and television. On a global level, no one can compete with Hollywood as a packager of images and dreams – and Silicon Valley's control of new distribution technology could further boost this advantage.

Finally, there's the matter of demographics. The United States, like its competitors, is aging, but not as quickly as our prime rivals. The birth rate has slowed with the recession, but it's likely to come back toward replacement levels in the years ahead as millennials enter their thirties en masse, and immigrants continue coming to the country. America should be the only one of the top five economies with a growing workforce over the next few decades.

So, if things are so good, why do they seem so bad? Sixteen years of lackluster leadership has not helped – a succession of two spendthrift presidents, one a too-happy warrior with a weak sense of the limits of even an imperial power, and the other, a posturing and arrogant academic oddly disconnected from the fundamental grass-roots drive that moves his country's economy. Yet I prefer to see it in a more positive light: If we can do better than our major competitors under such leadership, how great a country is this?

Joel Kotkin is executive editor of NewGeography.com and Distinguished Presidential Fellow in Urban Futures at Chapman University, and a member of the editorial board of the Orange County Register. He is author of The City: A Global History and The Next Hundred Million: America in 2050. His most recent study, The Rise of Postfamilialism, has been widely discussed and distributed internationally. He lives in Los Angeles, CA.

This piece originally appeared at The Orange County Register.

USA map image by BigStockPhoto.

Root Causes of Detroit’s Decline Should Not Go Ignored

$
0
0

Recently Detroit, under orders from a state-appointed emergency manager, became the largest U.S. city to go bankrupt. This stirred predictable media speculation about why the city, which at 1.8 million was once America’s 5th-largest, declined in the first place. Much of the coverage simply listed Detroit’s longtime problems rather than explaining their causes. For example a Huffington Post article asserted that it was because of “racial strife,” the loss of “good-paying [sic] assembly line jobs,” and a population who fled “to pursue new dreams in the suburbs.” Paul Krugman, who has increasingly become America’s dean of misguided thinking, downplayed the city’s pension obligations, instead blaming “job sprawl” and “market forces.” The implication is that Detroit’s problem just arose organically from structural economic changes, and within decades somehow produced a city of abandoned homes and unlit streets.

But a closer look suggests that Detroit’s problems, which include 16% unemployment, 36% poverty, and 60% population decline, were self-inflicted by a half-century of government excess. Thomas Sowell nicknamed this excessiveness the “Detroit Pattern”, and defined it as the city’s habit for “increasing taxes, harassing businesses, and pandering to unions.” These three problems have proven as instrumental to decline as the “Big Three” automakers once were to Detroit’s rise. Analyzing their background, and potential for reform, could expedite the city’s turnaround.

The foremost measure would be addressing taxes. Currently Detroit has one of America’s largest tax burdens for major cities, offering notoriously bad services in return (police response times average 58 minutes, and 40% of streetlights do not work). Its property tax rates are the nation’s highest, exceeding 4% for some buildings. This has caused particular disinvestment in the city’s large stock of abandoned homes, some of which sell for below $1000, but are avoided since they get assessed at far above their actual worth, leaving owners with inflated tabs.

Detroit could also help its cause with a business climate that better encouraged entrepreneurship. For decades it has done the opposite, championing a growth policy that mirrored the city’s overly-centralized private sector. It has gambled—with tax breaks, subsidies, and extensive eminent domain—on stadiums, casinos, office towers, factories, and a downtown monorail, only to find that these didn’t produce nearly the anticipated benefits. Meanwhile it has squelched small businesses, which are generally better at creating jobs, with a cobweb of protectionist regulations—on food trucks, taxis, movie theaters, and so on. This was summarized in economist Dean Stansel’s recent “economic freedom” study, which ranked the regulatory and tax climates of U.S. metro areas. In a field of 384, Detroit placed 345th.

These regulations have emanated from Detroit’s vast, union-controlled public bureaucracy. Recent debate about this bureaucracy has focused on retirement benefits, which apologists note are far less generous than in other big cities. But this does not detract from the sheer number of retirees, which at 20,000 are nearly twice Detroit’s existing public workforce, and account for obligations of potentially half the city’s $18 billion debt.

Less discussed is the way unions protect existing workers also, by stifling needed service reforms. When a philanthropist offered $200 million in 1999 to open the city’s first charter school, which would require changes to state law, the Detroit Federation of Teachers organized a work stoppage to protest in Lansing, ultimately causing withdraw of the donation. Various other city unions (which total 47) have resisted reduction or privatization of water utilities, trash-pickup, street lighting, and transportation. This is despite the city having proven wildly incompetent at providing these services itself, a point made recently in the Wall Street Journal by a former transportation chief. He claimed that unionization of the 1,400-employee DDOT had ensured worker protections for rampant absenteeism and poor performance, thus creating a climate in which 20% of scheduled buses did not arrive. Similar protections from firings and layoffs existed in other city departments, he wrote, perhaps explaining why Detroit, at over 10,000 workers, remains one of the most overstaffed big cities in America, while managing to do so little with them.

Of course many would argue that Detroit’s post-World War II racial conflicts were the real reasons for decline. More plausible is that these conflicts were inflamed by that era’s top-down government policies, which became all the worse when enforced by seemingly prejudiced officials. Throughout the 1950s and 1960s white mayors steamrolled roadways through functioning black neighborhoods like Black Bottom, and housed the displaced in dangerous, high-rise government projects. Funding for this and other “urban renewal” came from federal programs like President Johnson’s Model Cities, and using Detroit as a flagship, was meant to modernize aging urban communities. But the programs instead fragmented them, including a Detroit black population that, according to Sowell, then had 3.4% unemployment and “the highest rate of home-ownership of any black urban population in the country.” For them this “renewal” created a housing shortage, and along with discrimination and police brutality, inspired riots in 1967.

These riots killed dozens, injured nearly 1,200, and along with the ones inspired by Martin Luther King’s assassination, immediately spurred a mass white exodus. This cemented the demographic changes needed for both the 1973 election of Detroit’s first black mayor, Coleman Young, and subsequent policies that instead targeted the city’s whites. A paper by economist Edward Glaeser argues that this was done intentionally by Young as a way to further drive political rivals to the suburbs, and increase the share of his poor black voting base. He did this, writes Glaeser, by cutting off services in white neighborhoods, imposing onerous taxes, and displacing thousands of Polish households for a GM factory in the Poletown neighborhood. This led to further white exodus and diminishment of the tax base.

All these are examples of rampant abuses, under both black and white leadership, that have resulted because of Detroit’s notorious governing “pattern.” But one silver lining of its bankruptcy is the opportunity for structural change. This could occur by channeling the urban reforms—from charter schools, to defined-contribution pensions, to looser permitting, to plain-old lower taxes—that have helped other U.S. cities the last two decades. If these reforms can thrive in the Motor City than they probably can anywhere, turning it at the very least back into a functioning city, and at best into a reemerging economic star.

Scott Beyer is traveling the nation to write a book about revitalizing U.S. cities. His blog, Big City Sparkplug, features the latest in urban news. Originally from Charlottesville, VA, he is now living in different cities month-to-month to write new chapters.

Photo by Kate Sumbler.

Plan Bay Area: Telling People What to Do

$
0
0

The San Francisco area’s recently adopted Plan Bay Area may set a new standard for urban planning excess. Plan Bay Area, which covers nearly all of the San Francisco, San Jose, Santa Rosa, Vallejo and Napa metropolitan areas, was recently adopted by the Metropolitan Transportation Commission (MTC) and the Association of Bay Area Governments (ABAG). This article summarizes the difficulties with Plan Bay Area, which are described more fully in my policy report prepared for the Pacific Research Institute (Evaluation of Plan Bay Area).

Plan Bay Area would produce only modest greenhouse gas emissions reductions, while imposing substantial economic costs and intruding in an unprecedented manner into the lives of residents. The Plan would require more than three quarters of new residences and one third of net additional employment to be located in confined "priority development areas." These measures have been referred to as “pack and stack” by critics. The net effect would be to virtually ban development on the urban fringe, where the organic expansion of cities has occurred since the beginning of time.

Irrational Planning

Violating perhaps the most fundamental requirement of a rational plan, Plan Bay Area begins with a situation that no longer exists. Further, it is based on exaggeration, systematic disregard of official federal government projections and overly optimistic planning assumptions.

Exaggerated Population Projection: The Plan assumes that the Bay Area will grow 55 percent more rapidly between 2010 and 2040 than official California state Department of Finance population projections indicate. These state-produced estimates have tended themselves to be on the high side (Figure 1). The planners scurried about to resolve these differences, but there is no indication that the state will be revising its projections. Plan Bay Area’s population projection would require growth in the Bay Area to increase by more than one-half from the 2000-2010 annual rate. The exaggeration of population growth has its uses: it leads to a higher greenhouse gas emissions projection for 2040, providing a rationale for stronger policy interventions.

Ignoring Current Greenhouse Gas Emissions Projections: The Plan also ignores the new, more favorable DOE fuel economy projections (Figure 2). These projections were issued in December, well before the publication of the draft plan in April and the adoption of the final plan in July. Indeed, if the new DOE projections had been published the day before, Plan Bay Area should have been placed on hold and revised. In short, Plan Bay Area was out of date when adopted.

Overly Optimistic Planning Assumptions: The Plan assumes that travel by light vehicle (automobiles, sport utility vehicles and pickups) would be reduced by substantial increases in transit ridership. Plan Bay Area presumes that expanding transit service 27 percent over the next 30 years will lead to a near doubling of transit ridership. This is stupefying, since over the last 30 years, transit ridership remained virtually the same, while service was expanded nearly twice as much as would be planned from 2010 to 2040.

The plan also assumes that residents forced into the priority development areas will use transit and walking much more, materially reducing their use of light vehicles. This research behind this assumption is skewed toward transit oriented developments located on rail lines with good access to downtown. But nearly nine out of 10 employees in the Bay Area work outside the downtowns of San Francisco and Oakland, and that number is increasing (according to Plan Bay Area).

Given recent history, it seems wishful thinking to believe that small transit service expansions and downtown oriented transit development can do much to attract drivers from cars. The modest gains greenhouse gas emissions reductions projected in Plan Bay Area are likely exaggerations.

Plan Bay Area’s “pack and stack” densification is likely to produce even less than the modest substitution of transit and walking for driving (see The Transit-Density Disconnect). Traffic congestion, in this already highly congested area, is likely to be worsened, which could nullify part or all of the greenhouse gas emission reductions expected from reduced vehicle use.

Correcting Plan Bay Area Forecasts

Plan Bay Area would only modestly reduce light vehicle travel and greenhouse gas emissions. This is illustrated in Figure 3, which shows that the “pack and stack” strategies that would force most new residents and jobs into priority development areas, Plan Bay Area would reduce greenhouse gas emissions by 2 percent (“Plan Bay Area” line compared to the “Trend” or “doing nothing” line).

By contrast, correcting the Plan Bay Area 2040 population estimates to reflect the state population projections would reduce greenhouse gas emissions more than eight times as much (17 percent), without the “pack and stack” strategies. A further correction of the Plan Bay Area 2040 estimates to reflect the latest DOE fuel economy projections, would reduce greenhouse gas emissions 22 percent, 11 times as much as the “pack and stack” strategies.

Heavy Costs for Households and Businesses

The Plan’s “pack and stack” strategies seem likely to exacerbate the Bay Area’s already high cost of living. Currently, the San Francisco and San Jose metropolitan areas have the worst housing affordability among the nation's 52 metropolitan areas with more than 1 million residents. San Jose's median house price relative to its median household income was 7.9 last year, according to the Demographia International Housing Affordability Survey. San Francisco’s median multiple was 7.8. This severely unaffordable housing results from recent decades of urban containment or smart growth policies, which have severely restricted the land on which development can occur. This drives up prices (other things being equal), consistent with economic principle. This has been made worse by house and apartment impact fees imposed on developers that are far above the national average.

By comparison, in major metropolitan areas that have not implemented strong urban containment policies, the median multiple has typically been 3.0 or less since World War II, including the Bay Area before its adoption (Figure 4). The “pack and stack” strategies would largely limit new development to small parts of the Bay Area, an even more draconian prohibition than the long standing restrictions on urban fringe development. This further rationing of land could be expected to drive land prices even higher, making it even more difficult for households and businesses to live within their means.

The problem is already acute. The new US Census Bureau housing cost adjusted data shows California to have the highest poverty rate among the states and the District of Columbia (metropolitan area data is not available). An early 2000s Public Policy Institute of California report showed Bay Area poverty to be nearly double the official rate, adjusted for the cost of living. Ultra pricey San Francisco had among the ten highest poverty rates – over twenty percent – of any urban county in the country.

Unaffordable housing has also fueled an exodus to the San Joaquin Valley (Central Valley). Now more than 15 percent of the workers in the Stockton metropolitan area commute to the Bay Area, which led the Federal Office of Management and Budget adding Stockton to the San Jose-San Francisco combined metropolitan area (combined statistical area). In addition, the greater traffic congestion is likely to lengthen work trip travel times. This is likely to further increase emission while also burdening job creation and economic growth (see Traffic Congestion, Time and Money).

Ignoring the Economy and Poverty

Plan Bay Area effectively ignores these costs (despite rhetoric to the contrary), by failing to subject its strategies to a cost per ton metric. According to the United Nation’s Intergovernment Panel on Climate Change (IPCC), sufficient greenhouse gas emissions reductions can be achieved at a cost between a range of $20 to $50 per ton. The previous regional plan (through 2035) included such estimates. Only highway strategies achieved the IPCC range. Transit and land use strategies cost from four to more than 100 times the top of the IPCC range. Even those estimates did not include the prohibitively higher housing costs that result from urban containment policies. The cost metric is crucial, because spending more than necessary to reduce greenhouse gas emissions limits job creation and economic growth, which leads to reduced household affluence and greater poverty. This is the very opposite of the economic objectives of public policy. Virtually all political jurisdictions around the world seek greater prosperity for their residents and less poverty. A legitimate regional plan requires subjecting its strategies to economic metrics.

Opposition

There is opposition to Plan Bay Area. A citizen movement worked for rejection and has now filed suit claiming that the Plan violates the California Environmental Quality Act. The suit also alleges that MTC and ABAG used a questionable interpretation of state law and regulation to justify the irrational Plan outcomes.

Recorded Votes

Opponents were also successful in obtaining a rare recorded vote at ABAG. The governing board (General Assembly) is composed of selected elected officials from cities and counties who are not elected to their ABAG positions. ABAG adopts virtually all of its actions by consensus, rather by recorded votes, as occurs in many of the nation’s regional planning boards.

Consensus decision making seem especially odd in California, where inability to obtain sufficient votes in the legislature for the state budget required a constitutional amendment. Neither do city councils and county commissions operate on a consensus basis on controversial issues.

There is no shortage of controversial issues, at ABAG or other regional planning agencies. A good first reform would be for recorded votes to be the rule, rather than the exception. Consensus decision making may be appropriate for clubs, but it is not for representative bodies in a democracy.

Impeding the Quality of Life

Plan Bay Area was outdated when approved and reflects a world that no longer exists. Drafters have insisted on extravagantly expensive and intrusive policies that produce only minimal greenhouse gas reductions, and at great cost, using, among other things, unreasonably bloated population forecasts to bolster their approach. Unless changed, the Plan will likely be more successful in driving up housing prices, limiting options for households, and further congesting traffic than meeting its stated goal of reducing   greenhouse gas emissions.

Wendell Cox is a Visiting Professor, Conservatoire National des Arts et Metiers, Paris and the author of “War on the Dream: How Anti-Sprawl Policy Threatens the Quality of Life.

Photo: San Francisco (by author)

Cities Don’t Consume Resources, People Do

$
0
0

Urban form or urban consumers?If we want to reduce the environmental impacts of modern society let’s prioritize consumption, not city form.  The evidence suggests that large cities (and especially city centres) are associated with a bigger environmental footprint than modest cities or suburbs. 

This post looks at incomes and consumption, especially the consumption of housing and transport services, asking how far can local regulation really influence environmental impacts?

What can local governments do about the environment?
Local governments have two core roles.  One is to ensure that the infrastructure and services necessary to sustain everyday life and commerce are in place and working well.  In fulfilling this role they should aim to enhance the quality of the urban environment and limit any environmental impacts of infrastructure. 

The other role is to plan and manage development in a way that reduces conflict among land uses. In doing that they should aim to contain or control adverse spill-over impacts. 

However, for councils to use their investment in infrastructure and land use regulation to determine in detail how and where people should live and consume pushes the boundaries of these roles, particularly when they try indirectly to reshape household behavior by reshaping the city.

The key to understanding the environmental impacts of urbanized society is not urban form but household consumption, a function of income, not city plans.

Urbanization and environmental impacts
In a recent piece I showed how policies to increase residential densities around city and town centres assume a relationship between urban form and environmental impacts that is not supported by the evidence. In Australia, for example, residents of the New South Wales state capital, Sydney, particularly central Sydney, have by far the largest environmental impact per head.  Much lower levels are recorded in suburbs, smaller cities, and towns. (The same pattern is evident in all Australian states: have a look using the Australian Consumption Atlas).

The environmental impacts of intensive urban living outweigh any advantages of increasing scale and density. This means that policies that push agglomeration and intensification will increase rather than lower the impacts of urban living.

Household spending is the issue
The Australian study confirms that a city’s environmental impacts simply comprise the collective impacts of its residents.  Income is the driver of their consumption and thereby their demands on the environment. 

If we really believe city form can in some way over-ride income- and consumption-driven environmental impacts, then we should heed the evidence and plan for modest, small scale, dispersed urban settlement. 

Spending on housing and transport in New Zealand
Household Expenditure Survey data for New Zealand (and elsewhere) provide an opportunity to explore the role of income in consumption generally. 

First, take a look at the distribution of spending on housing, transport, and discretionary goods (recreation and cultural services is used to represent the latter category) according to household incomes in 2010. Average spending levels have been organized by income decile for this purpose, each group containing 10% of households. Average incomes increase from decile 1 (the lowest earning 10% of households) to decile 10 (the highest earning 10%).

The pattern is pretty predictable.  Housing dominates the spending of low decile households.  It accounts for 34% in the lowest decile, falling to 22% in the ninth.  It rises again (to 24%) in the highest earning decile (10). This lift between decile 9 and 10 households no doubt reflects higher discretionary spending in the latter group by way of additional space, the quality of fit-outs, and second homes. 

Shares of Household Spending to Selected Categories, by Income Band
http://3.bp.blogspot.com/-9RfoZrWOqJk/UdklonCl_xI/AAAAAAAAAY0/AX1r49MtdJE/s640/Share+of+hhold+spend+by+category.jpg

Do lower housing costs lead to higher transport spending?
Rent theory suggests that lower household spending is offset by higher transport spending.  This is because low income households can only afford cheaper, less accessible properties and so end up commuting further at a higher cost than high income households. 

It turns out that it’s not that simple.  Contrary to the theory, higher income households actually spend more of their income on transport.  That makes sense when we realize that commuting accounts for only around 25% of time spent travelling by New Zealanders.  The capacity to take discretionary trips is a bigger determinant of transport consumption than non-discretionary commuting and work-based trips.

The Relationship Between Spending on Housing and Transport

http://4.bp.blogspot.com/-8sGLN4_gTfo/UdyUskoSpgI/AAAAAAAAAZk/WEqMSQNRZM4/s640/Transport+Housing+Relationship.jpg


Lower incomes leave a lot less to spend on discretionary goods and services once housing and essential transport spending are covered.[1] Higher income households can and do travel more and consume more.  Their behavior is unlikely to be significantly influenced by changing city form. 

Who spends how much?
Not surprisingly total consumption in New Zealand is dominated by higher income households: the 20% highest earning households (deciles 9 and 10) account for 35% of total spending on goods and services, while the lowest earning 20% (deciles 1 and 2) account for just 20%.

And decile 10 households account for 7 times more spending on transport than decile 1 households.  They spend 5.5 times more on recreation and cultural services, and 3.5 times as much on food.


The Contribution of Household Total Expenditure by Income Band, Selected Categories
http://2.bp.blogspot.com/-OXL5hMRRw-Q/UdklqCO8CjI/AAAAAAAAAZA/o2GweAb3nTc/s640/Contributinm+to+totalmspoend+by+decile.jpg

 
The highest income households spend three times more on housing than low income households, an average of $476 per week compared with $161.
If refurbished housing in high amenity inner city living is expensive, guess which income groups will be living there?  The high consumers, obviously.  And in Auckland, at least, it seems that city planners and policy-makers are keen to deliver them the high order consumer services that will promote ever-more discretionary spending around the CBD(although much of central city resident travel may be taken up with recreational and social trip-making away from there).  

A high social cost for little environmental benefit?
The conclusion is straightforward: higher incomes mean more expenditure on additional housing, transport, and discretionary goods and services with correspondingly high environmental impacts.  If incomes are higher in cities, then their collective impacts will be high too.

Planning policies won't change that much - except to the extent that they erode consumption by inflating the basic costs of living, something that impacts most heavily on lower income households.  

Fiddling with city form is unlikely to significantly reduce the impact of higher incomes and associated spending on the environment.  Increasing dwelling and living costs by promoting larger cities, higher residential densities, and uneconomic transit systems simply penalizes low income households already committing substantial shares of their spending to housing and transport.  And this is the group that, by dint of constrained consumption, has the lowest impact on the environment. 

Better to address environment issues directly
From a policy perspective, environmental issues are better tackled directly.  This may mean promoting environmentally friendly goods and services, promoting low impact technologies (including low impact housing, fuel efficient vehicles, and the like), and encouraging responsible consumption. If we are really serious about environmental threats, we need to examine the efficiency of current pricing practices and even taxation measures, rather than leaning so heavily on clumsy, indirect, and ultimately spurious urban planning policies. 

Phil McDermott is a Director of CityScope Consultants in Auckland, New Zealand, and Adjunct Professor of Regional and Urban Development at Auckland University of Technology.  He works in urban, economic and transport development throughout New Zealand and in Australia, Asia, and the Pacific. He was formerly Head of the School of Resource and Environmental Planning at Massey University and General Manager of the Centre for Asia Pacific Aviation in Sydney. This piece originally appeared at is blog: Cities Matter.

Photo by Pat Scullion

Rust Belt Chic And The Keys To Reviving The Great Lakes

$
0
0

Over four decades, the Great Lakes states have been the sad sack of American geography. This perception has been reinforced by Detroit’s bankruptcy filing and the descent of Chicago, the region’s poster child for gentrification, toward insolvency.

Yet despite these problems, the Great Lakes’ future may be far brighter than many think. But this can only be accomplished by doubling down on the essential DNA of the region: engineering, manufacturing, logistics, a reasonable cost of living and bountiful natural resources. This approach builds off what some local urbanists, notably Jim Russell, have dubbed “rust belt chic.”

With a population of 58 million, the Lakes region boasts a $2.6 trillion economy equal to that of France and far larger than the West Coast’s. (We define the region geographically as comprising the western ends of New York and Pennsylvania, northeastern Minnesota, and Ohio, Indiana, Illinois, Michigan and Wisconsin.) Despite the growth in auto manufacturing in the South, the Great Lakes region still accounts for the vast majority of jobs in the resurgent industry, now operating at record levels of capacity.

Since 2007, Michigan, Indiana, Ohio and Wisconsin have ranked among the top five states for growth in industrial jobs, adding a half million new manufacturing jobs since 2009.

To build on this progress the region needs to focus on its human assets. This starts with by far the nation’s largest concentration of engineers, some 318,000, which stems from the oft unappreciated fact that manufacturing employs the majority of scientists and engineers in the nation. It also accounts for almost 70% of corporate research and development. This includes disciplines such as mechanical engineering, which according to a recent EMSI study, has enjoyed steady job and income growth over the past 20 years.

Another critical asset is the concentration of skilled trades, the workers most sought after by employers, according to a recent Manpower survey. To keep this advantage, the area needs to focus on educating its workforce — particularly in neglected inner city neighborhoods — with skill training for jobs that actually exist and are expected to grow. This is already occurring in some states, such as Ohio.

To be sure, traditional manufacturing jobs, particularly for the unskilled and semi-skilled, likely will never come back in large numbers. But the earnings level for skilled workers will remain well above the national average, and may increase even further as shortages develop.

Some dismiss such blue-collar strengths as a critical weakness. They suggest that area residents might decamp for places like Silicon Valley where they can find livelihoods cutting hair and providing other personal services for the digerati.

Of course, no sane Great Lakes leader would endorse this approach in public, but many, instead of embracing “rustbelt chic” prefer to recreate a faux version of America’s left coast. This obsession goes back at least a decade, reaching its most risible level during the time of former Michigan Gov. Jennifer Granholm. Her strategy focused on turning its cities — including Detroit — into “cool” burgs.

This clearly did little to turn around either already beleaguered state or cities; “cool” did not save Detroit from bankruptcy. Indeed cool represents just one variation in a myriad of Rust Belt elixirs, including casinos, convention centers, “and creative class oriented arts districts. Virtually all the strategies being adopted in Detroit have already been applied in Cleveland, including by the same entrepreneur, Quicken Loans Chairman Dan Gilbert, with very little tangible economic benefit.

Yet despite this history, Detroit — the poster child of public malfeasance — once again is pinning its hopes on luring the “creative class” to Motor City. It starts with the usual stab at subsidizing housing, office and retail around the central core. This is being jump-started by taking Quicken Loans jobs already in the area’s suburbs, meaning little net regional advantage.

Even more absurd, Michigan taxpayers are being asked to pony up to as much as $440 million for a new stadium in Detroit for the Red Wings hockey team. In contrast to this beneficence, many remaining established, older smaller neighborhood businesses — many of them deeply entrenched in the Rust Belt economy — get stuck with ever higher tax bills and reduced levels of public service.

To be sure, this approach can succeed in building hipster cordon sanitaire— a miniaturized but utterly derivative urban district — that can be shown to investors and visiting, and usually core-centric, journalists. It also can enrich speculators and those politicians who service them, but represents a marginally effective means of reviving the city, much less the regional, economy.

Instead of chasing hipsters , Cleveland urban strategist Richey Piiparinen suggests cities such as his rebuild their economies from the ground up, tapping the strong industrial skills, work ethic and resilient culture deeply embedded in the region. Large factories may not return en masse to Cleveland, Detroit or Chicago, but a strong industrial economy and a culture embracing hard work could stir growth in service-related fields as well.

Geography and location provide other opportunities . The area’s natural resources — the Great Lakes contain one-fifth of the world’s supply of fresh water — constitute a profound competitive advantage against drought stricken economies in the Inland West, the southern Great Plains and parts of the Southeast. Water is an essential element in many industrial processes, including fracking, a serious issue in parts of the Rust Belt. Miles of attractive coastline could be used to lure not only factories, but high-tech businesses, tourists and educated professionals who can choose their location.

The Great Lakes also are a natural conduit for the $250 billion trade with Canada, with its vast resource-based economy and growing population . Instead of funding better bars, art galleries and sports venues, or hoping to attract tourists and conventioneers to traipse to Cleveland in December, what the region really needs, noted a recent Brookings report, is better infrastructure, such as bridges, ports, freight rail and roads.

Critical too are the region’s strong engineering schools. Of the nation’s top 10, four — Carnegie Mellon, Purdue, the University of Michigan, and the University of Illinois at Champagne-Urbana — are located in the Rust Belt. The Great Lakes may not be home to the Ivy League, but it remains the nursery of practical applied intelligence.

Emerging demographic trends could also play a positive role. The millennial generation will soon be approaching the age when they wish to start businesses, get married, have children and buy homes. A good target would be those seeking a single-family home and a reasonable cost of living; both are increasingly difficult to attain in much of the Northeast and coastal California where the cost of housing, even adjusted to income, can be easily two to three times higher.

Indeed, despite decades of demographic stagnation, the region already boasts higher percentages of people under 15 than the Northwest, the Northeast (including New York) and has about the same percentage of kids as the rapidly growing Southeast. For a new generation, the Great Lakes could emerge as a destination, not a place to avoid.

This requires the region becoming more attractive to newcomers, whether from abroad or within the country. As urban analyst Aaron Renn suggests, the Great Lakes has to become more culturally open to outsiders and immigrants. Cities such as Cleveland, Chicago, and Detroit were once magnets for immigrants from Europe and people coming from America’s rural hinterlands, notably the south.

Restoring appeal to outsiders does not mean denying the region’s proud past, and throwing away its historic assets, but instead focusing on its core values. For many reasons — geography, weather, history — the region cannot remake itself into California, the Pacific Northwest or the Northeast Corridor. Instead the Great Lakes can best restore its legacy as an aspirational region by focusing on the very real things that constitute its historic DNA.

Joel Kotkin is executive editor of NewGeography.com and Distinguished Presidential Fellow in Urban Futures at Chapman University, and a member of the editorial board of the Orange County Register. He is author of The City: A Global History and The Next Hundred Million: America in 2050. His most recent study, The Rise of Postfamilialism, has been widely discussed and distributed internationally. He lives in Los Angeles, CA.

This piece originally appeared at Forbes.

Great Lakes map by BigStock.

South Korea, What Will Limit the World’s Global Underdog?

$
0
0

South Korea is a small country with grit. The shrimp sized peninsula is a national success story that transformed itself from impoverished conditions to industrial riches in a remarkable 68-year postwar period. The country experienced the fastest growth in per-capita GDP since the 1960. According to the World Bank, South Korea’s GDP per capita in 1960 was $155 and has risen to $22,424 today, which is greater than the national wealth of their Chinese neighbors.

Korea’s rise to world prominence did not come easily. The country rose to its ranks after being destroyed by a half-century of Japanese colonization and from the ashes of the divisive Korean War, which left its cities, including the capital, Seoul, in ruins. At war’s end GDP stood at less than $200 per capita, no natural resources, and a third of the population was homeless.  Today it is home to a number of Fortune Global 500 conglomerates, most notably, Samsung at no. 14, SK Holdings no. 57, POSCO no. 167, and Hyundai no. 206.

The country also took a tortuous path towards democracy, living under authoritarian and military-dominated regimes until 1945. Now it is not only a thriving, and often contentious democracy, but now boasts its first female president.   

But the question is: will South Korea’s miraculous rise to power give enough reason to believe that Korea is capable of global influence and expansion? For the most part, the answer – at least for the near future – is yes.

This trajectory will continue even though the country – known as the “shrimp among the whales” – lives next door not only to its unpredictable northern rival, but also in the same neighborhood as three world powers. Yet in qualitative terms it is increasingly out-performing their rivals and is one of the top tech capitals in the world.This place is literally wired for success: Number one in e-government and top five in the global gaming market, with the fastest and cheapest broadband connection on earth.

Due to the smallness of the domestic market – the country is home to only 48,955,203 people – Korean businesses need to operate on a global scale. Heavily dependent on international trade, the country, in 2011, ranked as the world's eighth largest exporter and ninth largest importer. An example of this is Samsung, the world’s largest smartphone maker. This will lead Korean firms to continue to invest heavily on a global basis.   

Perhaps the most impressive accomplishment can be seen in smart phones, an area that long-time electronics leader – and former colonial overlord – Japan has stumbled in. According to the Wall Street Journal, Strategy Analytics reported Samsung’s smartphone shipments grew to 69.4 million units in the quarter, giving it a market share of 33% – almost twice that of Apple.

Samsung’s growing cash reserves evidence its strength as a fierce competitor to Apple and questions Apple’s ability to return to its market leadership. Some commentators predict Apple will need to make price reductions or find an unforeseen market that does not compete. But its most recent blow in the American markets came after the ITC ban on the import and sale of some Samsung products into the U.S. This moment can be the saving grace for Apple but Samsung continues to gain market share and, unlike its Silicon Valley competitor, it is highly diversified as one of the world’s most sophisticated maker for processors, memory, and high-resolution screens.

But these accomplishments have had their downside. The hyper-connectivity has engendered a “digital addiction” among young children. Concerned of this has become so pronounced that Korea’s science and education ministries announced its policy package in June to “wean students off of their dependency” through boot camps.

Yet for now, the country’s positive trajectory seems assured. This is not just a matter of technology and manufacturing. The Korean entertainment industry  now ranks seventh in the world according to consulting firm PwC and is home to global stars like Psy of “Gangnam Style” and singer, Rain, whose influence in the music industry is unprecedented ranking him the most influential artist in TIME’s 100 list three years in a row. In the world of pop culture Korea tops the list among the Asian country competitors.  

Besides entertainment, Korea’s global footprint has been growing exponentially.  Korea’s direct foreign investment history in the U.S. increased steadily ever since the onset of South Korea’s financial crisis in 1997.   Korean investment in the U.S. has jumped from $15.7 billion in 2010 to $24.5 billion in 2012. In particular, Korea has been investing heavily in its East Asian neighbors. South Korean companies were the biggest investors in Indonesia with POSCO, the country’s leading steelmaker, topping it off with a $6 billion joint venture deal with Indonesian steelmaker Kraktau Steel.

Korean corporations also have been establishing new homes in the U.S. over the years. For example, Hyundai Motors has built its U.S. Headquarters in Fountain Valley in Orange County to “secure its long-term future in California,” as stated in its press release. The two-year and 500,000 square feet development has cost $200 million and is located visibly alongside the I-405 freeway. The project symbolizes economic growth in California and projects a positive outlook for the future of Hyundai as a rising automotive leader in the world. Hyundai’s move also makes Samsung’s plans to build its North American headquarters in San Jose no surprise. Another example is SK Planet, a South Korean Internet services giant, that is planning to invest anywhere from $500 million to $1 billion in the U.S. over the next few years.

South Korea also has been one of the top three Asian countries to participate in the “East looks West” trend in foreign property investments. In hunt for safe and affordable places to invest, South Korean firms and individual investment in U.S. real estate have surged in the past year. South Korea takes the second-lead after Singapore in investing the U.S. market. According to Real Capital Analytics, Singapore invested $1.87 billion, South Korea $1.83 billion, and China $1.52 billion for a combined total of $5.2 billion in commercial real estate in 2013 alone.  South Korea’s Mirae Asset Global Investments recently acquired Chicago’s West Wacker Drive building for $218 million. A group of South Korean investors also bought the Washington Harbour complex at the U.S. capital for $373 million in July.

Another noteworthy venture is the Korean Air’s plan to develop the tallest hotel skyscraper in the West at the site of the 1950s Wilshire Grand Hotel in downtown Los Angeles. Expected to be completed in 2017, the 73-story hotel is estimated to cost $1 billion. The skyscraper reinforces Korea’s determination to build its image as an aggressive, forward thinking investor.  

The leaders of the country have typically been supportive of their conglomerates but also recognize the downfalls in investing too much in a single business. South Korea’s Iron Lady, President Park Geun-hye, has promised to address the country’s major issues starting with the “economy’s excessive reliance on a small number of huge conglomerates”.  For instance, Seoul has offered $1 billion to small and mid-sized exporters in order to reach its targeted export growth of 4.1% in 2013. The South Korean government has also garnered free trade agreements in Europe, India, and reportedly help boost the U.S. auto industry.  

Yet like other Asian countries, Korea faces some large long-term challenges. It lacks the girth of China, or the EU, not to mention the resources and entrepreneurial system for the United States. Perhaps even more serious, the country now suffers among the lowest birthrates in the world. Although this may not yet be a critical problem, lack of production in this area could threaten the country’s long-term economic position.

Equally important, research has found that couples that do have children are born with health risks due to the extreme dense way of living. Since the 1970s, the population ballooned and the limited land for residential use led to the mass construction of high-rise apartments. The high density and aesthetically displeasing public spaces in the largest cities makes Korea an unattractive place for foreigners to live undermining it as a global country. For example, Seoul, the country’s capital, ranks highest in population density among OECD countries, a problem in terms of future fertility.

Development in the services industry will also become critical overtime because of the country’s heavy reliance in manufacturing. Korea does not outsource like its competitors, which has largely contributed to its wealth. But in order to be ranked as a premier nation, services will have to become a higher priority, meaning growth in its skilled work force. Korea lacks the managerial, administrative, and professional social capital that give U.S., Japan, U.K., and Germany their world status. According to Global Insight, 30% of the nation’s economy comes from manufacturing where as the U.S. and Japan have only 13% and 20% in manufacturing jobs, respectively, with a majority of their jobs in services.  

Despite its massive economy derived mainly from conglomerates and the wealthy few, Korea faces challenges in a number of areas: the diversity of its labor pool, new diplomatic strategies, declining demographics, lack of natural energy resources, and environmental sustainability. As they are keys to Korea’s continued success, the country’s long-term prominence falls into question.

Grace Kim is an undergraduate at Chapman University majoring in Business Administration and Communication Studies who is also the President of the Chapman Real Estate Association and Editor in Chief of Meta-communicate, the Communication department's undergraduate research journal.

Photo from Wiki Commons by user tylerdurden1.


Southern California's Road Back

$
0
0

If the prospects for the United States remain relatively bright – despite two failed administrations – how about Southern California? Once a region that epitomized our country's promise, the area still maintains enormous competitive advantages, if it ever gathers the wits to take advantage of them.

We are going to have to play catch-up. I have been doing regional rankings on such things as jobs, opportunities and family-friendliness for publications such as Forbes and the Daily Beast. In most of the surveys, Los Angeles-Orange County does very poorly, often even worse than much-maligned Riverside and San Bernardino. For example, in a list looking at “aspirational cities”– that is places to move to for better opportunities – L.A.-Orange County ranked dead last, scoring well below average in everything from unemployment to job creation, congestion and housing costs relative to incomes.

Yet, Southern California possesses unique advantages that include, but don't end at, our still-formidable climatic and scenic advantages. The region is home to the country's strongest ethnic economy, a still-potent industrial-technological complex and the largest culture industry in North America, if not the world.

In identifying these assets, we have to understand what we are not: Silicon Valley-San Francisco, or New York, where a relative cadre of the ultrarich, fueled by tech IPOs or Wall Street can sustain the local economy. Unlike the Bay Area, in particular, our economy must accommodate a much larger proportion of poorly educated people – almost a quarter of our adult population lacks a high school degree. This means our economy has to provide opportunities for a broader range of skills.

Nor are we a corporate center such as New York, Houston, Dallas or Chicago. We remain fundamentally a hub for small and ethnic businesses, home to a vast cadre of independent craftspeople and skilled workers, many of whom work for themselves. In fact, our region – L.A.-Orange and Riverside-San Bernardino – boasts the highest percentage of self-employed people of any major metropolitan area in the country, well ahead of the Bay Area, New York and Chicago.

Policy from Washington has not been favorable to this grass-roots economy. The “free money for the rich” policy of the Bernanke Federal Reserve has proven a huge boom to stock-jobbers and venture firms but has not done much to increase capital for small-scale firms. Yet it is to these small firms – dispersed, highly diverse and stubbornly individualistic – that remain our key long-term asset, and they need to become the primary focus on regional policy-makers.

Ethnic Networks

Immigration has slowed in recent years but the decades-long surge of migration, largely from Asia and Mexico, has transformed the area into one of the most diverse in the world. More to the point, Southern California has what one can call diversity in depth, that is, huge concentrations of key immigrant populations – Korean, Chinese, Mexican, Salvadoran, Filipino, Israeli, Russian – that are as large or larger than anywhere outside the respective homelands. Foreigners also account for many of our richest people, with five of 11 of L.A.'s wealthiest being born abroad.

These networks are critical in a place lacking a strong corporate presence. Our international connections come largely as the result of both the ethnic communities as well as our status as the largest port center in North America, which creates a market for everything from assembly of foreign-made parts to trade finance and real estate investment. Southern California may be a bit of a desert when it comes to big money-center banks, but it's home to scores of ethnic banks, mainly Korean and Chinese, but also those serving Israeli, Armenian and other groups.

For the immigrants, what appeals about Southern California is that we offer a diverse, and dispersed, array of single-family neighborhoods. Both national and local data finds immigrants increasingly flocking to suburbs. Places like the San Gabriel Valley's 626 area, Cerritos, Westminster, Garden Grove, Fullerton and, more recently, Irvine, have expanded the region's geography of ethnic enclaves.

These enclaves drive whole economies, such as Mexicans in the wholesale produce industry or the development of electronics assembly and other trade-related industry by migrants largely from Taiwan. Global ties are critical here. Korean-Americans started largely in ethnic middleman businesses, but have been moving upscale, as their children acquire education. They, in turn, have helped attract investment from South Korea's rising global corporations, including a new $200 million headquarters for Hyundai in Fountain Valley, as well as a $1 billion, 73-story new tower being built by Korean Air in downtown Los Angeles.

Tech Industrial Base

During the Cold War, Southern California sported one of the largest concentrations of scientists and engineers in the world. The end of the Cold War, at the beginning of the 1990s, severely reduced the region's technical workforce, a process further accelerated by the movement out of the region of such large aerospace firms as Lockheed and Northrop. The region has roughly 300,000 fewer manufacturing jobs than it had a decade ago, largely due to losses in aerospace as well as in the garment industry.

Yet, despite the decades-long erosion, Southern California still enjoys the largest engineering workforce – some 70,000 people – in the country. It also graduates the most new engineers, although the vast majority of them appear to leave for greener pastures. One looming problem: a paucity of venture capital, where the region lags behind not just the Bay Area, but also San Diego and New York. This can be seen in the relative dearth of high-profile start-ups, particularly in fields like social media, now dominated by the Bay Area.

But the process of recovery in Southern California does not require imitating Silicon Valley. Instead we need to leverage our existing talent base – and recent graduates – and focus on the region's traditional strength in the application of technology. A recent analysis of manufacturing by the economic modeling firm EMSI found strong growth in some very promising sectors, including the manufacturing of surgical and medical equipment, space vehicles and a wide array of food processing, an industry tied closely to the immigrant networks.

Cultural Complex

For most Americans, and even more so among foreigners, the image of Southern California is shaped by its cultural exports, not only in film and television but in fashion and design. This third sector epitomizes the uniqueness of the region, and provides an economic allure that can withstand both the generally poor business climate and the incentives offered by other regions.

After a period of some stagnation, Hollywood again is increasing employment. Roughly 130,000 people work in film-related industries in Los Angeles, which is now headed back to levels last seen a decade earlier but still well below the 146,000 jobs that existed in 1999.

At the same time, the sportswear and jeans business in Los Angeles, and the surfwear industry in Orange County, remain national leaders. Overall, the area's fashion industry has retained a skilled production base– over twice that of rival New York's – and has been aided, in part, by access to Hollywood, lower rents and labor costs than in New York.

Taken together, these sectors – ethnic business, sophisticated manufacturing and culture – could provide the basis for a renaissance in the local economy. The smaller firms in these fields, in particular, need a friendlier business climate, a more evolved skills-training program from local schools and a better-maintained infrastructure. More than anything, though, they require an understanding on the part of both government and business that their success remains the best means to reverse decades of relative decline.

Joel Kotkin is executive editor of NewGeography.com and Distinguished Presidential Fellow in Urban Futures at Chapman University, and a member of the editorial board of the Orange County Register. He is author of The City: A Global History and The Next Hundred Million: America in 2050. His most recent study, The Rise of Postfamilialism, has been widely discussed and distributed internationally. He lives in Los Angeles, CA.

This piece originally appeared at The Orange County Register.

Swedish Lessons for Obama

$
0
0

During his upcoming visit to Sweden, President Barack Obama will surely praise the nation’s combination of high living standard, few social problems, and high level of income equality. But he may be tempted to see the astonishing social and economic outcomes in Sweden and other Nordic countries have more to do with a unique culture amongst homogenous populations than simply the recipe of following social democratic policies.

Sweden long has been admired by US intellectuals, particularly amongst the left, for a long time. In 1976 Time Magazine described Sweden as a “country whose very name has become a synonym for a materialist paradise [...] No slums disfigure their cities, their air and water are largely pollution free... Neither ill‑health, unemployment nor old age pose the terror of financial hardship.” The praise has continued since then. Recently even Bruce Springsteen joined those in favor of the US adopting a Swedish style welfare state. The success of Nordic nations is often seen as the proof that large welfare states lead to good outcomes. Paul Krugman for example writes: “Every time I read someone talking about the ‘collapsing welfare states of Europe’, I have this urge to take that person on a forced walking tour of Stockholm.”

A walk through Sweden’s history however paints a more nuanced perspective than the one Krugman and other praise-givers might suggest. Around 1870 the previously poor country could begin its route to prosperity, thanks to comprehensive market reforms. Between 1870 and 1936, the start of the social democratic era, the country had the highest growth rate in the industrialised world. Between 1936 and 2008, a period when Sweden was mainly controlled by the Social Democrats, the growth rate was only ranked 18th out of 28 industrialised nations. Also, it is vital to remember that the social democrats were initially highly pragmatic. Small government policies continued until the social democrats radicalized in the late 1960s.

Sweden’s phenomenal growth can, besides business friendly policies, has much to do with the country’s unique history. Nordic countries were for a long period dominated by independent farmers who had great incentives to work hard in order to survive in the harsh and cold climate. The populations in these homogenous countries not only adapted very strong ethics relating to work and responsibility, but their culture also became characterized by social cohesion and high levels of trust.

Early welfare state institutions, not least a public school system open for all social classes that emphasized discipline and academic knowledge, indeed promoted social mobility. It is vital to realize that the high level of income equality for which Sweden is envied for developed when the nation had relatively small welfare state. The rise of high tax policies occurred after Sweden had already grown equal.

The cultural attributes that explain Nordic success work well also in the US, at least amongst the nation’s Nordic population. Today we can see that descendants of Scandinavians who live in the US (whose fore-fathers left well before the development of social democratic policies) have the highest levels of trust in the US. Americans of Swedish origin have the same poverty level as Swedes in their native country. The Americans however earn some 50 percent higher incomes than the latter.

The period for which Sweden has been most envied by the US left is the massive state expansion that occurred mainly during the period following the second world war, a period when the tax rate increased by almost one percentage point annually over three decades. In particular the left is fascinated by the “third way policies”, a mix between capitalism and socialism, which followed radicalization of previously pragmatic social democrats in the late 1960s. This period, characterized by massive state involvement and effective marginal tax rates of sometimes 100 percent, was however anything but successful. Previously Sweden had thrived due to birth of new entrepreneurial firms, a phenomenon that almost stopped in 1970 and did not again start until significant market reforms where introduced during the 1990s and early 2000s.

During recent decades the levels of economic liberty have again increased strongly in the Nordic countries (Norway, leaning on its oil-wealth, is somewhat slow to reform). The Nordic nations compensate for their high taxes and regulated labour markets by having introduced high levels of economic liberty in a wide range of other fields. Recently, even the taxes have been reformed. In 2000 total tax revenues in Sweden were over 51 percent of GDP. The level decreased somewhat during the following years of social democratic rule, to 48 percent in 2006. The current centre-right government has reduced them to 44 percent and is currently introducing new reductions of the tax burden.

Rather than expand their welfare states, Nordic nations are again returning to the free market roots that have served them so well historically. This is perhaps an important lesson for Obama, Springsteen and Krugman, to ponder. There are indeed many smart elements in the Swedish welfare state, and the welfare states of other Nordic countries, that deserve admiration. An example is how public child care has encouraged women’s entry into the labor market. Another is Danish flexicurity that combines public safety nets with a liberal labour market. A third is partial privatization of social security in Sweden. A fourth --- often ignored ---  is the country’s dedication to fiscal conservatism even under the Social Democrats.

There are also many areas in which some Nordic nations fail whilst others do significantly better. Norway continues to rely on systems with very generous public benefits, which deteriorate the work ethic. The other nations, which cannot rely on oil wealth, have learned their lesson and work towards strengthening incentives for work and entrepreneurship. Finland has kept a school system that is, thanks to academic discipline and knowledgeable teachers, able to educate well those who do not come from academic or middle-class families. Sadly, Swedish public schools, have, much like their US counterparts, moved towards progressive ideas and deterioration in teacher’s knowledge. The result is an inability to stimulate those who are not intrinsically motivated to learn to do so. Overall the Nordic nations also fail at integrating foreign-born, even those who come with higher education.  

There is simply much to learn from Nordic nations. They have experimented with everything from implementing Milton Friedman’s idea of vouchers in welfare to implementing gender quotas in corporate boards. But aside from benefitting from the unusually strong norms related to work, trust and cooperation, Nordic societies are no exception to the rules of politics and economics. The same policies that hinder growth in the US (high taxes, lack of infrastructure, failing school policies) limit societal success in Scandinavia, whilst steps to encourage innovation, entrepreneurship, and work are proven to work equally well in both sides of the Atlantic.  

Dr. Nima Sanandaji is a Swedish author of Kurdish-Iranian origin. He has written numerous books and reports about issues such as entrepreneurship, women's career opportunities, integration, and welfare. Nima is the author of reports "The Swedish Model Reassessed" for Finnish think-tank Libera and "The surprising ingredients of Swedish success” for the Institute of Economic Affairs. Currently he is working on a book about the unique economic and cultural success of both the Nordic nations and the “new Nordic” countries in the Baltics.

The Emerging Geography of Inequality

$
0
0

Since the 1970s there has been a well-documented and persistent increase in income inequality in the United States. As the country slowly emerges out of a deep recession, it is instructive to seek out the geographic variation by states in the degree of inequality and the variation in both median and mean incomes.

Data in this article are for households (basically IRS data), for 2009-2011. Median household income is considered the “typical” income of an area. The mean income is the aggregate income of all households in an area, divided by the number of households. This latter measure can be heavily influenced by high numbers of very affluent as well as poor households.


Inequality is a measure of how far the distribution of incomes differs from if all households had the same income.  The gini coefficient is the most popular measure of income inequality.  But for my maps I instead use a simple measure of the difference between the median and mean, divided by the median, or the percent by which the mean is higher (or lower) than the median. Values above .39 (the figure for the US as a whole) are considered quite high. It should be noted that areas of highest or lowest incomes are not necessarily very unequal, if mostly all are rich or all are poor. Rather it is the juxtaposition of poor and rich households in the same state or area that best demonstrates the true geography of inequality.

Median income is the best descriptive measure of the relative income of areas.  The state map is often reproduced and will not surprise the informed reader.  The highest median incomes, in descending order, are in Connecticut, New Jersey. Maryland, Alaska, Hawaii, Massachusetts, New Hampshire, Virginia and California, all over $60,000.  All but the far western AK, HI, and CA are parts of Megalopolis (minus the NY and PA core!).  The next “richest” (over $55,000) are selected northern and western states with large metropolitan populations: Washington, DC;  Delaware; Washington; Minnesota; Colorado; Utah; Nevada; Illinois; and New York.   


States with median incomes from $50,000 to $55,000 are the ”typical” US set ( the US median income  is $51,914) and include Arizona, Pennsylvania, Rhode Island, Vermont, Wisconsin and Wyoming – but no state from the Old Confederacy outside Virginia. The 16 states with median incomes between $45,000 and $50,000 include the remaining big metropolitan states of the northeast, Indiana, Michigan, Missouri, Ohio, some more agricultural states in the Midwest, such as Iowa, Nebraska, North and South Dakota,  and the most sophisticated, metropolitan southern states , Georgia, Texas, Florida and North Carolina.

Lower down on the income totem pole are six southern states, including Kentucky, South Carolina, Oklahoma, Alabama, Tennessee and Louisiana, and two western states, Montana and New Mexico, with median incomes between $40,000 and $45,000. Three states, Arkansas, Mississippi, and West Virginia, are at the bottom with median incomes under $40,000.  These states lack large urban areas, and in the case of Arkansas and Mississippi, retain a large and mostly poor African-American population.

Inequality

With the exception of New York, and its spillover to Connecticut, the northern part of the country has much lower inequality than the southern half, presumably because of a less severe racial and ethnic history, but also because of the differential history of unionization and welfare measures between north and south. The most egalitarian states are also in the North, establishing a band of lower inequality from Wisconsin through Iowa, Nebraska, Wyoming to Utah, northern New England (Maine, Vermont and New Hampshire), as well as the newest states, Hawaii, and Alaska.

Then these are abutted by the relatively more equal states (in yellow) across the northern tier from Oregon and Washington to Indiana, Ohio, West Virginia, Maryland, and Delaware. There may be several historic  reasons for this greater degree of equality ranging from relatively low percentages of  poorer minorities such as African-Americans and Latinos; the presence of large Scandinavian and German descendants who have a historic attachment to egalitarian notions; and in some states, the strong influence of private sector unions.

The middle set of states, orange on the map, sort of take a middle position geographically too, comprising in the east the highly urbanized  states of Massachusetts, New Jersey, Pennsylvania and Virginia, the Mid-America  trio of Missouri, Illinois and Kentucky,  and then the western redoubts of Colorado, Arizona, and New Mexico, affected by Hispanic and American Indian populations.  I can’t say why South Carolina is more equal (slightly) than any other state in the deeper South.  

The states in green with higher inequality are a contiguous set across the traditional South, a region united by a difficult history of race relations and underdevelopment, as well as hostility to unions and public intervention on economic issues. The exception to the rule, Connecticut is due to its proximity to New York, bringing exceptionally wealthy households, overcoming otherwise more egalitarian institutions.

Only four states, New York, California, Texas, and  Florida, plus Washington, DC have inequality above the national average of .39, indicating both their very large populations, their very complex ethnicity, and large metropolitan economies rich in high income earners, entrenched concentrations of poverty, and high levels of immigration. Surprisingly, these states are even more unequal than the poorest states with the most difficult racial history and delayed development: Mississippi, Alabama, Arkansas, and Louisiana.

Poverty

How does the level of poverty relate to income levels and the geography of inequality?  Consider first these simple correlations: Median income and poverty, -.62, mean income and poverty, -.44, and poverty and inequality, .57.  These relations reflect the complex patterns of income, inequality, and poverty across the states. While richer states tend to have lower levels of poverty, the weaker relation with mean rather than with median income reflects the fact that some richer states, especially New York and California, have moderately high poverty, which in turn is related to their high degree of inequality.  The moderate positive correlation of poverty and inequality is most evident in the giant states of New York, California, Texas and. Florida (and Washington DC) as well as in the deep south states of Louisiana, Mississippi, Alabama, and Georgia. In contrast there is relatively low rates of both poverty and  inequality in the same northern tier (Plains, Midwest, and Mountain) states of Wisconsin, Minnesota, Iowa, Nebraska, Wyoming, and Utah, plus the northern New England states of Vermont and New Hampshire.


The geography of poverty, even more than that of inequality is reflective in large part of the deep and abiding income and education divide between whites and Asians versus Blacks and Hispanics. But the poverty of West Virginia and perhaps of Kentucky, and even Tennessee and Indiana also reflects an    alternative Appalachian history of settlement and culture that is largely white. At the opposite end the low poverty of Maryland, despite a high minority population, perhaps reflects the importance of federal employment.

Conclusion

For an old Roosevelt Democrat, the persistence of widespread poverty and deepening inequality, even while the extremely rich capture ever higher shares of income and wealth, is outrageous. It brings the United States back to the degree of inequality last recorded in 1929. It is ironic that the lowest degree of inequality in American history was 39 years ago in 1974, during a Republican administration, and fifty years after the great March on Washington.  These new maps are not pretty, and sadly there is little prospect for improvement.

Richard Morrill is Professor Emeritus of Geography and Environmental Studies, University of Washington. His research interests include: political geography (voting behavior, redistricting, local governance), population/demography/settlement/migration, urban geography and planning, urban transportation (i.e., old fashioned generalist).

A Map Of America's Future: Where Growth Will Be Over The Next Decade

$
0
0

The world’s biggest and most dynamic economy derives its strength and resilience from its geographic diversity. Economically, at least, America is not a single country. It is a collection of seven nations and three quasi-independent city-states, each with its own tastes, proclivities, resources and problems. These nations compete with one another – the Great Lakes loses factories to the Southeast, and talent flees the brutal winters and high taxes of the city-state New York for gentler climes – but, more important, they develop synergies, albeit unintentionally. Wealth generated in the humid South or icy northern plains benefits the rest of the country; energy flows from the Dakotas and the Third Coast of Texas and Louisiana; and even as people leave the Northeast, the brightest American children, as well as those of other nations, continue to migrate to this great education mecca.

The idea isn’t a new one – the author Joel Garreau first proposed a North America of “nine nations” 32 years ago – but it’s never been more relevant than it is today, as America’s semi-autonomous economic states continue to compete, cooperate … and thrive. Click on the thumbnail of our map to see our predictions for the job, population and GDP growth of these 10 regional blocks over the next decade, and read on below for more context.

View the map graphic at Forbes.com.


INLAND WEST

The Inland West extends from the foothills of the Rockies to the coastal ranges that shelter the Pacific Coast. This is the West as we understand it historically, a land of spectacular scenery: icecaps and dry lands, sagebrush, high deserts and Alpine forests. From 2003 to 2013, it enjoyed the most rapid population growth in the nation: 21%. It is expected to continue to outgrow the rest of the country over the next decade, as the area boasts the highest percentage of young people under 20 in the U.S.

Much of this growth was driven by a combination of quality of life factors — access to the outdoors and relatively low housing prices — as well as strong economic fundamentals. Over the past decade the area has enjoyed nearly 8% job growth, the strongest in the country, with the highest rate of STEM growth in the nation over the past decade.  Boise, Denver and Salt Lake City have posted stellar employment growth due to the energy boom and growth in technology. The western reaches of the region — the inland parts of Washington, Oregon and California — have not done as well. These areas suffer from being “red” resource- and manufacturing-oriented economies within highly regulated, high-tax “blue states.”

THE LEFT COAST

The Northeast may still see itself as the nation’s intellectual and cultural center, but it is steadily losing that title to the Left Coast. This region sports a unique coastal terroir, with moderate temperatures, though it may be a bit rainy in the north. The climate requires less power than elsewhere in the country for heating and air-conditioning, making its residents’ predilection for green energy more feasible.

Over the past 20 years, the Left Coast — the least populous nation with some 18 million people — has rocketed ahead of the Northeast as a high-tech center. It has by far the highest percentage of workers in STEM professions — more than 50% above the national average — and the largest share of engineers in its workforce as well. No place on the planet can boast so many top-line tech firms: Amazon and Microsoft in the Seattle area, and in the Bay Area, Intel, Apple, Facebook and Google, among others.

Over the next decade, the Left Coast should maintain its momentum, but ultimately it faces a Northeast-like future, with a slowing rate of population growth. High housing prices, particularly in the Bay Area, are transforming it into something of a gated community, largely out of reach to new middle-class families. The density-centric land use policies that have helped drive up Bay Area prices are also increasingly evident in places like Portland and Seattle. The Left Coast has the smallest percentage of residents under 5 outside the Great Lakes and the Northeast, suggesting that a “demographic winter” may arrive there sooner than some might suspect.

CITY-STATE LOS ANGELES

Once called “an island on the land,” southern California remains distinct from everywhere else in the country. Long a lure for migrants, it has slipped in recent decades, losing not only population to other areas but whole industries and major corporations. The once-youthful area is also experiencing among the most rapid declines in its under-15 population in the nation. Yet it retains America’s top port, the lion’s share of the entertainment business, the largest garment district–and the best climate in North America.

THE GREAT PLAINS

The vast region from Texas to Montana has often been written off as “flyover country.” But in the past decade, no nation in America has displayed greater economic dynamism. Since the recession, it has posted the second-fastest job growth rate in the U.S., after the Inland West, and last year it led the country in employment growth. The Dakotas, Nebraska, Oklahoma and Kansas all regularly register among the lowest unemployment rates in the country.

The good times on the Plains are largely due to the new energy boom, which has been driven by a series of major shale finds: the Bakken formation in North Dakota, as well as the Barnett and Permian in Texas. The region’s agricultural sector has also benefited from soaring demand in developing countries.

Most remarkable of all has been the Plains’ demographic revival. The region enjoyed a 14% increase in population over the past 10 years, a rate 40% above the national average, and is expected to expand a further 6% by 2023, more than twice the projected growth rate in the Northeast. This is partly due to its attractiveness to families — the low-cost region has a higher percentage of residents under 5 than any other beside the Inland West.

But outside of the oil boom towns, don’t expect a revival of the small communities that dot much of the region. The new Great Plains is increasingly urbanized, with an archipelago of vibrant, growing cities from Dallas and Oklahoma City to Omaha, Sioux Falls and Fargo.

Its major challenges: accommodating an increasingly diverse population and maintaining adequate water supplies, particularly for the Southern Plains. The strong pro-growth spirit in the region, its wealth in natural resources and a high level of education, particularly in the northern tier, suggest that the Plains will play a far more important role in the future than anyone might have thought a decade ago.

THE THIRD COAST

Once a sleepy, semitropical backwater, the Third Coast, which stretches along the Gulf of Mexico from south Texas to western Florida, has come out of the recession stronger than virtually any other region. Since 2001, its job base has expanded 7%, and it is projected to grow another 18% the coming decade.

The energy industry and burgeoning trade with Latin America are powering the Third Coast, combined with a relatively low cost, business-friendly climate. By 2023 its capital–Houston–will be widely acknowledged as America’s next great global city. Many other cities across the Gulf, including New Orleans and Corpus Christi, are also major energy hubs. The Third Coast has a concentration of energy jobs five times the national rate, and those jobs have an average annual salary of $100,000, according to EMSI.

As the area gets wealthier, The Third Coast’s economy will continue to diversify. Houston, which is now the country’s most racially and ethnically diverse metro area, according to a recent Rice study, is home to the world’s largest medical center and has dethroned New York City as the nation’s leading exporter. Mobile, Ala., seems poised to become an industrial center and locus for trade with Latin America, and New Orleans has made a dramatic comeback as a cultural and business destination since Katrina.

THE GREAT LAKES

The nation’s industrial heartland hemorrhaged roughly a million manufacturing jobs over the past 10 years, making it the only one of our seven nations to lose jobs overall during that period. But the prognosis is not as bleak as some believe.

Employment is growing again thanks to a mild renaissance in manufacturing, paced by an improving auto industry and a shale boom in parts of Ohio. The region has many underappreciated assets, such as the largest number of engineers in the nation, ample supplies of fresh water and some of the nation’s best public universities. With fifty-eight million people, it boasts an economy on a par with that of France.

Yet we cannot expect much future population growth in the Great Lakes, the second most populous American nation. Its population is aging rapidly, and the percentage under 5 is almost as low as the Northeast.

THE GREAT NORTHEAST

The Northeast–which excludes the city-state of New York–has been the country’s brain center since before the American Revolution. This region is home to some 41 million people, and leads the nation in the percentage of workers engaged in business services, as well as in jobs that require a college education. With average wages of $76,000, $19,000 above the national average, the area boasts a GDP of $2.2 trillion, about equal to that of Brazil.

The Northeast is one of the country’s whitest regions — Anglos account for over 70% of the population — and one of the wealthiest. In many ways, it resembles aging Western Europe in its demographic profile. The Northeast is the most child-free region outside the retirement hub of south Florida. Coupled with sustained domestic out-migration, its population growth is likely to be among the slowest in the nation in the decade ahead.

Good thing its residents are highly educated — diminishing numbers and the consequent decline in political power suggest that the Northeast may need to depend more on its wits in decade ahead.

CITY-STATE NEW YORK

The Big Apple’s much heralded comeback has assured its place as one of the world’s great global cities. But the city faces challenges in terms of soaring indebtedness, rapid aging, a weak technical workforce, expensive housing and high taxes. It also will struggle with competition from rising cities of the other nations such as San Francisco, Seattle, Washington, D.C., and Houston, each of which threatens New York’s traditional role in key sectors of the economy.

THE SOUTHEAST MANUFACTURING BELT

At the time of the Civil War the southeastern United States was both outpeopled and outmanufactured. Today the Southeast, is the largest region in terms of population (60 million) and is establishing itself as the country’s second industrial hub, after the Great Lakes.

It is attracting large-scale investment from manufacturers from Germany, Japan, and South Korea. Although most of the region still lags in educational attainment, the education gap with the Northeast and Great Lakes is slowly shrinking. The population holding college degrees has been expanding strongly in Nashville, Raleigh, Birmingham, Richmond and Charlotte.

More babies and the migration of families, including immigrants, to this low-cost region suggest an even larger political footprint for the Southeast in the decades ahead. Population growth has been more than twice as fast since 2001 as in the Northeast, a trend that is projected continue in the next decade. The region looks set to become smarter, more urban and cosmopolitan, and perhaps a bit less conservative.

CITY-STATE MIAMI

Greater Miami often seems more the capital of Latin America than it does an American region. Its population is heavily Hispanic, and trade, finance, construction and tourism tend to focus southward. But Miami faces the constraints of an aging, and largely childless, population–which means it will continue to rely on newcomers both from abroad and from the colder regions of the U.S.

This story appears in the September 23, 2013 issue of Forbes.

Joel Kotkin is executive editor of NewGeography.com and Distinguished Presidential Fellow in Urban Futures at Chapman University, and a member of the editorial board of the Orange County Register. He is author of The City: A Global History and The Next Hundred Million: America in 2050. His most recent study, The Rise of Postfamilialism, has been widely discussed and distributed internationally. He lives in Los Angeles, CA.

Mark Schill is Vice President of Research at Praxis Strategy Group, an economic development and research firm working with communities and states to improve their economies.

Suburb Hating is Anti-Child

$
0
0

Sure, suburbs have big problems. Their designs force their inhabitants to drive in cars, instead of walking and bicycling. This diminishes face-to-face interactions, physical health, and the quality of the environment. Aesthetically, many of them, particularly those dreaded “planned communities,” are quite boring. People who live there tend not to have much contact with people who aren’t like them, so suburbs reinforce racial, religious, and class segregation.

A large proportion of intellectuals and politicians, including President Obama, decry these problems with suburbs as reason to hate them and advocate for their elimination, in favor of dense, big cities.

Yeah, I get it. I agree that all these problems exist, and they bother me a lot.

There’s just one big problem with suburb hating. The alternative to suburbs in metropolitan areas, cities, are much worse for children. Sure, adults can have a great time in hip, dense city centers like Manhattan or San Francisco. In fact, if my wife and I never had kids, we’d still be living in San Francisco, going out practically every night.

However, it’s clear that cities are worse for kids than suburbs.

Why do I say this?

First, just look at where newly married urbanites choose to live once they have children. They leave cities in droves. The hipper and denser the city, the more likely are parents to flee to the suburbs.

20-29_table

Richard Florida made his name over a decade ago writing about how cities should attract the “creative class” – a code name for childless urban hipsters. In his book, Who’s Your City?: How the Creative Economy Is Making Where to Live the Most Important Decision of Your Life, he lists cities he thinks are best for different groups of people. The table here shows the percentage of total population in the United States that is school-aged children (age 5-17) versus that for large cities that Florida lists as best for 20-29 year-olds.

The only two cities that are even close to the national average of 17.5% are Los Angeles and New York. Los Angeles covers an awful lot of land area, and I suspect that if I could get data for what Florida really means by “Los Angeles,” the percentage would be much lower.

NYC_boroughs

New York is also quite large and diverse, but there, fortunately, I have data for what Florida really means by “New York.” I’m sure he’s thinking of Manhattan when he thinks of “creative class.” There, as you can see on the table here, Manhattan’s percentage of the population that is school-aged is 11.8%, far below the national average.

In her suburb-hating book, The End of the Suburbs: Where the American Dream Is Moving, Leigh Gallagher gushes that Manhattan “has become overloaded with families.” To back up this assertion, she points to US Census data that there were 2,600 more married families with children 0-18 in 2010 than in 2000. Actually, that’s unimpressive for two reasons. First, the census data show that Manhattan’s total population actually increased by more than the population of children, so children as a percentage of the total population actually dropped. Second, even if the percentage of children had increased, the 11.8% figure for school-aged children is horrifically low.

The New York Times contributed to this gushing sentiment for children in Manhattan in a 2005 article. It pointed to a small surge in children under 5 in Manhattan’ census data between 2000 and 2004. Unfortunately, this trend did not extend to school-aged kids.

This disparity hints at the major reason why families leave big cities: public schools in large cities are, by and large, awful. So, for the most part, families that have the means to move out of cities when their children reach school age flee to the ‘burbs. Most middle and upper-middle class families that do stay send their children to private schools. 30% of San Francisco children go to private schools, and my guess is that the figure for Manhattan and other dense, hip urban centers is close to that.

So, to some extent, when you hear people complain that cities are too expensive for families, they are calculating private school into the cost of living there.

But private schools not only cost a lot of money. They also destroy neighborhood life for children. In big city neighborhoods where many or most children go to private schools, children who live on the same street hardly know each other because they tend to go to different schools that their parents choose.

Beyond running bad schools that force families with the means to go to private school, some big city school systems put the final dagger into neighborhoods by forcing or enticing children to go to a school outside their neighborhoods.

For example, San Francisco has done this for decades in an effort to forcibly integrate students of different races and backgrounds, but instead, what it’s done is destroy neighborhoods and push more families into private schools than any other city in America. In the last year or two, that city has made a small change in its policy in an apparent effort to make it more possible for children to go to school in their own neighborhood, but this change hasn’t gone nearly far enough to pull neighborhoods together.

So, big cities are left with neighborhoods where children spray out to all parts of the city to go to school every day. When school’s over at the end of the day, playing in their neighborhoods isn’t an option because children there don’t know one another.

The families that do flee for the suburbs leave a diverse place where parents like them have a small amount of political power and huge teachers’ unions dominate, to a more homogeneous place where most residents are like them, in terms of socio-economic status, and parents wield great power over schools. Left behind are the less fortunate kids, with their families.

The other primary problem that families have with cities is space. Yes, while it’s trendy these days for urban planners to advocate for dense development, families with children flee from density. Every large city in the United States that has high density – including those in the Richard Florida list above and other dense cities like Miami and Philadelphia – have very low percentages of school-aged children.

To put it simply, play requires space. If all kids have outside their crowded apartment building is a sidewalk, they can’t play a game of soccer, nor can they play even less formal games like hide and seek or tag. Also, sidewalks are a lot less complex, and therefore they’re a lot more boring for kids, than yards that have grass and bushes with hiding spaces.

As Richard Louv writes so eloquently in his book Last Child in the Woods, children really do love being in nature. They’re drawn to play among trees, bushes, grass, and creeks rather than sidewalks and brick walls.

Those who tout the attractiveness of city life for children always cite the importance of public parks. Parks are great for families that live right next to them, but unfortunately, we’re never going to put a park in every other block. The fact is that children don’t roam very far on their own these days. In fact, most preteen children don’t roam on their own more than a few feet from their front doors, whether those front doors are to their single family homes or to their apartment buildings. So, parks are of very limited use, even to most city dwellers. While kids and caregivers go there together, kids hardly every go there on their own to play freely.

Clearly, children can get a great deal of value from a yard outside a single family home, which is one important reason why so many families aim to move to the suburbs. Yes, most families don’t exploit their yards nearly enough once they move there, but that’s a problem with how families live in suburbs. It’s not a blanket condemnation of suburbs.

So, we need to fix suburbs and the way families utilize them. They should be far more pedestrian friendly, and not favor cars so much. Residential yards should be used as social hangouts, not merely admired from afar for their manicured shrubs and flower beds. I’ve written a great deal about these fixes on my blog and in my book Playborhood.

But what we shouldn’t do is try to force families to live in dense city centers. Most families don’t like it there, with good reason.

Suburb hating hurts children. Politicians who advocate anti-suburb policies are hurting children. They are, dare I say, anti-child.

Mike Lanza is author of the parenting book Playborhood: Turn Your Neighborhood Into a Place For Play, and blogs at Playborhood.com.

Suburbs photo by Bigstock.

History, Landscape, Beauty on the American Freeway

$
0
0

Freeways, particularly urban freeways, have had a bad press for several decades now.  They are accused of despoiling scenery, destroying habitat and causing urban sprawl.  Many observers report with glee on the latest news of a small segment of urban freeway being dismantled.

This blanket condemnation makes it easy to overlook the remarkable contribution that these freeways have made to the American economy and to American culture.  It is hard to imagine the growth in productivity in the country during the postwar years without these roads, which vastly increased the mobility of goods and people and connected parts of the country together in ways that were unprecedented.

The constant criticism also makes it difficult to appreciate these roads as cultural artifacts and a wonderful way to see the country.  This is all the more surprising since Americans in recent years have been discovering the rich legacy of our nation’s highways. There has been spate of books that celebrate travel on America’s pre-freeway-era highways. Many authors wax eloquent over the remaining motels, fast food restaurants and drive in theatres along US 66 or advise motorists on finding abandoned segments of roadway by passed by later highway alignments.   There has also been a remarkable surge of interest in America’s parkways, from the earliest parkways like the Bronx River Parkway in Westchester County New York, started in 1907, to parkways at the end of the parkway era in the years immediately before and after World War II when they gradually became more like freeways, for example the Arroyo Seco Parkway in Los Angeles, or the later segments of Lake Shore Drive in Chicago, the Taconic Parkway in New York State or the George Washington Parkway outside Washington.   

America’s postwar freeways merit a similar rediscovery.   I think that one of the biggest obstacles to appreciating them has been a question of scale.  Driving along a two-lane roadway it is possible to pull off the pavement and look at an historic courthouse or a particularly interesting agricultural landscape or early gasoline station. That is not possible on a freeway. It is also true that the engineers who designed the nation’s postwar freeways were probably less conscious of the aesthetic dimensions of the roadways than the designers of the German autobahn, who set a standard for integration of landscape and roadway  never surpassed, or American designers like landscape architect Gilmore Clarke who played important role in designing the parkways of metropolitan New York.   There is, moreover, no doubt that the push to accommodate increasing traffic loads and to make freeways safer in this country has led to a certain uniformity of standards that some people find boring.  Finally, the proliferation of sound walls over the last few decades all too often makes driving through urban areas like driving through a tunnel. 

Still, there is no better way to get a good view of the larger features of the American landscape or cityscape than looking through the windshield of an automobile rolling along a freeway at 65 miles per hour. At that speed it is often easier than on a slower road to appreciate the changes that occur in plant species as the highway climbs a steep ridge or to appreciate the way massive cuts to lower the grades on the climb over a hill that provide a graphic illustration of the underlying geology.  It might be difficult for many people to appreciate long stretches of flat country but, if a driver can put herself into the proper frame of mind, this experience can have its own rewards because of the way it accentuates the scale of the landscape. Even the billboards, which many drivers consider simply objectionable intrusions into the natural landscape, can, by their style and content, illustrate a great many regional differences.

And fortunately, there has been over the last two decades a growing recognition of the aesthetic dimensions of freeways.   In some ways this marks a reversion to ideas that were common in the parkway era when there was almost always a conscious attempt to integrate road and landscape into a successful composition reflecting  the landscape and culture of the region through which it passed. 

A pioneer postwar example of this push to bring conscious aesthetic design to the freeway can be seen in I-280, the Junipero Serra freeway, which runs between San Francisco and San Jose.  Here the engineers worked with Lawrence Halprin, the landscape architect, and architect Mario Ciampi to create a road that was widely considered the “most beautiful freeway in the world” when the initial segment was opened in the 1960s.  This highway, with its careful alignment, minimizing cut and fill, and the bold, sculptural concrete overpasses does little to diminish the spectacular landscape of the San Francisco Peninsula.  In fact it affords a wonderful way to experience the golden hills on one side of the roadway and the coastal range on the other, often seen in the morning or late afternoon with fog pouring over the crest.

In recent years the highway departments in an increasing number of American states have attempted to be more attuned to the aesthetic dimensions of freeways and of the places through which the roads run.   Wildflowers now bloom in medians and margins of a great many American freeways.   In arid landscapes engineers and landscape architects have worked to preserve native plants and use them as elements in a kind of idealized desert landscape in the median and along the berms.    In one of the most impressive achievements, a twelve mile stretch of I-70 passing through the tortuously narrow Glenwood Canyon west of Denver, opened in 1992, the designers went to great length to fit the roadway into the landscape in the least obtrusive way possible.  They accomplished this by splitting the roadway alignments, reducing the section of the roadway structure to a minimum, cantilevering both alignments from the canyon walls to reduce their bulk, pushing tunnels through the most difficult spurs of land and even treating the rocks that were scarred by excavation so they would not produce jarring juxtapositions.

Even the urban freeway, target of the most vociferous criticism, offers interesting perspectives for those willing to look.  Unlike the case in much of Europe, where planners have often attempted to create a parkway-like driving experience by providing a wide buffer between the roadway and nearby urban areas and tightly restricting new development along the highways, American freeways have become the new main streets of many cities.  Driving along the ring roads around American’s large cities can offer some of the most compelling views of these metropolitan areas. For the motorist driving along I-80, the Ohio Turnpike, there is the view from the giant viaduct crossing the Cuyahoga River.  There, 20 miles to the north, up the heavily wooded deep gash created by the river, the gleaming tip of the Key Bank Building peaks out  above the intervening ridges in clear weather, unfortunately all too rare in Northeast Ohio.  Likewise, very few urban views can compare with the panorama that suddenly unfolds for motorists as, emerging from I-376’s Fort Pitt Tunnel under Mount Washington, they suddenly burst out onto a bridge over the Monongahela River and a view of the Golden Triangle and the entire skyline of Pittsburgh. 

A drive along a city’s freeways is often the best way to get a good grasp of a region’s economic geography.   It would be hard to miss the contrast between the view from the Indiana Toll Road across the grimy industrial landscape of steel mills and refineries just east of Chicago, on the one hand, with the landscape of heavily planted berms and expensive new houses along the Tri-State Expressway in the north suburbs.

Many of the earliest freeways have crossed the 50 year threshold and deserve a closer look as some of the country’s most important historical and cultural artifacts.  And they provide a wonderful way to observe America’s landscape and cityscape.


Taconic State Parkway north of New York City.  The New York area had the first and largest set of parkways in the nation.  The Taconic, running along the Taconic Mountains from the Kensico Dam in Westchester County to Chatham near Albany, was not finished until 1960, but it maintains the earlier parkway standards rather than those of the later freeway era.   Because of its careful alignment and roadway design by landscape architect Gilmore Clarke and the beauty of the rugged countryside which it runs, it remains one of the country’s great driving experiences.


I-280, Junipero Serra freeway, south of San Francisco.  Although a much wider highway than the prewar parkways, this road, constructed in the 1960s, maintains much of the feel of the earlier parkways though the use of alignments carefully fitted into the rolling hills, integrating the road beautifully into the spectacular landscape of the San Francisco peninsula.    


I-20 east of Birmingham Alabama.  The undulating line that marks the edge of the pine forest and the beginning of the mowed grass in the freeway margins recalls the long curving vistas of English 18th century picturesque landscape tradition. On an overcast morning the resemblance to the British landscape tradition is particularly striking.


I-10 and I-215 at Colton, California.   No place in the United States is so associated with freeways as the Los Angeles region, but actually this region has fewer lane miles of freeway than most large American metropolitan areas.  Because freeway construction pretty much stopped in the 1970s but the population continued to grow and the density rose, this region has some of the most congested roads in the country.  If there is any consolation, they offer some remarkable displays of engineering bravado and urban intensity.


I-70 west of Denver, Colorado.  The construction of this roadway through the Glenwood Canyon in the Rockies is both an engineering feat and an aesthetic tour de force.  By separating the alignments and cantilevering the roadway from the canyon wall, the designers were able to minimize the visual impact of the road and provide spectacular vistas for travelers.


US 75 approaching downtown Dallas.  This short piece of roadway completes a loop around downtown Dallas that allows two interstate roads to bypass downtown.  A drive around the loop provides a kaleidoscopic sequence of views of tall buildings and a highly effective orientation to downtown Dallas.


I-10 east of Blythe Arizona.  Perhaps even more than in the East, the great distances of the American West make the freeway a lifeline for residents who live far from population centers.  The smooth roadway makes a striking contrast with the great rock outcrops and vast stretches of scrubland.


I-80 and I-94 Pennsylvania Turnpike north of Pittsburgh.  The era of the parkway ended at about the time of the second world war as a new generation of freeways started to emerge.  One of the interesting features of the interstate system today is the way it provides testimony to the shifting ideals of roadway design.  Although large stretches of the Pennsylvania turnpike, whose initial segment opened in 1940, have been upgraded, the narrow right of ways and steep gradients of the older portions of the road as well as the streamlined design of the overpasses recall the transition from one age to the next.


I-20 between Covington and Augusta Georgia.  A classic piece of interstate road with the smooth ribbon of pavement gliding effortlessly through a landscape of low hills and dense forest.


I-10 west of downtown Phoenix.  The state of Arizona has been particularly active in trying to create an appropriate landscape for the state’s highways.   They have pioneered techniques for saving cacti and other native species in the path of the roadway and then re-installing them alongside the new roads to create an idealized desert landscape.


I-10 approaching downtown Los Angeles, California.  The advent of sound walls has changed the driving experience in some profound ways.  In places it has severed the visual connection between the roadway and the city around it.  On the other hand, in some places, as here, when vines and other plants grow up over the walls and trees overtop them, the result is a curious but not entirely unpleasant sensation of floating through a city without being part of it.  Until the traffic backs up, of course.


I-27 between Amarillo and Lubbock, Texas.  The long flat stretches of the Llano Estacado of northwest Texas produce an almost hypnotic effect.  Even highway signs and telephone poles take on a monumental character, and train elevators loom up in the distance like the skyline of a great city.


I-70 in eastern Utah.   Although freeways can seem intrusive and over-scaled in the city, they are often dwarfed by the huge open spaces in states like Utah or Nevada.


I-5 south of Longview, Washington.   A trip across the country on the interstate roadway system allows for a panoramic view of the regional differences between, for example, the flat, semi-tropical landscape of central Florida and the deep green evergreen forests of the Pacific Northwest.


State route 99, the Alaskan Way Viaduct, downtown Seattle.   Completed in 1953, this roadway, this roadway like a number of freeways built in the heart of American cities, created a barrier in the city.  Some of these highways, for example the Central Artery in Boston have been relocated underground. In other cases, like the Embarcadero Freeway in San Francisco the replacement was a surface boulevard.  In this case, after a considerable debate, officials made the decision to create a massive tunnel.  It is difficult to argue that a road like this should be preserved, given its structural problems and the way it cuts off Seattle from its waterfront.  Still, it is almost inevitable that some of the drivers navigating the new tunnel will keenly miss the spectacular urban spectacle that unfolds today as they sweep along the viaduct.

Robert Bruegmann is professor emeritus of Art history, Architecture and Urban Planning at the University of Illinois at Chicago.

Americans' Family Feud

$
0
0

In this bizarrely politicized environment, even the preservation of the most basic institution of society – the family – is morphing into a divisive partisan issue. Increasingly, the two parties are divided not only along lines of economic and social philosophy, but over the primacy of traditional familialism.

Increasingly, large portions of the progressive community are indifferent or hostile to the idea of the nuclear family, while many on the right argue that it's key to a Republican revival. Observers such as the Weekly Standard's Jonathan Last see familialism as key to the demographically challenged GOP. “Start a family, vote Republican,” he suggests. Long-term, Republicans can look forward to the rise of what New York Times columnist David Brooks cleverly calls “red diaper babies.”

In the long term, the logic seems impeccable. Salt Lake City is creating a new generation of what may tend to be more conservative voters; when San Francisco's largely single and childless populace passes, their legacy ends with them – game over. Indeed virtually all areas of the country with the fastest projected growth in households are located in red states. Houston, Atlanta and Dallas are expected to add more households than true-blue New York City, Los Angeles or Chicago. New York, California and Illinois are losing children as a share of population, while deep-red Texas, Utah, Idaho, as well as Nevada, have increased their tyke population.

Others on the right take a more racially oriented tack. Linking lower fertility rates, particularly among Caucasians, Pat Buchanan warns of “the end of white America.” Steven Sailer, a staunchly anti-immigrant conservative theoretician, links Republican fortunes to “white fertility rates,” pointing out where whites choose to have children, particularly those who are married. George W. Bush, Sailer points out, won all 19 states with the highest rates of white fertility, as well as the 25 states where white women have been married the longest, on average.

This politicization threatens the building of a broad consensus on how to promote the family. The related issue of America's sagging birth rate – the lowest since the 1920s, by some measurements – should not be seen as a matter of political expediency but as an existential issue concerning the health of society and the long-term prosperity of the United States. No matter what happens with immigration, minorities are going to be a growing portion of our population and will soon represent the majority of children. Unless conservatives seek to secede and form their own Republic, they need to favor familialism among all ethnic groups.

Yet for now, partisan concerns remain primary, and are compelling, if for narrow, political reasons. In the past two national elections, the differences in voting patterns between married couples and those who are not has become obvious. Democratic pollsters like Stan Greenberg now hail single women as “the largest progressive voting bloc in the country,” Ruy Texeira, a leading political scientist, calls singletons critical to the “emerging Democratic majority.”

The mainstream “progressive” view on families can be seen in the “Life of Julia” slideshow produced last year by the Obama campaign and designed to appeal to single, unmarried women. In this rather pathetic portrayal, the fictional Julia is helped by federal programs from early in life. When she finally “decides to have a child,” it's on her own, a sort of an immaculate conception since no man seems to be involved. Then, her offspring is sent off to federally funded early childhood education programs and never heard of again.

Out of fashion

Familialism is deeply unpopular with many in two key Democratic constituencies – greens and feminists. Many feminists have long derided the traditional family and see child-raising as something that tends to reinforce sexual stereotypes by reducing the career prospects of women.

For their part, greens often disdain familialism since they see extra humans as a threat to the environment. The notion that depopulation, and too-rapid aging, at least in higher-income countries, could well become a greater issue than growth seems not to have sunk in, yet. Instead, people like Lisa Hymas, with the environmentalist website Grist, suggest that the “childfree” are something of a persecuted group that are in need of more societal understanding. Environmentalists also tend to be in favor of slow economic growth, which, in turn, tends to further depress birth rates.

These worldviews represent a break from the progressive politics of the entire era stretching from Teddy Roosevelt to Bill Clinton. In the past, the basic emphasis has been to make families stronger by backing such institutions as public schools and parks, as well as creating the basis for broad-based economic growth. Support for single-family homes that most families require was part of this.

But today, many “progressives” disdain the suburbs, which were built largely with the help of New Deal and successor programs. Now, most planners, according to the American Planning Association survey, believe accommodating families is simply not worth the cost of the services, notably schools, that they engender.

Rather than looking at housing that fits families, many progressives now want to promote an urbanism that has little place for families. Some real estate sites, such as Estately, rank cities not by being child-friendly, but those most accommodating to the “childfree” – reminds me of gluten-free – a term which for some reason is deemed preferable to childless. Virtually all cities so ranked, such as ultralow-fertility San Francisco, Portland, Seattle, New York and Madison, Wis., are all places that increasingly are Republican-free as well.

Most still want kids

Since most people, including millennials, likely will choose to have children – and settle in suburbs – embracing familialism does offer an opportunity for conservatives and Republicans. Most millennials, note generational chroniclers Morley Winograd and Mike Hais, place high priority on being good parents and having a strong marriage.

The potential political benefit, however, is being squandered by profamily activists who tend to focus on a Manichean worldview that sees anything other than traditional arrangements as inimical to core religious values about what is defined as a “natural family.” Rather than try to accommodate modernity, many family activists contend, as one leader told me, that we need to “march back to the '50s.”

Unfortunately for more hard-line social conservatives, history may go in waves, with each shift engendering a reaction, but it does not generally go backward. To remain relevant, and not to, so to speak, throw the baby out with the bathwater, some agenda items need to be laid aside. This is particularly true on issues such as gay marriage, where millennial opinion is shifting toward ever-greater acceptance, with roughly two in three in favor. By forcing allegiance to increasingly unpopular views, social conservatives are in danger of losing touch with the next generation.

At the same time, many conservatives are so wedded to the market economy as to ignore the negative pressures on family formation imposed by our relentlessly competitive society. Some thought has to be given to mechanisms – such as free or subsidized child care and extended parental leave – that might make it easier for young families to survive, particularly in tough economic times. Conservatives, if they value family, should look at ways to support them, even if, sometimes, it's done through government.

In the end, the issue of family is too important to leave to the mercilessness of narrow partisan political forces. The country – and its future generations– needs both parties to focus not just on pro-family rhetoric, but on how we can make it easier for young people both to create, and nurture, the next generation.

Joel Kotkin is executive editor of NewGeography.com and Distinguished Presidential Fellow in Urban Futures at Chapman University, and a member of the editorial board of the Orange County Register. He is author of The City: A Global History and The Next Hundred Million: America in 2050. His most recent study, The Rise of Postfamilialism, has been widely discussed and distributed internationally. He lives in Los Angeles, CA.

This piece originally appeared at The Orange County Register.

Baby photo by Bigstock.


Book Review: 'The End of the Suburbs,' by Leigh Gallagher

$
0
0

Suburbia has been a favorite whipping boy of urbane intellectuals, who have foretold its decline for decades. Leigh Gallagher's "The End of the Suburbs" is the latest addition to this tired but tireless genre. The book lacks the sparkling prose and original insights one could find in the works of, say, Jane Jacobs or Lewis Mumford. Indeed, Ms. Gallagher's book is little more than a distillation of the conventional wisdom that prevails at Sunday brunch in Manhattan.

The author restages many of the old anti-suburban claims, and her introduction's section headings easily give away the gist of the argument: "Millennials hate the burbs"; "Our households are shrinking"; "We are eco-obsessed"; "The suburbs are poorly designed to begin with"; and so on.

Ms. Gallagher, an editor at Fortune magazine, fails to persuade. For starters, her focus on the recent past distorts her argument. She starts with reporting about a dismal home-building conference in Orlando in early 2012, when the housing market was still close to its post-bubble nadir. She portrays those dark times as the harbinger of a new reality that will see suburban living fade away. She quotes real-estate economist Robert Schiller saying that suburban home prices won't recover "in our lifetime." But given that prices have indeed risen, and are now reaching precrash levels in some markets, such predictions should be viewed skeptically.

There isn't much room for contrarian viewpoints here. All the usual anti-suburbanite suspects are marshaled to support the book's thesis: Al Gore suggests suburbs will die because they aren't green enough; the critic James Howard Kunstler makes exaggerated claims about how "peak oil"—the notion that we are running out of fossil fuels and that their cost will skyrocket—will bankrupt suburbanites; other experts claim that young people will desert suburbia for their entire lifetimes and that empty-nesters will abandon their stale suburban lives in favor of urban density.

Today barely 11% of Americans live in densities of more than 10,000 people per square mile, which is about the level of an inner-ring San Fernando Valley suburb, one-seventh of the Manhattan level and almost one-third of the five boroughs. Four out of five prospective home buyers in the U.S. prefer single-family houses, according to a 2011 survey conducted by the National Association of Realtors and the advocacy group Smart Growth America. In short, most of America isn't about to densify itself along Gothamite, or even Los Angeles, lines.

The author ignores most of these findings. She believes cities are poised to become the main beneficiaries of the suburban decline she projects. "To see that cities are resurgent centers of wealth and culture, all you need to do is set foot in one," she writes. To be sure, some American urban centers, most notably New York, San Francisco and Washington, have experienced modest population growth over the past decade or two, although still well below the national average. And even in these cities, there are many neighborhoods that sophisticated urbanites wouldn't really want to "set foot in." In newly hip, and now increasingly expensive, Brooklyn, nearly a quarter of residents live below the poverty line. The borough's artisanal cheese shops and trendy restaurants are charming, but one in four Brooklynites receives food stamps. The urban renaissance is even less obvious in places like St. Louis, Cleveland and Detroit, which have lost residents in significant numbers over the past decade and whose gentrified zones are tiny.

Having misunderstood the past, Ms. Gallagher is likely off in her predictions of a high-density future. She insists that young people overwhelmingly want to live "in urban areas and don't want to own a car." But most millennials entering their 30s, according to surveys, are likely to get married and eventually have children. That is when they will start to seek out single-family houses in lower-density areas. They may well experience suburbia differently than their parents. More of them will work at home or close to home, or drive fuel-efficient cars on their commutes. Even so, most aging millennials can be expected to seek out homes in affordable areas with decent schools, meaning either the suburbs of older cities or lower-cost, economically vibrant regions like the Southeast, the Gulf Coast or the Mountain West.

Much the same can be said about the other key emerging demographic group, immigrants and their offspring. Nationwide over the past decade, the Asian population in suburbs grew by almost 2.8 million, or 53%, while that of core cities grew 770,000, or 28%. In Los Angeles, the region with the nation's largest Asian population, the suburbs added roughly five times as many Asians as the core city.

One reason: Immigrants are more likely to have families than the native-born. They don't share the conviction, held by many anti-suburbanites such as Ms. Gallagher, that we are seeing "the end of the nuclear family." The family, like suburbia, has been written off numerous times. But as Margaret Mead once observed, it "always comes back." High-density cities generally repel families, and they aren't conducive to middle-class aspirations. In New York City and Los Angeles, for example, the homeownership rate is 20% less than the national figure of 65%. Things are even worse for working-class and minority households. Metropolitan Atlanta's African-American homeownership rate is approximately 40% above those of San Jose and Los Angeles, approximately 50% higher than Boston's, San Francisco's and Portland's, and nearly 60% higher than New York's.

Many of those migrating to Atlanta, Houston, Dallas-Fort Worth and other low-density, lower-cost cities come from denser, more expensive areas. Between 2000 and 2010, 1.9 million net domestic migrants left the New York area, 1.3 million left Los Angeles and 340,000 left San Francisco, while 230,000 left San Jose and Boston, according to Census Bureau data. The death of the suburbs may suggest a pleasant prospect for the New York and D.C. urbanist crowd, but for most, the American dream remains a suburban one. As long as the American family and the national aspiration for a better life persist, the suburbs are likely to retain their pre-eminent role.

Joel Kotkin is executive editor of NewGeography.com and Distinguished Presidential Fellow in Urban Futures at Chapman University, and a member of the editorial board of the Orange County Register. He is author of The City: A Global History and The Next Hundred Million: America in 2050. His most recent study, The Rise of Postfamilialism, has been widely discussed and distributed internationally. He lives in Los Angeles, CA.

This piece originally appeared at The Wall Street Journal.

Inequality of the Largest U.S. Metropolitan Areas

$
0
0

We earlier mapped inequality of the US states. Now I show the geography of inequality for metropolitan areas over 1,000,000.  These measures of inequality are gini coefficients, calculated by the US Census Bureau for 2005-2009. These indicate how amazingly severe inequality, or the concentration of income and wealth at the top, has become.  The gini is a measure of the departure of a curve of accumulated income, ranking from the poorest to the richest. The current US gini is .467, up from .39 back in 1974, and much higher than other rich countries, such as Canada at .32, Germany at 27, France at .33, and Sweden at .23.

Interpretation of these indices is relative. Even the lowest value, for Salt Lake City, is absolutely high compared to high-income-country norms, or even our own recent past. But in the contemporary US context, ginis from .41 to .44 are  low, between .44 and .447 medium low, .448 to .46 moderate, .46 to .47  moderately high,  and over .47 very high inequality.  Note that the US average is .467, and that most of the metropolitan areas are below that. This is a reflection of the demographic influence of the high levels of inequality of the following few large metropolitan areas:


RegionPopulationGini  
New York18.9 million0.502
Miami5.50.493
LA12.80.484
Houston5.60.478
San Francisco  4.20.473


These national or regional capitals are highly unequal because of the concentration of wealthy families or wealth-producing sectors like finance. Other contributors are a dearth of middle income jobs and large numbers of the poor. These higher than the US average metro areas are joined by three southern metropolitan areas, New Orleans, Memphis, and Birmingham, where in equality is more explainable instead by racial inequality.

Metro areas around or just below the national average (in red) similarly include a mix of regional economic and financial capitals, along with southern large metros, including Chicago, Philadelphia,  Cleveland, Dallas, and Charlotte plus Oklahoma City and San Antonio.


A handful of  metro areas, shown in yellow, are moderately lower than the national average and dominantly in the east central part of the country, and include a mix of sizes, from Detroit, St. Louis and Atlanta, Pittsburgh, Buffalo and Milwaukee, Nashville, Tampa, and Austin, with only Denver and San Diego in the west. 

Less unequal areas, shown in green, are with the exception of Phoenix, all in the east, from Hartford and Providence, to Baltimore, Jacksonville and Orlando, and a cluster in the north central states, with Cincinnati, Columbus, Louisville, Indianapolis, and Grand Rapids. These mostly follow the pattern observed in our recent state analysis where inequality was generally lower across the northern tier of the country.

The least unequal metro areas are even more focused on the Germanic belt that stretches across the Midwest to far west, with Minneapolis, Kansas City, Salt Lake, Seattle and Portland, Sacramento Las Vegas and Riverside-San Bernardino, plus some in the Atlantic states, including Rochester, Raleigh, Richmond  and the government dependent Washington DC and Virginia Beach-Norfolk. Salt Lake, influenced both by Mormonism and a moderately Scandinavian population, is the least unequal followed by Virginia Beach and Minneapolis.  Overall, with the exception of the Washington DC area,  the least  unequal metro areas tend to have the lowest shares of minority populations. Less unequal metros also tend to retain strong middle class industries, whether it’s Boeing in the Seattle area or the burgeoning tech and manufacturing industries found in places like the Salt Lake region.

Highly unequal and less unequal may appear together on the map, suggesting lesser suburban or satellite inequality. Generally speaking, suburbanized, less dense (and often less globalized) areas tend to be more equal. We can see this in the difference between Los Angeles and Riverside-San Bernardino,    San Francisco as opposed to Sacramento, Boston vs. Providence, and Washington DC vs. Baltimore. Washington is especially interesting, as the city is extremely unequal, the wider metro area (more homogenous middle class suburbs) far less so. This is even more telling if we look at a more local geographic scale, with central cities marked by the juxtaposition of the very rich and very poor, while suburban cities tend to be dominated by similar middle class folks.

Among metro areas under 1 million the most unequal is Bridgeport-Stamford, CT  ( those wealthy suburbanites next to historic industrial cities), while the least unequal are Ogden, UT, Appleton, WI, York, PA and Fairbanks, AK.

Inequality in selected cities

The most unequal cities (over 100,000) are all southern (Atlanta, #1, New Orleans, Washington, Miami, Gainesville, Ft. Lauderdale, Dallas and Baton Rouge), all except for mighty New York City. Race and ethnicity matter, as does the composition of the local economy. 

The least unequal  cities are all suburban or satellite, except for Port St. Lucie (military and space), such as of Chicago (Elgin), Kansas City (Olathe), Salt Lake (West Valley, West Jordan), Sacramento (Elk Grove), Los Angeles (Norwalk), Phoenix (Gilbert) , Denver (Thornton) and North Las Vegas.

Conclusion

Inequality in distributions of income are high and have become higher in recent years in the United States. But there remains fascinating geographic variation, resulting from abiding racial differences, variation in industrial structure and class homogeneity, and in geographic situation, regionally and locally. This helps both to explain some of the drivers of inequality, but also the complexities of finding ways to alleviate it.

Richard Morrill is Professor Emeritus of Geography and Environmental Studies, University of Washington. His research interests include: political geography (voting behavior, redistricting, local governance), population/demography/settlement/migration, urban geography and planning, urban transportation (i.e., old fashioned generalist).

What Triggers a Civic Turnaround?

$
0
0

Lots of cities in America are struggling with low population growth and sluggish economies. Poor demographics and economics lead to fiscal problems that result in more people and businesses leaving, perpetuating a downward spiral. Detroit, which recently filed bankruptcy, is an extreme case, but many cities and states find themselves in similar straits, including much of New England and especially most of Rhode Island.

How to places break out of this and renew prosperity? Looking at cities where there has been change, I have observed several basic patterns of turnaround.

Structural Changes

Many cities failed for structural economic reasons like deindustrialization and globalization. Similarly, many ended up reviving for similar external reasons. In her seminal book The Global City, Saskia Sassen noted that while globalization permitted the dispersal of economic activities to lower cost locations, it created a parallel need for specialized financial and producer services to manage and control those global production networks. These services were disproportionately concentrated in so-called “global cities” like New York and London. While once those cities had fallen on hard times (in NYC’s case, nearly going bankrupt itself in the 1970s), globalization more than any other factor perhaps brought them back to life. Unfortunately, localities have no ability to conjure up these macro-economic changes.

Natural Lifecycle Progression

In a few places, notably Pittsburgh, it seems that the problems simply reached the end of their life cycle. To borrow a phase, they “hit bottom” and started reviving, if slowly. Of course, many places hit bottom and stayed there. Pittsburgh has been helped by the presence of large, world-class institutions. Being in the Marcellus Shale formation that’s the epicenter of the American gas fracking boom doesn’t hurt. It’s worth noting that Pittsburgh has seen fairly slow growth and still faces big challenges, including major pension and infrastructure problems.

Outsider Influx

Other cities hit a growth inflection point when they were able to attract a critical mass of outsiders. I have argued that having a critical mass of outsiders, that is, of people who aren’t long time natives or “boomerang” migrants, is almost a prerequisite for major civic change:

You need them, and you need enough of them that they a) don’t get beaten down by the man, so to speak and b) that they become a base of support for change in their own right. Once this group becomes large enough, it opens up the field of possibilities. They have the insights and different ideas from having lived elsewhere. They aren’t bought into the status quo or burdened by the baggage of the past. They are willing to question they way things are done. They are more likely to want change. In short, outsiders are the natural constituency for the new. That’s why outsiders are so important for a community to change, and why absent enough newcomers, change is difficult if not impossible.

Of course, this almost begs the question: how do you attract those outsiders? This would appear to be a second order factor. It would be worth doing a deep dive on how significant inward migration began in these places. Also, the places that seemed to do well on this model – like Nashville or Denver – are places that weren’t in terrible shape to begin with.

Transformational Leaders

Any number of cities lend themselves to a narrative of transformational change led by a particular leader or group of leaders. You can think of Richard M. Daley in Chicago or Rudy Giuliani and Michael Bloomberg in New York. Cory Booker in Newark may be an emerging story in this mold. Or in previous generations there were business magnates like J. Irwin Miller in Columbus, Indiana that through superior vision combined with clout were able to put their community on a different path than other similarly positioned cities. (Among other things, Columbus, Indiana is an internationally renowned center of modernist architecture, with no fewer than six National Historic Landmarks in a modernist style).

The obvious question here is how much leadership had to do with it. So many of these large tier one type cities came back at the same time that it seems likely some common outside force like globalization was the real driver. Or at least that it was a prerequisite to enable the leadership to be effective. However, there are some examples like Columbus that appear to be less the result of outside forces.

Civic Sector Led Revitalization

Some cities have done well in models without a single dominant leader such as a larger than life mayor. In Indianapolis, for example, it was a broader coalition of business, community, and institutional leaders that championed items such as their sports hosting strategy that had a transformational impact. This is the model most cities try to use, but it has failed nine times out of ten in delivering transformational impact, so would appear to be a very high risk strategy.

What other models suggest themselves? I won’t claim this as a comprehensive list.

A Look At Providence and Rhode Island

Where does Rhode Island fit in? Well, it hasn’t seen a turnaround yet. But there has been a sort of slow growth in personal incomes that could add up over time. In this light, Providence would be a sort of Pittsburgh-like city from a lifecycle perspective, though I should note with a much smaller asset base. Alon Levy made the case for this view last year in a piece called “The Quiet Revival”:

Rhode Island may have one of the highest unemployment rates in the US today, but income growth is high; things are slowly getting better. The most visible growth in the US is in population rather than income, and so the usual markers are new housing starts, new infrastructure, and a lot of “coming soon” signs. Providence of course doesn’t have much of this. Instead, people are getting richer, slowly… Economic growth in the richest countries is slow enough that people don’t perceive it. Instead, they think it’s the domain of countries that are catching up, such as China, where it’s so fast it includes new construction and the other markers that signify population growth in the first world. In the long run, it matters that a city’s income grows 1.8% a year rather than 1.1%, but it’s not visible enough to be captured by trend articles until long after the spurt of growth has started.

Given the lack of structural economic forces boosting the city, and a comparatively small base of newcomers, particularly outside of Providence proper and other core cities, this will likely have to do for now, unless we witness the emergence of a disruptive and transformational type leader.

This post originally appeared in GoLocalProv on August 26, 2013.

Aaron M. Renn is an independent writer on urban affairs and the founder of Telestrian, a data analysis and mapping tool. He writes at The Urbanophile.

Photo by Will Hart.

The Consequences of Urban Containment

$
0
0

Recently published research by Brian N. Jansen and Edwin S. Mills represents notable addition to the already rich academic literature that associates more stringent land use regulation with higher house prices. The analysis is unusually comprehensive and its conclusions indicate greater consequences than is usually cited. Mills is Professor Emeritus of Real Estate and Finance at Northwestern University and is renowned for his contributions to urban economics over more than five decades.

The Research

The comprehensiveness of the research is indicated by the fact that it covers all of the 268 metropolitan areas in the United States for which complete data was available. The focus was on the trend of house prices leading up to 2006, the peak of the housing bubble. Their econometric analysis showed that "stringent land use controls raise house prices."

They also found that more stringent land use controls were associated with greater house price losses following the peak.

“The strong conclusion of this paper is that stringent residential land use controls were a primary cause of the massive house price inflation from about 1992 two 2006 and possibly of the deflation that started in 2007.”

Overall, this finding is consistent with the work of others (such as in Glaeser and Gyourko) who have associated more stringent land use controls with greater house price instability.

Consistency with Economic Principle & Previous Research

The Jansen and Mills findings reiterate those of a large body of research. Economists Richard Green and Stephen Malpezzi summarized the issue a decade ago:

“When the supply of any commodity is restricted, the commodity's price rises. To the extent that land – use, building codes, housing finance, or any other type of regulation is binding, it will worsen housing affordability.”

This relationship is even acknowledged by proponents of more stringent land use policies. A Brookings Institution team led by University of Utah Professor Arthur C. Nelson indicated that “If … policies serve to restrict land supplies, then housing price increases are expected.”

Needless to say, any other effect would be the equivalent of “sun rising in the West” economics.”

The more stringent land use regulations include blunt tools like the urban growth boundaries of Vancouver, Sydney, Portland or the San Francisco Bay Area but also the large-lot suburban lots that have rendered Boston'surban densities nearly as low as Atlanta. Artificial limits on development lead to higher house prices, other things being equal.

This will come as no surprise to those familiar with the work of Dartmouth economist William Fischel who attributed California’s high house prices to stringent land use regulation. He noted that until around 1970, California house prices had been nearly the same, relative to incomes as the rest of the nation, before more stringent land use regulation began. Now house prices in coastal California markets are double those in liberally regulated markets, measured by the median multiple (median house price divided by median household income).

Unintended Consequences: Portland and California

The Jansen and Mills findings will disappoint urban containment (smart growth or growth management) advocates who have often denied the economic reality of its influence on house prices. Some had hoped that the house price increasing effects of stringent land use regulation would be neutralized by more affordable housing costs in the cores of metropolitan areas, where more dense housing would be permitted. A principle source of this view is an analysis of early 1990s Portland (Oregon) house prices by Justin Phillips and Eban Goodstein, who said that such an effect “should” occur.

Yet in the 15 years since the period covered by this research, Portland house prices have risen with a vengeance (see The Evolving Urban Form: Portland), with the median multiple rising more than 40 percent, from 3.0 in 1995 to 4.3 in 2012. Obviously, with such an increase, the price increasing impacts of Portland's urban growth boundary have not been negated.

Further, housing costs rose in Portland's densifying areas at virtually the same rate as in the rest of the metropolitan area over the period from 1999 to 2009. Census and American Community Survey data indicates that densifying zip code areas (housing unit density increases of 5 percent or more) experienced median multiple increases of 37 percent, compared to 36 percent for the balance of the metropolitan area (Note). Rents in the densifying areas rose 9 percent, compared to 8 percent in the rest of the area.

The impact on Portland's low income population, however, was less than equitable. The cost of owned housing rose 75 percent more in areas of higher poverty (areas with poverty rates 50 percent or more than the average rate) than in the balance of the metropolitan area. The median multiple (value) rose 61 percent in the high poverty areas and only 35 percent elsewhere (Figure 1).

The difference was even starker in rentals, where low income households are concentrated. Income adjusted median gross rents in the high poverty areas rose more than 2.5 times the increase in the rest of the metropolitan area. In the high poverty areas, the increase was 21 percent and only 8 percent elsewhere (Figure 2).

The housing cost increases in the higher poverty areas appears to be at least partially from gentrification as well as Portland’s efforts to improve neighborhoods through urban renewal. In assessing the results of the 2010 census, The Oregonian noted that the core city of Portland had become less diverse and that many African-American households were driven out of their neighborhoods by “gentrification.”

This greater housing cost burden on lower income households belies the noble intentions expressed in much of the urban containment and smart growth literature. Results are more important than intentions.

Portland is not alone. Nelson, et al, were uncritical of Portland a decade ago (before the evidence of house price increases was so clear), but did not mince words in characterizing the already evident higher prices from stringent land use policies in California, saying: “This is arguably what happened in parts of California where growth boundaries were drawn so tightly without accommodating other housing needs that housing supply fell relative to demand.”

The Broader Consequences of Stringent Land Use Regulation

Jansen and Mills took the research farther than most others. In their econometrics, they found more stringent land use regulation negatively impacted metropolitan area population, employment and per capita real income.

They also considered the role of stringent land use controls in the Great Financial Crisis. This issue had also been a subject of inquiry of the congressionally established United States Financial Crisis Inquiry Commission, which hypothesized stringent land use controls as one of four causes of the Great Financial Crisis:

“Land use restrictions. In some areas, local zoning rules and other land use restrictions, as well as natural barriers to building, made it hard to build new houses to meet increased demand resulting from population growth. When supply is constrained and demand increases, prices go up.”

My analysis of metropolitan markets for the National Center for Policy Analysis suggested a similar relationship (see The Housing Crash and Smart Growth).

Jansen and Mills squarely place blame for the Great Financial Crisis on stringent land use controls.

“Indeed, it is difficult to imagine another plausible cause of the 2008–2009 financial crisis. Popular accounts simply refer to a speculative housing price bubble. But productivity growth in housing construction is faster than in the economy as a whole and the US has an aggressive and competitive housing construction sector. In the absence of excessive controls, housing construction would quickly deflate a speculative housing price bubble.”

The absence of excessive controls would have defused the housing bubble, they suggested. This notion is supported by the experience of metropolitan areas with liberal land use regulation (Figure 3) where median multiple remained near or below 3.0 in liberally regulated markets. This standard has typified affordable markets since World War II, as well as California markets to the early 1970s and Portland until 1995. The retention of housing affordability is especially significant in Atlanta, Dallas-Fort Worth and Houston, which experienced some of the largest rates of domestic in-migration during the bubble. This is in contrast to the more stringently regulated high cost markets of coastal California, which experienced huge out-migration during the same period.

The Imperative for Job Creation and Economic Growth

All of this is particularly important because housing is the most expensive element of household budgets, and unlike transportation and most consumer goods, is extremely sensitive to varying local and regional public policies. Where households have to pay more for housing, they have less discretionary income and necessarily have a lower standard of living. This is deleterious to virtually all households and is especially burdensome on lower income households.

Many young adults are “doubling up” with their parents, deferring their own independence, facing huge student loan debts and inadequate employment prospects in what may become the Great Malaise. Taxpayers in many jurisdictions face unprecedented burdens in funding unsustainable government employee pension benefits. Only job creation and economic growth can solve these problems. The last thing the economy needs is stringent land use policies that reduce employment, economic growth and per capita real incomes.

Wendell Cox is a Visiting Professor, Conservatoire National des Arts et Metiers, Paris and the author of “War on the Dream: How Anti-Sprawl Policy Threatens the Quality of Life.

-----

Note: Median multiple data from the Census Bureau (and the American Community Survey) are reported using median house values, instead of the more common median house price.

-----

Photo: 1,700 square foot house in exurban Los Angeles priced at $575,000 at the peak of the housing bubble (by author).

America's True Power In The NAFTA Century

$
0
0

OK, I get it. Between George W. Bush and Barack Obama we have made complete fools of ourselves on the international stage, outmaneuvered by petty lunatics and crafty kleptocrats like Russia’sVladimir Putin. Some even claim we are witnessing “an erosion of world influence” equal to such failed states as the Soviet Union and the French Third Republic. “Has anyone noticed how diminished, how very Lilliputian, America has become?” my friend Tunku Varadajaran recently asked.

In reality, it’s our politicians who have gotten small, not America. In our embarrassment, we tend not to notice that our rivals are also shrinking. Take the Middle East — please. Increasingly, we don’t need it because of North America’s unparalleled resources and economic vitality.

Welcome then to the NAFTA century, in which our power is fundamentally based on developing a common economic region with our two large neighbors. Since its origins in 1994, NAFTA has emerged as the world’s largest trading bloc, linking 450 million people that produce $17 trillion in output. Foreign policy elites in both parties may focus on Europe, Asia and the Middle East, but our long-term fate lies more with Canada, Mexico and the rest of the Americas.

Nowhere is this shift in power more obvious than in the critical energy arena, the wellspring of our deep involvement in the lunatic Middle East. Massive finds have given us a new energy lifeline in places like the Gulf coast, the Alberta tar sands, the Great Plains, the Inland West, Ohio, Pennsylvania and potentially California.

And if Mexico successfully reforms its state-owned energy monopoly, PEMEX, the world energy — and economic — balance of power will likely shift more decisively to North America. Mexican President Pena Nieto’s plan, which would allow increased foreign investment in the energy sector, is projected by at least one analyst to boost Mexico’s oil output by 20% to 50% in the coming decades.

Taken together, the NAFTA countries now boast larger reserves of oil, gas (and if we want it, coal) than any other part of the world. More important, given our concerns with greenhouse gases, NAFTA countries now possess, by some estimates, more clean-burning natural gas than Russia, Iran and Qatar put together. All this at a time when U.S. energy use is declining, further eroding the leverage of these troublesome countries.

This particularly undermines the position of Putin, who has had his way with Obama but faces long-term political decline. Russia, which relies on hydrocarbons for two-thirds of its export revenues and half its budget, is being forced to cut gas prices in Europe due to a forthcoming gusher of LNG exports from the U.S. and other countries. In the end, Russia is an economic one-horse show with declining demography and a discredited political system.

In terms of the Middle East, the NAFTA century means we can disengage, when it threatens our actual strategic interests. Afraid of a shut off of oil from the Persian Gulf? Our response should be: Make my day. Energy prices will rise, but this will hurt Europe and China more than us, and also will stimulate more jobs and economic growth in much of the country, particularly the energy belts of the Gulf Coast and the Great Plains.

China and India have boosted energy imports as we decrease ours; China is expected to surpass the United States as the world’s largest oil importer this year. At the same time, in the EU, bans on fracking and over-reliance on unreliable, expensive “green” energy has driven up prices for both gas  and electricity.

These high prices have not only eroded depleted consumer spending but is leading some manufacturers, including in Germany, to look at relocating production , notably to energy-rich regions of the United States. This shift in industrial production is still nascent, but is evidenced by growing U.S. manufacturing at a time when Europe and Asia, particularly China, are facing stagnation or even declines. Europe’s industry minister recently warned of “anindustrial massacre” brought on in large part by unsustainably high energy prices.

The key beneficiaries of NAFTA’s energy surge will be energy-intensive industries such as petrochemicals — major new investments are being made in this sector along the Gulf Coast by both foreign and domestic companies. But it also can be seen in the resurgence in North American manufacturing in automobiles, steel and other key sectors. Particularly critical is Mexico’s recharged industrial boom. In 2011 roughly half of the nearly $20 billion invested in the country was for manufacturing. Increasingly companies from around the world see our southern neighbor as an ideal locale for new manufacturing plants; General Motors GM -0.96%Audi , Honda, Perelli, Alcoa and the Swedish appliance giant Electrolux have all announced major investments.

Critically this is not so much Ross Perot’s old “sucking sound” of American jobs draining away, but about the shift in the economic balance of power away from China and East Asia. Rather than rivals, the U.S., Mexican and Canadian economies are becoming increasingly integrated, with raw materials, manufacturing goods and services traded across the borders. This integration has proceeded rapidly since NAFTA, with U.S. merchandise exports to Mexico growing from $41.6 billion in 1993 to $216.3 billion in 2012, an increase of 420%,while service exports doubled. MeanwhileU.S. imports from Mexico increased from $39.9 billion in 1993 to $277.7 billion in 2012, an increase of 596%.

At the same time, U.S. exports to Canada increased from $100.2 billion in 1993 to $291.8 billion in 2012.

Investment flows mirror this integration. As of 2011, the United States accounted for 44% of all foreign investment in Mexico, more than twice that of second-place Spain; Canada, ranking fourth, accounts for another 10%. Canada, which, according to a recent AT Kearney report, now ranks as the No. 4 destination for foreign direct investment, with the U.S. accounting for more than half the total in the country. Over 70% of Canada’s outbound investment goes to the U.S.

Our human ties to these neighbors may be even more important. (Disclaimer: my wife is a native of Quebec). Mexico, for example, accounts for nearly 30% of our foreign-born population, by far the largest group. Canada, surprisingly, is the largest source of foreign-born Americans of any country outside Asia or Latin America.

We also visit each other on a regular basis, with Canada by far the biggest sender of tourists to the U.S., more than the next nine countries combined; Mexico ranks second. The U.S., for its part, accounts for two-thirds of all visitors to Canada and the U.S. remains by far largest source of travelers to Mexico.

These interactions reflect an intimacy Americans simply do not share with such places as the Middle East (outside Israel), Russia, and China. There’s the little matter of democracy, as well as a common sharing of a continent, with rivers, lakes and mountain ranges that often don’t respect national borders. Policy-maker may prefer to look further afield but North America is our home, Mexico and Canada our natural allies for the future. Adios, Middle East and Europe; bonjour, North America.

This story originally appeared at Forbes.

Joel Kotkin is executive editor of NewGeography.com and Distinguished Presidential Fellow in Urban Futures at Chapman University, and a member of the editorial board of the Orange County Register. He is author of The City: A Global History and The Next Hundred Million: America in 2050. His most recent study, The Rise of Postfamilialism, has been widely discussed and distributed internationally. He lives in Los Angeles, CA.

NAFTA logo by AlexCovarrubias.

Viewing all 3795 articles
Browse latest View live


Latest Images