Quantcast
Channel: Newgeography.com - Economic, demographic, and political commentary about places
Viewing all 3795 articles
Browse latest View live

Let L.A. Be L.A.

$
0
0

Victor’s Restaurant, a nondescript coffee shop on a Hollywood side street, seems an odd place to meet for a movement challenging many of Los Angeles’s most powerful, well-heeled forces. Yet amid the uniformed service workers, budding actors, and retirees enjoying coffee and French toast, unlikely revolutionaries plot the next major battle over the city’s future. Driving their rebellion is a proposal from the L.A. planning department that would allow greater density in the heart of Hollywood, a scruffy district that includes swaths of classic California bungalows and charming 1930s-era garden apartments. The proposal—which calls for residential towers of 50 stories or more along Hollywood Boulevard, where no building currently tops 20 stories—has been approved unanimously by the city council and will now probably be challenged in court.

That proposal isn’t the only densification plan making its way through city hall. Another is a “wholesale revision” of L.A.’s planning code that would strip single-family districts of their present status and approve the construction of rental units in backyards and of high-density housing close to what are now quiet residential neighborhoods. “We are going to remake what the city looks like,” Mayor Antonio Villaraigosa told the New York Times in March. Richard Abrams, a 40-year Hollywood resident and a leader of SaveHollywood.Org, puts it differently: “They want to turn this into something like East Germany. This is all part of an attempt to worsen the quality of life—to leave us without backyards and with monumental traffic.” The rebels gathered at Victor’s note that many of the density scheme’s most tenacious advocates, such as councilman and mayoral aspirant Eric Garcetti, live in leafy residential areas removed from the traffic nightmare that the new development would bring.

Despite public outcry, Los Angeles’s political, labor, and real-estate elites almost unanimously support what Villaraigosa calls “elegant density,” pushing for the transformation of the city’s low-rise, multipolar, and moderate urban form into something more like vertical, transit-oriented New York. Dissenters from this view are often called “antiurban.” But to activists like Susan Swan, who leads the Hollywood Neighborhood Council, it’s really about letting L.A. remain L.A. As she notes, New York and Los Angeles have evolved in radically different ways. New York, particularly its urban core, was built largely before the automobile age. Manhattan and the surrounding boroughs are transit-dependent: 56 percent of commuters take public transportation. By contrast, L.A. remains overwhelmingly car-oriented, with only 11 percent of commuters using public transit, despite the $8 billion invested in rail lines over the past two decades. Los Angeles’s downtown is nowhere near as important as New York’s; just over 2 percent of L.A. metropolitan-area employment is downtown, compared with about 20 percent in greater New York. Instead of revolving around one mega-center, L.A. boasts commercial centers in each of its major neighborhoods, many of which are close to single-family homes and low-rise apartments.

This dispersion creates an aesthetic rarely appreciated by density boosters, enabling residents to enjoy fully L.A.’s unique ambience—its superb Mediterranean climate, lush foliage, tall trees, and, most of all, magnificent light. Even when you walk down Hollywood Boulevard, what’s most striking is not the skyline but the steep hills, framed by palms, rising toward a clear blue sky. For a glimpse of the Hollywood imagined by Villaraigosa and his confederates, take a look at the much-reviled Hollywood and Highland Center, home of the Dolby Theatre, which hosts the Academy Awards. Instead of brilliant light and blue sky, visitors confront a boxy hulk that obscures the hillside views.

Swan and other activists deny that opposing mass densification is synonymous with opposing development. With many nearly abandoned blocks and downscale businesses around its core, Hollywood certainly could use a face-lift. But local community activists want development to be congruent with the area’s architectural traditions. “There is real dismay in our community that the opportunity to make Hollywood a world-class destination is slipping away to these ‘Manhattanization’ fantasies,” says Swan, a retired bookbinder. “We have always said that we love Manhattan—in New York.”

Demographics also make a mockery of the densification argument. With the exception of downtown, most of the central parts of Los Angeles have either stagnated or lost population over the last 20 years. Hollywood, for example, shrank from 213,000 residents in 1990 to 198,000 today. Within the last decade, Los Angeles County’s growth slowed to barely 3 percent—roughly one-fifth the rate that it enjoyed during the go-go 1980s, a period of extraordinary prosperity in the region. Yet Garcetti, Villaraigosa, and their allies continue to base their grands projets, as the French would call them, on outmoded assumptions of exploding economic and population growth. Particularly revealing is the experience of the Residences at W Hollywood, a luxury-condo project located a stone’s throw from the proposed new high-rise towers in Hollywood. According to recent reports, only 29 out of 143 units have sold since the project opened in May 2010, despite prices that have been slashed by more than half. The market, in short, is unwilling to embrace density here, “elegant” or otherwise.

Yet the city keeps planning big, as though hordes of the well-heeled were eager to move to L.A. It has offered massive subsidies, accounting for nearly $640 million in tax breaks, to three hotel projects. Public bonds are also underwriting expansion of L.A.’s convention center and a new football stadium, which received unheard-of exemptions from state and local environmental laws even though the city currently has no football team. “Everything we are doing, like the mass build-out of transit and density, provides an excuse for creating things people don’t want,” says Cary Brazeman, founder and president of L.A. Neighbors, a citywide alliance of neighborhoods, and a candidate for city controller in 2013. “To build this city back, you have to approach things in ways that enhance the gloriousness of L.A. Sunshine, it’s transcendental. You take away the sun, hell, I’m leaving my condo.”

Without backing from rent-seekers or unions, Brazeman’s campaign runs on a shoestring. His better-funded opponent, former police officer Dennis Zine, epitomizes L.A.’s dysfunctional political system, drawing both his generous police pension and a city council salary of $178,000, the highest in the nation. Though he represents a largely residential area in the San Fernando Valley, Zine has proved a reliable vote for the elaborate “incentives” that encourage large, often uneconomic, building and ever-greater spending on transit projects. A more serious challenge to the existing order could come from Zev Yaroslavsky, a member of the Los Angeles County Board of Supervisors. Yaroslavsky hasn’t declared his candidacy for mayor yet, but he is known to be skeptical of the proposed remake of L.A. The question is whether he’s too comfortable with the status quo to take on the “elegant density” agenda.

For now, the best hope for Los Angeles resides with the activists who meet at Victor’s. They may not scare the political incumbents or the real-estate developers, but they do represent a motivated opposition to the effort to recast the city. “Los Angeles started because people want to live here,” Abrams says. “We are not a cut-rate New York and don’t want to be. The developers and the politicians want to take away all that makes us unique and get rid of us tomorrow. It won’t be so easy.”

Joel Kotkin is executive editor of NewGeography.com and is a distinguished presidential fellow in urban futures at Chapman University, and contributing editor to the City Journal in New York. He is author of The City: A Global History. His newest book is The Next Hundred Million: America in 2050, released in February, 2010.

This piece originally appeared in The City Journal.


State of Chicago: Explaining the 1990s Versus the 2000s

$
0
0

In my article “The Second-Rate City?” I noted Chicago’s very strong economic and demographic performance in the 1990s and contrasted it with the very poor performance in the 2000s. Then I outlined several problems with Chicago I thought helped drive the struggles. A few people asked a very fair question, saying, “All the negative factors you cite about Chicago (e.g., clout, business climate) were equally as true in the 1990s as in the 2000s, so what really made the difference?” I want to try to respond to that today.

First, let’s ask ourselves, why did Chicago decline into its Rust Belt malaise? Was it some unique to Chicago factor? No, clearly not, as a broad swath of the industrial United States experienced a similar collapse. Likewise, lots of big cities (I mentioned New York before) seemed to be on the fast track to oblivion in the 1970s. In a sense, the city was a victim of outside macro-economic forces and secular trends.

Next, why did Chicago come back? Saskia Sassen helps us understand why. Globalization, which enabled the global distribution of many functions of production, also simultaneously created the demand for new types of functions to help control and manage these far flung networks, especially new types of financial and producer services. These require very specialized, high skill workers operating in dense knowledge networks, which led to agglomeration effects and the emergence of so-called “global cities.”

So, in a sense, the rise of global cities is simply an emergent property of the new global economy. The global transformation that renewed Chicago, New York, London, etc. had little to do with good leadership or great mayors, and everything to do with a historical context that was ripe for repositioning in a new world economy that demanded it. In other words: outside forces again. This includes other secular changes like the start of a new wave of people who prefer urban to suburban living. These forces laid the cities low and they brought them back.

So as I’ve said before, when it comes to Chicago’s transformation, the city was the artifact, not the architect.

The 1990s were a great decade nationally. Combine that with these forces I mentioned, and Chicago really had the wind at its back. It’s easy to do well in that environment. However, when the national economy took at turn for the worse in the 2000s and we experienced a “lost decade,” things were very different. It’s when the tide goes out that, as Warren Buffett likes to put it, you get to see who’s been swimming naked.

In a sense, the 2000s tough times exposed the weaknesses of Chicago in the same way that the financial meltdown blew up so many Ponzi schemes.

Also, I believe there were some particular characteristics about the way the markets changed in the 1990s and 2000s that particularly benefited Chicago in the 1990s and hurt it in the 2000s. I can’t claim to have done a rigorous study on it (though I think there is some good research to be done), but working in the industries affected and living it myself – and having some personal knowledge of various firm employee counts during the period – I feel somewhat qualified to state this as a hypothesis.

I’ve outlined this before, particularly in a very extensive post called “A Better Tomorrow” but I’ll restate it in part here.

There were two main forces that converged on Chicago in the 1990s: the tech revolution and the nationalization of industry. Note that I consider the 1990s really the prelude to globalization, which was the dominant force of the 2000s.

Consider the technology world of 1990. It was an era dominated by staid mainframe shops. By the end of the decade, the world was completely transformed. Just think of some of what we went through: the client/server revolution, the emergence of the web and the dot com boom, the ERP revolution, the Y2K retrofit problem, and the emergence of mobile telephony and laptops as ubiquitous. These were all huge, gut wrenching changes that required not just incredibly large numbers of people skilled in new technologies themselves, but also with tremendous business, functional, and people skills so they could be deployed effectively.

At the same time, the 1990s was the Great Rollup era. Back in the 1980s most cities had their three big local banks, their local electric and gas companies, their local retailers, even their local manufacturers. Only AT&T seemed to be a true national player of the type we know today. Fast forward through the 1990s and industry after industry was subject to national rollups. First was the emergence of “super-regional” banks, which led to today’s huge giants. (It was also when Glass-Steagall fell, arguably to our chagrin). Utilities merged, department stores merged, and major big boxes and category killers like Wal-Mart, Target, Walgreens, Best Buy, and Home Depot developed national footprints. Integrating these businesses, and building scalable processes and technology to manage these huge enterprises, was another gigantic effort.

Both of these worked enormously to Chicago’s benefit. Chicago had always been the dominant location in the interior for professional services, with core sub-industries including: management consulting (e.g., McKinsey), technology consulting (e.g., Accenture), IT/business process outsourcing (e.g., TCS), accounting (e.g., KPMG), and law (e.g., Mayer Brown).

Both the technology and nationalization trends generated huge amounts of demand for new people to manage them, which drove a huge increased demand generally for consultants and other service providers. What’s more, unlike the old back office “data processing” mainframes, the new technology was directly embedded into the fabric of the business. This meant that people working with it needed industry knowledge like never before. Clearly, to help executives merge and manage large national firms, consultants and such needed a lot of industry expertise as well, and needed to be able to serve their clients on a national, not just local basis.

This led to a sea change in the organization of professional services firms. Historically they had been organized by local office practice. But in the 1990s they reorganized along industry lines, with national practices. Instead of a Chicago consultant serving Chicago clients primarily, you’d have, for example, a retail consultant serving retailers where ever they might be nationally.

If you need to fly consultants all over the country to work with clients, where do you want to do it from? The two best options are Chicago and Dallas. So Chicago, with its huge labor market, its urban environment hitting at the emerging youth trend, its status as a major air hub, its central location, and its head start through its already robust professional services sector, became the best location in America for professional services overstaffing. That is, hiring people into a city with the idea that they’ll fly around the country servicing clients coast to coast. I believe this explains why Chicago boomed like nobody’s business during the 1990s. I suspect most major professional services companies doubled or tripled employment in Chicago in this period.

The 2000s were very different. First, the dotcom bust deflated demand for tech generally and Chicago as a hub got blasted. Second, the 2000s really didn’t see the same sorts of technology revolutions that we saw in the 1990s. I believe that things like Web 2.0 were mostly evolutionary. (Smart devices and such may be leading us through another fundamental revolution, but that wasn’t mostly a 2000s phenomenon). Third, the rise of the global age led to the emergence of offshore software development and business process delivery. Thus, much of the new demand, and existing demand, could be satisfied offshore, and didn’t require an army of expensive onshore consultants anymore. This new competition caused traditional firms to have to revamp themselves to become much more efficient internal business operators. (Law seems to be the last holdout, and is in the early stages today of a major shakeup in how legal business gets done).

This hurt Chicago badly. You didn’t need to overstaff in Chicago because you could do it in India. When there was recovery from the dotcom bust, much of it was offshore. I suspect that even 12 years later, there isn’t a single technology consultancy that employs as many people in Chicago as it did in 2000, new companies excepted. Consider that major firms like Arthur Andersen and Whitman-Hart don’t even exist anymore. Many smaller sized internet era firms also experienced the same fate, and Chicago’s “Silicon Prairie” ambitions more or less got wiped out, which cost a huge number of telecom jobs. Also, industries like finance have been subject to increasing centralization in global hubs. Chicago went from being #2 nationally as a financial hub to something further down the chart in a global hierarchy. Chicago retains great strengths in derivatives and risk management generally, but second tier financial hubs like Chicago and Boston have been feeling the pinch.

This, in a nutshell, is what I think explains the difference in performance. The general “wind at the back” of Chicago and big cities in a boomtime economy papered over a multitude of civic sins in the 1990s that the lean years of the 2000 exposed. And the tech/nationalization era of the 1990s particularly benefited Chicago, helping to explain why it rated so highly in that decade.

I’ve got one more piece in my “current conditions” segment of State of Chicago. Then I’ll turn to articulating my rationale for some of the structural weakness factors I outline in the article, then move on to a series of proposed fix-its.

This is the third installment in my “State of Chicago” series. Read part one here and part two here.

Aaron M. Renn is an independent writer on urban affairs and the founder of Telestrian, a data analysis and mapping tool. He writes at The Urbanophile, where this piece originally appeared.

How Marketing Could Boost Land Development

$
0
0

Zoning ordinances, land use maps and comprehensive plans used by cities to guide growth rarely provide the kind of insight required to make informed decisions about what will truly be best for the city and its residents in the long run. Unfortunately, by failing to incorporate market analysis and financial modeling in the beginning stages of the planning process, too many cities find themselves facing the results of misallocated resources and fiscal difficulties that could have been easily prevented.

For the past 22 years I have been involved in the market analysis of land development from the private developer’s perspective. The public sector could benefit greatly from utilizing the same sort of informed decision making tools currently used by much of the private land development industry.

Comments from urban planners and city officials seem to indicate that it is rare for city officials to actually consider market data in their decision making on issues such as transportation thoroughfares, land-use determination, building code changes, and comprehensive city planning.

As the owner’s representative, or as a market consultant in numerous design charrettes for master planned communities and urban infill projects, I've often observed an air of tension between those oriented toward design (urban planners and architects), and those who believed good design pays for itself through the value it creates for the end-user (the property owner and/or property developer).
In all of the situations where this tension was detected, no one considered including someone in the process to relay market information to the designers who were attempting to provide a product. Using readily available market data and a flexible, accurate financial model, input could have been given to the design consultants so that they could focus on land uses and products that would truly serve the local market, and to assure the success of the project.

It's difficult to design profitable private development projects in a vacuum. The same principle applies to cities. The proper planning of cities — plans that meet the needs of both present and future inhabitants in a fiscally responsible manner — cannot be done properly without considering the needs of the market, and the impact that serving those needs will have on the fiscal health of the city.

Typically, land uses are based upon residents' comments, the planning commission and/or council vision, and the planning consultant or staff leading the meetings. All of these suggestions stem more from emotion, or from the ease of finding a boiler-plate solution, than from an analysis of what the market wants or needs. Using market data, city leaders could be provided with reasonable projections concerning the near-term and long-term demand for different types of uses for property within their communities.

This projected data could then be compared to the existing supply and quality of these property types, and a reasonable projection for demand could be provided to the community. Community leaders could then decide how to proceed, based upon the values of the community. Once the initial decision was made, a framework could be put into place to evaluate future decisions on zoning, transportation, and infrastructure improvements.

However, this process would only address current and future levels of demand. The real issue is the likelihood of whether or not the projected demand will actually be met. This is where financial modeling techniques very similar to those created for large-scale development can be modified for use by the city.

In projecting future results, the trick is to not get caught up in trying to be exactly right. It’s not necessary, and any attempt to be exactly “right” leads to what I refer to as a deceptive level of precision, since you can’t possibly know exactly what is going to happen anyway. Using projected demand, market pricing and cost estimates, though, a model can be developed that can test the reasonableness of municipal policies and plans. Examples?

• A market study performed for a rapidly growing city reveals that affordable housing will be an even greater issue in the near future than it is currently, but the local school district needs additional funding. A per-lot impact fee to pay for new school construction seems like a reasonable idea, until the financial model proves that it will eliminate all hope of affordable housing being constructed.

• Street ordinances written long ago were originally intended to allow two fire trucks to pass each other while going in opposite directions. Even though the premise has now been proven to be absurd (how often are fire trucks assigned to different fires on the same street!), and, even though the rules produce large, ugly residential streets, the rules are not changed for years…until the long-term cost of maintaining those streets is accounted for in the city financial model. Once the high cost of the future maintenance and repair of the oversized streets is quantified and then compared to their “benefits,” the street ordinance is immediately amended.

• The opportunity to acquire water rights presents itself, with significant upfront costs involved. City leaders are understandably concerned, even though there will be long-term revenues from water sales. But the city market data and financial model indicates that the real benefit to the city is tax revenue generated as a result of having a stable, diverse source of potable water. After considering both the direct and indirect benefits of acquiring the water, the city decides to make the purchase. And the analysis of the economic benefits proved invaluable in selling the bond program to the voters in order to build the required infrastructure to utilize the water rights.

Consideration of market demand — and the intersection of that demand with public policy decisions — should be an integral part of the decision making process for the public sector. When used to provide input for financial projections, it can be an invaluable tool in land use planning for communities.

Skip Preble, MAI, CCIM is a real estate analyst and land development consultant specializing in market analysis, feasibility studies, project value optimization and market value opinions. He can be reached through his website at landanlytics.com

Flickr Photo by Toban Black: Prime Development Site, Oshawa, Ontario.

The Uncertain Future of the California Bullet Train

$
0
0

On July 18, at a site pregnant with symbolism — the future location of what HSR advocates hope will become San Francisco’s terminus of the state’s bullet train — California Gov. Jerry Brown signed a bill to fund construction of the first section of the high-speed line. Earlier in the day, Brown had traveled for a similar ceremony to Los Angeles, the other "bookend" of the project. The bill signing ceremonies followed the state Senate’s approval (by a single vote) earlier in the month of nearly $8 billion in state and federal money to build the initial section of the line in the Central Valley and to make  a series of  transportation infrastructure improvements in the LA and Bay Area. 

According to sources at the California High Speed Rail Authority (CHSRA), the total infrastructure commitment now involves:

*  $6 billion for construction of the first section of the high-speed line in the Central Valley ($2.7B of state HSR bonds and $3.3B of federal ARRA funds);

*  $1.2 billion for electrification of Caltrain, the commuter rail line in the SF Peninsula (half from state HSR bonds and half from local funds);

*  $1 billion for San Francisco’s Central Subway (of which $61M is in HSR "connectivity" funds and $930M in federal New Starts money);

*  $1.5 billion in other connectivity improvements (BART car replacements, LA Metrolink upgrades, LA regional connector, grade separation improvements) funded by the remaining "connectivity" funds, which must be matched ; and

*  $1 billion in other SoCal projects ($500M from state HSR funds which must be matched).

As can be seen from the above summary, almost half the funding is for upgrades to conventional transit/commuter rail services in LA and the Bay Area. Much to the chagrin of high-speed purists, the project has morphed into a statewide transportation program much of which is totally unrelated to the high-speed rail initiative approved by the voters in Proposition 1A.

Whether this shift in emphasis represents "a giant fraud perpetrated on the voters who passed Proposition 1A and voted for a true HSR system;" or whether this is a "victory for common sense, a decision that wisely places greater value on satisfying present-day needs than on promises and conjectures of distant-in-time benefits" depends on one’s point of view (both are direct quotes from our interviews.) While bullet train visionaries will view the "bookends" strategy as a betrayal of the original Prop 1A pledge, pragmatists will hail it as a prudent and realistic move to gain political support and a  hedge against  the uncertainties facing the high speed rail project. Just what obstacles confront the project in the months ahead can be gleaned from the discussion below.

Obstacles and Uncertainties

Despite the celebratory and self-congratulatory tone of the Governor’s speech, the project faces a number of impediments that could delay it for years if not put an end to it altogether. As a headline in a Wall Street Journal article put it, "For Now, the Bullet Train May Go Nowhere." (WSJ, July 8, 2012). The hurdles the project must overcome include:

*   A major lawsuit asserting that the Central Valley line project as proposed and approved by the Legislature does not comply with various provisions of the enabling Proposition 1A. According to the plaintiffs, the deficiencies include:(1) no electrification, (2) lack of a "useable segment" (the 130 mile section in the Central Valley by itself is claimed not to satisfy the requirements of an operable segment); (3) lack of adequate committed funding; (4) trip times above the promised 2 hrs 40 min; (5) the need for an operating subsidy; (6) inability to meet the Federal requirement to complete project by September 2017; and (7) inability to meet the promise of a "one-seat ride" from LA to SF (the "blended" approach would require at least one transfer). (John Tos, Aaron Fukuda and County of Kings v. California High Speed Rail Authority). The suit is moving toward trial sometime in 2013.

*   A lawsuit filed by the Madera County and the Madera and Merced County Farm Bureaus asking for a preliminary injunction to block rail construction in the Central Valley, slated to begin later this year. The suit asserts that the rail line would disrupt 1500 acres of fertile land by cutting off irrigation canals. Officials of the two bureaus say more than 500 farmers whose land lies in the path of the rail line plan to fight any attempts by the state to seize their properties by eminent domain. "It’s going to be a long battle for the Rail Authority," said executive director of the Merced County Farm Bureau. "There is going to be opposition every step of the way."

*   Several lawsuits challenging the Program level EIR for the Bay-Area-to-Central-Valley section of the statewide project. A victory by the challengers of the Program EIR would "undo" the project level EIRs for the Central Valley construction project, according to Gary A Patton, an attorney who has been involved in the litigation.

*   Several environmental lawsuits charging the HSR project with violations of the state environmental law (CEQUA) and the Endangered Species Act. The Governor, under pressure from environmentalists, has recently withdrawn his threat  to waive CEQUA requirements.

*   The possibility of a legal challenge that Proposition 1A money is being used "unlawfully," i.e. for non-HSR projects, in the "bookend" areas.

Any of the above actions could delay the issuance of the bonds and/or land acquisition, potentially delaying the start of construction and threatening the Authority’s ability to complete the Central Valley section by the federally imposed deadline of September 2017.

When asked about the potential impact of litigation on the Authority’s schedule, Chairman Dan Richard observed that "simply filing a lawsuit does not means they will win, nor if they do win does it automatically mean injunctive relief." In other words, the litigation may or may not delay construction in the Central Valley. It’s California, so there will always be lawsuits," Richard added with a chuckle.

The "Bookends" Approach 

Chairman Richard’s approach is two-pronged. While supportive of the distant vision of linking the Southern and Northern portions of the state with a high-speed rail line, he sees a need to show signs of near-term service improvements in order to gain crucial political support of skeptical local officials and the public. The dollars spent on the "bookends" could have "an immediate and dramatic effect" he told us.

Improving the metropolitan "bookends" of the system will make it possible to increase the speed of local commuter trains and thus bring immediate travel benefits to large segments of California’s urban population. Will Kempton, chief executive of the Orange County Transportation Authority (OCTA) and chairman of the Independent Peer Review Group advising the High Speed rail Authority agrees. It will be a good investment whether or not the overall $68 billion high-speed rail project ever gets completed, he said. Sensing a promise of new money, planning and transportation agencies in Southern California and the Bay Area have thrown their support to the Authority's "bookend" strategy.

The Long-Term Strategy

As for implementing the high-speed rail project itself, Richard is convinced that its various pieces will eventually fall into place, one step at a time. "What we’re doing is building a high-speed rail line," he told us, "that will connect to the existing tracks and allow passenger-only service between the town of Madera (north of Fresno) and Bakersfield. It will cut significant time off the trip from Oakland/Sacramento to Bakersfield.. At the same time we will be upgrading Metrolink from LA/Union Station up to Palmdale and we have our sight set on the next phase, which is Bakersfield to Palmdale. Once that gap is closed, we’ll have an intercity rail line from LA to northern California, albeit one with a couple of transfers, but we think that is when private sector investment will come in and help upgrade the entire line to full high speed rail. Even our critics agree that if we get to Palmdale, everything changes. We’re not that far away, in terms of either miles or dollars. ... Richard summed up, "We took great pains to make sure the investment is not stranded. The point is that we have an effective beachhead for a true advanced passenger rail system."

Exactly how does the Authority propose to fund the $8-11B cost to close the gap from Bakersfield and the Central Valley to Palmdale and down to LA (assuming the project does not go over budget)? Richard remains serene and confident. "We will have about $4 billion of our bonds left," he said." They must be matched. We will be looking for federal funding, to be sure, arguing that this can help free up freight capacity, assist goods movement through the Central Valley and enhance the efficiency of ports. ... We will also be pushing hard to look at other private sources...If all of that fails, we have the prospect of state cap-and-trade revenues."

These are heroic assumptions. Future federal support is highly uncertain. Congress, by eliminating Title V of the Senate transportation bill (the National Rail System Preservation, Expansion and development Act of 2012) from the final version of the surface transportation reauthorization (MAP-21) and by denying Administration requests for high-speed rail funds three years in a row, could not have sent a clearer message that states should not count on continued congressional funding of high speed rail, Transportation Secretary Ray LaHood’s bluster notwithstanding ("We will not be dissuaded by the naysayers in Congress...High speed rail is alive and well in America...The Administration is keeping high-speed rail on track...") "The President’s high-speed rail program is "a vision disconnected from reality," members of the Democratic-controlled Senate Budget Committee lectured Secretary LaHood at a recent hearing.

Private sector funding is equally problematic. "We see no evidence that private investors are taking serious interest in this project at this time," a financial consultant knowledgeable in public-private partnerships told us. As for cap-and-trade revenues, their use to bail out HSR is expected to meet with opposition from the state legislature, according to several sources.

For the backers of high speed rail, the implications are grave. Absent further federal funds and absent private capital, the State will be obliged to seek a fresh infusion of public money as early as 2014 if it is to continue pursuing its $68 billion train project. Will California voters be willing to approve new bonds for this venture, given recent surveys indicating dwindling popular support? Can the Governor and the Authority keep the faith alive by dangling a vision of a bullet train that few voters (and politicians) can hope to see deployed in their lifetime? There is reason to be skeptical.

Ken Orski has worked professionally in the field of transportation for over 30 years.

CA route map by Wikipedia user CountZ.

Characteristics of the Self-Employed

$
0
0

With EMSI’s new data categories, we can now more closely parse data on the major classes of workers in the labor market. This is a significant shift in how we present employment data, and one of the valuable applications is being able to track and analyze self-employed workers — those whose primary job, their chief source of income, is working on their own.

In this piece, we’ll use EMSI’s self-employment data to dig into a segment of the workforce that has previously been hard (or impossible) to get at for local researchers and planners. But first, it’s important to distinguish between EMSI’s two proprietors datasets and why we’re only focusing here on the self-employed, the third of our four class of workers.

We also track what we call extended proprietors. This is distinct, miscellaneous set of workers/income earners, and the fourth category included for subscribers to our web-based labor market research tool. Extended proprietors do side gigs or earn income through a sole proprietorship or partnership, most often (but not always) in addition to their primary job. If surveyed, they would not list this extra work as their main source of income. On the other hand, our self-employed dataset uses the American Community Survey and other publicly available sources to track proprietors who work for their own unincorporated business, practice, or farm. (People with incorporated businesses are considered wage and salary workers for their own companies, and are thus not considered proprietors).

In short, EMSI’s self-employment data gives an estimate of the true self-employed in the workforce (i.e., those who are primarily self-employed and consider themselves as such). And it does so at the county, ZIP code, MSA, and state level.

A Note on Monitoring Entrepreneurial Activity

EMSI’s two new proprietor datasets offer a window into entrepreneurial activity for any level of geography, but we caution against labeling all workers in the self-employed or extended proprietor classes as entrepreneurs. More accurately, inside the extended proprietors dataset are those who pursue extra work opportunities while maintaining their day job, while the self-employed dataset includes those who have taken the additional step and are primarily on their own. Once start-up owners incorporate their business, they fall under the traditional wage and salary worker datasets.

Another thing to keep in mind: As you compare EMSI’s self-employment numbers at the national level with other sources, you might find higher estimates of the self-employed workforce than EMSI’s. The Current Population Survey, for example, tracks workers’ primary and secondary self-employment, while the ACS — which again is what EMSI uses — keeps tabs on only primary self-employment. A teacher who mows lawns in the summer could fall in the secondary self-employed category in the CPS, but for the purposes of EMSI data, that teacher’s lawn mowing would be found in extended proprietors because if you asked him what he does for a living, he would say teacher.

Overview

  • There are an estimated 10.6 million self-employed jobs in the US, a 14.4% increase from 2001. From 2006-2008, this group of workers declined nearly 5% before employment mostly leveled off.
  • Self-employed workers make on average $26,921 — more than half the annual average of the total workforce ($56,053).
  • The self-employed population includes a large segment of older workers. Over 30% (3.25 million workers) are 55 or older; this includes more than a million workers who are at least 65. Another 28.2% of self-employed workers are 45-54.
  • Nearly 20% of all self-employed jobs are in the construction industry. Another 15% are classified under “other services (except public administration),” which includes repair & maintenance, personal & laundry services, religious and civic organizations, and private households. The next-largest industry is professional, scientific, and technical services (11% of self-employed jobs).
  • The largest self-employed occupations in the US are child care workers (an estimated 556,523 jobs in 2012), carpenters (459,116 jobs), maids & housekeeping cleaners (441,551), farmers & ranchers (437,999), and construction laborers (380,226).

Note: The data in this post is from EMSI’s 2012.2 Class of Worker dataset.

Proportion of All Workers

Self-employed workers account for 7.1% of all U.S. workers, up from 6.4% in 2001. This percentage is lower that what the Current Population Survey reports, but again, we are looking at those who are primarily self-employed. Note that this proportion does not include peripheral proprietor activity through our extended proprietor dataset.

Among major sectors, the share of self-employed jobs is greatest in administrative and support services (particularly landscaping and janitorial services); agriculture, forestry, fishing and hunting; construction; and transportation and warehousing. In each of these sectors, 20% or more of the workforce is classified as self-employed.

As shown in the chart below, agriculture, forestry, fishing and hunting has made the biggest jump in the proportion of self-employed workers since 2001 (from 19.3% to 26%), followed by transportation and warehousing (16.2% to 20.2%).

While just over 10% of all jobs in the real estate industry are categorized as self-employed, nearly 70% of jobs (more than 5.5 million) in this sector are in the extended proprietors dataset. In this case, extended proprietors include part-time agents or people drawing income in a real estate partnership. The 11% in the self-employed category encompasses those who would list their real estate work as their main source of income.

Top and Bottom States for Self-Employed

Driven by a larger-than-average proportion of self-employed jobs in the arts and entertainment sector (as well as in forestry and logging), Vermont has the highest share of self-employment (11.6% of all workers) among all states and the District of Columbia. Maine (10.3%) and Montana (10.1%) are grouped closely together in the second and third spots, followed by California (9.7%), South Dakota (9%), and Idaho (9%).

By far the smallest share of self-employment is found in Washington, D.C. (2.1%), which is no surprise given that governments workers — regardless of the industry or agency — are considered wage and salary workers. After D.C., Delaware (4.4%), Virginia (5.4%), and New Jersey (5.4%) have the next-smallest shares.

The following table also shows 2001-2012 self-employment job growth and decline, and no state has expanded its self-employed workforce more than Arizona (36%). The growth of entrepreneurs has also been impressive in Texas (31%), Nevada (31%) and Florida (25%), while Nebraska has lost the largest percentage of self-employed workers (-11%, a loss of almost 9,000 jobs).

Since the heat of the recession in 2008, Vermont (8%) and Arizona (7%) have led the way in growth among the self-employed.

State Name 2012 Self-Employed Jobs 2001-2012 % Change 2012 Avg. Annual Wage Proportion of Self-Employed (2012) Rank
Source: Self-Employed - EMSI 2012.2 Class of Worker BETA
Vermont 41,529 15% $28,064 11.60% 1
Maine 69,533 6% $24,717 10.30% 2
Montana 49,910 -4% $25,834 10.10% 3
California 1,660,324 21% $28,851 9.70% 4
South Dakota 42,105 5% $27,093 9.00% 5 (tie)
Idaho 64,217 13% $24,718 9.00% 5 (tie)
Oregon 166,412 5% $25,820 8.90% 7
New Hampshire 59,565 9% $31,172 8.60% 8
Tennessee 245,723 15% $27,071 8.20% 9
New Mexico 73,347 9% $23,181 8.10% 10 (tie)
Colorado 209,822 16% $25,616 8.10% 10 (tie)
Alaska 30,459 1% $29,248 7.90% 12 (tie)
Arizona 215,044 36% $24,549 7.90% 12 (tie)
Texas 934,704 31% $27,079 7.70% 14
Wyoming 24,575 9% $28,311 7.60% 15 (tie)
Oklahoma 134,732 0% $24,850 7.60% 15 (tie)
Washington 251,891 18% $26,057 7.60% 15 (tie)
Hawaii 55,097 16% $28,896 7.60% 15 (tie)
Arkansas 97,671 8% $22,687 7.50% 19 (tie)
Iowa 124,166 5% $24,728 7.50% 19 (tie)
Florida 589,416 25% $23,508 7.20% 21
North Dakota 33,105 -4% $27,753 7.10% 22 (tie)
Kansas 106,887 9% $26,231 7.10% 22 (tie)
Connecticut 126,400 4% $32,882 7.00% 24
Nebraska 71,650 -11% $26,269 6.90% 25 (tie)
Rhode Island 34,567 18% $31,344 6.90% 25 (tie)
North Carolina 305,895 18% $24,667 6.80% 27 (tie)
Mississippi 84,600 5% $25,426 6.80% 27 (tie)
New York 644,061 13% $28,829 6.80% 27 (tie)
Minnesota 198,691 4% $25,460 6.70% 30 (tie)
Massachusetts 241,911 13% $31,106 6.70% 30 (tie)
Louisiana 143,407 17% $26,258 6.70% 30 (tie)
Missouri 196,695 8% $24,634 6.70% 30 (tie)
Georgia 288,876 13% $25,189 6.60% 34 (tie)
Alabama 137,245 14% $26,014 6.60% 34 (tie)
Michigan 284,673 12% $23,305 6.60% 34 (tie)
South Carolina 133,602 17% $24,769 6.50% 37
Kentucky 128,914 -1% $23,896 6.30% 38
Pennsylvania 378,801 8% $28,930 6.10% 39
West Virginia 47,775 3% $29,347 6.00% 40 (tie)
Wisconsin 176,142 -1% $24,811 6.00% 40 (tie)
Ohio 331,482 5% $25,331 6.00% 40 (tie)
Maryland 168,572 13% $29,691 5.90% 43
Indiana 178,485 7% $26,669 5.70% 44 (tie)
Nevada 70,034 31% $28,109 5.70% 44 (tie)
Illinois 353,135 12% $26,511 5.70% 44 (tie)
Utah 75,480 18% $25,027 5.60% 47
New Jersey 226,039 10% $32,994 5.40% 48 (tie)
Virginia 223,509 12% $26,574 5.40% 48 (tie)
Delaware 19,935 4% $28,018 4.40% 50
District of Columbia 16,680 13% $44,523 2.10% 51
Total 10,567,489 14% $26,921

A Look at MSAs

For the largest metropolitan statistical areas, Riverside, California has the highest percentage of self-employed workers (12.4%), followed by Los Angeles (10.5%). None of the other 30 largest MSAs has a double-digit presence of self-employed workers. Just missing that mark is Miami (9.7%), while San Francisco (9.3%) is also close.

New York City is right at the national average — 7.1% of its workforce is self-employed. Chicago is at 5.7%.

For all MSAs regardless of size, Guymon, OK (35.4%) and Rio Grande CIty-Roma, Texas (21.4%) have the largest percentage of self-employed workers. The lowest are Williston, North Dakota (2.6%) and Hinesville-Fort Stewart, Georgia (2.9%).

Takeaways

1. Recession’s Toll

There are almost 400,000 fewer self-employed jobs in the U.S. than in 2006, and the proportion of self-employed workers to the entire workforce is below pre-recession levels.

2. Highest-Paying Industries are Declining in Self-Employment

Of the 20 highest-paying industries with at least 100 self-employed jobs at the start of the recession, 17 have fewer self-employed workers in 2012 than in 2008. This includes offices of physicians and offices of dentists, both of which have declined 3%. Almost as pronounced is the drop in self-employment in legal services. In 2008, more than 214,000 self-employed jobs were classified under offices of lawyers; in 2012, it’s estimated to be 209,494, a 2% decline.

Meanwhile, the largest self-employed occupations tend to be lower-skilled, lower-paying jobs — construction laborers, child care workers, etc.

3. Older Americans are Working for Themselves

In 2009, Dane Stangler of the Kauffman Foundation wrote, “Contrary to popularly held assumptions, it turns out that over the past decade or so, the highest rate of entrepreneurial activity belongs to the 55-64 age group.” While our self-employed dataset does not solely contain entrepreneurs (see note above), EMSI data backs up Kauffman’s research. As we showed earlier, over 30% of all self-employed workers are over 55, and another 28% are 45-54.

4. Majority of Self-Employed are Men

Of the estimated 10.6 million self-employed jobs in the US, more than 6.6 million (63%) are held by men. This is in contrast to a much more even male/female breakdown (51% male/49% female) when we consider all wage and salary and self-employed jobs.

Joshua Wright is an editor at EMSI, an Idaho-based economics firm that provides data and analysis to workforce boards, economic development agencies, higher education institutions, and the private sector. He manages the EMSI blog and is a freelance journalist. Contact him here.

Swing State Geography: The I-4 Corridor

$
0
0

Overheated presidential politics have done few favors to Florida, except to put 132 miles of hot asphalt on everyone’s lips:  Interstate 4.  Completed in the late 1960s, this interstate (in fact, the only interstate highway to be entirely contained within one state) is known by millions who have  visited there at least once on vacation.  But the social and political reality in the world  around Interstate 4 is little known outside of Central Florida.  Like Ypres, the Flemish town continually under assault during World War 1, I-4 will receive the brunt of both side’s forces.  It deserves to be known a bit for its quirky uniqueness,   even if, like Ypres, it will recede to obscurity once the election is over.

America’s other single-digit interstate, I-5 in southern California, has such a singular personality that its users refer to it as “the five.” Not so I-4, although many users spit when they say it. With the third highest accident rate in the nation with 1.58 fatal accidents per mile 2004-2008 , Interstate 4 is notorious   for its congestion, dangerous drivers and bad karma. A section of it is even rumored to be haunted.

I-4 begins rather inauspiciously in Tampa, at a highway interchange with I-275 that even the state Department of Transportation calls “malfunction junction.”   Tampa itself is a brew of German, Italian, Spanish, and Cuban immigrants largely supplanted in the 1980s by in-migration from other states. With a port poised to take advantage of Tampa’s proximity to the Panama Canal, Tampa, and its sister city, St. Petersburg, offer a fantastic coastal setting for urban development. 

Unfortunately, the two cities now squabble eternally over what has recently been diminishing economic opportunity, often leaving their geography a large, low-grade commercial wasteland. With little to offer except beaches and waterfront real estate, Tampa and St. Pete struggle for their existence. Their airport,  considered the world’s best in the 1980s and 1990s, has been overtaken by newer, better facilities in Orlando, Denver, and other international cities, and like Tampa in general, it suffers as a has-been. No matter; Tampa’s feisty nightlife has turned Ybor City from a quaint, vacant historic district into a wet-zoned bar district that still houses the best music scene in Central Florida.

Over the bay, St. Petersburg features lovely waterfront sidewalk life with delightful galleries and museums, but it remains “God’s waiting room” with shuffleboard courts and early bird specials at local diners. Beautiful older neighborhoods surround both downtowns, but the outer-ring growth that reaches out beyond these prewar suburbs seems unremarkable and bland. The area, once a diverse mix of blue-collar industry and office workers, has lost a lot of both.

St. Petersburg is set in Pinellas County, a peninsula that reaches downward just as the San Francisco bay area’s peninsula reaches upward.  But as San Francisco took off  Pinellas did not.  Even the gulf coast of Pinellas County, with beautiful beaches, fails to reach its potential, housing gritty, second-rate motels and paint-peeled condos catering to vacationers unable to afford Sarasota further on down the shore.

Downtown Tampa these days possesses the sad, romantic air of places once important but now in a state of vanished grandeur. The sidewalks are harsh, bricky, and hot; almost no one traverses the sun-grilled open space at noon. Vacant, boarded-up storefronts are prevalent, punctuated by sleazy, vacant eateries. Channelside, a redeveloped area between downtown and the historic district, has suffered the blight of new, cheesy-looking condominiums built over storefronts, awaiting the throngs of young singles seeking an urban lifestyle but never quite arriving. Channelside looks like an empty stage set, et, “for lease” signs flapping in the breeze.

Beltways like Interstate 4 can be dividers or uniters, and this one is both and neither at the same time.  East of Tampa, it makes little difference which side of I-4 you reside on; north of Interstate 4 is Temple Terrace and the University of South Florida, and south of Interstate 4 lies Brandon, an unincorporated town. Interstate 4 presents no barrier between the two sides, with fluid movement suggesting that in this section, I-4 presents no obstacle or defining boundary.

Further east, however, one encounters the city of Lakeland, hanging like a pendulous fruit just south of the freeway. There is a rather fascinating notion that Florida’s urban areas are all aspects of one very large, complex web of urban settlement  most of whom are net consumers, taking in more than they produce. Unlovely Lakeland, the agro-industrial capital of central Florida, is just the opposite. Rich with phosphate, one of Florida’s only natural resources, Lakeland mines and processes this mineral for fertilizer and soap additives. It sends the phosphate by truck and by rail to the Port of Tampa for export.  Lakeland also processes orange juice and a variety of Florida’s agricultural products, and has clusters of food-packaging industries to support this activity. Lakeland, in the heart of what locals call “Florida Cracker country”, works hard and is definitively blue collar.

North of I-4, Lakeland quickly fades into suburbs and ranchlands. Here, one passes through the Green Swamp, a wetlands that remains undeveloped and remote. An aviation museum reminds you that you are in Central Florida indeed, but little else of man’s handiwork is evident until US 27, an old, pre-war highway that runs along a nice, high ridge which brought so many people to Florida before the interstates came.

As a boundary, Interstate 4 here is still largely symbolic, with a truck-stop cluster of gas stations and fast-food restaurants that eke out a living. On either side, however, the population remains rural and at this juncture, US 27 unites both sides of I-4, negating its myth as a boundary between red and blue Florida. By now, the alert traveler may have noticed that he is trending more northerly than easterly, and indeed Interstate 4 is slowly turning one to the north into the fringes of greater Orlando.

At one time, Interstate 4 had seasonally fluctuating traffic. In the late summer heat, one could hit stretches of I-4 where no other cars could be seen on the horizon. Today, however, it frequently slows to parking-lot crawl on the outskirts of Lake Buena Vista. For this is the pleasantly named region in which Disney resides, and I-4 straddles this region. On the left side is Walt Disney World.  On the right side, Celebration:  Disney’s tribute to high-design community living.  Both sides lie within the Reedy Creek Improvement District, a self-governing singularity cleverly established by Walt Disney to prevent annoying regulation.

The first time one arrives to this section of I-4, no matter what age, is special.  Little things like the power line pole artfully shaped like a Mickey Mouse or the words “Magic Kingdom” on the big green signboards.  Here, I-4 is a conduit of anticipation, a rim from which one anxiously departs to plunge into  a fantasy world.

Flipping conventional wisdom on its head, cosmopolitan Orange County is mainly to the north of I-4, while Osceola County to the south is pretty much…well, country, in a Silver Spurs Rodeo sort of way. Osceola County houses a great deal of the service industry that maintains the machines of tourism. It also contains a large immigrant population, and the mix has raised tensions in this region. Presidential politics must intimately understand the problems of this county, or risk alienation of its voters over gaffes.

As I-4 finally turns due north you pass through an area once considered Orange County’s back door, the county jail, large sewage treatment facilities, and Lockheed Martin all sit, surrounded now by development pressures and the occasional stray theme park. Universal Studios is surrounded by residents so close they can hear the screams from the roller coasters in their back yards. Holy Land is isolated, crammed against I-4’s huge wall; and the spectacle of International Drive, one of the most interesting and unstudied urban conditions ever, is visible from much of I-4 as one trends northward towards downtown.

After twisting and turning through more blah suburbia, I-4 finally ascends to an elevated, straight bridge and threads its way past downtown Orlando.  This is actually, when traffic is flowing, a terrific urban experience, especially at night. To the right, Orlando’s small collection of meek towers, marked by the Captain Crunch hat of a failed condominium; to the left, the Magic’s basketball arena.  This drive continues northward through Orlando’s mosaic of adjacent towns. Younger than Florida’s average population, and largely from somewhere else, this region seems to be perpetually seeking itself, but never quite finding it. The allure of New York and Chicago seem to pick off the best and the brightest, but these folks are always backfilled with newcomers. With the leftist firebrand Alan Grayson   counterbalanced by the Tea Party’s right wing voice, Daniel Webster, the area will be critical in  this election season.

Past Orlando’s heat and light, Interstate 4 traverses one last stretch of Florida’s untamed wilds, the Tomoka wetlands. This is the stretch that is rumored to be haunted, for traffic fatalities seem more common than normal as one traverses through region here. Perhaps the proximity of Cassadega , home to many spiritualists, has something to do with it, or perhaps the vengeful souls from a graveyard  supposedly under the roadbed are to blame. Either way, one is relieved to see signs of civilization when one finally reaches the end of Interstate 4 as it tees into I-95 near Daytona, Florida.

One of many cities trying to reinvent itself, Daytona’s allegiance to Nascar and motorcycles is legendary, but it has suffered heavy joblessness and unsettlement in this Millennial Depression. With its share of overbuilt beachfront condos, an unusually blighted amusement park in the center of town, and a restless, angry inner-city population, Daytona’s dire straits resembles, in some ways, Detroit or other hard-hit areas. 

And so, Interstate 4 begins and ends. Like Ypres, it may come to represent the battleground of an ugly war. The front at one end of I-4, St. Petersburg, represents genteel poverty, at the other the angry poor are looking for answers. In the middle, Orlando has the two extremes of political viewpoints personified by real candidates with passionate followers. Interstate 4, in the Orlando area, was a recipient of a new congressional district, thanks to population growth that continues into the state. What this population growth brings, and how it changes the character of this interesting, complex corridor, will be revealed after the election in November.

Richard Reep is an architect and artist who lives in Winter Park, Florida. His practice has centered around hospitality-driven mixed use, and he has contributed in various capacities to urban mixed-use projects, both nationally and internationally, for the last 25 years.

Interstate 4 sign photo by Bigstockphoto.com.

Evolving Urban Form: Dhaka

$
0
0

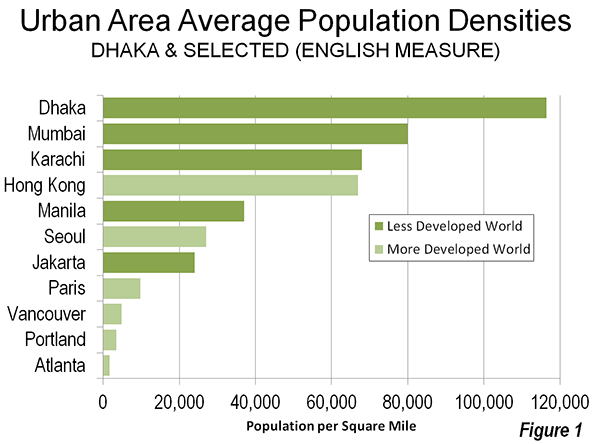
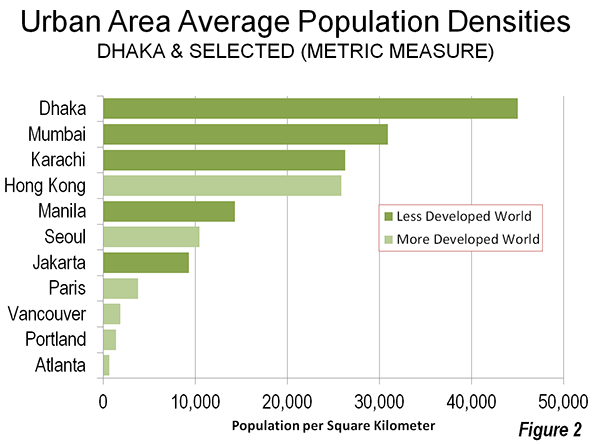
A few weeks ago, we suggested that Hong Kong was the "smart growth" ideal, for having the highest urban population density in the high income world. But, if you expand the universe to the poorer, developing countries, Hong Kong barely holds a candle to Dhaka. Dhaka's 14.6 million people live in just 125 square miles (325 square kilometers). At more than 115,000 people per square mile (Figure 1), or 45,000 per square kilometer (Figure 2), the capital of Bangladesh is nearly 75 percent more dense than Hong Kong.

The Ultimate in Average Urban Area Density

None of the world's megacities comes close to Dhaka’s population density. Mumbai is about one-third less dense, despite its reputation as crowded and congested. The only other megacity (minimum 10 million population) more than one-third as dense as Dhaka is Karachi. Twenty three other megacities fall at least two-thirds short of Dhaka's density (such as Jakarta, Seoul and Paris). New York's core, Manhattan, is 40 percent less dense, and the New York urban area does not reach 1/20th of Dhaka's density


No city in the world uses land so efficiently as Dhaka. But this comes at a price. With an urban area ranked among the 20 most populous in the world, Dhaka's average income is so low that it does not even place in the top 100 metropolitan area economies as measured by the Brookings Institution. Thus, the world's most dense urban area is among the least economically productive. Brookings rated the principally suburban and exurban Hartford metropolitan area number one, with an urban density approximately 1/100th that of Dhaka, Hartford includes the old core city; but as well as the much more substantial primarily suburban or even exurban areas.. Hartford is among the least dense urban areas in the world, at half as dense as Portland and one-fourth as dense as Los Angeles. So much for the illusion that urban density and productivity are joined at the hip.

Despite Dhaka's hyper-density, critics complain about Dhaka's urban sprawl. If Dhaka is "urban sprawl," then the term is meaningless. Perhaps the critics would prefer the rural poor to live in even more crowded shantytowns, or maybe better yet, that they go back home to even more desperate rural poverty. Aspiration is not a bad thing, and if that means cities with more people, covering more land area, so be it.

Not only does Dhaka have the highest average urban density, but it also has some of the highest neighborhood densities: some slum (shantytown) population densities reach 4,200 per acre, which converts to more than 2,500,000 per square mile or more than 1,000,000 per square kilometer. Estimates of the slum population vary, ranging from a quarter to 60 percent of the area population.

Dhaka in the Neighborhood

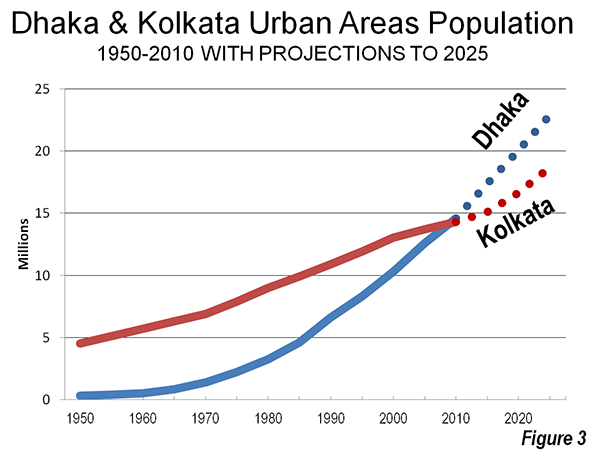
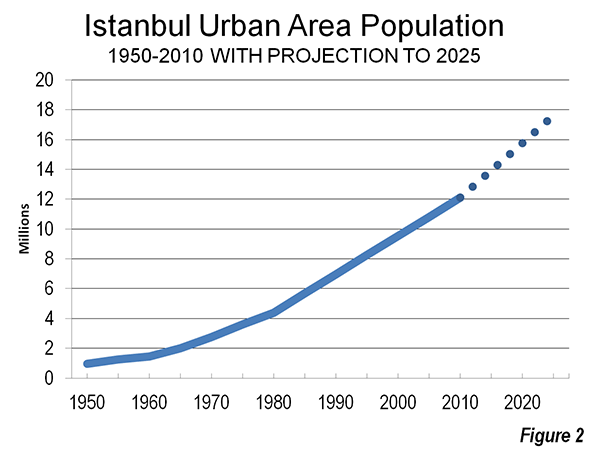
Dhaka is only 150 miles (250 kilometers) from Kolkata. Both cities were located in the province of Bengal for all but six years of the centuries long period of  British rule. After the division of India and Pakistan in 1947, Dhaka was located in East Pakistan. Kolkata became the capital of the Indian state of West Bengal. For most of their histories, Kolkata was larger than Dhaka. But the Dhaka urban area has just overtaken Kolkata in population. By 2025, the United Nations forecasts that Dhaka will reach 23 million, well ahead of Kolkata's projected 19 million (Figure 3).

Dhaka's growth has been spectacular. In 1970, just before East Pakistan separated from Pakistan to become Bangladesh, the urban area had a population of 1.3 million. Its population grew by more than 10 times, Dhaka growth over four decades trails only Shenzhen among the megacities, which expanded by 30 times over the same period.

The Metropolitan Area

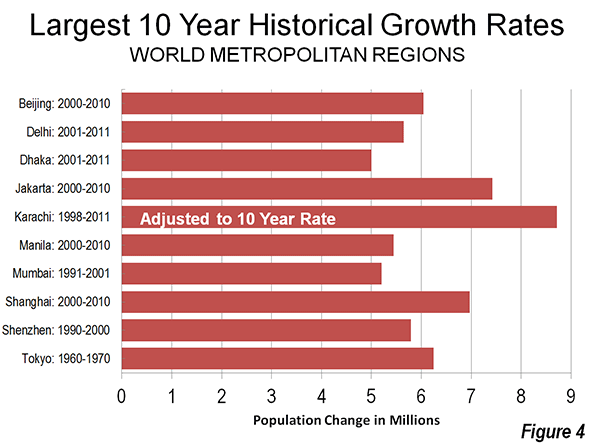
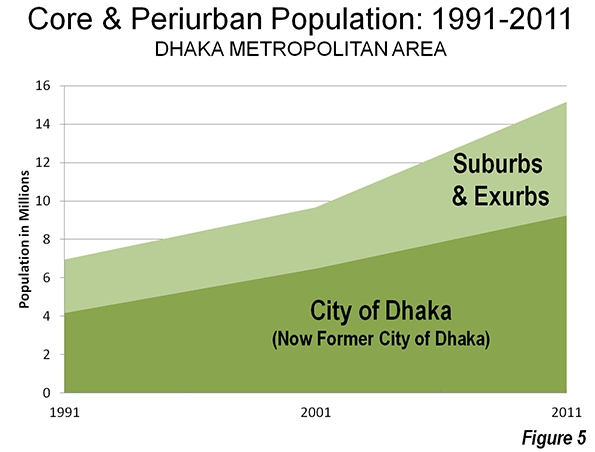
Dhaka's metropolitan area (which includes the urban area and economically integrated rural environs) added approximately 5,000,000 new residents between 2001 and 2011. Dhaka added at least a 50 percent to its population, rising from just under 10 million population to just over 15 million during the decade (Note 1). Few, if any of the world's largest metropolitan areas or urban areas have achieved such a large percentage population increase in a period of 10 years. Even so, Dhaka's population added fewer people than some larger metropolitan areas over a similar period, such as Karachi, Jakarta and Shanghai (Figure 4).

Spatial Expansion

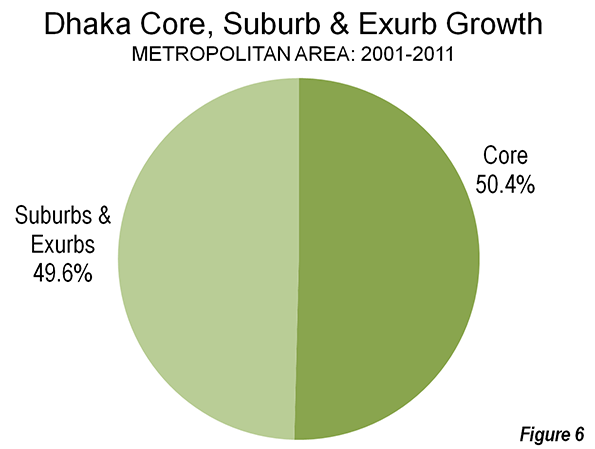
Consistent with the trend since cities escaped walls, Dhaka has been expanding spatially as its population has increased. Over the past decade, the core municipality, Dhaka, increased its population 45 percent. The suburban and exurban population increase was nearly twice as great, at 85 percent (Figure 5). The core city of Dhaka managed to capture just over one-half the population growth, but because of its larger size, the slower percentage growth rate still resulted in half the additional population being in the city (Figure 6). Dhaka thus further confirms the axiom that as cities become larger, they become less dense.


River City

Dhaka may be the worst situated urban area in the world. Dhaka is located in wetlands and virtually surrounded by rivers, some of the greatest in the world.

  • Dhaka is 20 miles (32 kilometers) east of the Padma River, which is the main course of the Ganges River.
  • Only a few miles north of this point, the Padma is joined by the Jamuna River, which is the main course of the Brahmaputra River.
  • The Meghna River, the secondary Brahmaputra River course is 15 miles (25 kilometers) to the east of Dhaka.
  • Little more than 30 miles (50 kilometers to the south is the confluence of the Padma River and the Meghna River, which flows the last few miles to the Bay of Bengal as the Meghna.

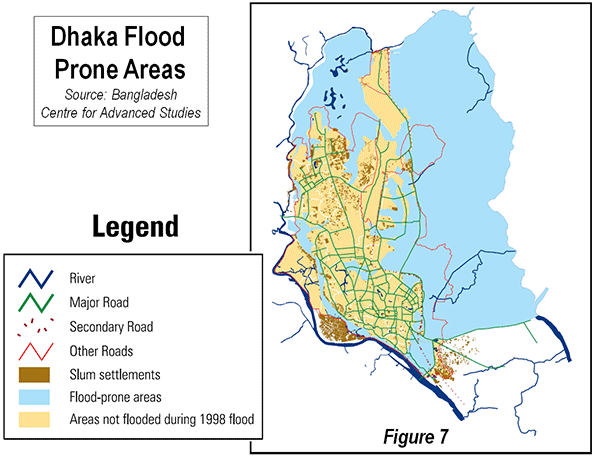
Though Dhaka is 100 miles (160 kilometers) from the Bay of Bengal (the Indian Ocean), the lowest parts of the city are little more than five feet (two meters) above sea level. This means serious flooding. The risk is illustrated in Figure 7. The extent of the risk is illustrated by the fact that the areas not prone to flooding cover less land than the urban area. That means that the necessary urban expansion will be very expensive. With the understandable exodus from rural areas to the city, the problems of high density and, particularly slums could become more acute.

A City Designed for a Metro?

The river courses and wetlands have forced Dhaka into a generally north-south orientation. The urban area averages from three to seven miles east to west (five to 11 kilometers) and is nearly 30 miles (50 kilometers north to south. The more circular development that would be expected for an inland urban area is precluded by the rivers and wetlands.

This unusual city form could serve the city well, however, as it builds its first Metro line. Stations on the planned north to south line will be within a long walk of a much of the urban area. It is hard to imagine an urban form and density more suited for a Metro. Construction is supposed to begin within the next two years.

Not only is Dhaka the largest world urban area without an urban rail system, it is also the largest without a motorway (freeway). That too will soon change, as two should be under construction soon.

Political Reform and the Future

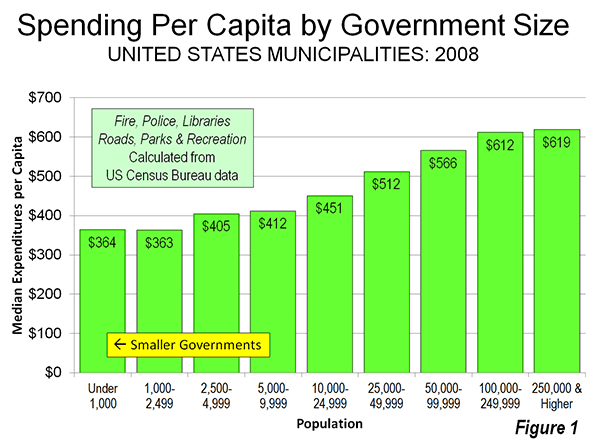
Meanwhile, in an attempt to improve city services, the national government has divided the city of Dhaka into two. The Dhaka City Corporation has now been replaced by the Dhaka North City Corporation and the Dhaka South City Corporation. There is an increasing body of literature suggesting that smaller municipalities perform better (and spend less) than larger municipalities. The Dhaka demerger may be the first significant such move since the 1986 breakup of the Greater London Council by the Thatcher government (Note 2).

Dhaka begins the next decade undertaking significant challenges in infrastructure, economic growth and government reform. However, perhaps the biggest challenge will be to figure out where to put the additional five million people expected by the 2021 census.

Wendell Cox is a Visiting Professor, Conservatoire National des Arts et Metiers, Paris and the author of “War on the Dream: How Anti-Sprawl Policy Threatens the Quality of Life.”

-----

Note 1: There was an undercount in the 2011 census, ranging from 3.8 percent in rural areas to 5.3 percent in urban areas. This complicates comparison between the 2001 and 2011 census data.

Note 2: Even after the subsequent creation of the Greater London Council, by the Blair government, most local functions were not transferred, remaining in the 32 local boroughs. A forced amalgamation of Montréal with suburbs was partially reversed by voter referenda in the early 2000s.

----

Photograph: Farmview Supermarket Transit Transfer Center, on one of the urban area's few north-south arterial  roadways. (by author)

Why I Don’t Live In Indianapolis

$
0
0

It’s no secret that Indianapolis has been a huge focus of my blog over the years. One of the biggest criticisms I get here, especially when I ding some other city, is that I’m nothing more than a mindless booster for Indy. While I like to think I’ve given the city a lot of tough love over the years, it’s definitely true that I’ve had many, many good things to say, and I have no problem saying that I’m a big fan of the city overall.

Why then, might one ask, don’t I actually live in Indianapolis?

The answer is multifaceted, but without a doubt one key reason is that I simply can’t sign up to what the city is doing in its urban environment. Indy is going one direction, I’m going another. It’s as simple as that.

Let me give you an example of what I’m talking about. The city recently announced a plan to subsidize a mixed used development on a parcel in the core of downtown, a project called “Block 400.” It would include apartments, retail, etc – all good. While the concept is great, the design is another matter. I could go into depth on the monotony of the structure and other matters, but what I want to show you instead is a parking garage that will house employees from One America insurance. Here was an initial rendering of the garage:

It’s about as boring a garage as can be imagined. It’s on a prime block just steps from Monument Circle, but has no street level retail or other interest. It’s just a dead parking garage.

Various folks took umbrage at this, so the developer decided to tack on some awnings, which got them approved by the city’s hearing examiner. Here’s their updated design:

Let’s be honest: this isn’t a garage, it’s urban design garbage. And guess what? The city of Indianapolis itself is paying to build it.

I don’t want to let the perfect be the enemy of the good. I can certainly understand that there are economic constraints, tradeoffs to be made, etc. And not every project can be a home run.

But this isn’t unusual at all – this is standard operating procedure for Indianapolis. This is par for the course. This is just what Indianapolis builds. I cannot name another major city in the United States where the city’s own developer community (including Flaherty and Collins, the developer of this property), own architectural firms (including CSO Architects, who designed this) and own city government so consistently produce subpar development.

I’m not exaggerating at all. And this isn’t even the worst offender. For example, here’s another downtown development that not only sucks out loud, but the state fire marshal condemned it and forced residents to move out:

While I’ve named the names of the folks involved in the parking garage and they certainly deserve it, let’s not focus overly on them. This trend goes back a really long way, and is pervasive. The previous city administration, which was of a different political party, behaved no differently. Partially it’s a result of a lack of good urban history of the type that exists in other places. So there isn’t a good template ingrained in the city to follow.

But ultimately, as I’ve written before, it’s a crisis of values.

Indianapolis is the place where, as a rule, not good enough is more than good enough for most people, even community leadership.

That’s why I don’t live there. Because that’s not good enough for me. I may not be perfect, but I aspire to more than mediocrity. I don’t expect any city to be perfect or all the way there yet. You can inspire people, including me, to join your army to take hamburger hill or to get behind the rock and push, if you provide a vision of what can be. That’s one reason people are planting their flag in Detroit. It’s the hope of the possible.

But when it’s clear that the city itself – and I mean that in the broadest sense – has decided it wants to go march off in a different direction, it’s a lot harder to enlist in that army, no matter how much you might want to.

Alas, it seems lots of people agree with me – on the actions if not the reasons – as Center Township (the urban core) lost another 24,000 people in the 2000s. They voted with their feet – just like tens of thousands of others have been continuously voting with their feet since 1950 – to go build a better life for themselves somewhere else.

And in a decade where downtowns made strong residential comebacks, with young people streaming in to live in them, Indianapolis was an exception. Its downtown* added less than a 1000 residents, and their distribution suggests that almost all of that might be a result of jail population expansion. Even downtown Cleveland did better.

I’m sure Indy’s boosters will be happy to talk about world class parts of downtown like Monument Circle, the Cultural Trail, Georgia St., etc. And these are legitimately first rate. Actually, that makes it worse. It shows that Indianapolis can compete with the best if it wants to, but most of the time it just doesn’t care to. It’s not ignorance. The city knows that to do, it just doesn’t want to do it.

For some reason locals seem to think that doing it right should be reserved for a handful of special places and occasions. But the mark of at great city isn’t how it treats its special places – everybody does that right – but how it treats its ordinary ones. Indy is like the guy who thinks he can get away with wearing the same old dirty clothes fives days in a row and not taking showers, as long he slaps on a little top shelf cologne before he leaves the house. I’ve got news for you, people are going to notice.

Indianapolis retains a very compelling regional story to tell. There are tons of reasons for people to come to or build a business in, metropolitan Indianapolis. But the real story there is mostly in the suburbs.

Yet I believe even the urban core of this not very historically urban city could be compelling as well – if it wanted to be. Indianapolis has all the potential in the world. Indy is like the up and coming star at a company whose boss pulls him aside one day and says, “You’ve got all the potential in the world, but if you want to get that big promotion, you need to stop doing/start doing X, Y, or Z.” Anybody who has made it to the top was fortunately enough to have somebody give them one or more of those good kicks in the pants along the way.

Indy, unfortunately, has heard the message many times before from many different people, and has elected not to do anything about it.

Locals love to make excuses for why things can’t be better. F&C’s development director for the project said of the garage, “Some things aren’t achievable.” What is so different about Indianapolis that makes that true there but no where else? What miracle of economics allowed similar cities like Nashville or Cincinnati or Columbus to build many urbanistically correct new developments in those places while somehow it is impossible in Indianapolis? Maybe it’s time to recruit some out of town developers and architectural firms who have a different attitude towards the possible.

I would encourage Indy’s leaders to take a short hour and a half drive to downtown Cincinnati and take a look around what’s there. Not the old buildings, but the new ones. Most of them are candidly quite bland architecturally, but from an urbanism perspective – and be sure to take someone with you know what’s what they are talking about on this so that they can point it all out – even the bottom quartile of new buildings in downtown Cincinnati beat most of the top 5% of what’s been build in downtown Indy.

I’ve listened to various civic leaders of late talk about how rebuilding the urban core is now a big priority of the city. If that’s true, and business as usual has been leading to a catastrophic population collapse for some time, wouldn’t you think that you might, you know, try something different? Apparently not.

When people in Indy want to do something, they can. That’s why they built an amazing franchise in events hosting, particularly sports. They understand what world class is there, they understand the competitive marketplace, and they do what it takes to succeed – including building world class venues, districts, and capabilities to make it happen. So why hasn’t it happened elsewhere?

I was involved in a discussion about building a high tech industry in Indianapolis a few years ago. Someone boldly said that since Indy had been able to pull off building the sports cluster, it should be very capable of equally pulling off a high tech cluster to rival top hubs in the country. A friend of mine was very dubious about this, and said insightfully, “Sports succeeded because sports is consistent with the state of mind (i.e, the culture, values, and patterns of life) of Indiana. But high tech is more consistent with the state of mind of other places and not so much with Indiana.” Indianapolis is #1 in sports. And while it’s done well in some parts of tech, I don’t see how you could really rate it as more than the middle of the pack nationally on that.

“State of mind” makes a big difference. That’s ultimately a question people ask themselves these days, whether it is a company and a prospective employee sizing each other up, a consultant and client, or a city and a prospective resident or business. The most important question is always, “Is there a cultural fit?”

In an era where an ability to attract talent is perhaps the defining characteristic of urban success over the long term, Indy needs to ask itself the hard questions. How competitive is it? I’d have to say right now that it does a great job for people who want to live in a suburban environment like Carmel or Fishers. That’s very, very important and not to be minimized.

But there are people out there that want more, who prefer different types of environments. Right now Indy is simply not very competitive in that market. And if it keeps on its current path, it never will be. Convince yourself otherwise by finding the exceptions to the rule and getting them to gush about how great things are. But the numbers don’t lie.

Like that young up and coming employee who’s got the goods but has a few problem areas that will, if not fixed, hold him back, Indy needs to take a serious gut check about the things that hold it back – and an embrace of mediocrity and lack of seriousness in its approach to urban core development are chief among them.

Ultimately as I said it’s a question a values. There’s nothing wrong with being happy about where you are. Most people don’t have that burning ambition to make it higher, nor a passion for excellence. In this competitive world a lax attitude will probably undermine your performance in the end, but if that’s what you want be, go for it. I won’t judge a place for that. Just don’t expect those who want better for themselves to sign up for it.

In any choice a city makes, somebody is going to be unhappy. Any branding choice is, in a sense, a choice to exclude by focusing on something rather than something else. There’s nothing wrong with setting down a marker of what you’re going after – and being comfortable with fall out from that.

Ultimately it’s not about me or any other specific individual. I’m under no illusion that I’m someone who is personally important to future of any city I might find myself. But it about people generally, and being able to attract enough of them – particular of those that are critical to the 21st century economy – to make the city successful and indeed sustainable over the long term.

Just remember, talented, ambitious people – those with big dreams and hopes for themselves and their societies – want to live in a place where the civic aspiration matches their personal aspiration.

What do you aspire to, Indianapolis?

* Downtown defined as the area inside the inner freeway loop and the White River.

Aaron M. Renn is an independent writer on urban affairs and the founder of Telestrian, a data analysis and mapping tool. He writes at The Urbanophile, where this piece originally appeared.


The U.S. Cities Getting Smarter The Fastest

$
0
0

It’s a commonplace among pundits and economic developers that smart people flock to “smart” places like sparrows to Capistrano. Reflecting the conventional wisdom, The New York Times recently opined that “college graduates gravitate to places with many other college graduates and the atmosphere that creates.”

Yet an analysis of Census data shared with Forbes by demographer Wendell Cox tells a different story. In the past decade, the metropolitan areas that have enjoyed the fastest growth in their college-educated populations have not been the places known as hip, intellectual hotbeds.

Perhaps the myth most devastated by the study, which looked at the change in the number of people with bachelor’s degrees in the 51 largest metropolitan statistical areas from 2000-2010, is that there is, as the Atlantic’s Derek Thompson has insisted, a “bipolar population shift” in which the educated go to the expensive blue regions while families and dummies (often conflated as the same thing) flock to the brain-dead reaches of the Sunbelt. In fact, during the first decade of the 21st century, the number of college graduates in Las Vegas increased by a remarkable 78%, the biggest jump in the nation over the period, while in second place Riverside-San Bernardino, Calif., the college-educated population expanded by 60%. Other surprise cities in the top 10 — Charlotte, N.C. , (No. 5) ; San Antonio (No. 6); Jacksonville, Fla. (No. 7); Orlando (eighth); and Nashville, Tenn. (ninth) — all saw 40% to 50% increases in their college-educated population.

Among the more conventional “brain” cities, the biggest winners from 2000 to 2010 tended to be lower-cost metropolitan areas with less dense cores, such as Raleigh–Durham, N.C. (No. 3), and Austin, Texas (No. 4). In contrast, the more expensive places celebrated for being smart expanded their populations of college grads at roughly half that rate, such as San Francisco (48th), San Jose (43rd), Boston (45th) and New York (39th).

This is not to say that these cities don’t boast huge concentrations of educated people. The largest metro areas, led by New York, Los Angeles and Chicago, have the biggest populations with bachelor’s degrees. And on a per capita basis, Washington D.C. (aka “parasite city”), San Francisco, Boston, Denver and Minneapolis lead the way, with a share of college grads 20% or more above the national average.

But other metro areas are catching up. In Tampa-St. Petersburg, Fla., for example, the share of the population that’s college-educated grew from 21.7%  to 26.2%, a gain of 21%. This is roughly twice the increase in the Washington, San Francisco and Seattle metropolitan areas.

This trend  doesn’t extend to all lower-cost regions. The Sunbelt has generally gained, but some Rust Belt towns have not fared as well. Cleveland, for example, ranked 50th in terms of its growth of its college-educated population, Detroit 49th and Buffalo 48th. Low costs, not surprisingly,  don’t compensate for poor economic conditions, decayed infrastructure and bad weater.

Yet the pattern is clear: brainpower is spreading out. The notion that companies seeking skilled labor have to go to one of the “hip” cities — an idea relentlessly marketed by the New York and D.C.-based press — appears greatly overstated. In reality, skilled, college-educated people are increasingly now scattered throughout the country, and often not where you’d expect them. For example, Charlotte, N.C., Columbus, Ohio, Kansas City and Atlanta now boast about the same per capita number of college grads as Portland and Chicago, and have higher per capita concentrations of grads over the age of 25 than Los Angeles.

These trends also suggest that, in many ways, the highly educated are not so different from Americans who never went to college or never graduated. The factors that have driven economic outperformance by some cities over the past decade — lower home prices, better business climate, job opportunities — also attract people with bachelor’s degrees.

Atlanta, Houston and Dallas each have added 300,000 college grads in the past decade. This is far more than Boston’s increase of 240,000 or San Francisco’s 211,000. Once considered backwaters, these Sunbelt cities now all enjoy a critical mass of educated people.

Houston boasts a percentage of college grads over 25 somewhat above the national average. Dallas-Fort Worth is just about at the national average. The total Houston increase in college grads over the past decade amounts to three times that of the capital of Silicon Valley, San Jose, Calif., twice that of San Diego and more than Philadelphia. Since hipness is not a well-known Houston trait (though it did place first this year on Forbes’ list of America’s Coolest Cities), and climate can hardly be seen as a positive, one has to imagine this growth has something to do with a job machine that has created over 100,000 new positions between 2006 and 2011.

The addition of college grads leads to changes on the ground that tend to make cities even more attractive to future graduates. In the case of Houston, there’s been a proliferation of more sophisticated restaurants, clubs and bars in growing inner-city districts like Houston Heights, Montrose and Midtown.

In the past, executives often turned up their noses at the prospect of relocating to the Gulf Coast metropolis, says Chris Schoettelkotte, founder of the Houston-based recruiting firm Manhattan Resources. Now, particularly given the weak national economy, Houston is increasingly competitive in the race to recruit skilled, educated labor, he says. This is particularly true with people at the beginning of their career. “I don’t get the pushback I used to get,” Schoettelkotte says. The message to recruits: “ You try to find a city with a better economy and better job prospects than us.”

A democratization and dispersion of educated workers bodes well for the U.S. economy. When highly skilled labor is concentrated in a few places, such as Boston or the Bay Area, opportunities for growth tend to be limited by extremely high business and housing costs. Having more places with educated workers gives employers and entrepreneurs more options for where to start a business or relocate.

Looking ahead, we can expect this trend to continue, particularly as the current bulge of millennial graduates mature and start to look for affordable places to live and work. Regions that maintain strong job growth, and keep their housing costs down, are likely to keep gaining on those metropolitan areas celebrated for being the winners of the race for educated people.


Metropolitan Growth in Age 25+ Population with Bachelor Degrees
Rank Region Total Growth Percent Growth
1 Las Vegas 122,304 78.4%
2 Riverside 187,406 60.0%
3 Raleigh 107,075 55.2%
4 Austin 147,341 52.3%
5 Charlotte 126,226 51.7%
6 San Antonio 111,739 48.1%
7 Jacksonville 77,102 46.8%
8 Orlando 125,299 46.6%
9 Nashville 92,823 42.4%
10 Phoenix 216,585 42.1%
11 Tampa 145,675 39.6%
12 Houston 300,952 39.5%
13 Louisville 61,312 37.6%
14 Portland 134,935 37.2%
15 Dallas 336,993 36.9%
16 Atlanta 308,306 36.1%
17 Sacramento 108,151 35.8%
18 Denver 169,553 35.2%
19 Indianapolis 90,001 34.5%
20 Oklahoma City 56,117 33.5%
21 Richmond 67,012 33.4%
22 Columbus 96,905 33.2%
23 Miami 262,394 31.7%
24 Virginia Beach 73,110 31.2%
25 Seattle 205,977 31.2%
26 Kansas City 103,527 31.0%
27 Salt Lake City 46,205 30.5%
28 Washington 410,679 30.5%
29 Minneapolis 189,209 29.9%
30 Baltimore 146,285 29.6%
31 San Diego 154,845 29.6%
32 St. Louis 128,617 29.5%
United States 13,115,437 29.5%
33 Cincinnati 90,374 28.3%
34 Los Angeles 559,904 27.7%
35 Memphis 45,141 27.4%
36 Philadelphia 281,686 27.2%
37 Birmingham 41,436 26.3%
38 Chicago 429,001 25.5%
39 New York 905,618 24.4%
40 Milwaukee 63,508 24.3%
41 Providence 59,926 24.1%
42 Rochester 44,268 23.6%
43 San Jose 102,609 22.5%
44 Pittsburgh 88,370 22.3%
45 Boston 240,426 22.0%
46 Hartford 49,225 20.8%
47 Buffalo 36,578 20.1%
48 San Francisco 211,835 19.2%
49 Detroit 109,429 16.2%
50 Cleveland 51,259 14.9%
51 New Orleans 19,307 10.1%

Data source: U.S. Decennial Census 2000 and 2010.

Joel Kotkin is executive editor of NewGeography.com and is a distinguished presidential fellow in urban futures at Chapman University, and contributing editor to the City Journal in New York. He is author of The City: A Global History. His newest book is The Next Hundred Million: America in 2050, released in February, 2010.

This piece originally appeared in Forbes.

Graduation image by BigStockPhoto.com.

The Screwed Election: Wall Street Can’t Lose, and America Can’t Win

$
0
0

About two in three Americans do not think what’s good for Wall Street is good for America, according to the 2012 Harris poll, but do think people who work there are less “honest and moral than other people,” and don’t “deserve to make the kind of money they earn.” Confidence in banks is at a record low, according to Gallup, as they’ve suffered the steepest fall in esteem of any American institution over the past decade. And people have put their money where their mouth is, with $171 billion leaving the stock market last year alone, and 80 percent of Wall Street communications executives conceded that public perception of their firms was not good.

Americans are angry at the big-time bankers and brokers, and yet, far from a populist attack on crony capitalism, Wall Street is sitting pretty, looking ahead to a presidential election that it can’t possibly lose. They have bankrolled a nifty choice between President Obama, the largest beneficiary of financial-industry backing in history and Mitt Romney, one of their very own.

One is to the manner born, the other a crafty servant; neither will take on the power.

Think of this: despite taking office in the midst of a massive financial meltdown, Obama’s administration has not prosecuted a single heavy-hitter among those responsible for the financial crisis. To the contrary, he’s staffed his team with big bankers and their allies. Under the Bush-Obama bailouts the big financial institutions have feasted like pigs at the trough, with the six largest banks borrowing almost a half trillion dollars from uncle Ben Bernanke’s printing press. In 2013 the top four banks controlled more than 40 percent of the credit markets in the top 10 states—up by 10 percentage points from 2009 and roughly twice their share in 2000. Meantime, small banks, usually the ones serving Main Street businesses, have taken the hit along with the rest of us with more than 300 folding since the passage of Dodd-Frank, the industry-approved bill to “reform” the industry.

Yet past the occasional election-year bout of symbolic class warfare, the oligarchs have little to fear from an Obama victory.

“Too big to fail,” enshrined in the Dodd-Frank bill, enjoys the full and enthusiastic support of the administration. Obama’s financial tsar on the GM bailout, Steven Rattner, took to The New York Times to stress that Obamians see nothing systemically wrong with the banking system we have now, blaming the 2008 market meltdown on “old-fashioned poor management.”

“In a world of behemoth banks,” he explained to we mere mortals, “it is wrong to think we can shrink ours to a size that eliminates the ‘too big to fail’ problem without emasculating one of our most successful industries.”

But consider the messenger. Rattner, while denying wrongdoing, paid $6.2 million and accepted a two-year ban on associating with any investment adviser or broker-dealer to settle with the SEC over the agency’s claims that he had played a role in a pay-to-play scheme involving a $50,000 contribution to the now-jailed politician who controlled New York State’s $125 billion pension fund. He’s also expressed unlimited admiration for the Chinese economic system, the largest expression of crony capitalism in history. Expect Rattner to be on hand in September, when Democrats gather in Charlotte, the nation’s second-largest banking city, inside the Bank of America Stadium to formally nominate Obama for a second term.

In a sane world, one would expect Republicans to run against this consolidation of power, that has taxpayers propping up banks that invest vast amounts in backing the campaigns of the lawmakers who levy those taxes. The party would appeal to grassroots capitalists, investors, small banks and their customers who feel excluded from the Washington-sanctioned insiders' game. The popular appeal is there. The Tea Party, of course, began as a response against TARP.

Instead, the party nominated a Wall Street patrician, Mitt Romney, whose idea of populism seems to be donning a well-pressed pair of jeans and a work shirt.

Romney himself is so clueless as to be touting his strong fund-raising with big finance. His top contributors list reads something like a rogue’s gallery from the 2008 crash: Goldman Sachs, JPMorgan Chase, Morgan Stanley, Credit Suisse, Citicorp, and Barclays. If Obama’s Hollywood friends wanted to find a perfect candidate to play the role of out-of-touch-Wall Street grandee, they could do worse than casting Mitt.

With Romney to work with, David Axelrod’s dog could design the ads right now.

True, some of the finance titans who thought Obama nifty back in 2008 have had their delicate psyches ruffled by the president’s election-year attacks on the “one percent.” But the “progressives,” now tethered to Obama’s chain, are deluding themselves if they think the president’s neo-populist rancor means much of anything. They get to serve as what the Old Bosheviks would have called  “useful idiots,” pawns in the fight between one group of oligopolists and another.

This division can be seen in the financial community as well. For the most part Obama has maintained the loyalty of those financiers, like Rattner, who seek out pension funds to finance their business. Those who underwrite and speculate on public debt have reason to embrace Washington’s free spenders. They are also cozy to financiers like John Corzine, the former Goldman Sachs CEO and governor of New Jersey, whose now-disgraced investment company MF Global is represented by Attorney General Eric Holder’s old firm. 

The big-government wing of the financial elite remains firmly in Obama’s corner, as his bundlers (including Corzine) have already collected close to $20 million from financial interests for the president. Record support has also poured in from Silicon Valley, which has become ever more like a hip Wall Street west. Like its east-coast brethren, Silicon Valley has also increased its dependence on government policy, as well-connected venture capitalists and many in the tech community  have sought to enrich themselves on the administration’s “green” energy schemes.

Romney, on the other hand, has done very well with capital tied to the energy industry, and others who invest in the broad private sector, where government interventions are more often a complication than a means to a fast buck. His broad base of financial support reflects how relatively few businesses have benefited from the current regime.

Who loses in this battle of the oligarchs? Everyone who depends on the markets to accurately give information, and to provide fundamental services, like fairly priced credit.

And who wins? The politically well-situated, who can profit from credit and regulatory policies whether those are implemented by  Republicans or Democrats.

American democracy and the prosperity needed to sustain it are both diminished when Wall Street, the great engineer of the 2008 crash, is all but assured of victory in November.

Joel Kotkin is executive editor of NewGeography.com and is a distinguished presidential fellow in urban futures at Chapman University, and contributing editor to the City Journal in New York. He is author of The City: A Global History. His newest book is The Next Hundred Million: America in 2050, released in February, 2010.

This piece originally appeared in The Daily Beast.

Wall Street bull photo by Bigstockphoto.com.

Vermont's 'New Agriculture': Mini-Farms and the Urban Boundary

$
0
0

The “new agriculture” is typically small-acreage, intensively-managed, organic (in contemporary terms) in that it avoids both chemical use and genetic modification, and uniquely adaptable to such practices as niche-market services, consumer associations (community-sharing) and pick-your-own. One could argue that it won’t supplant present-day large-scale commercial generic-commodity agriculture any time soon. But one should also recognize that, if industry observers are correct in gauging the size of this producer-to-consumer sector at 20% of the total, then, logically, rural land-use planning ought to be moving to recognize this “new normal” and providing for it in statute and regulation.

Just the opposite seems to be happening. The so-called “Smart-Growth” doctrine, opposed to traditional low-density suburban development for both residential and commercial land use, now seems to favor smaller lots for residential and commercial use. No more wooded and lawned exurban campuses for business, manufacturing, or research; no more large-lot trophy-house-or-less subdivisions, but very large indeed minimum lot sizes in beyond-the-new-city-wall farmland.

In Oregon, for example, the minimum farm-lot size is 80 to 160 acres, and is described in various studies of Oregon’s land use laws as the smallest presently acceptable to the State Land Conservation and Development Commission. The same regulatory body calls for a minimum residential lot size of 20 acres for areas beyond the adopted Urban Growth Boundaries, “…to help contain Oregon’s growing urban population inside the growth boundaries”. Similar regulations in Illinois and Pennsylvania call for 40 and 50-acre minimum farm-lot sizes. And these lots come with residential prohibitions. In Oregon, for example according to The Cascade Policy Institute, there’s a State regulation “…requiring a piece of property zoned as high-value farmland to generate $80,000 in annual sales before a dwelling can be built for the farmer.”

Translated this to a generic-commodity crop like corn, more typically associated with large-scale commercial farming than with small-acreage mini-farms. The 80 acres, if farmed to match the recent new-high national average yield of 160 bushels per acre, and selling at a recent $6 per bushel,, would be generating 160 x $6 x 80, or $76,800.

This means that a typical Midwestern Corn Belt corn-grower wouldn’t be welcome as a new resident in Oregon’s Willamette Valley, a notably gentrified rural district comparable in size and population (not counting the urban populations) to such enclaves as Virginia’s Shenandoah Valley and, some would argue, the entire State of Vermont. The Willamette Valley is well-known in oenophile circles for its more-valuable-than-corn bottled product. A vineyard operator with an 80-acre operation there would easily meet the $80,000 (that’s a gross of $1,000/acre) threshold benchmark and be permitted (literally) to build a house for the owner.

Whether operators of mini-farms in the ¼ to 10-acre range (as defined by the titles of advisory books which offer author advice on “X Acres and Independence”) can generate $1,000 per acre depends on, among other factors, production choice. Pastured beef is certainly less likely than row-crop broccoli.

Judging by the percent of all farms, large to small, which are reported by the USDA to derive some 90% of household income from off-farm non-farm jobs, a safe guess for mini-farmers as a sub-group would be “not likely”. And even if they could gross $1,000 per acre, doing so on, say, five acres (a guessed-at average; we have no official stats, although the USDA tells the that the 0-50 acre category is increasing) doesn’t suggest economic “independence” in comparison to recent Bureau of Labor Statistics stats for median US household income in the $50,000 range.

And, of course, if there are any mini-farms in the 80-acre size, they would be extremely few in number and far off on the right-hand side of the size-distribution bell curve. That’s for another reason: labor.

All the qualities associated with “the new agriculture” indicate more intensive management time and effort than for more traditional, large-lot commodity agriculture, with its dependence on 10- and 12-row equipment to enable a single operator with minimal help to produce at large scale, The typical mini-farm operator-plus-household simply couldn’t apply the same level of intensive management at an 80+acre level as they can at the ever-more-widely-practiced 5-acre level. With the exception of some designed-specifically-for-small-operations equipment like cultivators and harvesters (and sold mostly to Third World operators), there’s no equipment yet invented to replace the grower touch in dealing with any produce from flowers and table crops.

Oregon’s farm-zoning requirements — not less than 80 acres in farm size, not less than $80,000 in annual gross revenues; add in the built-in labor question — all seem specifically designed to prevent mini-farm-based rural land use practices, and to encourage instead a more limited range of larger-scale choices. These range from commercial-scale vineyards, to mechanizeable operations like sod and organic wheat, and relatively low-labor-requirements-per-acre operations like beef grazing, All of the above are hardly do-able, economically, at the typical small-acreage scale of the usual mini-farm. The question then becomes the reasoning behind the State government’s land-use-management decision.

Two possibilities, seemingly improbable but both historically based, come to mind.

One posits the competition-prevention scenario; the concern over loss of control of any part of the eventual consumer dollar. “New Ag” and its mini-farms have, over the last two or three decades, raised their “market share” from insignificant to, some observers claim, as much as 20%.In this view, any new farm-stand just outside the “urban growth boundary” is a dollar-for-dollar challenge to the established retailers, distributors, and processors, and even the commodity brokers and buyers in the business chain that ends at the already-established retail check-out counter well within the “urban growth boundary”.

In recent history, this concern first showed up in Vermont in the ‘70s, when grocery-chain lobbyists attended a raw-milk-ban proposal hearing in force to proclaim that their only concern was “public health” and that, for consumer safety, all milk should be legally required to move from farm to home through their channels alone. Across the nation now, as do-it-yourself or sell-to-neighbors enterprises such as urban poultry flocks or home-baked pies at farmers markets show, legal attempts at prevention (supposedly on behalf of consumer health, but more evidently on behalf of food retailers, almost universally) now take place. For states to respond to industry lobbying pressures for new rural-land-use planning supposedly for preservation of farmland, but actually for preservation of market share, would not be an unreasonable speculation.

The other posits a tilt towards favoring land acquisition by a wealthier and more gentrified sector of society, as opposed to the sorts of folks who established small-acreage live-off-the-land communes and collectives in the ‘60s. Setting the cost-of-entry and cost-of-stay high enough encourages the former and discourages the latter, precisely as large-lot residential zoning (and even minimum-house-size requirements) did in the more self-consciously exclusive Northeastern suburbs in the '70s.

Seen in that light, an 80-acre rule which works well for private-label vineyards and not well for self-sufficiency home-steaders, organic or otherwise, makes some logical sense. Just as different jurisdictions adopt different residential lot (and housing) sizes, it’s probable that some States will pursue the Oregon 80-acre farm-lot model and some won’t. But the economic purchasing power of the consuming 20% now eager to buy organic veggies at farmers’ markets won’t go away.

Expect some insufficiently-successful vineyard operator near Portland to sub-divide his eighth-section (a little archaic surveyor’s lingo, there; the Homestead Act of 1862 prescribed operation of 160-acre quarter-sections) into 15 little 5-acre leased farmettes, at a total ground rent high enough for the $80,000 annual-revenue permit to build his own mini-mansion on the 16th.

Flickr Photo by Rick Skully: Uphill view of Four Springs Farm, Windsor County, Vermont. At the top of the photo is the outdoor kitchen.

Martin Harris is a Princeton graduate in architecture and urban planning with a range of experience in fields ranging from urban renewal and air-industrial parks to the trajectory of small-town planning and zoning in states like Vermont.

Sex (Or Not) And the Japanese Single

$
0
0

Back in June 2011, British prime minister David Cameron backed proposals tackling the sexualisation of British children, in a bid to dilute the culture of sex that has swept western nations. The rhetoric goes that the ‘oversexualisation’ of society, as represented in everything from ‘lads mags’ to advertising boards promoting shampoo, has fuelled a surplus of sexual desire that is thought to have contributed to the rise of teenage pregnancy and rape cases in the UK.

Compare this to Japan, a country where, according to a recent survey, a third of young men have no interest in sex. Moreover, 50% of young women are not dating. Could this be an ‘undersexualised’ society? Has this impacted Japan's population geography?

In 2007, Japans population reached a tipping point. It was the first year in its history (excluding 1945) where the number of deaths exceeded the number of births. In 2007 there were 2,000 more deaths than births. In 2011 that figure rose to approximately 204,000, and it's a figure that is accelerating. Indeed, at 23.1%, Japan has the highest proportion of over-65s in the world, and at 13.2%, the world's lowest proportion of under 14s. Japan's population peaked at 127.7 million in 2007, and is forecast to shrink to a mere 47 million by 2100. What are the economic and social forces behind this?

Too much work, too little sex: Japan is a country where sales of adult diapers exceed child diapers, and where more public money is spent on healthcare than defence. It's also one of the world's most industrialised countries, with an agricultural sector comprising 1.5% of its GDP and services sector comprising 75.7% of GDP. For Japanese society, this means that a white collar lifestyle predominates. High salaries with high workloads in an already expensive country has meant that starting a family has become a low priority, if a priority at all, on a Japanese professional’s wish list. The little available data on the reasons why indicates that raising a child is too expensive, and that the pressure of work leaves little time available to look after anyone other than themselves.

Compounding this battle between a high flying job versus a family is a culture somewhat void of sexualisation. It is unlikely that, on a stroll through Tokyo, you will come across much imagery that is overtly sexual. In contrast with the west, sex doesn’t sell in Japan. Among males 16 to 19 year old, 36% have no interest in sex, and some even despise it. The figure is even higher (59%) for females in the same age category. These respondents often cite greater interest in comics, computer games and socialising through the internet. A low level of cultural sexualisation is not without its benefits; the rape rate is one of the lowest in the world.

However, the net result of these socio-cultural and economic factors is that the fertility rate is astonishingly low. According to the UN the figure is 1.27.

Japan is therefore facing a demographic crisis. The number of dependents per active member of the labour force is increasing, and in an unusual situation, there are more jobs available than people to do them. Furthermore, in future decades Japan may have an oversupply of infrastructure relative to the amount of people who can use it.

Several policy options could be under consideration by Japan's decision makers. Not all of these are practical or even advisable, but we may see them looked at in years ahead:

Encourage Fertility – This would help ensure that the labour market and services such as transport are not undersupplied. It can be done in at least three ways. The first is through pro-natal incentives, such as child tax breaks for couples who desire children. The second is to restrict or even ban abortion (Japanese abortion laws are some of the most liberal in the world). For example, restrict abortions to the first trimester only. Laws such as these will inevitably conflict with women's and couples rights. The third, and perhaps the most untried, is to sow the seeds for a more sexualised Japanese culture, one with more lust and desire, in an attempt to situate relationships as more desirable than the latest computer game.

Encourage Migraton – Japanese immigration and emigration have both been low. The ethnic mix of Japan is not diverse. 98.5% of Japan's population is ethnically Japanese, with only a few other ethnic groups. In order to prevent an undersupply of labour, the country may have to encourage mass immigration. Given the unique culture and language of Japan, will foreigners want to come and live there? Would immigration cause ethnic tensions in this peaceful country?

Raise the Retirement Age – It has been calculated by United Nations researchers that the retirement age in Japan would have to be raised to 77 from 65 in order to rebalance its crippling dependency ratio. This would shorten the average amount of retirement years from 14 years to two for men, and from 19 years to seven for woman.

A blueprint for the rest of the world? Is Japan's pattern of rising, peaking, and falling gross population going to be a defining demographic trend in the 21st century? In Japan, Germany, Russia, Czech Republic, Estonia and several more countries it already is, with several other low growth European countries, such as Italy, forecast to head the same way.

Low sexualisation is unlikely to be an important factor of low growth in Europe. The worldwide trends of continued urbanisation, the growth of white collar jobs, and the decline of blue collar jobs as an overall percentage of the economic makeup have acted as the most effective mass contraception.

Given a course of continued social and economic development around the world, the ‘tipping point’ for world population could be as near as 2050, a date that many of the readers of this article could be witnessing.

The rhetoric of overpopulation doomsday scenarios should really be reversed. The warnings today should be about the unsustainable dangers of a shrinking population. This will no doubt be one of the key issues in sustainable development discourse for years to come.

Edward Morgan is a 4th Year Human Geography student at the University of St Andrews, Scotland.

Photo by Kevin Poh: Night Life @ Shinjuku, Tokyo

The Evolving Urban Form: Istanbul

$
0
0

Istanbul is unique in straddling two continents. The historical city was concentrated on the European side of the Bosporus, the wide, more than 20 mile long strait linking the Sea of Marmara (Mediterranean Sea) in the south to the Black Sea in the north. Nearly all of the historic city was located on a peninsula to the south of the Golden Horn, an inlet off the Bosporus. By 1990, the urban area had expanded to occupy large areas on both sides of the Bosporus.

The Urban Area

Istanbul, like many other developing world urban areas, has grown rapidly since World War II. In 1950, the urban area contained a population of less than 1,000,000. That is similar to the present population of urban areas like Edmonton, Adelaide and Raleigh. By 2012, the urban area had   a population of nearly 12.7 million.

Few of the world's cities boast a more storied history than Istanbul. It started as the Greek colony of "Byzantium," in the 7th century, BCE. By the fourth century, CE, Byzantium , taking advantage of Rome's decline, was designated capital of the Roman Empire by the Emperor Constantine. The city was subsequently renamed "Constantinople." The final name change, to "Istanbul," was finalized in the early years of the post-Ottoman Empire Republic in the 1920s.

Constantinople became capital of the Eastern empire. Constantinople eventually emerged as the seat of Eastern Christianity (Easter Orthodoxy) and remains so today, despite more than 500 years of Islamic predominance under the Ottomans and later, the Republic of Turkey.

Like many ancient cities, Constantinople experienced wide swings in population, reaching 400,000 in 500 C.E. then dropping to under 50,000 by the time of the Ottoman conquest (1453). But the conquest proved a boon to the city.

By 1550, the population had risen to 660,000. At the time only Beijing was larger (690,000). At that point, the city walls (the present district municipality of Fatih) and urbanization north of the Golden Horn amounted to an estimated six square miles (15 square kilometers), for a population density of approximately 110,000 per square mile (42,500 per square kilometer). Such hyper-densities were typical of pre-1800 cities, when walking was the predominant mode of transport. Some older cities were even more dense:  17th century, Paris approached 175,000 per square mile (67,000 per square kilometer (Note: Walking Cities)


Caption: Sultan Ahmed Mosque (Blue Mosque), 17th Century, CE

In the ensuing centuries, the urban area grew modestly to less than 1,000,000 in 1950, when the urban population density fell to 40,400 per square mile (15,600 per square kilometer). Rapid growth was to follow to today's more than 12 million, along with a further drop in urban density, to 24,300 per square mile or 9,400 per square kilometer (Note: The Density of Istanbul). The physical expansion of the urban area now stretches north all the way to the Black Sea (Figure 1 shows the present extent of the urban area and the 1950 urban area). Over the 60 years, the urban area population grew more than 12 times, but the urban land area grew nearly 21 times (Table 1). Istanbul demonstrates the near universal truth that as cities grow, they become less dense  (Figure 2).


Table 1          
Istanbul Urban Area: Population & Density from 1550    
Year Population in Millions Land Area: Square Miles Land Area: Square Kilometers Density:Square Mile Density: Square Kilometer
1550 0.66 6 16 110,000 42,500
1950 0.97 24 62 40,400 15,600
2012 12.66 520 1,347 24,300 9,400
           
Change: 1550-1950 47% 288%   -63%  
Change: 1950-2010 1205% 2073%   -40%  


At United Nations projected growth rates, the urban area should approach 18 million by 2025 (Figure 2). There are reports of increased migration to Istanbul from Asian Turkey, which if continued, could make the 2025 figure even higher.

The Metropolitan Metropolis and Province

Istanbul is a both a metropolitan municipality and a province and can be considered a metropolitan area (labor market area). The province, most of it rural, covers land area of more than 2,100 square miles (5,300 square kilometers) and had a population of approximately 13.5 million according to the 2011 census. The urban area (area of continuous urban development) is much smaller, at only 520 square miles (1,347 square kilometers). Nearly all the population is concentrated in the urban area.

Since 1985, the metropolitan area's growth largely has been outside the core. The historic core, on the peninsula (Fatih), lost 27 percent of its population, while the balance of the core, district municipalities to the north of the Golden Horn and to the west, lost 5 percent. Such core area losses have frequently occurred in many  major metropolitan areas   (for example, Osaka, Seoul, Mumbai, Chicago, Milan, Buenos Aires, and Mexico City).

The inner ring, including district municipalities further to the west and north of the core on the European side and municipalities on the Asian side have captured nearly all the growth. From 1985 to 2011, inner ring district municipalities added 5,000,000 residents. The outer ring of suburban district municipalities gained 2.5 million residents with the greatest percentage growth, at nearly 250 percent. There has also been growth in exurban district municipalities (beyond the urban area), though it has been much more modest (Figure 4 and Table 2).


Table 2          
Istanbul: Population Growth by Sector: 1985-2012  
           
    1985 2000 2011 Change: 1985-2011
 Historic Core: Fatih             591          459          429 -27%
 Balance of Core          1,336      2,175      1,270 -5%
 Inner Ring          2,635      5,747      7,800 196%
 Outer Ring          1,044      2,424      3,598 245%
 Exurbs               147          240          386 162%
 Total            5,753    11,045    13,483 134%
           
 Population in 000s         


Ascendant Asia

While European Istanbul has been dominant for millennia, it is perhaps fitting that Asian Istanbul is on the rise, with nearly 40 percent of the population, up from 31 percent in 1985. Asian Istanbul was made substantially more accessible by the first bridge over the Bosporus (1973).

Linking Istanbul

Istanbul is served by two major east-west freeways. Each (the O-1 and O-2) both have their own crossings of the Bosporus. Other freeways feed these both in Europe and Asia. The development of the mass transit system is somewhat curious. The inner Fatih area and Beyoğlu contain the historically most important commercial centers. However, they are being fast replaced by new skyscraper developments in Levent and Maslak. This is similar to the emergence of newer commercial cores that have become more important the older cores, such as in Mexico City, Sao Paulo, Beijing, and Manila, where multiple, large cores have grown.

Yet, Istanbul's urban rail system keys on the old commercial centers. Both Levent and Maslak are located on a single Metro line, which makes them less convenient than if radial lines were being built to these centers instead. Both centers have good road access. Levent is located between the O-1 and the O-2 motorways, while Maslak is located just north of the O-2.

A passenger rail tunnel between Asia and Europe, the first, is scheduled for opening to Fatih in 2015. Local authorities predict that this and other pending projects could increase the share of trips by rail in Istanbul from 3.6 percent to as much as 27.6 percent. No such market share increase has ever occurred in the world since automobiles have become widely available. Further, like Istanbul's transit system in general, the project will not provide direct service to Levent or Maslak.

Becoming Europe's Largest Urban Area

Istanbul has always been considered European and remains so even with its huge suburbs in Asia. Istanbul trails Moscow as Europe's largest urban area, but by 2025 should be the largest. Indeed, it seems likely that Istanbul will be the only European urban area to reach a population of 20 million, as much of Europe faces stagnant or even declining population.

Wendell Cox is a Visiting Professor, Conservatoire National des Arts et Metiers, Paris and the author of “War on the Dream: How Anti-Sprawl Policy Threatens the Quality of Life.”

--------------------

Note: Walking Cities: Walking constrained the physical expansion of cities, and thus the population. As result, few pre-1800 cities reached 1,000,000 population and most were not able to sustain that level. The great expansion of urban areas followed, as walking was replaced by the more efficient transport modes of transit and automobiles, both of which permitted a sizeable expansion of urban footprints and labor markets. The subsequent economic growth is legendary and accounts for having attracted so many people from the countryside. In 1800, estimates suggest that urban areas contained under 10 percent of the world population. Today, the figure is 52 percent, according to the United Nations. This includes all urbanization, from the largest cities to the smallest towns.

Note: The Density of Istanbul. The province, most of it rural, covers land area of more than 2,100 square miles (5,300 square kilometers) and had a population of approximately 13.5 million according to the 2011 census. The urban area (area of continuous urban development) is much smaller, at only 520 square miles (1,347 square kilometers). This article highlights the urban density of Istanbul, which is the population per square mile or square kilometer. Other sources cite much lower figures, for the province/metropolitan municipality (metropolitan area). However, metropolitan area densities are not urban area densities. Metropolitan areas virtually always have more rural land than urban land, so their population cannot be included in calculations of urban density. The population and density noted above is based upon the 2011 census and will be reflected in the next edition of Demographia World Urban Areas.

Photo: Hagia Sophia (Santa Sophia) Church (now museum) built by Justinian (6th Century CE). Photos by author.

Is California the New Detroit?

$
0
0

Most Californians live within miles of its majestic coastline – for good reason. The California coastline is blessed with arguably the most desirable climate on Earth, magnificent beaches, a backdrop of snow-capped mountains, and natural harbors in San Diego and San Francisco. The Golden State was aptly named. Its Gold Rush of 1849 was followed a century later by massive post-war growth.

There is no mystery why California’s population and economy boomed after the Second World War. Education in California became the envy of the world. California’s public school system led the nation in innovation with brand new schools and classrooms. The Community College system that fed its universities was free for its students. A college education at the UC and Cal State systems was inexpensive. UC-Berkeley, with its graduate schools, was arguably the greatest in the world while Stanford developed into the Harvard of the West. An efficient highway system moved California’s automobile driven commerce while fertile soil of the Central Valley became the fruit and vegetable basket of the world.

The next wave hit in the 80s as former orchards south of San Francisco morphed into the Silicon Valley. Intel and other chip manufacturers led the computer and software revolution bringing high tech jobs and immense new wealth to the Golden State. The dot-com revolution of the 90s brought more gold to California. Innovators like Google and Apple cashed in by nurturing the Internet era. The next decade heralded the greatest housing and mortgage boom in the nation’s history. Developers from Orange County, south of Los Angeles, invented creative financing vehicles that drove home sales, and profits, to record heights by 2006.  
 
This success has created a problem: Californians, due to their golden history, live unreflective lives. The Tea Party movement generated a political tsunami that swept more than 60 incumbents from political office in 2010, but the wave petered out at California’s state line as Democrats take every elected office in the state.

The state budget, mandated to balance by law, has been billions in the red for ten straight years. Yet Californians re-elect the same politicians, year after year, who produce budgets with multi-billion dollar deficits. California voters rejected Meg Whitman, the billionaire founder of Ebay, in favor of Jerry Brown. California now has a $16 billion deficit which “assumes” that California voters will pass massive tax increases on themselves. If they do not, the 2013 deficit becomes a mind numbing $20 billion. Yet despite the red ink, Governor Brown signed into law a “high speed rail” bill that will spend $6 billion on a train between Fresno and Bakersfield – not LA and San Francisco as promised. Polls turned against the choo-choo, but there remain no outcry from California voters.

California voters rejected Carly Fiorina, who ran Hewlett Packard, for Barbara Boxer in the 2010 Senate race. To protect the endangered Delta Smelt, a fish known better as bait, water has been diverted from Central Valley farms to the Pacific Ocean. Orchards in the Central Valley were allowed to wither and die resulting in unemployment in the Central Valley as high as 40%. Imagine Californians on food stamps, living in what was the fruit basket of American.  

California’s business climate now ranks dead last according to 650 CEOs measured by Chief Executive Magazine. Apple will take 3,600 jobs to its new $280,000,000 facility in Austin Texas – jobs that California would have had in the past. Texas ranked first in the same survey. California’s unemployment rate is consistently higher than 10% of its work force, and there are few jobs for college students who graduate with as much as $100,000 in student loans. Despite overwhelming evidence that bad public policy is chasing away jobs, the same state politicians are sent back to Sacramento every two years.

California’s public education system, once the envy of the world, now ranks 46th in the nation in per pupil spending and faces a $1.4 billion cut in the fall. In the last month, three California cities declared bankruptcy. More will follow. Take Poway for example. Its school board borrowed $100,000,000 (for 33,000 students) through a Capital Appreciation Bond. The politicians told the voters there would be no payments for 20 years. What they did not explain was the residents must pay back $1 billion dollars on their $100 million loan. Beginning in 2021, tiny Poway will be forced to pay $50 million per year in bond payments. Huge property tax assessments will be required if homes do not appreciate 400% by then, which is unlikely under foreseeable circumstances.   

Rather than stare at themselves in the mirror, Californians should take a look at Michigan. In the 50s greater Detroit was the fourth-largest city in America with 2 million inhabitants and the world’s most dominant industry: the automobile.

Most people had a good paying job. Its burgeoning middle class was the model of the world with excellent public schools and universities. Detroit in 2012 is a shadow of that once great metropolis. Its population has shrunk to 714,000. The average price of a home has fallen to $5,700. Unemployment stands at 28.9%. It has a $300,000,000 deficit. There are 200,000 abandoned buildings in the derelict city. Its public education system, in receivership, is a disgrace producing more inmates than graduates. In 2006, the teacher’s union forced the politicians to reject a $200,000,000 offer from a Detroit philanthropist to build 15 new charter schools. Jobs long ago abandoned Detroit for places like South Carolina and Alabama, with their “right to work” laws and low taxes.

Now Detroit’s Mayor has proposed razing 40 square miles of the 138 square miles of this once great American city returning 70,000 abandoned homes to farmland. Even such a draconian plan may not be enough to save the city. If a hurricane had hit Detroit, more of us would know of this tragedy in our midst, but this fate was man-made and not wrought by nature. Detroit has had one party rule for more than fifty years. Louis C. Miriani served from September 12, 1957 to January 2, 1962 as Detroit's last Republican mayor. Since that time the Democrats have ruled the Motor City.  John Dingell has served region since 1956. His father was the Congressman from 1930 to 1956. Despite the disastrous decline of their city, Detroit voters send him back to Congress twenty-two times.

Like Detroit, California now has one party rule. The Democrats of California did not need a single Republican vote to pass their budget. Governor Brown’s plan is to address the nation’s largest deficit by raising taxes instead of cutting spending. If passed, the deficit would drop from $20 billion to a mere $16 billion. The budget does nothing to cure the systemic problems of a bloated bureaucracy. It does not eliminate one of California’s 519 state agencies.  

Caltrans stopped building highways under Brown’s first term, but the people kept coming. Now 37 million Californians are locked in traffic jams each day. Brown was rewarded for such prescience with re-election as Governor. California’s egotistical politicians passed the Global Warming Solutions Act in 2006 (AB32) to “solve” climate change. Dan Sperling, an appointee to the California Air Resources Board (CARB) and a professor of engineering and environmental science at UC Davis, is the lead advocate on the board for a “low carbon fuel standard.” The powerful state agency charged with implementing AB 32 and other climate control measures, claims the low carbon fuel standard will “only” raise gasoline prices $.30 gallon in 2013. The California Political Review reported implementation of these the policies will raise prices by $1.00 per gallon.

Detroit was once the most prosperous manufacturing city in the world, a title later secured by California.    Will California follow Detroit down a tragic path to ruin? In 1950, no one could imagine the Detroit of 2010. In 1970, when foreign imports started to make a foothold, the unions and their bought and paid for politicians resisted any change. In the 1990s as manufacturers fled to Alabama and South Carolina, the unions and their political minions held firm, even as good jobs slipped away. No one in Detroit envisioned their future.

Today, California is following Michigan’s path with exploding pension obligations, a declining tax base, and disastrous leadership. Housing prices have fallen 30 to 60% across the state, evaporating trillions of dollars of equity and wealth. Unemployment remains stubbornly high and under-employment is rife. Do our politicians need any more signs?

Governor Brown’s budget will first slash money to schools and raise tuition on its students while leaving all 519 state agencies intact. He apparently will protect political patronage at all costs. Jobs, and job creators, are fleeing the state. Intel, Apple, and Google are expanding out of the state. The best and brightest minds are leaving for Texas and North Carolina. The signs are everywhere. Meanwhile, the voters send the same cast of misfits back to Sacramento each year – just as Detroit did before them.

The beaches are still beautiful. The mountains are still snow capped and the climate is still the envy of the world. Detroit never had that. But will California’s physical attributes be enough? If the people of California want to glimpse their future, they need look no farther than once proud City of Detroit and the once wealthy state of Michigan.

It can happen here.

Why I Do Live in Indianapolis

$
0
0

When a friend constantly tells you how much he or she likes you and then one day says, “But I’d never live with you,” the predictable reaction is to feel hurt and angry. That’s how I felt when The Urbanophile posted “Why I Don’t Live in Indianapolis.”

But last night, while riding my bike on one of Indianapolis’ many bike trails (yes, we have them), I started thinking about why I do live in Indianapolis. The answer surprised me.

While I honestly buy into the quality-of-life, amenity-based strategies that are all the rage these days, that’s not how I arrived here. I live in Indianapolis because I grew up in the Indiana part of Chicago and my late wife grew up near Fort Wayne. We chose Indianapolis because it was close to our families and we had job offers – simple as that. This decision is even more stunning because just a few years earlier, I’d visited Indianapolis for the first time and went home convinced that I would never live in a city that only had one tall building and appeared to be virtually empty at night.

When I moved to Indianapolis, I had no idea that the new mayor had a vision that Indianapolis could rebuild its downtown, obtain an NFL team and one day host a Super Bowl. I had no idea whether the city wanted to be great or accepted mediocrity. And I certainly didn’t base my decision on the architectural design of a parking garage.

I also didn’t grow up dreaming of life in a specific city. When I asked some friends (admittedly not a big or random sample), I found only one who dreamt of living in a specific place. That place: New York City. That friend’s current residence: Nashville, Tenn. Turns out my friend lives in Nashville because it’s reasonably close to family and he had a job offer. Most everyone I talked with told me the same story. Maybe this is because we grew up Midwesterners—and as ESRI’s human tapestry data tells us, we are more likely than those who live elsewhere to value family, tradition and stability. But the key point is our choices weren’t predicated on urban amenities or ambitions. They were all about location and employment. I’d wager that most of us – yes, even us pro-amenity types – are less idealistic in our choices than we profess to be.

This is not to argue that high-quality amenities and bold visions are unimportant. But for those who initially decide where to live based on more practical and personal considerations, it may mean that urban amenities and ambitions are more important to retention than they are to attraction. If so, then a key issue is what residents – rather than potential residents – value in a community. Prior to reading The Urbanophile post about Indianapolis, I wouldn’t have thought that.

Cities, in a way, are like households: What’s our priority? For most of us mortals (maybe not global cities or the “one percenters,”), the answer involves compromise. I might choose to buy a great TV and a nice driver for my golf game. A neighbor might choose a fast car. Another might choose to travel. What we choose doesn’t determine whether we’re striving. We might all be striving, yet we can’t have it all. The same holds true for a community.

So how did Indianapolis advance from that city with one tall building to a city able to dazzle and delight as Super Bowl host? Choices. Compromises. We chose to focus our ambitions and our resources on a sports-based, downtown-festival-marketplace strategy. It’s worked – repeatedly – with the Super Bowl being the latest and greatest sign of success.

Now it’s time to build on what’s working, and to turn our sights to what’s next. Part of moving on likely will be to sustain, enhance and further capitalize on a great downtown – one that’s more appealing to current and prospective urban dwellers. That’s where the new parking garage comes into play – the one the Urbanophile and others so dislike.

The garage, as best I understand, is being developed to rid us of three large asphalt surface lots in the heart of downtown. Good riddance! That, in turn, will clear space for an additional downtown grocery store and more downtown housing. Good additions!

I’m all for quality design. But given a choice – the kind of compromise required of cities and households – the developers of these three blocks chose to focus on the grocery store and the housing without stressing a world-class garage.

In a world of limited means and compromise, does the design or lack of design in a parking garage indicate an entire city’s failure to strive? Or does it reflect a practical desire to balance ambition, cost, and progress? Put another way: If the choice was a nicer garage and a less-grand grocery and housing development, would that be better? If some think the garage should have first-floor retail space, but there is already a glut of unused retail space nearby, should one include it in the design for design’s sake, knowing it likely would sit empty?

While most responses to The Urbanophile article were about design, another key point was urban aspiration. On that point, Indianapolis and many other Midwestern cities have reached a critical moment as they seek to balance the notion of striving with the realities of living within their means. As they choose and compromise, it doesn’t mean that Indianapolis and its counterparts are lacking in ambition any more than a family balancing the cost of a Caribbean cruise vs. sending the kids to college.

Sure, some in Indianapolis would let the lack of resources limit ambition. Others would have us aspire without considering cost. Still others will realize that finding the money – even in the toughest economies – is a measure of our city’s commitment to aspire.

In all likelihood, though, compromise will be necessary. While many look down on the notion of compromise, I think of it as the key component of incremental progress and the failure to compromise as the enabler of inaction. When choices must be made, it’s critical that incremental progress be viewed from two perspectives: How far have we come and how our progress compares with that of other communities.

In the final analysis, each city is likely to make different compromises. Ideally, those compromises reflect the current demands and long-term aspirations of their citizens and institutions. Some may choose well-designed parking garages. Others will focus on neighborhoods, parks, schools or some combination of services and amenities. Those with internal perspectives will view progress as change over time. Those who think more globally will choose to measure progress relative to other cities.

Is Indianapolis perfect? Nope. Could and should it try harder? Yes. Should it seek to get more people and, thus, more perspectives involved? Of course. Should, it keep in mind that it is competing globally for human capital and private investment? Yes again.

But like many, non-global Midwestern cities, Indianapolis will have to make choices and compromises. In so doing, it will pursue a strategy that’s different from other places, and those differences won’t appeal to all.

Ricky Nelson once sang, “You can’t please everyone, so you got to please yourself.” I’m pleased to look at it this way: For some, Moby Dick was just a whale; for me, the parking garage is just a parking garage, but a new urban grocery and more downtown housing that is incremental progress.

Drew Klacik is a Senior Policy Analyst at the Indiana University Public Policy Institute.

This piece originally appeared at The Urbanophile. It is a response to "Why I Don't Live in Indianapolis" by Aaron M. Renn.


Cities of Aspiration

$
0
0

Drew Klacik’s recent post on how he ended up in Indianapolis got me thinking about the unique status of what I’d describe as “cities of aspiration.” Pretty much all cities seem to be reasonably good at attracting people in the following cases:

1. Recruiting someone to a specific career or other opportunity. In this case, the value of the opportunity is really the question at stake. The attractiveness of the community itself is generally a secondary consideration though may have an impact pro or con.

2. Luring residents based on a family connection. This would often be the case for “boomerang migration” – people who left and came back, ordinarily after marriage and children. More broadly we could think of this as retaining or attracting those with a historic connection to a place, such as being born there.

3. Drawing people from a city’s natural catchment area. The size of this area depends on a variety of factors, but pretty much every city has some natural hinterland from which it draws people.

I call this the “normal model” of attraction. Clearly, a place like Indianapolis does well on all of these types of attraction, as do most similar sized cities I’d argue. That’s how Drew ended up in Indy.

However, there’s another basis of attraction. This is what I call “aspirational attraction” – it’s people deciding to move or desiring to move to a city from outside of its natural catchment area despite a lack of a job offer or historical connection. I see this as based in one of three primary motivations:

1. Desire to work in a particular industry that is centered in a particular location. Want to be a country musician? Moving to Nashville helps. Similarly, if you want to be an actor, New York, LA, or Chicago are basically your only options.

2. Desire to live in a particular city for lifestyle reasons. Portland would be the paradigmatic example here. People sure don’t move there for its job market.

3. Desire to live in a city because of its reputation for a rapidly growing economy or superior job market. Many of the Sun Belt boomtowns might fall into this category. They’ve got similar quality of life to many other places, but their robust job markets (and perhaps a bit of nicer weather) draw people in.

Clearly, there are comparatively few places that function as a aspirational cities in a meaningful sense.

Back to Drew’s piece, I don’t want to put words into his mouth, but my impression was that he sees Indianapolis having a strong “normal model” of attraction but not functioning as an aspirational city. I agree. More than 80% of Indy’s net domestic in-migration comes from elsewhere in Indiana, the city’s natural catchment area, and it isn’t hard to believe that specific opportunities and boomeranging account for almost all the rest. Perhaps the implication of his notion of tradeoffs is that if a city like Indy isn’t aspirationally attractive, you have the luxury of compromise since you probably already have a lock on the market you’re currently capturing. That’s a perfectly valid conclusion to reach, IMO.

A very serious question cities that function nearly exclusively as normal attractors need to ask themselves is whether they desire to become aspirationally attractive. If so, then some exploration of the basis of that, and a realistic assessment of whether or not it is possible is important to undertake. Included in this would be the implications of not becoming aspirationally attractive. It seems to me that not having some type of aspirational component to your city’s attractiveness ultimately puts a ceiling on what it can achieve. On the other hand, it is far from clear that it’s easy to consciously create an aspirational value proposition where none currently exists.

Aaron M. Renn is an independent writer on urban affairs and the founder of Telestrian, a data analysis and mapping tool. He writes at The Urbanophile, where this piece originally appeared.

Photo: sparktography

Form Follows Zoning

$
0
0

When Louis Sullivan, purveyor of modern American high-rise architecture, said more than 100 years ago that ‘Form Follows Function’, he perhaps didn’t realize the extent to which building form would not be determined only by building type and the laws of physics, but by zoning laws, building safety codes, real estate developer balance sheets and even vocal neighborhood groups.

For every new building project, an architect’s role is to balance these opposing forces, while also delivering a scheme that is aesthetically pleasing and appropriate for its surroundings. This can be a challenge, but also an opportunity for designers to find creative solutions working within constraints.

Following are just a few of the many parameters an architect must work with when designing this type of project:

Form Follows Zoning

Zoning is a term with broad implications, used to describe the set of regulations put forth by local governments that dictate what type of building can be built where. For each land plot, zoning laws also indicate floor area ratio (FAR, or how much area of building can be constructed), allowable building height, bulk limits, site density, setbacks, and parking requirements, among other constraints.

The FAR number is of paramount importance: it is the magic number used as a multiplier of a site’s area, resulting in the allowable gross floor area. The higher the FAR number, the more area is allowed to be built on a given plot. In most U.S. cities FAR numbers are difficult to amend except through cumbersome political and legal processes. On the other hand, in developing countries such as China, FAR numbers change on an almost daily basis as zoning regulations remain malleable in order to meet of the moment economic growth needs.

For high-density commercial and multi-family residential buildings, real estate developers typically seek to maximize FAR to get the highest return on investment. For tall buildings, that means building to the height limit, and then asking for a variance to exceed the height limit if it does not max out the FAR.

Bulk limits deal with the ascending bulk of skyscrapers, mandating setbacks in the building form as the tower rises up to mitigate shadow impact. That is how you end up with ‘wedding cake’ buildings like the Chrysler Building and the GE Building at Rockefeller Center, both of which were a result of setback mandates in New York City’s 1916 Zoning Resolution. These Art Deco masterpieces are prime examples of how architects cleverly worked within zoning laws to design handsome buildings.

Form Follows Parking Requirements

While parking requirements are indicated in zoning laws, this constraint warrants its own category. It is remarkable how much influence the personal automobile has in shaping the modern city, not only in terms of road infrastructure but also in the space required for parking when cars are stopped. Parking requirements are responsible for urban design situations like the ubiquitous linear strip mall setback a great distant from the street, separated by a sea of parking spaces.

Even in dense urban environments, parking is usually a requirement for new buildings. This means that when designing a multi-story building, the parking layout is what sets the structural column grid that stacks vertically throughout the entire height of the building. A typical 30 ft. column bay (measured from center to center) will accommodate 3 parking spaces, which then results in the building’s entire structure being based on the 30’ column grid.

Parking garages are either below grade or above grade (above lobby level), and usually do not count towards FAR. There are various reasons (including geological/topographical) for placing a parking garage either below or above grade, but in either case, structure is ultimately designed to accommodate the needs of automobiles.

Form Follows Rentable/Saleable Area

In addition to zoning requirements, architects must also meet the needs of their developer clients. This entails realizing in form what real estate bean counters calculate to be the appropriate mix of area for what is to be built.

If it is commercial office space, developers follow the Building Owners and Managers Association (BOMA) standards of measurement to calculate how much ‘rentable area’ can be squeezed out of a building’s floor given a building’s envelope. Of utmost importance in this calculation is the ‘load factor’ or ratio of rentable area to usable area, determining how much building owners can charge their tenants.

Also important is the ‘lease span’, with a 45 ft. clear span from service core to exterior wall being the ideal. This allows flexibility in office layout and also ensures enough natural light penetrates deep enough into the office space.

In residential buildings, saleable are is what developers are after and that determines the mix of unit types (studios, 1 bedrooms, 2 bedrooms, etc…) in a given market. This can frequently change during the design process based on changing market conditions

For towers with a mix of uses, designing a functional building places tremendous onus on the architect to balance competing forces of different building types consolidated into one vertical structure. With financial rewards ultimately more important than aesthetic outcome, architects have to struggle to create a beautiful building within these constraints.

Form Follows NIMBY Demands

In the U.S., and other democratic countries with strong property rights, new building projects are subject to the scrutiny of local neighborhood and vocal environmental groups. Often derided as NIMBYs (Not-In-My-Back-Yard) by those on the pro-development side of a new project, these groups usually have predictable objections, the most common being    increases in traffic. Yet if these NIMBYs, especially in urban settings, have objections to traffic, rather than protest individual projects, they should write their local city councilman suggesting a change in zoning to modify parking requirements.

Even after the approval of extensive traffic and environmental studies, NIMBYs may criticize a building’s appearance in a last ditch effort to prevent construction. Objections include obscure criticisms such as a design does not fit in with ‘neighborhood character’. This criticism reflects a fundamental misunderstanding that even in historic neighborhoods, a well designed counterpoint or contrast can be a suitable proposal. After all, cities are not static museums frozen in time but dynamic and evolving organisms.

Unfortunately, the NIMBY victory can often be a final blow to what would’ve otherwise been a successful, beautiful design.

Conclusion

For architects, designing a building is more like solving a puzzle rather than an exercise in unrestrained creativity. Surprisingly, there is little discussion of the real world constraints in architecture schools. This is perhaps due in part to the fact that regulations vary greatly from place to place, but the fundamental importance of planning and zoning should be emphasized more often.

For all stakeholders involved in new building projects (developers, local officials and planning departments, the design team, concerned neighbors) what is written in the local zoning code provides the basis for every decision made. For those interested in making better, more informed planning decisions, individuals and governments should focus less on singular building projects and more on easing the process of making changes to local zoning codes.

Adam Nathaniel Mayer is an architectural design professional from California. In addition to his job designing buildings he writes the China Urban Development Blog.

Follow him on Twitter: AdamNMayer

Chicago skyline photo by Bigstockphoto.com.

America's Baby Bust: How The Great Recession Has Jeopardized Our Demographic Health

$
0
0

At the turn of the century, America’s biggest advantage was its relatively vibrant demographics. In sharp contrast with its major competitors — the E.U., Russia, China, Japan — the United States had maintained a far higher birthrate and rate of population growth.

But the 2010 Census showed that in the past decade America’s birthrate slipped below at least one European country (France) and under the pace necessary to replace our current population. Immigration, both legal and illegal, is also slowing, in part due to plunging birthrates in Mexico and other Latin American countries. As one National Geographic report from Brazil has it, women there, too, are saying: “A fábrica está fechada.” The factory is closed.

America’s sinking birthrate is in great part a function of our wobbly economy. The decline, notes the Pew Research Center, largely coincides with the onset of the 2007 real estate crash and the financial crisis the following year.

The recession had a disproportionate impact on people of child-bearing age, who suffered higher unemployment and steeper income declines than their elders. In the process, the U.S. fertility rate dropped from over 2.1 births per woman in 2007 to 1.9 last year, below replacement rate for the first time since the mid-1980s. The 2010 Census found that the number of households that have children under age 18 was 38 million, unchanged from 2000, despite a 9.7% growth in the U.S. population over that period.

Of course many environmentalists would celebrate these numbers, and some nativists as well. But the problem is not that we need more people per se — we need an increase in younger, working-age people to make up for our soon to be soaring population of retirees. Young people are the raw capital of the information age and innovation, and new families are its ballast and growth market.

Yet many developed countries are facing dramatic labor force deficits. By 2050, according to Census projections, there will be 40% fewer workers in Japan then there were in 2000, 25% less in Europe and 10% fewer in China; only projections of higher birthrates and immigration allowed demographers to suggest the U.S. workforce would keep growing.

Without these future workers our already tottering pension system will become even more untenable, as is occurring in Europe and Japan. The bad part about slow population growth is that it depresses the economy, which in turn works against family formation.

Of course, there are others ways to deal with this imbalance of too many retirees and too few workers. One is to raise taxes. The billionaire philanthropist Pete Peterson estimates that most developed countries will need to increase their spending on old age benefit promises from 9% to 16% of GDP over the next 30 years. This would require an increase in taxes of 25% to 40% — even in the already high-tax countries of northern Europe.

Raising taxes to transfer funds to the older generation is already happening in some of the most rapidly aging countries. Japanese lawmakers just voted to double the country’s sales tax by 2015 precisely for this reason. Due in large part to low birthrates and soaring numbers of seniors, Japan is now the most heavily indebted high-income country in the world.

Germany likewise is now considering a special tax on younger workers to fund the pensions of the growing ranks of oldsters. Chancellor Angela Merkel has proposed the 1% income tax as a “demographic reserve” for a workforce that is expected to shrink by 7 million by 2023. “We have to consider the time after 2030, when the baby boomers of the ‘50s and ‘60s are retired and costing us more in health and care costs,” explained Gunter Krings, who drafted the new proposal for Germany’s ruling Christian Democrats.

Higher taxes, or its evil twin, austerity, are unlikely to solve this dilemma. Other issues may constrain family growth — high urban population densities, women’s growing role in the workforce, declining religiosity — but one critical precondition for spurring family growth is to expand the economy. Without growth, the long-term decline of most high-income countries, including the United States, is all but assured.

This turns on its head the commonplace assumption that societies reduced their birthrates as they got wealthier. This pattern was seen in the United States and Europe by the 1960s and, even more so in East Asia, whether governments adopted baby-suppressing (notably China) methods or, more recently, as in Singapore, have tried to promote family formation.

But more recently it appears that declining economics — and strong public perceptions that things will get worse — can also convince people not to have children. In 2010, according to Gallup, most European countries have been expecting harder times; pessimism was particularly strong in Spain, Italy, Greece, the Czech Republic and the United Kingdom. Stories about divorced Spanish or Italian young fathers sleeping on the streets or in their cars is not exactly a strong advertising for parenthood.

In 2011, birthrates fell in 11 of the 15 European countries that have reported numbers. Among the countries reporting declines were Finland and Denmark, where rates had been ticking slightly upwards.

The impact has been even greater in countries like Spain and Greece, where overall joblessness has hit one in four and youth unemployment is roughly 50%. Some of these countries face the prospect of considerable de-population in the coming decades.

“A more pessimistic economic outlook” is one key reason that European birth rates have been depressed and family formation so slow, confirms Austrian demographer Wolfgang Lutz. Overall fertility has fallen to roughly 1.5, well below replacement rate and all but guaranteeing a demographic-based economic crisis a decade or two sooner. Some eastern countries like Latvia now have fertility rates approaching 1.2. Lutz believes that once birthrates fall to these levels, there is no turning back.

Yet it is Japan that perhaps shows this renewed relationship between economics and birthrates most clearly. In 1991 many economists predicted that Japan would overtake the U.S. economy; instead U.S. GDP grew much faster and China supplanted Japan in 2010 as the world’s second-largest economy. As prices deflated and opportunities shriveled, Japanese grew less interested in either starting or growing families.

It could get even worse: Japanese teens seem not only less interested in work but in each other. In what seems an enormous reversal of adolescent nature, 36% of Japanese males 16 to 19 years old have admitted to pollsters having no interest in sex, and some even despise it. The figure is even higher (59%) for females in the same age category. For many, notes Japanese sociologist Mika Toyota, hobbies, vacations, food and computer games are often more alluring than pursuing the opposite — or the same — sex.

It may well be that American birthrates have been more impacted than Europe’s by the recent recession due to the relative weakness of the country’s social safety net. Finnish demographer Anna Rotkirch has pointed out that Europeans have tried to mitigate the impact of recession through generous transfer payments to young families. This may account as well for the fact that France’s birthrate last year surpassed that of the United States.

But without strong economic growth, it seems likely that family formation and birthrates will continue downward everywhere, particularly as economic realities force reductions in state aid. A mindlessly ever-expanding welfare state, trying to enlist more clients, even tiny ones, will diminish private sector growth and usher in even more quickly the onset of “demographic winter.” A lethal demographic cocktail of high taxes, low growth and fewer babies could set the stage for an even greater financial crisis in the decades ahead.

Joel Kotkin is executive editor of NewGeography.com and is a distinguished presidential fellow in urban futures at Chapman University, and contributing editor to the City Journal in New York. He is author of The City: A Global History. His newest book is The Next Hundred Million: America in 2050, released in February, 2010.

This piece originally appeared in Forbes.

Childhood kids photo by BigStockPhoto.com.

Utah Up, Chicago Down: Why Mitt Romney Should Embrace His Mormonism

$
0
0

In his run for the Republican nomination, Mitt Romney downplayed his Mormonism—referring only to “faith” or “shared values”—in the face of small-minded members of the Christian right and the occasional cackle from the Eastern cultural avant-garde. But with his party’s nod in hand, Romney has been “coming out” in the run-up to the Republican convention, letting pool reporters join him and his family at a church service, and even choosing a member of the church to deliver the invocation on the night he addresses the Republican convention.

The church’s appeal can be seen, in part, in the contrast between booming Utah and Salt Lake City and President Obama’s adopted home state of Illinois and hometown of Chicago.

Utah netted 150,000 new arrivals from other states in the last decade, while Illinois lost a net of 70,000 people each year to other states. And Utah’s new arrivals include more than Mormons returning to Zion; Salt Lake County is now only 54% Mormon. Twenty-six percent of the county’s residents are minorities, mostly Hispanic immigrants.

Romney himself reflects the enormous changes in the fast-growing and highly successful Church of Jesus Christ of Latter-day Saints (LDS), the official name of the religion, since the church (which continues to have an all-male clergy), opened itself to black members in 1978. Mormons now enjoy levels of education and wealth well above those of the average American.  Some 53.5% of LDS males have a post–high-school education, compared to 36.5% of the total U.S. population. And 44.3% of LDS females have a post-high-school education, compared to a national average of 27.7%. More impressive still, unlike mainstream churches, Mormonism is thriving; the church membership in North America grew 45 percent over the past decade to more than 6 million members—roughly matching the number of American Jews

This is not Romney’s father’s—and certainly not his grandfather’s—LDS.

A recent Gallup survey ranked Utah first in terms of quality of life, in part because of its citizens’ “low smoking habits, ease of finding clean and safe water, having supervisors who treat workers like a partner rather than a boss, learning something new or interesting on any given day, and perceptions that your city or area are ‘getting better’ rather than ‘getting worse.’”

While Illinois competes with California for the nation’s worst credit ranking, Utah stands at the AAA apex. The job-growth rate in Salt Lake City and the state rank near the top while Chicago and Illinois have sunk relentlessly toward the bottom. Forbes recently ranked Utah “the best state for business and careers” for the second straight year; Illinois ranked 41st.

While Utah undoubtably owes some of its success to its low-tax, low-regulation culture, and to smart incentives to draw in businesses, it’s also benefitted from a Mormon culture that promotes not supply-side but investment-driven growth.

From its origins in the great Mormon migration in the late 1840s, the state and the church have built a legacy of careful planning. Brigham Young was many things, control freak and city planner among them, laying out the streets of the towns with exacting detail. The Mormons, wrote Wallace Stegner, a “gentile” who lived among them, “were the most systematic, organized, disciplined, and successful pioneers in our history.”

Today this legacy is evident in the excellent infrastructure the state is building, including new highways that shame the pot-holed roads that people on the coasts commonly endure. Utahans have invested mightily in their universities, public and private, and are positioning themselves to be major players in fields from energy and agriculture to composite manufacturing, science, and engineering. They are not merely waiting around to ransack the intellectual capital of other states; for the last two years the University of Utah has ranked No. 1 in forging startups, besting institutions like MIT and Columbia.

It is a bit distressing for a Californian to ride down Highway 15 south from Salt Lake City towards Provo and see buildings, often just finished, from some of Silicon Valley’s signature companies including Intel, Adobe, Twitter, eBay, and Fairchild Semiconductor. These are jobs that used to stay in California, but for a host of reasons—regulation and housing prices chief among them—have moved east to Utah.

And most of the former Californians I’ve met in Salt Lake like the place, even if they sometimes feel uncomfortable with the Mormon aversion to such habit as drinking. Over the past 30 years, the city has changed for the better. Good food now proliferates—even if the elegantly dressed young Mormons still don’t order wine, much less vodka. The local arts and culture scene has evolved to, if not world-class levels, at least those seen in other similarly-sized cities.

But what’s most impressive about Utahans may be their devotion to family. Although they make much noise about their dedication to “working families,” the Democratic Party increasingly relies on singles and the childless as its core base, particularly among white voters. In contrast, GOP-dominated Utah (which is largely white, but increasingly diverse) has the highest birth rate and youngest population in the nation. Families thrive there, including those who are not Mormon. It is almost like another America—one where most people raise their children, and push education and enterprise. If you’re getting deep into your 50s like me, you might remember that country.

True, Salt Lake City now has some high-rise residential areas and some local planners, largely from the University of Utah, who push “smart growth.” But the big growth along the Highway 15 corridor is mostly single-family home communities, affordable and large enough to accommodate several offspring. They seem a lot like the places Long Island and the San Fernando Valley once were.

Like the church around which it is built, the Mormon Zion in Salt Lake Valley has also changed. It has what may be the largest concentration of multilingual people in the country. With 55,000 missionaries at 340 mission sites across the globe, native English-speaking Mormons have learned more than 50 languages. Former Utah governor and Romney rival Jon Huntsman gained respectability—even among sophistos—for his fluent Mandarin.

On the business side, Mormons’ linguistic skills have attracted loads of big international companies, such as Goldman Sachs, who need people capable of conversing in Lithuanian, Chinese, or Tongese. Goldman has 1,400 employees in Salt Lake City, making it the investment bank’s sixth largest location in the world.

In contrast to the antediluvian nonsense sometimes expressed by right-wing evangelical Christians, the LDSers have become more cosmopolitan as their faith has expanded. Once a peculiarly American creed, with the vast majority of its faithful living in the Western United States, Mormonism has morphed into a global religion with over 11 million members—more than half of them outside the United States. Once narrowly white, the church’s biggest growth now is in Brazil, the Philippines, and the Pacific Islands. Even in the U.S., converts have made for an increasingly diverse church, with blacks and Hispanics accounting for one in five new Mormons, according to Pew.

It's not likely that the church will be portrayed by the Obama campaign and its associated media outlets in this way. They also are sure to continue portraying millionaire Mitt as the greedy capitalist devil incarnate. Perhaps to avoid getting drawn into a discussion of his faith, Romney rarely mentions that he tithes 10 percent of his substantial income to support church activities. Such tithing, expected of all church members, helps explain why Utahans are easily the nation’s most charitable citizens, according to The Chronicle of Philanthropy—contributing two and a half times more of their income than Illinoisans.

Yet most appealing about Mormons is their focus on self-help and community outreach, and the church’s highly structured and efficient relief organization—something Romney has never communicated well. Mormons are remarkable for their ability to rise to the occasion during natural disasters like Hurricane Katrina and the earthquake in Haiti.

“Mitt may not be Bill Clinton or Barack Obama—he’s a boring guy, but he’s not the jerk people think he is,” says Joe Cannon, the former publisher of the Deseret News, the church-owned paper. “When you are a bishop,” as Romney was in Boston, says Cannon, “you are running a huge welfare state on your own. You spend a lot of time helping the poorest and most dysfunctional congregants.”

In the end, Utah’s Mormon-created reality is bigger than one relentlessly ambitious man’s foibles and tax dodges; Mormonism is the enterprise that transformed a desert province into a productive garden. That’s the story that Romney needs to share between now and November. If he fails, we might see a more appealing Mormon, Jon Hunstman, remind us of this success story in 2016.

Joel Kotkin is executive editor of NewGeography.com and is a distinguished presidential fellow in urban futures at Chapman University, and contributing editor to the City Journal in New York. He is author of The City: A Global History. His newest book is The Next Hundred Million: America in 2050, released in February, 2010.

This piece originally appeared in The Daily Beast..

Mitt Romney photo by BigStockPhoto.com.

Regionalism: Spreading the Fiscal Irresponsibility

$
0
0

Stanley Kurtz's new book, Spreading the Wealth: How Obama is Robbing the Suburbs to Pay for the Cities describes political forces closely tied to President Obama who have pursued an agenda to destroy the suburbs for many years. He expresses concern that a second Obama term will be marked by an intensification of efforts to destroy the suburbs through eviscerating their independence thought the imposition of "regionalism". The threat, however, long predates the Obama administration and has, at least in some cases, been supported by Republicans as well as by Democrats.

America is a suburban nation. Nearly three-quarters of the residents of major metropolitan areas (over 1,000,000 population) live in suburbs, most in smaller local government jurisdictions. Further, outside the largest metropolitan areas most people live in suburbs, smaller towns or smaller local government jurisdictions.

Smart Growth

The anti-suburban agenda has more than one dimension. The best known is smart growth, known by a variety of labels, such as compact development, growth management, urban consolidation, etc. Smart growth, from our research, also is associated with higher housing prices, a lower standard of living, greater traffic congestion and health threats from more intense local air pollution.

Regionalism

Another, less well-known anti-suburban strategy is regionalism, to which Kurtz grants considerable attention. Regionalism includes two principal strains, local government amalgamation and metropolitan tax sharing. Both of these strategies are aimed at transferring tax funding from suburban local governments to larger core area governments.

Social welfare and differing income levels are not an issue at this level of government. Local governments, cities, towns, villages, boroughs and townships, finance local services principally with their own local taxes. The programs aimed at social welfare or providing income support are generally administered and financed at the federal, state or regional (county) level. Any suggestion that local suburban jurisdictions are subsidized by core local governments simply reveals a basic unfamiliarity with US municipal finance.

Local Government Amalgamation

Opponents of the suburbs have long favored amalgamating local governments (such as cities, towns, villages, boroughs and townships). There are two principal justifications. One suggests "economies of scale" --- the idea that larger local government jurisdictions are more efficient than smaller governments, and that, as a result, taxpayers will save. The second justification infers that a larger tax base, including former suburbs, will make additional money available to former core cities, which are routinely characterized as having insufficient revenues to pay for their services. Both rationales are without foundation.

Proponents of amalgamation incessantly refer to the large number of local governments in some states, implying that this is less efficient. The late Elinor Ostrum put that illusion to rest in her acceptance speech for the Nobel Prize in economics in 2009:

Scholars criticized the number of government agencies rather than trying to understand why created and how they performed. Maps showing many governments in a metropolitan area were used as evidence for the need to consolidate.

The reality is that there is a single measure of efficiency: spending per capita. Here there is a strong relationship between smaller local government units and lower taxes and spending. Our review of local government finances in four states (Pennsylvania, New York, Indiana and Illinois) indicates that larger local governments tend to be  less efficient, not more. Moreover, the same smaller is more efficient dynamic is evident in both metropolitan areas as well as outside. "Smaller is better" is also evident at the national level (Figure 1).

Yet the "bigger is better" faith in local government amalgamation remains compelling to many from   both the Right and Left. Proponents claim that smaller local governments are obsolete, characterizing them as being from the horse-and-buggy era. The same logic could be used to eliminate county and even state governments. However, democracy remains a timeless value. If people lose control of their governments to special interests (which rarely, if ever, lobby for less spending), then democracy is lost, though the word will still be invoked.

Support of local government amalgamation arises from a misunderstanding of economics, politics and incentives (or perhaps worse, contempt for citizen control). When two jurisdictions merge, everything is leveled up, from labor costs to service levels. The labor contracts, for example, will reflect the wage, benefit and time off characteristics of the more expensive community, as the Toronto "megacity" learned to its detriment.

Further, special interests have more power in larger jurisdictions, not least because they are needed to finance the election campaigns of elected officials, who always want to win the next election. They are also far more able to attend meetings – sending paid representatives – than local groups. This is particularly true the larger the metropolitan area covered, since meeting are usually held in the core of urban area not in areas further on the periphery. This greater influence to organized and well-funded special interests – such as big real estate developers, environmental groups, public employee unions – and drains the influence of the local grassroots. The result is that voters have less influence and that they can lose financial control of larger local governments. The only economies of scale in larger local government benefit lobbyists and special interests, not taxpayers or residents.

Regional Tax Sharing

Usually stymied by the electorate in their attempts to amalgamate local governments, regional proponents often make municipal tax sharing a priority. The idea is that suburban jurisdictions should send some of their tax money to the core jurisdictions to make up for the claimed financial shortages of older cities. Yet this ignores the fact, as Figure 1 indicates, that larger jurisdictions generally spend more per capita already and generally tax more, as our state reports cited above indicate. Larger jurisdictions also tend to receive more in state and federal aid per capita.  A principal reason is that the labor costs tend to be materially higher in larger jurisdictions. In addition to paying well above market employee compensation, many larger jurisdictions have burdened themselves with pension liabilities and post employment health benefits that are well above what their constituencies can afford. The regionalist solution is not to bring core government costs in line with suburban levels but force the periphery to help subsidize their out of control costs.

Howard Husock, of Harvard University's JFK School of Government (now at the Manhattan Institute) and I were asked to evaluate a tax sharing a plan put forward by former Albuquerque mayor David Rusk for Kalamazoo County, Michigan (The Kalamazoo Compact) more than a decade ago. Our report (Keeping Kalamazoo Competitive)found no justification for the suburban areas and townships of Kalamazoo County to share their tax bases with the core city of Kalamazoo. The city already spent substantially more per capita, received more state aid per capita and had failed to take advantage of opportunities to improve its efficiency (that is, lower the costs of service without reducing services).  We concluded that the "struggling" core city had a spending problem, not a revenue problem. To the credit of the electorate of Kalamazoo County, the tax sharing proposal is gathering dust, having been made impractical by suburban resistance.

Spreading the Financial Irresponsibility

The wanton spending that has gotten many larger core jurisdictions into trouble should not have occurred. The core cities are often struggling because their political leadership has "given away the store," behavior that does not warrant rewarding. Elected officials in the larger jurisdictions had no business, for example, allowing labor costs to become higher than necessary or granting rich pension benefits paid for by private sector employees (taxpayers), most of whom  enjoy only  much more modest pension programs, if at all (See note below).

The voters are no match for the spending interests with more efficient access to City Hall. The incentives in such larger jurisdictions are skewed against fiscal responsibility and the interests of taxpayers. Making an even larger pool of tax revenues available can only make things worse.

At the same time, the smaller, suburban jurisdictions around the nation are often the bright spot in an environment of excessive federal, state and larger municipal government spending. Their governments, close to the people, are the only defense against the kind of beggar-the-kids-future spending that has already captured the federal government, state governments and some larger local jurisdictions.

Either Way the Threat is Very Real

Even if President Obama is not re-elected or if a second Obama Administration does not pursue the anti-suburban agenda, the threat to the suburbs will remain very real. This is not just about the suburbs, and it is certainly not some secret conspiracy. What opposing regionalism means is the preservation of what is often the last vestige of fiscal responsibility. It is not that the elected officials in smaller  jurisdictions are better or that the electorate is better. The superior performance stems from the reality that smaller governments are closer to the people, and decision-making tends more to reflect their interests more faithfully than in a larger jurisdictions.

------

Note: A report by the Pew Charitable Trusts (Promises with a Price) indicated that "... in general, the private sector never offered the level of benefits that have been traditionally available in the public sector." The report further indicated that 90 percent of state and local government retirees are covered by the more expensive defined benefit pension programs, compared to 20 percent in the private sector. The median annual pension in the state and local government sector was cited at 130 percent higher than in the private sector. While 82 percent of state and local government retirees are covered by post-employment medical benefits, the figure is 33 percent in the private sector. According to the Bureau of Labor Statistics, after accounting for the one-third higher wages per hour worked among state and local government workers, employer contribution to retirement and savings is 160 percent higher than in the private sector (March 2012). A just published Pew Center on the States report (The Widening Gap Update) indicates that states are $1.3 trillion short of the funding required to pay the pension and post employment medical benefits of employees. This does not include programs administered by local governments.

Wendell Cox is a Visiting Professor, Conservatoire National des Arts et Metiers, Paris and the author of “War on the Dream: How Anti-Sprawl Policy Threatens the Quality of Life.”

Lead Photo: Damascus City Hall (Portland, Oregon metropolitan area) by Wiki Commons user Tedder.

Viewing all 3795 articles
Browse latest View live


Latest Images