Quantcast
Channel: Newgeography.com - Economic, demographic, and political commentary about places
Viewing all 3794 articles
Browse latest View live

China and the Future of Hong Kong

$
0
0

Last week Hong Kong’s new leader Leung Chun-ying was sworn into office by Chinese President Hu Jintao. The ceremony coincided with the 15th anniversary of the British handover of Hong Kong to China so there was plenty of rhetoric about ‘strengthening ties with the motherland’. Yet not far from the ceremony, tens of thousands of Hong Kong citizens marched in protest showing discontent with growing inequality and what they perceive as Beijing’s increasing assault on the territory.

The relationship between Hong Kong and mainland China is complex. Beijing for the most part has kept its promise to uphold the ‘one country, two systems’ mandate. Officially, Hong Kong is considered a ‘Special Administrative Region’ (SAR), which means that it is treated as a separate country from an immigration standpoint and continues to circulate its own currency, the Hong Kong dollar. Hong Kong also retains an independent legal and judicial system inherited from the previous British rulers.

Most importantly, Hong Kong has avoided the draconian media censorship common on the mainland. A free press is consistent with its reputation as a global center of banking and commerce. Hong Kong’s ease of trade and doing business frequently leads it to being named one of the world’s freest economies.

So if Beijing continues to hold up its end of the deal, why do so many Hong Kong residents march in protest? The relationship is more nuanced than it appears on the surface. Politically, Hong Kong residents do not have the freedom to elect their leader (CY Leung was appointed by a 1,200-person electoral college made up primarily of pro-China business leaders), although democratic elections are set to commence in the next five years. Underlying this frustration is what Hong Kong residents see as an infiltration of growing mainland influence on the city.

On the ground, Hong Kong experienced a huge increase in mainland tourists to the city since the handover. Hong Kong doesn’t have the same high tax rate on imported goods that mainland China does, so mainlanders flock to the city primarily for shopping, hunting for bargains on electronics and luxury fashion brands. It is not uncommon to see long queues of mainland tourists in front of shops of famous fashion brands like Gucci, D&G or Prada. The droves of mainland shoppers spending money in Hong Kong are great for the local economy, but many locals decry the constant flow of tourists as invading ‘locusts’.

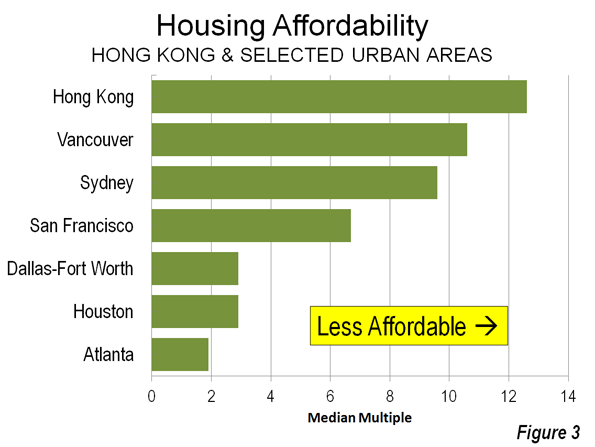
Yet more significant than what is happening on the ground is what is taking place high above in the sky. The phenomenon of wealthy mainlanders purchasing real estate in the city has driven   housing prices to astronomical levels, approaching the market just before the Asian Financial Crisis of 1997. For well-off Chinese mainlanders, Hong Kong real estate is seen as a safer long-term investment than China’s still somewhat risky real estate market and unpredictable stock market. A severely limited land supply coupled with the fact that a handful of powerful real estate oligarchs control the market for new development means that prices will probably stay high barring another economic crisis.

Land-use policy is perhaps the most critical factor in determining both the future of Hong Kong and the mainland. As anyone who has been to the city can attest to, Hong Kong has some of the best infrastructure in the world, including a first-class international airport, extensive rail system and a booming seaport. Much of that infrastructure comes from the city’s land-auctioning system, which is the government’s primary source of revenue. This is also what helps keeps taxes low.

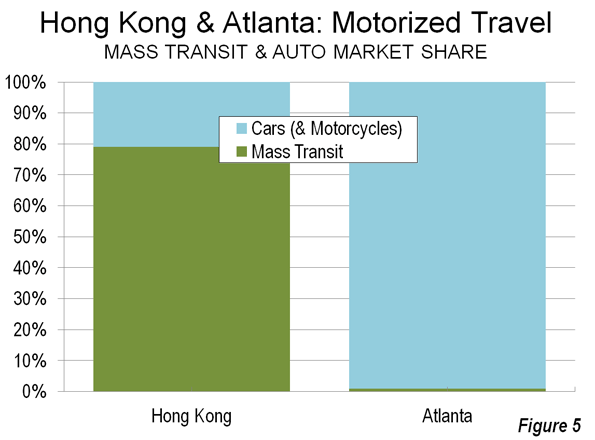
Furthermore, unlike in the U.S., where infrastructure is traditionally financed publicly, Hong Kong’s infrastructure is increasingly built with private funds. For instance, the city’s Mass Transit Railway (MTR) Corporation, founded as a public entity, went fully private in 2000 and is traded on the Hong Kong’s stock exchange. In addition to operating and maintaining the city’s existing rail system, MTR Corporation is responsible for building new lines. What makes MTR Corporation different from most other transit authorities is that its primary earnings do not come from passenger ticket sales but from developing the land on top of and around its metro stations.

Cheung Kong Holdings, led by Hong Kong’s richest man Li Ka-shing, is not only one of the city’s largest property developers, its business interests also include Hutchinson Port Holdings (a port operator that handles 13% of the world’s container traffic) and Hutchinson Telecommunications Limited (which builds and operates mobile phone networks). Sun Hung Kai, another powerful Hong Kong property developer also owns stakes in logistics and telecommunications businesses (although its founders, the Kwok brothers, were recently arrested on corruption charges).

The mode of urban development in mainland Chinese cities is heavily influenced by Hong Kong. Yet instead of powerful corporations, State-Owned Enterprises (SOE), large entities owned by the government, dominate urban development related businesses. China’s land auctioning system is far from perfect, with well-documented instances of corrupt land seizures and the unfair advantages government backed SOEs have in the bidding process over private developers. But with virtually no property taxes in mainland cities, land sales remain the primary source of revenues for local governments to support infrastructure development.

There is growing evidence that suggests China plans to alter the direction of its development model in the coming years by consolidating and privatizing its SOEs. Already, Hong Kong property developers are active in the mainland real estate market with Chinese companies eager to learn from their expertise. The cozy relationship between Hong Kong developers and mainland SOEs is a cause for concern by Hong Kong citizens, as they see their local developers as more interested in appeasing Beijing authorities than providing affordable housing for its own citizens.

Yet this is inevitable. The city of 7 million cannot expect to forever be completely independent of a country of 1.3 billion to which it is now irrevocably attached. This is true even in spite of Hong Kong’s role as an international center of trade.

Throughout history, Chinese culture survived through its sheer mass and cultural osmosis. When CY Leung gave his inaugural speech last week, it was in Standard Mandarin, the official language of China. Although the citizens of Hong Kong are also Chinese, their official language is Cantonese, a completely different and not mutually intelligible dialect. Leung’s move was seen as a slight to the people he was chosen to serve, yet given who he has to report to in Beijing, it made perfect sense.

Adam Nathaniel Mayer is an architectural design professional from California. In addition to his job designing buildings he writes the China Urban Development Blog.

Follow him on Twitter: AdamNMayer

Hong Kong photo by BighStockphoto.com


Core City Growth Mainly Below Poverty Line

$
0
0

Over the toughest economic decade since Great Depression, the nation's core cities continued to gain more than their share the below poverty line population in the 51 metropolitan areas with more than 1,000,000 population. Between 2000 and 2010, core cities (Note 1) attracted approximately 10 percent of the increase in population (Note 2) while adding 25 percent of the increase in people under the poverty line (Figure 1).

Most New Core City Residents in Poverty: The core city poverty trend was overwhelming. In the core cities of the 51 metropolitan areas with more than 1,000,000 population (2010), 81 percent of the aggregate population increase was under the poverty line. This compares to the 32 percent of the suburban population increase that was below the poverty line. This may be a much lower figure than the concentration in the core cities, but even that also is far too high (Figure 2).

The trend in core city poverty concentration was also pervasive. In 39 of the 51 metropolitan areas, core cities accounted for a greater share of poverty level population growth than overall population growth. One of the exceptions was Louisville, where the core city expanded to nearly six times its 2000 land area and more than doubled its population (Note 3). The result was to convert Louisville into a largely suburban city, which masks the high poverty rate in genuine urban core of the former city.

Poverty in the Suburbs: At the same time, as core city population growth has stalled, much of the numeric increase in the below poverty line population has been in the suburbs. In 2010, the Brookings Institution reported that a majority of the metropolitan population below poverty was in the suburbs (Note 3). This is to be expected, since suburban areas account for nearly 75 percent of major metropolitan area population.

Partially in response to the Brookings Institution finding, there has been some misinterpretation as to the relative economic fortunes of the core cities and the suburbs. This is consistent with the continuing "drumbeat" of the "return to the cities," which results of the last definitive ten year census only briefly quieted. The "great inversion" cited by Aaron Ehrenhalt and others, wherein the affluent "flock" (the recurring term) to the cities, as the suburbs are ghettoized, remains far from an actual reality.  

Overall the average major metropolitan area poverty rate rose from 10.9 percent in 2000 to 14.1 percent in 2010. Rather than gentrify, the core city rate rose from 19.2 percent to 23.3 percent, while the suburban rate rose from 8.2 percent to 11.3 percent (Figure 3).

Core City Poverty Rates Double the Suburbs: In 2010, core city poverty rates were higher in every major metropolitan area than in the suburbs. Overall, average core city poverty rates were more than double that of the suburbs in most metropolitan areas (27 of 51). Among the 10 largest metropolitan areas, the core cities of New York, Chicago, Houston, Philadelphia, Miami, Washington and Boston (Figure 4) suffered poverty rates more than double  those of their suburbs. The cities of Milwaukee and Hartford had the highest poverty rates relative to their suburbs, at four or more times.

Shares of Poverty Level Population in the Core Cities: On average, 41 percent of metropolitan area populations living below the poverty rate resided in the core cities. The city of San Antonio had the highest share of its metropolitan below poverty population, at 73 percent, followed closely by the city of Milwaukee, at 72 percent. New York City accounted for 63 percent of its metropolitan below poverty line population and the city of San Jose 61 percent. Even after incorporating suburbs, the city of Louisville contained 57 percent of its metropolitan below poverty level population (Figure 5).

Highlights of the 2010 Data: The 2010 poverty rates for metropolitan areas, core cities and suburbs are shown in the table below. Highlights of the data are described below:

Metropolitan Areas: The highest metropolitan area poverty rates were in Memphis (19.1 percent), New Orleans (17.4 percent) and Riverside-San Bernardino (17.1 percent). The lowest metropolitan area poverty rates were in Washington (8.4 percent), Hartford (10.1 percent) and Boston (10.3 percent).

Core Cities: The city of Detroit had the highest poverty rate, at 37.6 percent, The city of San Bernardino, whose city council voted to file for bankrupcty on July 10, had the second highest poverty rate at 34.6 percent, and Cleveland ranked third highest, at 34.0 percent.  The lowest core city poverty rates were in high-tech centers, the city of San Jose (12.6 percent), the city of Seattle (14.7 percent and in the two core cities of San Francisco-Oakland (15.7 percent). Despite the strong metropolitan area showing (#1) and high suburban ranking (#3), the city of Washington had only the 15th lowest poverty rate among core cities.

Suburbs: The highest suburban poverty rates were in Riverside-San Bernardino (16.2 percent), Miami (15.9 percent) and Oklahoma City (15.2 percent). The lowest suburban poverty rates were in Baltimore (6.7 percent), Milwaukee (6.9 percent) and Washington (7.1 percent), with Baltimore and Washington profiting from strong federal government employment and contracting.

The data reflects the continuation of longer term trends as wealth losses continue to afflict many core cities and as domestic migrants continue to move away (As was previously reported core counties, the lowest level at which there is migration data, have predominantly lost domestic migrants, both between 2000 and 2009 and in the latest estimates, between 2010 and 2011.) The problem, however is much larger. Both the core cities and the suburbs are are challenged by heightened poverty rates. The entire urban form, from the exurbs and the suburbs to the core cities   need  a substantial reduction in poverty, although  present economic trends are working against this   result.


2010 Poverty Rates: Major Metropolitan Areas, Core Cities & Suburbs
Poverty Rates
Metropolitan Area (MSA) Historical Core City (HCM) MSA City Suburbs City/  Suburbs
Atlanta, GA Atlanta 14.8% 26.1% 13.9% 1.88
Austin, TX Austin 15.9% 20.8% 11.7% 1.78
Baltimore, MD Baltimore 11.0% 25.6% 6.7% 3.80
Birmingham, AL Birmingham 17.0% 29.5% 14.2% 2.08
Boston, MA-NH Boston 10.3% 23.3% 8.3% 2.80
Buffalo, NY Buffalo 14.4% 30.2% 9.7% 3.13
Charlotte, NC-SC Charlotte 14.5% 17.2% 12.6% 1.36
Chicago, IL-IN-WI Chicago 13.6% 22.5% 10.0% 2.24
Cincinnati, OH-KY-IN Cincinnati 14.0% 30.6% 11.4% 2.69
Cleveland, OH Cleveland 15.1% 34.0% 10.7% 3.19
Columbus, OH Columbus 15.7% 22.6% 10.5% 2.16
Dallas-Fort Worth, TX Dallas 14.6% 23.6% 12.5% 1.88
Denver, CO Denver 12.5% 21.6% 9.7% 2.21
Detroit,  MI Detroit 16.6% 37.6% 12.4% 3.02
Hartford, CT Hartford 10.1% 31.2% 7.8% 3.99
Houston, TX Houston 16.5% 22.8% 13.1% 1.74
Indianapolis. IN Indianapolis 14.8% 21.1% 9.1% 2.31
Jacksonville, FL Jacksonville 15.3% 16.7% 13.1% 1.28
Kansas City, MO-KS Kansas City 12.4% 20.4% 10.0% 2.05
Las Vegas, NV Las Vegas 15.1% 16.0% 14.7% 1.09
Los Angeles, CA Los Angeles 16.3% 21.6% 14.0% 1.54
Louisville, KY-IN Louisville 15.3% 18.9% 12.2% 1.55
Memphis, TN-MS-AR Memphis 19.1% 26.5% 12.0% 2.20
Miami, FL Miami 17.1% 32.4% 15.9% 2.04
Milwaukee,WI Milwaukee 15.5% 29.5% 6.9% 4.30
Minneapolis-St. Paul, MN-WI Minneapolis & St. Paul 10.9% 23.7% 7.6% 3.10
Nashville, TN Nashville 15.4% 20.8% 12.2% 1.71
New Orleans. LA New Orleans 17.4% 27.2% 13.4% 2.02
New York, NY-NJ-PA New York 13.8% 20.1% 9.0% 2.24
Oklahoma City, OK Oklahoma City 15.9% 16.8% 15.2% 1.11
Orlando, FL Orlando 14.7% 18.5% 14.2% 1.30
Philadelphia, PA-NJ-DE-MD Philadelphia 12.7% 26.7% 7.9% 3.36
Phoenix, AZ Phoenix 16.3% 22.5% 13.0% 1.73
Pittsburgh, PA Pittsburgh 12.2% 22.3% 10.7% 2.08
Portland, OR-WA Portland 13.4% 18.5% 11.7% 1.59
Providence, RI-MA Providence 13.7% 30.5% 11.7% 2.60
Raleigh, NC Raleigh 12.9% 18.4% 10.0% 1.84
Richmond, VA Richmond 11.6% 25.8% 8.9% 2.91
Riverside-San Bernardino, CA San Bernardino 17.1% 34.6% 16.2% 2.13
Rochester, NY Rochester 14.2% 33.8% 9.3% 3.62
Sacramento, CA Sacramento 15.1% 21.5% 13.3% 1.62
St. Louis,, MO-IL St. Louis 13.3% 27.8% 11.5% 2.42
Salt Lake City, UT Salt Lake City 13.1% 22.3% 11.3% 1.98
San Antonio, TX San Antonio 16.3% 19.1% 11.7% 1.64
San Diego, CA San Diego 14.8% 17.4% 13.0% 1.34
San Francisco-Oakland, CA San Francisco & Oakland 10.9% 15.7% 9.0% 1.74
San Jose, CA San Jose 10.6% 12.6% 8.4% 1.49
Seattle, WA Seattle 11.7% 14.7% 11.1% 1.33
Tampa-St. Petersburg, FL Tampa 15.4% 21.3% 14.6% 1.46
Virginia Beach-Norfolk, VA-NC Norfolk 10.6% 16.4% 9.7% 1.69
Washington, DC-VA-MD-WV Washington 8.4% 19.2% 7.1% 2.69
Average (Unweighted) 14.1% 23.3% 11.3% 2.18
Data from American Community Survey, 2010


Wendell Cox is a Visiting Professor, Conservatoire National des Arts et Metiers, Paris and the author of “War on the Dream: How Anti-Sprawl Policy Threatens the Quality of Life.”

Photograph: Downtown Detroit (by author)

----------------------

Note 1: "Historical core municipalities," which are defined here. One such city is designated in each metropolitan area, except in Minneapolis-St. Paul and San Francisco-Oakland. In each of the metropolitan areas, these are the core cities of the metropolitan area at the beginning of the great automobile-oriented suburban expansion. These cities represent at least the urban core. However, in most cases, these cities  include considerable post-war suburban development is not genuinely urban core, largely due to post-1950 annexations.

Note 2: The data in this analysis is extracted from the American Community Survey for 2010 and the United States Census of 2000. The metropolitan areas for both years are as geographically defined in 2010. The total population figures are the population for which poverty status has was determined by the Bureau of the Census (in each year this was approximately 98 percent of the total population).

Note 3: The city of Louisville reached its population peak of 390,000 in 1960. Its highest density was nearly 9,300 per square mile (3,600 per square kilometer) in 1950, when it had a population of 370,000 in 40 square miles (100 square kilometers). The suburban incorporating consolidation of 2000 left the city with under 600,000 population in 340 square miles and a population density of 1,700 per square mile (700 per square kilometer), one of the lowest core city population densities in the nation.

Note 4: The Brookings Institution report compared its "primary cities" to suburbs for 95 metropolitan areas. The primary cities included some that were little more than small towns at the beginning of the great automobile oriented suburban expansion, such as Aurora (Denver), Mesa (Phoenix), Santa Ana (Los Angeles), Fremont (San Francisco-Oakland) and Arlington (Dallas-Fort Worth), which is not served by mass transit. Each of these municipalities is classified as suburban in this analysis.

High Speed Rail Advocates Discredit Their Cause - Again

$
0
0

Is there any high speed rail boondoggle big enough to make rail transport advocates reject it?  Sadly, for all too many of them, the answer is No, as two recent developments make clear.

The first is in California, where the state continues to press forward on a high speed rail plan for the state that could cost anywhere from $68 billion to $100 billion. Voters had previously approved $10 billion in bonds for the project, but as the state's economy and finances have continued to sour – including multiple major cities going bankrupt – the polls have turned against it, and with good reason. The state faces the prospect of already enacted education cutbacks if Gov. Jerry Brown's tax increase proposal in not approved in a vote this fall.  Other painful service cuts loom. Voters are rightly asking themselves if now is the time to be borrowing public money for very expensive, speculative infrastructure. 

Equally, many of the much cited overseas examples of high-speed rail seem, well, to be off the tracks.    China's rail system has serious safety problems, for example. And developing the most extensive high speed rail system in Europe hasn't stopped Spain from seeing 50% youth unemployment, a 3 percentage point increase in the VAT tax, and a humiliating bailout from the rest of the EU.

Nevertheless, the California assembly recently voted to go full speed head on its high speed rail plans. As part of an overall $8 billion rail spending package, the state is borrowing $2.6 billion to complement $3.2 billion in federal funds left over from the stimulus (shovel ready???) to build a starter segment of the line linking Bakersfield and Madera through the Central Valley. This is the easiest segment on which to build – though legal action is likely to delay construction – but doesn't do anything to link the state's huge population centers around LA and the Bay Area. With no more significant federal funds likely to be forthcoming, and the state's finances a wreck, this segment risks becoming an embarrassing white elephant, or, as critics call it, “a train to nowhere”.

After this vote it came to light that respected French high speed rail operator SNCF had approached California officials, private funding in hand, with a preliminary offer to build the LA-SF link themselves on a better and cheaper alignment along I-5 that would cost only $38 billion. But this was rejected by the state. The Times account suggests this rejection came about due to a combination of a political preference for the inefficient Central Valley segment and the clout of Parsons Brinckerhoff, the lead contractor.  Some commentators have referred to this revelation as a “bombshell.”

Despite management misstep after management deception, rail advocates around the country cheered California's decision to build the Central Valley segment. Jerry Brown, with not much to show for his reprise as Governor, is excited of course. Secretary of Transportation Ray LaHood called it a “big win.”  America 2050 (an offshoot of the Regional Plan Association of New York), “commended” the state for “taking a big step forward.”  Streetsblog called it a “major victory.”  While I respect what these organizations do in other contexts, this high speed rail vote is not a major victory, but a major defeat for common sense.

But apparently not willing to let California take the prize in the rail boondoggle category without a fight, Amtrak shortly thereafter issued a “vision” for rail in the Northeast Corridor that would provide faster service between Boston and Washington, DC – at a cost of $151 billion. Strange as it sounds, some commentators actually lauded Amtrak for reducing costs since the previous plan was $169 billion.  The Brookings Institution was measured in its reaction to the plan, but managed to describe it as “more rational.”   With Republicans seemingly safely in charge of the House for now, and large federal deficits projected for the mid-term future, $151 billion for Amtrak seems purest fantasy.

These developments are unfortunate because high speed rail could play an important role in US transportation, particularly in the Northeast. But that's unlikely to happen because of the indiscriminate way establishment advocates have supported anything with the “high speed rail” label attached, ranging from $2 billion, 110 MPH peak speed Toonerville Trolleys in Illinois that barely beat Megabus in terms of journey time to the California rail boondoggle, regardless of merit. All they know that if it claims to be high speed rail, they are in favor of it.

There are other people who take a more serious view. Unfortunately, they tend to be outsiders with little influence.  For example, Alon Levy suggested a set of near term, incremental Northeast Corridor improvements that might cost 90% less than Amtrak's plan.

$8 billion in stimulus dollars have gone to purchase us nothing of any real significance in terms of rail infrastructure. That money, invested wisely in high priority projects in the Northeast Corridor, could have made a big difference and started building a real demonstrated case for high speed rail investment in America. Unfortunately, the way high speed rail has been botched by its advocates, all the money we've spent on it has accomplished just the opposite. If California's Central Valley segment is built and the complete line is never finished, it will likely discredit high speed rail in America for the long term.

Aaron M. Renn is an independent writer on urban affairs and the founder of Telestrian, a data analysis and mapping tool.

CA route map by Wikipedia user CountZ.

How Fossil-Fuel Democrats Became An Endangered Species

$
0
0

In an election pivoting on jobs, energy could be the issue that comes back to haunt Barack Obama and the Democratic Party as the cultural and ideological schism between energy-producing Republican states and energy-dependent Democratic ones widens.

As the economy has sputtered since 2008, conventional energy has emerged as one of the few robust sources of high-paying work, adding roughly half a million jobs since 2007 as new technologies and changing market conditions have opened up a vast new supply of exploitable domestic reserves. This is good news for Mitt Romney: nine of the ten states that rely most heavily on the sector for jobs are solidly behind him. (Colorado, where polls show Obama with a narrow lead, is the one exception).

President Obama’s heavy-handed regulation of the booming old-energy economy—the moratorium on offshore drilling following the BP spoil, the decision to block the Keystone XL Pipeline, and the prospect of a fracking ban—and his embrace of green-energy policies has played well in the solidly-Democratic post-industrial coastal economies that he also depends on for fund-raising. But it’s left him with few friends in the energy belt that spans the Great Plains, the Gulf Coast, Appalachia and now some parts of the old rustbelt, despite his election-year claims of an “all-of-the-above” energy policy.

It’s a far cry from Bill Clinton, whose close ties with Great Plains and Gulf Coast Democrats and energy producers there helped him twice carry Louisiana, Kentucky and West Virginia—all states that appear to be solidly behind Romney this year.

Today, Democratic senators in regions that depend on fossil fuels are becoming an endangered species. Over the past two years, Virginia’s Jim Webb and Byron Dorgan and Kent Conrad, both from booming North Dakota, have announced their retirement or retired, while Montana’s Jon Tester has distanced himself from the president as he faces a difficult re-election fight. And that diminishing presence in turn means less intra-party resistance to any potential second-term plans to cut the burgeoning fossil-fuel business to size.

The administration’s hostility to the dirty business of energy, and the sector’s fear of new bans or regulations in a second Obama term that would gut the industry were perhaps best captured by the then-EPA administrator who claimed Administration policy was to “crucify” fossil fuel.

Yet as Obama pursues a 50-percent-plus-one re-election strategy reminiscent of President Bush in 2004, his energy approach has been embraced by his core constituents, particularly the public-sector union workers and urbanized “creative-class” members. This is particularly true in the coastal enclaves like New York and California that import much of their energy (and in California’s case in particular has declined to exploit its own considerable reserves). Sixty-percent of the electricity in Los Angeles, a key bastion of Obama support, comes from coal-fired plants in Utah and Arizona; much of the natural gas that provides nearly half of the power for California’s grid is imported. While Pennsylvania and Ohio have exploited their large shale reserves that have become vastly valuable in recent year thanks to new extraction techniques and shifting energy prices, New York State has yet to follow suit, even as New York City lacks the supply to match peak summer demand, forcing it to depend on an aging nuclear power plant at Indian Point that’s years overdue to close.

President Barack Obama defends his energy agenda during his visit to oil and gas production fields located on federal lands outside of Maljamar, N.M., Wednesday, March, 21, 2012. (Pablo Martinez Monsivais / AP Photo)

If anything, the pressure from environmental activists , many of them well-heeled and living far removed from power sources and the jobs they create, is for Obama to go even further. A few rich donors from the green lobby complain the President has not been environmentally correct enough; Mother Jones actually asked if Obama has been “morphing into Dick Cheney” on energy issues.

But for the most part, the coasts are on board with Obama’s energy policy. Silicon Valley and Wall Street have invested heavily in the renewable industries favored and frequently propped up by the administration, putting their money where Obama’s mouth is. Silicon Valley hegemons like venture capitalist John Doerr and Wall Street giants like Goldman  Sachs regard the green energy business as a profitable, state-supported way to grow their profits. One disgusted  venture investor described the investors in the heavily subsidized green game as “venture porkulists.

These investments are now critical to many powerful tech firms, who increasingly have little domestic involvement in the manufacturing businesses that was central to a prior generation of Silicon Valley titans. Google alone has invested more than a billion dollars in the green-energy sector, as the valley’s new dominant clique of venture capitalists and tech executives donate at record levels to the president’s re-election.

Nowhere is the element of choice inherent in energy policy more evident than in California, home to five of the nation’s twelve largest oil fields and energy reserves equal to those of Nigeria, the world’s tenth-largest producer. As high-paying energy jobs swell payrolls in the Great Plains, the Intermountain West and parts of the Gulf, the Golden State has double-digit unemployment, a collapsed inland economy and a series of bankrupt municipalities. Amidst a great national energy boom, California’s energy production has remained stunted even as the state’s draconian “renewable” energy mandates are slated to drive up its already high electricity rates. The state’s high cost of energy has impacted industry:  despite its vast human and natural resources, the Golden State, with 12 percent of the nation’s population received barely 2 percent of the country’s manufacturing expansions last year.

Such inattention to California’s resources may be  popular in wealthy precincts of Silicon Valley, San Francisco and west Los Angeles, but the state’s green approach has helped place traditionally manufacturing-oriented communities such as Oakland, east Los Angeles, San Bernardino and Stockton in deep distress. Despite central California’s vast deposits of oil and gas, unemployment rates in some oil-rich areas there are over 15 and sometimes even 20 percent. 

As economic forecaster Bill Watkins recently told an audience in hard-hit Santa Maria: “If you were in Texas, you’d be rich.”

Meanwhile  the fossil-fuel energy producers, related chemical manufacturers  and financiers who are getting rich, from the Koch Brothers to Chesapeake Energy and Arch Coal, have been investing in Romney and the super-PACs supporting him.

Much of the money they’re pouring in will likely be spent persuading voters in the four crucial energy states –long-time producers New Mexico and Colorado and emergent natural gas producers Ohio and Pennsylvania—that will be up for grabs in November. Colorado has generated more than 20,000 while new energy jobs since 2000, third highest in the nation, while Ohio and Pennsylvania combined have created 25,000 new energy jobs in that span—and that’s not counting the services those largely  well-paid workers demand or the new manufacturing jobs making pipes and compressors the industry creates. What all four contested states have in common is that their energy sectors are pitted against powerful competing interests, including true-blue urban constituents, and tourism and technology sectors that employ workers and industries more concerned with the local environment than with energy-driven growth.Still, a boom is a boom, and President Obama is doing his best to claim credit for the huge surge in oil and gas production under his watch, although the increase has been almost completely on private and state lands outside his reach. Production on federal lands has actually dropped. Yet his “all of the above” rhetoric comes off as more evenhanded and substantial than the drill- baby-drill GOP set.

Romney, though, can point to a series of Obama decisions and priorities—including the painfully slow resumption of Gulf Shore oil operations after the BP spill, the effective veto of the Keystone XL pipeline, and proposed EPA greenhouse gas restrictions—as mortal threats to the American energy boom. He can also contrast the economic rise of energy-friendly Texas with the troubles of hyper-green California.

Whether Romney, far from a master communicator, is savvy and bold enough to stick the point may prove decisive in November.

Joel Kotkin is executive editor of NewGeography.com and is a distinguished presidential fellow in urban futures at Chapman University, and contributing editor to the City Journal in New York. He is author of The City: A Global History. His newest book is The Next Hundred Million: America in 2050, released in February, 2010.

This piece originally appeared in The Daily Beast.

Oil well photo by BigStockPhoto.com.

China's French Connection

$
0
0

No two countries would appear more divergent than France and China, especially in the age of Eurozone collapse. One country represents the Asian future, while the other is the capital of the failed, if diverting, old world.

The French recently elected a socialist president and assembly on the basis that everyone should share the country’s deficits and decline. The Chinese, meanwhile, have enough surpluses to buy out the European Union, should they wish to exchange their EU debts for an equity stake. (Maybe they will choose to have Paris shipped east in boxes?)

To take the measure of the two economies — although I admit this survey lacks academic rigor — I recently crossed each country by rail.

In China, I rode a succession of trains, high-speed and low, between Beijing and Hong Kong, with stops along the way in Yenan (Mao’s revolutionary capital), Xian (of Terra Cotta Warrior fame), Chongqing (Chiang Kai-shek’s wartime capital), Zhuzhou (a rail junction), Guangzhou (used to be Canton) and Shenzhen (the biggest city near Hong Kong you’ve never heard of).

I have also recently taken a number of train trips between Geneva and Bordeaux and crossed “France profonde” through the mountainous Massif Central, or gone on more roundabout routes through Toulouse and Tours.

My conclusions, which even I find surprising: France has a better balance between its land and cities, as well as richer farms and a more sustaining political culture, even if the presidency is a reality show.

China, at least from a train window, seems to be devoting most of its budget surpluses to moving the population into fifty-story, high-rise apartment buildings, the dormitories of its industrial revolution.

Like France, China has a high-speed rail network that travels on segregated tracks, allowing for speeds close to 200 miles per hour. I went from Zhuzhou to Guangzhou in about four hours, a trip that used to take overnight. The stations of the expanding high-speed Chinese network, however, are outside the downtowns of most cities, so getting to them feels like a trip to the airport.

Unlike trips in France, most intercity trips in China take place on slow night trains, with thousands of passengers tucked into open couchette berths. On my trip south, I was usually assigned the cramped middle bunk and rode, even during the day, like “John Malkovich” on floor 7½.

The French have largely given up on night trains. My regional train from Geneva to Bordeaux is a milk run (skim, I would say, to judge by the amenities), with beautiful views but few passengers. French high speed trains — Trains à Grande Vitesse or TVGs — do go downtown, although the French have the annoying habit of routing every trip through Paris.

In the current economic crisis, however, funding is being bled from the rails, and many TGV cars look thread-worn. Nevertheless, the TGV remains the inspiration for the Chinese high-speed system, perhaps because many Communist leaders had warm memories of their Paris underground cells.

Sadly, Chinese cities retain few of their French inspirations. Apart from old Beijing and some quarters of Shanghai, Xian and Guangzhou, Chinese cities are faithful to Maoist doctrine in that that they serve as worker housing and base camps for industrial output.

I may, however, be one of the few who prefers Beijing over Paris; the biking is better and the hotels are cheaper. Nevertheless, the average Chinese city is going the way of Los Angeles and Phoenix. The streets are less forgiving to cyclists, pedestrians, and kids playing after school. The outskirts of Chinese cities are great walls of housing projects that probably can be seen from the moon.

In France, because I often travel with a bike, during waits between trains I sometimes go for a downtown spin, which has allowed me to discover the old world charms of Orleans, Tours, Toulouse, and Blois.

Because French cities were laid out in the eighteenth and nineteenth century and not in 2003, they have narrow streets, often unsuitable for cars, but perfect for walking, bikes and sidewalk cafés. Bordeaux, a hive of narrow streets and small, self-contained neighborhoods, is an excellent example of a car-unfriendly French city that is flourishing.

Away from the glittering high-rise buildings in places like Dalian and Shanghai, much of train-window China remains a poor country, a succession of terraced subsistence farms, cut out of rocky hillsides and inevitably encased in a steamy fog. Elsewhere, China has the fault lines of runaway development: a population confined to worker housing, and agricultural provinces that are stripped for minerals or exports.

By comparison, French trains are never far from verdant pastures or neatly tended vineyards. Ironically, China's detached “people’s” government is the largest consumer of first-growth French wines.

The wine industry is one of the few meeting points where the French and the Chinese find harmony. China is now fifth (ahead of the U.K.) in wine consumption, and at the high end nearly all of it comes from Bordeaux and Burgundy. (The low end is a concoction of bootlegged Algerian and Rhône reds.) The reason that the wines of Château Lafite Rothschild can command $2000 a bottle is because newly coined Chinese millionaires find it a must-have brand.

Since France produces a surfeit of wines, the trade should stimulate the economies of both countries for a long time. Nevertheless, French producers live on the precipice of Chinese wine tariffs, should the Beijing government want to promote its own vineyards south of Shanghai at the exclusion of those in Pauillac.

Which country will fare better in the coming decades: China with its Dickensian economic juggernaut, or France with its budget deficits, despite having well-fed cows and landscapes worthy of Monet?

Just because my Geneva to Bordeaux train crosses through the contours of an Impressionist painting does not mean that France will return to its imperial glories. Nor do China’s traffic jams mean that it will dissolve into Manchu feudalism. Furthermore, to paraphrase Chou En-lai on the French revolution, it may be “too soon to tell” if Chinese communal capitalism will put an end to the party or to free enterprise.

Ironically, France does have the surplus of a self-contained economy, even if now it is in hock to German debt markets. Similarly, China has the deficits of post-Maoism—something close to the state capitalism of fascism—including that the best that can said of its Politburo is that it keeps the high-speed trains running on time.

Personally, I hope that both countries do well. I love that in each I can take trains, get around by bike, read about the Revolution or the Franco-Prussian war, enjoy the cities—especially Beijing and Bordeaux—and, well, drink French wines.

Photo: The new high-speed rail station, Zhuzhou, China; from the studio of Matthew Brady.

Matthew Stevenson, a contributing editor of Harper's Magazine, is the author of Remembering the Twentieth Century Limited, a collection of historical travel essays. His next book is Whistle-Stopping America.

Are Millennials the Screwed Generation?

$
0
0

Today’s youth, both here and abroad, have been screwed by their parents’ fiscal profligacy and economic mismanagement. Neil Howe, a leading generational theorist, cites the “greed, shortsightedness, and blind partisanship” of the boomers, of whom he is one, for having “brought the global economy to its knees.”

How has this generation been screwed? Let’s count the ways, starting with the economy. No generation has suffered more from the Great Recession than the young. Median net worth of people under 35, according to the U.S. Census, fell 37 percent between 2005 and 2010; those over 65 took only a 13 percent hit.

The wealth gap today between younger and older Americans now stands as the widest on record. The median net worth of households headed by someone 65 or older is $170,494, 42 percent higher than in 1984, while the median net worth for younger-age households is $3,662, down 68 percent from a quarter century ago, according to an analysis by the Pew Research Center.

The older generation, notes Pew, were “the beneficiaries of good timing” in everything from a strong economy to a long rise in housing prices. In contrast, quick prospects for improvement are dismal for the younger generation.

One key reason: their indebted parents are not leaving their jobs, forcing younger people to put careers on hold. Since 2008 the percentage of the workforce under 25 has dropped 13.2 percent, according to the Bureau of Labor Statistics, while that of people over 55 has risen by 7.6 percent.

“Employers are often replacing entry-level positions meant for graduates with people who have more experience because the pool of applicants is so much larger. Basically when unemployment goes up, it disenfranchises the younger generation because they are the least qualified,” observes Kyle Storms, a recent graduate from Chapman University in California.

Overall the young suffer stubbornly high unemployment rates—and an even higher incidence of underemployment. The unemployment rate for people between 18 and 29 is 12 percent in the U.S., nearly 50 percent above the national average. That’s a far cry from the fearsome 50 percent rate seen in Spain or Greece, or the 35 percent in Italy and 22 percent in France and the U.K., but well above the 8 percent rate in Germany.

The screwed generation also enters adulthood loaded down by a mountain of boomer- and senior-incurred debt—debt that spirals ever more out of control. The public debt constitutes a toxic legacy handed over to offspring who will have to pay it off in at least three ways: through higher taxes, less infrastructure and social spending, and, fatefully, the prospect of painfully slow growth for the foreseeable future.

In the United States, the boomers’ bill has risen to about $50,000 a person. In Japan, the red ink for the next generation comes in at more than $95,000 a person. One nasty solution to pay for this growing debt is to tax workers and consumers. Both Germany and Japan, which appears about to double its VAT rate, have been exploring new taxes to pay for the pensions of the boomers.

The huge public-employee pensions now driving many states and cities—most recently Stockton, Calif.—toward the netherworld of bankruptcy represent an extreme case of intergenerational transfer from young to old. It’s a thoroughly rigged boomer game, providing guaranteed generous benefits to older public workers while handing the financial upper echelon a “Wall Street boondoggle” (to quote analyst Walter Russell Mead).

Then there is the debt that the millennials have incurred themselves. The average student, according to Forbes, already carries $12,700 in credit-card and other kinds of debt. Student loans have grown consistently over the last few decades to an average of $27,000 each. Nationwide in the U.S., tuition debt is close to $1 trillion.

This debt often results from the advice of teachers, largely boomers, that only more education—for which costs have risen at twice the rate of inflation since 2000—could solve the long-term issues of the young. “Our generation decided to go to school and continue into even higher forms of education like master’s and Ph.D. programs, thinking this will give us an edge,” notes Lizzie Guerra, a recent graduate from San Francisco State. “However, we found ourselves incredibly educated but drowning in piles of student loans with a job market that still isn’t hiring.”

More maddening still, the payback for this expensive education appears to be a chimera. Over 43 percent of recent graduates now working, according to a recent report by the Heldrich Center for Workforce Development, are at jobs that don’t require a college education. Some 16 percent of bartenders and almost the same percentage of parking attendants, notes Ohio State economics professor Richard Vedder, earned a bachelor’s degree or higher.

“I work at the Gap and Pacific Pak Ice, two jobs that I don’t see myself working long term nor jobs that are specific to my major,” notes recent University of Washington graduate Marshel L. Renz. “I’ve been applying to five jobs a week and have gotten nothing but rejections.”

Particularly hard hit are those from less prestigious schools or with majors in the humanities, notes a recent Pew study. Among 2011 law-school graduates, half could not find a job in the legal field nine months after finishing school. But it’s not just the lawyers and artists who are suffering. Overall the incomes earned by graduates have dropped over the last decade by 11 percent for men and 7.6 percent for women. No big surprise, then, that last year’s class suffered the highest level of stress on record, according to an annual survey of college freshmen taken over the past quarter century.

The proliferation of graduate degrees also impacts those many Americans who don’t go (or haven’t yet gone) to college. High-school graduates now find themselves competing with college graduates for basic jobs in service businesses. Unemployment among 16- to 19-year-olds this summer is nearly 25 percent, while for high-school graduates between 2009 and 2011, only 16 percent have found full-time work, and 22 percent work part time.

Once known for their optimism, many millennials are turning sour about the future. According to a Rutgers study, 56 percent of recent high-school graduates feel they would not be financially more successful than their parents; only 14 percent thought they’d do better. College education doesn’t seem to make a difference: 58 percent of recent graduates feel they won’t do as well as the previous generation. Only 16 percent thought they’d do better.

This perception builds on the growing notion among economists that the new generation must lower its expectations. Since the financial panic of 2008, “the new normal” has become conventional wisdom. Coined by Mohamed El-Erian at Pimco, it’s been used to describe our world as one “of muted Western growth, high unemployment and relatively orderly delevering.”

The libertarian Tyler Cowen, in his landmark work The Great Stagnation, makes many of the same points, claiming that the U.S. “frontier” has closed both technologically and in terms of human capital and resources. He maintains that we’ve already harvested “the low-hanging fruit” and that we now rest on a “technological plateau,” making any future economic progress difficult to achieve. Stagnation is not such a bad thing for people already established in college-campus jobs, think tanks, or powerful financial institutions. But it wipes out the hope for the new generation that they can achieve anything resembling the American Dream of their parents or even grandparents.

Inevitably, young people are delaying their leap into adulthood. Nearly a third of people between 18 and 34 have put off marriage or having a baby due to the recession, and a quarter have moved back to their parents’ homes, according to a Pew study. These decisions have helped cut the birthrate by 11 percent by 2011, while the marriage rate slumped 6.8 percent. The baby-boom echo generation could propel historically fecund America toward the kind of demographic disaster already evident in parts of Europe and Japan.

The worst effects of the “new normal” can be seen among noncollege graduates. Conservative analysts such as Charles Murray point out the deterioration of family life—as measured by illegitimacy and low marriage rates—among working-class whites; among white American women with only a high-school education, 44 percent of births are out of wedlock, up from 6 percent in 1970. With incomes dropping and higher unemployment, Murray predicts the emergence of a growing “white underclass” in the coming decade.

The prospect of downward mobility is most evident in recent discussions about the future of the housing market. Since World War II the expectation of each generation was to own property, preferably a single-family house. The large majority of boomers became homeowners during the Reagan-Clinton era. Yet it is increasingly fashionable to insist this “dream” must be expunged. If millennials ever move out of their parents’ house, they will live in apartments they don’t own. There’s a lot of talk about a “generation rent” replacing a primarily suburban ownership society with a new caste of city-dwelling renters. “I’m hoping that the millennial generation doesn’t set its sights on homeownership as a benchmark of economic stability,” sociologist Katherine Newman suggests, “because it’s going to be out of reach for so many of them.”

No doubt the prospects for homeownership will be tough in the years ahead. But it’s delusional to believe millennials don’t desire the same things as previous generations, note generational chroniclers Morley Winograd and Mike Hais. Survey research finds that 84 percent of 18- to 34-year-olds who are currently renting say that they intend to buy a home even if they can’t currently afford to do so; 64 percent said it was “very important” to have an opportunity to own their own home.

And where do millennials see their dream house? According to research at Frank Magid Associates, 43 percent describe suburbs as their “ideal place to live,” compared with just 31 percent of older generations. Even though big cities are often preferred among college graduates in their 20s, only 17 percent of millennials say they want to settle permanently in one. This was the same percentage of members of this generation who expressed a preference for living in rural or small-town America.

So far, the Great Recession has driven young people around the high-income world to the left. Generations growing up in recessions appear more amenable to arguments for government-mandated income redistribution. And since so few young people pay much in the way of taxes, they are less affronted by the prospect of forking over than older voters, who do. This left-leaning tendency has been on display in recent European elections. In France, 57 percent voters 18 to 24 supported the Socialist François Hollande, one of the reasons why the conservative Nicolas Sarkozy lost. Similarly, 37 percent of those in that age category voted for Syrizia, the far-left party in Greece.

But Winograd and Hais—and Democratic strategist Ruy Teixeira—say it’s not just economics working for the Democrats. Social issues such as gay marriage, women’s rights, and immigration—a large proportion of millennials are children of newcomers—tend to drive younger voters toward the Democrats. Half of millennials, for example, favor gay marriage, compared with a third of boomers, and some predict the Republican embrace of draconian social conservatism will serve to harden the Democratic tilt of millennials for the foreseeable future.

Yet Republicans may take heart from some of the more conservative values embraced by the young. As a group, millennials appear to be very family-oriented—being good parents is often their highest priority—and roughly two thirds claim to believe in God. And since their long-term aspirations are not so different from those of earlier generations—they still want to own a home in a nice, secure neighborhood—Republicans could make a case that their economic model will work better with their personal goals.

Right now, politics is just another place where American millennials are getting screwed. Republicans want to deport young Latinos while cutting investments, such as roads and skills education, that would benefit younger voters. Democrats, meanwhile, seem determined to mortgage the future with high spending on pensions, predominantly for aging boomers; cascading indebtedness; and economic policies unfriendly to the rapid growth necessary to assure upward mobility for the new generation.

This suggests millennials need to force the parties to cater to them and play hard to get. Being taken for granted, as African-Americans have been, does not always produce the best results for any demographic grouping. Politicians target “soccer moms,” “independents,” and suburban voters precisely because they are not predictable. Millennials should not want to be in anyone’s hip pocket.

Wanting the next generation to succeed is in everyone’s long-term interest. Eventually they will constitute the majority of parents, potential homeowners, and workers. This year they will comprise 24 percent of voting-age adults, up from 18 percent in 2008; by 2020 they will amount to a third of all eligible voters. And if, by then, they are still a screwed generation, they won’t be the only ones suffering. America will be screwed, too.

Research assistance by Gary Girod. Portrait interviews by Eliza Shapiro.

Joel Kotkin is executive editor of NewGeography.com and is a distinguished presidential fellow in urban futures at Chapman University, and contributing editor to the City Journal in New York. He is author of The City: A Global History. His newest book is The Next Hundred Million: America in 2050, released in February, 2010.

This piece originally appeared in Newsweek Magazine.

Unemployed photo by BigStockPhoto.com.

State of Chicago: The Decline and Rise

$
0
0

I’ve had it in my head for over a year now to do an in-depth exploration of Chicago, a project I’ve called “State of Chicago.” This is the first a series of pieces that expand on the themes in my recent article “The Second-Rate City?

First, I’d like to list three reasons why I wrote that piece:

1. To bring to the attention of Chicago the very poor statistical performance of the city on basic demographic and economic measures.
2. To write a corrective to the many national puff pieces that have been written on the city that totally overlooked its real and serious problems.
3. To lay out some frames that I had on the underlying causes that are different from the typical explanations, in particular the excessive focus on “global city” and the “cost of clout.”

As it turns out, Rahm Emanuel’s own economic plan and the OECD report beat me to the punch on point #1. As a lot of what I wanted to accomplish with State of Chicago was data oriented, my project is now much less ambitious than I’d originally intended since Chicago’s leaders are now, fortunately, owning up to the problems.

The Fall of Chicago

Today I want to start out by giving the prequel to my article: Chicago’s Rust Belt decline and subsequent comeback, particularly in the 90s. I think everybody knows that cities had a rough 70s and early 80s. It was the “Rotten Apple” era in New York, for example, a time of needle parks, mugger money, graffiti trains, a brush with bankruptcy, and much more.

Chicago had a similar rough patch. When Richard Longworth (now of Caught in the Middle and Global Midwest fame) returned to Chicago in 1976 from many years overseas as a foreign correspondent for the Chicago Tribune, it was to a grim, decaying city that, like so many big cities in America at the time, clearly was a city that did not work.

This was perhaps best symbolized by the city’s inept response to the Blizzard of ’79, which left the city paralyzed for days. Mayor Michael Bilandic’s blizzard response was widely credited for his subsequent re-election defeat. Old mayor Richard J. Daley’s City Hall alliance with business had preserved the Loop as a powerful, if somewhat drab, business district while so many other Midwest downtowns fell into ruin. But otherwise Chicago was a troubled, declining city covered by a veneer of boosterism.

In 1981 Longworth wrote a damning four part, front page series for the Chicago Tribune called “A City on the Brink” drawing a powerful portrait of a city in crisis. He noted that, “Chicago has become an economic invalid. The situation may be permanent.” The Economist, in a far cry from its praise in the 2000s, described the city as having little more than a “facade of downtown prosperity.”

The city was losing people, losing businesses, and losing jobs – even in the Loop. Manufacturing was collapsing and the middle class was fleeing, leading to neighborhood decline and eroding the city’s tax base, which in turn degraded the city services residents had come to expect and demand. The decline in services and neighborhoods drove more people way, which led to further declines, perpetuating a vicious cycle.

University of Illinois at Chicago Professor Pierre de Vise predicted, “I see very little hope for locating economic activities here again.” And a local business executive added, “Is the city being annihilated? It’s probably inevitable.” While careful to note that Chicago was not at the point of New York City’s brush with bankruptcy nadir, Longworth noted it was headed that direction and glumly asked, “What happens when a major city becomes a backwater?”

The city was failing on nearly every measure. I was struck by how similar Longworth’s litany of statistics were to my own. There was a big different however: back then things were way worse. Today the problems of Chicago take place against a backdrop of many areas of strength in the urban core and a secular uptrend in the fortunes of cities. Given that Chicago has come back from far more dire circumstances than it faces today, there’s reason for optimism in the present.

Chicago Reborn

As I noted in City Journal, during the 90s (probably starting in the late 80s), Chicago had a massive comeback. It gained people, it gained jobs, and the core reasserted itself. I moved to Chicago in 1992 when only a few select lakefront precincts were really gentrified. Though I lived in Lincoln Park, I was told not to move west of Racine, not because it was dangerous, but because it was dead. The area where I used to live near Belmont/Ashland/Lincoln was completely boarded up except for the Army-Navy surplus store. Recruiters for my company tried to sell me on the city by telling me it was now a location of the uber-hip coffee chain Starbucks. I watched vast tracts of the city transformed before my eyes. The 90s boom was real. I saw it. I felt it.

It also showed up in the data. I don’t want to go too crazy, but I wanted to look at some economic statistics. First, I want to look at metro area job growth in the 1990s for selected cities. I’ll show the percentage gains in a moment, but here’s the raw job growth for the ten largest US metros during the 1990s. (Top ten selected based on today’s 2010 census population).


Note: Data in thousands

Chicago actually had the third highest total job growth. Not only did metro Chicago outgrow New York and crush LA (which got bruised by the “peace dividend”), it actually added more total jobs than Houston, everybody’s darling today. Wow. And more than currently booming Washington, DC. In short, Chicago beat out its mature tier one peers while holding its own with the emerging boomtowns. Very impressive.

Here’s the percentage view:


Not as impressive vs. the emerging cities, but Chicago held its own with Boston (a big beneficiary of the dotcom boom) and more than doubled up traditional peers New York and LA. I think it’s fair to label Chicago an outperformer here.

Let’s do a quick look at unemployment rates for the big three:


As you can see, Chicago metro had a much lower unemployment rate than NYC or LA during most of the 90s. Since unemployment rate is available at the municipal level, here’s a quick look at the big three core cities. We’ll see again that even at the municipality level, the city of Chicago had a lower unemployment rate:


So in terms of quantitative measures, Chicago was winning in the 90s. But it also seemed to do well qualitatively. I don’t have GDP data going back to the 90s, but I do have per capita personal income. Here’s how the top ten cities fared:


Boston topped out, perhaps to be expected from the dotcom boom. But Chicago beat NYC and LA again, and also Washington, DC. (Interestingly, the southern boomtowns that did well on this metric in the 90s mostly got killed on it in the 2000s, Houston excepted).

So I think it’s fair to say that compared to its large mature peers, Chicago economically was the winner (or at least near the top depending on who you put in there) during the 1990s, along with Boston. This is the type of performance Chicago is capable of delivering.

But beyond the statistical measures, there were many qualitative improvements as well. For example, Chicago was really the early leader in quality of space. After Mayor Daley’s famous trip to Paris, he came back and encased the city in wrought iron. He also put in miles of streetscapes, with median planters, new streetlights and the like. (I happen to think the aesthetic style of these was not appropriate to Chicago, but they clearly upgraded the city in a big way). The CTA saw a brand new L line open to Midway Airport. New cultural facilities blossomed. For example, both the Chicago Symphony and the Lyric Opera undertook $100+ million building projects. And Daley even brought political stability back to the city after the turbulence Bilandic-Bryne years and the racially driven “Council Wars” of the 1980s.

In a post-Cold War global order, Chicago also emerged as a global city. No longer just a superpower of the American interior, Chicago came to play a critical role in the global economy, through its derivatives exchanges, its professional services complex, and its status as a transport and cultural hub. Globalization became the lens through which the city sees its role in the modern economy, and with some justification. By 2010, Foreign Policy magazine ranked Chicago as the sixth most important global city in the world, for example. Chicago began to regard itself no longer as merely the “Second City,” but as a global player in its own right.

So in the 1990s, Chicago was riding high. Little did the city know that with the dotcom collapse and the national economic trends of the 2000s, the city was about to enter a tailspin. But there was clearly a lot of real progress and change in the city and a lot for the city to feel good about and be proud of. Chicago was the big city champion of the 90s.

I don’t want that story to get lost and people to think I’m just picking on Chicago. I’m happy to shout out its accomplishments when merited. But when things aren’t going so well, the city likewise deserves people who are willing to tell the truth.

In the next installment, we’ll expand a bit on the troubles.

Aaron M. Renn is an independent writer on urban affairs and the founder of Telestrian, a data analysis and mapping tool. He writes at The Urbanophile, where this piece originally appeared.

Chicago skyline photo by BigStockPhoto.com.

Housing Affordability Protests Occurring in "Livable" Hong Kong, Not "Sprawling" Atlanta

$
0
0

The Economist has published another in its city rating series, under the headline "The Best city in the World." This one was the result of a contest examining ways to elaborate on its rating system. The winner, Filippo Lovato, added a spatial dimension to the ratings, which included a 5 point rating of "sprawl," a pejorative term for the natural expansion of cities (which in this article means urban areas, areas of continuous urban development). Much of the urban planning literature is pre-occupied with combating urban sprawl, though urban expansion continues virtually everywhere around the world, as cities add population and become more affluent.

Livability for Whom?

As Jon Copestake, the Editor of the Economist Intelligence Unit’s Cost of Living and Livability surveys and I discussed in front of a Property Institute of Western Australia meeting, The Economist livability ratings are not aimed at average resident households, but rather at an international audience, such as corporate executives and corporate relocation services. This distinction can be important.

Hong Kong was top ranked for livability in the new Economist list. Doubtless this is accurate for well paid executives posted temporarily, who are granted substantial housing allowances by their employers and who can live in luxury condominiums within a short walk or taxi ride to their jobs in Central (the core of the Hong Kong central business district).

For local residents, livability is measured differently than for jet-setters or corporate executives.

Hong Kong: Smart Growth Model

With the developed world's highest urban area density and lowest automobile market share, Hong Kong beguiles anti-sprawl "smart growth" crusaders, for whom these two characteristics are the "two great commandments."

The entire  Hong Kong urban form (urban area) is as dense as Manhattan at 67,000 per square mile (25,900 per square kilometer), but is more than twelve times the density of the New York urban area: the city and its “sprawling” surrounding suburbs (5,300 per square or 2,100 per square kilometer). Similarly, Hong Kong is somewhat more dense than the ville de Paris, but seven times the density of the Paris urban area (9,800 per square mile or 3,800 per square kilometer). This hyper-density combined with one of the world's strongest central business districts give Hong Kong a nearly 80% mass transit share of motorized travel, nearly 10 times that of the New York urban area and more than three times that of the Paris urban area (Figure 1).

"Livable" Hong Kong?

To its permanent and unsubsidized residents, though, Hong Kong's spatial Nirvana does not provide much in terms of livability.

Excessively Long Commutes Hong Kong's high density indicates that jobs and houses are relatively close to one another, which should indicate that commute times would be short. Not so. Commutes are among the longest in the developed world – only Tokyo residents take more time to get to work. (Figure 2)

The average one way commute is 46 minutes in Hong Kong, well above the developed world average of 33 minutes for urban areas over 5,000,000 population. By comparison, commuters in similarly sized Dallas-Fort Worth (26 minutes) and "gridlocked" Los Angeles (27 minutes) get to work much faster. Commuting also takes longer in Hong Kong than in Paris (34 minutes) and London (37 minutes).  Lengthy commutes impose an economic price and make Hong Kong less livable.

Exorbitant House Prices: Hong Kong’s housing, the largest household budget item, is profoundly unaffordable. The 8th Annual Demographia International Housing Affordability Survey rates Hong Kong as the most costly out of 325 metropolitan areas. The median house price in Hong Kong's is 12.6 times the median annual gross household income (the "median multiple"), which leaves little more than a pittance in discretionary income for many households. Perhaps this is why Hong Kong's fertility rate has fallen to rock bottom levels near the lowest on the planet – people cannot afford kids.

Even during the housing bubble, coastal California never became so unaffordable. Hong Kong housing is nearly twice as costly as San Francisco (6.7 median multiple) and more than four times as costly as Dallas-Fort Worth (2.9), Houston (2.9) or Atlanta (Figure 3).

Concern about housing affordability has become so intense that it is an issue in public protests, which The Economist reports to have drawn up to 400,000 people earlier this month (link to photo). Exorbitant house prices make Hong Kong less livable.

"Sprawling" Atlanta

Things are much different in "sprawling" Atlanta, which The Economist's spatial list ranks as the worst among the US entries. Atlanta is at the opposite end of the density spectrum from Hong Kong, with the lowest urban population density of any major developed world urban area.

Short Commutes: Atlanta's low density would suggest that jobs and houses must be so far apart that commute times are very long. Again, not so. Atlanta commuters have among the shortest travel times (29 minutes) in the world among urban areas of similar size (see Note: Jobs-Housing Balance). Shorter travel times make Atlanta more livable (Figure 4).

Other similarly sized US urban areas do even better, such as Dallas-Fort Worth (26 minutes) and Atlanta's leaders know that traffic congestion need to be eased to improve Atlanta's competitiveness. But the political process politics has offered a dysfunctional plan that would spend more than half of a new tax on mass transit, which is used by only the one percent. Less than one half of the money would be spent on the roads that the 99 percent use (Figure 5). Any strong growth will overwhelm the stingy highway improvements, and if the voters approve the July 31 referendum, Atlanta's travel time advantage over Hong Kong could narrow.

Affordable House Prices: Despite being the bane of planning orthodoxy, Atlanta's has far better housing affordability than Hong Kong. The median multiple is 1.9, compared to Hong Kong's 12.6. Hong Kongers pay six times as much of their income for their houses (which are also two-thirds smaller than in Atlanta). So far, there have been no protests against Atlanta's low house prices. Better housing affordability makes Atlanta area more livable.  

The Hong Kong Model

Hong Kong's high density (more than double that of any other large developed world urban area) is an accident of history, the result of geo-politics, not urban planning. Further, China's impressive new cities are being built at a small fraction of Hong Kong densities. Yet, Hong Kong has given much to the world. Not least is the fact that its market oriented economy served as the model for economic reform which has radically improved livability for hundreds of millions of people in China.

Further, Hong Kong is attractive as one of the world's premier tourist destinations. For aficionados of cities, like me, Hong Kong is intensely interesting. It is the ultimate in urbanization. It is a wonderful place to visit and to live – if someone else is paying the bills.

However, the interplay between Hong Kong's hyper-dense urban form and its transportation system burdens Hong Kong residents dearly, both in time and money. For them, Hong Kong is hardly a model of livability.

-------------------

Note: Commuting in Dallas-Fort Worth: Larger Dallas-Fort Worth has faster average work trip travel times than Atlanta, at 26 minutes, which are principally are aided by its much superior freeway (motorway) systems and arterial street (non-freeway boulevard) systems. Transit carries about one-half the share (0.6%) of travel in Dallas-Fort Worth as in Atlanta.

Note: Jobs-Housing Balance: One of urban planning's principal goals is to achieve a jobs-housing balance, wherein jobs and housing are so close that people can walk to work or use transit, minimizing travel times and distances. Hong Kong is best in this, with its small urban footprint. Yet, despite having achieved the ultimate, it takes Hong Kongers much longer to get to work than Atlantans. The comparison of Hong Kong and Atlanta shows this theoretical measure to be of little importance. A better indicator of the jobs-housing balance is practical – how long it takes to get to work.

Note: Travel Times by Car and Transit: Mass transit has substantially longer average work trip travel times than cars in nearly all of the world metropolitan areas for which data is available. In Atlanta, the average work trip by car (single-occupancy) was 29 minutes in 2007, compared to 54 minutes for mass transit.

----------

Wendell Cox is a Visiting Professor, Conservatoire National des Arts et Metiers, Paris and the author of “War on the Dream: How Anti-Sprawl Policy Threatens the Quality of Life.”

Photograph: Kowloon, Hong Kong (by author)


The New Geography Of Success In The U.S. And The Trap Of The 'New Normal'

$
0
0

This year’s presidential election is fast becoming an ode to diminished expectations. Neither candidate is advancing a reasonable refutation of the conventional wisdom that America is in the grips of a “new normal” — an era of low growth, persistently high unemployment and less upward mobility, particularly for the working class.

Certainly recent economic news of slowing growth and job creation bolster the pessimists’ case. But Americans may face far better prospects than portrayed by our dueling presidential mediocrities. Let’s look at those states that have found their own way out of the “new normal,” in some cases reversing all the losses of the Great Recession and then some.

The states that have added the most jobs since 2007 — Texas, North Dakota, Louisiana, Oklahoma and Alaska – are located in a vast energy and commodities corridor extending from the western Gulf to the northern tip of the Continent. New York and Washington, D.C., prime beneficiaries of monetary easing and a growing federal government, have also clawed back.

But the big winners are in the central energy corridor. Since 2007, Texas has created almost five times as many jobs as New York; California is still down almost 900,000 jobs and Illinois is off close to 300,000.

This should represent what Walter Russell Mead calls “a new geography of power,” the anointing of new places Americans and business go to find opportunity. One example: five of the six best cities for starting over in 2012, according to TheStreet.com, were in the Dakotas, Utah, Iowa and Nebraska.

Why the energy and agriculture states? Since the onset of the new century, much of the sustained growth in the world has taken place not in the financial or information capitals, but in regions that produce basic commodities like energy and food. In the high-income world, the consistently best-performing countries since 2008 have also tended to be resource-rich ones such as Norway, Australia and Canada.Blue social policies work best when financed by petro-dollars and minerals sales.

Domestic and European demand may fall in the next few years, but increasingly global commodity and energy markets are driven by the expanding needs of the major developing countries. This has helped keep energy prices high, particularly for oil. Being good at exploration and drilling has been more profitable than social media. Texas alone has added nearly 200,000 jobs in its oil and gas sector over the past decade and Oklahoma some 45,000. The Lone Star energy sector created twice as many jobs as exist in the software sector in San Jose and San Francisco combined. These jobs have been an outstanding driver of high-wage employment, with an average salary of upwards of $75,000, and located usually in less expensive areas.

Choice plays an important part in the growth. The energy boom has supercharged the economies of the states that have welcomed this growth, including Texas, Oklahoma, Louisiana, North Dakota, Wyoming and Alaska. It has not been much help to New York and California, which are reluctant to crack rocks to extract even relatively cleaner carbon-based fuels like natural gas. In contrast, long-suffering Ohio and Pennsylvania, where there have been significant new finds of shale oil and gas, appear to have decided that Texas, not California, is the model for spurring growth.

The energy-producing states can look forward to a bright future in the long run. U.S. oil and Canadian reserves now stand at over 2 trillion barrels and constitute more than three times the total estimated reserves of the Middle East and North Africa. Observers such as the New America Foundation’s Michael Lind believe that new discoveries, particularly of natural gas, mean that we might actually be living in an era of “peak renewables,” and at the onset of a “very long age of fossil fuels.”

Growth of these sectors — along with construction and manufacturing — could prove critical to our beleaguered working class. There’s not much respect among the university-dominated pundit class for people who work with  their hands or have specific tangible  skills. Instead they need to lower their expectations and seek, as Slate recently suggested, to find work “in the service sector supporting America’s innovative class.”

In this neo-Victorian society, the “new normal” means a society dominated by  “innovative” or “creative” masters and their chosen, lucky servants. Leave your job and family in the Midwest or Nevada to become a toenail painter in Silicon Valley, San Francisco or Boston. Besides losing any sense of one’s independence, it’s hard to see how a barber or gardener can live decently, particularly with a family, in such expensive places.

This bleak reality may not inevitable, though. In many places construction employment is on the rise from its nadir in 2010. This recovery has been a nationwide phenomena but is, not surprisingly, most evident in growth states like Montana, Colorado, Indiana, Iowa, Nebraska, Tennessee and Utah.

At the same time over the last two years the nation has added more than 400,000 manufacturing jobs, led by the industrial states hit hardest by the recession. Though these gains are small compared to the losses earlier in the decade, the growth is encouraging; automakers and other industries already are complaining about severe shortages of skilled labor. Maybe, after all, life as a dog-walker and hostel denizen in Palo Alto is not the best one can hope for if you can make enough to afford a nice suburban house outside Columbus or Detroit.

The pundit class may be ready to write off the American dream but many Midwest states are working to restore it. Over the past two years Michigan and Ohio have experienced the biggest drop in unemployment of any states in the union; Michigan leads the way with a drop of almost five percentage points, while Ohio comes in second with a nearly three-point decline. Other key Great Lakes battlegrounds—Wisconsin, Indiana and arguably Missouri—have also seen two-point drops in their unemployment numbers.

Why is this happening? A lot of it has to do with business-friendly state regimes. Unlike Illinois, increasingly the sad sack  of the Midwest, these states have cut taxes, worked to increase the availability of skill training and streamlined regulations. This has allowed them to take advantage of new opportunities.

Improving the business climate represents the third critical element for overcoming the new normal. Most rundowns of the states with consistently favorable business and tax climates – as judged by executives — start with Texas, Utah and South Dakota. Many states that are recovering best from the recession, like Louisiana, Wisconsin, Florida, Ohio, Michigan and Arizona, all have been improving their rankings in business surveys over recent years.

But this should not be seen as an exclusively red state phenomenon. Some blue states as well, notably Washington, have worked hard to keep taxes tolerable and have promoted a rapid expansion of their  industrial sector. Democratic-leaning Colorado, under the leadership of pragmatic Gov. John Hickenlooper, has also strived to main a good business climate and promote growth.

What works, it appears, is not the mindless embrace of GOP or Democratic ideology, but a model that drives economic growth. It’s not rocket science: sensible regulation, moderate taxes and investments to spur job creation and productivity. “There is no Democratic or Republican way to sweep streets,” legendary New York City Mayor Fiorello LaGuardia once remarked and the same is true of economic growth.

The stories of the successful states tell us the key to success lies  in promoting basic industries like energy, agriculture and manufacturing — which then create business service and high-skilled jobs — combined with a broad agenda favorable to entrepreneurs of all kinds. If only one of our presidential candidates would get the message.

For more about how states are defying the "new normal," read the 2012 Enterprising States: Policies that Produce report, authored by Joel Kotkin and Praxis Strategy Group.

Joel Kotkin is executive editor of NewGeography.com and is a distinguished presidential fellow in urban futures at Chapman University, and contributing editor to the City Journal in New York. He is author of The City: A Global History. His newest book is The Next Hundred Million: America in 2050, released in February, 2010.

This piece originally appeared in Forbes.

Auto manufacturing photo by BigStockPhoto.com.

State of Chicago: The New Century Struggle

$
0
0

This is the second installment in my “State of Chicago” series. Read part one here.

Last time I looked at Chicago’s 70s and early 80s horrible struggles followed by rebirth and robust out-performance during the 1990s. Today we turn our attention to the first decade of the 21st century. During the 2000s, Chicago experienced a bit of a two-track performance. Parts of the urban core continued to grow robustly, fueled by the real estate bubble and perhaps the greatest urban condo building boom in America. The culinary, cultural, and other scenes in Chicago only improved. Yet while there was a solid core of health at the center, the overall city and region stumbled badly with aggregate statistics that were, bluntly, awful in most respects. I’ve detailed these elsewhere already so won’t go in depth, but let’s review. These are metro area statistics unless otherwise noted.

Population

I already discussed how Chicago got shellacked in the 2010 Census. It was the only one of the 15 largest municipalities in the United States as of 2010 to lose population. The cities of New York, Los Angeles, and San Francisco hit all time record high populations. Philadelphia and DC grew for the first time since 1950, and Boston continued growing. But Chicago has now rolled back its population clock a hundred years and stands at its lowest population since 1910.

Chicago’s metro population growth of 4% was less than half the national average, and virtually all of that came at the exurban fringe. Chicagoland ranked 40 out of 51 large metros for population growth, though it did beat New York, LA, and Boston on a regional basis, which is positive.

International Population

This previous data was all from previous writings. I want to highlight a couple of other areas of demographic weakness though. First is international population. Chicago’s percentage of foreign born residents is 17.6%, which beats the national average, but trails New York and LA by over ten percentage points. It ranked 5 out of the 10 largest US metros. On a growth basis in foreign born population, Chicago did beat New York and LA. Those three were at the bottom in the percentage growth category, most likely because they all started from relatively high bases of total foreign born population. On a total change basis Chicago ranked 7th, with New York #1, but sick man LA brought up the bottom, a stunning change of fortunes for them.

The city of Chicago itself seems to have lost its allure to immigrants. The foreign born population of the city actually declined during the 2000s. Even during a decade of huge Hispanic population growth nationally, Chicago barely grew its Hispanic population. The city of Indianapolis, about a third of Chicago’s size, added nearly twice as many total Hispanic residents. To the extent that immigrants now see Chicago as an opportunity zone, it appears to be suburban Chicago.

Education

Chicago’s college degree attainment is in the middle of the pack for the top 10, ranking #5. Considering it came from an industrial heritage, I think this is pretty good.


However, Chicago only ranked 8th out of the top 10 in the growth in population with bachelor’s degrees.


This hardly suggests that metro Chicago is a talent magnet. If you look at the numbers vs. other large Midwest metros, Chicago is healthy, but not looking like it is pulling away from the pack. I don’t see anything to suggest that Chicago is hoovering up all the college grads in the Midwest.

Economy

Chicago lost 323,000 jobs during the 2000s, or 7.1%. The was the worst performance on a percentage basis of any of the 10 largest US metros:


One of the stats that took some flak from my City Journal piece was that private sector employment in the Loop had dropped by 18.6% during the 2000s. This seems at odds with the massive skyscraper boom and other improvements. This wasn’t my stat. It came from a Chicago Loop Alliance report, and they commissioned a credible analytics firm to do the work, and the data was also reported by the Chicago Sun-Times, so I believe it is solid. A few things to consider:

- This figure is for the Loop, not the Central Area (a bigger construct). The Loop does have the majority of the Central Area jobs, however.
- Much of the construction was residential, not commercial. Also, things like the booming Loop U probably brought in more students than jobs.
- Keep in mind that 2000 was the peak of the dotcom bubble. For reasons I’ll explore later, I believe this hurt Chicago badly. So there’s a tough comp (also why the Bay Area and to a lesser extent Boston look bad on comps vs 2000).
- Consider major Chicago companies that totally went out of business: Arthur Andersen and Whitman-Hart come to mind.
- Also consider that pledges of added jobs generally are trumpeted to the sky, while jobs are often cut silently as much as possible.

Looking at unemployment rate in our Chicago vs. NYC/LA chart from before, we now see that Chicago is no longer winning, though is beating LA:


Chicago is a large economy, but not a particularly high value added one. Out of the ten largest metros, Chicago ranks 8th in per capita GDP. (Chicago is 3rd among large Midwest metros on this figure)


Chicago also ranked eighth in real per capita GDP growth over the decade.


Chicago ranked 5th out of 10 in per capita personal income, beating LA:


But Chicago ranked only 8th out of 10 in PCPI growth:


On the whole, this is a rather uninspiring collection of economic statistics for the Windy City, particularly after it did so well in the 1990s.

Fiscal Crisis

No discussion of Chicago’s problems in the 2000s would be complete without a review of its fiscal problems. However, as I already gave the numbers in my City Journal article, I won’t repeat them here. If anything, the problem has only gotten worse since that went to press. While Chicago may not be the worst municipality in terms of fiscal issues, Illinois is the worst state, and that will continue to be a drag until it’s addressed.

Crime

Among the biggest complaints about my article was that I didn’t address the crime problem in Chicago. Without a doubt, crime is a problem. Murders are up 38% or so just in 2012. The city of Chicago has a much higher murder rate than the cities of New York or Los Angeles. There has also been a national headline grabbing series of high profile attacks in affluent areas like the Gold Coast and Streeterville. The strength of the Chicago Police Department is somewhere between 500-1000 officers short of where it should be.

I’m not the best equipped person to talk about crime, but I actually think the crime problem is overstated. Yes, it’s serious. The murder rate especially is troubling. But analyses I’ve read suggest that overall crime isn’t spiraling out of control in Chicago. Also, flash mob type attacks are happening across the country, in places ranging from Philadelphia to Portland. This isn’t a unique to Chicago situation. So I don’t want to claim that Chicago’s crime problems are uniquely bad, though they shouldn’t be minimized.

Without a doubt the incredible collapse in crime in New York perhaps more than any other single factor fueled that city’s comeback, and it wouldn’t surprise me if it were a big factor in that city’s out performance in the 2000s. Mark Bergen cited some interesting research that suggested that for every murder in your city, 70 people move out. If Chicago had matched New York’s crime performance, it would have held steady or even gained population based on this relationship. If true, wow.

Regardless, public safety is job #1 for any mayor, so Rahm Emanuel is rightly feeling the heat on this even if he can’t necessarily be blamed for what’s going on.

Schools

Others have cited Chicago’s poor public school system. Again, I’m not sure Chicago’s schools are any worse than any other big city system, and there are a number of magnet and neighborhood schools that are now attracting the children of the well-off. I’d have to see something that suggested Chicago took a turn for the worse on schools in the 2000s on a comparative basis.

Conclusion

There are more statistics that could be given, and if you want them, I suggest reading the very data rich OECD Territorial Review of Chicago.

On the whole I think it’s pretty clear that there was trouble in Chicago during the 2000s – and more trouble than most large cities experienced during what was a tough decade nationally.

Some rightly noted that I discuss the divergent performance of Chicago in the 1990s vs the 2000s, but that my structural factors that weaken Chicago were probably the same in both decades. So why the difference? I want people to know I plan to address that in a future post shortly, but next up we’ll have a look at Chicago’s present day strengths before moving on.

Read part 1 in this series.

Aaron M. Renn is an independent writer on urban affairs and the founder of Telestrian, a data analysis and mapping tool. He writes at The Urbanophile, where this piece originally appeared.

Photo by smik67.

London Olympics 2012: Let the Games End

$
0
0

Why does anyone persist with the Greek mythology that the Olympics are an engine of economic development, sportsmanship, or peace on earth? London is spending $15 billion on the hope that it can sell enough tickets to synchronized swimming, and earn enough from television ads, to cover the costs of the 30,000 rent-a-cops and military personnel being deployed in the spirit of Olympic harmony.

Even though the Games break few economic records, except those for non-performing sovereign debts, governments around the world scramble madly every four years for the right to act as host, as if influence peddling were an Olympic sport.

The original cost estimate, sold to the British public to convince them to get behind the bid for the 2012 Games, was about $4 billion. Those budget forecasts imagined that, after the event, Olympic sites would be recycled for use as schools, homes for the aged, and handicapped parking, even though earlier Olympic cities have found little use for their table tennis stadiums and aquatic centers.

In 2005, London beat out Paris (narrowly), New York, Madrid, and Moscow for the right, if not the privilege, to spend billions of dollars (that no one has) on a temporary Olympic village, a badminton complex, and swimming pools suitable for the American relayers to lap swimmers from places like Albania and Costa Rica.

Those who advocate Olympian edifice dreams include smiling politicians who can dole out sweetheart construction contracts; national sports associations, whose budgets are commensurate with gold-medal production; the International Olympic Committee, which in the past has been something of a Dream Team for backhand payments; and the television networks, which use the Games to fill the dog days of August and to develop various story-lines around medal-gobbling athletes (see Michael Phelps) or mildly voyeuristic content (women’s beach volleyball comes to mind).

Everyone wins at the Olympics: stadium contractors, strutting central governments, and athletes who place high enough to be crowned with the laurels of corporate sponsorship. Well, everyone except the bondholders, who are left with little more than folded tents when the circus leaves town after three weeks of breathless commentary about women’s weightlifting.

By chance, I have been to many of the cities that have hosted recent summer Games — Barcelona, Moscow, Beijing, Athens, and Seoul. In nearly each locale the thought crossed my mind that city residents have little more to show for their indebted billions than a few light-rail lines, perhaps an airport facelift, and impractical buildings that can be converted only into minimum-security prisons.

Beijing still has its iconic Bird’s Nest and Water Cube, although neither stadium is used now for anything more than tourist photography and an aqua park.

My son Charles and I spent a week driving around Greece after the 2004 Games. As best as we could tell, all Athens got for its now-bad loans were signs pointing the way to the Olympic Sailing Center (we even found these billboards miles from the sea), and a light-rail connection to Piraeus. Weeds covered the infield of the softball stadium.

Barcelona, the 1992 host, ended up with some new apartment buildings — since the Olympics were played in downtown areas — a few marinas, and of course light-rail. Many cities, however, have successfully put up apartment blocks without staging a field hockey tournament.

Nor did Moscow get the political bounce it had angled for when it hosted the 1980 summer Olympics. In protest over the Russian invasion of Afghanistan, the United States and many allies refused to send teams, giving the Games the feel of a Warsaw Pact scout jamboree. The paint peeled off the Olympic village faster than some of the times in the marathon. (In London, the US has decided against boycotting its own invasion of Afghanistan.)

In theory, politics have nothing to do with the Games, although by organizing teams according to countries, the Olympic Committee has ensured that the spectacle is best understood as the continuation of war by other means, including archery and (in 1900) live pigeon shooting.

When the modern Olympics were revived in 1896, individual athletes paid their own way to Athens to compete as amateurs. Now, nearly all nations field the equivalent of the East German swim team, a squad bred in laboratory test tubes to demonstrate a triumph of the will.

The reason terrorists have the Games on their hit lists (Munich in 1972 was the worst example) is because the governments that they revile enter the stadiums with such wild displays of flag waving, as though the opening ceremony were a bullfight. At the London Games, security contracts are worth more than gold medals. For example, the British army is deploying surface-to-air missiles near the Olympic Stadium (apparently javelins no longer do the trick), and the FBI, in theory an exclusively domestic US Agency, is sending over about 500 agents, even though it was the Secret Service that won the regional escort trials in Cartagena.

Does the corporate business of the Olympics negate the achievements of the athletes? Am I so cold-hearted that I cannot admire Joan Benoit Samuelson coming home in 1984 with the gold or Fosbury’s flop? Not at all. I enjoy watching Moldova lose at water polo as much as the next American. At the same time, there is something cartoonish about NBA All-stars dunking over a Latvian small forward.

Were the decision mine, I would let the Olympics go the way of Nuremberg rallies. The Games strike me as ruinous to city finances and bad for sport. Should not the goal of the Olympic movement be to encourage more players and fewer spectators? Instead, the Games are a celebration of reclining consumerism. At least the athletes get to go through 100,000 condoms in 17 days.

Nor does any sporting event that requires the protection of thousands of soldiers, surface-to-air missiles, and 24/7 cable coverage strike me as the spiritual heir of the Games first contested in a Greek sanctuary.

Several school vacations ago, I took my younger daughter to Olympia, located in the western Peloponnese. We were tracking down the ancient wonders of the world, and Olympia once had a huge gold statue of Zeus, until “promoters” stripped it for parts and carted off the gold to Aleppo on donkeys.

We strolled around the original Olympic stadium, which even today could be built for about $200,000. The “seats” are slopes of grassy lawn, and the field of dreams is covered with dirt. The rest of the Olympic village is a few pine trees and some worn temples, but it’s magical.

Even during times of conflict, from 700 BC to 400 AD athletes came to Olympia from the contours of the Greek world, and left for home, if successful, only with olive branches in their hair. Along with paying honor to Zeus, the ancient Olympics celebrated athletic achievement, not prime-time nationalism or Coca-Cola. To show modesty, athletes were naked for their competitions. The Games ended only when Christianity moved to wipe out what it viewed as a pagan ritual.

At the end of three weeks of the London Games, even if the British army has had to shoot off a few of its surface-to-air missiles, TV commentators will pronounce the Games an immortal success, a triumph of Spartan proportions, and an epic not seen since Jason came back with the golden fleece.

Then, in three years, if not sooner, London will get the $15 billion invoice for its fun summer, and all it will have to show for it will be a few used diving boards and, with luck, some new light-rail. In the words of George Best, the great Northern Irish footballer: “I spent a lot of money on booze, birds and fast cars. The rest I just squandered.”

Flickr photo by Jesse Scott / twowaystairs - Wenlock, the 2012 Olympic mascot.

Matthew Stevenson, a contributing editor of Harper's Magazine, is the author of Remembering the Twentieth Century Limited, a collection of historical travel essays. His next book is Whistle-Stopping America.

The Evolving Urban Form: London

$
0
0

The 2011 census results show that London (the Greater London Authority, which is Inner and Outer London) experienced its greatest percentage population growth in more than 100 years (1891 to 1901). London added nearly 1,000,000 new residents since 2001. That growth, however, is not an indication that "people are moving back to the city." On the contrary, National Statistics data indicates that London lost 740,000 domestic migrants between 2001 and 2011. The continuing core net domestic migration losses have been replicated in other major European metropolitan core areas, such as Milan, Vienna, Stockholm and Helsinki.

Instead as typical in major European core municipalities, the vast majority of the growth in London has come from net international migration. London added 690,000 residents between 2001 and 2010. This pattern has become more prevalent since European Union enlargement, when Eastern Europeans began moving in much larger numbers to the United Kingdom and other richer areas of the old EU-15.
London first became the world's largest urban area in the first quarter of the 19th century, displacing Beijing. At that time, London was approaching 1.4 million residents, living in an urban area of approximately 15 square miles. Today, Inner London, the Outer London suburbs and two rings of exurbs spread 10,500 square miles (27,000 square miles), with a population of 20.3 million. Beijing, meanwhile, has grown so fast that it may once again surpass London in the next decade. However, other metropolitan regions are much larger, such as Tokyo and Jakarta.

Meanwhile, the urban area (the continuous built up area), circumscribed for more than one-half century by the Greenbelt, appears to have a population of 9.5 million, which would place it 27th in population in the world.

Over the past century, London has experienced substantial ups and downs in its population and still remains below its 1939 population, even with the large gain over the past decade. Over the same period, Inner London lost millions of its residents and only recently has begun to gain some back, largely due to net international migration gains. Outer London gained in the first half of the 20th century, plateaued and then also gained strongly in the last decade. The exurban areas virtually monopolized growth for most of the post-World War II period (Table) until recently.


London Region: Population 1891-2011
Year London Region London (Greater London Authority) Inner London (Historical Core) Outer London (Suburbs) Exurbs (Outside Greenbelt) 1st Exurban Ring (Historical Counties Adjacent to Green Belt) 2nd Exurban Ring
1891 7,752,000 5,574,000 4,432,000 1,142,000 2,178,000 595,000 1,583,000
1901 8,931,000 6,507,000 4,898,000 1,609,000 2,424,000 691,000 1,733,000
1911 11,526,000 7,162,000 5,002,000 2,160,000 4,366,000 2,365,000 2,001,000
1921 12,071,000 7,386,000 4,978,000 2,408,000 4,684,000 2,553,000 2,131,000
1931 13,229,000 8,111,000 4,898,000 3,213,000 5,119,000 2,805,000 2,314,000
1939 8,617,000 4,441,000 4,176,000
1951 14,832,000 8,193,000 3,680,000 4,513,000 6,635,000 3,891,000 2,744,000
1961 15,911,000 7,997,094 3,492,881 4,504,213 7,918,000 4,720,000 3,198,000
1971 17,028,000 7,453,000 3,031,000 4,422,000 9,659,000 5,894,000 3,765,000
1981 16,644,000 6,713,000 2,498,000 4,215,000 10,035,000 6,127,000 3,908,000
1991 17,139,000 6,393,000 2,343,000 4,050,000 10,746,000 6,497,000 4,249,000
2001 18,313,000 7,172,000 2,766,000 4,406,000 11,141,000 6,773,000 4,368,000
2011 20,256,700 8,164,000 3,222,000 4,942,000 12,092,700 7,318,700 4,774,000
Sources
Census except 1939
Greater London Authority, 1939


The London Region

The London region is composed of the Greater London Authority (GLA), which includes Inner London, the historical core municipality, covering approximately the same geographical area as the old London County Council from the 1890s to the 1960s and Outer London, the great suburban expanse consisting of detached and semi-detached housing.

GLA is surrounded by the Greenbelt, established to contain the expansion of the urban area after World War II, and, at least at first, to decentralize London's unhealthy and overcrowded conditions. Beyond the Greenbelt are the East of England and the Southeast, which are composed of a first exurban ring of historical county areas, adjacent to the Greenbelt, and a second ring of historical county areas in the East and Southeast, beyond the first ring. Virtually all new urban expansion in the London region was forced into the exurbs by the Greenbelt. As a result, all of the London region's growth (6 million) since World War II has been outside the Greenbelt (Figure 1).

Inner London

Inner London has been a population growth miracle over the past two decades. The 2011 population was 3.2 million, up more than 450,000 from 2001 and nearly 900,000 since 1991. However, the 1991 figure of 2.3 million was more than one-half below the 5,000,000 peak reached in 1911. Even though historical core city losses are typical (where geography is held constant), Inner London's loss was huge, at more double those sustained in Chicago (since 1950) and Paris (since 1921). The core of Inner London was developed as a walking city and expanded substantially with the coming of transit.  At approximately 26,000 residents per square mile (10,000 per square kilometer), Inner London is less than one-half the density of the ville de Paris and far less dense not only than Manhattan but even less dense than the New York City boroughs of Brooklyn and the Bronx.

Yet despite the recent increases, inner London's 2011 population is lower than counted in the 1861 census (yes, 1861) Even  with the population increase Inner London lost 390,000 domestic migrants (Figure 2) to other parts of Great Britain between 2001 and 2010 (the detailed 2011 data is not yet available at this level).

Tower Hamlets, one of London's 32 boroughs, is an example of this population roller-coaster. Tower Hamlets is located just to the east of the Tower Bridge in Inner London on the north bank of the Thames. It is home to substantial new development spurred by the rapid growth of the financial services industry both in the "square mile" ("city of London) and Canary Wharf. Tower Hamlets grew to 254,000 in 2011, a nearly 80 percent increase from the 142,000 registered in 1981, less than its 1801 population (Note: London Boroughs). But like Inner London, Tower Hamlets used to be much more populous, reaching a record for a London borough at 597,000 residents in 1901. It then lost more than 75 percent of its population over the next 80 years.  

Outer London

Outer London, which was combined into the Greater London Council in 1965 (and the Greater London Authority in 2000) also grew strongly, from 4.4 million to 4.9 million and is now at its peak population. Outer London's population density is 10,000 per square mile (4,000 per square kilometer), approximately the same as the District of Columbia. Like Inner London, Outer London also lost domestic migrants, with a net 310,000 residents leaving for other parts of the United Kingdom (Figure 2).

The Greenbelt

Since World War II, the London urban area (principally composed of Inner and Outer London) has been surrounded by the Greenbelt on which development is not permitted. The Greenbelt ranges from 10 to 20 miles wide (25 to 50 kilometers) and covers more than three times the size of the Greater London Authority. The Greenbelt has been cited, along with related policies, with substantially raising house prices and contributing to London's longer commutes than Paris, where there is no greenbelt.

Exurban London

Despite their more modest growth in the last decade, the exurbs have been effective in attracting net domestic migration. From 2001 to 2011, three was a net inflow of domestic migrants of 320,000 (Figure 2). Much of this appears to be people leaving London. During the last year, more than 50,000 residents of London moved to the exurbs. Net international migration to the exurbs had been fairly small earlier in the decade, but increased substantially in the later years. By 2009-2010, two thirds of the London region's net international migration was to the exurbs, and only one-third to London.

First Exurban Ring

The first exurban ring includes the historical counties that border on the outside of the Greenbelt. These areas added approximately 550,000 residents between 2001 and 2011 and reached a new population peak, at 7.3 million.

Second Exurban Ring

The second exurban ring includes the counties of the East of England and the Southeast that are outside the first ring. These areas added more than 400,000 new residents, and reached a new peak population of 4.8 million.

London and England

In contrast to the 1991-2001 decade, the 2001-2011 decade indicated a significant slowdown in the share of England's population growth in the London region. In the previous decade, all of England's growth occurred in the greater London region. In the last decade, 50 percent of England's growth took place around the capital. Overall, the core of London (Inner London) population has steadily fallen relative to the rest of England England's while the suburbs and exurbs have grown to include one-third of England's residents (Figure 3). So as Japan is moving to Tokyo, England is still moving to London, but not nearly so fast.

Wendell Cox is a Visiting Professor, Conservatoire National des Arts et Metiers, Paris and the author of “War on the Dream: How Anti-Sprawl Policy Threatens the Quality of Life.”

----

Note: London Boroughs: The 32 boroughs of London were defined after the creation of the Greater London Council in 1965 (which was abolished in 1986). The Greater London Authority provides data to show the historical population figures for the boroughs, going back to the initial census (1801). The new Greater London Authority was established in 2000, with less power than the previous Greater London Council. The 32 boroughs continue to operate, providing local public services.

Photograph: London Suburbs (Outer London) by author

London's Olympic Whingers

$
0
0

Busted. "Even in the best of times, whinging, as Britons call the persistent low-grade grousing that is their default response to life’s challenges, is part of the national condition", Sarah Lyall writes in the New York Times, about Londoners’ failure to embrace the Olympic Spirit. If a British newspaper mocked America there would be a flood of patriotic remonstrance right back at us. But when The Guardian asked its readers whether it was true that Britons were whingers, this is how the poll went:


There is a lot to complain about with the Olympics. The police have been heavy-handed, pushing around people who have argued with the Olympic hype. The Olympic Park has been forcibly cleared of its official and unofficial tenants.

Dave Renton, author of Lives; Running, who believes in the Olympics but not in the corporate hype and security that comes with it explains:

Already the park is enclosed by a sky high fence, topped by razor wires and electronic sensors, with CCTV every few metres and security patrols inside the fence, all to protect the Park from intruders. But in addition the towpath was closed to public access 23 days before the Olympics even began. All across London on the edge of Olympic venues there have been similar restrictions imposed. (see his Olympics-and-other sports blog, http://livesrunning.wordpress.com/)

Most shockingly, the army has put surface to air missiles on the roofs of local tower blocks, to the outrage of the residents, who see them as a threat against London’s rioting youths rather than any imagined Al Qaida attack. Pointedly, the one estate that has welcomed the installation is the Bow Quarter, a super-rich gated community in the heart of impoverished East London (the site, ironically, of the re-birth of British trade union struggle in the nineteenth century, the Bryant and May match factory).

There are special Olympic lanes painted on the roads, like those that the old Soviet bureaucracy had for the Zil limousines carrying officials. We are warned that spectators wearing the wrong logo will be barred from the stadium, as will Tibetan flags and any kind of political slogan.

There is much to complain about, but Sarah Lyall is right: scoffing is the British way. Poor Sebastian Coe, goody-two-shoes of the 1980s track, has a hard job selling the Olympics to the British public. This coming Saturday radicals of the counter Olympics network will meet at noon to protest in Mile End Park.

Of course Briton’s have not been big on public celebration since they lost that last toe-hold on world domination, as subalterns to the United States in the Cold War. The Falklands War against Argentina (oh, the shame!) was the last that drew out a jingo crowd. Ever since the Berlin Wall came down, we only come out on the streets to object or mourn. That is why the Millennium celebrations drew such a vicious reaction from the intelligentsia here, and why the most recently celebrated Queen’s Jubilee was such a damp squib. By contrast, hundreds of thousands mourned the death of Princess Diana, and perhaps a million marched against the war in Iraq.

It is not easy to be a British sporting star. Jaded Britons willed Wimbledon tennis finalist Andy Murray to lose with the fervour that in years gone by they would have willed him to win. England's soccer captain, John Terry, is better known for swearing at Anton Ferdinand than for his defending skills (after a failed prosecution for racial abuse, the press, unwilling to accept the jury’s decision, found him guilty anyway). The mood behind team GB in London right now is markedly downbeat. Londoners’ main interest has been whether they could make any money letting out their homes (no, it turns out, the market was flooded).

The mood is not helped by the downbeat promotion. Filmmaker Danny Boyle is in charge of the opening ceremony. He says he will not follow the Beijing triumphalism, but instead threatens a mawkish recreation of the English countryside, complete with sheep and even a mob of countercultural festival hippies. On television, Britons follow not the hype, but a mockumentary satire of the hype, Twenty Twelve.

******

The London that Britain will showcase to the world is at a difficult crossroads. It is the centre of the financial services sector, Britain’s most successful export since deregulation in the 1980s, but currently mired in successive crises, most recently the manipulation of the LIBOR rate by Barclays (with the apparent connivance of not only shamed Chief Exec Bob Diamond, but the Governor of the Bank of England, too). There is little doubt that Britain’s economy is dangerously skewed in favour of its financial sector, which buys influence from out-of-touch and cash-hungry politicians. Sadly, the one occasion when the financial sector might have been reined in, the crash of 2008, led to a massive bailout instead. Advice from financiers that the banks were ‘too big to fail’ was accepted with much the same gullibility as advice from the securocrats that Iraq’s weapons of mass destruction could strike London in 15 minutes. In the manner of a naïve maiden aunt, the press and the politicial establishment here were repeatedly surprised that the billions the government gave the bankers went straight into bonuses, instead of being passed on as loans to businesses. Did no one ever tell them that banks are in the business of making money, not giving it away?

The problem with the banks, in any event, is misunderstood. The febrile financial sector is more symptomatic than causal. It has been fuelled for some years by the surplus capital that British and European industry fails to reinvest in its manufacturing base. Europe’s risk-averse business leaders are reluctant to disturb their cozy relations with each other and government by innovating new processes or products. Where their forebears ploughed profits back into the business, our business leaders prefer to put them in the bank, hunting around for some fantasy of high yield investments that do not entail any relationship more demanding than a phone-call. It is not that bankers steal the cash from business so much as that business that is falling over itself to give it up.

High on the list of London’s problems is its house-building industry, which has systematically failed to meet the expanding demand for homes. Characteristic of the institutional prejudice against development here, house-building has been stymied by a planning system that restricts building to brownfield sites, and is strangling London’s growth with a ‘green belt’.

Predictably, the limit on building new houses has forced up prices, and priced poorer Londoners out of central London. According to a study by Tom MacInnes and Peter Kenway for the City Parochial Foundation:

… more than half (54%) London’s low income population live in Outer London. This is an increase compared to the late 1990s, when London’s low-income population was split equally between Inner and Outer London. Reflecting this relatively bigger population, a larger number of children in low-income households live in Outer London (380,000) than Inner London (270,000). (London’s Poverty Profile, 2009, p 29)

The impact of high prices on where people live, the gentrification of the inner city, and the exodus of the poor, has been dramatic. For poorer residents to carry on living in London gets more and more difficult. That is particularly so because the rise in rents mirrors the rise in house prices. For too many families living in London means accepting less and less space. Meanwhile, in Caledonian Road, a local developer bought up local shops to convert into flats, and then realised that the cellars could be made into houses, too.

With some cheek, London's former Mayor, Ken Livingstone, architect of the London plan that put the dampeners on development is now protesting that ‘rents have soared beyond people's ability to pay’. But it was Livingstone’s policy, with its mantra of building up, not out, on brownfield, not greenfield land, that created the scarcity of homes that is forcing up prices and rents. All of Livingstone’s solutions are about redistributing the limited housing stock available, without understanding that the real problem is in the realm of production.

The Olympics, of course, are supposed to have a lsting and positive effect on the London’s housing. But that will not happen unless there is a cultural shift in favour of development that is not engulfed in precautionary regulations and political indecision.

So let’s hope that Londoners do cheer up before the games start, and enjoy the sight of people giving their all. It ought to be a good antidote to the dog-in-the-manger attitude that is wrecking the prospects of recovery. Londoners have to choose between Olympic spirit, orOlympic whinging.

Photo by BBC World Service: Homeless Hostel, East London

James Heartfield’s latest book The Aborigines' Protection Society: Humanitarian Imperialism in Australia, New Zealand, Fiji, Canada, South Africa, and the Congo, 1836-1909 is published by Columbia University Press, and Hurst Books in the UK.

The Tribal Election: Barack Obama Turns to the Karl Rove Playbook

$
0
0

Move over, Iraq. Tribal politics have arrived at home.

It’s not like our tribes will arm themselves, but American politics is developing a disturbing resemblance to Mesopotamia’s ever-feuding Sunnis, Shiites, and Kurds as the 2012 election rapidly devolves into a power struggle between irreconcilable factions rather than a healthy debate among citizens.

The blame here falls in large part on President Barack Obama, who after four years of economic lethargy needs to recast the election as anything other than what it naturally is: a referendum on the incumbent and the state of the nation.

To turn the page, he has revived the kind of divisive 50 percent–plus–one politics Bush political guru Karl Rove successfully championed in 2004. As former George W. Bush strategist Mark McKinnon has observed, Obama is now following the same playbook used in 2004 against another Massachusetts faux blueblood, Sen. John Kerry. Like Obama, Bush was a polarizing president of meager accomplishments and modest popularity. And like Bush, Obama is hoping to rally his base and demonize his opponent to achieve a fairly comfortable reelection.

To do that, Obama is offering an array of appeals based on tribal totems—gay marriage, contraception, cheap loans for kids, charges of racism by his opponents. Every “grand” statement is aimed at specific groups, either to offer them something or to show how Romney would threaten their interests.

It’s a self-perpetuating dynamic: as he’s aimed his appeal at targeted groups to cobble together a winning coalition, he’s consistently lost ground with middle- and lower-income white Americans. That in turn compels him to double down on his appeals to single women, gays, youth, and minority voters—which in turn further alienates working and retired white voters.

Obama’s gambit creates an election in which turnout and mobilization—a fittingly military concept—of the faithful may be more important than the art of persuasion. It also guarantees a very ugly campaign, filled with even more than its usual share of innuendos, smears, and outright lies aimed at enthusing his base or—particularly for the GOP—discouraging members of unfriendly tribes from showing up to vote.

Obama starts off with natural advantages in the tribal sweepstakes. He’s black, he’s got a “creative class” university pedigree, and he’s hip and cool, not to mention the first post-boomer president. It’s a powerful base for an electoral win.

While Romney‘s core tribe, the Mormons, constitute less than 2 percent of the nation’s population. That’s a lot less than the Alawites who have constituted the core of strongman Bashar al-Assad’s support in Syria. (Of course, part of why Obama needs to cobble together a more complicated coalition is that Romney can also count on winning most white voters, who last favored a Democratic candidate in 1964.)

But Obama and his party have been playing the race card with the aplomb of a Jim Crow Democrat. Assaults on the president or his attorney general, Eric Holder, are immediately blamed on “racism” by groups like the Congressional Black Caucus and “leaders” like the Rev. Al Sharpton—who compared the investigation into the Fast and Furious gun-running case to the stop-and-frisk policies in urban police departments.

This appeal to race makes sense with African-American unemployment at its worst level in more than three decades and enthusiasm for the first black president understandably diminished since 2008. Tribal politics help cover up economic failings, as the old Dixiecrats did by using racism as a screen for the then-backward condition of their region.

More recently, Obama has also directed his tribal charm at Latinos. Hispanic families, according to the census, have done the worst of all groups in the recession, losing 66 percent of their household wealth. Unemployment in the group hovers near 11 percent, and more than 6 million Hispanic children live in poverty—exceeding for the first time the number of black children living in poverty.

Despite those sobering numbers, Obama is favored among Latinos by better than 2 to 1. This is in part because of Mitt Romney’s pivot to a hardline immigration stance during the Republican primary, as well as Obama’s election-year decree effectively giving mass amnesty to a large number of undocumented youth. Obama’s policy conversion is a seminal triumph for Latino politics, marking the group’s ascension into the first rung of American tribes. For many Hispanics, this was seen as an issue of family as well as identity.

Obama has also worked hard to cultivate culture and gender-oriented tribes. The most obvious example of special-interest pandering was his well-timed “evolution” favoring gay marriage. Perhaps more important in terms of votes, the president’s conflict with the Catholic Church over contraception could appeal to single women, who now constitute a critical part of his base. Recent polling shows single women opting for the president by as much as 2 to 1.

Then finally there are the millennials. In 2008, Obama could count on both their votes and their enthusiasm. Now amid hard times—particularly for the “screwed generation”—he has to appeal by offering lower interest rates for student loans and expanded aid to education.

Against these powerful alliance of tribes, what can ultra-white-bread Romney do in response? No doubt he can win the majority of white evangelicals—the largest tribe in the GOP base—but it’s hard to see how they will be much energized for a man whose religion is widely considered a cult among some prominent evangelical preachers. As late as this month, Romney still has to pour time and resources into what has been in recent years a solidly GOP bulwark. At the same time, his other natural “base,” high-income earners in the private sector, is simply not numerous enough to push him even near the electoral requisite.

To counter Obama’s tribal strategy, Romney has to move the discussion away from issues of race, gender, or immigration to the economy and unemployment, which, according to Gallup, remains far and away the dominant issue—with three times more voters calling it their primary concern than those for all social issues combined.

Perhaps the most inviting tribal group for Romney to contest is the “youth vote,” whose members of course shift dramatically every four years as voters age in and out of the cohort. The poor performance of the current economy has already blunted the once widespread youthful enthusiasm for Obama; in 2008 turnout reached 64 percent among young people, the highest in 16 years. This year the portion of 18- to 24-year-olds who say they’ll definitely vote has fallen to 47 percent, according to polls conducted by Harvard University’s Institute of Politics.

Overall, Democrats’ support among millennial voters has dropped from 66 percent in 2008 to close to 54 percent in 2010. Part of this may be because a vast majority of millennials, like other Americans, rank the economy as by far their greatest concern. Obama is already trailing the GOP candidate among white millennials by more than 20 points.

Due in large part to the heavy minority cohort among millennials, Obama still should win this group in November, but the margin may be somewhat lower and the vote totals much reduced due to rising apathy, something that was notable in the 2010 election. Perhaps more troubling for Democrats, in the critical Scott Walker recall race in Wisconsin, more than 45 percent of voters between 18 and 29 voted for the GOP governor, who had garnered barely 40 percent of their support in his first race against Democrat Tom Barrett two years earlier.

Other tribes could also be targeted, particularly American-born Latinos, who constitute about half the Hispanic adult population. They have been hard-hit by the recession and, according to a recent University of Arkansas study, tend to be somewhat more hardline on border control than their foreign-born counterparts.

And even after his amnesty move, Obama’s support among Hispanics is only 57 percent compared with 67 percent four years ago.

Of course, there are dangers to an ugly tribal win. While Bush significantly moderated his policies in his second term, he received little credit for that shift from the half of the country he’d alienated in 2004 and during his first four years in office.

Another politician who’s recognized the dangers of tribalism? Barack Obama, circa 2007:

"You've got to break out of what I call the 50-plus-1 pattern of presidential politics, which means you have nasty primaries where everyone’s disheartened, then you divide the country 45 percent on one side, 45 percent on the other, 10 percent in middle, all of whom live in Florida and Ohio," Obama told the Concord Monitor.

"Then maybe you eke out a victory of 50 plus one. [But] you can't govern."

Joel Kotkin is executive editor of NewGeography.com and is a distinguished presidential fellow in urban futures at Chapman University, and contributing editor to the City Journal in New York. He is author of The City: A Global History. His newest book is The Next Hundred Million: America in 2050, released in February, 2010.

This piece originally appeared in The Daily Beast.

Barack Obama photo by BigStockPhoto.com.

The Rise of The 1099 Economy: More Americans Are Becoming Their Own Bosses

$
0
0

While the economy has been miserable for small business, and many larger ones as well, the ranks of the self-employed have been growing. According to research by Economic Modeling Specialists International, the number of people who primarily work on their own has swelled by 1.3 million since 2001 to 10.6 million, a 14% increase.

This rise is partially reflective of hard times, and many of the self-employed earn only modest livings in fields such as childcare and construction. However the shift to self-employment is likely to accelerate in the future, and into higher-paying professions, for reasons including the ubiquity of the Internet, which makes it easier for some types of business to use independent contractors, as well as the reluctance of large firms to hire full-time employees with benefits.

Urban analyst Bill Fulton, who has looked into this issue, concludes we may be seeing a fundamental change in how the economy operates. “Even though there may not be jobs in the conventional sense, there is still work,” Fulton notes. “That’s the whole idea of the 1099 economy. It’s just a different way of organizing the economy.”

If the 1099 economy is the wave of the future, which regions and industries are currently at the forefront? We turned to EMSI for the data. We looked at the change in self-employment numbers for the nation’s 30 largest metropolitan statistical areas from 2001 to the present, and also from 2008, when the economy first nosedived and people started to scramble.

The results of EMSI’s research are fascinating, and somewhat surprising, perhaps giving us a glimpse of where the future of economic growth may be taking shape. The biggest changes have taken place in four metro areas where the number of self-employed workers expanded over 10% growth between 2008 and 2012. Two of them, Houston and Seattle, have done very well in our previous rankings of economic performance, and the other two, Phoenix and Riverside- San Bernardino, Calif., suffered grievously from the housing bubble.

In the case of Houston, its 12% rise in the number of self-employed workers reflects not only widening economic opportunity, but also structural changes in the energy industry, the metro area’s prime economic driver. Since 2005, self-employment in the energy industry has grown 35% (and a remarkable 75% for support activities for oil and gas operations). At least part of this influx, EMSI suggests, could be attributed to land owners cashing in on royalties after leasing their property for drilling, but also to the demand for the increasingly specialized, and often high-tech, services required by that industry.

The entrepreneurial drive in Houston is clearly not a response to economic disaster – the city has a culture that encourages striking out on your own, and low costs and lighter regulation make it easier. Indeed over the past decade, the Texas powerhouse also led the nation in the growth of its 1099 economy, which expanded by a remarkable 51%.

Like the energy industry, the burgeoning high-tech sector also has become more dependent on the 1099 economy. Encompassing people writing apps, doing technical consulting,  and working in the information sector, the numbers have surged over the past five years. This may help explain the double-digit increase in self-employment over the past five years in Seattle (up 10%) and San Jose (up 11%). In some cases this may be young people working on their own; in others it could be older techies who may have lost full-time jobs but are now consulting.

Perhaps the most intriguing shift to the 1099 economy can be found not in hotspots like Silicon Valley, but in areas pummeled in the “housing bust” that are only now showing signs of recovery. This includes two areas, Phoenix and San Bernardino-Riverside, Calif., usually disdained by “creative class” pundits as backwaters, that have seen their number of self-employed grow 12% since 2008.

One contributing factor may be the migration of people to these areas from Southern California, says Rob Lang, a leading expert on economic trends who teaches at the University of Nevada-Las Vegas. For much of the second half of the 20th century, Southern California was, as historian Fred Siegel of the Manhattan Institute aptly put it, the nation’s “capitalist dynamo.” Unlike Houston with energy, or Seattle and San Jose with technology, the Southern California economy was broad based, spanning everything from aerospace and garments to homebuilding  and fast-food restaurants.

Over the past generation, many heirs to this entrepreneurial tradition have decamped to the Sonoran Desert region, which stretches from California into Arizona, Lang says.

Of course, Lang notes, Phoenix has long been disdained by urban aesthetes as environmentally “unsustainable”and doomed to economic decline. Its fate, according to accounts during the worst of the housing crash, was to be surrounded by “zombie sub-divisions” that would remain empty for years, perhaps permanently as the desert encroached.

Yet as the strong self-employment numbers demonstrate, Phoenix may well be on its way to recovery. Brookings recently estimated its rebound since the Great Recession to be the fifth best of the nation’s 100 largest metro areas. Its unemployment rate has dropped from 12% in 2010 to around 7.5% in May 2012. Bankruptcies have fallen dramatically and the housing market is clearly on the mend.

One clear sign of improvement is foreclosures have dropped 53% over the past year and are now below the national average.   Meanwhile net migration into Phoenix as well as the rest of Arizona is once again on the rise.

This recovery, notes local economist Elliot Pollack, follows the typical cycle for Phoenix, led by entrepreneurial activity.  “Greater Phoenix is a small business town,” notes Pollack. ”Historically, during periods of growth, there is substantial new business and self employment formation.”

Phoenix’s self-employment boom suggests that the Valley of the Sun is primed for a comeback. But not all of the top 30 metro areas are seeing anything like this level of new entrepreneurial activity. The 1099 economy has grown at less than half Phoenix’s rate in such “creative”  hotbeds as New York, Los Angeles, San Francisco and Boston. Self-employment is flat in many cities, including St. Louis, Cincinnati and Cleveland, and as actually declined in Kansas City, Chicago and Atlanta.

It may be too early to declare which economies will finally rebound fully from the ravages of the Great Recession. But for my money, I’d look to those places where people are taking the leap to go out on their own as the ones most likely to reinvent themselves when the economy begins expanding robustly again.


Rank Region Growth in Self-employed, 2008-2011
1 Houston-Sugar Land-Baytown, TX 12.2%
2 Riverside-San Bernardino-Ontario, CA 11.8%
3 Phoenix-Mesa-Glendale, AZ 11.5%
4 Seattle-Tacoma-Bellevue, WA 10.0%
5 Baltimore-Towson, MD 8.6%
6 San Antonio-New Braunfels, TX 8.1%
7 Tampa-St. Petersburg-Clearwater, FL 6.5%
8 Dallas-Fort Worth-Arlington, TX 6.3%
9 Boston-Cambridge-Quincy, MA-NH 5.6%
10 Miami-Fort Lauderdale-Pompano Beach, FL 4.9%
11 Detroit-Warren-Livonia, MI 4.7%
12 New York-Northern New Jersey-Long Island, NY-NJ-PA 4.6%
13 Orlando-Kissimmee-Sanford, FL 4.4%
14 San Francisco-Oakland-Fremont, CA 4.2%
15 Sacramento--Arden-Arcade--Roseville, CA 4.2%
16 Los Angeles-Long Beach-Santa Ana, CA 4.1%
17 San Diego-Carlsbad-San Marcos, CA 4.1%
18 Portland-Vancouver-Hillsboro, OR-WA 4.1%
19 Pittsburgh, PA 2.9%
20 Denver-Aurora-Broomfield, CO 2.9%
21 Philadelphia-Camden-Wilmington, PA-NJ-DE-MD 2.8%
22 Washington-Arlington-Alexandria, DC-VA-MD-WV 1.3%
23 Cleveland-Elyria-Mentor, OH 0.6%
24 Cincinnati-Middletown, OH-KY-IN 0.5%
25 St. Louis, MO-IL 0.3%
26 Las Vegas-Paradise, NV 0.3%
27 Minneapolis-St. Paul-Bloomington, MN-WI 0.2%
28 Kansas City, MO-KS -0.7%
29 Chicago-Joliet-Naperville, IL-IN-WI -2.4%
30 Atlanta-Sandy Springs-Marietta, GA -6.5%


Joel Kotkin is executive editor of NewGeography.com and is a distinguished presidential fellow in urban futures at Chapman University, and contributing editor to the City Journal in New York. He is author of The City: A Global History. His newest book is The Next Hundred Million: America in 2050, released in February, 2010.

This piece originally appeared in Forbes.

Self employment photo by BigStockPhoto.com.


Public School Parent Trigger Laws: Something’s Gotta Give

$
0
0

In the mid-1950s, the McGuire Sisters’ version of Johnny Mercer’s song about what happens when an irresistible force meets an immovable object made it to number five on the record charts. Their prediction, that “Something’s Gotta Give,” provides an apt description of the outcome of today’s battle between the parents of Millennials who want more say in their children’s education and the teacher unions and school district administrators who refuse to give up a smidgeon of control over the public schools they run.

One of the hottest battle fronts in the war between these two forces has been debates over whether to adopt “Parent Trigger” laws, similar to those passed in California in 2010. Such legislation empowers the majority of parents in any school district deemed to be “failing,” according to the federal No Child Left Behind standards, to essentially reconstitute the school according to parents’ desires either by turning it into a charter school or removing and replacing all current teachers and administrators.

Since 2010, Texas, Mississippi, and Louisiana have passed similar legislation and it is up for debate in major industrial states such as Michigan, Pennsylvania and New York. In Florida, the idea came within one vote of passage in the State Senate thanks to the enthusiastic support of former Florida Republican Governor, Jeb Bush. At the same time, such Democratic stalwarts as Barack Obama’s Secretary of Education, Arne Duncan, and liberal Congressman George Miller (D-CA) have expressed their strong support for the concept. Most recently, the bi-partisan U.S. Conference of Mayors unanimously passed a resolution in support of Parent Trigger laws.  Los Angeles Mayor, Antonio Villaraigosa, chairman of both the Mayor’s Conference and the upcoming Democratic National Convention, led the charge for the resolution’s passage, aided by strong support from Democratic Mayors such as Michael Nutter of Philadelphia and Kevin Johnson of Sacramento.

None of this has softened the resistance from teacher unions, historically a bulkwark of Democratic support. Often led by unreconstructed Boomer liberals from the 1960s, they see the law’s emphasis on parental prerogatives as the ultimate threat to their control of the classroom and educational budgets. In the most recent battle, unions were able to pressure Change.org, a for profit, grass roots website “staffed by some of the most talented progressive organizers in the country,”  to bar StudentsFirst, an advocacy group run by Democrat Michelle Rhee, the former Washington D.C. School Superintendent, that supports giving parents more control over the schools their children attend, from using its website.

And when the chief press person for Parent Revolution, the non-profit that is the primary driver behind the adoption of Parent Trigger laws, was announced as the new education media spokesperson by Obama’s re-election campaign, teachers' unions threatened to withhold their support of the president.

In the long run, the implacable objections of the unions to parents having more say over the type of education their own children will fail. They will prove no match for the irresistible force of generational change that is already sweeping away existing institutional power structures in schools across the country.

One of the distinguishing characteristics of Millennials, born 1982-2003, is the intense interest their parents take in every aspect of their children’s lives. This desire to constantly hover over their offspring earned parents of older Millennials (those now in their twenties) the sobriquet, “helicopter parents.” The younger half of the Millennial Generation, which  accounts for most elementary and all secondary school students today is primarily parented by members of the more entrepreneurial Generation X (born 1965-1981). These parents replaced their Boomer predecessors’ tendency to hover and talk with a desire to take action and change bottom-line results.

Millennials are the largest, most diverse generation in American history, and many of them are now starting to have children of their own. When those children begin arriving in the nation’s schools, Millennial Generation parents will bring the same dedication that their own parents exhibited to making sure each school serves their child’s interests first.  As a result, it won’t be long before the same rights California, Mississippi, Texas, and Louisiana parents now have are given to every parent in the country. As Ben Austin, the founder of the Parent Revolution points out, “the old coalitions don’t apply here; it’s a cause that unites parents from upper-middle-class and working-class backgrounds—white, black, and Latino alike.”            

The type of generational change America will experience over the next few decades   will drive the transformation of America’s educational institutions and overwhelm those who attempt to keep parents from deciding what kind of school their kids go to. When push comes to shove, something’s gotta give. And, in the end, that means that those who stand for the status quo in our nation’s schools will have to give up their traditional prerogatives and let parents choose the educational experience they think is best for their own children.  

Morley Winograd and Michael D. Hais are co-authors of the newly published Millennial Momentum: How a New Generation is Remaking America and Millennial Makeover: MySpace, YouTube, and the Future of American Politics and fellows of NDN and the New Policy Institute.

School bus photo by BigStockPhoto.com.

Predictable Punditry Down Under

$
0
0

The New South Wales Government has been following an extreme version of currently fashionable planning doctrines based on higher population densities. These policies have resulted in exorbitant housing costs and increasing traffic congestion.  A Liberal/National Coalition Government has come into power in New South Wales, replacing the previous Labor Government. In its election platform it promised to change planning policies for the better. These include fewer additional dwellings to be forced into Sydney suburbs, more fringe land release, decentralisation and giving planning powers back to the community.

The New South Wales Department of Planning bureaucracy is consequently ostensibly devising a new housing strategy.  As the main feature in a community discussion on this new strategy, the Department organised a presentation by Harvard Professor Edward Glaeser in Sydney entitled “Triumph of the City”, The promotional description read

recognised as the world’s leading urban economist, Harvard University’s Professor Edward Glaeser, along with four of NSW Government’s planning and infrastructure experts, will discuss fresh approaches to meeting Sydney’s biggest challenge now and into the future — planning for a population that is expected to increase from 4.2 million to more than 5.6 million by 2031”.

Previous consultation exercises for planning strategies had proved to be tokenistic and mere public relations exercises.  Unfortunately this event proved to be no exception. It promoted the current high-density policies with no discussion of alternatives or fresh approaches.

Professor Glaeser spoke about how cities evolved as engines of development and wealth creation. He portrayed cities facilitating people getting together, sharing ideas and building on previous innovations. He described how the advent of popular means of transport --- from horse drawn transport to cars --- allowed cities to spread and maintained that low density areas are associated with longer car journeys and larger homes that consume more energy. To facilitate the person to person contact he considers necessary to sustain innovation and to reduce energy consumption he advocated ever higher-densities closer to the city core.   

He implied this is especially important so as to set an example to highly populated China and India in order to limit the otherwise huge escalation in energy usage in those countries.

Throughout the proceedings the conference facilitator promoted the concept of high densities by such statements as “We need to re-examine the suburban model, living more like urban model” and “Go up, not out.  Can we do that? How do we do that?”
The overwhelming impression given by the consultation proceedings was that high-density is the only possible strategy worth considering and that Glaeser’s USA perspective can be applied to New South Wales.

Yet the argument that high density means more innovation seems flawed. In the United States of America the greatest innovative activity takes place not in crowded Manhattan but in regions of densities similar to that of Sydney, the urban area of which has 2100 persons per square kilometre (5,500 per square mile).  The San Jose urban area in Silicon Valley, with a similar population density, has a booming world-changing local technology industry including Cisco Systems and IBM. It also is almost totally dependent on automobiles, with only a small share of people taking transit.

Companies operating in Hillsboro in the Portland urban area (population density of 1400 per square kilometre or 3600 per square mile) include Yahoo!, Credence Systems, Synopsys, Epson and Sun Microsystems.  Seattle, the home of Microsoft and the initiation of Boeing, has a population density of 1,200 per square kilometre, or 3,000 per square mile. The densities in these dynamic areas are equal to or less than that of Sydney and a far cry from the Manhattan or even Hong Kong type of density of 25,000 (67,000 per square mile) or more that Glaeser seems to prefer.

Although high-density living may not be for everyone, apparently, particularly those with kids. Glaeser, like another prominent advocate of rapid densification, David Owen “copes” with living in suburbia.  I guess dense housing is for other families.

The claim by Glaeser that high-density is superior environmentally also is not borne out in Australian studies.  A publication of his finds emissions in low-density suburbs in several United States cities to be higher than in high-density suburbs.  Australian data does not show this.

A study of energy-related emissions at the final point of consumption finds per capita energy usage in a group of low density Sydney suburbs (96 GJ per annum) to be lower than in high-density suburbs (169 GJ).  One of several factors accounting for these differences is there are more people per household in the lower density areas. Glaeser models emissions on a “standard household” of 2.2 people; many, if not most suburban households, have more than that number, although city households frequently don’t.  One wonders whether possible differences in the number of people per dwelling in high-density and low-density areas can be adequately catered for in such models.

For another thing, the Australian climate is very different and that is probably a significant reason for higher densities to be more energy intensive. If dwellings are too close they are more difficult to cool whereas it is easier to heat them.  Also, cooling technically needs more energy than heating as a much larger volume of air needs to be circulated (NOTE 1).

Glaeser’s advocacy of high-density to reduce transport emissions needs special consideration.  In Australia such reduction, if any, is trivial.  Transport greenhouse gas emissions account for only a small proportion of household emissions and higher-densities reduce these to a minimal extent. (NOTE 2

It is not only in Australia where evidence for significant environmental benefits from high-density planning is lacking.  As a result of studies testing the relative performance of spatial options in England, Echenique et al conclude: “The current planning policy strategies for land use and transport have virtually no impact on the major long-term increases in resource and energy consumption. They generally tend to increase costs and reduce economic competitiveness. The relatively small differences between options are over-whelmed by the impacts of socioeconomic change and population growth”.

The Department of Planning-sponsored Glaeser presentation was not a genuine consultation. It promoted existing government policies with no attempt to consider their downside or to discuss alternatives.  It is extraordinary and downright arrogant to expect Sydney communities to change their preferred mode of life to live in tiny apartments perched in towers (see picture) in the unproven expectation that this will significantly reduce greenhouse gas emissions. It is yet even more extraordinary to presume that such a transformation would influence policies in China and India in any significant way. The days when these great countries looked to the West for models has already passed; and look where many people from these countries settle when they get to the United States or to Australia: the suburbs. Classic cases include the San Gabriel Valley East of Los Angeles, the Santa Clara Valley communities of Silicon Valley, large swaths of northern New Jersey and to Sydney’s North Shore in Australia.

The proceedings proved to be an attempt to promote a particular point of view, so perpetuating previous approaches of trying to manipulate opinion in the guise of consultation.

It appears clear that in spite of a change of government there will be no change in planning policies.  The new government looks like having been captured by the bureaucracy and its cult of densification that has no more chance of changing its views than the College of Cardinals is likely to eschew the Papacy. 

(Dr) Tony Recsei has a background in chemistry and is an environmental consultant. Since retiring he has taken an interest in community affairs and is president of the Save Our Suburbs community group which opposes over-development forced onto communities by the New South Wales State Government.

Photo: Kowloon, Hong Kong

Density is Not the Issue: The Urban Scaling Research

$
0
0

The "urban scaling" research of Geoffrey West, Luis Bettencourt, Jose Lobo, Deborah Strumsky, Dirk Helbing and Christian Kuhnert on cities has attracted considerable attention (references below). They have provided strong quantitative evidence, based upon voluminous econometric analysis that cities tend to become more efficient as they grow in population.

Specifically, West, a theoretical physicist, and his team show that measures such as gross domestic product per capita and income per capita rise, on average, 15 percent with each doubling of city population. They draw parallels with the animal kingdom, noting that larger animals tend to be more efficient than smaller ones, and comparing elephants, efficient because of their size, to cities.

This is all very attractive, especially the elephant analogy, which appropriately suggests that cities are organisms.

The Urban Organism

Yet the research has been widely reported to suggest that density as opposed to size is the key to urban productivity. West et al look at cities as "integrated economic and social units," at the "level of metropolitan statistical areas (MSAs); in the European Union, larger urban zones (LUZs); and in China, urban administrative units." This is the economic, or functional manifestation of the urban organism (the urban area, the area of continuous urbanization, is the physical manifestation). In so doing, West, et al demonstrate a familiarity with urban geography that is all too rare, even among analysts who have studied cities for far longer.

The key issue here is what constitutes a “city”.  New York is a good, example, as headquarters to the national media, a world class city and as urban as it gets in the United States. But the New York metropolitan area, the "integrated economic and social unit" is not Manhattan or even five boroughs. It stretches from a bit west of Blooming Grove Township, in Pike County 25 miles west of Port Jervis, a city 90 miles from Manhattan located in western Orange County, NY, to Montauk Point in Suffolk County and from north of West Point, in Putnam County to Egg Harbor Township, in Ocean County, New Jersey (that's nearly 30 miles south of Toms River). Suffice it to say most of this vast region is not dense at all.

Divining Density

Yet, some analysts have characterized the West, et al research as being about higher densities, Richard Florida wrote in The Wall Street Journal:

Researchers at the Santa Fe Institute have been able to demonstrate that bigger, denser cities literally speed up the metabolism of daily life.

That's only half right. The research was about city size, not density, as the authors indicate (below).

All too typical of the way that suburbanized America is disparaged by the media, Jonah Lehrer, of The New York Times sputtered that:

In recent decades, though, many of the fastest-growing cities in America, like Phoenix and Riverside, Calif., have given us a very different urban model. These places have traded away public spaces for affordable single-family homes, attracting working-class families who want their own white picket fences.

In reality, the kind of suburbs found in Phoenix and Riverside-San Bernardino will be found surrounding every one of the nation's core cities, including New York, an urban area that covers  more land area than any urban area in the world at 3,450 square miles (8,935 square kilometers), according to the Census Bureau. That’s twice the expanse of the Los Angeles urban area. Granted, New York's Hudson Valley suburbs are greener and more affluent than most in Phoenix, but their population density is nearly the same. Moreover, neither Phoenix nor New York (think Staten Island or much of Long Island) should be ashamed of attracting "working class families who want their own white picket fences." Why demean aspiration?

Urban blogger James Withow refers to their "remarkable findings" that "raise interesting policy issues on density." Another analyst wrote "West offers data that shows cities create economies of scale that suburbs and small towns cannot match." This is patently absurd since, as noted above, West did not study any part of the urban organism below the metropolitan area. There was no attempt to make a distinction between the productivity of say, Manhattan or Brooklyn, to White Plains or even Blooming Spring Township. No core city or suburb is an "integrated economic and social unit."

West et al on Density

Indeed, West et al make it very clear that their findings have nothing to do with urban population density. They tested for correlations population growth and income, patents and violent crimes, and found "no significant trend exists between residuals for income, patents and violent crime and population growth or density." They further note their equations showed an "R2 consistent with zero" (in every day English, that means they found no relationship between density and the other variables).

This conclusion was correct, though comparing metropolitan area densities is less than ideal. Just to check, we reran the equations with urban density data and found that this approach too produced an "R2 consistent with zero," not only for income, patents and violent crimes, but also gross metropolitan product.

West et al pointed out that:

The shape of the city in space, including for example its residential density, matter much less than (and are mostly accounted for by) population size in predicting indicators of urban performance. Said more explicitly, whether a city looks more like New York or Boston or instead like Los Angeles or Atlanta has a vanishing effect in predicting its socio-economic performance. (emphasis by author)

In other words, the same improvement in urban performance would be predicted from doubling the population of Atlanta, with an urban density of 1,700 per square mile (700 per square kilometer) as in New York, with more than three times Atlanta's density or Los Angeles' with more than four (Los Angeles is highest density large urban area in the United States).

 It turns out – counter the misunderstandings of some urbanists – that higher or lower density simply does not matter according to the West, et al research.

It's About Density Thresholds and Efficient Labor Markets

Cities (integrated economic and social units) are created by reaching urban density thresholds. They tend to become more productive as they grow, so long as they are not too large to function as a labor market. Density doesn't matter particularly. Indeed, the general tendency is for cities to become more dispersed (less dense) as they grow, as indicated by longer term data in the US, Canada and around the world.

For example, the Seattle and Houston urban areas have population densities much lower than those of Paris, London, Hong Kong and even Los Angeles – yet they still rank higher among the most productive metropolitan areas in the world, according to the Brookings Institution Global Metropolitan Monitor 2011. Brookings rates Hartford as the most productive metropolitan area in the world, yet its urban population density is nearly as low as Atlanta's.

Finally, the Brookings list excludes the world's most dense major city, Dhaka. That's because the economic output of its 15 million people is insufficient to make a list that includes cities one-tenth its size. Dhaka combines the highest population density in the world with perhaps the lowest per capita economic output of any megacity in the world.

Allowing Organisms to Grow

As West et al suggests, cities, like elephants, are organisms. Both expand (dare we say "sprawl") as they grow. This should be cause for concern, given planning dictates that would restrain urban organism, such as urban growth boundaries. These restraints are akin to depriving a large mammal of sufficient space to roam and feed. That's no way to treat a productive organism, or a great city.

-------

Reference Materials:
Growth, innovation, scaling, and the pace of life in cities
Urban Scaling and Its Deviations: Revealing the Structure of Wealth, Innovation and Crime across Cities
2010 US Urban Area Data

-------

African Bush Elephant photo by flickr user nickandmel2006.

Wendell Cox is a Visiting Professor, Conservatoire National des Arts et Metiers, Paris and the author of “War on the Dream: How Anti-Sprawl Policy Threatens the Quality of Life.”

Libor: Is The City of London Fixed?

$
0
0

Having worked inside banking, do I think that banks colluded to post an artificial London interbank offered rate, otherwise known as Libor? For those not in the brotherhood, that acronym is a compendium of average borrowing prices from sixteen large banks, pronounced either as lee-boar or lie-bore. Before turning to conspiracy theories, let’s review the facts of a scandal that began more than four years ago, and are so murky that I, for one — despite twenty-five years in international banking — have a hard time grasping.

In 2008, around the time of the September panic, Barclays and perhaps other large banks began obfuscating the true costs of their interbank borrowing, and submitted rates to the “fix” (in all senses of the word) that were less than their actual cost of funds. Why?

Few creditors wanted to take a chance on leaving their deposits in large European or American banks, especially since so many, such as Lehman, Merrill Lynch, Countrywide, and the UK's Northern Rock were shuttering their branch windows.

Only by paying over the market rates could banks like Barclays fund their bloated balance sheets of subprime assets. (Big banks in 2008 were more like pyramid schemes.) If the market got wind of their true borrowing costs, it would have eroded what little confidence was left in the banking system. Barclays and the British government concocted (shall we say colluded?) to post rates to the Libor “fix” that did not reflect the bank’s actual cost of borrowing funds.

As in Olympic scoring, when setting the Libor the highs and lows are thrown out, leaving the financial world with an approximation of what big banks pay to borrow from each other. When big banks actually trade with each other, however, they have to pay what they agree to with their creditors, not the Libor rates printed in the Wall Street Journal.

In 2008, Barclays was paying over Libor. The British government was helping it to cover its wobbly funding tracks in the interest of showing the financial world that London banks were solid and creditworthy.

Before this shell game, there was the another leg of the current scandal. From about 2005 onward, Barclays and others had been posting artificially high interbank borrowing costs, so that borrowers across the world would be paying higher benchmark rates on their loans and derivative contracts, valued in the trillions of dollars.

The reasons are easy to calculate. Imagine that the world’s big banks can borrow from each other at 2%, but that they secretly agree to establish a Libor benchmark rate of 2.5%. The fifty basis points are pure profit to anyone funding loans at 2%, and then charging a margin on top of 2.5%.

If true, Libor’s three-card Monte could have drained a reported $22 billion from unwitting borrowers. Nevertheless, while cabalistic traders were feathering their plush-carpeted nests, global regulators were also willing accomplices to the large banks in these rigged markets.

After the crash, institutions like the Bank of England and the Federal Reserve Bank were desperate to recapitalize the banking system. The presumed results would be to improve the profitability of the banks, and make them less dependent on state funding.

In fixing Libor, both high and low, Barclays probably thought it was doing the king’s bidding. No wonder its $39-million-a-year Chairman Bob Diamond expected a knighthood rather than a pillory.

If much of this finagling happened between 2005 and 2008, why are bankers now heading to jail for aiding and abetting their senior managements or the regulators? Why now the moral outrage, Senate hearings, presidential soundbites, indictments, hair shirts, resignations, and headlines that the banks have yet again stolen our money?

Although in theory banks are credit institutions, at least according to their charters, in reality they are political interest groups that occasionally grant loans.

Among the oldest arguments in American politics are those that center on whether the US should have national or just state banks, and whether the circulating currency should be tethered to some commodity (gold, silver, toasters) or allowed to float unhinged on world money markets, as they now do (Nixon ended the dollar’s convertibility in 1971).

Another divisive political argument has been whether banking and money should be beholden to big city interests (for example, robber baron J.P. Morgan) or to agricultural concerns (Andrew Jackson had them in mind). Morgan got rich on deflation when money was tied to gold; the farmers won with inflation because they could repay their loans with cheaper dollars.

In Europe, the similar divide is between the propertied and working classes. In the Libor scandal, Barclays is synonymous with the remittance men in the House of Lords, living off coupons.

Now on both continents, the political question is whether the financial system should be geared toward stimulus (cheaper money) or austerity (debt reduction; gold standards). In the US. election, Romney speaks for the hard money men while the Obama administration, like French President François Hollande, believes in fiat money with the revolutionary passions of Marat and Robespierre.

Because both political blocs have their constituents and henchmen, Libor bankers are walking the plank for constricting the money supply, and spendthrift politicians are being turned out of office, charged with debasing the paper currency.

Although the fine print of the outrage is obscure, Libor is at the subconscious center of the 2012 election and the future of Europe. No wonder headline writers and prosecutors are rounding up the usual banking suspects.

The soundbite storyboards are perfect for a prime-time, election-season docudrama, starring greedy bankers, virtuous senators, victimized home owners who were bilked out of billions in a scam hatched in City of London pubs and carried out in corner offices.

On the campaign trail the President could be heard to imply that plutocratic, Republican supporters of Mitt Romney are hand-in-black-glove with the rate fixers. The message is clear. The reason the world’s economies are in recession is not incompetent economic policies, but collusion between Wall Street and its UK counterpart, the City of London.

In other words, the banking system has fulfilled its historic political mandate: to give every presidential election “a good, safe menace,” so that nervous voters can cast their ballots to keep the moneychangers away from the temples of democracy, even though they need a billion in soft money to light the altar candles.

Flickr Photo by Garry Knight – The Dragon from the City of London's coat of arms, cast as a statue.

Matthew Stevenson, a contributing editor of Harper's Magazine, is the author of Remembering the Twentieth Century Limited, a collection of historical travel essays. His next book is Whistle-Stopping America.

America's Future Is Taking Shape In The Suburbs

$
0
0

For nearly a generation, pundits, academics and journalists have written off suburbia. They predict that the future lies in the cities, with more Americans living in smaller spaces such as the micro-apartments of 300 square feet or less that New York and San Francisco are considering changing their building laws to allow. Even traditionally spread out cities, such as Los Angeles, are laying out plans to create greater population density, threatening the continued existence of some neighborhoods of single-family homes.

Yet wishing something dead does not make it so. Indeed, the suburbanization of America is likely to continue over the next decade. The 2010 Census — by far the most accurate recent accounting — showed that over 90% of all metropolitan growth over the past decade took place in the suburbs.

Some central cities, notably New York, enjoyed decent population growth, but their increases were still below the national average. The Joint Center for Housing at Harvard notes that, only five metro areas —Boston, San Diego, San Jose, Calif., and the Florida cities of Cape Coral and Palm Bay — saw an increase in the share of households living in core cities relative to their suburbs and exurbs.

To be sure, the Great Recession slowed the growth of suburbs, as many Americans lost the ability to achieve their dream of owning a single-family house. “Back to the city” advocates have seized on Census estimates for the past year that suggested that urban core growth has actually been a tad faster than that of suburbs.

However, the Census Bureau numbers may be less accurate, and certainly less predictive, than many suggest. University of Pittsburgh urban analyst Chris Briem points out that in the last decade, some Census Bureau city estimates turned out to be vastly exaggerated compared to the actual 2010 Census. This was particularly true in Chicago and New York, where constant lobbying by city officials — after all, federal aid is distributed based on population estimates — meant that optimistic urban estimates turned out to be hundreds of thousands of people off.

More amazing still, the Census Bureau essentially assumed that growth was even in all municipalities in a county. This bizarre practice projects that growth, say, in the city of Los Angeles, is equal to that of newer communities like Santa Clarita, or that suburbs of Alleghany County grew at the same rate as the city of Pittsburgh. This surely can’t be the case.

Reporters concentrated in Manhattan and the District of Columbia didn’t look seriously at these numbers. They repeated the assumption that this was the result of mass migration, particularly among the young, out of suburbs and into cities.

Yet in reality, there was no evidence of that trend. In fact, the Census Bureau’s core county estimates (which are demonstrably more accurate than the municipal estimates) showed a slight core county loss in domestic migration over the past year. The real story of the estimates has to do with the recession, which has led to record-low levels of mobility. Inter-county migration has fallen almost half from its 2006 level. Essentially, a historically weak economy has boosted the city share of population growth.

So what can we expect in the future? Some cities will grow, but the vast majority of metropolitan growth will continue to take place in what are still car-dominated suburbs like areas areas. This can occur only the economy again get on a full-fledged growth cycle. Here some basic reasons not to write off suburbia.

Inter-Regional Growth Patterns

All 15 of the fastest-growing metropolitan areas of the past decade — led by places like Las Vegas, Raleigh, Phoenix, Houston and Dallas-Fort Worth — are sprawling and have low-density cores. Metropolitan areas with far denser cores, such as New York, Boston, Chicago, and San Francisco, tended to display below-average growth.

These fast-growing cities tend to be suburban in form, dominated by single-family homes, automobile commuters and with dispersed economic centers. The growing central cities of Phoenix or Houston look more like places such as Long Island or Santa Clara than Manhattan or Chicago.

Economic Shifts

Many urban boosters cite a Santa Fe Institute study claiming that density creates productivity and economic growth. However, the study clearly dissociated itself from this argument, claiming that it did not matter if a region was shaped like Los Angeles, Atlanta or Houston, or New York or Boston. The source of productivity lay simply in a growing metropolitan population, the authors claimed.

Overall, it’s questionable whether city economies perform better over time than the suburbs. Indeed, over the last decade, 81 percent of the population growth of core cities was among the poor, compared to 32 percent in suburbs. Poverty anywhere is a bad thing, but the claim, made repeatedly by some pundits that it is worsening more in suburbs turns out to be, well, just another urban legend. Overall poverty accounts for nearly one in four urban residents, twice the rate for suburbs.

Energy Costs

Ever since the energy crisis of the 1970s, pundits have predicted suburbanites would be forced to give up their cars. But higher energy prices have not slowed the suburban trend. With the current growth in new energy finds both here and abroad, the much heralded dawn of “peak oil” appears to be about as imminent as a balanced federal budget.

Some terrified urbanists, like Bruce Fisher, director of the Center for Economic and Policy Studies at Buffalo State College, fear the new oil rush means “suburban real estate development will once again enjoy a comparative advantage over center city development.” In what some see as a catastrophe for both planet and urbanity, the car will remain dominant for the foreseeable future, despite three decades of massive spending on new transit systems across the country.

Demographic Trends

The advocates of a dense urban future usually point to demographics. Yet the formerly fashionable theory that retiring boomers would head en masse to cities turned out to be largely false. The last census showed the vast majority of aging boomers remained in the suburbs or moved further out into the periphery. “Back to the country” actually far outweighed “back to the city” in terms of boomer migration.

Then there’s the other large generation of Americans, millennials, who are said to prefer an urban lifestyle. Yet surveys of millennials show a strong, often even more marked, preference for homeownership and suburban living than their parents.

This will prove critical as many now urban millennials begin to enter their 30s and 40s over the next decade. Once they marry and start to have families, they will emerge, as the Harvard housing study notes as “the primary driver of new household formations over the next two decades.” Along with the other powerful force, immigrants, most seem likely to end up in suburban locales, if they can.

Preferences Matter

This does not counteract the fact that many young people will chose to settle in dense urban areas for their 20s and early 30s. Some urban cores, notably New York, Boston and San Francisco, will likely grow and get denser. But most others will see only modest, often fitful growth; despite massive public investment, for example, downtown Los Angeles, according to Zillow.com, has foreclosure rates worse than virtually anywhere else in the region.

Preferences are the key here, particularly paying attention to what people want as they age. The 2011 Community Preference Survey, commissioned jointly by the National Association of Realtors and Smart Growth America, found that only a small minority — less than 10 percent — favored a dense urban location. Some 80 percent expressed preference for a single-family home.

Over time, in a market-based economy, consumer preferences matter far more than those of pundits, professors or, for that matter, rent-seeking real estate developers. The only things that can kill off future suburban development would be forced densification by government edict or a continued miserable economy that entraps millions of the unwilling in dense urban areas.

Joel Kotkin is executive editor of NewGeography.com and is a distinguished presidential fellow in urban futures at Chapman University, and contributing editor to the City Journal in New York. He is author of The City: A Global History. His newest book is The Next Hundred Million: America in 2050, released in February, 2010.

This piece originally appeared in Forbes.

Suburbs photo courtesy of BigStockPhoto.com.

Viewing all 3794 articles
Browse latest View live


Latest Images