Quantcast
Channel: Newgeography.com - Economic, demographic, and political commentary about places
Viewing all 3789 articles
Browse latest View live

Length of Residential Tenure: Metropolitan Areas, Urban Cores, Suburbs & Exurbs

$
0
0

America is becoming less mobile than in the past, but there are some major metropolitan areas --- and areas within them --- that have fewer people move in and out than others. US households tend to live longer in their present residences where population growth has been more modest. The data also indicates that across all major metropolitan areas, households tend to have lived longer in suburbs and exurbs than in the urban core.

The Census Bureau’s American Community Survey (ACS) reports on the length of time that residents have been living at their current address. This article describes the length of residence tenure data, focusing principally on the 53 metropolitan areas with more than 1,000,000 residents. This includes the latest data (for 2017) at the metropolitan area level as well as the latest data at the small area level using the City Sector Model (Figure 12). This permits examination of length of residential tenure within major metropolitan areas.

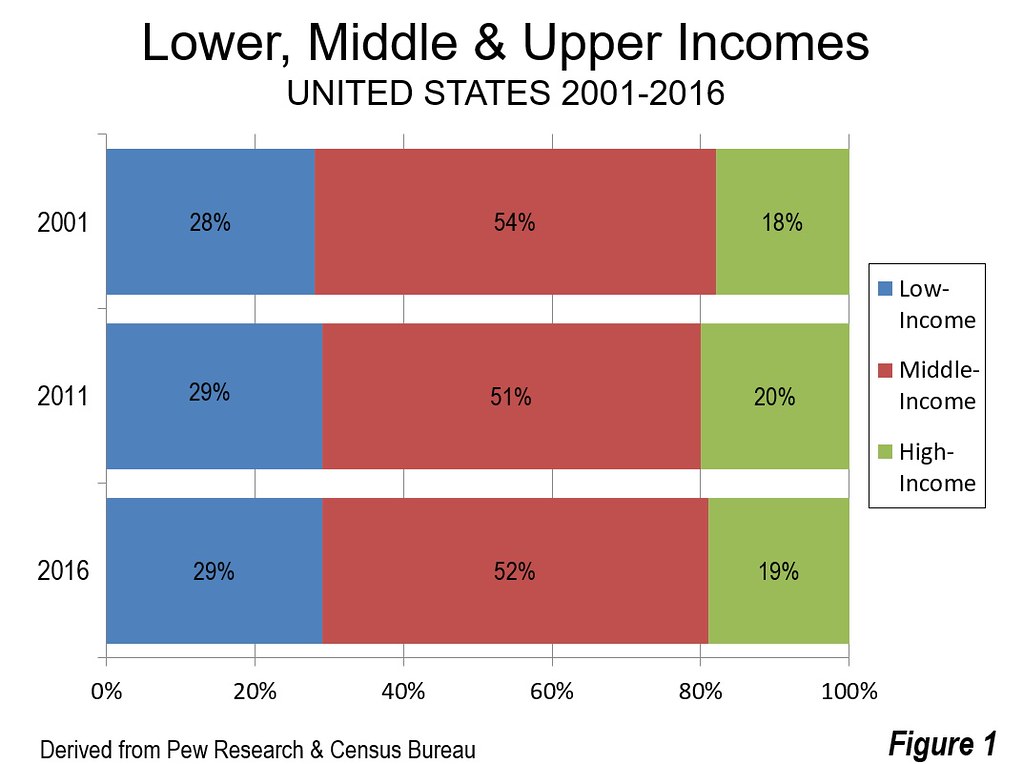
As of 2017, the median period of residence (tenure) in the United States was 7 years (Figure 1). Among those living in owner-occupied housing (those with and without mortgages), the median was 12 years, while among renters the median tenure was below two years (See Note 1, “Note on the data”).

Major Metropolitan Area Data: All Households

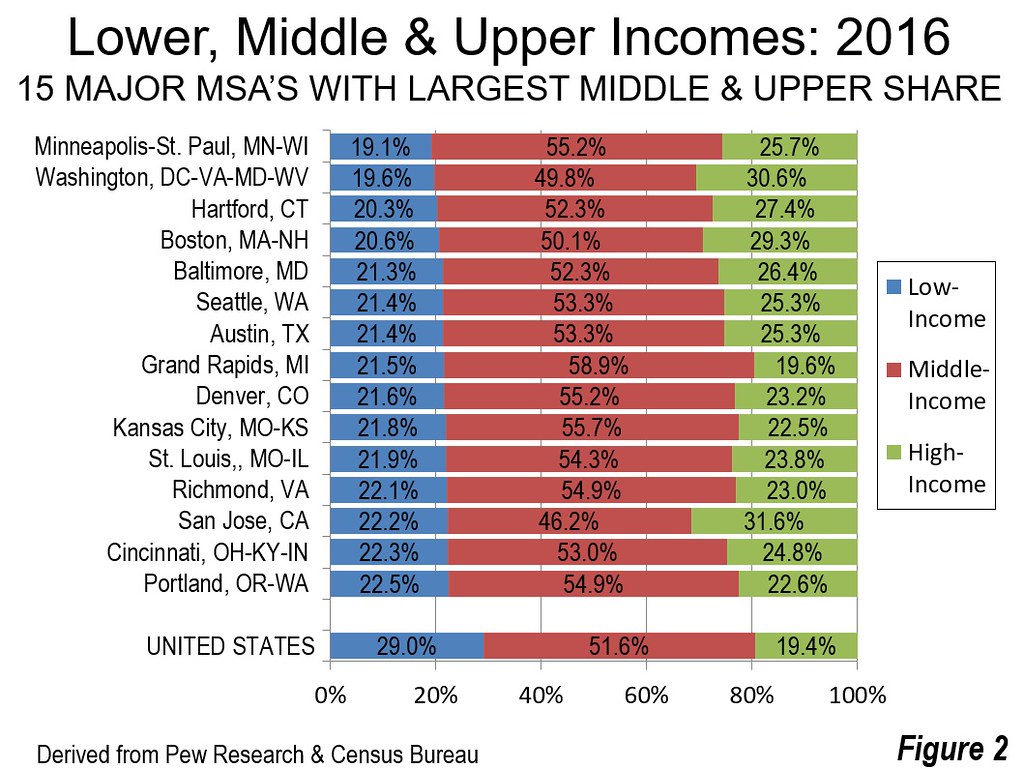
Among the major metropolitan areas, the longest median period of residence was in Pittsburgh, at 11 years. Pittsburgh’s long lengths of tenure are not surprising, in view of its lack of population growth. As presently defined geographically, the Pittsburgh metropolitan area had two percent less population in 2017 as in 1930 (See Note 2: Pittsburgh Population). This declining population base denied the metropolitan area the new residents that would have reduced its median residency period.

Outside Pittsburgh, Buffalo had the slowest growth rate, at 25 percent from 1930. Buffalo is among the metropolitan areas with the second longest median residency, at nine years. Slow growing New York, Philadelphia and Hartford, also had medians of nine years. All of the 10 metropolitan areas with the longest residence medians were in the Northeast or the Midwest (Figure 2).

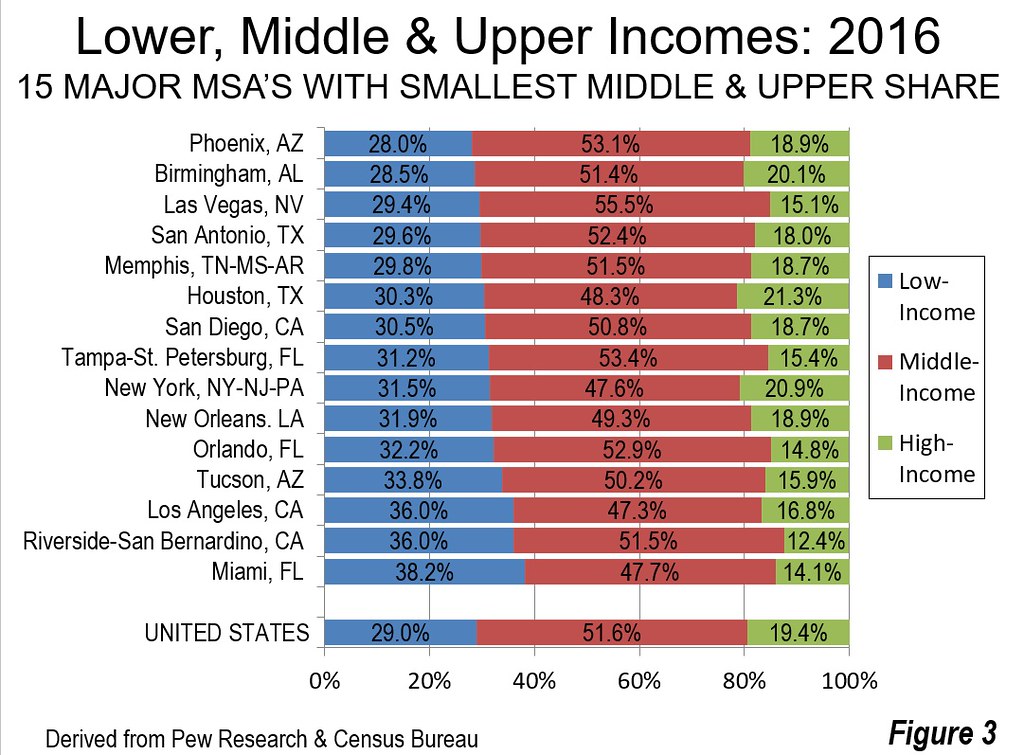
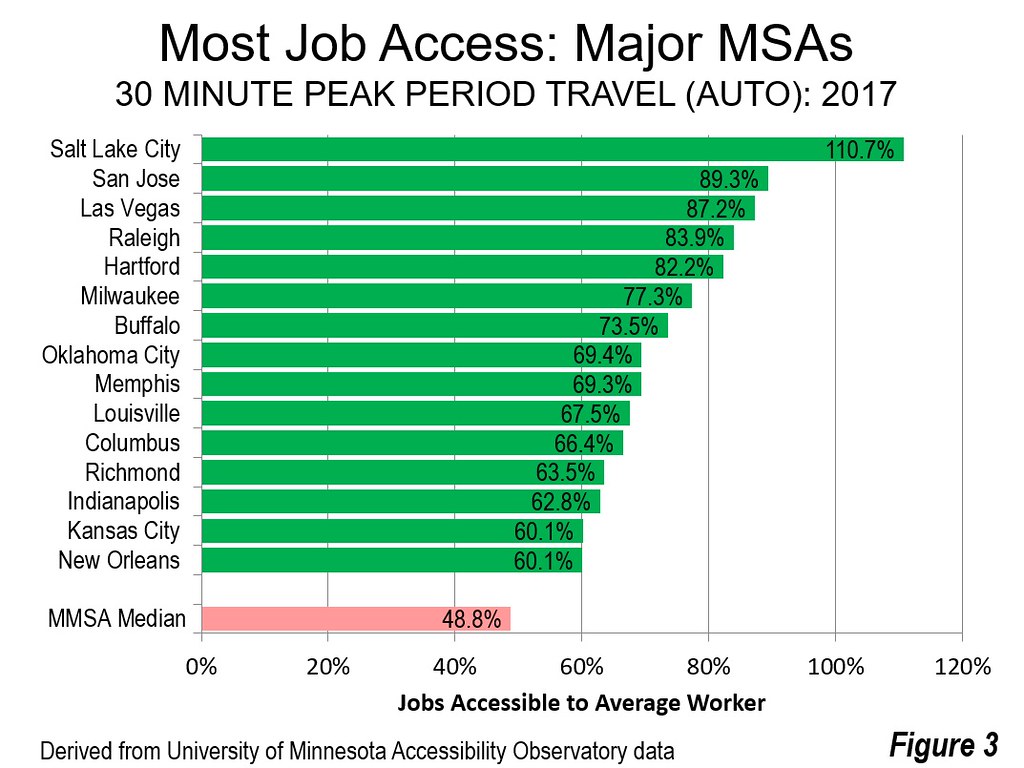
The shortest median residence periods were all in the faster growing metropolitan areas of the South or the West Census Bureau regions. The shortest medians were in Las Vegas and Austin, both at four years. These two major metropolitan areas have been the fastest growing over the last two decades (Figure 3).

Major Metropolitan Area Data: All Households

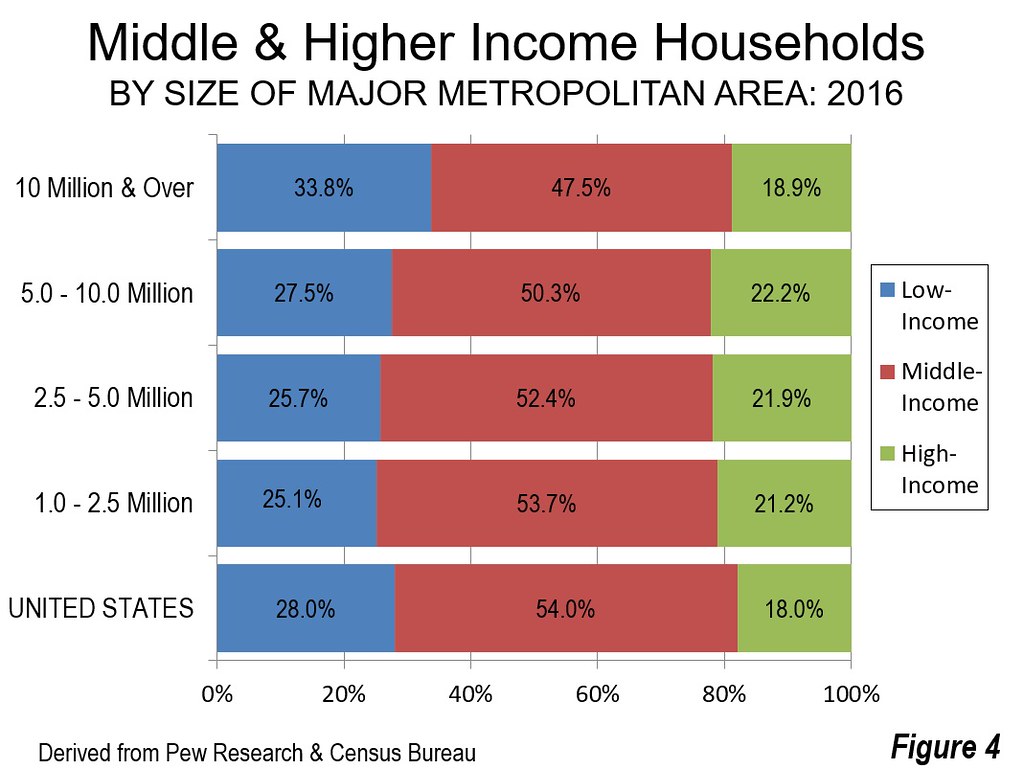
As in the all households data, Pittsburgh has the longest median owner occupied residence periods, at 16 years. The home ownership data, unlike that of households, is not monopolized by the Northeast and Midwest, though the slow growing metropolitan areas of the Northeast and Midwest have 11 of the 14 longest medians. Los Angeles is in a five-way tie for second longest, at 15 years (Figure 4). It is also notable that San Jose, which has had 85 percent of its growth since 1950 and no pre-World War II urban core, ranks a seven way tie with a median of 13 years.

The longest rental median was in New York at five years. Los Angeles and San Francisco each had a median of four years (Figure 5). All of the other 50 major metropolitan areas had a median rental tenure length of three years or less.

City Sector Data

The length of residency varies considerably, as indicated by the City Sector Model analysis (Figure 12). The ACS 2012/2016 survey (taken over five years, one-fifth in each year, with a middle-year of 2014) indicates a population weighted median of 7.0 years for all major metropolitan area residents. The shortest periods of residency are in the Urban Core, with 2.4 years in the CBD and 4.6 years in the Inner Ring. The suburban and Exurban residency periods are longer, ranging from 6.9 years to 8.8 years (Figure 6).

These differences are largely driven by the ownership data, since the rental tenure lengths are fairly stable across the city sectors. The shortest median period of residency is among owners in the Urban Core: CBD is 6.8 years, well below the other four sectors (from 10.8 years to 13.4 years). Overall, home owners have been in their houses for a median of 12.1 years. Among renters, the medians are all between 2.0 and 2.2 years, except in the Exurbs, where the median reaches 2.5 years (Figure 7). This suggests that as people continue to move from the urban cores, where renting is more common, to the suburbs and exurbs, they are more likely to transition to home ownership. This is despite the popularity of substituting renting for buying among academics, urban planners and others.

As is so often the case, New York stands out as an outlier. With a median residential tenure of 7.0, New York’s CBD is well above that of San Francisco (3.1) and Los Angeles (3.8) and more than double that of the other 50 major metropolitan areas (Figure 8). New York’s median tenure is also higher in each of the other city sectors, but the differences are less. (Figure 9).

In the balance of the Urban Core, the Inner Ring, all of the longest medians in the Urban Core are in the East and Midwest, except for San Francisco (Figure 10). In the suburbs and exurbs, Pittsburgh has the longest residential tenure median, at 11.8 years, closely followed by New York (11.4) and Buffalo (11.2). All of the 10 longest suburban and exurban medians are in the East and Midwest (Figure 11).

From the Transitional Urban Core to the Longer Tenures in the Suburbs and Exurbs

Generally, residential tenure tends to be longer in metropolitan areas with slow growth and shorter in fast growing metropolitan areas. Within metropolitan areas, residential tenure tends to be shorter in the urban cores and especially in the central business districts. This reflects the greater incidence of renting in the urban core, a phenomenon that does not follow households to the suburbs.

The Census Bureau’s Current Population Survey has long shown that people tend to move less frequently as they become older. The ACS data shows that residential tenures are the longest in the suburbs and exurbs, where most people live (86 percent) and which account for an even greater percent of the population growth since 2010 (91 percent). Residential tenures tend to be remarkably shorter in the urban core, particularly in the CBD. With households living only a median of 2.4 years in these areas, communities are necessarily more transitional. The opposite is true in the suburbs and exurbs, where people stay in their homes (and neighborhoods) longer.

Note 1: Note on the data: The median is measured the middle, the point at which one-half of the residents have lived at the same address longer and the other half for a shorter period. ACS reports whole years, not differentiating periods within years. ACS does not differentiate among periods less than two years, which are simply shown as less than two years (as in Figure 1).

Note 2: Pittsburgh population: The Pittsburgh metropolitan area, as currently defined by the Office of Management and Budget, had 2.382 million residents in 1930 and 2.333 million in 2017. During the period, the area’s population rose to 2.769 million in 1960, and, concurrent with the virtual death-spiral of its signature steel industry, lost 300,000 residents by 2000.

Wendell Cox is principal of Demographia, an international public policy and demographics firm. He is a Senior Fellow of the Center for Opportunity Urbanism (US), Senior Fellow for Housing Affordability and Municipal Policy for the Frontier Centre for Public Policy (Canada), and a member of the Board of Advisors of the Center for Demographics and Policy at Chapman University (California). He is co-author of the "Demographia International Housing Affordability Survey" and author of "Demographia World Urban Areas" and "War on the Dream: How Anti-Sprawl Policy Threatens the Quality of Life." He was appointed to three terms on the Los Angeles County Transportation Commission, where he served with the leading city and county leadership as the only non-elected member. He served as a visiting professor at the Conservatoire National des Arts et Metiers, a national university in Paris.

Photograph: Neighborhood in city of Indianapolis


Lurching To A New Weimar

$
0
0

America seems to be heading inexorably toward a Weimar moment, a slide toward political polarization from which it could be increasingly difficult to return. Weimar — that brief, brilliant and tragic German republic of the 1920s — was replaced by Hitler’s murderous regime in 1933.

Like Weimar, our politics are increasingly defined by violence, whether the Pittsburgh massacre, the mass mailing of bomb-laden parcels, dueling mobilizations on the border, the shooting of Republican Rep. Steve Scalise or, less lethally, the antics by unhinged partisans such as Maxine Waters. Respect for the basic folkways of a functional republic is vanishing, damaged by the angry narcissism of both President Trump and his often-hysterical media enemies.

So we end up with a spectacle surrounding funerals at a Pittsburgh synagogue, with the mainstream press virtually blaming Trump for the killings, even though he was no favorite of the anti-Semitic shooter. President Trump may be divisive, but he likely doesn’t hate Jews, particularly given he has children and grandchildren who are members of the tribe.

How democracies really die

Let’s start by stating that Donald Trump is no Adolf Hitler, and his increasingly cowed Republican Party no National Socialist clone. But his intemperance has widened gaps that were already gaping. And certainly, his prior, mistaken refusal fully to denounce the alt-right activists at Charlottesville displayed a terrifying ignorance about white nationalists and their agenda.

Yet, less obviously, the road to Weimar is also being paved by his opposition. Trump was elected legally, but from the beginning his opponents — including senior member of the Democratic Party — devalued his election and threatened his impeachment. By claiming to be the “resistance,” as opposed to the loyal opposition, they have set in play a tit-for-tat political war game that is becoming all too real.

In a democracy, norms of transcending partisanship matter. It was the refusal of the various parties in Germany, notes City University of New York historian Eric Weitz, to express faith in free speech and democratic norms that undermined that country’s democracy. In Weimar Germany, he notes, lack of faith in liberal principles infected many, if not most, of the top aristocrats, intellectuals, clergy, bureaucrats and industrialists — most eventually welcomed the authoritarian Nazis. “Democracy,” Weitz notes, “needs democratic convictions and a democratic culture.”

Following the left over the ledge

Unlike pre-war Germany, the right does not dominate the country’s corporate, media and technological establishment. These have, with a nudge from Trump, largely coalesced around the Democratic Party. Yet the movement of powerful and wealthy individuals has failed, as in the past, to moderate the opposition, but has instead become increasingly strident.

Some antics of the current “resistance” — notably the idea of harassing administration supporters with their families, the shouting down or banning of speakers, the brutal Antifa — reprises the tactics of the Communists in Germany, or the Red Guards under Mao. Like the Nazis, the Communists took to the streets and denounced democracy, adding to the atmosphere that allowed the Nazis to proclaim themselves the only real alternative to a Bolshevist coup.

Authoritarianism among the cultured and highly educated, who generally revile Trump, is nothing new. Many students today are indoctrinated in social justice but not civics. They are depressingly dismissive of the idea of free speech. Much the same occurred in Germany, where the university became something of a Nazi stronghold. Similarly, many artists backed Hitler’s efforts to “cleanse” German culture. In the first months of the regime, notes one historian, “testimonials of loyalty rained down upon it unrequested”.

Lucky it’s 1928, not 1933

Fortunately, we are still far from the conditions that created Weimar. We may be losing in Afghanistan, but this is nothing like the massive catastrophe that Germany suffered in the First World War. Powerful corporate interests dominate much of our economy, as they did in Germany, but even the tech oligarchs nominally support democratic norms. Our economy is actually humming, although that was true in Germany in 1928.

But things could get worse, no matter who wins in 2018 or 2020. Weitz describes “proletarianization of the middle class,” the drop in the status and security among the class that has been the natural bulwarks of a democracy, as one of the precipitating causes of Nazism. Most Americans have experienced stagnant or reduced wages since the 1970s, and their anger and disappointment could turn far worse if the economy, as seems inevitable, takes something of a nose dive.

Right now, the habits of liberal democracy are fading, not only here but in places like Brazil, across eastern Europe, Turkey and the Philippines. As standards are broken, from the White House and elsewhere, belief in republican norms is steadily being undermined. Our road to Weimar may be slower, and less precipitous than that of Germany, but the course is frightening clear.

“The death of democracy is not likely to be an assassination from ambush,” the renowned educator Robert Hutchins once said. “It will be a slow extinction from apathy, indifference and undernourishment.”

This piece originally appeared in The Orange County Register.

Joel Kotkin is executive editor of NewGeography.com. He is the Roger Hobbs Distinguished Fellow in Urban Studies at Chapman University and executive director of the Houston-based Center for Opportunity Urbanism. His newest book is The Human City: Urbanism for the rest of us. He is also author of The New Class Conflict, The City: A Global History, and The Next Hundred Million: America in 2050. He lives in Orange County, CA.

Photo: Kenneth Lu from San Francisco, CA [CC BY 2.0 ], via Wikimedia Commons

California Supports “Foreign” Big Oil

$
0
0

California is home to the largest crude oil reserves in America, but the States’ choice to not drill for that oil requires in-state manufacturers to “export” billions of dollars annually to oil rich foreign countries to import their oil to meet the state’s energy demands.

The subject of energy for the world’s fifth-largest economy is about finding a workable, sustainable balance across equally important concerns for our economy, our shared sense of social equality, our impact on the environment, and a truly sustainable energy future.

The state’s daily need to support its 145 airports (inclusive of 33 military, 10 major, and more than 100 general aviation) is 13 million gallons a day of aviation fuels. In addition, for the 35 million registered vehicles of which 90 percent are NOT EV’s are consuming DAILY: 10 million gallons a day of diesel and 42 million gallons a day of gasoline.

The USA is now a net exporter of crude oil, with crude oil exports exceeding imports. This oil boom coming from Texas, North Dakota, Pennsylvania, Oklahoma, and Colorado, is beneficial to 49 states, but not to California. The insurmountable condition of no pipelines over the Sierra Nevada Mountains results in California having no easy access to the over- supply of USA crude oil east of the Sierra Nevada Mountains. The American shale boom has important security implications as well, as America is now less dependent on crude oil from the turbulent Middle East, again, except for California.

California is an “energy island” to roughly 40 million citizens, bordered between the Pacific Ocean and the Arizona/Nevada Stateline with no pipelines over the Sierra Nevada Mountains. To access the oil shale boom from the rest of the country for California, that oil must to go through the Panama Canal to reach California ports. There are other options of crude oil by trucks, or by railroads, but both have been overwhelmingly ruled out environmentally.

Additionally, the crude oil is needed in California to support the other “stuff” of chemicals and by-products from crude oil that are the basis of 6,000 products from petroleum that are part of every infrastructure and virtually everything in our daily and leisurely lifestyles.

Many in California are working hard to produce hydrocarbon energy efficiently, reliably, and safely, and many others are working hard to develop alternative energy sources that will efficiently, reliably, and safely produce carbon neutral energy, but despite those appreciative efforts, our energy needs continue to grow with the growing populations of people, vehicles, and businesses.

Both California’s in-state oil production, and Alaskan oil imports are both in-decline to meet the States’ energy needs. Shockingly, California increased crude oil imports from foreign countries from 5% in 1992 to 56% in 2017.

In 2017, California imported crude oil from foreign countries at the rate of 354,119,000 barrels annually from oil rich foreign countries, costing California more than $26.6 billion annually at the Brent Average Crude Oil Spot Price which was recently $75.36 per barrel for September 2018. . This equates to “exporting” more than $73,000,000 per day on a daily basis from California to Saudi Arabia, Ecuador, Columbia, Iraq, Kuwait, Brazil, and Mexico and others for the crude oil energy needs of California.

The latest data from the California Energy Commission (CEC), shows that California fuel consumption is at the highest level since 2009, thus continuation of the state’s dependency on foreign countries for the states’ energy needs seems to be the states future.

The 1,700 square-mile Monterey Shale, from the state’s central coast to its San Joaquin Valley, holds roughly 60 percent of the country’s estimated shale oil reserves. Yet, even though California is sitting on one of the largest shale reserves and ocean crude oil reserves in the country in the Monterrey Shale and Pacific Ocean, California’s reliance on crude oil imports from foreign countries is at 56% and increasing each year.

The States’ choice is to continue “exporting” $73,000,000 of its dollars to oil rich nations on a DAILY basis to obtain oil from foreign countries with less stringent environmental regulations than California, and having that oil transported via air polluting ships delivering that the oil to our ports.

The State could be contributing to lessening world GHG emissions by increasing in-state production from the most environmentally regulated location in the world, from the largest crude oil reserves in the country, located right here in California. If the state chose, it could be keeping those huge funds in the state to be earned by hard-working, tax-paying Californians by accessing the huge reserves in-state.

This piece originally appeared on Fox & Hounds.

Ronald Stein is Founder and Ambassador for Energy & Infrastructure at PTS Advance, a technical staffing agency headquartered in Irvine.

Photo: Antandrus at English Wikipedia [CC BY-SA 3.0 or GFDL], via Wikimedia Commons

Ultimate City: Guangdong-Hong Kong-Macao Greater Bay Area (with Photographic Tour)

$
0
0

The Pearl River (Zhujiang) Delta has developed into the world’s ultimate city (Figure 1). More people live in the urbanization there than in any space of similar size in the world (Figure 2). Once home to separate urban enclaves comprising 9 million residents in 1980, the now adjacent urban areas of the Pearl River Delta are home to 55 million residents, nearly one-half more in either the Yangtze Delta adjacent urban areas (which have undergone a similar development process) or the Tokyo-Yokohama urban area with 38 million residents (Note 1). The population density is slightly above that of the Yangtze Delta urbanization and Tokyo-Yokohama (Figure 3), well below others, such as Jakarta, Seoul and Mumbai, and far above that of New York (which covers nearly a third more land area).

This article provides summary information on the adjacent urban areas of the Pearl River Delta. There is also a photographic tour, following the text comprised of Figures 10-56.

Geography of the Pearl River Delta Adjacent Urban Areas

The Pearl River Delta urbanization extends, about 130 kilometers (75 miles) south along the west bank of the Pearl River from Guangzhou, through Foshan, Jiangmen, and Zhonghsan, Zhuhai to Macau, and about 160 kilometers (100 miles) south along the East Bank through Dongguan and Shenzhen to Hong Kong.

The Guangdong-Hong Kong-Macau Greater Bay Area

This urbanization is at the core of a cooperative effort to integrate these adjacent urban areas (the Guangdong-Hong Kong-Macau Greater Bay Area) into an integrated economic region. The Greater Bay Area Plan combines planning for China’s Hong Kong and Macau Special Economic Regions including the Guangdong province municipalities of Guangzhou, Shenzhen, Dongguan, Foshan, Zhongshan, Zhuhai Jiangmen, Huizhou and Zhaoqing. Overall, including the areas beyond the adjacent urban areas has a population approaching 70 million.

The opening last month (October 2018) of the Hong Kong-Zhuhai-Macau Bridge (Top photograph and Figure 4) was both a important and symbolic step toward economic and cultural integration. The South China Morning Post (Hong Kong), posted a video of a trip across the bridge just before it opened. Road travel between Hong Kong International Airport and Zhuhai has been reduced from more than four hours to under an hour. Before the new bridge opened, the southernmost crossing (Humen Bridge) was more than 70 kilometers (45 miles) farther north.

Strong Growth in All of the Adjacent Urban Areas

The growth of the Pearl River Delta has been overshadowed in attention Shenzhen’s, legendary for growing rapidly to a megacity since its designation as a special economic zone in 1979 (under the leadership of Deng Xiao Peng).

In 1980, Shenzhen had the smallest population of the now adjacent urban areas (60,000, according to the United Nations estimate). In 1979, Shenzhen was designated as a special economic zone under the leadership of Deng Xiao Peng. Since that time Shenzhen has grown to 13.5 million residents, an increase of more than 13.4 million.

In 1980, more than half all of the nine million population in the urban enclaves was in Hong Kong, which had about five million residents, while Guangzhou had approximately two million (Figure 5). Guangzhou-Foshan, not Shenzhen has grown the most, adding 16.3 million since 1980 (Figures 6 and 7). Percentage growth ranged from over 200 percent in Macau, to 600 percent in Guangzhou-Foshan and 22,000 percent in Shenzhen. The slowest growth was nearly a respectable 50 percent in Hong Kong, which accounted for only 5 percent of the growth since 1980.

A Wide Range of Population Densities

While the Pearl River Delta adjacent urban areas are well below the highest urban densities in the world (Dhaka, Bangladesh is at least 7 times denser), they include the two densest urban areas in the high-income world. Hong Kong and Macau. Their above 25,000 per square kilometer density (65,000 per square mile) is far greater than the overall 5,000 (13,000 per square mile) in the other urban areas.

Commercial Centers

The Pearl River Delta has some of the strongest commercial centers in the world. Astoundingly, more than one quarter (13) of the 50 tallest buildings in the world are located in the Pearl River Delta (excluding telecom towers). The Pearl River Delta has more “supertall” buildings (300 meters or approximately 1,000 feet) than any single urban area, and more than three times as many as New York. This is an incredible turnaround, since in 1970, 9 of the 10 tallest buildings in the world were in New York (Figure 8). The Pearl River Delta also has a commanding lead among buildings of 150 meters (approximately 500 feet) nearly as many as the next three areas, New York, the Yangtze River Delta adjacent urban areas and Dubai (Figure 9). The Canton Tower (Figure 13), across the Pearl River from Guangzhou’s Zhujiang New Town is the second tallest free-standing tower in the world (not classified as a building) and the tallest structure in the Pearl River Delta.

These dense centers belie a significant dispersion of employment and commercial activity. In addition to the large historic commercial districts, there is a plethora of edge cities (see: see “Edge Cities in China: Suzhou,” note 1), such as in Figures 20, 26, 28, 29, 30, 40 and 41. This dispersion shows no signs of slowing down. For example, ground was recently broken on the Shimao Shenzhen-Hong Kong International Centre in Shenzhen, which will be located appositely 15 kilometers (10 miles) away from the largest commercial areas, and will be the tallest building in the Pearl River Delta and would rank second in the world by today’s rankings, after the Burj Khalifa in Dubai

Integrating the Adjacent Urban Areas

Transportation is a critical element of integrating the urban areas of the Pearl River. The area has long had a comprehensive toll motorway (freeway) system, though automobile ownership rates are not yet high (Note 2). Additional bridges are being planned. The eight-lane Second Humen Bridge will link Dongguan and Nansha District in Guangzhou. The planned Shenzhen-Zhongshan bridge will reduce travel between these municipalities to 20 minutes, from the present two hours. Also eight lanes, the bridge will be the critical link in a cross-town motorway from Huizhou through Shenzhen and Zhongshan to Jiangmen.

Rapid commuter rail connections are being established between the municipalities in the Greater Bay Area and Guangzhou South (Guangzhounan) Station. The intention is to reduce travel times between the cities to one-hour or less. Such travel times are now achieved between Guangzhounan and all of the Greater Bay Area municipalities, including Huizhou and Zhaoqing.

Three of the world’s 10 most patronized Metro (urban rail or subway) systems are in the Pearl River Delta. The Guangzhou Metro is reported to rank fourth and is connected to the Foshan Metro, helping to advance the economic integration of those two municipalities. There are also plans to connect to the Dongguan Metro, which has begun construction. Hong Kong’s MTR ranks 9th among the world’s most patronized Metros. The Shenzhen Metro, already carrying nearly as many riders as Hong Kong, plans to extend its system to be the longest in the world by 2030, and will link up with the Dongguan Metro. These three largest Metros would overwhelm the ridership figures for any other urban area in the world, as well as the Yangtze River Delta adjacent urban areas.

Connecting to the World

The Pearl River Delta has three of the top ten seaports in the world, including Guangzhou, Shenzhen and Hong Kong. Two of the area’s international airports rank in the top 20 in passenger usage, including Hong Kong International (8th) and Guangzhou Baiyun International (13th).

The Future

The various initiatives outlined above, and others promise to improve the economic performance of the Greater Bay Area. There are, however challenges, not the least of which is a potentially transient population. Much of the growth of the east coast urban areas, and especially those in the Pearl River Delta derived from temporary migration to staff the manufacturing and construction that fueled China’s rapid economic advance and poverty reduction. The South China Morning Post report that more than 60 percent of the residents of Guangzhou, Shenzhen, Dongguan and Foshan are temporary residents, without permanent residency permits (hukou).

Sustaining the present population levels, especially with China’s low fertility rate, will require turning temporary residents into permanent ones. It seems likely that the Pearl River Delta will continue to be the world’s ultimate city in the years to come.

PHOTOGRAPHIC TOUR OF THE PEARL RIVER DELTA URBANIZATION

Figure 1: Pearl River Delta Adjacent Urban Areas superimposed on Google Earth

Figure 4: Hong Kong-Zhuhai-Macau Bridge western approach (aerial photograph)
The bridge from Hong Kong enters from the middle-right of the picture and enters the customs facility on the island. Access to Macau is to the bottom of the picture. Access to Zhuhai is along the lower portion of the picture (just to the north of Macau towers at the bottom) reaching Zhuhai just to the east of Zhuhai Railway Station, a white rectangular structure partially shown near the bottom left corner of the picture.

The Apex: Guangzhou-Foshan (Figures 10-28)

Figures 11-17: Zhujiang New Town: One of the world’s largest “edge cities” (substantial new tside the central business district) Like Atlanta’s centrally located Mid-Town edge city, Zhujiang New Town is located near Beijing’s historic central business district. For a more detailed description of edge cities, see “Edge Cities in China: Suzhou,” note 1.

Figures 18-19: Older Central Guangzhou

Figures 20-23: Baiyun New Town edge city and motorways (freeways)

Figure 24: Suburban villa development

Figure 25: Xiqiao Mountain (Foshan)

Figure 26: Edge city development at Guangzhounan

Figures 27-30: By train from Guangzhounan to Zhuhai
​There is also direct access to nearby Macao from Zhuhai Station

Figures 31-32: Zhuhai

The East Bank: Shenzhen, Dongguan and Hong Kong (Figures 33-55)

Figures 33-40: Shenzhen Futian CBD

Figures 41-43: Shenzhen Huaqiangbei (China’s “Silicon Valley”)

Figures 44-48: Shenzhen Luohu CBD

Figure 51: Dongguan

Figures 52-56: Hong Kong

NOTES

Note 1: The Yangtze Delta adjacent urban areas include Shanghai, Kunshan, Suzhou, Wuxi and Changzhou. Like the Pearl River Delta, these former enclave urban areas have grown into adjacent urban areas.

Note 2: China is now the world’s leading producer of automobiles. Automobile ownership, while still low compared to high income nations, is rapidly increasing.

Wendell Cox is principal of Demographia, an international public policy and demographics firm. He is a Senior Fellow of the Center for Opportunity Urbanism (US), Senior Fellow for Housing Affordability and Municipal Policy for the Frontier Centre for Public Policy (Canada), and a member of the Board of Advisors of the Center for Demographics and Policy at Chapman University (California). He is co-author of the "Demographia International Housing Affordability Survey" and author of "Demographia World Urban Areas" and "War on the Dream: How Anti-Sprawl Policy Threatens the Quality of Life." He was appointed to three terms on the Los Angeles County Transportation Commission, where he served with the leading city and county leadership as the only non-elected member. He served as a visiting professor at the Conservatoire National des Arts et Metiers, a national university in Paris.

Top Photograph by N509FZ [CC BY-SA 4.0 ], from Wikimedia Commons

Economics Blunt A Blue Wave In 2018 Elections, But Danger Signs Mount For GOP

$
0
0

All politics is local, Tip O’Neill observed, and despite the national battle between Donald Trump and the Democratic “resistance,” the mid-term elections in rural states and the Midwest showed this dictum still holds. Democratic senators with proven grassroots appeal like West Virginia's Joe Manchin and Ohio's Sherrod Brown won handily Tuesday, while less established figures like Indiana’s Joe Donnelly, Missouri's Claire McCaskill and North Dakota's Heidi Heitkamp, all of whom at times played to the center, went down ignominiously.

Yet to a large extent, national and geographic factors played a role this year, much as in 2016. President Trump may drive coastal sophisticates, women and minorities wild with his often inane comments, misogyny and demagoguery, sparking unusually high turnout, but in the middle of the country his policies, at least so far, have coincided with rapid job and income growth not seen in a generation.

Income growth is now largely strongest in the pro-Trump states. In the second quarter, Texas led the nation with 6% income growth, followed by Louisiana, Kentucky, North Dakota, blue-tilting Colorado, Arkansas and Iowa, which were all north of 5%, according to the Bureau of Economic Analysis.

Strong wage growth in blue-collar sectors, particularly manufacturing, make voters in Trump’s America feel like he’s done enough to dump the Democrats rather than candidates linked to the president.

However Tuesday night’s results, with the Democrats seizing control of the House of Representatives on a wave of victories in suburbs of big cities that were formerly Republican strongholds, aided by demographic trends, suggest that there’s a blue wave moving in from the coasts, boding poorly for the GOP in future elections.

Role Reversal

Once upon a time the GOP was the party of the business elite. Not so much anymore.

Trump states tend to make things -- they build houses, drill oil wells, make cars and grow food. The Democratic America increasingly makes its living off tourism, software, media and finance -- all sectors that strongly backed Democrats this year.

The Democratic Party’s burgeoning economic base in the richest fields allow them to consistently spend more than the GOP in key congressional races. The Republicans still have support in energy and other older, basic industries, but they don’t boast the kind of executives who are widely touted now as role models, like Michael Bloomberg, Warren Buffet, Bill Gates, Elon Musk, Jeff Bezos and Tim Cook.

The French Marxist economist Thomas Piketty aptly describes this conflict as “the brahmin left against the merchant right,” that is between a highly educated elite in tech, government, media and bureaucracy versus what is left of Main Street.

This Brahmin-merchant struggle can be seen in the results of crucial congressional races. The GOP held onto Main Street in most places, winning easily in the small towns, exurbs and newer suburbs. Trump’s 2016 election was made possible by these people and industries, and so far his presidency has delivered both a real and psychological boost for them. Despite repeated tales of how tariffs are destroying manufacturers, the industrial sector, after weakening at the end of President Obama’s term, has been enjoying its best growth since the mid-1990s. Critically, incomes are up for the lower deciles of the labor force, including youth. In 1992, 15 of the 20 most manufacturing oriented congressional districts were Democratic; today all 20 are controlled by the GOP.

Trump has in fact been very successful for Main Street and the industrial economy. Yet most Americans today do not live in small towns or buy most of their products from local friendly vendors. The sectors Trump supports are not on the cutting edge of history.

The Democrats' Suburban Coup

The Democrats made their most significant gains in suburbs near big cities -- home to growing numbers of minorities and upwardly mobile millennials. Many of these people are offended by Trump’s loutishness and xenophobia; younger voters, who tend to be less patriotic and religious, are less subject to the GOP’s nationalist and conservative social appeal. Republicans lost upper-income suburban seats around Los Angeles, Washington, D.C., Chicago, Houston and Dallas. As someone who spends much time in the latter two great Texas cities, you could smell the impending change just by talking to people and looking at the endless sea of Beto signs. In two to five years, more seats, including in the Senate, could be in play.

This rise of gentrified politics has long been a feature of California, where the party lost at least one or two seats Tuesday. Once the home of the most fearsome Republican machine in the country, the Golden States is now deep blue, and its business elite in both Silicon Valley and Hollywood function alternatively as funders and court jesters for the Democrats. In crucial House races in places like Orange County, where I live, they outspent the Republicans handily. They also appear to have out-thought and out-campaigned them.

Yet it’s not just the elites that win elections. The Democrats have mobilized a lot of progressive volunteers, from the ranks of young devotees; my house was canvassed three times by supporters of University of California-Irvine law professor Katie Porter but not by her opponent, Rep. Mimi Walters. Grassroots enthusiasm matters, and Trump has done a great job of rousing his opponents. Porter may have lost by 3 points, the forces she has excited will still be in play.

Critically, the Democrats in California, and elsewhere in the nation, have combined their high-end support from wealthy suburbs with an appeal to minorities. In 2012, the California electorate was about half non-Hispanic white; by 2030, that ratio will drop closer to 40%. Asians, despite their relative wealth and opposition to affirmative action in college admissions, remain reliable members of the Democrats’ “rainbow” coalition. In 1998, the percentage of Asians nationwide identifying with Democrats was 53%; today, it’s 65%.

The only countervailing trend is the fact that more Americans -- contrary to the conventional wisdom of the media and the investment community -- are migrating in bigger numbers away from the big deep blue metro areas like New York, Boston, Los Angeles and San Francisco. They are settling in places like Texas, where younger voters (18-29) overwhelmingly supported Beto O’Rourke, 71% to 29%. Voters aged 30-44 leaned toward him, 51-47. Voters over the age of 45 favored Cruz 58-41.

If you are betting on the future, it gets ever more dubious for the GOP -- even Texas looks wobbly. If they are losing or barely winning affluent suburbs amidst a thriving economy, this is very bad news. Every year GOP voters die, and new predominantly Democratic ones replace them -- not only in deep-blue areas but more contestable ones like California’s Orange County, inner-ring Houston and Northside Dallas.

This all suggests that, even in a strong economy, the Democrats enjoy significant long-term demographic advantages in coming elections. Even strong economic gains for low-income workers has not (to the consternation of Republicans) eroded Latinos and African-Americans affinity for the Democrats. Both groups went overwhelmingly blue this year.

Demographic change has not advanced far enough yet in Georgia and Florida to enable the dynamic African-American candidates Stacey Abrams and Andrew Gillum to prevail in their gubernatorial races.

Nonetheless, until the GOP finds a way to appeal to these voters and immigrants, as Nixon and Reagan did with white ethnics, the blue wave may continue moving in from the coasts, employing their cultural dominance, media support and control of academia to devastating effect. Unless the Republicans find an answer, the party may find itself increasingly as irrelevant in much of the nation as they already are in California.

This piece originally appeared on Forbes.

Joel Kotkin is executive editor of NewGeography.com. He is the Roger Hobbs Distinguished Fellow in Urban Studies at Chapman University and executive director of the Houston-based Center for Opportunity Urbanism. His newest book is The Human City: Urbanism for the rest of us. He is also author of The New Class Conflict, The City: A Global History, and The Next Hundred Million: America in 2050. He lives in Orange County, CA.

Photo by Kyle Tsui from Washington, DC, USA (Women's March 2018) [CC BY 2.0 ], via Wikimedia Commons

Signs of Hope in California?

$
0
0

Ronald Reagan is not coming back, but California may be avoiding a trip to the insane asylum. Yes, the GOP’s lackluster gubernatorial candidate, John Cox, lost by almost 20 points, and the only issue in the legislature is whether the Democrats regain their supermajority in both houses. But it could have been much worse.

The GOP lost only two or three congressional districts in southern California and appeared to be holding its own in the interior. In my own district, to my surprise, Mimi Walters, who was out-campaigned and outspent, managed to win. Others, like the more contentious Dana Rohrabacher, did not.

Read the entire piece at City Journal.

Joel Kotkin is executive editor of NewGeography.com. He is the Roger Hobbs Distinguished Fellow in Urban Studies at Chapman University and executive director of the Houston-based Center for Opportunity Urbanism. His newest book is The Human City: Urbanism for the rest of us. He is also author of The New Class ConflictThe City: A Global History, and The Next Hundred Million: America in 2050. He lives in Orange County, CA.

Photo: Ggerdel - Fotografía tomada por: Gustavo Gerdel (BAB - Buenos Aires Buceo) [CC BY-SA 4.0 ], via Wikimedia Commons

Superstar Effect Wins Again as Amazon Chooses New York, Washington for HQ2/3

$
0
0

Amazon, obviously embarrassed at the way their HQ2 process has been received, leaked the results of the competition the night before Election Day, ensuring coverage will be largely muted.

Amazon has reportedly decided to split HQ2 between two locations, New York City (Long Island City, Queens) and Washington (Crystal City, VA).

I will have more analysis over the next several days, but this shows that the superstar effect is alive and well. Amazon chose not one but two elite coastal cities for its new headquarters.

There’s no other way to slice it: Amazon repudiated the heartland with this decision. This was probably the ideal case for a heartland choice. It was not just a small executive headquarters but a gigantic number of employees. And Amazon, having lower margins than say Google, has to be much more cost conscious. My own analysis turned on the question of whether or not Amazon would be concerned about costs. I thought they would be, but it turns out they didn’t care. No matter what subsides Amazon extracts from New York and Virginia, they certainly won’t offset the labor cost differentials in those locations.

A friend of mine who works at Google several months ago predicted NYC, saying he thought that Amazon was looking for the “upgrade HQ.” It will be interesting to see if the center of gravity in the company tilts away from Seattle. And where Bezos himself spends most of his time. Another correct prognosticator was Joe Cortright, who predicted Amazon would pick multiple cities so they could retain leverage over time to keep extracting more subsidies.

This choice is a profound challenge to much of America, and particularly to red state philosophies of economic growth. At the high end of the economy, where the most value is being generated and where much of the future of the country is determined, the critical factor is ability to hire top 1% type talent. These companies need the best of the best. And that talent is located disproportionately in the coastal elite cities.

As one person tweeted, “A friend is the founder of a fintech company. They want to hire more college graduates to their Austin office instead of NYC. New talented recruits have multiple offers & most want to be in NYC, not Austin. Austin isn’t exactly a horrible place to live.”

At this level, cost is essentially irrelevant at present. The ability to attract A+ caliber talent is all.

That’s not to say heartland places can’t be successful in many ways. But it won’t be at the elite tiers of the economy.

The Biggest Loser

The biggest loser in this is Chicago. Chicago had the urban location, transit, a great pipeline of talent from the Big Ten, and lower costs. That’s why I picked Chicago as the favorite in my analysis. It checked every box at some level and had lower costs than the coasts to boot.

It didn’t matter. Real estate magnate Sam Zell attributed this to the city and state’s political and fiscal problems, saying, “On a pure competitive basis, Chicago is far and away the No. 1 place that Amazon should pick for their second headquarters—major international airport, major universities, talent, etc.—and yet if I were Amazon, that’d be the last place I’d consider because you’re taking on, excuse the expression, pre-existing conditions.”

This could well be true. Undoubtedly these items are a huge boat anchor on the city, no matter what local boosters might say.

But the talent issue shouldn’t be overlooked. Having lived in both Chicago and New York I can tell you that the caliber of talent is as different as night and day. Chicago has a ton of solid Big Ten type recruits. They are drawing the top 10-20% type people. But Chicago is very weak in top 1-2% types, and that’s a huge handicap when you are trying to position yourself as an elite player. You can’t do it without elite talent, and Chicago doesn’t have nearly enough of it. I wouldn’t be surprised if this were the key factor for Amazon.

Dallas and Atlanta were the other heartland places that could have handled the job influx. But they can console themselves by saying that they weren’t urban enough. The Columbuses and Indys of the world can feel good just to be included on the final 20 list.

But regardless of where you are, this is a big negative indicator for heartland competitiveness at the high end of the economy across the board.

This piece originally appeared on Urbanophile.

Aaron M. Renn is a senior fellow at the Manhattan Institute, a contributing editor of City Journal, and an economic development columnist for Governing magazine. He focuses on ways to help America’s cities thrive in an ever more complex, competitive, globalized, and diverse twenty-first century. During Renn’s 15-year career in management and technology consulting, he was a partner at Accenture and held several technology strategy roles and directed multimillion-dollar global technology implementations. He has contributed to The Guardian, Forbes.com, and numerous other publications. Renn holds a B.S. from Indiana University, where he coauthored an early social-networking platform in 1991.

Photo Credit: Rober Scoble, CC BY 2.0

To Make the Internet Great Again, Trump Must Smash Facebook and Its Tech Oligarch Friends

$
0
0

Even as many Americans look with horror on the authoritarian blusterer in the White House, we are slowly succumbing to a more pernicious, less obvious and far more lasting tech oligarchy gaining ever more control over our economy, culture and politics.

“We are certainly looking at” bringing antitrust cases against Amazon, Facebook and Google,” Trump said in an interview just before the election, adding that he’s had “so many people” warning him about their overwhelming power.

Unreliable narrator though the President may be, people are indeed waking up to the tech giants’ massive and largely unchecked power, and the consequences of turning over our channels of communication to them. That includes World Wide Web inventor Tim Berners-Lee, who said earlier this year that he “was devastated” by how the internet has been used in recent elections, including our presidential race, and that he’s working to create a new system now that "the web had failed instead of served humanity, as it was supposed to have done, and failed in many places.”

We once saw the tech industry as a refreshing alternative to the staid old corporate establishment, a entrepreneurial environment where all kinds of thoughts and images would have free rein. Yet as the industry has evolved, it has become one of the most concentrated and monopolistic America has ever seen, determined to stamp out prospective rivals and expand control of both media and politics.

Amazon’s recent decision to put its two new “headquarters” operations in New York and Washington illustrates the growing collusion of tech, culture and media. From an economic or geographic point of view, other cities like Columbus, Dallas, or Indianapolis, where tech growth is greater and where lower housing and living prices are drawing more millennials, might have made more sense. But by locating in the most expensive and connected northeastern cities, Amazon and Jeff Bezos are placing themselves in the heart of the nation’s dominant media and political culture. With almost limitless cash, considerations like office or housing costs, or even taxes, that impact most normal businesses apparently mean very little.

The early phases of the digital revolution, which I witnessed in California in the 1970s and 1980s, were shaped by relentless competition between upstarts and firms that, just a few years earlier had been upstarts. Scores of companies launched their own personal computer lines, software and peripherals.

Today, a handful of companies that have colluded to keep wages down dominate the digital economy, in part by buying up any emerging competitors. Once we had bold notions of the internet helping to create an ever-expanding realm of options in the arts and journalism. In 1980, the late Alvin Toffler suggested in The Third Wave a “de-massified media.” Instead, we have Google controlling nearly 90 percent of search advertising, Facebook almost 80 percent of mobile social traffic, and Amazon about 75 percent of American e-book sales, over forty percent of all online sales and, perhaps most important, nearly 40 percent of the world’s “cloud business.” Together, Google and Apple control over 95 percent of operating software for mobile devices. Microsoft still accounts for over 80 percent of the software that runs personal computers around the world.

This piece originally appeared on The Daily Beast.

Joel Kotkin is executive editor of NewGeography.com. He is the Roger Hobbs Distinguished Fellow in Urban Studies at Chapman University and executive director of the Houston-based Center for Opportunity Urbanism. His newest book is The Human City: Urbanism for the rest of us. He is also author of The New Class Conflict, The City: A Global History, and The Next Hundred Million: America in 2050. He lives in Orange County, CA.

Photo: From http://www.shopcatalog.com/via Flickr, using CC License.


California Needs A New Economic Model

$
0
0

Already anointed by The New Yorker as the “head of the resistance,” Gavin Newsom could well think he’s also king of California politics. He can both sell himself as the model of progressive virtue and also lord of the world’s fifth-largest economy, home to three of the world’s most powerful and influential companies.

California, along with New York, epitomizes what the French Marxist economist Thomas Piketty has aptly called “the Brahmin left,” which trades in digits, images and financial transactions. The other side, “the merchant right,” trades in more tangible goods such as cars, steel, oil, gas and food.

Yet here’s the rub: The vast majority of Californians are not entitled Googlers from Stanford who can spend their time obsessing about the climate or the meaning of their sexuality. The Brahmin model has worked well for the top earners, and their offspring, but most Californians were left out of the boom.

The Other Guys are gaining on us

The rest of the nation thinks it has our number and is calling it. Data compiled by EMSI and Mark Schill over the last year reveal some key metropolitan regions, including New York, Los Angeles, Chicago and Boston, are falling behind in terms of job creation with competitors such as Nashville, Orlando, Phoenix, Dallas and Salt Lake City. The Bay Area economies, which ranked in the top five over the last decade, notched 15th and 16th last year. Even tech and business service growth, although strong down the peninsula in Silicon Valley, is now much more rapid in the sunbelt hotspots.

Much the same can be seen in migration. During the recession and the early recovery, out-migration from California slowed considerably, and the San Francisco area actually went net positive. But since then virtually all the coastal areas have seen increased out-migration. Since 2012 total net out-migration from the state has almost tripled, with many of the new departures among younger, more affluent residents.

Whereas many states might have envied California for its tech growth, they may be less impressed by its absurdly high cost of living, high energy prices and nation-leading poverty rate. A state where one in four people is poor, and as many as one in three households, according to United Way, live on poverty’s doorstep.

Breaking our addictive economy

California’s growth model has become dependent on two key sectors — high-end real estate and the tech companies — that generate capital gains on a massive level. But both of these sectors face some challenges now that could hamper their future growth.

Real estate, at least on the residential side, shows signs of peaking. Inventories are up, sales are down and there are concerns about the possible slowdown in Chinese investment. A similar pattern has emerged in Australia, where the departure of Chinese investors has sent prices plunging in some markets. Already many Californians, cashing in on inflated housing, may be taking their own dollars to more affordable markets such as Boise and Reno, where Elon Musk has put his new battery plant.

Then there’s tech, which has been the Energizer Bunny for the state economy and chief contributor to the state’s coffers. Companies like Apple, Google and Facebook all face slowing growth; their stock prices have fallen considerably, which will reduce capital gains. Right now the best hope for the budget lies in possible IPOs for Uber and Airbnb, which might allow the state another taste of the tech narcotic.

Newsom, who identifies himself with the tech oligarchs, will see any IPO or resurgence in tech stock prices as a means to boost spending without pain. Yet he also will find himself asked to pay for programs — housing subsidies, renewable energy and expanded free healthcare — that could un-balance even the healthiest budgets. Under the “frugal” Jerry Brown the state budget since 2011 grew 53 percent while the population expanded by a mere 5 percent. One can only imagine what happens now with an even less “stingy” chief executive.

The wish list of new expensive programs — single-payer healthcare alone would up to double the state budget — means Newsom must likely raise taxes ever higher. This likely will not be tough on tech firms themselves, which are adept at tax avoidance, but on upper-middle class taxpayers who have been drifting for decades to the Democrats.

What are needed are programs that resonate with an older generation of Democrats. This would include practical infrastructure investment we would actually use — roads, bridges, airports, water systems — and could also help create thousands of higher-paying blue-collar jobs. Better than wasting billions on Jerry Brown’s choo-choo, or expanding transit systems that continue to lose riders.

California cannot rely in the long term on real estate investors from New York or Shanghai, or the tech perpetual motion machine to keep the state afloat. Four of the ZIP codes sending the most cash to Sacramento are in the Silicon Valley. Overall the top 1 percent pay nearly half of all income taxes, which accounts for two-thirds of the state budget. “We are very dependent on millionaires,” Mike Genest, former budget director for Gov. Arnold Schwarzenegger, recently told the Los Angeles Times. “If the millionaires get a cold, we all die of the flu.”

Even in “good times,” most Californians are not doing so well, as indicated by low homeownership rates and the migration numbers. Given our historic economic diversity, we need to develop an economy that also provides hope for people without Ph.Ds. Gavin Newsom may like to see himself as the governor of the technocracy, but to succeed he also needs to be governor for everyone else.

This piece originally appeared on The Orange County Register.

Joel Kotkin is executive editor of NewGeography.com. He is the Roger Hobbs Distinguished Fellow in Urban Studies at Chapman University and executive director of the Houston-based Center for Opportunity Urbanism. His newest book is The Human City: Urbanism for the rest of us. He is also author of The New Class Conflict, The City: A Global History, and The Next Hundred Million: America in 2050. He lives in Orange County, CA.

Photo: JD Lasica from Pleasanton, CA, US [CC BY 2.0], via Wikimedia Commons

The Other Side of the Superstar Effect

$
0
0

A couple of folks had interesting counterpoints to the superstar effect. Neil Strickland gave me permission to post the following email he sent:

I wonder if you’ve read, or if I’ve referred to, the Santa Fe Institute’s highly cited 2007 paper in PNAS (Proceedings of the National Academy of Sciences) called “Growth, Innovation, Scaling, and the pace of life in cities.” Its work was in “deriving growth equations which quantify the dramatic difference between growth fueled by innovation versus that driven by economies of scale. This difference suggests that, as population grows, major innovation cycles must be generated at a continually accelerating rate to sustain growth and avoid stagnation or collapse.”

For my MSc thesis in England last year I took that to mean that the agglomeration economies arms race favoring superstar cities is actually more of a doomsday clock. Right now a hardline national policy diverting some amount of economic heat out of the six big winners (Seattle, SFO, LAX, BOS, NYC, DC) might even be favored by middle and lower class victims of the housing market in those six regions — who, at the prevailing longtime low rate of wage growth, have much more to fear from property speculation than they have to lose in the margin of local job growth, for their future career prospects there should such policy take effect.

In the long run, meanwhile, the lower threshold of innovative critical mass will rise at a pace set by competitor regions like JJJ, Keihanshin, and the PRD, who boast an order of magnitude greater population and labor shed connection than the Northeast Corridor can offer. This means that even our winners (and not necessarily just the smaller ones like Boston or Seattle) will sooner or later not be able to “avoid stagnation or collapse” when global capital flows can find better productivity acceleration in Hangzhou or Shanghai. Better to build a rich ecosystem of more small baskets all across America rather than go for the global sweepstakes in ever fewer baskets, kill the feeder ecosystem, and virtually guarantee low resilience.

The interstate banking laws prior to the 1980s meant that with financial institutions making decisions locally, there were going to be some sources of capital interested in investing in Greensboro NC during economic troughs or retrenchments even when higher returns might be on offer elsewhere — which gave Greensboro a chance, at least, to recharge and start new cycles of local innovation. Whereas, if capital flows anymore chase the efficient boom areas at a given moment, that doesn’t actually result in the best total system outcome (not only for feeder cities like Indianapolis). Certainly not if a modicum of stability or trust continuity is something that matters where human families live. This kind of race away from patient cultivation toward high speed trading (in the broadest sense) would need to get wound down at the same time as policies to diminish labor market rent seeking by the superstar Six.

And in another post commenter David wrote:

I was born in Manhattan and still live a stone’s throw from NYC. There is a unique talent stack in NY, but I fear you bought into the myth that elite talent is propelling these change rather than being its beneficiary. Now Aaron that you are a New Yorker I suggest you find time to read Bonfire of the Vanities by Tom Wolfe.

This is a quote from the novel is from when NYC first caught fire in the early 1980s:

As Lopwitz put it, “The bond market has been going down ever since the Battle of Midway.” The Battle of Midway (Sherman had to look it up) was in the Second World War. The Pierce & Pierce bond department had consisted of only twenty souls, twenty rather dull souls known as the Bond Bores. The less promising members of the firm were steered into bonds, where they could do no harm. Sherman resisted the thought that it had been even thus when he entered the bond department. Well, there was no more talk about Bond Bores these days … Oh no! Not at all! The bond market had caught fire, and experienced salesmen such as himself were all at once much in demand. All of a sudden, in investment houses all over Wall Street, the erstwhile Bond Bores were making so much money they took to congregating after work in a bar on Hanover Square called Harry’s, to tell war stories . . . and assure one another this wasn’t dumb luck but, rather, a surge of collective talent. Bonds now represented four-fifths of Pierce & Pierce’s business, and the young hotshots, the Yalies, Harvards, and Stanfords, were desperate to get to the bond trading room of Pierce & Pierce.

What is happening in America is that Globalization is doing to America what it did to the smaller Western European Economies in the late 20th Century. In the case of America the best analogy is Great Britain. In the first part of the 20th Century the UK had an extremely well rounded economy. However, in my lifetime the only thing the world markets really wants from the UK are FIRE products from the City of London and North Sea Oil. Since these profitable goods dictate the exchange rate of the British pound, all other private sectors of the economy have essentially been malpriced and have withered.

Although the basket of goods is slightly different (including Aerospace and Technology) the same thing is happening here. Why did this happen in America so much later than in Europe? Because as late as 1980 85% of all commerce in the United States was domestic and thus exchange rates and cheap foreign labor did not really dictate the health of the US economy outside certain sectors. Now that American commerce has internationalized we are suffering the same fate as the UK.

Like in the quote above, New York is simply in a bunch of businesses that have continued to catch fire; and the collective talent has now convinced themselves they are in fact bunch of geniuses.

There’s definitely something to that. Just as Detroit boomed during the autos supercycle, the Bay Area is thriving with tech and will no doubt have to adjust when that inevitably ends at some point.

Nevertheless, it’s very clear the talent is higher caliber in NYC. I see it in the people I interact with. Beyond raw horsepower, the other side of the “talent” equation is access to the networks people have by virtue of their backgrounds and schooling at elite institutions. That may be unearned privilege in a sense, but it nevertheless exists.

The warning is definitely worth considering though. It’s not guaranteed that New York won’t go back serious decline at some point. As my wife likes to point out, New York will have to “save Central Park” yet again sometime in the future. But for now the superstar trend holds.

This piece originally appeared on Urbanophile.

Aaron M. Renn is a senior fellow at the Manhattan Institute, a contributing editor of City Journal, and an economic development columnist for Governing magazine. He focuses on ways to help America’s cities thrive in an ever more complex, competitive, globalized, and diverse twenty-first century. During Renn’s 15-year career in management and technology consulting, he was a partner at Accenture and held several technology strategy roles and directed multimillion-dollar global technology implementations. He has contributed to The Guardian, Forbes.com, and numerous other publications. Renn holds a B.S. from Indiana University, where he coauthored an early social-networking platform in 1991.

Improved Middle-Income Estimates by Pew Research, But More Improvements Needed

$
0
0

There are few issues, if any, more important than income and poverty. The most successful political jurisdictions, where national or sub national, are characterized by rising incomes and falling rates of poverty. A large and growing middle-class is key to that. But measuring the size and trend of the middle-class is easier said than done. There is considerable concern about the threat to the middle-class, which is most evident in the high cost California markets (See: California Feudalism: The Squeeze on the Middle-Class).

For years, Pew Research has been a leader in providing estimates of the size and trends relating to the middle class. More recently, Pew has incorporated cost of living adjustments into its analysis. Consistent with the familiar narrative, the middle-class is shrinking, having dropped from 54 percent of the population in 2001 to 52 percent in 2016. But this is not all bad. One-half of the households have moved up to higher income status, while one-half have moved down, to low income status (Figure 1). Overall, 71% of households had middle and higher incomes in 2016, according to Pew.

This article analyses the latest Pew Research data for 2016, focusing on the 53 major metropolitan areas (those with over one million population).

Major Metropolitan areas

Pew provides data for 260 metropolitan areas, adjusting for both households size and the cost of living, as estimated in the Bureau of Economic Analysis Regional Price Parities (BEA RPPs). The data is available here.

Pew’s definition of the middle-class is as follows:

“Middle-income” Americans are adults whose annual household income is two-thirds to double the national median, after incomes have been adjusted for household size. In 2016, the national middle-income range was about $45,200 to $135,600 annually for a household of three (incomes in 2016 dollars). The same standard is used to determine the status of households in all metropolitan areas after their incomes have been adjusted for the cost of living in the area.

The Pew standard considers household incomes in each metropolitan area based upon the national median and income distribution.

Major Metropolitan Areas with the Largest Middle-Income Share

Among the nation’s 53 major metropolitan areas (over 1,000,000 population), the Twin Cities metropolitan area of Minneapolis-St. Paul has the largest share of households with middle and higher incomes (80.9%), and as a result, the lowest share of lower-income households (Figure 2). Washington, DC-VA-MD-WV ranks second, at 80.4%. Hartford and Boston both score above 79%. Hartford has been cited as the most affluent metropolitan area in the world in 2012 and third most affluent in 2015. Boston ranked fifth most affluent in the world in 2015.

The balance of the top ten is rounded out by seven metropolitan areas with at least 78% of their households at or above middle-income level, Baltimore, Seattle, Austin, Grand Rapids, Denver and Kansas City. Baltimore is well within the economic orbit of Washington, being inside the federal city’s combined statistical area. Austin is a predictable entry, given its strong information technology industry and its cost of living that at 100.0, matches the national average, according to the BEA RPPs. Grand Rapids may be surprising, but it is among a growing number of Midwestern metropolitan areas where low costs of living portend a bright future for middle-income growth. These include 10th ranking Kansas City, 11th ranking St. Louis and 13th ranking Cincinnati with improving economic performance.

Richmond ranks 12th, San Jose is in a 13th place tie with Cincinnati and Portland (Oregon) ranks 15th. San Jose is particularly noteworthy, as its highest median household income is substantially discounted by its highest cost of living, the result of its astronomical house prices. Even so, San Jose has the largest upper income segment in the nation, so large that it reduces San Jose’s middle class to the smallest among the major metropolitan areas. Similarly high income San Francisco, located in the same combined statistical area as San Jose, ranks a lower 18th in the share of its middle and higher income households.

Major Metropolitan Areas with the Smallest Middle-Income Share

Miami, ranked 53rd, has the lowest share of households with middle or higher incomes, at 61.8%, nearly a quarter below leader Minneapolis-St. Paul’s 80.9%. Riverside-San Bernardino and Los Angeles, in the same combined statistical area, rank 52nd and 51st respectively in the share of households that have middle or higher income. Each of these three metropolitan areas has a high cost of living, driven by their much higher than average housing costs.

Tucson and Orlando have the fourth and fifth smallest number of households with middle and higher incomes. The second five includes New Orleans, New York, Tampa-St. Petersburg, San Diego and Houston. Among the 10 with the lowest middle and higher income share, all but four have foreign born population shares exceeding 20%, including Miami, Riverside-San Bernardino, Los Angeles, New York, San Diego and Houston.

Middle and Higher Income Household Shares by Size of Metropolitan Area

Among the major metropolitan areas, the largest middle and higher income shares of the population are those with the smallest population. In metropolitan areas with from 1.0 to 2.5 million population, 75% of the households have middle or higher incomes, while 25% have lower incomes. The next higher category, from 2.5 to 5.0 million population, have 74% of their households with middle or higher incomes and 26% with lower incomes. Among the metropolitan areas with from 5.0 to 10,0 million, the more affluent share falls to under 73% and the lower income share exceeds 27%.

Things are much different in the megacities (over 10 million), In these two metropolitan areas, New York and Los Angeles, the lower income share rises to nearly 34%, leaving little more than 66% for the middle and lower income share. This is more than an 11% smaller middle and upper income share than in the smallest major metropolitan areas, and 9% smaller than in the middle two population categories (Figure 4). The two metropolitan areas that constitute this most populous category, New York and Los Angeles have very high costs of living, which discounts their nominally higher incomes significantly in purchasing power.

Middle and Higher Income Household Shares and Housing Affordability

There is a strong positive relationship between a larger middle and upper income share of the population and better housing affordability (Figure 5). This is consistent with a growing body of economic research that has found an association between higher housing costs and lower economic growth (Note). The “Affordable” markets, as rated in the 13th Annual Demographia International Housing Affordability Survey had a middle and upper income share of households of 75.8%, 3.4 percentage points higher than the “severely unaffordable” markets. This is the equivalent of 3.1 million residents based on the population of the “severely unaffordable” markets.

An Important Step Forward

Adjustment for the cost of living greatly increases estimates of the extent of middle and upper income households. The cities with larger middle and upper income percentages offer much broader opportunity, which arises from the interplay of many factors, such as metropolitan markets and public policy, whether federal, state, regional and local within the metropolitan area. Even so, further refinements are needed:

1) The effect of federal, state and local taxation needs to be included. Including these taxes would more accurately reflect the higher cost of living of metropolitan areas in high-taxed states, such as California, New York, New Jersey Minnesota and Oregon:

2) The costs of owner occupied housing needs to be included. By their exclusion of owned housing costs, the BEA RPPs (on which Pew Research appropriately relies), overstate the number of middle-income and higher-income households in the metropolitan areas of states with the highest housing costs, especially Calfornia.. This is illustrated by the C2ER cost of living index, which has been widely used for decades and includes the cost of owned housing. For example, the C2ER cost of living for San Diego is a quarter higher than the BEA RPPs.

Nonetheless the new Pew Research data is a monumental step forward in comparing how well people live in American cities. Despite this important contribution, there is a continuing need to more accurately define households by income classification.

Note: For example, Chang-Tai Hseih of the University of Illinois, Chicago and Enrico Moretti of the University of California, Berkeley traced a nearly 10% annual loss in U.S. national output by 2009 from the expansion of housing regulation and the attendent upward impact on house prices from the mid-1960s. Kyle Herkenhoff of the University of Minnesota, Edward Ohanian of U.C.L.A. and Lee Prescott of Arizona State University estimate that if California’s land use regulatory structure were returned to the more market oriented situation of 1980, it “would increase national output, productivity “by about 1.5%.” Matthew Rognlie, now of Northwestern University, found that the widening inequality gap found by French economist Thomas Piketty was largely due to housing and suggested re-examining land-use regulation.

Wendell Cox is principal of Demographia, an international public policy and demographics firm. He is a Senior Fellow of the Center for Opportunity Urbanism (US), Senior Fellow for Housing Affordability and Municipal Policy for the Frontier Centre for Public Policy (Canada), and a member of the Board of Advisors of the Center for Demographics and Policy at Chapman University (California). He is co-author of the "Demographia International Housing Affordability Survey" and author of "Demographia World Urban Areas" and "War on the Dream: How Anti-Sprawl Policy Threatens the Quality of Life." He was appointed to three terms on the Los Angeles County Transportation Commission, where he served with the leading city and county leadership as the only non-elected member. He served as a visiting professor at the Conservatoire National des Arts et Metiers, a national university in Paris.

Photograph: Minneapolis-St. Paul (with the largest middle & upper income household share), suburbs and Interstate 494 Ring Road (by author).

Resolving California's Housing and Homeless Crisis

$
0
0

On any given night in California, there are about 134,278 people without a home. California, with 12 percent of the U.S. population, has 25 percent of the nation’s homeless people. California’s homeless population increased 13.7 percent between 2016 and 2017. About 36 percent of the homeless population are families with children. About 25 percent of the homeless population have jobs.

The homeless population is defined as “individuals who lack a fixed, regular, and adequate nighttime residence.”

Homelessness increased 20 percent in San Francisco, and grew14 percent in Los Angeles, but decreased 13 percent nationally, from 2009 to 2016.

Four of the top ten U.S. cities with the largest homeless populations are in California: Los Angeles, San Diego, San Jose/Santa Clara, and San Francisco. The major cause of homelessness in these cities is the lack of affordable housing – as housing costs increase faster than incomes.

West Coast cities tend to lack right-to-shelter laws, and therefore are not required to provide beds for homeless people. Instead, these cities have homeless tent encampments. For example, 25 percent of Los Angeles City/County’s 55,188 homeless people were unsheltered in 2017. In contrast, only 5 percent of New York City’s 76,501 homeless people were unsheltered.

Unsheltered homelessness increased 48 percent in San Francisco, and grew 35 percent in Los Angeles, but decreased 23 percent nationally, from 2009 to 2016. In California, 68 percent of the homeless population was unsheltered in 2017. California accounted for 49 percent of all unsheltered people in the U.S.

Housing Affordability

The primary cause of homelessness is the lack of affordable housing, according to city officials surveyed by the U.S. Conference of Mayors.

A home is deemed affordable if rent or house payments are 30 percent or less of a household’s gross income.

Only 26 percent of California households earning the statewide median income could afford to buy the median-priced single-family home in the state, in the second quarter of 2018, a 10-year low, and down from 29 percent a year earlier. In the San Francisco Bay Area – 18 percent could afford the median-priced home, and in the Los Angeles Metro Area – 29 percent. The national average was 53 percent.

Overall, California homeowners spent an average of 21.9 percent of their household income on housing costs, the 49th worst in the nation in 2016, while renters spent 32.8 percent, the 48th worst.

There is a direct relationship between the reduced availability of low-cost housing and the increased number of homeless people. The lack of affordable homes to buy increases the demand for rental units, which raises rents, and forces more people at the lowest economic level into homelessness. Extremely low-income renters increasingly face unaffordable housing costs, overcrowding, squalor, and homelessness.

“Our results suggest that simple economic principles governing the availability and pricing of housing and the growth in demand for the lowest quality housing explain a large portion of the variation in homelessness among US metropolitan housing markets. Furthermore, rather modest improvements in the affordability of rental housing or its availability can substantially reduce the incidence of homelessness in the US…Homelessness can be reduced by attention to the better functioning of housing markets,” wrote University of California, Berkeley professors John M. Quigley and Steven Raphael in a 2001 report.

“We now know that there is a very close connection between housing costs and homelessness,” said Margot Kushel, director of the University of California San Francisco Center for Vulnerable Populations. California has only 22 affordable, available rental homes for every 100 extremely low-income households, creating a shortfall of 1.5 million rental units. “That probably describes more than any other reason why we have a homelessness crisis in California.”

In Los Angeles County, there are 600,000 low-income residents who spend 90 percent or more of their income on housing. Santa Clara County has a similar rate. “These are areas where housing is expensive and incomes are polarized, and people at the bottom of the income distribution are having a really tough time keeping a roof over their heads,” said Daniel Flaming, president of the Economic Roundtable. “And if a shoe drops, if someone gets sick or someone loses a job or if someone leaves the household that’s contributing to paying rent, then that family can easily find itself on the street.”

Southern California has become one of the top areas in the nation for homelessness, as expensive housing and unaffordable rent have driven many people into shelters and onto the streets. In Los Angeles, 61 percent of the population were renters in 2016. From 2011 to 2017, the median rent for a one-bedroom apartment in Los Angeles County increased 67 percent, from $1,200 to $2,000, while average incomes stagnated, and the homeless population grew 75 percent. A rent hike of 5 percent boosts the number of homeless people by 2,000 in Los Angeles, according to Zillow.

Fifty-four percent of California renters spent more than 30 percent of their income on rent in 2016. Paying more than 30 percent of income on housing can make it hard to afford basics like food, clothing, transportation, and health care.

Twenty-nine percent of California renters spent more than 50 percent of their income on rent in 2016. Rent payments of over 50 percent of income represent a severe housing cost burden. Severe-housing-cost-burdened renter households increased 30 percent in California, compared to a 21 percent increase nationally, from 2007 to 2016.

Factoring in housing costs, California’s poverty rate is the highest in the nation. Persons living in poverty are most at risk of becoming homeless.

Increased Demand

California is at full employment, increasing the demand for housing.

The share of households renting in California’s eight largest cities rose from 52 percent in 2006 to 57 percent in 2016, as homeowners went back into the rental market as a result of the subprime-mortgage crisis.

Reduced Affordable Housing Supply

In the gentrification of neighborhoods, high-end, higher-cost housing replaces deteriorated, affordable housing. Property values and rents in the neighborhood increase. The neighborhood’s low-income residents, who cannot afford higher-cost housing, are displaced by higher-income residents. The process of gentrification reduces the supply of affordable housing.

A 1983 study of five cities (Boston, Cincinnati, Richmond, Seattle, and Denver) found that 23 percent of residents in gentrifying urban neighborhoods were displaced due to eviction, increased rent, or the sale of the house they were renting, from 1978 to 1980.

Nationally, there has been a failure to replace single-room occupancy (SRO) housing lost to conversion, gentrification, and urban renewal. From 1970 to 1985, 1 million SRO units – half the national total – were lost to conversion or demolition.

Constraints on Housing Production

As a result of California’s Progressive land use policies, homebuilding cannot keep up with demand, creating a shortage of homes, which drives prices and rents higher, to the point of being unaffordable, thereby increasing homelessness.

California’s development approval processes have become burdensome, causing the number of new housing units built to lag behind the state’s population growth. For every 2.8 California jobs created in 2018, only one new housing unit is being constructed.

Zoning restrictions and opposition by NIMBYs hinder housing development.

Solutions

“Considerable evidence suggests that construction of market-rate housing reduces housing costs for low-income households,” writes the California Legislative Analyst’s Office.

The solution to California’s homeless crisis is to build more homes and apartments. The solution to affordable housing is to encourage additional private, market-rate housing construction.

Housing vouchers and Housing First programs are effective, but only if there are homes available.

In order to build more homes, California needs to reduce its over-regulation, to make it easier to build. For example: speed up the permitting process by streamlining development reviews. Reduce mandates and related construction costs. Ensure that a sufficient supply of land is zoned to meet a community’s housing needs, including single-family homes, condominiums, townhomes, and apartments. Development impact fees, the costs of which are passed along to homebuyers, must pay only for the actual costs of providing services and infrastructure for the project.

Californians need to make it a priority for people – rich or poor – to have a home.

Bruce Colbert, AICP is executive director at Property Owners Association of Riverside County. He can be contacted at (949) 689-4480 or bcolbert@poarc.com.

Photo: Grendelkhan [CC BY-SA 4.0], from Wikimedia Commons

Cars and Urban Mobility

$
0
0

Schlomo ‘Solly’ Angel is a world renowned urbanist and author of countless books including “Atlas of Urban Expansion”, “Planet of Cities” and “Tale of Scale.” He is adjunct professor at New York University (NYU) and senior research scholar at the NYU Stern Urbanization Project, where he leads the Urban Expansion initiative. He has advised the United Nations, the World Bank, and the Inter-American Development Bank (IDB).

So when Solly Angel observes that across the United States that “the great majority of workplaces (are) now dispersed outside CBDs, employment sub-centers or live-work communities, and (are) beyond walking or biking distance” he is saying so as a well-informed global expert.

He goes on to conclude that as a result “increasing the productivity of American cities requires a sustained focus on meeting the travel demands of the great majority of commuters rather than on improving mobility at large or on transportation strategies focused on CBDs, employment sub-centers, or live-work communities.”

Essentially, the point he is making is that few cities observe the deterministic overlays imposed by urban planners for the sake of convenient analysis. The monocentric model (a high density CBD to which a majority of workers commute from outlying dormitory areas) he claims almost never exists in reality (although oddly, this model describes widely held prejudices about our own urban form).

The poly-centric model (with multiple centres) is he says equally more often described in theory than in practice. There are various other urban models, including what he calls “the maximum disorder model” (which I love the sound of) but the one that he argues best describes the majority of US cities is the “constrained dispersal model” where “the great majority of jobs are dispersed throughout the metropolitan area and where workers and workplaces in a metropolitan-wide labor market adjust their locations to be within an tolerable commute range of each other.” Makes sense, hey?

In a nutshell, because we live and work in largely randomized locations across cities, a focus on urban productivity needs to acknowledge this reality and try to create transport systems that cater for the majority of commuters, not just a proportion who can be serviced by public transport in high density cores. In his words:

While we do not have to accept this state of affairs as “the best of all possible worlds”, as Voltaire’s Candide would have it, we do have to acknowledge it and to understand that the future of our cities is path dependent: the cities of the future will be variations on the cities of today and, barring catastrophes and calamities of one kind or another, any changes in their spatial structure and their built form are likely to be gradual and marginal, building upon their existing spatial structure. The same observation also applies to commuting patterns: most commuting patterns are quite likely to be between dispersed residences and dispersed workplaces for a long time to come.”

In Australia, much like the USA, CBDs do not dominate as metro wide employment hubs (as they might in a hypothetical mono-centric model). They are significant but not dominant. In some cases, their significance is eroding – not because they are shrinking, but because the suburban economy is growing faster. In Sydney and Melbourne for example, inner city jobs (being the CBD plus surrounds, described as the SA3 by the ABS) represent 22% and 21% of metro wide jobs respectively. In Brisbane the figure is lower – with the inner city representing 14% of regional jobs. Interestingly, while Brisbane’s inner city added 12,802 jobs (full and part time and casual) in the 2011-2016 period (growing by 7%) the Greater Brisbane region added nine times that number at 112,517 jobs in the same period, growing faster at 12%.

Much like the USA, our major cities mostly fit Solly’s “constrained dispersal” model. Plus, with the two fastest growing future industries being health and education, that pattern of dispersal is likely to increase over time. So to ensure our cities remain economically productive, urban transport policy should ideally support the efficient movement of the greater majority of people from home to work and during work. Cycling, walking, and traditional modes of public transport are suitable for some of the working population, but nowhere near a majority. For the majority of workers, the rational transit solution is the car.

Which makes the relentless public policy and media assault on the private car a strange thing. For the majority of workers in dispersed urban locations, it offers door to door convenience, it is on demand (ready when they are), it is comfortable (and often air conditioned), and generally quite affordable. As a transport choice, it also generates substantial government revenues via taxes (fuel excise, registration fees, etc) compared with public transport which consumes a great deal more in subsidies than it generates via the fare box.

We have fallen into a habit of blaming congestion on the car but we also need to accept that more people (a bigger population) trying to get around on the same road space is - mathematically and inevitably - going to mean more congestion. Public transport has an important role to play but its ability to “solve” congestion has been oversold. Unless worldwide patterns of employment dispersal are suddenly and radically reversed and the monocentric urban model materializes overnight, PT will forever be limited by its convenience for the minority of urban workers with jobs in urban cores or high density suburban centres. Outside this, the 80% of the remaining urban workforce will continue to use cars as a rational and affordable choice. (Additionally, intra urban freight will continue to be totally reliant on private delivery vehicles using the road space).

The horizon for the private car is also not bleak, as some might suggest. Advances in driverless technology, car sharing and other innovations in urban mobility that revolve around better ways to make use of private vehicles (which for many sit idle 20 out of 24 hours) are worthy of exploration, but receive little public policy attention (or investment). So far anyway.

Addressing urban congestion therefore should require a balanced policy which accepts the critical role played by private transport and the road network, along with the critical role played by public transport. Demonising the car, or suggesting that it can be largely replaced by walking or cycling or PT for a majority of the population, is delusional given the spatial reality of our urban economies. If this thinking finds its way into public policy practice, it goes from delusional to dangerous.

You can read Solly Angel’s work on Commuting and the Spatial Structure of American Cities, via the link below.
http://marroninstitute.nyu.edu/uploads/content/Commuting_and_the_Spatial...

This piece originally appeared on The Pulse.

Ross Elliott has more than twenty years experience in property and public policy. His past roles have included stints in urban economics, national and state roles with the Property Council, and in destination marketing. He has written extensively on a range of public policy issues centering around urban issues, and continues to maintain his recreational interest in public policy through ongoing contributions such as this or via his monthly blog, The Pulse.

Jeff Bezos Is Right at Home in the D.C. Swamp, but Amazon Might Have Bit Off More Than It Can Chew with the Big Apple

$
0
0

It turns out that tech oligarchs aren’t much better than old dogs at learning new tricks. By splitting his much coveted supposed second headquarters between New York City and greater Washington D.C., Amazon’s Jeff Bezos is repeating what worked for him in Seattle while saying “yes, sir” to power.

Technology firms were once seen as outsiders, mostly located far from the traditional East Coast power centers. Now, as they gradually take control of every industry once coveted by the old establishment—media, finance and retail—firms like Amazon are handing out consolation prices to their new subjects.

The move to Washington amplifies the already clear message that Bezos, passionately against the Trumpian draining of the Washington “swamp,” wants to be a big player there, operating from the 27,000 square foot mansion—the biggest house in Washington—he paid $23 million to buy and another $12 million to renovate. He already controls the dominant local mouthpiece, the Washington Post (which broke the “news” that he was the “anonymous buyer” of the former Textile Museum he’s made into a one-family house), and has located his key profit-making enterprise, cloud services, in part in a new campus in suburban Fairfax. And Amazon already owns one of the largest lobbying operations in Washington.

I worked with Richard Florida on Kansas City’s bid for HQ2. We made a case, as finalists Indianapolis, Dallas-Ft. Worth and Columbus could make as well, that Amazon’s white-collar workforce, half of whom make under $100,000 annually, could thrive best in less expensive, family-friendly and lower-tax locales. After all, one apparent motivation for opening a second headquarters—if that wasn’t a contradiction before the decision to split it between New York and Virginia—was the high housing prices in Seattle, which weren’t an issue when Bezos launched Amazon in 1994.

If Amazon had moved to a heartland city, Bezos would have made a statement not only to his employees but to the middle of the country, where the tech industry is often seen as another enforcer of the progressive groupthink. Instead, he genuflected to the preferred locations and conventional wisdom of the overclass.

Both Rich and I suspected that that the headquarters could end up in the DC area, close to Bezos’ big home, the Post and the bipartisan misfits who make up our governing class in both pathetic parties. Trump may well be gone, like the Republican House majority, but Bezos will be there for the long term, the unelected lord of a capital that, if it believes in anything, worships the toxic brew of power and money.

So Amazon has reasons, however venal, to favor greater Washington. The move to Long Island City, Queens, a former industrial area turned into a hot new residential satellite of Manhattan, is less understandable, and could prove more problematic. Unlike Washington, New York is vastly overrated—it helps to have media yappers close by—as a tech center, particularly outside of finance.

Overall, the New York region’s percentage of people working in math and computers was actually below the national average as of 2017, and growing at one of the lowest rates in the country. Let’s stipulate, it’s no Silicon Valley or even Austin or Raleigh. Over the last two years, the urban leader in STEM (science, technology, engineering, and mathematics) job growth was Orlando, at 8 percent, or three times the national average, while places like Charlotte, Grand Rapids, Salt Lake City and Tampa all grew a faster clip than New York, which is a player, like Los Angeles, largely by dint of size.

As for the “talent” already in New York, millennials and others have in fact been leaving the city at a faster clip in recent years as costs have soared. Many industries, notably finance, are moving jobs to less expensive locales. Last year Brooklyn, the epicenter of the urban gentrification, lost population, as young people look for more affordable places to live and older ones flee cold weather and high taxes. Due in large part to foreign investment and continued strong immigration, New York already has among the most exorbitant housing prices in the country and after Amazon’s announcement speculators—the prototypical New York opportunists—immediately focused on the Queens neighborhood which the tech giant plans to occupy and where rents and housing prices are sure to shoot up.

This parallels the Seattle experience, where the median home price of $739,600 and median rent of $2,479 now make it now the third-most expensive—and second-most competitive—housing market in the country.

“The hardest thing is to unlearn the secrets of your past success,” the Japanese analyst Jiro Tokuyama used to tell me as he predicted Japan’s decline when many American pundits predicted the island nation would eclipse America. Although Amazon may maintain its dominance, it will likely find the new realities it has helped to create less comforting. Bezos started Amazon in the late 1990s, when Seattle prices were low, but the presence of Microsoft and Boeing guaranteed the presence of a talented workforce. Washington state has other advantages, such as no state income tax.

Now, Amazon is putting half of its HQ2 next to the country’s biggest public housing development. Given that poor New Yorkers already have trouble affording rents, this can’t be good news for them. Few high school graduates, let alone dropouts, will land jobs in the HQ. Their role at Amazon is to work in warehouses in unfashionable locales, where they generally are underpaid, need food stamps to survive, and are forced to work under poor conditions. Amazon’s managers—the masters of the sweatshop of the future—have workers wear wristbands so that they can be monitored at every moment.

And Amazon is coming to what’s already a very expensive place, and, like much of the country, is enjoying near full employment. There won’t be a honeymoon for workers; they will have to compete for brutally expensive market-rate apartments. New York’s political class—furious at being cut out of the deal the mayor and governor cut to bring Amazon here—will unleash a torrent of demands on the new player in town.

Ironically, this has already happened to Amazon in Seattle, where Amazon is totally dominant, and was a big reason for the decision to seek a second headquarters. The once proudly middle-class northwestern city now seems to be another San Francisco in the making, attracting not just the hip and educated, but a huge homeless population. Diversity? Both cities are losing African-Americans and are becoming increasingly segmented between an affluent overclass, hipster short-termers and a burgeoning underclass. Seattle, once relatively cheap, has become more and more expensive, with some of the nation’s highest rents; already, 45 percent of local millennials say they’re considering leaving because of the high price of shelter.

It certainly is widely reviled by progressives there. Amazon was a prime target of a proposed tax on employees last year, an effort only turned back with massive lobbying.

Hey, Jeff, if you think it’s hard to deal with these folks in Seattle, wait until you get a load of New York, which is where I grew up and first experienced political life. The Gothamites are nearly as far to the left and not so easily intimidated by someone with a huge checkbook. After all, they can easily make the case that the billions—nearly $50,000 a job—in tax breaks for a company run by the world’s richest man should be more equitably shared in a city where more than one in five people lives below the poverty line.

Gotham will test Bezos’ political skills in ways he cannot even yet imagine, though he may have gotten just a hint in the furiously angry response to the Amazon announcement from local Councilman Jimmy Van Bramer all the way up to Senator Kirsten Gillibrand and Queens’ new congressional star Alexandria Ocasio-Cortez.

New York City, like cities across the country, is becoming more aware of the forces diminishing its middle class and stripping opportunity from the poor. Amazon is likely to make life for the average New Yorker worse before it even begins to get better, and New Yorkers just might return the favor.

This piece originally appeared on The Daily Beast.

Joel Kotkin is executive editor of NewGeography.com. He is the Roger Hobbs Distinguished Fellow in Urban Studies at Chapman University and executive director of the Houston-based Center for Opportunity Urbanism. His newest book is The Human City: Urbanism for the rest of us. He is also author of The New Class Conflict, The City: A Global History, and The Next Hundred Million: America in 2050. He lives in Orange County, CA.

Photo credit: Grant Miller for the George W. Bush Presidential Center, via Flickr, CC License.

Energy Storage Isn’t Ready for Wide Deployment

$
0
0

When understanding and examining energy storage for wide-scale, societal deployment that is scalable, affordable and reliable these factors need to be included: energy security, renewable power production and cyber security. At this time energy storage doesn’t meet any of these criteria. The best example is Tesla’s deployment in November 2017 throughout South Australia of a lithium-ion battery storage system. This was hailed a great success a month later by:

“Smoothing out at least two major energy outages, responding more quickly than coal-fired backups and Tesla’s battery (Hornsdale Power Reserve) last week (December 2017) kicked in, in just 0.14 seconds after one of Australia’s biggest plants, the Loy Yang facility suffered a sudden, unexplained drop in output.”

There is a major problem with this line of analysis in late 2017 and even today in Australia – if Tesla’s battery storage system is that effective – then why did the Financial Timesexclaim in late August, “Energy is at the Roots of Australia’s Political Crisis.” Countries and states that deploy energy storage systems that aren’t scalable, affordable or flexible are doomed to higher rates like Australia, Germany and Denmark, energy blackouts and higher emissions through increased use of fossil fuels; particularly, coal-fired power plants. China, which says it is the leader in green energy, is fooling world leaders and environmentalists bent towards renewable energy and energy storage products that aren’t ready for mass market.

China is building coal-fired power plants at a rapid pace while Australia – who signed the Paris Climate Agreement – exports billions a year in coal to Asia. If energy storage worked then renewable energy would work as well, since each technology complements the other. Renewables are intermittent and need energy storage capacity and/or fossil fuel backup. And at this time only fossil fuels works; energy storage isn’t available on a wide-scale basis now or in the near future for 24/7, 365 on-demand energy storage. The best response is an all-of-the-above approach that relies overwhelming on fossil fuels while working to overcome renewable energy’s intermittent issues and energy storage system’s limitations.

Other examples of failed renewable energy deployment where backup energy storage systems are unavailable are Germany and the state of Minnesota. Bloomberg reported in mid-August how Germany’s climate goals have failed by stating:

“Germany, the nation that did more than any other to unleash the modern renewable-energy industry, is likely to fall short of its goals for reducing harmful carbon-dioxide emissions even after spending over $500 billion euros by 2025 to overhaul its energy system.”

Germany is one of the top economies in the world, its engineering prowess for over a century is legendary and they have political consensus for green energy, but still they can’t blend renewable energy into emissions goals. The reason why is the intermittent nature of renewables and there isn’t an adequate energy storage system available. Even in technologically advanced Germany, which is attempting to shut down nuclear plants after the 2011 Fukushima Daiichi meltdown in Japan here’s the issues:

“Shutting down nuclear plants is leaving Germany short of generation plants that can work on the breezeless dark days in winter when wind farms and solar plants won’t provide much to the grid-and demand is at its peak.”

Additional problems occur for German renewable users and grid operators without adequate energy storage is, “the grid is so flooded with power that prices in the wholesale market sometimes drop below zero.” What’s further vexes German, EU, Chinese policymakers and the industrialized world is that Germany’s economy is more service-oriented, uses less energy and emits fewer CO2 unlike China and increasingly the US that is heavier towards manufacturing and factories for larger shares of their respective GDP’s. Emission reductions and a carbon-free society will be more difficult to attain using renewable energy without scalable, affordable and reliable energy storage systems.

The United States (US) has its own example where prices have risen without adequate energy storage that doesn’t include California, which is usually the example given for high wholesale and retail prices since energy storage isn’t available in that state either. However, Minnesota is a better example since historically Minnesota had rates 18.2% less than the national (US) average. Since 2009 Minnesota spent $10 billion on wind farms, upgraded transmission lines and the State’s renewable energy portfolio-standard, “requires utilities to generate 25-30% of electricity from renewable sources, mostly wind.” All of this was suppose to be achieved without an energy storage system in place. The results: Minnesota’s rates beginning in February 2017 are now above the national average, and they have not reduced greenhouse emissions relative to the US average, or cut pollution.

If Minnesota had not added renewable energy without energy storage in place and – instead stayed with their traditional energy mix – from 1990 to 2017 that state’s ratepayers would have saved $4.4 billion. Energy storage is the key besides the failure of intermittent renewables in each of these real-world examples.

But advocates for battery storage, smart grids and renewable energy will contend that the technology is available, scalable, affordable and offers grid-flexibility. However, “Commercial large-scale batteries available today are rated to deliver stored electricity for only two hours or ten hours duration.” Energy storage technology – in the near or long-term future isn’t feasible – and no one can say if or when it will be available though citizenry, governments and private industry keep insisting on renewable energy and a carbon-free society.

The US Department of Energy’s (DOE) Quadrennial Energy Review (QER) Part 1 (2015) that was completed under the Obama administration and definitively states what energy storage needs moving forward:

“Establish a framework and strategy for storage and flexibility: Energy storage is a key functionality that can provide flexibility, but there is little information on benefits and costs of storage deployment at the state and regional levels, and there is no broadly accepted framework for evaluation of benefits below the bulk system level.”

Any type of local, county, state, nation-state or international approach to energy storage systems will require a strategy and technology that includes flexibility, commonly accepted planning methods, on-demand consumer use, national and international connected transmission lines and be able to handle the variable, intermittent nature of renewable generation. Part 2 of the DOE’s, QER in 2017 also factored in that energy storage systems will need to handle increased cyber-security concerns and grid modernization for energy storage to be a factor in renewable energy and carbon-free society becoming a reality.

Todd Royal is a committee member for the California energy and electrical committee for the American Society of Civil Engineer; and an energy consultant focusing on the geopolitics of energy directly related to foreign policy, national security and domestic exploration and production based in Los Angeles. He can be reached via Twitter @TCR_Consulting.

Photo credit: Hornsdale Power Reserve


The Suburbs and the GOP

$
0
0

In this year’s elections, particularly in California, the suburbs spoke, and essentially destroyed Donald Trump and the Republican Party. In affluent suburban districts once controlled by the GOP – outside Houston, Dallas, Atlanta, Seattle, Kansas City, Philadelphia and Orange County — long held GOP seats have flipped and may prove unlikely go back to the GOP unless Democrats alienate their new constituents.

Fundamentally this year suburbia, which leaned somewhat to Trump in 2016, turned decisively to the Democrats. In 2016 the suburbs voted 50 to 45 for Trump; this year the suburban electorate tilted blue, going Democratic by 52 percent. The reasons for this shift are manifold but the biggest cause boils down to two words: Donald Trump. The megalomaniac New Yorker may have persuaded enough suburban voters to back him last time, but his erratic personality, misogynistic past and perceived hostility to immigrants cost his fellow Republicans dearly. They could also cause numerous “purple states” like Florida to flip.

With this election, the suburbs, home to the majority of all voters and over 80 percent of the residents of major metropolitan areas, have established themselves as the ultimate arbiters of political success. This contrasts with the situation in 2016 when American politics were shaped by vastly different visions promoted by rural residents and urbanites; Trump won roughly two-thirds of the rural vote while Clinton won almost Soviet-like support in core urban areas like San Francisco, New York and Los Angeles.

Is there a suburban politics?

Unlike core cities, suburbs are family-centric — the 8 percent of core residents with children 6 to 17 is barely one third the rate for suburbs and exurbs. They tend to be deeply concerned with issues such as education, public safety and broad-based economic growth. Traditionally this has worked for moderate Republicans outside the super-affluent inner suburbs such as around Silicon Valley.

But Trump’s behavior has proven a hard sell to suburban parents, who do not want their children to model themselves on a crude, venal and morally reprobate chief executive. His nativist flirtations also seem to have hurt him with Asian, Latino and African-American suburbanites, who could be part of a future GOP coalition but likely not with Trump at the helm.

The challenge for the Democrats, particularly the newly elected members, is to learn how to serve middle-class families instead of kowtowing to their more leftist base of city-dwellers, who tend to be renters and childless. Suburbanites, for example, may be less interested in transit, which is losing market share, and prefer fixing roads than trying to torture motorists since this is how most suburbanites get around.

Issues that could threaten the Democratic ascendancy

From Franklin Roosevelt to Bill Clinton, Democrats historically favored the expansion of homeownership and suburban growth. But increasingly progressives — and the regions they control — seek to make the construction of middle-class housing all but illegal.

This policy does have perversely positive effects for existing coastal property owners by inflating home values, which may explain the lack of resistance to these policies. Yet there are some areas of vulnerability, notably on attempts to “disrupt” the suburban way of life.

Under President Obama, HUD Secretary Julian Castro was pushing for policies that would enforce civil rights laws against suburbs that are insufficiently diverse — even without any proof of discrimination. Earlier this year San Francisco state Sen. Scott Wiener, backed by the tech oligarchs, similarly sought to strip zoning authorities from jurisdictions in the mistaken belief that cramming more high-rise projects into an area would reduce driving or prices.

What will shape the future?

These attempts assault the very reasons — notably space and privacy — people of all ethnicities move to suburbia. Democrats need to separate themselves from notions put forward by Victoria Fierce, one of the leaders of the tech-funded YIMBY pro-density lobby, to favor relentless densification because it promotes “collectivism”. Lily Geismer, an associate professor of history at Claremont McKenna College, thinks the suburbanites also should be punished for their “hoarding” of everything from their children’s education and protecting their neighborhoods from unwanted development.

Try that approach in Marin County, west Los Angeles or the San Fernando Valley, and see how it works. Many suburbanites may be somewhat “woke” on issues of the environment, race or gender, but they also have economic and family interests.

This can be seen in the results for the badly defeated Proposition 10 rent control measure, whose opponents drilled repeatedly on the prices homeowners can charge for rentals. This may well have turned off a portion of the same voters — perhaps as many as 20 percent of the total — who then voted for Newsom and the rest of the blue team.

Yet to take advantage of potential progressive over-reach, future GOP candidates need to change their tone, separating themselves from the politics of division and bombast. They need to free their party from the tyranny of the largely rural and small-town Trumpista fringe, or they will continue to lose the suburbs, essentially a death sentence for their party.

This piece originally appeared on The Orange County Register.

Joel Kotkin is executive editor of NewGeography.com. He is the Roger Hobbs Distinguished Fellow in Urban Studies at Chapman University and executive director of the Houston-based Center for Opportunity Urbanism. His newest book is The Human City: Urbanism for the rest of us. He is also author of The New Class Conflict, The City: A Global History, and The Next Hundred Million: America in 2050. He lives in Orange County, CA.

Photo credit: Kinney [CC BY 3.0]

The View from Hudson Street—With Thoughts on Science and Orthodoxy

$
0
0

Two audacious quotes in planning literature underpin this article and substitute for an introduction:

"As in the pseudoscience of bloodletting, just so in the pseudoscience of city rebuilding and planning, years of learning and a plethora of subtle and complicated dogma have arisen on a foundation of nonsense."

And:

"Orthodox planning is much imbued with puritanical and Utopian conceptions of how people should spend their free time, and in planning, these moralisms on people's private lives are deeply confused with concepts about the workings of cities"

These forceful warnings, by Jane Jacobs , respectively, are not entirely new (careers and lives have been ruined to unorthodox views), but bear repeating: Orthodoxy, dogmas, moralisms, utopianism, and pseudoscience are the shackles of scientific pursuits. They must be identified, exposed, and expunged.

In this piece, we take Jacobs' advise seriously, "I have learned yet again [….] what folly it is to take any thing for granted without examining it sceptically," by examining the case of certain assertions that drifted unnoticed into the realm of orthodoxy.


Fig. 1. Crime Statistics for selected cities (1958)

The Los Angeles logic

After listing crime figures in 1958 for seven cities and crime types (Fig 1) that show Los Angeles leading the set by large margins, and describing the city as "[….] almost all suburban. It has virtually no districts compact enough to qualify as dense city areas," Jane Jacobs concludes:

"The reasons for Los Angeles' high crime rates are undoubtedly complex, and at least in part obscure. But of this we can be sure: thinning out a city does not insure safety from crime and fear of crime. This is one of the conclusions that can be drawn within individual cities too, where pseudosuburbs or superannuated suburbs are ideally suited to rape, muggings, beatings, hold ups and the like."

The crime statistics of 1958 Los Angeles do stand out. But the city's comparative thinness (i.e., population density) is simply implied, not tabulated. Can this single, incomplete snapshot be enough ground for linking crime rate to thinness? Moreover, while this one cross-city statistic seemingly supports this thesis, can it be automatically extended to within-city comparisons without relevant district statistics? Apparently not. Newer, comprehensive and detailed tabulations reveal a complex picture that thwarts any attempts at an explanation of the differences in rates between cities or within cities. Extracting a purported definitive correlation is at best farfetched.

Cities, Crimes in Time

Take a 27-year long murder rate tabulation, for example. Murder prevalence rates for the same seven cities traced over time (1990 to 2016) would undeniably suggest "complicated and partly obscure reasons" for the observed changes:


Fig. 2. Murder rates for seven US cities (1990 to 2016)

In 1990, unlike in 1958, the murder rate of L.A. was slightly lower than N.Y.'s, and the rates of both declined for the next 26 years, ultimately plateauing as did rates in all the cities in the set except two. St Louis' wildly fluctuating rate, which reached two dramatic peaks in 1993 and 2016, and Baltimore's erratic movement defy explanation by any single factor. The same can be said about the more or less steady decline of rates in the other five. Undoubtedly, there are many, and interacting, factors that produce such outcomes—some identifiable (e.g., policing), others obscure or, if discernible, hard to compute. Of those that could be measured, deciphering their relative impact would be a monumental research task. A snapshot at any particular year of these time series would invariably yield scant and worthless information, just as those of 1958. This obvious unfathomable complexity should restrain attempts at drawing simple conclusions, let alone causal relations.

Seven cities in 2009


Fig. 3. Crime rates of seven US cities (2009)

For example, a 2009 snapshot of the same seven cities and crime types shows a new descending order of crime rates placing New York beside Los Angeles instead of at opposite ends (as in 1958). Just as with Figure 2, so it is with this one; no credible, simple explanation can be drawn about the influence of thinning or thickening of cities from this statistical snapshot. Many factors would be at work for such shifts to occur.

Metros, Cities and Suburbs


Figure 4. Crime rates in seven metropolitan areas by City, Suburb (2008)

Drawing another picture from metropolitan crime data challenges the rushed supposition that "pseudo suburbs or superannuated suburbs are ideally suited to rape, muggings, beatings, hold ups and the like." It shows that suburbs (i.e., thinner districts) have substantially lower crime rates, ranging from one half to one fifth of their central city counterparts. This lower rate suppresses the total city rate and, at the same time, complicates the search for a simple correlation between crime and any single attribute of a metropolitan city (e.g., density, income, GDP, education etc).

Other Research

At minimum, Figure 4 portrays the suburbs as having a clear advantage in public safety. This fact is corroborated by new research. One recent study stands out for its comprehensive, detailed method, and analytical rigor. Following a multivariate analysis of several factors it concludes: "The compactness index was positively related to violent crime…." And elsewhere: "These results also are consistent with findings from previous studies showing that life expectancy is reduced by violent crime. However, this study found that this indirect effect operates in the opposite direction of the earlier two [VMT and BMI] variables. Violent crime rates were lower in sprawling counties…."

A simpler bivariate analysis of districts within a city that we published on this site earlier also shows a positive association between compactness and crime.

A View from Hudson Street

As a rule, ideas and opinions are shaped, at least to some extent, by one's physical and cultural living environment. The resident of Hudson Street, is no exception: This street becomes a recurring motif and, imperceptibly, the foundation of a perspective on city and district planning: "The stretch of Hudson Street, where I live, is each day the scene of an intricate sidewalk ballet." And: "We [its residents] are the lucky possessors of a city order that makes it relatively simple to keep the peace because there are plenty of eyes on the street." And in the same vein: "The streets of the North End of Boston are outstanding examples [of this order]. They are probably as safe as any place on earth in this respect." Probably, but also hopefully, because of the lack of any empirical evidence.

How can such reassuring, general statements be questioned without guilt? On the other hand, without evidence, what comfort does this reassurance provide? Hudson—a main street—is still functioning and features a texture of uses analogous to the 1950s, though the mix may now be different. There are also likely more people treading on its sidewalks or driving on it today. What would current crime statistics show for the district that surrounds Hudson Street? Is it safer than other N.Y. districts?


Figure 5. Crime map of the city of New York.

Of the ten districts (precincts) south of Central Park, two—North and South Manhattan—have inordinately high number of crimes followed by the 6th district, which includes Hudson Street. The remaining seven register lower rates with the 17th district (Tudor City) occupying the bottom rung; about half the 6th district's rate. Here, another complex picture emerges that disfavours the 6th district with its exemplary Hudson Street. Yet, even with this data now available, still little can be said about a simple correlation that explains its unfavourable position in this chart.

Conclusion

From one 1958 statistic about crime in selected U.S. cities, highlighting one city's high crime rate, a leap of faith was made: thinning must be, at least partly, responsible for this rate. From there, another leap ascertained that the same rule applies to suburban districts. Supported by anecdotal evidence only, this rule quickly morphed into orthodoxy (and now a moralism): Cities are "good" and suburbs are "bad" for safety, and thinning accounts for the difference. But credible science demands more than anecdotal evidence when dealing with complex phenomena.

As we saw, robust tabulations of cities, metropolitan areas, and districts within cities show the opposite. Metropolitan regions, whose central cities register high crime rates, display lower average metropolitan rates thanks to the reduced rates of their suburbs and exurbs. Thinner districts are generally safer.

Suburbs have been shown to increase driving and, consequently, a higher rate of traffic crashes. A host of other negative outcomes of city expansion have been studied and shown to prevail.

But one thing we cannot doubt—now in evidence: suburbs do provide greater safety from crime to their residents.

Sources:

1. Chapter 2 – The Death and Life of Great American Cities by Jane Jacobs
2. Murders in the US cities: https://www.americanviolence.org/map?
3. List of US cities by crime rate (2009): https://en.wikipedia.org/wiki/List_of_United_States_cities_by_crime_rate
4. Associations between Urban Sprawl and Life Expectancy in the United States. Shima Hamidi ,
Reid Ewing, Zaria Tatalovich, James B. Grace and David Berrigan
https://www.ncbi.nlm.nih.gov/pubmed/29701644

5. City and Suburban Crime Trends in Metropolitan America: Elizabeth Kneebone and Steven Raphael Analysis of FBI Uniform Crime Report and U.S. Census Bureau data from 1990 to 2008 in the cities, towns, and counties of the 100 largest U.S. metropolitan areas - https://gspp.berkeley.edu/assets/uploads/research/pdf/0526_metropolitan_...

Fanis Grammenos is the director Urban Pattern Associates in Ottawa, Ontario and the author of Remaking the City Grid: A Model for Urban and Suburban Development. Reach him by email at fanis.grammenos@gmail.com with questions or comments.

Photo Credit: BlastOButter42 at English Wikipedia [GFDL or CC BY 3.0-2.5-2.0-1.0]

Monrovia, Indiana, Idyll or Elegy?

$
0
0

Frederick Wiseman turned his documentary filmmaking lens to the Midwest in his new work Monrovia, Indiana. My review of the film is now online at City Journal. Here is an excerpt:

"Wiseman spent ten weeks filming in this small Indiana town of about 1,500 people, creating a fair and insightful portrait of a section of the rural Midwest. He shows us quotidian aspects of life in Monrovia that are likely exotic to a typical big-city documentary-film audience: corn and hog farming, locals holding court at the town diner, a mattress-sale fundraiser for the local school, a farm-equipment auction, a Lion’s Club board meeting, and more. For urban audiences, the lives of service-class workers in the groceries and restaurants of their own cities, while differing in details, are likely just as foreign as the ones shown in Monrovia.

Most brilliantly, Wiseman captures the collision between Monrovia’s past and future. He shows how Monrovia, like so much of the Midwest, is dominated by a pervasive, smothering sense of nostalgia, which goes far beyond healthy community pride. In an early scene, a schoolteacher explains the town’s storied history of sports success. Legendary UCLA basketball coach John Wooden, winner of 10 NCAA championships, was born in Hall, about five miles away. Branch McCracken, a two-time NCAA championship-winning basketball coach at Indiana University, hailed from Monrovia proper; the high school named its gym in his honor. The teacher chronicles how, in the 1920s, Indiana was one of three major basketball hubs, and recounts the many tournaments won by local teams in that era. Afterwards, as if instructing the kids in their local culture, he notes how difficult it is to change any aspect of the school’s football field, because so many families either donated or have some personal tie to it".

Click through to read the whole thing.

This piece originally appeared on Urbanophile.

Aaron M. Renn is a senior fellow at the Manhattan Institute, a contributing editor of City Journal, and an economic development columnist for Governing magazine. He focuses on ways to help America’s cities thrive in an ever more complex, competitive, globalized, and diverse twenty-first century. During Renn’s 15-year career in management and technology consulting, he was a partner at Accenture and held several technology strategy roles and directed multimillion-dollar global technology implementations. He has contributed to The Guardian, Forbes.com, and numerous other publications. Renn holds a B.S. from Indiana University, where he coauthored an early social-networking platform in 1991.

Employment Access in US Metropolitan Areas (2017)

$
0
0

Much of the US population of the United States is located in its major metropolitan areas, those with more than one million population. In 2017, the 53 major metropolitan areas had 56% of the population, and they attracted two-thirds of the population growth from 2000 (present geographical delineation). Economic research, such as by Remy Prud'homme and Chang-Woon Lee at the University of Paris as well as David Hartgen and M. Gregory Fields at the University of North Carolina, Charlotte suggests that the economic growth of metropolitan areas is enhanced by access --- the greater the number of jobs that the average worker can reach in a particular time, the better the economic performance.

Recent advances in data have made it possible to measure the effectiveness of access systems in metropolitan areas. The University of Minnesota’s Accessibility Laboratory has been a leader in developing metropolitan access measures and has recently published access metrics for autos and transit (Note 1). Data is provided for the 50 largest metropolitan areas for autos, with Memphis excluded for transit. The auto and automobile access data is based on morning peak periods.

As Figure 1 and 2 indicate, automobiles provided by far the greatest job access in every major metropolitan area. As a result, automobile access defines access in metropolitan areas. The average one-way work trip travel time in the United States is between 25 and 30 minutes. Nearly 62% of all work trips are less than 30 minutes. This article uses the University of Minnesota 30-minute access data as a standard for rating job access in the major metropolitan areas.

Metropolitan Areas with the Greatest Job Access

Overall, a median of 48.8% of jobs can be accessed within 30 minutes by the average employee in the 50 metropolitan areas surveyed by the Accessibility Observatory. Salt Lake City has the greatest access in relation to its metropolitan area jobs, at 110.7%, a number that exceeds 100% because additional jobs are accessible in adjacent metropolitan areas (see below). San Jose has the second most access, at 89.3%. Las Vegas ranks third, with 87.2 of its jobs accessible. Raleigh and Hartford round out the top five, at above 80% (Figure 3).

Caution on the Ratings: However, this is not necessarily a reflection that these metropolitan areas have the most efficient road systems. For example, adjacent metropolitan areas increase the jobs accessible to the residents of Salt Lake City, San Jose and Raleigh. The problem is that the “building blocks” (counties) used by the US Office of Management and Budget to delineate metropolitan areas are far too large to reflect actual labor markets, as indicated in commuting patterns. This is most evident in Salt Lake City, where the boundary of the Ogden metropolitan area is little more than five miles from Temple Square (downtown). The Provo metropolitan area boundary is less than 25 miles away, an easy commute. The use of census tracts as metropolitan area building blocks would result in more credible metropolitan area (labor market) boundaries (Note 2). Despite this technical point, residents are able to reach additional nearby jobs.

Metropolitan Areas with the Least Job Access

New York has the least job access within 30 minutes, at 14.4%. This is not surprising, since New York covers more land area than any other urban area in the world (Figure 4). Even so, New York’s superior roadway system permits considerably faster average work trip travel times than other high-income world metropolitan areas with larger populations and higher urban densities, Tokyo-Yokohama and Seoul.

The Impact of Traffic Congestion

The Observatory Laboratory also estimates the extent to which traffic congestion reduces job access. The number of jobs that cannot be reached due to traffic congestion are expressed in percentages, which this article refers to as the “Congestion Penalty” (Figures 5 & 6).

Transit Access

Transit access is considerably less than that of cars. In the median major metropolitan area, the average worker can access 0.9% of the jobs within 30 minutes. This is 1.8% of the jobs that can be reached by car. Autos provide 55.7 times as much access to jobs for the average employee.

For example, in New York, with by far the nation’s most comprehensive transit system, the average worker can get to 17% as many jobs by transit as by car (Figure 7). This means that the average worker can reach almost 6 times as many jobs (600%) by car as by transit. San Francisco has the second most competitive transit system, reaching 12% as many jobs as the car. Washington, Boston, Chicago, Philadelphia and Seattle have transit systems that access between 5% and 10% of the jobs that can be reached by car.

At the other end of the scale, Detroit and Raleigh have the least competitive transit, which provides access to less than one percent of the jobs accessible by car (Figure 8). In Detroit, 124 times as many jobs can be reached by car as by transit, and 112 times as many in Raleigh.

These figures are astonishing, in view of the many billions that have been spent to develop urban rail systems to attract people from cars. They have not removed even a pittance from automobile volumes.

Transit is About Downtown: In fact, the impact of transit as a substitute for automobile use is limited to the largest central business districts. Transit’s six legacy cities, the municipalities of New York, Chicago, Philadelphia, San Francisco, Boston and Washington account for 57.5% of all transit commuting destinations in the nation. And, transit commuting is becoming even more concentrated, as 81% of the increase in transit commuting in the last decade has been to destinations in these six municipalities. Most of this commuting is to the six largest downtown areas (central business districts) in the nation, which are located in these municipalities.

Improving Public Investment Decisions

For decades transit planning agencies and public officials (including when I served on the Los Angeles County Transportation Commission) have claimed that new transit rail systems can materially reduce traffic congestion. The development of access metrics should put an end to such misconceptions (Note 3).

Regional planning agencies, transportation agencies and public officials should use the access metrics to direct funding to strategies that improve 30 minute access throughout cities. That principally means attention to improving the highway system. It’s time to develop a metric for urban transportation investments to address the fundamental goal of improving access, specifically the cost per new percentage point of job access. Getting people more access is critical to strong economies and reducing poverty, and deserves an assessment based on facts, not wishful thinking or mythology.

---

Note 1: The University of Minnesota Accessibility Observatory has also produced metrics for walking, though not this year. Not surprisingly, walking provides little access to metropolitan area jobs. The previous report put walking access at about one-third of transit nationally, a negligible number of jobs compared to autos. However, walking can be important in niche markets such as neighborhoods that have hyper densities of both residences and jobs (such as Manhattan and Chicago’s River North).

Note 2: The Office of Management and Budget also delineates “combined statistical areas” (CSAs) which are larger labor markets. Salt Lake City, Ogden and Provo share a CSA. San Jose is combined with adjacent San Francisco and nearby Napa, Santa Cruz, Santa Rosa, Stockton and Vallejo. Raleigh is combined with Durham. Perhaps it would be preferable for access metrics to be based on CSA’s rather than metropolitan areas. However, counties would still be far too large as building blocks.

Note 3: It has become increasingly obvious that new urban rail systems have little impact on traffic congestion since they were introduced in the 1980s. This is principally because they do not attract drivers from cars. This concern led me to suggest development of access indicators, for both workers and employers based on a 30 minute travel time in a working paper for the Texas Governor’s Business Council and in the subsequent final report, Shaping the Competitive Advantage of Texas Metropolitan Regions.

Wendell Cox is principal of Demographia, an international public policy and demographics firm. He is a Senior Fellow of the Center for Opportunity Urbanism (US), Senior Fellow for Housing Affordability and Municipal Policy for the Frontier Centre for Public Policy (Canada), and a member of the Board of Advisors of the Center for Demographics and Policy at Chapman University (California). He is co-author of the "Demographia International Housing Affordability Survey" and author of "Demographia World Urban Areas" and "War on the Dream: How Anti-Sprawl Policy Threatens the Quality of Life." He was appointed to three terms on the Los Angeles County Transportation Commission, where he served with the leading city and county leadership as the only non-elected member. He served as a visiting professor at the Conservatoire National des Arts et Metiers, a national university in Paris.

Photograph: Interstate 110 Los Angeles (by author)

The Gig Economy, Americans and The Future

$
0
0

The rise of automation and artificial intelligence is keeping many Americans up at night, worrying about their jobs, and certainly those of their children. The World Bank predicts that 57 percent of all jobs in developed countries could be automated in the next two decades. Some studies suggest that almost half of all current jobs will be made redundant while others suggest that past technological innovation created enough new jobs to make for those lost.

And indeed, with record low unemployment, the real question, at least for now, lies in the quality of jobs, and whether people will be buying homes or starting families with their income. Nothing raises this issue more than the rise of the contingent “gig” economy, which has over 7 million members in the United States alone in 2018, a 26 percent increase compared to the previous year. Research reveals that 20 to 30 percent of the working-age populations in the United States and the EU-15, or up to 162 million individuals, engage in part-time contract work. Such part-time work has been growing rapidly, accounting for roughly 20 percent of the workforce in the U.S. and Europe and is expected to grow substantially over the next decade, notes McKinsey.

Some progressives, including Chris Lehane and David Plouffe, who managed Barack Obama’s 2008 campaign, cast the “gig” or “sharing” economy as “democratizing capitalism” by returning control of the working day to the individual. They point to opportunities the gig economy provides for people to make extra money using their cars or homes as a balm for the middle class. The image of companies like Uber and Lyft are ones of moonlighting drivers saving up for a vacation or expensive date, which does seem the ultimate win-win.

Who are the gig workers?

In principle, the gig economy provides great services — Uber and Lyft are rapidly changing urban transport in some positive ways. For those who are generally highly educated, and “share” to make a little money, the system works great. But for those who rely on such income for their livelihoods, notes Juliet B. Schor, a sociology professor at Boston College who interviewed gig workers, the picture is much grimmer and dissatisfaction far higher.

Clearly most gig workers are not doing well. One survey of workers in 75 countries found that most earned less than minimum wage, including in the United States, leading one observer to label them “the last of Marx’s oppressed proletarians.” Roughly half of California’s gig workers struggle with poverty.

The reasons for this are not hard to figure out. Gig workers lack many basic protections that full-time workers might have, for example, in enforcement of civil rights laws. Workers without representation, or even set hours, lack many of the tools needed to protect their own position; they are essentially fungible, like day laborers anywhere. Former Secretary of Labor Robert Reich has gone so far as to label the “sharing” economy as the “share-the-scraps” economy.

Some new gig workers have replaced people with regular work, such as hotel workers or taxi drivers, some of whom have been driven to despair as their ridership has declined. Many taxi and limo drivers spent their life’s savings on medallions that are now increasingly worthless; there have been at least six suicides of these drivers in New York City since Uber took command of the streets.

Is this the future of work?

Ultimately the gig economy, even as it uses the latest technology, represents something of a devolution of labor. Although widely associated as “progressive,” the arbiters of the gig economy are, perhaps unconsciously, recreating the conditions that led to the impoverishment of the peasants and mechanics — replaced by slaves — at the end of the Roman Republic, or what befell artisans whose livelihoods were destroyed in the 19th century by machines.

This is very different from the working class we have known since the 1940s, many of whom enjoyed stable working conditions, decent pensions and became homeowners. Able to work enough to perhaps pay their rent, most gig-ers may never earn enough to buy a home or start a business. In this respect these workers resemble increasingly high-tech version of serfs, free legally but locked in a system that offers little hope for upward mobility. They may tout the independence that the gig jobs give them, notes one observer, but there’s “an algorithm in control.”

And longer term, at least for many jobs, only the algorithm will survive. People may still work, at least on occasion, but hardly enough to support themselves, much less a family. This is one reason why so many high-tech executives favor a guaranteed national wage to keep the peasants away from their pitch forks.

Already, according to one poll, nearly half of Americans support up to a $2,000-a-month stipend for the unemployed or underemployed. Soon we can share a future that all but guarantees lucre beyond the wildest imagination for the handful who are on the other side of the computer interface, but leave most of us dependent on the kindness, or enlightened self-interest, of our masters.

This piece originally appeared on The Orange County Register.

Joel Kotkin is executive editor of NewGeography.com. He is the Roger Hobbs Distinguished Fellow in Urban Studies at Chapman University and executive director of the Houston-based Center for Opportunity Urbanism. His newest book is The Human City: Urbanism for the rest of us. He is also author of The New Class Conflict, The City: A Global History, and The Next Hundred Million: America in 2050. He lives in Orange County, CA.

Photo credit: Sandeepnewstyle from Wikimedia Commons

Viewing all 3789 articles
Browse latest View live


Latest Images