Quantcast
Channel: Newgeography.com - Economic, demographic, and political commentary about places
Viewing all 3788 articles
Browse latest View live

Tulsa, Oklahoma Will Pay You $10,000 to Move There

$
0
0

Tulsa is joining the parade of places that are providing economic development incentives to people who are willing to relocate there. I previously mentioned Vermont’s program and also that of a Cincinnati suburb.

I’ve been pretty critical of these. They have the whiff of desperation about them even though these places should be positioned to attract people. Tulsa in fact is growing right in line with the US average population growth rate.

I’ve never been to Tulsa so won’t comment on them specifically. I just find it curious that so many places are turning to this approach to try to lure talent.

There are so many other traditional ways to market your city to outsiders that haven’t yet been exhausted in these places. My recent paper on civic branding talks about how cities overwhelmingly try to sell themselves using generic descriptors rather than stake out a unique place in the market.

I’ve been puzzling over why this is for a long time. It’s probably multi-factoral. At some levels many of these places don’t actually want to attract outsiders because that would threaten the status quo. (Though cities going to far as to offer $10K to someone to move must mean it). It’s also the case that civic marketing is often overseen by committee and is handled by the agency responsible for, at the end of the day, booking conventions not luring residents. And also maybe that the real primary audience for this material is internal.

There are definitely a lot of places in America that face legitimate challenges and where convincing someone to move there is going to be a tough sell. But there are many other places that have all the potential in the world but don’t seem to be interested in achieving it. For those that do want it, I’m not convinced a generic financial incentive to relocate is the right answer.

This piece originally appeared on Urbanophile.

Aaron M. Renn is a senior fellow at the Manhattan Institute, a contributing editor of City Journal, and an economic development columnist for Governing magazine. He focuses on ways to help America’s cities thrive in an ever more complex, competitive, globalized, and diverse twenty-first century. During Renn’s 15-year career in management and technology consulting, he was a partner at Accenture and held several technology strategy roles and directed multimillion-dollar global technology implementations. He has contributed to The Guardian, Forbes.com, and numerous other publications. Renn holds a B.S. from Indiana University, where he coauthored an early social-networking platform in 1991.

Photo Credit: Tulsa, Oklahoma by Jordan Michael Winn


How Much Density Is Enough?

$
0
0

Portland New Urbanist Joe Cortright has rarely seen a high-density development he didn’t like. Like Marxist economists who always begin their papers by referring to quotations from Karl Marx, Cortright takes his cues from Jane Jacobs.

Most recently, he argues that the reason why most Millennials, along with most people of almost all other categories, live in suburbs is that they are forced to do so by evil zoning rules that prohibit that densities that people actually prefer. Or, as he put it, there is a “pent-up demand for more urban neighborhoods that can’t be satisfied because of zoning.”

He bases his claim on a survey of people in Atlanta and Boston asking whether they would prefer to live in a walkable neighborhood or an auto-oriented neighborhood. More people in Atlanta preferred auto-oriented neighborhoods, and 90 to 95 percent of the auto-oriented people in both cities actually lived in auto-oriented neighborhoods. However, in Atlanta, just 48 percent of people who said they preferred walkable neighborhoods were able to live in such neighborhoods, compared with 83 percent in Boston. Cortright attributes the shortfall in walkable neighborhoods to zoning.

But there is an alternate explanation that is much more likely to be true. In places like Atlanta, developers will build for the market, and they are able to easily persuade cities to alter zoning if the market demands something different from existing zoning. (Such alterations are admittedly more difficult in Boston.) If that is true, then why do less than half the Atlantans who want to live in walkable neighborhoods get to do so?

The answer is cost, a variable that was completely ignored in the surveys cited by Cortright. Though Cortright claims to be an economist, he seems to consider costs irrelevant. The reality is that density costs more. Land in dense areas costs more because there is more competition for its use. Construction of dense housing costs more per square foot.

If the surveys cited by Cortright were honest, they would have asked, “Would you rather pay $400,000 for a 1,000-square-foot condo in a walkable neighborhood or $200,000 for a 2,000-square-foot single-family home in an auto-oriented neighborhood?” If the question were asked this way, then the answers would be a lot closer to how people actually live. If anything, there is a shortage of low-density housing in places like Boston, not the other way around.

This piece first appeared on The Antiplanner.

Randal O’Toole (rot@ti.org) is a senior fellow with the Cato Institute and author of the new book, Romance of the Rails: Why the Passenger Trains We Love Are Not the Transportation We Need, which was released by the Cato Institute on October 10.

Photo credit: Robbie Shade [CC BY 2.0], via Wikimedia Commons

Class Prejudice and the Democrats’ Blue Wave?

$
0
0

Two days after the mid-term elections, The Washington Post published an analysis under the headline “These wealthy neighborhoods delivered Democrats the House majority.” That headline is false in several different ways, but it is being repeated among a large group of the punditry because it fits into a class narrative that sees affluent, college-educated white people who live in suburbs as citadels of tolerant decency while white folks without bachelor’s degrees, wherever they live, are wall-to-wall racist and sexist xenophobes.

There is some evidence for that narrative, as whites without bachelor’s degrees (who in electoral analyses are called “the white working class”) are among President Trump’s strongest supporters. According to nationally aggregated exit polls, they voted for Trump by 37 points in 2016 and for GOP House candidates by 24 points in 2018. In contrast, “educated whites” gave Trump only a 3-point advantage in 2016 and then flipped to Democratic candidates by 8 points in 2018.

A significant section of the punditry, including many Clinton Democrats, have latched on to this phenomenon to argue that the whole ballgame for the Dems, in 2018’s blue wave and for 2020, is about winning traditionally Republican suburbs while ignoring what’s left of their traditional base in the white part of the working class. An important political shift is happening in suburbs, where half of all voters live, but it is only one part of what generated the blue wave, and these suburbs are much more diverse and complicated places than the punditry allows.

The Washington Post analysis, for example, focused on six suburban districts outside Minneapolis, Los Angeles, Atlanta, Dallas, Richmond, and Washington, D.C., which voted for Hillary Clinton in 2016 while also sending Republicans to the House of Representatives. All six, along with similar traditionally Republican suburban districts, flipped to Dems earlier this month. These kinds of districts definitely played an important role in Democrats winning the House, and we should celebrate every country-club Republican who is outraged by Trump’s nationalist mendacity, racist dog whistles, old-fashioned male supremacy, or just plain crudeness. But these districts are much more complicated than the “wealthy neighborhoods” contained within them, and most importantly, they are only one part of how the Democrats won the House.

Flips within the so-called white working class are proportionately more important. First, while the GOP won among the white working class this year by 24 points, that is a substantial shift away from the 37-point advantage they gave Trump in 2016. And because this group of whites represents 41% of all voters, compared with college-educated whites who make up only 31%, that 13-point shift produced some 6 million additional votes for Dem candidates versus the 4 million produced by the 11-point gain Dems achieved among the white middle class. So unlike the widely cited pre-election prediction by Ronald Brownstein that the Dems’ blue wave would be an exclusively suburban tsunami, shifts toward the Dems among “poorly educated” whites were of greater importance than the shift in the metro suburbs. In the exit polls, “non-whites,” including Blacks, Latinos, Asians, and Others, were about 29% of voters and gave Dems an overwhelming 54-point advantage – both numbers just 1-point higher than in 2016. As the core of the Democratic base, people of color provide the foundation for any Democratic victory, but the shifts among both kinds of whites in 2018 account for the flip of the House.

Second, along with the dozen or so suburban districts they flipped, Dems also flipped at least 14 House districts that cannot be characterized as “suburban,” let alone “wealthy.” Nate Silver highlighted many of these as “Obama-Trump” districts because they went for Obama in 2012 and Trump in 2016. There were 21 such districts, mostly in Rust Belt states where there are large proportions of white working-class voters – including 6 in New York, 3 each in Iowa and Minnesota, 2 each in Illinois and New Jersey, and one each in Pennsylvania and Wisconsin. Democrats won 14 of them, and that is at least as important as the “wealthy suburban districts” D.C. pundits continue to focus on.

What’s more, even in the traditional Republican suburban districts The Post chose to highlight, wealthy voters were not obviously more flippy than middle-income voters in those districts; those with household incomes in the $50-75k range also “surged” for Dems in comparison to their Republican pasts. Two-thirds of suburban residents do not have bachelor’s degrees, and the largest group is middle income, not affluent, let alone “wealthy.” Much of this is apparent from the data The Post authors report and display in various graphics, but they consistently emphasize the role of “the wealthy,” whom they apparently define as households with more than $100k in annual incomes. According to their own graphic, of the 29 House seats that had flipped to Dems by the time they were writing, only three came from what they define as “wealthy” districts. What’s more, in the nationally aggregated polls, Democrats failed to gain House votes versus the 2016 Trump vote in only one income category – those with household incomes of more than $100k. The Post analysis is correct in saying that “suburban neighborhoods . . . are trending increasingly left,” but they are wrong to assume that suburbs are uniformly affluent and college educated (or white).

Worse, their analysis tells only one half of the story of the Dems’ 2018 blue wave, and the smaller half at that. The 13-point shift away from Republicans by working-class whites is important even if it did not produce a majority for Dems nationwide. The difference between Clinton winning about 30% of that group in 2016 and Obama winning 40% of it in 2008 and 2012 is the difference between Democrats holding power or not.

The exclusive focus on suburbs as if they are wall-to-wall white middle-class professionals, which the influential Ron Brownstein continues to champion post-election, supports a Democratic political strategy that wants to run against Trump’s offensive style and values rather than on a substantive economic-justice program that could move toward renewing the kind of multi-racial, cross-class coalition that was such an important part of the Democrats’ 2008 sweep of executive and legislative power. In my view, that would be a horrendous strategic mistake. But worse, and not unrelated, it continues a moral narrative, common among many Clinton Democrats, that implicitly and often very explicitly values people with bachelor’s degrees over those without. That attitude, as much as any strategic choice, adds toxicity to our already toxic Trumpian environment.

This piece originally appeared on Working-Class Perspectives.

Jack Metzgar is a retired Professor of Humanities from Roosevelt University in Chicago, where he is a core member of the Chicago Center for Working-Class Studies. His research interests include labor politics, working-class voting patterns, working-class culture, and popular and political discourse about class. He is a former President of the Working-Class Studies Association.

Photo credit: VJnet, via Flickr, using CC License.

Update on Australian Urban Areas (with a Photographic Tour)

$
0
0

Australia is one of the world’s most urban nations, with nearly 90% of its population living in urban areas, according to the United Nations (2018 estimate). Only four nations with as many residents have a larger urban population percentage (Argentina, Japan, Venezuela, and Brazil).

More Australians live in urban areas than in the United Kingdom (83.4%) United States (82.3%), and Canada (81.4% ). Australia’s urbanization rate is about half-again that of the world (55.3%) and well above that of the two most populous nations, China (59.2%) and India (34.0%).

Australia, however, is not among the most populous countries. With 24.7 million residents, Australia has fewer residents than California or Texas. Indeed, other states and provinces are much larger than Australia. For example, the state of Uttar Pradesh in India has more than eight times the population (over 200 million), while China’s Guangdong province has more than four times the population (over 100 million).

Australia’s Urban Centres

As a result, Australia has no megacities (urban areas over 10 million) and none of its urban areas exceeds 5,000,000 population.

Like a number of nations, Australia’s national statistical authority, the Australian Bureau of Statistics compiles data on continuously built-up urban areas from its census, conducted every five years. Similar data is published in Canada (called “population centres”), Denmark, Finland, France, India, Norway, Sweden, the United Kingdom (called “built-up” areas), and the United States. Australia, however, uses a lower population density for threshold as small area building blocks for urban areas, which it calls “urban centres” than typical. Generally, other nations use a minimum urban standard of approximately 400 residents per square kilometer, or 1,000 per square mile. As a result, the Australia urban population densities are not directly comparable to the urban areas of the other nations.

In 2016, there were approximately 20.9 million urban residents in the nearly 700 urban centres, which covered 23,100 square kilometers (8,900 square miles). This is 0.29% of Australia’s land area, one of the lowest figures in the world. The overall urban density of 903 per square kilometer (2,340 per square mile) is similar to the US figure from the 2010 census of 905 per square kilometer, However, the lower population threshold and that fact that Australia counts settlements with more than 1,000 residents as urban, compared to the U.S. minimum of 2,500 means that its urban areas are denser (though by an unknown amount).

Largest Urban Centres

Sydney (Figures 6-11) is the largest urban center in Australia, a position its metropolitan area (which includes the Sydney urban center, and exurbanization) has held since the early 20th century. Sydney’s urban centre has 4.3 million resident and the highest density among the largest urban centres, at 2,000 per square kilometer (5,100 per square mile). Melbourne (Figures 12-14), the second largest metropolitan areas is also the second largest urban centre, with 4.2 million residents and an urban density of less than 1,600 per square kilometer (4,000 per square kilometer)

There are three additional urban centres with more than 1,000,000 residents, Brisbane (Queensland [Figures 15-19]), Perth (Western Australia [Figures 20-22]) and Adelaide (South Australia [Figures 23-24]). Brisbane and Perth are considerably less dense, with little more than 1,000 per square kilometer (below 3,000 per square mile). The densest of these three is the smallest, Adelaide, at nearly 1,400 per square kilometer (3,600 per square mile).

These five largest urban areas all have large central business district (CBDs) that appear to be physically dominant, due to their high-rise buildings, but which typically have less than 20% of the employment. There are smaller subcenters, which are generally synonymous with the “edge city” concept identified by Joel Garreau in his 1991 book Edge City: Life on the New Frontier. Sydney’s Norwest is an edge city, (Figure 10). More than two-thirds of employment is dispersed in each of the urban areas, according to a recent report by Marion Terrill and Hugh Batrouney of the Grattan Institute (See: Remarkably adaptive Australian cities in a time of growth). This urban development (Figure 1) pattern is roughly similar to that of Canadian and US urban areas, where dispersion and subcenters dominate the employment market (see: Job Dispersion Eases Growth in Australian Cities).

Between 55% and 60% of Australia’s urban population is concentrated in these five largest urban centers (Figure 1). By world standards, this is very high (Figure 2). Japan and South Korea have a larger share of their populations in urban areas with more than 1,000,000 residents, at 60% and more. The United States and Canada follow 8 to 13 percentage points behind. Australia’s cross-Tasman neighbor, New Zealand is far below, at 32% (though it has only one urban area of this size). Larger European Union nations and soon the separated United Kingdom have somewhat smaller number percentages of their population in these largest urban areas. By comparison, approximately 25% of the world population lives in urban areas with more than 1,000,000 population.

Other Urban Centres

Australia has few urban centers with between 100,000 and 1,000,000 population. Only one, the Gold Coast-Tweed Heads (Queensland-New South Wales [Figures 25-26]), has more than 500,000 residents. The Gold Coast is Australia’s principal resort and retirement area and is nearly contiguous with Brisbane, only 80 kilometers 50 miles) to the northwest. The Sunshine Coast, the second largest resort and retirement area, is about 100 kilometers (60 miles) northeast of Brisbane. The Sunshine Coast is the 11th largest urban centre.

The nation’s capital, Canberra (Australian Capital Territory-New South Wales [Figures 27-30]) has over 400,000 residents, while only three others have more than 250,000 population, each an exurb of Sydney. Central Coast is in the Sydney metropolitan area (Greater Capital City Statistical Area), while Newcastle and Wollongong are in adjacent metropolitan areas (Significant Urban Areas). Others of the largest urban centres are in relatively close proximity to the largest urban areas, such as Geelong (Figure 36), Ballarat and Bengido, which are from 75 to 150 kilometers of Melbourne, and Toowoomba, approximately 75 kilometers from Brisbane.

There are also photographs of 12th ranked Hobart, capital of Tasmania (Figures 31-33), 16th ranked Darwin, capital of the Northern Territory (Figure 34), 23rd ranked Launceston (Tasmania) and 51st ranked Alice Springs in the center of the nation, with nearby Ayers Rock (Uluru) and the Olgas, in the Northern Territory (Figure 37-40).

Population densities fall sharply in the smaller categories of urban centres (Figure 4). However, Sydney is not the densest. Four other urban centers are denser, with Meridan Plains, QLD (near Sunshine Coast) holding the number one position, at 2,399 per square kilometer (6,213 per square mile). Meridan Plains had fewer than 1,400 residents, according to the 2016 census. Overall, Australia has 50 urban centres with more than 25,000 residents (Table). A table has also been posted to the internet showing data for all of Australia’s urban centres (See: AUSTRALIA URBAN AREAS: URBAN CENTRES [Built Up Urban Areas) 2016 Census]). Photographs follow, in Figures 5 to 40.

Wendell Cox is principal of Demographia, an international public policy and demographics firm. He is a Senior Fellow of the Center for Opportunity Urbanism (US), Senior Fellow for Housing Affordability and Municipal Policy for the Frontier Centre for Public Policy (Canada), and a member of the Board of Advisors of the Center for Demographics and Policy at Chapman University (California). He is co-author of the "Demographia International Housing Affordability Survey" and author of "Demographia World Urban Areas" and "War on the Dream: How Anti-Sprawl Policy Threatens the Quality of Life." He was appointed to three terms on the Los Angeles County Transportation Commission, where he served with the leading city and county leadership as the only non-elected member. He served as a visiting professor at the Conservatoire National des Arts et Metiers, a national university in Paris.

Photograph: Sydney Opera House (by Author)

The Benefits of Homeownership Mean We Should Still Believe in the American Dream

$
0
0

In 2004, President George W. Bush announced the aim of promoting a broader “Ownership Society,” in which more Americans could benefit from owning a home, retirement accounts, and other financial assets. “If you own something,” he declared, “you have a vital stake in the future of our country. The more ownership there is in America, the more vitality there is in America.” President Bush’s premise echoes ideas advanced by virtually all presidents since Franklin Roosevelt.

Decades of evidence suggest this premise is correct: Asset ownership generally improves the well-being of families and provides an irreplaceable rung on the ladder to a stable place in the middle class. Even so, the share of households owning a home or other assets has fallen over the last decade, particularly among vulnerable groups like African-Americans, Hispanics, and millennials. To revive upward mobility and safeguard the “American Dream” of a secure middle-class life, reversing this trend is essential.  

Why ownership matters

Households accumulate assets to prepare for retirement, as well as for lumpy expenses like college tuition and medical bills. Accumulated savings are the most important funding source for startup businesses — and the decline in asset ownership arguably helps explain a puzzling downtrend in startup activity. Asset holdings also serve as a “buffer stock” enabling families to smooth spending over time in the face of ups and downs in their income.

Asset ownership is especially important to middle-class families in the United States compared to other economies, in view of America’s relatively modest government safety net. Social Security, for instance, replaces only about 40 percent of a median individual’s earnings during her retirement years, or 30 percent for someone earning about $100,000 – less than in most European countries.

Middle-class families also encounter much higher tuition bills and health expenses than peers elsewhere. Studies show that even a small savings stock makes a big difference to the well-being of lower-income families experiencing a financial setback.

The evidence also suggests that, for most families, home ownership brings considerable benefits.

Ownership is, first, a hedge against rising housing costs. Having such a hedge has turned out to be pivotal to American households over the last two decades. New construction of rental units aimed at lower-income families has languished far below the pace seen in the late 20th century, adjusted for population size. In part because of this supply constraint, median rents have surged 32 percent in constant dollars since 2001,  while median real wages have barely budged. 

More than 40 percent of America’s 44 million renter households are now “rent-burdened,” as the government defines it — spending more than 30 percent of income on housing  while a quarter spend more than 50 percent.

Home ownership also promotes household wealth-building. In theory, a family could always rent a home and redirect the money they would have spent on a down payment and mortgage principal payments to stocks and bonds. In practice, careful studies in the U.S.and other countries have shown that homeowners accumulate greater net wealth over time than otherwise similar renters.

One reason is that required payments on a mortgage effectively force homeowners to build equity in their home over time, overcoming some of the behavioral challenges in the way of wealth accumulation. Another reason: while typical appreciation in house values after taxes and maintenance is relatively low, homeowners can and do borrow most of the cost of purchasing a home, which they can’t do with liquid assets. Net returns on a homeowner’s 20 percent down payment are at least equivalent to returns on a portfolio of stocks and bonds, on average.

It’s not surprising, then, that 87 percent of Americans continue to view home ownership as part of the American Dream. According to another survey, 90 percent of young renters wish to buy a home someday, defying the myth that millennials value ownership less than previous generations did at the same age. African-Americans and Hispanics are even more likely than white Americans to aspire towards home ownership, a Harvard study found.  

When a family owns their home, benefits spill over to the wider community. A variety of studies demonstrate that neighborhoods with high home ownership rates experience higher civic engagement, less resident turnover, greater property appreciation, and less high-displacement gentrification. The whole neighborhood derives value from the financial and “sweat-equity” investments homeowners make in their homes.

It’s recently become fashionable to argue that the financial crisis of 2007-2009 discredited the “Ownership Society” as a policy aim. According to critics, Clinton- and Bush-era policies to promote home ownership were destined to fail and, moreover, fueled the financial sector excesses that spawned the crisis. This argument represents a lazy and indefensible misreading of the record.

The housing crash proved that the disastrous pattern of housing finance that emerged between 2004 and 2007  no-money-down “liar” loans, dishonestly-rated securitization structures, and the whole miasma of self-delusion and fraud depicted in Michael Lewis’s The Big Short  was bound to end badly. But it doesn’t follow that lower-income families are incapable of responsible home ownership. Ownership rates were almost as high in the U.S. during the 1960s as they were at the peak of the excesses in 2005, with no housing crises.

Also, bad lending to commercial real estate developers  including builders of rental housing  has sparked far more banking crises in history than lending to homeowners. Bad lending coupled with under-capitalized banks caused the crash of 2008, not home ownership as such.

Finally, critics of home ownership fail to consider that a rental-dominated market would confer tremendous market power on large landlords, reinforcing what author Joel Kotkin refers to as “lord-and-serf” dynamics and driving inequality higher. The only alternative would be rent control, which would devastate already-anemic construction activity and create growing housing shortages.

Ownership rates in decline

The home ownership rate declined from a peak of 69.2 percent of households in 2004 to a 50-year low of 63.1 percent in 2016, bouncing back slightly last year. The decline has been especially severe among African-Americans, Hispanics, people without a college degree, and millennials.

As of 2015, ownership rates among both the 25-34 and 35-44 age groups were more than 10 percent lower than for the same groups three decades earlier. The U.S. was once an international leader in home ownership rates, but now ranks 35th out of 44 advanced countries.

Likewise, enrollment rates in 401(k) plans and other tax-advantaged retirement programs have declined considerably since the 1990s for African-Americans, Hispanics, and young adults. Only 52 percent of Americans in the middle income quintile — and just 31 percent of the lower-middle quintile — had money in retirement accounts as of last year.

The net wealth, after household debt, of middle-income Americans has deteriorated recently as well. According to a 2017 Pew Research report, median net wealth for middle-income white, African-American, and Hispanic households has fallen 19 percent, 38 percent, and 46 percent, respectively, over the last decade.

A new study by the Federal Reserve Bank of St. Louis estimated that the accumulated assets of the median household “headed” by a 35-year-old are running 40 percent below the level one would expect at this stage based on the experience of earlier generations. 

Why has asset ownership fallen so much, particularly among middle-income families? The chief factor accounting for declining home ownership rates is, almost surely, the fact that house prices have been at sky-high levels by historical standards, both before 2008 and again over the last five years. Ownership rates actually fell from 2004 to 2007 despite the wild excesses of housing finance during those years, because houses became so unaffordable.

As for retirement assets, the existing system is failing all too many middle-income households. People find it too easy to withdraw account balances and too difficult to port accounts over to new employers, which means a substantial minority of enrollees have virtually nothing in their accounts. The share of smaller employerswho even offer a 401(k) plan has fallen considerably over the last two decades, to less than half.

For millennials, one more impediment to asset accumulation is the millstone of student debt. Outstanding student loans have exploded upwards from under $400 billion in 2005 to $1.5 trillion today. 

Reviving the Ownership Society 

Providing a “hand-up” to help lower-income people onto the first rung of the ladder to stable asset ownership is one of the most powerful engines for upward mobility and a sustainable middle class.

Government at all levels should promote sustainable home ownership by:

• Loosening onerous land use restrictions to stimulate development of much-needed housing supply and drive down housing prices – as studies show that cities with the least restrictive zoning rules like Dallas, Nashville, and Charlotte have experienced the most construction and relatively modest housing price increases;
• Using property tax incentives to incentivize homeowners and landlords to rehab existing homes, which could add as much to the future housing stock as any plausible amount of new construction;
• Phasing out the mortgage interest deduction for middle-income families and higher to eliminate the price distortions this needless tax break creates, and converting it into a refundable tax credit for lower-income families, who currently derive no benefit from it; and
• Taxing land more heavily and structures more lightly to induce development.

To promote asset accumulation in retirement plans and other savings accounts, Congress should replace today’s heavily-regulated, burdensome mix of retirement mechanisms with a single system of easily portable, tax-advantaged “universal savings accounts,” with far higher contribution limits. President Bush pushed unsuccessfully for such a system in the early 2000s, and numerous such proposals are circulating today.

Government at all levels should stop penalizing savings in determining eligibility for means-tested benefit programs. They should also consider innovative experiments in matching contributions by lower-income families to savings vehicles. One example is the promising “Individual Development Account” program, which helped low-income savers to more than triple their savings relative to a control group in a randomized trial last year sponsored by the Urban Institute.

The federal government should overhaul the disastrous student loan system to reverse the rapid buildup of indebtedness, which today renders the dream of wealth-building an unreachable fantasy for millions of young Americans.

And policymakers should do all they can to foster the emergence of cheap, technology-enabled, no-conflicts financial advice to middle- and lower-income people – which is almost impossible to provide in the over-regulated and conflict-ridden financial services environment of today. 

President Bush was right in 2004, and his vision of an “Ownership Society” is more valid than ever in 2018. Building asset holdings is one sure way to bolster America’s middle class. 

This piece originally appeared in The Catalyst, a journal of ideas from the Bush Institute.

J.H. Cullum Clark is Director, Bush Institute-SMU Economic Growth Initiative and an Adjunct Professor of Economics at SMU.

The Soul Of The New Machine

$
0
0

Thirty-five years ago Tracy Kidder electrified readers with his “Soul of a New Machine,” which detailed the development of a minicomputer. Today we may be seeing the emergence of another machine, a political variety that could turn the country toward a permanent one-party state.

This evolution has its roots in California, where a combination of Silicon Valley technology, changing demographics, control of media, culture and academia have worked to all but eliminate the once-fearsome state GOP. For all intents and purposes, the California Republican Party has ceased to exist.

But this is not, as some conservatives contend, a case simply of California lunacy. Several once historically conservative states — Colorado, Arizona, Nevada — have been turning ever-bluer in recent elections. The party now barely is able to hold onto seats in places such as Texas, Alabama, Mississippi, Georgia and Florida, while the Midwest, the region that elected Donald Trump, seems to be shifting back to its bluer past.

The road to Dominion

Just two years ago, the Republican Party was at its apex at the state level, while controlling both the House and the Senate. Yet Trump’s histrionics and narcissistic persona have undermined his own party, as Utah’s defeated Rep. Mia Love recently suggested. “It’s all the Donald that’s killed us,” says Kevin Shuvalov, recounting the beating Republicans suffered in most Texas metro areas, and where Beto O’Rourke almost dethroned Senator Ted Cruz.

Trump’s antics, particularly on immigration, have brought the fabulously rich Brahmin elite — Michael Bloomberg, Tom Steyer, the Silicon Valley billionaires — out in force, continuing a trend that has been building for at least a decade. But they also built a very impressive grassroots funding base. Together these two efforts allowed the Democrats to garner effort for two-thirds of spending on critical congressional races.

Money, as the late Jesse Unruh put it, is “the mother’s milk of politics” and the Democrats employed it in part to finance a first-rate get out the vote effort. This helped raise the midterm turnout to its highest rate since 1914. Numerous well-targeted campaigns in fairly affluent suburban districts saw GOP candidates, notably in Congress, chopped up like unwelcome crabgrass.

In my own Orange County district, Elizabeth Warren acolyte Katie Porter outspent, out-hustled and out-thought our listless Congresswoman Mimi Walters. Porter canvassers, young and enthusiastic, visited our house three times, but we never saw anyone from Walters’ campaign. Porter’s well-done ads, following the approved script of health care and opposition to Trump, appeared on popular websites and sports events, while Walters’ were virtually non-existent. In the end Walters’ addled handlers tried to win by waving the bloody shirt of potential tax returns and calling Porter a liberal; those old tactics failed miserably.

Demographics and political economy

Amid the best economy for minorities in a generation, the Republicans have managed to further alienate the fastest-growing groups in the country. The Latino share of the midterm vote, notes the GOP consulting firm of Melman Castagnetti, has risen from 5.6 percent in 2006 to 11 percent in 2018. Two-thirds of those votes went to the Democrats.

Other strongly Democratic groups — millennials, educated women, professionals — also turned out in big numbers, leaving the GOP with an aging, heavily white and working-class base. As suggested by falling oil prices, a weak housing market and new layoffs at General Motors, the GOP’s economic base could be buckling. In the long run the Democrats now enjoy almost uniform support from the less threatened quasi-monopolies of the tech and media oligarchy.

To this, notes one GOP strategist, add Trump’s uncanny ability to alienate well-to-do conservatives. When the rich of Dallas, for example, close their wallets while the Silicon Valley types, Wall Street and Hollywood open theirs, it’s a recipe for GOP disaster.

The only thing Democrats need to fear is themselves

Trump has accelerated the movement of almost everyone — outside his working class and Main Street base — toward the Democrats and their shiny new machine. But politics is not yet fully based on algorithms; people still have unpredictable sensitivities, even if the alternative is Trump.

Several issues could derail the Democrats, notably their apparent embrace of “open borders,” something most Americans will not welcome. Their parade of “free” programs may mean much higher taxes. More regulation, notably on energy, and calls for a climate change “command economy” could threaten the incomes and lifestyles of most Americans, particularly the critical suburban voters. Programs that punish the middle and working class in order to “save the planet” are already causing chaos in France. This might happen here as well, but only after 2020, when the Democrats may have the power to impose them.

Increasingly the great Trump triumph of 2016 is looking more and more of a pyrrhic victory. With more Democrats in the 116th Congress than 34 other states combined, California, not Indiana or Ohio, is becoming the country’s premier political center. Our “model” of a one-party progressive dictatorship, built on an odd coalition of the rich and poor, is inexorably moving beyond the Sierras and into the rest of the country.

This piece originally appeared on The Orange County Register.

Joel Kotkin is executive editor of NewGeography.com. He is the Roger Hobbs Distinguished Fellow in Urban Studies at Chapman University and executive director of the Houston-based Center for Opportunity Urbanism. His newest book is The Human City: Urbanism for the rest of us. He is also author of The New Class Conflict, The City: A Global History, and The Next Hundred Million: America in 2050. He lives in Orange County, CA.

Photo: Via KNX1070 NewsRadio.

Louisville Bridges Project Is the Biggest Transportation Boondoggle of the 21st Century

$
0
0

I have been a steadfast critic of the project to build two new bridges across the Ohio River in Louisville for over a decade. In fact, my first critical post on the bridges proposal was put up in 2007 less than six months after starting my original Urbanophile blog.

The end result was even worse than I anticipated. The project has proven to be a money waster of the highest order, and in fact by far the biggest American transportation boondoggle I can identify in the 21st century so far.

Part of the agreement between Indiana and Kentucky to build the bridges was that they would do official before and after surveys of traffic to determine the impact of the new bridges on traffic flow. The study was published in August of this year.

The result? The two states spent $1.3 billion dollars to build a parallel I-65 span in downtown Louisville that doubled the capacity of that crossing. After spending that money, traffic fell by 50%.

Let me repeat that: Indiana and Kentucky spent $1.3 billion to double the capacity of a road while traffic levels were cut in half.

Here’s a chart showing the before and after traffic levels on the bridges.

And here’s a percent change look.

The project doubled the size of the I-65 crossing and built a new East End crossing that didn’t previously exist. Each of these were around $1.3 billion separately.

What happened is that to pay for (part) of the bridges, a toll was added to the previously free I-65 bridge, and a new crossing in the East End was also tolled. This simply led to a diversion of traffic to the other two bridges that didn’t have tolls. In fact, the existing free I-64 Sherman Minton Bridge now carries more traffic than all of the toll bridges combined. (Unsurprisingly, there’s talk of temporarily closing that bridge for rehabilitation).

Total cross-river traffic has actually fallen since 2013, albeit only slightly. But traffic on the Clark Memorial (2nd Street) Bridge is up 75%. This is traffic choosing the free route to get to downtown. This happened even though the Clark Bridge has seen its number of lanes cut in half due to a lengthy repainting project. Traffic on the I-64 bridge increased by 23%. There’s no percent change on the East End bridge since it didn’t previously exist.

I have always said that the East End bridge made sense conceptually because it added a crossing where one did not exist previously and where traffic would otherwise have to go many miles out of the way to get across the river. The actual bridge was too expensive (also $1.3 billion or so), in part because of a ludicrous tunnel built on the Kentucky side, but at least the basic bridge was a sound project.

But an expanded downtown crossing never made sense. Not only has it proven to be a transportation waste, it is a negative in other ways. For example, the project doubled the width of interstate overpasses through downtown Louisville, creating a bigger barrier between downtown and the booming NuLu district to the East.

Most gallingly, Louisville decided to double down on freeways at a time when most cities are looking at ways to reduce the negative impact of freeways on downtowns and even tear them out entirely in some cases. A very viable proposal to do just that in Louisville called 8664 was rejected by policymakers, who insisted on spending $1.3 billion on this disaster.

Not only was this project a colossal waste of $1.3 billion. Not only did it harm the urban fabric of downtown Louisville. But there’s also reason to believe it diverted economic activity away from Louisville.

Looking at the numbers in table 3.1., it looks like truck traffic across the river has fallen by almost a third since 2013. Here’s the chart:

20% of 224,700 is 44,940. 14% of 220,200 is 30,828. That’s 14,112 trucks (i.e., commercial traffic) gone. Where did they go? If you are a region that’s banking on the distribution industry for a big part of your future blue collar employment growth, the tolls on these bridges can’t be good news. That’s particularly true when no surrounding competitor city has tolls.

I don’t generally like to say “I told you so” – but in this case I’ll make an exception. My analysis of this bridge project was known to decision makers well in advance of the project moving forward. I know that for a fact. What’s more, probably nothing harmed my standing in certain political circles more than this reportage. The 8664 idea was very widely circulated and understood by everyone in Louisville leadership.

This boondoggle didn’t happen by accident. It wasn’t a result of ignorance. It was well known in advance that it was a bad idea. It was a deliberate, conscious choice.

The fact that these states found $1.3 billion to spend on this downtown bridge is one reason why I will never again accept the “there’s no money for that” excuse on anything again. States keep finding plenty of money to spend on things of little to no value – like this bridges project.

I’m not hostile to road spending, so my opposition to this project was never based on an ideological opposition to cars but because it made no transportation or financial sense. It doesn’t make sense to build new roads in stagnant or shrinking places and we should be cautious about speculative projects in an age where we don’t know what the pending possible disruption of driverless cars might bring, but I’m a big advocate of building more roads in rapidly growing places. Unfortunately, the project selection process in most states seems to alight upon the worst projects while the best go unfunded.

Is there another place in the country where somebody spent $1.3 billion to double the capacity of a road whose traffic then fell by half? I can’t think of another example remotely like this. It may well be that something like the MTA East Side Access in New York has seen cost overruns that dwarf this. But at least that project will be useful when it’s done. This is a total waste. That’s why the Louisville downtown bridge is the biggest transportation boondoggle of the 21st century to date.

By rights I should be writing this for a major national publication instead of putting it on my personal web site. But I love Louisville and Southern Indiana (my hometown) and don’t want to create negative press for them. I just want it known for the record that this did not have to happen.

This piece originally appeared on Urbanophile.

Aaron M. Renn is a senior fellow at the Manhattan Institute, a contributing editor of City Journal, and an economic development columnist for Governing magazine. He focuses on ways to help America’s cities thrive in an ever more complex, competitive, globalized, and diverse twenty-first century. During Renn’s 15-year career in management and technology consulting, he was a partner at Accenture and held several technology strategy roles and directed multimillion-dollar global technology implementations. He has contributed to The Guardian, Forbes.com, and numerous other publications. Renn holds a B.S. from Indiana University, where he coauthored an early social-networking platform in 1991.

Photo Credit: Bart Evans, CC BY 2.0

California Doesn’t Have a Budget Surplus

$
0
0

It’s become common folklore that California is booming and incoming Governor Newsom and the Democratic supermajority have more taxpayer money than they will know how to spend, save, or invest. Nothing could be farther from the truth; and it’s the California voters and taxpayers who will continue to be pay for this mistake. We literally owe trillions that isn’t being discussed. Just the estimated payments on public employee pensions in California will increase from $31 billion in today’s dollars to $59 billion in 2024; and this number is based on non-recessionary conditions or a major correction in the stock market. And California immediately needs $800 billion to over $1 trillion worth of infrastructure repairs, upgrades and new construction.

A conservative estimate of California’s total debt by the California Policy Center in a 2017 study – before new tax and bond obligations recently voted in were factored – puts California’s total local and state debt at $1.3 trillion. The Stanford University Pension Institute (www.pensiontracker.org) in 2017 calculated California’s unfunded liability at $1.4 trillion and CalPERS also with an unfunded liability of $1.4 trillion, with CalSTRS billions underwater as well to give, “real state debt of $2.8 trillion.”

Whichever calculation is used California owes trillions and doesn’t have a plan in place to address this issue. What should be clear is that California does not have a surplus or anything near a surplus factoring in total debt and infrastructure for a basic, functioning society California citizens and non-citizens expect. This figure also doesn’t factor in health care costs rising under Covered California, Medi-Cal or possibly expanding Medicare to include all Californians living in-state.

These financial and societal facts will affect overall fiscal health and the ability to pay back debts accruing interest or fall under the category of a future obligation. Government services at the state, county and local level are at risk if a recent announcement by the CalPERS Board is taken into consideration titled, “Risks Report,” highlighted, “The greatest risk to the system continues to be the ability of employers to make their required contributions.”

Taxpayers will have to make up the shortfall through additional taxes – like eliminating Prop 13, voting in a VAT or services tax or some combination thereof – otherwise first responder-response-times, social services for the poor and needy; and environmental standard protocols will erode.

There are other factors California will need to overcome to pay back their debt and realize we do not have a budget surplus. California’s unemployment rate is 33rd in the nation at 4.1%. The national unemployment rate is 3.7%. We have the highest taxes in the nation when the variables of the gas tax, state income tax, and sales tax are put into the equation. Additionally, California has the highest housing and rents in the nation per amount of residents. The median home price in California is roughly $544,900 whereas the remainder of the United States is estimated at $220,000. We artificially suppress housing supply (particularly, single-family-home) – though demand hasn’t diminished – driving up prices. Our stringent environmental standards evidenced by CEQA, SB 375, AB 32, SB 100 and CARB is hurting job growth and economic sustainability.

High taxes and regulations; and a tough business environment are some of the reasons why Toyota, Occidental Petroleum, and Nestle USA food conglomerate left California. Now the second largest firm in California – McKesson Pharmaceuticals is seriously contemplating leaving for Texas – according to a report by the San Francisco Business Times. The issue isn’t whether or not these companies leave; instead it’s the high paying jobs with benefits across all income spectrums being driven out of California. Moreover, we need successful firms to assist tackling the trillions we owe in pensions, bond obligations and infrastructure requirements.

After this recent election where it has become proper to bash Republicans – especially California Republicans – many will postulate there is no difference between Republicans and Democrats. When there is nothing farther from the truth. I’m not speaking about politics, which is essentially the means for winning elections and building coalitions for governance, I’m speaking about actual policies. How do you allocate taxpayer money? Do you want to tackle California’s debt or speak about a surplus instead? Do you believe in abortion, gay marriage, some form of socialism? Do you build a larger navy to confront global problems? Do you believe in fracking?

Those are policy decisions that have wide ramifications for California policymakers and voters. The California Democratic Party currently believes in spending more than it takes in by amounts it will never be able to recover; though incoming Governor Newsome showed variables of fiscal restraint as Mayor of San Francisco. Of course there are establishment cronies and swamp-dwellers in both parties; but if you only take environmental policy using Tom Steyer as an example there has never been a more powerful oligarch in recent memory.

The planet and California isn’t better off for the policies Mr. Steyer advocates for and our poverty and homelessness continues being the worst in the nation. These are examples of policy decisions similar to believing there is a budget surplus that have long-term, negative ramifications.

What the surplus doesn’t take into account is California’s real poverty rate, which the Census Bureau standard now has at 19% and 43.9% higher than the remainder of the US. Disenchantment and disillusionment with both parties is en vogue, but there is too much at stake in our financial future to allow the Democratic supermajority to be let off the hook by continuing to spout the mantra of budget surplus.

Todd Royal is a committee member for the California energy and electrical committee for the American Society of Civil Engineer; and an energy consultant focusing on the geopolitics of energy directly related to foreign policy, national security and domestic exploration and production based in Los Angeles. He can be reached via Twitter @TCR_Consulting.


ABC Sitcom The Conners: The Struggle is Real

$
0
0

Life expectancy for Americans has fallen to an average of 78.6 years. This is a drop from the most recent estimates—indicating a downward trend that is virtually unheard of in Western countries. A report just released from the Centers for Disease Control and Prevention calls this “a disturbing result not seen in the US…since 1915 through 1918, which included World War I and a flu pandemic.” The report blames the downward trend on increases in opioid abuse, suicide, and diabetes.

So perhaps it is fitting that when ABC debuted The Conners, a spinoff from last year’s canceled Roseanne, the writers decided to kill off Roseanne Conner by having her succumb to an opioid addiction—an addiction so secret that even her husband, Dan (John Goodman) was shocked when his daughters started unearthing random bottles of pain pills around the house after Roseanne’s death.

The real life Roseanne Barr is still very much alive, as she reminded her fans when The Connors debuted in mid-October, tweeting, “I’m not dead, b*&%#es.” But it was a tweet last May that killed Barr’s tenure at ABC. She tweeted about President Obama’s close advisor, Valerie Jarrett: “Muslim brotherhood & planet of the apes had a baby=vj.” At first Barr blamed the tweet on the sleep aid, Ambien, and then she claimed that didn’t know Jarrett was African American. Finally, she apologized: “to Valerie Jarrett and to all Americans. I am truly sorry for making a bad joke about her politics and her looks. I should have known better. Forgive me—my joke was in bad taste.” But the damage was done. ABC promptly canceled Roseanne, calling Barr’s tweet “abhorrent, repugnant, and inconsistent with our values.”

Sara Gilbert, who plays Roseanne’s daughter Darlene, and Goodman scrambled to find a way to keep the show alive. Indeed, the Roseanne reboot was Gilbert’s idea in the first place. They were also concerned about the ability of the hundreds of people employed by the sitcom, in front of and behind the camera, to keep their jobs.

Ironically, perhaps, some have argued that The Conners is just as good—and maybe even better—than Roseanne. The show was always an ensemble piece, and every actor associated with the reboot has remained. Even better, D.J.’s (Michal Fishman) African American wife, who last spring was off camera fighting in Afghanistan, is now back from the war (Maya Lynne Robinson), and there are delightful cameos by Johnny Galecki as Darlene’s ex-husband, Matthew Broderick as Jackie’s pompous Halloween date, and Jay R. Ferguson (Peggy’s bearded coworker from Mad Men!) as Darlene’s new boss at a tabloid newspaper.

Michael Schneider writing for Indiewire suggests that without the distraction of Roseanne Barr’s politics the show can go back to doing what it did so well in the 1990s: chronicling the woes of the working class. The Conners struggle with many problems familiar to working-class families: the grief from losing someone to opioid addiction, the additional loss of Roseanne’s income, alcoholism, being fired, being underemployed, being forced to work in crappy service industry jobs because nothing else is available, blue collar jobs that suck, dicey sexual situations in the workplace, and a threadbare house that is falling apart and which has to hold several generations because of finances. The Conners also face less class-specific problems of tween sexuality, teenage sex, divorce, religion, politics, and a multi-racial family.

One of the most interesting consequences of the Roseanne reboot, its subsequent cancellation, and its rebirth as The Conners is that television critics are talking about class on television. These discussions fall into two oddly contradictory threads. Some argue that television has never properly addressed class, arguing, as Pepi Lesteinya did in Class Dismissed: How TV Frames the Working Class, that television has either long ignored, mocked, or derided the working class in its portrayals. The other thread, which seems to belie the first, is that in the good old days television represented the working class with love, but that now those days are gone.

The truth is more complicated than either of these claims.

First, working-class people have always been featured on network television in greater numbers than we have been able to see as scholars, in part because there are simply too many hours to count, watch, and apprehend. From my own research, I can assert that 1950s television was weird, heterogeneous, ethnically and racially diverse, full of working-class characters and themes, and ideologically diverse as well. While this is not a view in the scholarly mainstream, I have allies for this argument in the scholars who contributed to The Other Fifties: Interrogating Mid Century Icons, and, especially, Horace Newcomb’s chapter, “Meaningful Difference in 50s Television.”

Despite the seeming scarcity of working-class themed television comedies, many such shows have been at the center of a canon of the most watched and re-watched series in television history. The 1950s offered The Honeymooners and The Life of Riley, game shows like Queen for a Day, and variety shows featuring diverse casts such as TheMilton Berle Show and TheRed Skelton Show. The 1960s and 70s brought dozens of television series about public sector workers (nurses, teachers, cops, and fire fighters) and classics like All in the Family, Sanford and Son, Maude, and Laverne and Shirley. Don’t forget the longest running TV series in history, The Simpsons or more recent series such as Two Broke Girls and Superstore. Across these eras, working-class characters, working-class writers, and actors from working-class backgrounds have always been a core staple of the small screen. A quick visual for this comes from Vulture’s timeline of working class sitcoms on network television.

Despite all this attention to the working class, one thing is for sure: television is bad at class struggle. On rare occasions, such as with the 1990s drama WWII era Homefront (1991-1993), unions are portrayed with dignity and realism, but for the most part television either ignores or distorts class conflict. On the other hand, the most consistent theme of most working-class sitcoms, including The Conners, is that it is a struggle to be working class.

In an op-ed last week David Brooks mused about the decline in life expectancy for Americans, concluding that since the economy is currently going gangbusters, that the only thing that can explain the uptick in opioid deaths and suicides among working-class Americans is some strange brew of economics, philosophical rot, and moral decay. But Brooks is wrong. Whatever the GDP might indicate, the American economy has been in decline for working people for a long time—even more so since the financial collapse of 2008. There is no single state in the US in which a minimum wage job can afford a worker a two-bedroom apartment. Inequality is more pronounced than in any time in US history. African American poverty in the South is considered by the UN to be some of the worst anywhere in the world. And as Forbes magazine reported in August, the real economy isn’t booming.

For now The Conners remain on the air, with their lives and their dignity intact, if only just barely. I hope that ABC and its viewers will keep the show on the air long enough for us to keep talking about class and culture—and about class struggle. The struggle is real.

This piece originally appeared on Working-Class Perspectives.

Kathy M. Newman is an Associate Professor of English at Carnegie Mellon University and author of Radio-Active: Advertising and Activism 1935-1947.

Photo by Eric McCandless, ABC

Highest 2016 Home Ownership Rate in Grand Rapids, Los Angeles Last

$
0
0

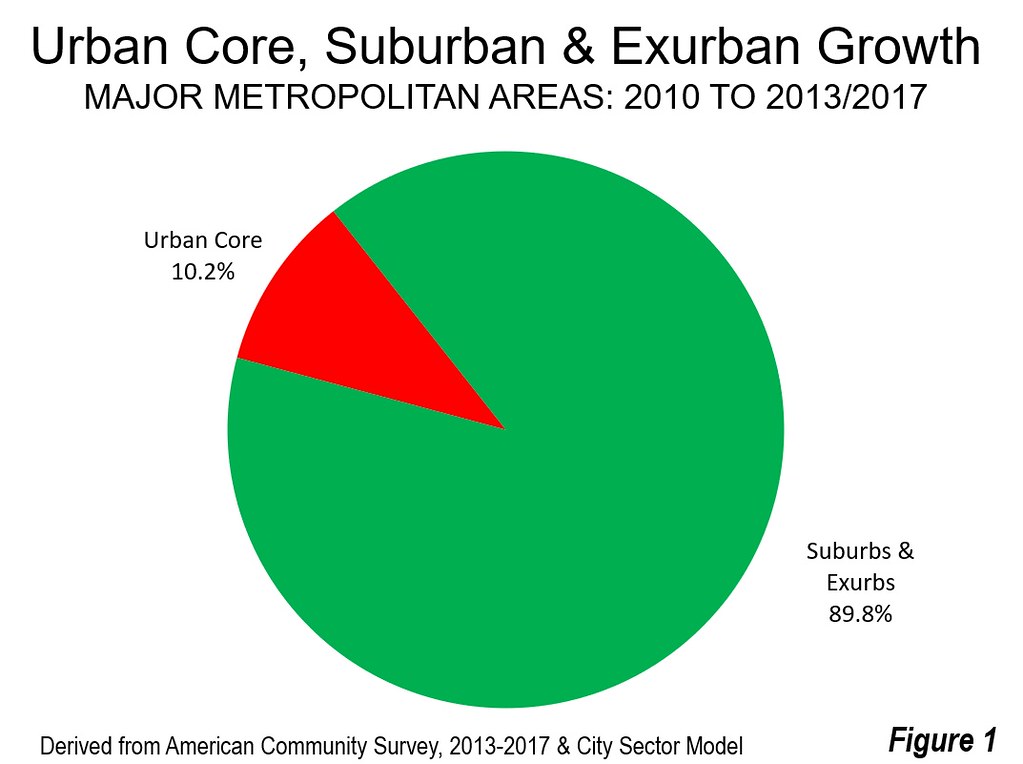
Home ownership is finally increasing in the United States, following the housing bust. The Census Bureau reports that 63.9 percent of households owned their own homes in 2017. This represents the first annual home ownership increase in more than 10 years, as a string of losses followed the housing bust after 2006. The home ownership rate has continued to increase, and stood at 64.4 percent in the third quarter of 2018. This is just above the 64.3 percent average home ownership rate for the three decades ending in 1994. Much of the subsequent increase in home ownership was the result of the housing bubble (Figure 1). The authors of a Federal Reserve Bank of San Francisco working paper (Paolo Gelain of the European Central Bank and Norges Bank, Kevin J. Lansing of the Federal Reserve Bank of San Francisco and Gisle J. Natvik of the BI Norwegian Business School) characterized this as:

… a classic speculative bubble involving naive projections about future asset values, imprudent lending against risky collateral, and ineffective regulatory oversight."

Much of the angst about falling home ownership since the Great Financial Crisis insufficiently accounts for unusual, and hopefully not to be repeated influences. Yet the differences between metropolitan areas are enormous.

Highest Home Ownership Rates

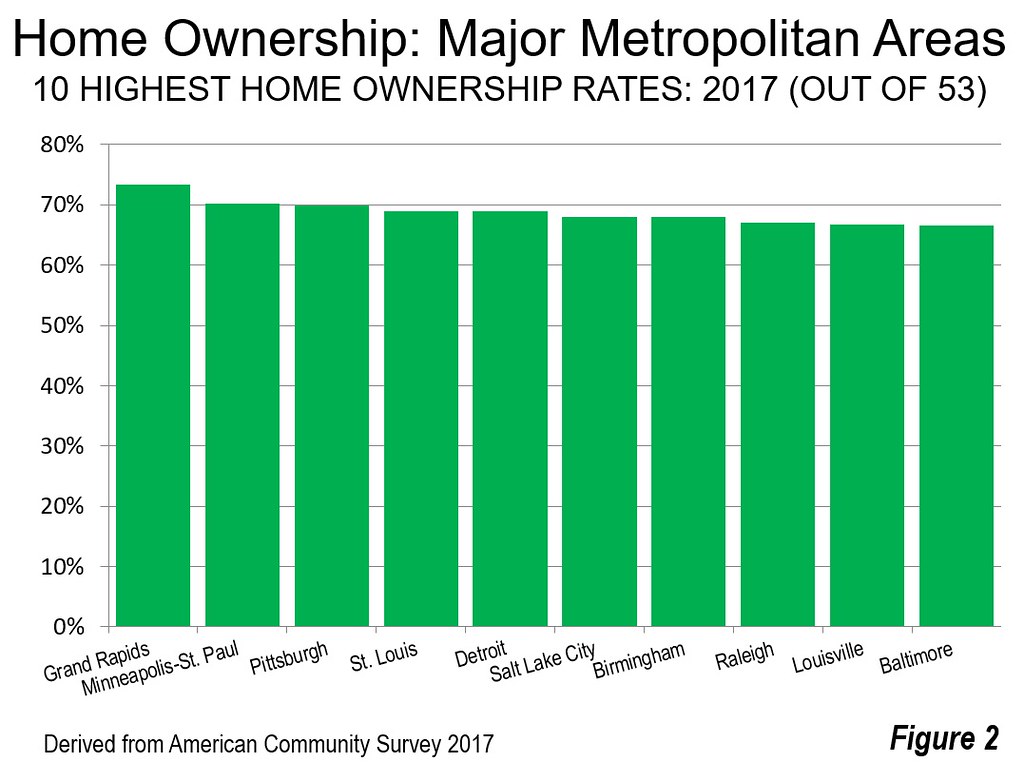
The data from the American Community Survey shows that Grand Rapids, Michigan has the highest home ownership rate among the 53 major metropolitan areas (over 1,000,000 population). With 73.4 percent of households owning homes, Grand Rapids has a 3.2 percentage point margin over second ranked Minneapolis-St. Paul (Minnesota-Wisconsin), which has a 70.2 percent home ownership rate. Grand Rapids and Minneapolis-St. Paul are the only major metropolitan areas with home ownership rates exceeding 70 percent. The table shows home ownership rates for the 53 major metropolitan areas.

Pittsburgh, St. Louis (Missouri-Illinois) and Detroit ranked third through fifth in home ownership, they were followed by Salt Lake City, Birmingham, Raleigh, Louisville (Kentucky-Indiana), and Baltimore. All of the top ten metropolitan areas had home ownership rates of 66.6 percent or higher (Figure 2).

Lowest Home Ownership Rates

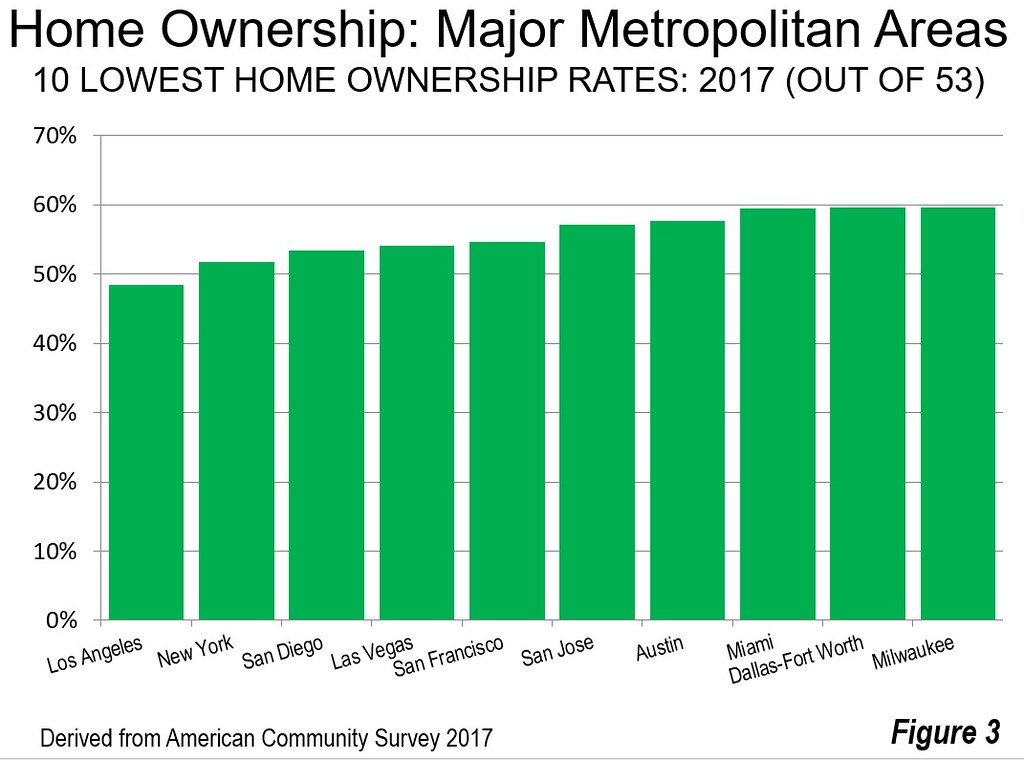
The lowest home ownership rate was in Los Angeles, at 48.4 percent (a ranking of 53rd). This is more than one third below that of leader Grand Rapids and 3.4 percentage points below New York (New York-New Jersey-Pennsylvania), at 51.8 percent. Three other metropolitan areas had home ownership rates below 55 percent, 51st ranked San Diego, 50th ranked Las Vegas, and 49th ranked San Francisco. The other metropolitan areas among the lowest 10 home ownership rates were all below 60 percent, San Jose, Austin, Miami, Dallas-Fort Worth, and Milwaukee (Figure 3).

California’s Low Home Ownership Rates

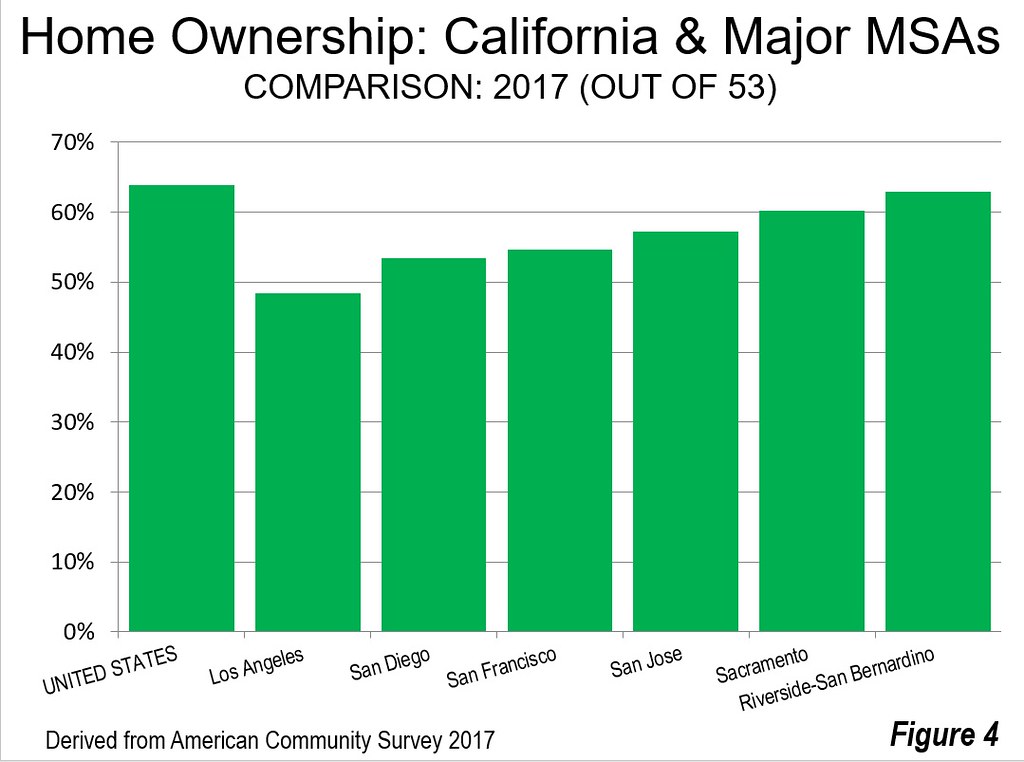
California’s major metropolitan areas are disproportionately ranked with among the lowest home ownership rates. None has a home ownership rank in the top one-half of metropolitan areas. Four of the six metropolitan areas with the lowest home ownership rates are in California, including the two largest. The Los Angeles home ownership rate is nearly one-quarter below that of the nation. The San Francisco home ownership rate is 14 percent below the national rate. The fourth largest metropolitan area, San Diego, has a home ownership rate 16 percent below that of the nation. San Jose, with the highest median income of any major metropolitan area, has a home ownership rate 10 percent below the US rate.

While Sacramento is not among the 10 metropolitan areas with the lowest home ownership rates in the nation, it ranks 12th worst, at six percent below the national rate. Only Riverside-San Bernardino has a home ownership rate nearly equal to that of the nation, at 63.0 percent.

There have been multiple reports from California’s Legislative Analyst, as well as others tracing much of the higher housing costs to some of the most restrictive land use regulations, in a state with the highest urban population density in the nation. Further, California’s high house prices make it far more expensive to provide subsidized, affordable housing because its costs are tied to housing costs in the market. A consequence is that California has the highest housing cost adjusted poverty rate among the 50 states.

The Importance of Home Ownership

In a recent article, Cullum Clark, Director of the Bush Institute-SMU Economic Growth Initiative, reminds us that home ownership has been a priority of presidents since FDR (see: The Benefits of Home Ownership Mean We Should Still Believe in the American Dream). He says that “Providing a 'hand-up' to help lower-income people onto the first rung of the ladder to stable asset ownership is one of the most powerful engines for upward mobility and a sustainable middle class.” This is crucial to a prosperous and inclusive future.

Improving home ownership does not require liar loans or dishonestly rated securities. It can be accomplished by allowing competitive land markets to operate. This requires allowing starter housing to be built that can be afforded by the starter home consumers of the future, such as millennials and many minority households.

Photograph: Grand Rapids
Credit:
https://en.wikipedia.org/wiki/Grand_Rapids,_Michigan#/media/File:Grand_R...

Miami’s New Temples

$
0
0

I scratched my head over this one for a while before I eventually came around. Give me a minute to come full circle here.

This is the latest architectural statement in Miami’s trendy Wynwood neighborhood. Faulders Studio and Wolfberg Alvarez Partners created an eight story garage meant to be a catalyst for the larger neighborhood. The high design celebrates the building on its own terms and is intended to be a cultural icon in its own right. The skin of the building is made of movable panels that can be swapped out with new art installations over time.

A multi story garage is expensive relative to a surface parking lot. Rigorously engineered steel and concrete come at a premium compared to a thin schmear of asphalt and a couple of curb cuts. Parking decks are justifiable when land values are sufficiently high. But a garage can also boost the value of surrounding real estate in a reciprocal fashion. Not coincidentally many nearby properties are owned and managed by the same small group of influential investors. This particular structure was financed through the sale of a vacant 1.25 acre lot that recently sold for $30M.

Multiple elevators, stairwells, electrical, plumbing, fire safety, and surveillance equipment all serve the building. But it comes at a price. This 428 vehicle garage cost $22M to construct. That’s about $51,400 per parking space. The next time you find yourself complaining about a $3 per hour parking fee let those numbers sink in.

The building is officially “mixed use.” That’s a term that used to signify residential and commercial activities in one envelope like a mom and pop shop with an apartment or two upstairs. But here one corner of the lower level is set aside for retail and a portion of the top floor is meant for office space. But the overwhelming majority of the structure is parking. There is no residential component. While Wynwood itself is a relatively walkable area the majority of Miami is auto dependent and those cars need to be accommodated. So a “mixed use” garage with a corner shop to activate the pedestrian realm and offices with city views makes sense in this context.

Not too far away in Miami’s Design District is the new garage for the Institute of Contemporary Art. Again, this building is a functional necessity that was leveraged into a neighborhood icon and embellished with distinctive art installations. This building is pure parking. While the museum across the street commissioned the structure the surrounding luxury brand shops benefit from the garage. The flow of prosperous visitors to the design district also supports the museum in a symbiotic two way feedback loop. The commodification of culture is unapologetically embraced in Miami.

1111 Lincoln Road in South Beach is Herzog and De Meuron’s origami brutalist garage-as-sculpture. The 40,000 square foot building provides 300 parking spaces. At $65M that’s $216K per car. To be fair there are a few retail shops on the ground floor and a luxury penthouse on the upper level, but it’s still pretty pricey for a garage. So why are property owners willing to spend that kind of money on such buildings? First, they’re required. You can’t not have parking and have a property succeed. Second, if a garage is magnificent instead of a hideous bunker it adds value to everything around it. In the right environment it makes financial sense.

The most fashionable places seem to embrace exposed mechanical systems and unfinished crude materials. Light and cavernous spaces (or alternatively, dark and intimate spaces) are in demand. Refinements come in the form of ephemeral furnishings and… humans. These buildings are beginning to emerge as quasi public venues that fill the void left behind by the larger anonymous metroplex. Parking garages are Miami’s new temples.

This piece first appeared on Granola Shotgun.

John Sanphillippo lives in San Francisco and blogs about urbanism, adaptation, and resilience at granolashotgun.com. He's a member of the Congress for New Urbanism, films videos for faircompanies.com, and is a regular contributor to Strongtowns.org. He earns his living by buying, renovating, and renting undervalued properties in places that have good long term prospects. He is a graduate of Rutgers University.

The First Shots in the Climate Wars

$
0
0

In launching their now successful protests against President Emmanuel Macron’s gas hike, the French gilets jaunes (yellow jackets) have revived their country’s reputation for rebelling against monarchial rule. It may well foreshadow a bitter, albeit largely avoidable, battle over how to address the issue of climate change.

Macron’s approach may have made him a favorite of editorial writers, who see him as the new “sun king,” but he is far more disliked by his own people than Trump is by Americans. The new French rebellion parallels the revolutionary resentments that ultimately overthrew aristocratic and clerical privilege that allowed them to live in splendor while the Third Estate, the middle class, suffered.

Climate: Beyond hysteria

Macron’s policies rest on the notion of an on-going climate catastrophe embraced by media, the academy and the intelligentsia. Every time weather takes a nasty turn as it often does — heat waves, downpours, forest fires, floods — it’s often attributed to climate change.

This leads to the notion that we need to embrace climate “hysteria,” as one New York Times reporter suggested recently. This does not seem the best basis to create an enduring and workable policy. Like other pressing issues, environmental concerns need to be addressed in a rational and equitable manner. The mainstream media has become the biggest obstacle here, as evidenced by coverage of a recent report suggesting a huge economic hit from climate change. As President Obama’s undersecretary of energy for science, physicist Steven Koonin, suggests, these projections reflected only highly improbable worse case scenarios based on such things as ever growing coal usage and no significant technological improvement.

Who pays for environmental virtue?

The gilets jaune revolt begs the issue: who pays to save the planet? The Paris accords absolved the very countries driving emission increases — China and India — from mandating emissions cuts until 2030, leaving the burden largely on the backs of the West’s own middle and working classes.

Yet many of these people need fossil fuels to get to work or operate their businesses. Tourists may gape at the high-speed trains and the Paris Metro, but the vast majority get to work in cars. More than 80 percent of the Paris metropolitan area population lives in the suburbs and exurbs, in an area nearly the size of Connecticut and Rhode Island combined.

Like the revolutionaries of 1789, people are enraged by the hypocrisy of their betters. In pre-revolutionary times, French aristocrats and top clerics preached Christian charity while indulging in gluttony, sexual adventurism and lavish spending. Today they see the well-off and well-connected buying their modern version of indulgences through carbon credits and other virtue-signaling devices. Meanwhile, as many as 30 percent of Germans and as many as half of Greeks are spending 10 percent or more of their income on energy, the definition of “energy poverty.” This is occurring while these policies prove sadly ineffective in reducing emissions while the much disdained US leads the large countries in cuts.

Is there a Third Way?

In California the zealous apparatchiks of the Air Resource Board are working overtime to make life worse for most residents — even though the state since 2007 has trailed 35 states in emission declines. California’s gains are further clouded by the fact that the state exports its pollution to other states as well as overseas. And the fires, which produced massive emissions, were made much worse by state’s mismanaged forest policies — and those imposed on federal lands by environmental groups. (Just because Trump says something doesn’t make it de facto untrue).

Ultimately politics may force a shift in these policies. Unlike China, people in democracies sometimes fight back against their governments. Already political leaders in Alberta and Ontario have broken with federal climate policies seen as hurting their provincial economies. In the US many states, including left-leaning Washington and Colorado, rejected such things as carbon taxes and bans on oil drilling, in part due to concerns over energy bills.

Like Macron and leaders elsewhere, the woke folks running California may not escape a citizen rebellion forever. There’s already a major lawsuit against climate policies brought by 200 veteran civil rights leaders on behalf of mostly minority working class voters. In the trial deliberation Attorney General Xavier Becerra has all but admitted that the state does not consider class or race as relevant in climate policies which may not play so well with that part of their own political base.
Hopefully grassroots pressure will shift the policy agenda. Already some environmentalists are approving of trimming the forests. Others are proposing more expenditures on resiliency — coastal walls, dispersed power systems, better storage of water — to meet the challenges presented by climate change.

The world, California included, needs to respond to the climate challenge with a pragmatism based on realism and respect for citizens’ aspirations. No democratic society can be expected to openly impose a radical decline in living standards; that has already been made clear in France, and may be shape politics here in the US, and even here in California, for years to come.

This piece originally appeared on The Orange County Register.

Joel Kotkin is executive editor of NewGeography.com. He is the Roger Hobbs Distinguished Fellow in Urban Studies at Chapman University and executive director of the Houston-based Center for Opportunity Urbanism. His newest book is The Human City: Urbanism for the rest of us. He is also author of The New Class Conflict, The City: A Global History, and The Next Hundred Million: America in 2050. He lives in Orange County, CA.

Photo: Obier [CC BY-SA 4.0], from Wikimedia Commons

2018 Standard of Living Index

$
0
0

The Center for Urban Opportunity (COU) has developed a measure (the “COU Standard of Living Index”) that estimates the purchasing power of real average pay in metropolitan areas compared to that of the average employee who moves to a new residence. We have found that the places that return the most for median pay are varied. Some, like leaders San Jose, Boston and Seattle come from the ranks of high-priced places that deliver even better pay. But most are decidedly in the heartland, led by Durham, North Carolina, Houston, Detroit, Atlanta and Charlotte, where lower costs meet relatively lower pay.

Read or download the full report here.

Wendell Cox is principal of Demographia, an international public policy and demographics firm. He is a Senior Fellow of the Center for Opportunity Urbanism (US), Senior Fellow for Housing Affordability and Municipal Policy for the Frontier Centre for Public Policy (Canada), and a member of the Board of Advisors of the Center for Demographics and Policy at Chapman University (California). He is co-author of the "Demographia International Housing Affordability Survey" and author of "Demographia World Urban Areas" and "War on the Dream: How Anti-Sprawl Policy Threatens the Quality of Life." He was appointed to three terms on the Los Angeles County Transportation Commission, where he served with the leading city and county leadership as the only non-elected member. He served as a visiting professor at the Conservatoire National des Arts et Metiers, a national university in Paris.

Photo by Smithfl [CC BY-SA 3.0 or GFDL], from Wikimedia Commons

By Law, California High Speed Rail May Be Doomed To Fail

$
0
0

It has been 10 years since passage of California Proposition 1A the High-Speed Rail Act that approved the $9.95 billion bond, a down payment on a high-speed rail project that was optimistically estimated by proponents at that time to cost $40 billion. Today, the California high-speed rail cost may approach $100 billion. Public enthusiasm is obviously dwindling.

Supporters of the Los Angeles-to-San Francisco high-speed rail line hope that erecting part of the line now will make future governors less likely to abandon the project. The entire 800-mile line is scheduled for completion by 2033. There is no shortage of obstacles to what even the project’s biggest boosters call an ambitious timetable, including the engineering challenge of tunneling through the Tehachapi Mountains, a seismically active barrier between the Central Valley and Los Angeles.

In addition to the continuous cost overruns and schedule delays, by law, the State will not operate the train, nor subsidize its operation. Once built, the State will seek an operator of the completed project, through competitive bidding. State law says that the system MUST OPERATE WITHOUT A TAXPAYER SUBSIDY, but according to a Reason Foundation study, there are more than 100 bullet trains worldwide and except for the one or two that operate profitably, all require subsidies, thus the end results for California’s high speed rail is that it will most likely necessitate taxpayer subsidies or higher fares per mile, or both.

Beginning construction without all of the financing in place represents a strategic gamble by the rail authority, and by Governor Brown, that once enough work is completed, future leaders may be intimidated to abandon the project and leave a landscape of unfinished pillars, viaducts, bridges and track beds. Faced with reduced resources, the authority has altered its plans, and is now focused on finishing a 119-mile stretch of track from Bakersfield to Madera by 2022.

The continued delays and rising costs have fueled criticism that California, perhaps the most prosperous state in the nation, is squandering money on a transportation project that critics describe as a prime example of big government waste in a state controlled by Democrats.

For all the construction, the project faces the ever-present threat that a future governor may decide that state resources would be better used dealing with, to name one example, the housing, homeless and poverty crisis. Governor Jerry Brown, a big proponent, is leaving office at the end of the year.

The coastal elites who support “going to green electricity” at all costs just don’t care that the working poor and struggling middle class living away from California’s coast are bearing the brunt of higher energy costs. “Clean electricity” doesn’t run the military, airports, cruise liners, supertankers, ports, and transportation industries, nor does electricity produce 6,000 products from petroleum that are used by every infrastructure, that are made from the chemicals and by-products that are manufactured from crude oil. The inconvenient truth about AB 32 the Global warming initiative, as well as Cap and Trade and its extension to 2030, is that we now have higher gasoline prices and higher electricity costs.

Since our state has the worst poverty rate in the nation where 1 out of 5 California families are barely hanging on, it’s hard to understand the time and effort being extended on the subject of the emissions crusade that is obviously negatively impacting our poverty and homeless populations.

Driving or flying from a multitude of airports can be done at virtually any time of day, but the inflexibility of how many train departure times would be available from a limited number of trains would impact the convenience factor offered by cars and planes and thus also adversely affect train ridership. The snowballing effect of lower ridership would be higher fares for those that do use the train as there would be no state subsidies available. Lower ridership would further impact the ROI risks for invested capital.

Just like the land line phones that have become obsolete as a result of cell phone technologies, future travel needs may be impacted in the coming decades as a result of the ever growing virtual world for office workers and online classes for students. There is also a rise of alternatives to both private automobiles and public transit, such as Uber and bicycling, and the coming evolution of driverless vehicles.

The latest business plan of completing a high speed rail between San Francisco and Los Angeles that cannot be subsidized by law is essentially a going-out-of-business plan that is discussed in a Reason Foundation Due Diligence Report.

However, once the high speed rail is ever operating, and the realization that subsidizing funds may be required to augment ridership income, future leaders will be loath to walk away from the $100 billion project and you can bet on it that Californians will be further burdened with subsidizing costs, or some form of greenhouse gas offsets paid for by businesses to pay for the trains operation!

This piece originally appeared on CFACT.

Ronald Stein is Founder and Ambassador for Energy & Infrastructure at PTS Advance, a technical staffing agency headquartered in Irvine.

Reinventing the Rust Belt in Kokomo

$
0
0

I’ve written about Kokomo, Indiana before and also posted a podcast with its mayor. It’s a small manufacturing city in Indiana, far from glamorous and with its own set of challenges, that has been seeking to reinvent itself for the 21st century. My latest City Journal article is a look at Kokomo and what it’s been up to.

"Today, Kokomo is in the midst of a multiyear transformation that’s dramatically reshaping it. Downtown is home to new co-working spaces, retailers, restaurants, and a brewery. More than 200 upscale apartments have been built across several developments, along with new senior housing and upgraded public-housing developments. Renovators are working on single-family homes in near-downtown neighborhoods. The city is expanding parks, trails, and bike lanes, and has built a downtown baseball stadium, home to a collegiate summer-league team. Every stoplight was removed from the core of downtown, every one-way street converted to two-way, and numerous intersections were redesigned with attractively landscaped pedestrian-friendly bump-outs and decorative flower-planters on streetlights. There’s a sparkling new YMCA, a central parking garage, new firehouses, and a refurbished city hall. After several decades without public transit, the city restarted bus service, which now operates five routes, all fare-free.

The catalyst for all this change has been Mayor Greg Goodnight, in alliance with the Chamber of Commerce, the school corporation, and other community groups. Goodnight is arguably the most dynamic Democratic politician in Indiana. He’s a union blueblood—he was previously president of the local United Steelworkers, and his father was formerly the regional president of the Teamsters. But he’s also a fiscal hawk who has tussled with local public-employee unions, including a bruising multi-month standoff with the firefighters. And he’s a strong proponent of creative-class-style place-making as well. Goodnight, who does not hold a college degree, gave himself a master class in urbanism by reading classics in the field from authors including Jane Jacobs, Edward Glaeser, and Jeff Speck. Books on cities line the shelves behind his desk, and he’s internalized them better than many planners. Kokomo’s infrastructure projects, in particular, are well designed, with great attention to detail. Goodnight’s leadership is arguably the model of the working-class/creative-class, blue-collar/white-collar synthesis that many believe we need today."

Click over to read the whole thing.

This piece originally appeared on Urbanophile.

Aaron M. Renn is a senior fellow at the Manhattan Institute, a contributing editor of City Journal, and an economic development columnist for Governing magazine. He focuses on ways to help America’s cities thrive in an ever more complex, competitive, globalized, and diverse twenty-first century. During Renn’s 15-year career in management and technology consulting, he was a partner at Accenture and held several technology strategy roles and directed multimillion-dollar global technology implementations. He has contributed to The Guardian, Forbes.com, and numerous other publications. Renn holds a B.S. from Indiana University, where he coauthored an early social-networking platform in 1991.


Black Exodus From Chicago

$
0
0

I'm the oldest of three siblings. My siblings left the Rust Belt for the East Coast; my sister and her family are in suburban Washington, D.C., and my brother's family lives in Brooklyn. Both have been encouraging me for years to make the leap and join them. I stay in touch with friends and other family from my birthplace of Detroit and my current hometown of Chicago via Facebook, and they have fanned throughout the country -- Atlanta, Los Angeles, Las Vegas, Phoenix, Denver, Dallas, Houston.

I stayed in Chicago, the capital of the Rust Belt. I love it here and despite its flaws, I love what it is and what it can be. I believe in Chicago. I believe in Detroit too. But I also recognize that the outmigration of black residents to other cities is part of a growing pattern among black Rust Belt residents. There is indeed a black Rust Belt diaspora.

Black population loss in Chicago is substantial but has received scant attention. In the city alone the black population has dropped 8.9% since 2010, and almost 25% since 2000. Blacks were once the largest racial/ethnic group in Chicago, but are now second behind whites; blacks are close to being surpassed by Latinos. In the entire metro area, black population is down about 5%.

This wouldn't be a concern, necessarily, if population declines were evident across the board. But they're not. Outside of African-Americans Chicago's city and metro population have steadily, if slowly, grown over the same period. The American Community Survey shows Chicago growing by just 0.77% between 2010 and 2017, the lowest of the ten largest cities. The next lowest is Philadelphia, at 3.6%. The same is true at the metro level. Chicago added just 0.76% to its population between 2010 and 2017, with Philadelphia the next lowest at 2.2%.

Chicago's differences become even clearer when looking at this in a chart. Here's how Chicago's black population loss compares with the ten largest cities:

And here's how it compares among the ten largest metro areas:

Oddly, the only comparable places at the city level are Los Angeles, San Diego and San Jose, California cities with far different demographics and economies. At the metro level, only Los Angeles is comparable. I haven't pulled the data, but I suspect a similar phenomenon is evident in other Rust Belt cities like Cleveland, Milwaukee, Detroit and St. Louis, and to a lesser extent in cities like Indianapolis, Minneapolis, and Pittsburgh.

Where are blacks going? Mostly to Sun Belt metros, in particular their suburbs. Despite what my siblings did, blacks aren't necessarily following the larger trend of relocating to the nation's growing global cities.

Why are they leaving the Rust Belt? There's at least three theories as to why:

• Conditions in many Rust Belt cities have deteriorated to the point (high crime, poor schools, moribund economies, etc.) that blacks are giving up on the Rust Belt.

• A related theory is that Rust Belt metro economies are in the midst of a makeover, and are jettisoning off much of the labor that would've been manufacturing workers in an earlier time. And the service sector hasn't yet added enough jobs at comparable wages to fill the gap.

• A third theory is that today's black middle class Rust Belt residents are simply following the same pattern that other Rust Belters established in the '80s and '90s.

In a sense this is reminiscent of the Great Migration, when blacks migrated from South to North in search of better opportunities at the beginning of the twentieth century. Not only were blacks looking to escape violence, but the South in general was in a state of economic stagnancy that lasted from the end of the Civil War until the end of World War II. Only in the second half of the twentieth century did the South begin to right itself and become a stronger region economically. A similar transition may be happening in reverse today.

I'm concerned, however, that this could have more dire economic impacts for today's middle class blacks than for the earlier Sun Belt trailblazers. We're seeing greater concentration of wealth within the superstar global cities, as they've been able to reverse their decades-long population loss trends. They're doing better than their suburbs. In some respects today's Sun Belt metros are comparable to the suburbs of the global cities; doing well but not keeping pace with the change taking place in the city core. They may find themselves on the outside, looking in.

It leads to a legitimate question with no real answer: are blacks moving to new spaces with greater opportunity, or moving away from their next best shot at it?

This piece originally appeared on The Corner Side Yard.

Pete Saunders is a Detroit native who has worked as a public and private sector urban planner in the Chicago area for more than twenty years. He is also the author of "The Corner Side Yard," an urban planning blog that focuses on the redevelopment and revitalization of Rust Belt cities.

Photo credit: travelers.com

Suburbs & Exurbs Continue to Dominate Metropolitan Growth at Mid-Decade

$
0
0

America’s suburbs and exurbs continue to receive the most population growth among the 53 major metropolitan areas. This is indicated by data in the just released 2013-2017 American Community Survey (ACS), which provides a mid-decade snapshot of US demography. With its middle sample year of 2015, the 2013-2017 ACS is most representative of the middle of the decade between the 2010 and 2020 censuses (Note 1).

The 2013-2017 ACS data indicates that 89.8 percent of the major metropolitan area growth since the 2010 census has occurred in the suburbs and exurbs (Figure 1), which include three City Sector Model categories, the Earlier Suburbs, Later Suburbs and Exurbs (Note 2). This essentially follows the pre-existing pattern, which was detailed in the four previous annual analyses.
The 2013-2017 data indicates that 85.5 percent of the major metropolitan area population is suburban or exurban (Figure 2). This is an increase from 85.3 percent in 2010. The urban core share of major metropolitan area population dropped from 14.7 percent in 2010 to 14.5 percent in 2013-2017.

Only 10.2 percent of the major metropolitan growth was in the urban core, which includes the City Sector Model CBD (central business district) and its adjacent Inner Ring. Between 2010 and 2013-2017, the suburbs and exurbs added population at a 1.05 percent annual rate, 50 percent greater than the 0.70 annual rate in the urban core.

Even so, the major metropolitan areas (over 1,000,000) have nearly all of the nation’s urban core population. An analysis of ACS 2012-2016 data indicated that the share of population in the urban cores of metropolitan areas between 500,000 and 1,000,000 was only 4.2 percent, less than one-third of the major metropolitan area percentage. Moreover, the urban cores of these somewhat smaller metropolitan areas declinedin population overall from 2010.

City Sector Trends

The population and market share trends among the five City Sector Model categories are indicated in Figures 3, 4 and 5.

The estimates indicate that the largest population growth has occurred in the Later Suburbs (generally outer suburbs), which added 4.25 million residents from the 2010 census to 2013-2017. The Earlier Suburbs (generally inner suburbs) added 2.5 million residents and the exurbs added 1.5 million. Smaller gains occurred in the Urban Core: Inner Ring, at 0.81 million and the Urban Core: CBD, at 0.11 million.

The only sector to gain in its share of the population was the Later Suburbs (Figure 2), which with 46 percent of the metropolitan area growth was well ahead of its 28 percent share in the 2010 census. The Exurbs had 16 percent of the growth from 2010 to 2013/2017, equaling their 2010 population share. The Earlier Suburbs, however fell far short of their population share, adding 27 percent of the new residents, compared to their 2010 share of 41 percent (Figure 6).

The Later Suburbs grew at an annual rate of 1.70 percent. This is 70 percent greater than the overall rate of 1.01 percent and more than 80 percent higher than the 0.93 percent increase in the Urban Core: CBD. All sectors except the Later Suburbs grew more slowly than the overall major metropolitan area rate, though the Exurbs grew nearly as fast (Figure 7).

New York and the Rest

The population growth in the suburbs and exurbs was so pervasive that only one urban core had a greater increase than the suburbs and exurbs --- the New York metropolitan area. Nearly three quarters of New York’s growth was in the urban core, leaving only 25 percent in the suburbs and exurbs. New York has by far the largest and densest urban core in the United States, though the density of its overall urban area ranks behind Los Angeles, San Francisco and San Jose. New York has 40 percent of the nation’s transit ridership, much more than its seven percent of the nation’s population --- and the overwhelming majority of that traffic is oriented to the urban core, not the suburbs and exurbs. The uniqueness of New York’s urban core has never been replicated in any of the other major metropolitan areas, despite frequent envious proposals on the part of many officials and others.

Only two other major metropolitan areas had 30 percent or more of their growth in the urban core--- Boston, at 42 percent and Philadelphia, at 36 percent. The other 49 major metropolitan areas averaged only four percent growth in their urban cores, less than one-half the overall average growth rate (Figure 8). Generally, urban core growth was the exception, as only 16 of the 53 major metropolitan areas had population gains in their urban cores.

The predominant trend continues. At least since World War II, most population growth has been concentrated in the suburbs and exurbs. Despite all the blather and pronouncement about a “back to the city” wave, things have not changed very much overall several decades.

Note 1: The ACS 2013-2017 is the most current release of the ACS 5-year product, which is released annually. It is the result of equally weighted surveys taken in each year from 2013 through 2017. Thus, characterizing results from the 2013-2017 ACS as 2017 data is inappropriate, since 80 percent of the data was collected in years before 2017. The middle year of the 2013-2017 release is 2015, making it the most representative mid-decade sample for the smaller geographies not reported in the annual sample, such as census tracts and zip codes (as used in the City Sector Model. This includes zip codes, which are used in the small area analysis produced by the City Sector Model (Note 2).

Note 2: The City Sector Model classifies small areas (ZIP codes, more formally, ZIP Code Tabulation Areas, or ZCTAs) in metropolitan areas in the nation based upon their function as urban cores, suburbs, or exurbs. The criteria used are generally employment and population densities and the extent of transit use versus car use (Figure 9). The purpose of the urban core sectors is to replicate, to the best extent possible, the urban form as it existed before World War II, when urban densities were much higher and a far larger percentage of urban travel was on mass transit. The suburban sectors replicate the automobile-oriented suburbanization that began in the 1920s and escalated strongly following World War II. The suburban areas are largely within the continuous built-up urban areas, while the exurban areas are generally in the metropolitan areas, but outside the built-up urban areas.

Wendell Cox is principal of Demographia, an international public policy and demographics firm. He is a Senior Fellow of the Center for Opportunity Urbanism (US), Senior Fellow for Housing Affordability and Municipal Policy for the Frontier Centre for Public Policy (Canada), and a member of the Board of Advisors of the Center for Demographics and Policy at Chapman University (California). He is co-author of the "Demographia International Housing Affordability Survey" and author of "Demographia World Urban Areas" and "War on the Dream: How Anti-Sprawl Policy Threatens the Quality of Life." He was appointed to three terms on the Los Angeles County Transportation Commission, where he served with the leading city and county leadership as the only non-elected member. He served as a visiting professor at the Conservatoire National des Arts et Metiers, a national university in Paris.

Photograph: Chicago’s Gold Coast, dominated by the 100 story John Hancock Tower (by author)

Texas’ New Hipsters Threaten the Very Environment That Lured Them There

$
0
0

The prospect of a purple and eventually blue Texas thrills progressives who see the Lone Star State as the key to their drive for post-Trump domination. Before draining their champagne glasses and filling their bongs, the coastal crowd should sober up enough to consider what happens if the Texas miracle comes to an end.

Many Republicans, meantime, have come to consider Texas their sovereign territory, a deeply conservative place where even Democrats were generally pro-business and growth was the prevailing religion. This last election ended what remained of that hallucination. In virtually every big metro—the increasingly dominant geography of Texas—the Democrats grabbed control.

In the election for Senate, the uniquely unattractive Ted Cruz lost the 25 largest counties to his challenger, media darling Beto O’Rourke, by a combined 700,000 votes. Only the hard-right remnants of small-town Texas allowed Cruz to claw out a narrow victory. Due in part to slate voting, large counties also turned control over to Democrats, as in Harris County, the home of Houston, which is now led by 27-year-old -progressive Lina Hidalgo, a 27-year-old part-time student with almost no work experience.

Several factors seem to be driving this change, including a growing population shift to large metropolitan areas, a diversifying economy and, most of all, rising migration both from abroad and from the rest of the country. This changing electorate—younger, more ethnically diverse, better educated—has shifted the state’s politics away from a Republican Party operating under the shadow of Donald Trump and his fellow travelers.

“What is our message? “asks Austin-based GOP consultant Kevin Shuvalov. “What do we stand for? Republicans don’t seem to care about anyone. This is not a winning strategy.”

Over the past two decades, Texas has enjoyed one of the greatest economic expansions in recent American history. In contrast to notions of a wide-open Texas defined by oil rigs and cattle, this expansion has been a profoundly urban one. Approximately 80% of all population growth since 2000 has been in the four large metropolitan areas: People may wear cowboy boots, drive pickups and attend the big Rodeo in Houston, but, they are, first and foremost, part of a great urban experiment.

Economic growth has driven this process. Since 1969, Texas has considerably out-performed California in terms of percentage job growth, as well as real personal income growth. Between 2000 and 2016, according to the Bureau of Labor Statistics, or BLS, Austin expanded its employment by over 50 percent, while Houston, Dallas and San Antonio grew above 30 percent, more than twice the growth of New York and three time that of San Francisco and Los Angeles.

As cities like New York, San Francisco and Los Angeles become too expensive for most millennials without trust funds to put down roots, young people are now flocking to Dallas or Houston. These new Texas urbanites are forging an increasingly vibrant design, arts and restaurant scene. They are also, on average, better educated than the average Texan, and they elevate the workforce, notes Dallas Morning News columnist Mitchell Schnurman.“If oil prices don’t go up,” he says, “Texas can always count on California—and New York, Florida, Illinois and New Jersey“ to export their talent.

Ironically, the arrival of these newcomers is changing the policy environment that created the conditions for this migration. Partly, this reflects a change in funding. Democrats of the old school, like Houston’s former Mayors Bob Lanier and Bill White, raised money from the real estate industry and other interests that also supported the GOP. The new Democratic crowd relies on massive funding from the post-industrial progressive gentry, much of it concentrated in traditional Republican-leaning areas: The fanciest areas around Dallas and Houston at election time sported many more Beto than Cruz signs. The big money, notes Shuvalov, now, as in the nation, goes to the Democrats.

O’Rourke helped drive this trend and benefited massively from it. Unlike many traditional Texas Democrats, O’Rourke ran as a standard-brand national progressive, earning him an almost embarrassing degree of adoration. The lanky El Paso Congressman is already being compared to Lincoln, counselled by President Obama and widely seen as a serious contender for the Presidency, despite what even The New York Times notes is “an absence of signature policy feats.”

At the local level, many new Democratic office-holders such as Hidalgo will likely adopt very much the national party agenda, with its emphasis on dense urbanization, climate change and racial “equity.” She has already announced that she will campaign against “sprawl,” which literally defines Houston, greater spending on trains, which have done very poorly in the area, and an agenda focused primarily on transfers to the poor. Add to that the Democratic Party’s climate-change mantra, including provisions to eliminate fossil fuels by 2030 and forbidding energy executives from serving in the White House, and you have a scenario that could devastate an economy still built largely on oil and gas.

The rest of America should care if Texas abandons its model. Without it, we will increasingly resemble European countries—like France—where all power and wealth is concentrated in the largest, densest and most established cities, while everyone else is on the outside looking in. And the country will have lost its premier safety valve for young people and families priced out of the coasts.

Unlike many New Yorkers or San Franciscans, most Texas city-dwellers are not forced to choose between having a family, with a middle-class lifestyle, and staying in a city they love. The large Texas cities, according to American Community Survey data, all rank above the national average in children per household, while New York and San Francisco sit near the bottom.

The new Texans might not like Ted Cruz (who does?) but one wonders if they would welcome a policy regime like that in California, where the middle and working classes are confronted with an ever more feudalized reality.

America can endure, and even thrive, with a New York or a California to service the rich and employ their servants. But it also needs a place for upward mobility and the chance to buy a house. If Texas stops providing that, we may be running out of dynamic states where the less than affluent can achieve their aspirations. America needs a Texas that is still Texas, not a big, flat, dry place trying and failing to impersonate San Francisco.

Texas was a place of opportunity even when it was part of Mexico as bankrupts, criminals and others looking for a fresh start headed there from the old southeastern states, leaving behind the note: “Gone to Texas.” But for most of the 20th Century, the Lone Star trailed the Golden one, with its advanced industry, perfect climate and spectacular topography, a fallback for those who no longer could afford, or find opportunity, in New York.

Today California suffers net outmigration, massive property inflation and arguably the country’s worst regulatory environment. Now it’s Texas where people are flocking; the state added 3 million people between 2010 and 2016—including 940,000 migrants from other states. In comparison, California lost more than 500,000 domestic migrants to other states and New York hemorrhaged nearly one million.

Texas now increasingly represents the urban future. Since 2000 Dallas-Ft. Worth has boosted its population by 33.6 percent, while Houston has gained 38 percent. New York, Chicago, Los Angeles and Boston grew by well under 10 percent. Austin and San Antonio, not to mention the burgeoning region between these two cities, gained people even faster.

Many of the newcomers come from places—notably California—that many Texans once migrated to. On average, in each of the past five years, more than 25,000 people left California for Texas.

Between 2000 and 2014, the Latino population grew by 39 percent in Dallas-Fort Worth, 39 percent in San Antonio, 42 percent in Houston, and by 60 percent in Austin. In contrast, Latino population growth slowed down to 8 percent in Los Angeles, 7 percent in San Francisco, 6 percent in New York and 5 percent in Chicago.

Economic opportunity explains much of the gap. The vibrant industrial and construction culture of Texas has provided many opportunities for upwardly mobile Latinos. Texas cities made up 17 of the 50 best ones for Latino entrepreneurs, by one recent measure. Boston, New York, Los Angeles and San Francisco didn’t make the top 100. More than 50 percent of Latinos in Dallas-Fort Worth and Houston own their own homes; fewer than one in four does in New York, Boston, San Francisco or Los Angeles. African Americans also do better in Texas, but by not so wide a margin.

In Texas, minorities have tended to focus on economic opportunity as key to their future. “The consensus in San Antonio,” notes former Mayor and Clinton HUD Secretary Henry Cisneros, “is all about jobs. Everything is driven by that. The idea of inclusiveness for Latinos may have started a political dialogue but now everything is focused on business and opportunity. People get along because we have the same goals.”

No one suggests Texas has been a total success at integration. Poverty levels for both blacks and Hispanics are high in inner-city Houston, Dallas-Fort Worth and San Antonio, although lower housing prices help; education levels also lag in inner-city and predominantly minority areas. Yet overall, according to Richard Florida’s “urban crisis index,” which measures such things as inequality in the 20 largest metros, Los Angeles, New York and San Francisco ranked worst while Houston and Dallas ranked 11th and 12th. The big difference is that the poor and working class there have a decent chance to achieve a middle-income lifestyle, unlike in the ultra-expensive coastal states.

Nor is growth in Texas all at the low end, as some, like Paul Krugman, have insisted. Over the past 15 years, according to the BLS, the Texas cities have experienced faster growth in STEM (Science, Technology, Engineering, and Math)-related jobs than their more celebrated rivals. Austin and San Antonio have grown their STEM-related jobs more quickly than the Bay Area, while both Houston and Dallas have STEM employment at almost twice the national average, well ahead of New York, Los Angeles, and Chicago.

Texas cities have also enjoyed faster growth in middle-class jobs, defined as those paying between 80-200 percent of the national median wage. Since 2001, these jobs have grown 39 percent in Austin, 26 percent in Houston, and 21 percent in Dallas, a much more rapid pace than in San Francisco, New York or Los Angeles. Chicago has actually lost such jobs. In critical blue-collar fields like manufacturing, New York has lost jobs since 2010, while Texas has boosted its numbers by over 7 percent, twice the rate of California.

For a few years after 2010, California could boast of exceeding Texas job growth, largely due to a weakening in oil prices and the tech boom. But now the Lone State is again greatly exceeding its coastal rivals. This year, Texas is growing its GDP at almost twice the rate of California or New York. Its personal income growth, up 6 percent in the first quarter of 2018, was the highest in the nation.

Much of the credit goes to the state’s reputation for business friendliness. Texas consistently ranks as the first or second leading locale as ranked by business executives. The tax burden has remained far lower than in New York, California, Connecticut, New Jersey, and Illinois. This explains a huge wave of corporate relocations ranging from Occidental Petroleum to Jacobs Engineering, Bechtel and, most recently, Foremost McKesson, the sixth largest firm in terms of revenue on the Fortune 500. Apple just announced a major expansion in Austin, now its second largest base in the US.

A reversal of the policies that have driven Texas’ ascendancy would be a tragedy, not just for the Lone Star State, but the nation as a whole. America needs Texas, just as it once needed New York, Chicago and Los Angeles, to serve as a beacon of opportunity and a place for people to create the second acts that have shaped our civilization.

This piece originally appeared on The Daily Beast.

Joel Kotkin is executive editor of NewGeography.com. He is the Roger Hobbs Distinguished Fellow in Urban Studies at Chapman University and executive director of the Houston-based Center for Opportunity Urbanism. His newest book is The Human City: Urbanism for the rest of us. He is also author of The New Class Conflict, The City: A Global History, and The Next Hundred Million: America in 2050. He lives in Orange County, CA.

Photo Credit: Another Believer [CC BY-SA 3.0], from Wikimedia Commons

The Next Housing Crisis

$
0
0

Little over a decade ago, the housing sector almost brought down not only the American but the world economy. Today the reprise of the housing decline will be playing a very different tune.

In the past bust, it was the fast-growing exurbs, aspirational home of the middle and working classes, that imploded, driving millions of people into foreclosure. Aided by dicey lending practices from the private sector, devastation was most precipitous in states such as California, where public policy helped drive housing prices to unsustainable levels.

This time the biggest problems emerge at the upper-end market, particularly the 80-90 percent of all new multi-family construction that is considered “luxury.” The first signs of diminished demand, and falling prices, can be seen in high-end markets such as Manhattan, San Francisco, London and Sydney, in part reflecting a fall in foreign investment, and shifting demographics that see more millennials entering prime child-bearing ages.

Southern California’s story

The Southland, ground zero for the last housing bust, may well reprise this unwanted role. Inventories are at their highest levels in six years, and prices increasingly wobbly. Perhaps the most obvious candidate for a real estate haircut is downtown Los Angeles, where, according to one study that simply examined changes in median home value, median household income and population found the highest changes in the nation.

To be sure, the once desolate downtown has seen a considerable increase in housing units, with more than 70,000 additional units planned by 2040. Yet what it has not done is emerge as a major job center; in fact, since 2010 its share of total employment in the region is no larger than it was in 2010, while the most rapid growth continues to be in newer suburbs and exurbs.

Projections of up to 30,000 new units over the next three years increasingly reflect wishful thinking, or even delusion. Mayor Eric Garcetti was warned by his own housing department chief that L.A.’s luxury-housing overkill had created a huge 12 percent vacancy rate (5 percent is considered healthy) in all housing built since 2005. Now savvy Chinese real estate website Mingtiandi is warning investors that downtown L.A. is heading for “an imminent glut of luxury condos.” Already landlords of luxury apartments in downtown are giving out free parking — and free rent, as vacancy rates have hit record levels.

The limits of social engineering

Over the past decade, largely due to the state’s climate-change policies, California has sought to stymie new affordable suburban housing. Obsessed by a desire to reduce driving, it has worked to force development into high-density locales near transit, largely in and around the urban core.

In the initial period after the last bust, this policy could boast some market logic. There remained an overhang of foreclosed homes, particularly in the Inland Empire and more remote suburb locations, and the millennial generation was only in their early 20s, an age where many feel comfortable with dense apartment living. The high-end market was further enhanced by investors, largely from Asia, who could be persuaded that Southern California would resemble their own densely settled cities.

These conditions are all changing. Millennials are now entering their 30s, and, when they can afford to, buying homes in the lower-density suburbs, where the vast majority already live. At some point settling in the much ballyhooed “tiny units” will lose appeal. Many Los Angeles inner-city communities are also increasingly concerned about being displaced from their historic neighborhoods in part due to the mayor’s willingness to ignore existing land-use regulations, almost always in favor of density developers.

Finally, the great wave of investment from abroad, notably China, is clearly slowing, exacerbated both the emerging trade conflict and that country’s massive property indebtedness. This has already undermined the apartment market in Sydney and could also hit those parts of the Southland, like downtown, Irvine or the San Gabriel Valley, dependent on foreign buyers willing to pay high prices.

Taking advantage of a crisis

For millions of homeowners, a housing decline is less than good news. House value represent the key asset for many middle- and even working-class Californians. Yet at the same time, any reduction of prices would open opportunities for those — notably millennials, minorities and immigrants — who are now largely frozen out of the market.

Certainly the current policies are not helping most Angelenos, who have suffered a decline in high-paying jobs, soaring rents and one of the highest poverty rates among the largest U.S. cities. In Richard Florida’s “new urban crisis index,” which measures income growth, poverty and housing costs in our 20 largest metros, Los Angeles ranked at the top, followed by New York, San Francisco and San Diego.

Even better, a reduction in prices, or even a slowdown in increases, might suggest to some a need to rethink our housing policy. We are already chasing millennials away, helping make this unique state, despite our unmatched attractions, among the least favored places for relocating people. If a housing downturn leads to a reassessment of policy, it might even be worth it.

This piece originally appeared on The Orange County Register.

Joel Kotkin is executive editor of NewGeography.com. He is the Roger Hobbs Distinguished Fellow in Urban Studies at Chapman University and executive director of the Houston-based Center for Opportunity Urbanism. His newest book is The Human City: Urbanism for the rest of us. He is also author of The New Class Conflict, The City: A Global History, and The Next Hundred Million: America in 2050. He lives in Orange County, CA.

Photo: An apartment building in downtown Los Angeles. OZFAN22 VIA FLICKR

The Mask Is Off: Minneapolis Declares War on Single Family Houses

$
0
0

In a recent article published in Housing Wire (and in many other places), it was told that Minneapolis will abolish single family housing as part of the Metropolitan Councils 2040 plan. Much of the reason seems to be based on the idea that people in single family homes are discriminating against minorities and the poor, who can only afford apartments, although of course many people of color own homes, or would like to.

Yet, it is not at all reasonable to assume that new high density multi-family housing will fulfill the expectations of the social engineering crowd. And at the same time, it may weaken the very strong community and neighborhood structure that has made Minneapolis such an appealing place.

When I moved to Minneapolis in 1983 from Dallas and Houston, (and originally from Detroit), I was amazed at the lack of blight. Living in the Detroit area, you can drive for hours south of 8 Mile Road and not see affluent well kept neighborhoods – just blighted areas that resembled leftovers from a war zone. Yet, drive for hours around Minneapolis – a city similar in age to Detroit, and you would be hard pressed to find any area that could be considered even remotely downtrodden.

Coming from Detroit and later from Houston, there was a racial undertone to both. Yes, things have improved over the decades but the divide still remains. This underlying racism was something I hated about living in Detroit, and to a lesser extent in Houston. In 1983, when I moved to Minneapolis, the racism seemed almost non-existent at the time, but back then the city was mostly white Nordic-Germanic of populous.

In Detroit, the wealthy flashed their success in their clothes, cars, and homes, and those that cannot afford such luxuries sometimes felt compelled their credit as a way of financing the appearance of being a ‘class above’. This too always bothered me. When I moved to Minneapolis, the person passing in an old Pontiac and conservatively dressed could be a janitor or CEO of a major corporation. Yes, they probably lived in a Lake Minnetonka Mansion, but did not likely flash their wealth as in other cities. This also was refreshing.

When we wrote the chapter in our book titled Prefurbia on redevelopment of blighted cities, we were going to take some local pictures but could not find a single area that could be described as blight. Instead, I used pictures that I took in Detroit!

Of course, the city has changed since I’ve moved here, it’s less ‘white’ and more racially mixed, but the areas of concentrated poverty are still very low for a major city.

Minneapolis’ problem is not that there are too many single family homes – it’s that the real estate prices are too high to justify low density redevelopment. Allow me to explain. If a developer wanted to re-develop a 10 acre area in Detroit, they would pay almost nothing for the land. Not so in Minneapolis. Because there is no such blight, even the land under the worst existing homes would cost at least $100,000 to buyout each existing home – possibly more. Assuming that the 10 acres in Detroit or Minneapolis would be in a tight ‘urban grid’ layout, about 40% of that 10 acres would be in the form of street and right-of-ways as well as easements. Assuming that in both cases, the right-of-ways and easements could be abandoned – much of that area could in theory be recaptured to create a more cohesive ‘neighborhood’. e can also assume the city grid would be at a density about 5 homes to the acre. So, 10 acres X 5 = 50 homes x $100,000 = 5 million dollars for the Minneapolis site vs. $5 for the blighted Detroit land.

In the Detroit situation, you can ‘in theory’ keep the overall density the same (50 single family homes) and apply advanced land planning models to have far less infrastructure consuming the land, and have a fantastic neighborhood without any raw land costs, leaving single family density financially feasible.

In Minneapolis the $5 million land cost is increased by demolition of the existing structures, all passed onto the next buyers or renters. So, at 5 homes per acre, that acre of land at best will be somewhere north of ½ million dollars per acre. Put another way, to maintain single family validity, if you are buying a $100,000 home (that would be in the worst neighborhoods), and 1/4th of a new home is typically a finished lot, at minimum you would need to replace that home with a $400,000 home. That would make no sense – not in downtrodden areas at least. These Minneapolis lots are small to begin with, so replacing single family with duplex won’t make much of a dent financially. Building code in Minneapolis won’t allow attached housing of the past where a thin common wall separated the adjacent unit. Today, the builder must construct what is essentially two exterior walls with airspace between adjacent units for duplex and townhomes, so why not separate the units and build somewhat high density single family instead? The only way to economically justify redevelopment in an area of high raw land cost would be high density vertical growth.

As a result, there might be justification of higher density redevelopment, but then there is the reality that the tens of thousands of apartments sprouting in the Minneapolis metro area are anything but ‘affordable’. Possibly because land is terribly overpriced here, or maybe because you cannot replicate the cheapness of older high density because of today’s building codes. Finding affordable rents in newly built apartments is elusive – unless part of subsidized programs.

But there is another more important issue – these multi-story apartments being built have absolutely no architectural uniqueness. When someone designs a single family home in a horizontal single family neighborhood, architectural character matters, but not nearly as much as a mid-rise apartment which takes on a vertical visual massing. There is a responsibility of any development going vertical to create landmarks – not repetitious mundaneness. Looking at every single apartment building rising in this city – they appear to be designed by the same person. In a way they are. They simply press a button in their Revitt, and ‘typicals’ appear to quickly design these monuments. Point the mouse and pick a unique color to give the building something different than the one sprouting down the street. Where did architectural talent go?

One architect friend said to me, this software is great – just replicate the unit, and then flip it on the other side of the hallway and you quickly create an apartment building – isn’t this stuff wonderful? Well, isn’t the architect being paid a hefty percentage of the construction costs?
So now we can have more repetitious apartments few can afford --- is this progress?

Lastly, there’s a larger concern. A person’s pride. Progressives, and even some Wall Street types, seem to think home ownership is outdated. Is an apartment corridor a proper place for kids to play vs. a private rear yard? Is the ‘working class’ supposed to live in apartments, take the bus, and be thrilled with their position in life, or hope to strive for more – the American way of living. When did Minneapolis become the third world city, relegating the working class to riding the bus (or light rail) and living in towers? Why have such an agenda? I’ve been dirt poor – more recently during the recession when our only luxury was the $5 Sunday morning movie. But we did not lose our home – a source of significant equity if we had to fall back on it. Renting an apartment for $2,000 a month on the fifth floor builds no equity for a typical four person family – having a single family home, even one in a cheap neighborhood at a minimum instills a sense of self-worth and builds at least some equity.

The 2040 plan makes some financial sense, but no social sense. You want racial equity – you want the diverse races to be in single family homes, not packed in like sardines in a mundane high priced mid-rise. American cities should be about aspiration, not forcing people to live like peons permanently. Isn’t the message in itself racist and opposed to our concept of upward mobility?

Rick Harrison is President of Rick Harrison Site Design Studio and Neighborhood Innovations, LLC. He is author of Prefurbia: Reinventing The Suburbs From Disdainable To Sustainable and creator of LandMentor. His websites are rhsdplanning.com and LandMentor.com

Photo: Via Flickr by edkohler, using CC License.

Viewing all 3788 articles
Browse latest View live


Latest Images