Quantcast
Channel: Newgeography.com - Economic, demographic, and political commentary about places
Viewing all 3794 articles
Browse latest View live

California's Dense Suburbs and Urbanization

$
0
0

Many observers think California urban areas are more geographically expansive ("lower density" or to use the pejorative term, more "sprawling") then those elsewhere in the nation, especially the Northeast Corridor, which runs from the Washington DC metropolitan area through Baltimore, Philadelphia, New York, Hartford, Providence to Boston. This obsolete view is a leftover from the pre-automobile city of more than a century ago, when the largest American cities (metropolitan areas) had far higher urban densities, smaller suburban expenses, and no cars. Then, the principal method of urban mobility was walking, though transit had a virtual monopoly on motorized mobility.

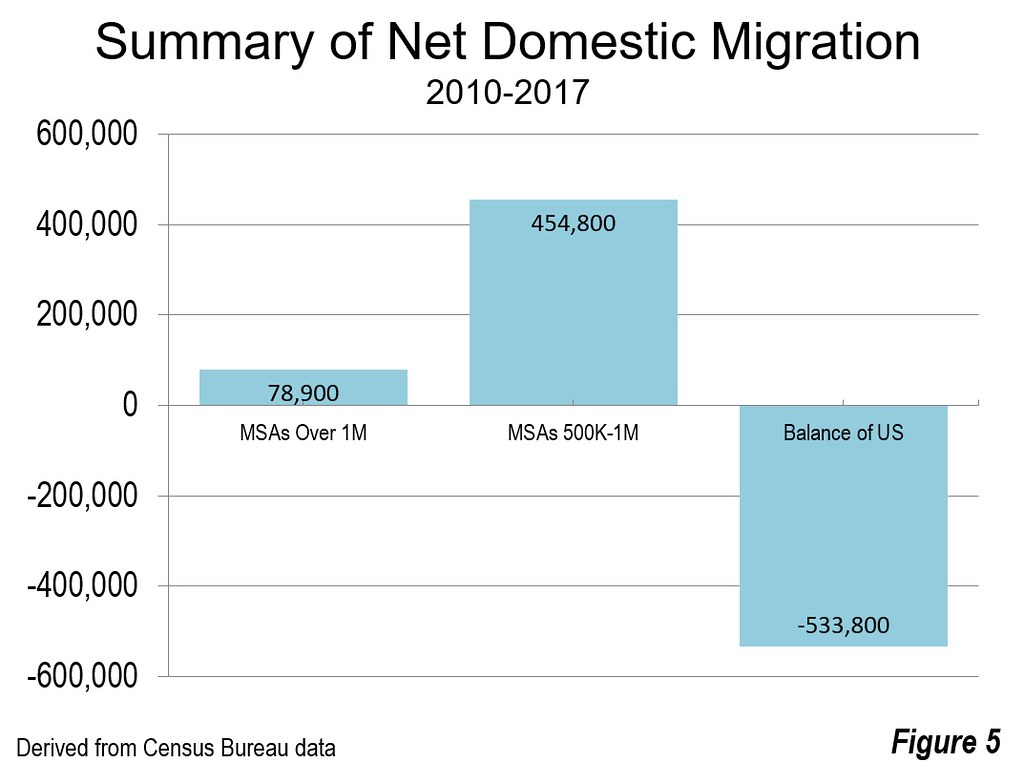
During the 1920s, automobiles began to dominate and automobile oriented suburbization had its early beginnings. In 1930 there were 90 motor vehicles in the United States for each 100 households. Now, more than 85% of the 53-major metropolitan area (over 1 million population) residents live in the suburbs (or exurbs), leaving less than 15% in the urban cores, according to the City Sector Model, which differentiates between urban cores and automobile-oriented suburbs (Figure 8). The suburbs are even more dominant in California, with 91 percent of major metropolitan area residents.

Still, there is a widely held view that California's urban areas are less intensively developed than others around the country, especially in the Northeast Corridor. Indeed, some urban cores resembling the pre-automobile cities remain in the Northeast Corridor. Yet, these urban cores are vestiges of another era, surrounded by suburbs that are nearly as automobile oriented as the suburbs of dispersed metropolitan areas such as Orlando, Phoenix or Portland.

California’s Dense Urban Areas and Suburbs

Population densities have plummeted so much that today Boston’s overall urban density (including its dense urban core) is only 2,200 per square mile, less than one third that of Los Angeles, often seen as the very definition of "sprawl." Even more remarkable, the Boston urban area covers more land area than Los Angeles, according to the Census Bureau. If Los Angeles were populated at the urban density of Boston, only 3.9 million residents would have been counted in the 2010 Census, instead of the actual 12.1 million.

The Los Angeles urban area, as well as San Francisco and San Jose urban areas are also denser than New York. In 2010, New York had 51 percent more residents, but covered 99 percent more land area. The high suburban density of Los Angeles is illustrated by the photograph above, which is of the Ontario and Upland area, bisected by the San Bernardino Freeway (Interstate 10), approximately 35 miles east of downtown Los Angeles.

This analysis that follows analyzes the urban densities within the principal urban areas of the major metropolitan areas, using the City Sector Model.

Comparison of California Urban Areas to Other Regions

For this analysis, a tailored set of geographical regions has been selected for comparison to "Coastal California," which includes the Los Angeles, San Francisco, San Diego and San Jose urban areas. Because of the concentration of some of the nation’s largest metropolitan areas, including four of the transit legacy cities (New York, Philadelphia, Boston and Washington, municipalities that comprise 57 percent of the nation’s transit commuting destinations, but only seven percent of the jobs) the Northeast Corridor is also analyzed. These four metropolitan areas include four of the nation’s six largest downtowns (Central Business Districts). The Northeast Corridor also includes Hartford and Providence.

The other three regions include one that encompasses the entire Midwest as well as three metropolitan areas over the Appalachian Mountains from the Northeast corridor (Pittsburgh, Buffalo and Rochester). Another is the South, but excludes Washington and Baltimore, which are in the Northeast Corridor. The last region is the West, which excludes coastal California though does include Riverside – San Bernardino and Sacramento in California.

Coastal California: Much Denser than the Northeast Corridor

Figure 1 compares the urban core, suburban and overall urban densities by the regions delineated above. The Exurban category is excluded, because it is virtually all outside the principal urban areas (Note). Perhaps surprisingly, the urban core population density in Coastal California nearly equals that of the Northeast corridor while the suburban density of Coastal California is more than double that of the Northeast Corridor. The overall urban population density of Coastal California is at least 60 percent higher than the urban areas of the Northeast Corridor.

The urban core, suburban and overall urban densities in Coastal California are well above the densities of each of these categories in the other three regions.

Moreover, despite their reputation for high density, the urban areas of the Northeast Corridor are only a little more densely populated than those of the Middle and East and the South. Perhaps more surprisingly, the suburbs of the West, excluding Coastal California, are at least 15% more densely populated than in the urban areas of the Northeast Corridor.

A more detailed examination is provided in Figure 2, which compares densities among the Earlier Suburbs and Later Suburbs. The New York urban area is broken out of the Northeast Corridor, to illustrate the fact that California suburbs are considerably denser --- nearly 90 percent ---- than those of the nation's largest urban area. In addition, the population density of both the Earlier Suburbs and Later Suburbs are also higher in the West, outside Coastal California, than in New York.

Individual California Urban Area Comparisons

Figure 3 compares individual metropolitan area urban core densities in California with those of the Northeast Corridor and for all metropolitan areas in the nation outside California. Both the Los Angeles and San Francisco urban cores are nearly as dense as the urban cores of the Northeast Corridor and about one third denser than the urban cores outside California. The urban cores of San Diego, Sacramento and San Jose are well below those of the Northeast Corridor, Los Angeles, San Francisco and outside California. This is to be expected, since each of these three metropolitan areas did not achieve significant size until after the sunset of the transit and walking era.

Figure 4 compares suburban population densities. All the California urban areas have suburban population densities higher than the Northeast Corridor. Los Angeles has suburbs that are more than three times as dense while San Jose's suburban densities are more than double that of the Northeast corridor

National Urban Density Perspective

Figure 5 illustrates the 10 densest urban cores among those with more than 100,000 population. Not surprisingly, New York has by far the highest density at nearly 23,000 per square mile. Indeed, New York represents 41 percent of the urban core population of major metropolitan areas. New York’s urban core population, at 10.3 million, is more than four times that of Chicago, which has the second largest urban core, and more than six times that of third largest Boston and fourth largest Philadelphia.

Los Angeles has the second highest urban core population density, followed by San Francisco. Other metropolitan areas such as Chicago and Philadelphia, often perceived to have higher densities, have lower urban core population densities than Los Angeles and San Francisco.

Figure 6 shows the major metropolitan areas with the 10 densest suburbs, led by Los Angeles and San Jose. Miami and Las Vegas ranked third and fourth, followed by San Diego and San Francisco. Four of the 10 densest suburban components are in California metropolitan areas, while seven are in the West.

All of California’s major metropolitan areas have more densely settled suburbs than Portland, Oregon, which is renowned for its densification policies. In addition to the four coastal metropolitan areas, all ranked in the top 10, the suburbs of Riverside-San Bernardino rank 15th, while Sacramento ranks 20th, both ahead of 23rd ranking Portland.

Figure 7 shows the major metropolitan areas with the least dense suburban areas. Birmingham, Nashville and Pittsburgh have the lowest suburban densities. Only one metropolitan area from the West, Tucson, ranks among those with the lowest suburban densities.

The Implications of California’s High Suburban Densities

Given the already elevated level of density, proposals to cram more people into already settled areas of California could worsen the quality of life. California’s high urban densities are accompanied by the worst traffic congestion in the nation and some of the worst in the world. With plans in place and more proposals to increase densities, this can only get worse. Regrettably, transit access cannot possibly substitute for auto access (see: Connecting the Dots in Los Angeles, an analysis that would be virtually the same for every other urban area in the United States). Moreover, policies that seriously limit development on the urban fringe distort the market and have already driven house prices up. That is likely to continue.

Wendell Cox is principal of Demographia, an international public policy and demographics firm. He is a Senior Fellow of the Center for Opportunity Urbanism (US), Senior Fellow for Housing Affordability and Municipal Policy for the Frontier Centre for Public Policy (Canada), and a member of the Board of Advisors of the Center for Demographics and Policy at Chapman University (California). He is co-author of the "Demographia International Housing Affordability Survey" and author of "Demographia World Urban Areas" and "War on the Dream: How Anti-Sprawl Policy Threatens the Quality of Life." He was appointed to three terms on the Los Angeles County Transportation Commission, where he served with the leading city and county leadership as the only non-elected member. He served as a visiting professor at the Conservatoire National des Arts et Metiers, a national university in Paris.

Photograph: Densely settled suburbs approximately 35 miles east of Los Angeles (Ontario and Upland), by author.


Billy Graham and the Evangelical Origins of Organized Labor

$
0
0

When I heard over breakfast that Billy Graham had died, the news ricocheted around my mind and stirred up lots of memories. The counter of George’s Diner on Coney Island Avenue in Brooklyn was just the place to begin reflecting on the surprising connection between Graham’s legacy and organized labor.

I came of age in the early 1970s during one of the high points of Graham’s influence. A friend of Richard Nixon, and rightly criticized for that relationship, Graham’s world-wide evangelistic “crusades” continued apace. In 1973, Graham preached to 3.2 million people in a series of services in Seoul, South Korea. The final service on June 3 drew 1.1 million people, most of whom had traveled to Seoul on foot to hear him. According to the Billy Graham Evangelistic Association, it was the largest crusade his team ever organized. Over the years, Graham eventually preached in 85 countries on six continents, reaching 215 million people.

I recall little of his much-lauded preaching. What caught my ear, rather, was Graham’s singular manner of invitation to come forward to receive Jesus. I can still hear the signature hymn “Just As I Am” sung by the crowd as individuals soulfully walked forward. As they did, Graham would assure the soon-to-be-converted and particularly those who had not yet made a decision that “the buses will wait.” While he made no specific reference to class, Graham’s invitation to receive the good news of Jesus was plain and unadorned, suggesting that you didn’t need to be somebody special. All you had to be was who you were and ready to receive God’s grace. In my working-class household, this was a theology everyone could work with. If the way to receive the gospel was just an old bus, so much the better that it would wait!

Neither a prosperity gospel nor a liberation theology, Graham’s message did not promise riches or a revolution, but rather an everlasting reward in heaven. Heavenly rewards have long been the promise of what IWW bard Joe Hill called “long haired preachers.” Such preachers are long on words but short on food: “You will eat, bye and bye, in that glorious land above the sky; work and pray, live on hay, you’ll get pie in the sky when you die.” American evangelicalism, with Billy Graham at the lead, thus seems an impoverished place to ponder labor issues. But according to Graham, evangelicals did not forsake labor. Rather, labor has forgotten that its very source is evangelicalism itself.

On the Sunday before Labor Day in 1952, Billy Graham preached in the Great Auditorium at the historic Ocean Grove Camp Meeting Association. Methodist ministers created this “place of respite where ‘religion and recreation should go hand in hand’” in 1869 to get away from the “stresses and pressures of society.” On that day, before the official kick-off of the presidential campaign between Dwight D. Eisenhower and Adlai Stevenson, Graham told his listeners that millions of Americans were anxiously awaiting to hear what the candidates had to say about the grave issues facing them, including the still raging war in Korea. But he also pointed to an apparent bright spot, “the laboring man and his family.” Noting the extraordinary growth of unions in the past fifteen years, he commented that “perhaps fifty to sixty million American people are directly or indirectly connected with organized labor.” Labor, Graham reminded his audience, had become a “dominant economic and political force” with “tremendous power.” He also admitted to his disappointment that church leaders were neglecting organized labor.

Graham was not simply an evangelist; he was also a consummate organizer. His advance teams would work with churches and organizations in a given city or area well before an evangelistic crusade. After Graham’s appearances, the newly converted would then be directed to area congregations while Graham and his team would move on.

Graham couldn’t understand why ministers would always direct his team to industrialists and political leaders but not to labor leaders. Yes, Graham saw organized labor as a mission field. He argued that the church “should be impartial toward the labor union as well as to other economic groups.” One should not “place halos on the heads of one group and horns on the heads of another. We must treat all with equal fairness and try to be neither pro-labor nor pro-capital.” This may seem like a surprising statement from an evangelical, but Graham’s evangelicalism was quite different from today’s Christian Right. And to be sure, Graham the organizer would not want to alienate a potential soul-mine of redeemable sinners.

But I think Graham also had something else in mind in his non-hostile view of the labor movement that day. He was attentive to history, particularly to an ecclesiastical history that traced a whole bevy of reform movements, including organized labor, to the religious revivals of the early eighteenth century. As he told his Methodist audience at Ocean Grove, who might have been eager to hear about their spiritual forebears, “you should remember that the trade union movement started as a result of a great spiritual revival. The heritage that labor unions have comes from the church and from the great Wesleyan revivals of the eighteenth century.” Graham underlines this point later in the sermon: “Our great labor unions of America today owe everything they have and are to the great revival under Wesley.” In the absence of these revivals, Graham emphasized that there “may never have been organized labor as we know it today.” Graham’s position on labor in the early 1950s was not unique among the evangelicals who spoke to social issues in those years, hard as it is to imagine how an evangelical today could be even provisionally favorable to a labor perspective.

The occasion of Billy Graham’s death reminds us that his organizing prowess helped create the evangelical era, but evangelicalism in the United States has evolved over time, with many branches that seem to be going their own ways. Evangelicals once explicitly distanced themselves from the fundamentalists to their right, despite overtures from leading fundamentalists to join them. To be sure, most evangelicals in the 1950s were pro-capital and anti-labor, as they are now. But evangelicalism fills a very capacious tent, and we should not forget those, like Graham, who saw labor as an inhabitant under that canopy.

Graham’s death calls our attention not only to his long ministry but also to the surprising range of his perspective over the years. There is plenty to criticize in Graham, and most of us would rather focus on the future rather than on this highly problematic figure of the postwar era. Yet if we take seriously Graham’s implicit instruction to pay close heed to history, we can imagine that there might be other instructive connections between working-class perspectives and religion. For a labor movement in free-fall, looking backward might be the best way to look ahead.

This piece first appeared in Working-Class Perspectives.

Ken Estey is an associate professor of Political Science at Brooklyn College and the author of A New Protestant Labor Ethic at Work. His research centers on the intersection of politics and religion with a particular focus on labor and Christianity.

Photo: Erling Mandelmann / photo©ErlingMandelmann.ch, via Wikimedia Commons

The Hippie Jesus Convergence

$
0
0

I picked up another hefty delivery of meat yesterday from one of the farmers I buy from. At various times during the year I order an entire lamb, a whole hog, or a side of beef. Today it was dozens of chickens and a few extra bundles of bacon and such. It all goes in to the freezers. The highest quality cuts become wonderful roasts or barbecue while the lesser portions are turned in to soups, stews, and stock that I pressure can in big batches. I really enjoy giving my money directly to the families that raise my food. And the quality is excellent.

As I chatted with the other customers and Farmer Craig it occurred to me that if we all lined up we would be a cartoon of the American cultural and political spectrum. Craig is a deeply religious man who lives in one of California’s rural Republican conservative strongholds. He and his wife have a special calling that compels them to take in troubled youth and provide them with a nurturing home, spiritual instruction, and practical life skills on the farm. He’s patient, earnest, and impossibly kind.

At the other end of the spectrum are the old school San Francisco lefties with “Tax the Rich” and “Keep Our Muslim Neighbors Safe” buttons who are also kind, generous, and loving – although from an entirely different perspective. In between middle-of-the-road soccer moms and at least one aging gay guy of no particular political or spiritual persuasion (cough) round out the image. Given the current political atmosphere we should all be at each other with knives. Instead, it’s all big hugs with lots of mutual respect and genuine affection.

As a nation we have multiple profound long festering overlapping predicaments that we need to come to grips with. None of the options are particularly savory. We need to roll up our sleeves and get serious. As face-to-face individuals we don’t actually have a problem with each other. But all sides of our most critical institutions are obsessed with the minutiae of their own palace intrigue. There’s a palpable reciprocal commitment by the various factions to destroy the opposition by dividing the country – at all costs. The problem is external reality is going to intervene sooner or later. This isn’t going to end well if we don’t pull together.

This piece first appeared on Granola Shotgun.

John Sanphillippo lives in San Francisco and blogs about urbanism, adaptation, and resilience at granolashotgun.com. He's a member of the Congress for New Urbanism, films videos for faircompanies.com, and is a regular contributor to Strongtowns.org. He earns his living by buying, renovating, and renting undervalued properties in places that have good long term prospects. He is a graduate of Rutgers University.

Southern California Needs A Better Marketing Strategy

$
0
0

"Southern California is man-made, a gigantic improvisation” — Carey McWilliams, Southern California: An Island on the Land, 1946

Largely invented, a semi-desert far from the metropolitan heartland of the nation, Southern California has relied on a combination of engineering genius and marketing bravado. The constructed infrastructure has become creaky, but still functions. Not so our sense of marketing our region to the rest of the world — and ourselves.

In its earliest decades, the Los Angeles region merchandised itself aggressively, but the product largely sold itself by showing off its natural beauty and uniquely wonderful climate at events like the Rose Bowl. The area’s domination of music, movies and television and its tech-based business community — notably aerospace — solidified its standing as among the world’s most vibrant regions.

Now that marketing savvy and business acumen seems largely missing. Once a magnet for migrants, both domestic and foreign, the region has become one of the leading exporters of people to other, physically less attractive places. A region that both created giant companies, and lured others here, is now increasingly devoid of powerful, locally based companies.

Read the entire piece at The Orange County Register.

Joel Kotkin is executive editor of NewGeography.com. He is the Roger Hobbs Distinguished Fellow in Urban Studies at Chapman University and executive director of the Houston-based Center for Opportunity Urbanism. His newest book is The Human City: Urbanism for the rest of us. He is also author of The New Class ConflictThe City: A Global History, and The Next Hundred Million: America in 2050. He lives in Orange County, CA.

Marshall Toplansky is Clinical Assistant Professor of Management Science at Chapman University. He is co-principal investigator, with Joel Kotkin on “The Orange County Model”, a demographic and econometric research project to identify growth strategies for that region. He is formerly Managing Director of KPMG’s national center of excellence in data and analytics, and is co-founder of Wise Window, a pioneer in sentiment analysis and the use of big data for predictive models. He lives in Orange, California.

Photo: Brian1078 [CC BY-SA 3.0 or GFDL], via Wikimedia Commons

The Evolving Urban Form: Paris

$
0
0

Probably no city inspires the romance of Paris, which has been a principal object of writers for centuries. The Paris they have written about is limited almost exclusively to the small geography of the ville de Paris, which has expanded from 1.7 square miles (4.3 square kilometers) in the 14th century to 40.5 square miles (105.0 square kilometers) in 1860, its latest annexation (Note). The ville de Paris is however, by no means all of Paris, representing less than four percent of the land in the built-up urban area, and little more than 0.5 percent of the metropolitan area.

The 19th Century Suburbanization of Paris

As late as 1800, virtually all of the population of the Paris urban area lived (550,000) within the ville de Paris according to data compiled by Tertius Chandler, in his epic Four Thousand Years of Urban Growth: An Historical Analysis. This is the continuously built up urban area (analogous to the unité urbaine, below), not to be confused with the metropolitan area or city-region, which is the labor and housing market, including areas beyond the continuous urbanization)

By 1850, however, substantial suburbanization was evident beyond the boundaries of the ville de Paris. Chandler indicates that the population of the Paris urban area had more than doubled, to 1.3 million, 250,000 of which was outside the ville de Paris.

In the last census (1856) before the annexation, the ville de Paris had nearly 1.2 million residents in 12 arrondissements (districts), which were redefined with the annexation. By far the densest was the 7th, at 230,000 per square mile (90,000 per square kilometer). Already, however, dispersion was evident. The population of the 7th arrondissement had dropped 10 percent population from the 1846 census, and had begun its decline after the 1836 census (with a modest increase over the next 10 years). Gates to the old city, such as the Pont San Martin, are still evident along the boulevards that Haussman built in the second half of the 19th century (Photo 12).

The former 7th arrondissement was generally incorporated into the western half of the new 4th. The population history of the pre-1860 ville de Paris arrondissements, and a map are here. Overall, the population density of the ville de Paris was 88,000 per square mile (34,000 per square kilometer) in 1856.

The Post-Annexation Ville de Paris

The new, larger ville de Paris had a population of 1.7 million in the first post-annexation census, 1861. This 500,000 increase indicates the substantial extent to which suburban development had already occurred, despite efforts to confine the population within the previous borders. The population from 1801 to 2018 is indicated in Figure 1, and the population density is shown in Figure 2.

The years that followed the annexation showed a continuation in the population losses of the historic core. In the new arrondissments 1 through 4, population fell from 379,000 in 1861 to around 100,000 in 2014. In the other new arrondissements inside the old Ville boundaries, the 4th through 11th, the population fell from 593,000 to 500,000. All of the growth of more than 1,000,000 was in the new 12th to 20th arrondissements, most of which includes the area annexed in 1860 (Figure 3).

All but one of the 11 arrondissements that were largely included in the pre-1860 ville de Paris lost population over the 150 plus years from 1861 to 2014. The first arrondissement dropped more than 80 percent (Figure 4).

Ville de Paris: the Huge Loss: 1921 to Today

Like many of the world’s core municipalities, the ville de Paris has lost population from its peak. From 1921 to 2018, Paris lost more than one-quarter of its population, marginally more than the city of Chicago (1950 to 2016). Other European examples lost even more, such as Glasgow (minus 45 percent), Lisbon (minus 38 percent), and even that favorite of US urban planners, Copenhagen (minus 31 percent). The largest losses among municipalities that have exceeded 400,000 population are in the United States, St. Louis at 63.7 percent and Detroit at 63.6 percent (Figure 5).

Paris: the Urban Organism

But the Paris of today is much larger than that of the novelists. Much of the impression of Paris today, in the literary world, and on the part of tourists, is limited to the incomparable core, with its distinctive architecture. Many, gazing on the Louvre or Notre Dame imagine a Paris with a cross section that looks no different. I called this “Louvre Café Syndrome,” in an early newgeography.com post. Indeed, the average Paris is no more represented by the small core of Paris than New York by the Upper East Side or London by Westminster and the City.

For the better part of the last two centuries, Paris has been far more. There are two dimensions to Paris, organism. There is the physical city, the continuous urban development that INSEE (the national statistical bureau, Institut National de la Statistique et des Études Économiques) calls the unité urbaine, Statistics Canada the population centre, the US Census Bureau the urban area and Britain’s ONS the“built up urban area.” There is also the labor and housing market, or metropolitan area, which is the functional or economic city, and also includes external areas from which large numbers of commuters travel into the urbanization.

From the 250,000 residents that lived in the suburbs of the built-up urban area, but outside the Ville de Paris in 1861, to today, the number of suburbanites has grown to more than 8.5 million. In 1861, about 80 percent of the physical city was in the ville de Paris. Now, this has been virtually reversed, with 80 percent living in the suburbs and only 20 percent in the ville de Paris (Figure 6).

In 2014, the Paris unité urbaine has 10.7 million residents in 1,050 square miles (2,845 square kilometers, for a population density of 10,100 per square mile (3,900 per square kilometer). The unité urbaine includes 412 municipalities (communes). This is below London, (14,600/5,800), which truncated organic development with a strictly enforced greenbelt, forcing outer suburban development even further from the urban core. Paris is also less dense than Madrid (12,600/4,800), but denser than Milan (7,200/2,800) and Essen (the Rhine-Ruhr connurbation), at 6,500/2,500.

The metropolitan area, which INSEE calls the aire urbaine, has steadily expanded. The latest data indicates a population of 12.5 million in 2015, up from 10.3 million in 1990. The Paris metropolitan area covers 6,620 square miles, or 17,145 square miles, of which only 16 percent is in the urban area (unité urbaine). In France, a metropolitan area includes the municipalities in unité urbaine (urban area) as well as the municipalities from which at least 40 percent of the resident workers commute to the unité urbaine.

The metropolitan area was formerly confined to the Ile-de-France region, which includes eight departments, including the ville de paris, Hautes-de-Seine, Seine-St.-Denis, Val-de-Marne, Val-d’Oise, Essone, Yvelines, Seine-et-Marne. In recent years, the metropolitan area has expanded to the outside, and now includes parts of six additional departments, Aisne, Eure, Loiret, Marne, Oise and Yonne. After this expansion, the Paris metropolitan area includes 1,794 municipalities, up from 1,155 municipalities in 1990.

There is also a new coordinating body, called the Métropole du Grand Paris, which is composed of the ville de Paris and 130 additional municipalities, largely in the inner suburban ring (Petite Couronne). This is not a municipality, nor does it increase the geographical size of the ville de Paris. It is rather a council of governments, similar in structure to metropolitan planning organizations in the United States. The Métropole du Grand Paris has a population of 7.1 million, but excludes more than 3.5 million residents in 281 urban area communes and 5.2 million residents in 1,663 municipalities in the metropolitan area.

Paris: Organic City

The evolution of Paris, which unlike its long-time competitor London, has been allowed to continue its development. The result is an organic whole that has been able to accept modernity, stretching like so many others, from a dense historic core to the comparatively dense automobile oriented suburbs where the vast majority of the people live.

Note: This excludes the parks outside the Boulevard Peripherique, the Bois de Vincennes and the Bois de Boulonge.

Wendell Cox is principal of Demographia, an international public policy and demographics firm. He is a Senior Fellow of the Center for Opportunity Urbanism (US), Senior Fellow for Housing Affordability and Municipal Policy for the Frontier Centre for Public Policy (Canada), and a member of the Board of Advisors of the Center for Demographics and Policy at Chapman University (California). He is co-author of the "Demographia International Housing Affordability Survey" and author of "Demographia World Urban Areas" and "War on the Dream: How Anti-Sprawl Policy Threatens the Quality of Life." He was appointed to three terms on the Los Angeles County Transportation Commission, where he served with the leading city and county leadership as the only non-elected member. He served as a visiting professor at the Conservatoire National des Arts et Metiers, a national university in Paris.

Photograph at the Top: Eiffel Tower and La Defense from the Tour Montparnasse (La Defense may have the largest employment base of any “Edge City,” a term popularized by Joel Garreau in his Edge City: Life on the New Frontier). Photograph by Author.

Additional photographs show both the suburbs and the ville de Paris (which contains nearly all of the historic sites).

Is Women's Progress Blocked By Welfare State?

$
0
0

Women’s progress is a global phenomenon, but one region is widely regarded as being the world leader in gender equality – the Nordics. Science Daily Newspaper bluntly stated in 2016 “[t]he Nordic countries are the most gender equal nations in the world”. During the recent International Women’s Day, Anne Kari Ovind argued in the Huffington Post that Nordic-style gender policies, including Norway’s state-mandated quotas on the share of women on company boards, is an inspiration for the world.

Throughout the world, liberal and socialist thinkers therefore point to Nordic-style welfare policies as a way of promoting gender equality. The Global Gender Gap Index confirms supports the view that Nordic countries are gender equal role models. Iceland tops the latest version of the index, followed by its Nordic neighbors Finland, Norway and Sweden. The only Nordic country that does not qualify to the very top is Denmark, which ranks on 19th position. This is still higher than the 45th position of the United States. Also, in previous versions of the Global Gender Gap Index, the Nordic countries are top performers. The 2014 edition for example reached the conclusion “the Nordic nations continue to act as role models in terms of their ability to achieve gender parity”.

Yet when you look deeply, there is one disturbing reality: women in Scandinavia do not rise as often to the top as their American counterparts. In the Nordic Gender Equality Paradox we found that the rise of the welfare state created jobs for women as well as aided their labor market participation by offering various family-related services. Yet this same system contains disincentives for female ascension in business. One example is high taxes that make it costly to purchase household services (a strategy otherwise used by parents to “buy” time so that they can take care of children as well as focus on their careers); generous benefit systems combined with high taxes that reduce economic incentives for both parents to work full-time and public sector monopolies/oligopolies in female-dominated sectors and parental policies that give women incentive to take long breaks from the working life. Through these mechanisms, welfare state policies create the Nordic Glass Ceiling.

Let us, for the sake of clarity, compare the Nordic nations to the US with the help of the Economist glass-ceiling index. When it comes to issues such as the labor force participation difference between genders and the higher education gap, the Nordics are consistently placed at the top of The Economist index. Direct childcare expenditure for families are relatively low in the Nordics, since much of childcare is tax-funded. Nordic countries additionally have generous public programs for paid leave for mothers. The United States on the other hand has a considerably larger gap in labor force participation, a smaller advantage for women in tertiary education attainment, higher private child-care costs and no paid leave for mothers at all.

Based on the Economist index, the United States has unusually women-unfriendly work policies while the Nordics have the most women-friendly work policies in the world. However, it is the United States which has the highest rate of women managers amongst all countries included in the Index, while the Nordic countries have a lower share.

Does this explanation fit with the level of women who reach executive positions in the Nordic countries? The answer is yes. Iceland, which historically and today has the most limited Nordic welfare state, is the country with a high rate of women managers. Sweden, which has opened public sector monopolies in amongst others education, elderly care and health care for private firms do relatively good – and much better than these market reforms were introduced. Denmark, which still has public monopolies and the highest tax rate amongst modern economies, is the poorest performer.

Then how about Norway’s much-admired quota policies? Norway passed a law at the end of 2003, requiring 40 per cent of board members of public companies to be women. The law, which became mandatory at the beginning of 2006, has gained considerable international attention. However, while the quotas law has been mimicked by many other nations, in effect it has not worked. In an important paper, Marianne Bertrand and co-authors look at the way the introduction of gender quotas affected women in Norwegian firms. The researchers find that the change had:

No trickle-down effect. This means that whilst a few women at the top received higher wages due to affirmative action directly benefiting them, the broader group of female employees did not receive higher wages due to a gender shift in board leadership.

• The reform had “no obvious impact on highly qualified women whose qualifications mirror those of board members but who were not appointed to boards”. The affirmative action thus failed to break the glass ceiling in any meaningful way except for the few elite women who directly benefited from it.

• No significant changes in the gender wage gap or in female representation in top positions. Again, wages and the ability of women in general to climb to the top were simply not affected.

• Lastly, “there is little evidence that the reform affected the decisions of women more generally; it was not accompanied by any change in female enrollment in business education programs, or a convergence in earnings trajectories between recent male and female graduates of such programs. While young women preparing for a career in business report being aware of the reform and expect their earnings and promotion chances to benefit from it, the reform did not affect their fertility and marital plans”.

The Swedish government planned to introduce a similar quota legislation but, after considerable critique (in which I participated), pulled back the suggestion which did not have support in Parliament. It is a policy which simply fails to promote women’s career progress in a meaningful way. Reducing the hinders that the welfare state creates for women’s progress would be the way to achieve this goal. After all, it is the United States with its limited government approach to helping women which in practice has most women managers – not the Nordic countries with their long history of gender equality.

So how are women faring in the modern Nordic welfare states? In many ways good. Nordic societies have a large share of women active on the workplace, perhaps the most gender equal attitudes in the world, and a tradition of women’s empowerment in the political sphere. One would think that this also translates to many women reaching the top of the business world, but this clearly is not the case.

This is certainly a controversial idea right now, but there is a case to be made that limited government and free markets provides the best way to promote women’s careers – not interventionist state policies.

Dr. Nima Sanandaji is the president of ECEPR and author of 25 books. He has recently published the study The Nordic Glass Ceiling for the Cato Institute.

Alcoholism May Be Linked To Living Further North

$
0
0

A new analysis by 24/7 Wall St., reprinted in part by USA Today, lists all 50 U.S. states in order of "excessive alcohol consumption," which is defined as binge drinking ("four or more drinks in a single occasion for women and five or more for men") or heavy drinking ("at least eight drinks per week for women and 15 for men").

The 24/7 Wall St. article indicates that there is a complicated relationship between income and excessive drinking. Richer people tend to drink heavily, while poorer people tend to binge drink. The conventional wisdom, however, is that poverty is a risk factor for alcoholism. Is it?

Rich Drunk, Poor Drunk

We decided to take a closer look at the data. Each point in the graph to the left represents an individual state. The data are plotted as the percentage of the state's population that drinks excessively versus the percentage of the state's population that lives in poverty1. The best-fit line is in black, and the confidence interval is in red.

Surprisingly, the correlation is negative. That is, as a state's population becomes poorer, people are less likely to drink excessively.

Obviously, that's not what we would expect. What explains this pattern? It is possible that rich people spend their money on booze. However, because this data analysis is ecological, that means there are no data on individuals. So it is quite plausible that, even in rich states, poor people are likelier to drink excessively than rich people. Without data on individuals, it's impossible to definitively conclude one way or the other.

Are People Who Live Further North Likelier to Drink Excessively?

One pattern that has not been explored extensively is the relationship between drinking and geography. Russia and Poland are both infamous for alcoholism. Both countries experience long, cold winters with little to do outside. Could that be a driving factor behind excessive drinking? Our analysis suggests yes.

The graph to the left depicts the percentage of an American state's population that drinks excessively versus the state's average latitude2. Once again, the best-fit line is in black, and the confidence interval is in red.

Very interesting. As latitude increases (i.e., a state is further north), the state's population is likelier to drink more.

There are two states in particular worth discussing. Hawaii is a clear outlier. Despite having the lowest latitude of all 50 states, it has an incredibly high percentage of people who drink excessively. (Maybe sitting on the beach all day lends itself to excessive drinking?) The alcohol consumption in Alaska, on the other hand, is about what we would expect given that it has the highest latitude of all 50 states. While it's not an outlier (because it falls almost exactly on the best-fit line), it may be an overly influential point on how the best-fit line is drawn.

So, we removed Hawaii and Alaska and restricted our analysis to the 48 contiguous states.

Not only does the relationship hold, it gets a little stronger. (The correlation coefficient r increased from 0.46 to 0.56 after removing Hawaii and Alaska.)

We wanted to answer one last question: Is there still an association between excessive alcohol consumption and latitude after we control for poverty? In other words, if we compare two states that have the same level of poverty and differ only in latitude, should we expect citizens of the state that is further north to have a larger drinking problem? Once again, the answer is yes, though it was no longer as strong3.

Is Geography Destiny?

Much scholarship in recent years has focused on the notion that "geography is destiny." Due to factors such as infectious disease, it may not be a coincidence that richer, more developed nations are located further away from the equator. (Parasites have a harder time surviving in cold weather.)

When it comes to alcohol consumption, however, the reverse trend might be true: The further away one is from the equator, the darker and longer the winter nights -- and, perhaps, the likelier people are to keep themselves entertained with a few bottles of booze4.

Notes

(1) Poverty data was collected from the U.S. Census Bureau and represents a 3-year average poverty rate from 2014 to 2016.

(2) A state's latitude was calculated as the average latitude of all zip codes in the state and was obtained from Ink Plant.

(3) For this analysis, we performed a multiple linear regression on just the 48 contiguous states using both latitude and poverty as predictor variables. When we did the regression on all 50 states, the association between alcohol consumption and latitude remained, but it was no longer statistically significant.

(4) To help confirm this hypothesis, it would be interesting to compare how much alcohol is consumed in the summer (when daylight hours are greatly extended) versus the winter for U.S. states and countries at high latitude.

This piece originally appeared on the American Council of Science and Health website.

Alex Berezow is Senior Fellow of Biomedical Science at the American Council on Science and Health.

Photo: Storyblocks

Brain Drain as Economic Development, Akron Edition

$
0
0

If you’ve been reading this blog for any length of time, you’ll know that I don’t believe brain drain is the problem it’s been made out as. Often talent export can actually itself be a form of economic development.

A recent New Yorker profile of the Silicon Valley firm Glassdoor, which allows employees to post reviews of their employer, made this point implicitly in passing. Robert Hohman, the CEO of Glassdoor, is from Akron.

"One day last fall, I met with Robert Hohman, Glassdoor’s C.E.O., at the company’s Chicago office. He had just hosted a ted-like conference (tagline: “Winning with informed candidates”) where C.E.O.s and talent recruiters took notes on how to operate in the new era of corporate transparency. Hohman, who grew up in Akron, Ohio, resembles the actor Jeff Daniels; friendly and rumpled, he wore jeans, and his blond hair was slicked back. According to Glassdoor, ninety-one per cent of employees approve of Hohman’s performance. The other nine per cent include a former sales director, who recently griped about a “culture of blame” at the company’s Mill Valley, California, headquarters and advised Hohman to “stop standing up in meetings dropping F-Bombs like a 6th grader with a head injury.”

When he needed help with his startup, he looked to friends and family back home:

"In 2008, shortly before Glassdoor’s launch, Hohman called his sister, Melissa Fernandez, in Akron. She had just given birth to her first child and wanted to work from home. He enlisted her to read every review that was submitted to the site, scanning them for violations of the Community Guidelines. When the workload got to be too much, Fernandez recruited Cara Barry, another stay-at-home mom, who recruited a third mom, her neighbor. Eventually, this group—the content-moderation team—grew to include twenty-six people, several of them men, although for years employees at Glassdoor’s headquarters referred to them as “the wahms,” for “work-at-home moms.” During the past decade, Glassdoor has built machine-learning algorithms to screen for fraud and profanity, and the members of Fernandez’s team read anything that users have flagged; these days, they also read half of all reviews submitted to the site regardless—a step that Yelp and TripAdvisor don’t take, Hohman said."

This turned into a Glassdoor office in suburban Akron, complete with Silicon Valley style perks.

"From Chicago, Hohman returned to San Francisco. Dawn Lyon and I went to visit the content-moderation team, which works in an office park in Green, Ohio, five miles from the Akron airport. Melissa Fernandez met us at the door. She has a “Rachel” haircut, wire-rimmed glasses, and an even-keeled demeanor. She introduced her team of moderators—twenty-one other women and four men, working at adjustable-height desks. According to Glassdoor’s Glassdoor page, the Ohio office is the happiest of the company’s six locations, beating London and San Francisco, with a 5.0 rating—a perfect score. Fernandez explained that this is in part because the team has a great culture, and also because its San Francisco-style startup perks—yoga classes, dogs in the office, flexibility to work from home—are virtually unheard of in Akron, where the biggest employers are factories and call centers. Laura Beth Mercina, the team’s head of community care, previously worked at Arby’s. She said, “I tell people about my job at Glassdoor, and they’re, like, ‘Is this place real?’”

It’s not clear how many people Glassdoor employs in Akron. It sounds like a very small number. But any amount is more than they would have been employing if Hohman hadn’t left Akron to ultimately end up starting the company. Brain drain turned out to be gain for the folks who are now working for Glassdoor in Akron.

This piece originally appeared on Urbanophile.

Aaron M. Renn is a senior fellow at the Manhattan Institute, a contributing editor of City Journal, and an economic development columnist for Governing magazine. He focuses on ways to help America’s cities thrive in an ever more complex, competitive, globalized, and diverse twenty-first century. During Renn’s 15-year career in management and technology consulting, he was a partner at Accenture and held several technology strategy roles and directed multimillion-dollar global technology implementations. He has contributed to The Guardian, Forbes.com, and numerous other publications. Renn holds a B.S. from Indiana University, where he coauthored an early social-networking platform in 1991.

Photo: Akron, Ohio from Sleepydre, Public Domain


The Significance of Public Art to its Space: People’s Spaces, People’s Choices

$
0
0

Public Art has been an important part of American public spaces since the 1960s when the National Endowment for the Arts established their first public art program in America’s public spaces. During this inception, public art was a new concept in a time when art was largely relegated to the confines of the museum. The Civil Rights Movement changed the perception of public spaces in America, giving more autonomy to the people to determine how the public space should be used. This was because the public voiced their opinions on art through the movement and public spaces became more democratic, offering public art to the general public. The notion of public sculptures enhancing the public space started to capture people’s attention as they drew meanings from the contents of the space around them.

As public art became more prominent in America’s public spaces, the New York City based Public Art Fund (1997) attracted contemporary artists and visitors to determine how the space should be defined. One of the biggest influences of public art was the effect it had on the general public, who for the first time felt power to exercise over their surroundings and city spaces. This change also led to some controversy over who had the right to design public space, the public or art professionals? Increasingly, the people of the city, who live, work and commute daily in the space and have to endure the art around them, felt they had a right to express opinions about what was made in their name.

There are a few examples which created this spur in public art in America and greatly transformed the way public spaces were used globally. The first artwork is Tilted Arc (see image below) which was the first of its kind to have immense impact on the geographical surrounding of the sculpture. Tilted Arc was a site specific post minimalist sculpture designed by a famous artist, Richard Serra, commissioned by United States General Services Administration for their Arts in Architecture program. It was designed to be erected in the Federal Plaza in Manhattan, New York City. The sculpture was a steel arc which was 120 feet long and around 12 feet high. It was designed, according to Serra, to give the viewer a special significance of the space and to appreciate the changes the public feels when walking around the site-specific sculpture.

Yet, despite Serra’s lofty intentions, the public did not much appreciate the sculpture. People passing through the steel arc said it was too gaudy and distracted them from the view of other buildings. Residents and businesses around the location signed a petition against the sculpture in order for it to be removed. Richard Serra was deeply offended by the comments of the public, leading to a big controversial trial, where despite the views of the artist, the pubic prevailed. Eventually, the sculpture was removed, giving the space a different meaning.

Tilted Arc did succeed in raising the public’s perception of the public art. Another example in New York City which created a spur was South Bronx Bronzes by John Ahearn in 1991. The long awaited sculptures in the Bronx were perceived as a threat to the neighbourhood. The artist considered to depict an accurate picture of the Bronx but after much heated debate from the public, he recognised the issues his work had raised as mentioned below:

“After assessing the situation, Ahearn came to the conclusion that the work needed to be removed immediately. Ahearn predicted that if they were not removed, the works would be the centre of a very damaging controversy in which he would be cast as a racist." (Finkelpearl, 2000)

People thought the images the artist had created stereotyped people of the Bronx in racially offensive ways, particularly to the African American community (Finkelpearl, 2000). The public space had three realistic life size sculptures (see image below) of people who were known to the artist. The sculpture represented a young man wearing a hood with his dog, a boy with rollerblades and finally a man with a basketball having a foot on the radio. Although Ahearn thought these figures were based on real people he had met and represented the local community, the public thought otherwise. This indicates that the public and the artist need to have similar perceptions for the artwork to be accepted by the community.

These two controversies, and the notion that people should have some power over the space in which they interact, alarmed many artists.

One way to deal with this dilemma has been a shift towards temporary installations of sculptures. In New York City alone, Public Art Fund has commissioned more than four hundred exhibitions and on site projects throughout the years. Some of these artworks include Please Touch the Art in Brooklyn Bridge Park by Jeppe Hein in 2016, which was a successful interactive public art installation supported by New York’s Public Art Fund. The name of the artwork, Please Touch the Art, suggests that the art needs to be touched and experimented with as people walk past the artworks. This feature included fountains, mirror installations and interactive seating. Such interactive public art has grown as a way to bring people together while enhancing the city’s public spaces.

Another project, Anish Kapoor’s art of Sky Mirror (or Cloud Gate) in Chicago has had a tremendous impact on public spaces. This improves how the public space is used, but also conveys significance to the public space itself.

Anish Kapoor's Cloud Gate in Chicago's Millenium Park has gained enormous popularity as people look into the concave sculpture to interact with the art. It has provided Millennium Park a sense of place, enabling residents and tourists to visit regularly. The art has also become a tourist spot and can be found in many travel books as a destination to visit. The Crown Fountain in Millennium Park is another successful public art in America. The Crown Fountain complements Cloud Gate as they are located in close proximity and allows people to enjoy both the public artworks. The artworks provide respite and relaxation from everyday stresses as it allows for playful interactions. It also contributes to bringing the community together by enabling communication with others surrounding the artwork. Sculptures like this, which create interaction with public art, are a growing trend in today’s American public spaces.

In San Francisco, California LED lighting used on the Bay Lights created an upsurge of public visiting the bridge to interact with the lights. The Bay Lights created vibrancy in the city as more people noticed the lights and interacted through many mediums as the lights represent brian neurons. Cupid’s Span Sculpture has also gained attention in San Francisco as “it is now seen as an integral part of the Embarcadero skyline (Garnett, 2017)” Cupid Span’s shape, colour and lighting has attracted visitors to the public space. These types of artworks are becoming popular and contributes to bringing people together in America’s public spaces.

As we consider our future cities, public art should not be overlooked. Compared to public art installations in the 20th century, there has been tremendous growth and change in 21st century in New York City’s public art scene. People are more involved in New York City’s public art decisions due to the interactive and engaging nature of the installations. With the accelerated pace public art is being commissioned in America the future of public art could be promising indeed.

Thejas Jagannath has recently completed her Master of Planning in University of Otago. Her Master’s thesis was on the influence of public art on public space. She has written on various blogs including Medium, Parksify and Urban Times. She was the Managing Editor of Urban Times. As an urbanist, she enjoys writing, visiting museums and exploring cities. You can follow her on the Twitter Handle @thejas009.

Links to Images:

Top photo: Eric Kilby, via Flickr, using CC License.
Tilted Arc: https://publicdelivery.org/richard-serra-tilted-arc/
South Bronx Bronzes: https://blog.vandalog.com/2011/01/parallels-john-ahearns-bronzes/
Jeppe Hein Please Touch the Art: Author
Cloud Gate: Wikipedia Commons
Cupid Span: www.theculturetrip.com

Moving Away From The Major Metropolitan Areas: The 2017 Estimates

$
0
0

The new 2017 US Census Bureau metropolitan area population estimates have been published. They show a significant increase in domestic migration away from the largest cities (the major metropolitan areas, with more than 1,000,000 population) toward the metropolitan areas with from 500,000 to 1,000,000 population. The data also shows an acceleration of suburban versus core county population growth within the major metropolitan areas themselves. The data is summarized in the table at the bottom of the article.

Stronger Net Domestic Migration in Metropolitan Areas under 1,000,000 Population

Earlier in the decade, the 53 major metropolitan areas (over 1,000,000 population) had greater net domestic migration than in the 54 middle-sized metropolitan areas (between 500,000 and 1,000,000 population). In fact, since 2012, net domestic migration in the major metropolitan areas have dropped every year. By 2016, the major metropolitan areas had a net domestic migration loss of 67,000, which accelerated to 166,000 in 2017. In contrast, the middle-sized metropolitan areas have experienced annual increases in net domestic migration each year since 2012. In 2017, the metropolitan areas with between 500,000 and 1,000,000 population gained 271,000 more net domestic migrants than the metropolitan areas with more than 1,000,000 population (Figure 1, see Note).

A more detailed analysis shows that metropolitan areas between 1.0 and 2.5 million population gained the most domestic migrants relative to their 2016 population (0.33 percent). The under 1,000,000 category (the “larger” metropolitan areas) have the second greatest net domestic migration (0.27%), while the 2,500,000 to 5,000,000 category shows a smaller increase (0.14 percent). Metropolitan areas between 5,000,000 and 10,000,000 had a small loss (minus 0.19 percent), while New York and Los Angeles, the two megacities (over 10,000,000), had an enormous 0.95 percent net domestic migration loss, at 209,000. (Figures 2 and 3).

Domestic Migration to Suburbs Accelerates

Domestic migration also continues to accelerate to the suburbs of the major metropolitan areas. The core counties of the 50 major metropolitan areas (over 1,000,000) with more than one county have continued to shed domestic migrants (Note). Between 2016 and 2017, nearly 438,000 net residents moved from the core counties (which include the urban cores) to elsewhere in the nation. The suburban counties of the same metropolitan areas gained 252,000. Thus, the domestic migration gain in the suburbs was 690,000 more than in the core counties. (Figure 4).

Since 2010, the core counties have lost 1.39 million net domestic migrants to other parts of the nation, while the suburban counties have gained 1.38 million, This indicates a net movement of nearly 2.8 million residents to the suburbs compared to the core counties during the 2010s.

National Summary of Net Domestic Migration

During this decade, the metropolitan areas from 500,000 to 1,000,000 have attracted 455,000 net domestic migrants, compared to only 79,000 by the major metropolitan areas. Thus, the middle-sized metropolitan areas have added nearly six times as many domestic migrants as the major metropolitan areas, despite having less than one-quarter the population at the beginning of the decade. The rest of the nation lost 534,000 net domestic migrants to the metropolitan areas with more than 500,000 population (Figure 5).

Top Gainers and Losers

All this resembles a rerun of the 2000s --- with Austin and Las Vegas ranking number one and two. Virtually all of the others in the top ten also experienced strong net domestic migration in the 2000s.

The major metropolitan areas losing the largest share of net domestic migrants are also very familiar from the 2000s, such as San Jose, New York, Miami, Chicago and Los Angeles (Figure 6). “Boomtown” San Francisco, which had done well in domestic migration earlier in the decade, has quickly fallen into the bottom 10, a downward acceleration noted by the Wall Street Journal (see: “San Francisco has a People Problem”).

The metropolitan areas in the 500,000 to 1,000,000 population range with the greatest net domestic migration are strongly weighted toward retirement destinations, with five of the top 10 being in Florida, led by Lakeland. Lakeland is also close enough for commuting to Tampa-St. Petersburg and Orlando, which rank among the top 10 major metropolitan areas. The top 10 also includes Boise, ID, as well as Fayetteville, AR-MO, where strong growth has been propelled by Wal-Mart headquarters and related economic activity. The largest domestic migration loss among all metropolitan areas over 500,000 was in Honolulu (Figure 7).

Population Gains and Losses

The 10 major metropolitan areas with the largest growth from 2016 to 2017 were all in the South, except for Phoenix and Las Vegas. The largest loss was in Pittsburgh, which has experienced recurring losses. The population within the present boundaries of the Pittsburgh metropolitan area reached 2.77 million in 1960, 420,000 more than today (Figure 8).

Lakeland was also the leading large metropolitan area for overall growth. Boise, Provo, UT and Fayetteville, AR-MO were also among the top gainers, along with other Florida metropolitan areas. Youngstown, OH experienced the greatest loss, now down 20 percent from its 1970 peak. Honolulu had the second largest loss and moved farther away from the million threshold it nearly reached last year (Figure 9).

Other Notable Developments

The new 2017 metropolitan area population estimates show that Philadelphia and San Francisco have been passed by newer metropolitan areas, Miami and Phoenix. Less than 15 years ago, Philadelphia was the nation’s fourth largest metropolitan area, a position it had held since 1950. When Philadelphia was edged out by Los Angeles the city was then passed by Houston and Washington, and now Miami. Philadelphia now holds 8th place.

Phoenix has replaced San Francisco as the 11th largest metropolitan area in the nation, and is poised to replace 10th ranked Boston by the 2020 census, if present trends continue. Phoenix has a population of 4.74 million, compared to 4.73 million in San Francisco. In 1950, Phoenix had a population below 400,000, well behind San Francisco’s 2.1 million (present land areas), which had been either the West’s first or second largest metropolitan area since metropolitan areas were first delineated.

Meanwhile, the nation’s three largest metropolitan areas are stagnating. Los Angeles grew an anemic 0.19 percent compared to a national average of 0.72 percent. New York did marginally better, at 0.23 percent. In the city of New York growth has virtually stopped, increasing only 7,000 last year, compared to an average of 70,000 annually earlier in the decade. One borough --- Brooklyn --- actually lost population, a reversal from the early 2010s when annual increases exceeded 30,000. Suburban New York, long a laggard, added five residents for every new City resident in 2017. Chicago lost 0.14 percent and has returned to little more than its 2012 population.

Some “Rust Belt” metropolitan areas have long had among the slowest growth such as Detroit, Chicago, Milwaukee, Buffalo and Pittsburgh). Yet this year saw a positive net domestic migration in Minneapolis-St. Paul, Kansas City, Columbus, Cincinnati and Indianapolis. Just five years ago (2012), these metropolitan areas attracted fewer than 2,000 net domestic migrants combined. By 2017, the figure had risen to 43,000. Their near average or lower than average costs of living, strongly related to house prices that are affordable, are a likely contributor.

At the same time, metropolitan areas with higher costs of living such as coastal California (especially Los Angeles, San Francisco, San Diego and San Jose), have experienced a significant deterioration in net domestic migration, expanding their annual loss more than seven times, from nearly 25,000 in 2012 to nearly 180,000 in 2017. Meanwhile, metropolitan areas over 500,000 in interior California have seen their net domestic migration rise from minus 4,000 in 2012 to 38,000 in 2017 (Riverside-San Bernardino, Sacramento, Fresno, Bakersfield, Stockton and Modesto). Population trends reflect the domestic migration decline, with coastal California growing nearly two-thirds less in 2017 than in 2012, and interior California nearing a 50 percent increase.

A Pivotal Year

The 2017 population estimates show that there is a resounding “return to the suburbs,” with historical trends restored after a brief interlude caused by the Great Recession. At the same time, medium-sized metropolitan areas, with either small or no urban cores are gaining many more domestic migrants than their larger cousins. Regrettably much of the mainstream media, not to mention academia and some of the development community, has not woken up to this reality.

Note: Three major metropolitan areas have only one county (San Diego, Las Vegas and Tucson). Domestic migration data is available only at the county level (not, for example, by individual municipalities, except for city-county jurisdictions, such as San Francisco and Baltimore).


Metropolitan Areas Over 500,000:  Population Estimates: 2017
Population (Millions)2016-2017
       
RankMetropolitan Areas201020162017Population ChangeRank: Population ChangeNet Domestic MigrationRank: Domestic Migration
1New York, NY-NJ-PA    19.566     20.275     20.321 0.23%           83 -1.03%         105
2Los Angeles, CA    12.829     13.328     13.354 0.19%           84 -0.82%           99
3Chicago, IL-IN-WI      9.462       9.546       9.533 -0.14%         100 -0.89%         103
4Dallas-Fort Worth, TX      6.426       7.253       7.400 2.02%           11 0.81%           24
5Houston, TX      5.920       6.798       6.892 1.39%           31 -0.15%           68
6Washington, DC-VA-MD-WV      5.636       6.151       6.217 1.07%           42 -0.35%           80
7Miami, FL      5.566       6.107       6.159 0.84%           55 -0.77%           98
8Philadelphia, PA-NJ-DE-MD      5.966       6.077       6.096 0.31%           79 -0.30%           75
9Atlanta, GA      5.287       5.796       5.885 1.54%           27 0.57%           33
10Boston, MA-NH      4.553       4.806       4.837 0.64%           64 -0.38%           84
11Phoenix, AZ      4.193       4.648       4.737 1.91%           17 1.10%           16
12San Francisco, CA      4.336       4.699       4.727 0.60%           69 -0.51%           92
13Riverside-San Bernardino, CA      4.225       4.524       4.581 1.26%           35 0.47%           38
14Detroit,  MI      4.296       4.306       4.313 0.17%           86 -0.35%           78
15Seattle, WA      3.440       3.803       3.867 1.69%           25 0.55%           35
16Minneapolis-St. Paul, MN-WI      3.349       3.557       3.601 1.22%           38 0.23%           48
17San Diego, CA      3.095       3.317       3.338 0.62%           65 -0.48%           87
18Tampa-St. Petersburg, FL      2.783       3.037       3.091 1.81%           22 1.34%             9
19Denver, CO      2.544       2.852       2.888 1.28%           34 0.42%           41
20Baltimore, MD      2.711       2.801       2.808 0.26%           80 -0.35%           81
21St. Louis,, MO-IL      2.788       2.807       2.807 0.02%           95 -0.35%           79
22Charlotte, NC-SC      2.217       2.476       2.525 2.01%           12 1.26%           15
23Orlando, FL      2.134       2.453       2.510 2.30%             8 0.95%           20
24San Antonio, TX      2.143       2.426       2.474 1.97%           13 1.03%           17
25Portland, OR-WA      2.226       2.423       2.453 1.24%           36 0.55%           36
26Pittsburgh, PA      2.356       2.342       2.333 -0.35%         105 -0.37%           83
27Sacramento, CA      2.149       2.295       2.325 1.29%           32 0.56%           34
28Las Vegas, NV      1.951       2.157       2.204 2.20%             9 1.36%             8
29Cincinnati, OH-KY-IN      2.115       2.166       2.179 0.60%           68 0.07%           56
30Kansas City, MO-KS      2.009       2.106       2.129 1.07%           43 0.41%           42
31Austin, TX      1.716       2.061       2.116 2.68%             4 1.46%             7
32Columbus, OH      1.902       2.047       2.079 1.55%           26 0.61%           30
33Cleveland, OH      2.077       2.060       2.059 -0.06%           99 -0.39%           85
34Indianapolis. IN      1.888       2.006       2.029 1.15%           41 0.39%           43
35San Jose, CA      1.837       1.991       1.998 0.38%           73 -1.29%         106
36Nashville, TN      1.671       1.869       1.903 1.83%           20 1.00%           19
37Virginia Beach-Norfolk, VA-NC      1.677       1.723       1.725 0.14%           89 -0.51%           91
38Providence, RI-MA      1.601       1.616       1.621 0.32%           77 -0.16%           69
39Milwaukee,WI      1.556       1.576       1.576 0.01%           97 -0.61%           97
40Jacksonville, FL      1.346       1.477       1.505 1.93%           16 1.28%           13
41Oklahoma City, OK      1.253       1.372       1.384 0.82%           57 0.02%           59
42Memphis, TN-MS-AR      1.325       1.345       1.348 0.23%           82 -0.37%           82
43Raleigh, NC      1.130       1.305       1.335 2.31%             7 1.33%           10
44Richmond, VA      1.208       1.282       1.294 0.94%           50 0.32%           44
45Louisville, KY-IN      1.236       1.285       1.294 0.71%           59 0.19%           50
46New Orleans. LA      1.190       1.271       1.276 0.36%           75 -0.28%           74
47Hartford, CT      1.212       1.210       1.210 0.02%           96 -0.56%           94
48Salt Lake City, UT      1.088       1.186       1.203 1.44%           30 0.18%           51
49Birmingham, AL      1.128       1.147       1.150 0.25%           81 -0.03%           63
50Buffalo, NY      1.136       1.135       1.137 0.17%           85 -0.20%           71
51Rochester, NY      1.080       1.078       1.078 -0.04%           98 -0.50%           88
52Grand Rapids, MI      0.989       1.049       1.059 0.98%           49 0.21%           49
53Tucson, AZ      0.980       1.013       1.023 1.01%           46 0.60%           32
54Tulsa, OK      0.938       0.987       0.991 0.33%           76 -0.24%           73
55Fresno, CA      0.930       0.980       0.989 0.99%           48 -0.05%           66
56Honolulu, HI      0.953       0.993       0.989 -0.41%         106 -1.36%         107
57Bridgeport-Stamford, CT      0.917       0.949       0.950 0.08%           91 -0.92%         104
58Worcester, MA-CT      0.917       0.937       0.942 0.61%           66 -0.04%           64
59Omaha, NE-IA      0.865       0.924       0.933 1.01%           47 0.04%           57
60Albuquerque, NM      0.887       0.907       0.911 0.42%           71 0.02%           58
61Greenville, SC      0.824       0.885       0.896 1.29%           33 0.84%           23
62Bakersfield, CA      0.840       0.885       0.893 0.91%           53 -0.18%           70
63Albany, NY      0.871       0.883       0.886 0.38%           72 -0.01%           61
64Knoxville, TN      0.838       0.868       0.877 1.06%           44 0.93%           21
65McAllen, TX      0.775       0.850       0.861 1.23%           37 -0.42%           86
66New Haven CT      0.862       0.860       0.860 0.05%           93 -0.57%           95
67Oxnard, CA      0.823       0.851       0.854 0.37%           74 -0.32%           77
68El Paso, TX      0.804       0.841       0.845 0.43%           70 -0.88%         102
69Allentown, PA-NJ      0.821       0.835       0.841 0.64%           63 0.17%           52
70Baton Rouge, LA      0.803       0.836       0.834 -0.17%         103 -0.84%         101
71Columbia, SC      0.767       0.817       0.825 0.93%           51 0.45%           40
72Sarasota, FL      0.702       0.788       0.805 2.06%           10 2.20%             2
73Dayton, OH      0.799       0.801       0.803 0.32%           78 -0.04%           65
74Charleston, SC      0.665       0.762       0.776 1.83%           21 1.26%           14
75Greensboro, NC      0.724       0.757       0.761 0.61%           67 0.17%           53
76Stockton, CA      0.685       0.734       0.745 1.52%           29 0.63%           28
77Cape Coral, FL      0.619       0.723       0.739 2.31%             6 1.94%             6
78Little Rock, AR      0.700       0.733       0.738 0.67%           62 0.12%           55
79Colorado Springs, CO      0.646       0.711       0.724 1.85%           19 1.01%           18
80Boise, ID      0.617       0.691       0.710 2.76%             2 2.02%             5
81Akron, OH      0.703       0.703       0.704 0.14%           90 -0.12%           67
82Lakeland, FL      0.602       0.667       0.686 2.92%             1 2.28%             1
83Winston-Salem, NC      0.641       0.662       0.668 0.91%           52 0.65%           27
84Ogden, UT      0.597       0.653       0.665 1.89%           18 0.70%           26
85Syracuse, NY      0.663       0.657       0.655 -0.32%         104 -0.83%         100
86Madison, WI      0.605       0.647       0.654 1.05%           45 0.26%           47
87Daytona Beach, FL      0.590       0.637       0.649 1.94%           15 2.03%             3
88Des Moines, IA      0.570       0.635       0.646 1.76%           23 0.76%           25
89Wichita, KS      0.631       0.645       0.646 0.15%           88 -0.50%           89
90Springfield, MA      0.622       0.631       0.632 0.16%           87 -0.54%           93
91Provo, UT      0.527       0.601       0.618 2.69%             3 0.86%           22
92Toledo, OH      0.610       0.605       0.604 -0.15%         102 -0.51%           90
93Augusta, GA-SC      0.565       0.595       0.600 0.88%           54 0.46%           39
94Melbourne, FL      0.543       0.578       0.589 1.95%           14 2.02%             4
95Jackson, MS      0.568       0.580       0.579 -0.15%         101 -0.59%           96
96Harrisburg, PA      0.549       0.568       0.572 0.69%           61 0.13%           54
97Durham, NC      0.507       0.559       0.567 1.52%           28 0.62%           29
98Spokane, WA      0.528       0.555       0.564 1.71%           24 1.30%           12
99Chattanooga, TN-GA      0.528       0.552       0.557 0.83%           56 0.61%           31
100Scranton, PA      0.564       0.555       0.555 0.05%           94 -0.02%           62
101Modesto, CA      0.514       0.541       0.548 1.21%           39 0.31%           46
102Lancaster, PA      0.519       0.539       0.543 0.70%           60 -0.01%           60
103Youngstown, OH-PA      0.566       0.545       0.542 -0.48%         107 -0.31%           76
104Fayetteville, AR-MO      0.463       0.525       0.537 2.34%             5 1.31%           11
105Portland, ME      0.514       0.528       0.532 0.72%           58 0.55%           37
106Lexington, KY      0.472       0.507       0.513 1.16%           40 0.31%           45
107Santa Rosa, CA      0.484       0.504       0.504 0.08%           92 -0.22%           72
From: US Census Bureau Data


Wendell Cox is principal of Demographia, an international public policy and demographics firm. He is a Senior Fellow of the Center for Opportunity Urbanism (US), Senior Fellow for Housing Affordability and Municipal Policy for the Frontier Centre for Public Policy (Canada), and a member of the Board of Advisors of the Center for Demographics and Policy at Chapman University (California). He is co-author of the "Demographia International Housing Affordability Survey" and author of "Demographia World Urban Areas" and "War on the Dream: How Anti-Sprawl Policy Threatens the Quality of Life." He was appointed to three terms on the Los Angeles County Transportation Commission, where he served with the leading city and county leadership as the only non-elected member. He served as a visiting professor at the Conservatoire National des Arts et Metiers, a national university in Paris.

Photograph: Lakeland, Florida, which led the nation in population increase and net domestic migration gain among metropolitan areas with more than 500,000 population in 2016-2017. Credit: Mikerussell at English Wikipedia [CC BY-SA 3.0 or GFDL], via Wikimedia Commons

Is This the End For the Neoliberal World Order?

$
0
0

Whatever his grievous shortcomings, President Trump has succeeded in one thing: smashing the once imposing edifice of neoliberalism. His presidency rejects the neoliberal globalist perspective on trade, immigration and foreign relations, including a penchant for military intervention, that has dominated both parties’ political establishments for well over two decades.

Some of Trump’s actions, notably the proposed tariffs, may be crude and even wrong-headed but other moves, notably focus on China’s buying of American technology assets, expose the fundamental weakness of the neoliberal trade regime. Trump’s policy agenda would never have risen if neoliberalism was able to improve the lives of the vast majority of citizens rather than promote stagnation and downward mobility for a large portion of the population.

The geography of neoliberalism

Neoliberal policies have worked well for those in the upper economic, academic, bureaucratic classes and the cosmopolitan places where they predominate. But what works for Manhattan or Palo Alto, as well as Goldman Sachs or Apple, does not help so much residents of declining industrial cities, small towns and villages which suffered millions of lost jobs due to China or NAFTA.

Trump’s support in these locations reflects a broader global phenomenon. Like the Midwestern and southern towns recently denounced by Hillary Clinton as looking “backward,” neoliberal policies have been rejected by similar geographies in the United Kingdom, as seen in the Brexit vote, and powered nationalist parties in such varied places as Germany, Russia, Slovakia, Hungary, Sweden, Poland and the Netherlands. Most recently Italians, including in the impoverished south, voted largely for anti-immigrant, nationalist and populist parties.

Read the entire piece at The Orange County Register.

Joel Kotkin is executive editor of NewGeography.com. He is the Roger Hobbs Distinguished Fellow in Urban Studies at Chapman University and executive director of the Houston-based Center for Opportunity Urbanism. His newest book is The Human City: Urbanism for the rest of us. He is also author of The New Class ConflictThe City: A Global History, and The Next Hundred Million: America in 2050. He lives in Orange County, CA.

Photo: ShnapThat! (Singapore Ship Docks (PSA)) [CC BY 2.0], via Wikimedia Commons

The Fastest Cities for Job Growth in 2017

$
0
0

The Bureau of Labor Statistics recently released their final 2017 metro area job numbers. It was a pretty good year for job growth in a lot of major metros. Here’s how they fared, ranked by percentage job growth. Job totals are in thousands.

RankMetro Area20162017Total ChangePct Change
1Riverside-San Bernardino-Ontario, CA1401.91451.649.73.55%
2Austin-Round Rock, TX1000.51032.632.13.21%
3Nashville-Davidson–Murfreesboro–Franklin, TN949.9980.030.13.17%
4Orlando-Kissimmee-Sanford, FL1208.91247.138.23.16%
5Jacksonville, FL668.6689.721.13.16%
6Charlotte-Concord-Gastonia, NC-SC1147.91181.533.62.93%
7Las Vegas-Henderson-Paradise, NV949.5976.827.32.88%
8Phoenix-Mesa-Scottsdale, AZ1979.22034.154.92.77%
9Dallas-Fort Worth-Arlington, TX3503.03596.793.72.67%
10Raleigh, NC600.1616.116.02.67%
11Seattle-Tacoma-Bellevue, WA1950.32000.650.32.58%
12San Jose-Sunnyvale-Santa Clara, CA1071.41098.226.82.50%
13Portland-Vancouver-Hillsboro, OR-WA1145.11172.927.82.43%
14Salt Lake City, UT699.7716.316.62.37%
15San Antonio-New Braunfels, TX1016.41039.322.92.25%
16Atlanta-Sandy Springs-Roswell, GA2663.92723.759.82.24%
17San Francisco-Oakland-Hayward, CA2344.32396.452.12.22%
18Sacramento–Roseville–Arden-Arcade, CA949.0968.519.52.05%
19Grand Rapids-Wyoming, MI542.4553.411.02.03%
20Tampa-St. Petersburg-Clearwater, FL1295.01321.226.22.02%
21San Diego-Carlsbad, CA1424.61453.228.62.01%
22Denver-Aurora-Lakewood, CO1434.11461.727.61.92%
23Columbus, OH1064.31083.919.61.84%
24Miami-Fort Lauderdale-West Palm Beach, FL2586.12629.443.31.67%
25Minneapolis-St. Paul-Bloomington, MN-WI1957.21988.831.61.61%
26Washington-Arlington-Alexandria, DC-VA-MD-WV3223.23274.150.91.58%
27Kansas City, MO-KS1066.11082.616.51.55%
28New York-Newark-Jersey City, NY-NJ-PA9525.19672.2147.11.54%
29Detroit-Warren-Dearborn, MI1974.22004.330.11.52%
30Philadelphia-Camden-Wilmington, PA-NJ-DE-MD2868.42910.141.71.45%
31Tucson, AZ371.8377.25.41.45%
32Indianapolis-Carmel-Anderson, IN1043.11057.814.71.41%
33Los Angeles-Long Beach-Anaheim, CA5969.86052.282.41.38%
34Louisville/Jefferson County, KY-IN658.3666.68.31.26%
35Cincinnati, OH-KY-IN1080.01093.613.61.26%
36Boston-Cambridge-Quincy, MA-NH – Metro2704.42736.832.41.20%
37Richmond, VA664.0671.37.31.10%
38Pittsburgh, PA1162.81175.412.61.08%
39St. Louis, MO-IL1363.71377.413.71.00%
40Providence-Fall River-Warwick, RI-MA – Metro583.2588.95.70.98%
41Houston-The Woodlands-Sugar Land, TX2992.33021.329.00.97%
42Virginia Beach-Norfolk-Newport News, VA-NC772.6779.97.30.94%
43Baltimore-Columbia-Towson, MD1385.21397.512.30.89%
44Chicago-Naperville-Elgin, IL-IN-WI4658.64697.238.60.83%
45Oklahoma City, OK629.8634.64.80.76%
46Buffalo-Cheektowaga-Niagara Falls, NY560.0563.93.90.70%
47Birmingham-Hoover, AL526.2529.53.30.63%
48Memphis, TN-MS-AR638.2642.24.00.63%
49Hartford-West Hartford-East Hartford, CT – Metro569.8572.12.30.40%
50Milwaukee-Waukesha-West Allis, WI863.8866.62.80.32%
51Rochester, NY532.9534.11.20.23%
52Cleveland-Elyria, OH1055.31057.62.30.22%
53New Orleans-Metairie, LA576.2575.0-1.2-0.21%


This piece originally appeared on Urbanophile.

Aaron M. Renn is a senior fellow at the Manhattan Institute, a contributing editor of City Journal, and an economic development columnist for Governing magazine. He focuses on ways to help America’s cities thrive in an ever more complex, competitive, globalized, and diverse twenty-first century. During Renn’s 15-year career in management and technology consulting, he was a partner at Accenture and held several technology strategy roles and directed multimillion-dollar global technology implementations. He has contributed to The Guardian, Forbes.com, and numerous other publications. Renn holds a B.S. from Indiana University, where he coauthored an early social-networking platform in 1991.

Photo: Cover image photo credit: David McSpadden, CC BY 2.0

Orange County Focus: Forging Our Common Future

$
0
0

How can Orange County become a better place to live for all of its residents? Joel Kotkin and Marshall Toplansky explore the challenges and solutions in Orange County Focus: Forging Our Common Future, a research brief from Chapman University's Center for Demographics and Policy. Read an excerpt from the report below:

Orange County is, in many ways, among the nation’s best of places to live and work, but also one whose very attractiveness threatens its long term social, economic and environmental sustainability.

Much of this report is built around the assumption that Orange County will retain its allure for those who have the means and opportunity to live here. Few locations possess its combination of cultural and natural assets, talent, and innovative spirit. These attractions have helped make Orange County the nation’s sixth largest county in terms of its output, which is larger than that of 25 states.

Yet, as we discovered in our initial report, “The OC Model,” Orange County faces severe challenges on numerous fronts. The area has continued to lag competitors in high paying job creation in relation to its most dynamic high cost rivals, the Bay Area and Seattle, as well as to those like Austin, Dallas, Denver and Phoenix, that offer lower housing prices, a more pro-business environment, and often more compelling career opportunities. This can be seen in such crucial fields as professional and business services, and in high-technology and finance, where our relative strength, while still impressive, has been stagnant and, in some cases, has even decreased.

Maintaining and then expanding OC’s presence in these fields should be the dominant focus of future development efforts, along with expanding the opportunities for middle-skill jobs. Given the current regulatory environment in California and the likely persistence of high housing prices, Orange County must nurture high wage employment in promising fields like data analytics, med ical technology, and design, which pay enough to allow millennial and Generation X workers to stay here. At the same time, we must maintain our strengths in real estate and finance. Without growth in these select sectors, the county will continue to age rapidly, and become akin to places like Hawaii or Palm Beach, Florida — retirement-oriented communities serviced by low-wage workers.

Read the full report here.

From the generation of ME to the generation of WE

$
0
0

The headlines in 2017 were saturated with stress, ultimately perpetuating the issue by increasing anxiety and fear compounded by loneliness and isolation. The number of Americans with zero close friends, defined as having no one to talk to about ‘important matters,’ has tripled since 1985. Additionally, the General Social Survey found that Millennials, the most connected generation, appeared to rank the highest in loneliness.

In the height of irony, it seems that the more “connected” people are on digital platforms, the more disconnected they feel in person. A sense of belonging is an inherent human need. While Maslow's hierarchy of needs is common knowledge - it seems there is increasingly a crisis in love and belonging. Author Anne Snyder, in her essay, "Millocalists? The Real Story Behind Millennials and the New Localism," writes, “There is a growing craving for life to be lived offline, for human contact to be enjoyed with real handshakes, real meals around real tables, and real care for neighbors, knowing that in a pinch that neighbor will watch out for you in turn.”

The Problem with Ego-Media

The Internet has provided many social media tools to serve one’s self-esteem - Instagram, Snapchat, Facebook, Twitter. This is otherwise known as ego-media, platforms which are designed to highlight the best moments of life and voice personal opinions. Many movies, television shows, and parents encourage children to follow a career backed by passion. This combination of social media and encouragement has led to an unattainable idea of seeking perfection, living up to our fullest potential, and self-actualizing. But self-actualization without a base of belonging is unsatisfying and hollow.

Moving toward a ‘WE-Oriented’ Society

One trend demonstrating a shift in thinking is the idea that mindsets are evolving from ME-orientation to WE-orientation. The effect of satisfying the fundamental need to belong is rooted in this mind shift. Belonging to communities aids in forming a strong sense of self, developing professional success, and even promoting love.

An all-embracing sense of belonging can be obtained through participation in a variety of communities from social to professional:

Professional Networks - as job roles become more specialized, the number of tailored communities across the globe is on the rise. YEC, Growth Hackers, Inbound.org are just a few examples of businesses and organizations helping men and women meet individuals with shared passions.

Company’s Internal Communities - corporations are recognizing the key to employee retention includes a comfortable work environment. Facilitating a space for a brand’s community of employees to feel a sense of purpose and belonging at work is crucial.

Co-working Spaces - with technology providing ease in working remotely, co-working spaces are popping up quicker than ever before. Remote workers and freelancers often experience loneliness and these areas create an opportunity to bridge that gap. The success of WeWork is not solely the result of selling physical spaces - they are selling a community with a sense of belonging.

Social living - people are increasingly interested in knowing their neighbors. In crowded cities, companies like Common.com, which offers dorm style living, are gaining traction. With high housing costs, shared housing is also a way for people to save money.

Social and affinity groups - young parents, hobbies, sports - people have different things that they love to do that give them a sense of identity and community - and they are looking for a way to share this passion, to be around people like them.

Companies that double down on creating communities that connect their customers will realize success in 2018. Communities that will remain strong in the long term will characteristically be defined by genuine conversations, a safe space, and level of authentic engagement. People should truly feel that they belong somewhere, and in the age of fast Internet, mobile phones, and VR - online is everywhere, anytime and for everyone.

Even so, in the age of the internet where communication tools are easily accessible, there is no suitable place online that mimics the elevated feeling of connecting with others in a deep conversation at an event suiting both passions.

Author: Tiffany Kenyon

Photo: Ben Duchac, via Unsplash.

Landless Americans Are the New Serf Class

$
0
0

The suburban house is the idealization of the immigrant’s dream—the vassal’s dream of his own castle. Europeans who come here are delighted by our suburbs. Not to live in an apartment! It is a universal aspiration to own your own home. —Los Angeles urbanist Edgardo Contini

For the better part of the past century, the American dream was defined, in large part, by that “universal aspiration” to own a home. As housing prices continue to outstrip household income, that’s changing as more and more younger Americans are ending up landless, and not by choice.

The share of homeownership has dropped most rapidly among the key shapers of the American future—millennials, immigrants, minorities. Since 2000, the home ownership among those under 45 has plunged 20 percent. In places like Atlanta, Dallas-Fort Worth, Houston, and Indianapolis, and elsewhere, households with less than the median income qualify for a median-priced home with a 10 percent down payment, according to the National Association of Realtors. But in Seattle, Miami, and Denver, a household needs to make more than 120 percent of the median income to afford such median-priced house. In California, it’s even tougher: 140 percent in Los Angeles, 180 percent in San Diego, and over 190 percent in San Francisco.

Rents are rising as well. According to Zillow, for workers between the ages of 22 and 34, rent costs claim upwards of 45 percent of income in Los Angeles, San Francisco, New York, and Miami, compared to closer to 30 percent in Dallas-Fort Worth and Houston.

The basic reality: America’s new generation, particularly in some metros, increasingly seems destined to live as renters, without ever enjoying equity in property.

The Housing Crunch

Last year, the gap between new builds and demand was estimated at 330,000 houses. Nationally, the inventory of homes for sale has been shrinking for 24 straight months, and supply, according to the National Association of Realtors, is nearing its lowest level ever.

Given the surging demand among millennials and immigrants, why are builders not meeting the demand? The reasons vary, but, according to the National Association of Homebuilders, they include higher material costs, long permitting waits, labor shortages, and too few inexpensive lots.

Not all the difficulties, however, can be traced to market forces. In many regions of the country, conscious government planning discourages single-family home construction, a policy often described oddly enough as “smart growth.” Advocates of this approach suggest that most people, particularly millennials, do not want single-family homes, and prefer to live chock-a-bloc in dense multi-family units.

This does not reflect reality. In survey after survey, an overwhelming majority of millennials, including renters, want a home of their own. A Fannie Mae survey of people under 40 found that nearly 80 percent of renters thought owning made more financial sense, a sentiment shared by an even larger number of owners (PDF). They cited such things as asset appreciation, control over the living environment, and a hedge against rent increases. Roughly four in five purchases made by people under 35 are for single-family detached homes (PDF).

The real problem is a growing gap between what people want and what they can afford.
Jason Furman (PDF), the former chairman of President Obama’s Council of Economic Advisers, has warned that price escalations associated with strong housing regulation push many people “out of the market entirely.”

These huge price premiums, particularly stark in California, also plague Denver, Miami, New York, Portland, Seattle, Honolulu, and Boston. Where housing prices once closely tracked rents, they now have shot up in many metropolitan areas far past what renters would ever be able to afford.

In some places the “universal aspiration” has been all but put on hold. Between 1969 and 2015, home prices increased by an inflation-adjusted average of 226 percent in the 10 big metropolitan areas with the largest increases, vastly outpacing the steep enough 65 percent average rise in rents.

Serf’s Up in California

California began to embrace highly restrictive housing policies in the 1970s. Prices in places like Los Angeles or the San Francisco Bay Area were already higher then than the national average, but roughly on track when adjusted for income. Today, after four decades of ever tightening controls and draconian regulations, prices adjusted for incomes are now about three times as high in coastal California as those in traditionally regulated markets.

California’s efforts to force densification, by locking up peripheral land and other strategies, have been a boon to well-placed urban developers because it limits new suburban competition. Rather than respond to market preferences, people are forced to live the way the planners want, creating conditions that permit developers to impose ever higher rents and housing costs.

Not surprisingly, these policies have produced one of nation’s lowest rates of homeownership. The state’s largest metropolitan area, Los Angeles, which includes Orange County, has the lowest homeownership rate of the country’s 75 largest metropolitan areas. Other regulatory factors that drive up California prices include sky-high impact fees charged to new developments, which can add more than $75,000 to the price of a house, more than 10 times the cost in other states (PDF). The impending 2020 mandate for “zero emissions” homes promises to boost that up to six figures.

These costs have become in a sense a form of generational warfare, as the average age of California homeowners keeps rising. According to American Community Survey data, the share of the state’s homeowners over 55 years old has shot up from 41 percent to 55 percent since 2000, while the share of homeowners under 45 years old has dropped by a third. From 1990 to 2016, home ownership among those aged 25 to 34 dropped 18 percent nationally but 26 percent in California. Several economic studies have shown a strong association between high housing prices and net domestic migration, with attention to more than 1 million who have left California for less expensive states since 2000.

Despite these ghastly statistics, California officials have kept doubling down on regulations that drive up housing prices, based in part on the dubious notions that packing people together will lower costs and have a major impact on the climate. Most recently, new legislation concocted by San Francisco state Sen. Scott Wiener would establish state-wide mandates that, according to Slate, “ensure that all new housing construction within a half-mile of a train station or a quarter-mile of a frequent bus route would not be subject to local regulations concerning size, height, number of apartments, restrictive design standards, or the provision of parking spaces.” Like your quaint urban neighborhood, or quiet suburbia? Too bad. If you live within a half mile of transit lines, developers can build what they want and not even your mayor or city council can stop them.

This planning fever, an unprecedented assault on local control, has elicited widespread opposition from cities, neighborhoods, and even some environmentalists and civil rights leaders. Activists in the Crenshaw district in Los Angeles see in the new rules “a declaration of war on south L.A.” Some neighborhoods could literally be “Manhattanized,” which may be fine for Manhattan but not for the millions who moved to California for its sun and space.

This drive to intensify development in already densely packed coastal California has strong backing in the academy and the media, and from some powerful real estate and big tech interests, whose primary goal is to house their largely young, single, and often noncitizen workers in dense quarters near their operations.

But the claim that higher density reduces housing costs to affordable levels is largely bogus (again, see Manhattan!). Dense housing is about three to seven times more expensive to build. Combined with the very high cost of land zoned for high-density development, market prices inevitably end up beyond the means of nearly all Californians. New publicly subsidized “affordable” apartments in one dense Bay Area development are estimated to cost upwards of $700,000 to build—more than the cost of two-thirds of all homes in California, according to our analysis of American Community Survey data for 2016.

Larger units suitable for families are increasingly rare, and even more expensive, so even if the market is overbuilt, they will remain overpriced. Indeed, glorified boarding houses in San Francisco are now offering 250-square-foot or smaller units, many with shared kitchens and bathrooms—and rents that begin at about the median for the Bay Area.

As to improving the environment, even the pro-density UC Berkeley Termer Center acknowledges that virtually banning urban fringe development would account for barely 1 percent of the state’s plan to reduce greenhouse gases (PDF)—pittance for policies certain to drive house prices and rents even higher. On a global basis, that reduction would amount to an 0.003 percent drop in worldwide emissions.

The Human Cost

The long-term impact of depressed ownership will shape our future. It’s no coincidence that the birthrates in the most expensive places—Los Angeles, Seattle, Manhattan, Brooklyn—are among the nation’s lowest.

The pressures on millennials, the dominant group shaping the future, are particularly harsh. In the city of New York, incomes for millennials have dropped in real terms since 2000, despite a considerable rise in education levels in that same span (PDF).

Recent Harvard econometric research associated bloated house price increases with a reduction in birth rates among households that do not already own a home of their own. Similarly, high housing priceswere cited as a cause to delay having children in a recent Bankrate.com survey. In places where housing prices remain around historic levels, such as Dallas-Fort Worth, Nashville, Orlando, and Houston, birth rates are much higher.

As price pressures push middle-income people into what had been low-income markets in the priciest cities, the neediest find themselves with fewer and fewer rental options, notes the National Low Income Housing Coalition—which counts a 4 million unit national shortfall in truly affordable units. For working-class people in Los Angeles, the Bay Area, New York, and Boston, these higher prices claim an ever-larger portion of their income. Nearly 70 percent of poor Californians see the majority of their paychecks go rents, which continue to rise.

High rents are leaving many at the brink of poverty. Adjusted for housing costs, California has the largest share of its citizens living in poverty—well above the rate for such historically poor states as Mississippi. And homelessness has surged in the priciest places, particularly in Los Angeles and New York City, which account for about 4 percent of the national population but 25 percent of its homeless population.

In New York, the homeless population rose 4 percent last year amidst a strong economy; there are a record 75,000 New Yorkers living in shelters or on the streets. And in Los Angeles County, homelessness surged by a boggling 23 percent in the last year—with the largest increase among Latinos, many still working but unable to pay their rent. In Orange County, long a middle-class bastion, large homeless encampments around the riverbeds have been embarrassing to local officials and sparked widespread concern among the citizenry.

What Happens Next

The reduction in the prospects in homeownership combined with the rising rent burden is leading us toward an ever more unequal society—one increasingly divided by class, color, and generation.

Policies that restrict access to homeownership also constitute a direct assault on the future prosperity of the country. Jason Furman calculated that a single-family home contributes 2.5 times as much to the national GDP than an apartment unit.The decline in investment in residential properties has dropped to levels not seen since World War II.

Some people, particularly young and middle-class families, are finding their own solution by moving away from densely packed, highly regulated places like San Francisco, L.A., and New York for less glamorous, but more affordable areas like Dallas-Fort Worth, Houston, and Phoenix.

But even in expensive areas, there remain opportunities to build more housing in ways that do not cause mass displacement or ruin existing neighborhoods. One fantastic opportunity lies in expanding retail vacancies. America has four to five times as much retail space per capita as the United Kingdom or Japan, and Amazon’s dominance and changing consumer tastes mean that perhaps 15 percent or more of all mall space will need to be refitted to new uses in the next five years.

Already there are some pilot projects aiming to take advantage of this shift. Savvy developers like Shaheen Sadeghi’s LAB Holdings are constructing residential and workspaces into old malls in cities across Southern California, and similar plans are underway in Texas.

But ultimately the most cost-effective way to produce more housing remains the traditional one: development on the urban fringe. This is what happens in lower cost, market-driven models like Dallas-Fort Worth, Houston, or Nashville—which all built both multi-family and single-family housing at faster rates than Los Angeles, San Francisco, New York, Boston, and Portland between 2010 and 2016, according to Census Bureau figures.

The density proponents will yell “sprawl.” Yet, that is hardly a concern in California, where urban population densities are the highest of any state, including New York. Los Angeles suburban densities are four times those of Boston or Atlanta and double that of New York.

As MIT’s Alan Berger has noted, modern suburban development also creates environmental benefits, including water retention, species habitats, tree cover, and improved health outcomes. In addition, suggests Britain’s Hugh Byrd, low-density communities are ideally suited for an eventual transition to solar energy generation in ways that high-density ones can’t emulate.

Over time, Berger foresees self-driving cars allowing for “autonomous suburbs” that will expand living space by reducing commuting times and hassles, a finding as well of a recent report by the global consulting firm Bain & Company (PDF). That would leave more people in the exurbs than in the core cities but also allow the cities to recover space from parking garages to create new housing.

The shift to an ever more unequal, congested, and feudal society is not inevitable. We have the capacity to expand housing opportunities for future generations. There is no reason that we need to surrender the universal aspiration that for so long has defined our society.

This piece originally appeared on The Daily Beast.

Joel Kotkin is executive editor of NewGeography.com. He is the Roger Hobbs Distinguished Fellow in Urban Studies at Chapman University and executive director of the Houston-based Center for Opportunity Urbanism. His newest book is The Human City: Urbanism for the rest of us. He is also author of The New Class ConflictThe City: A Global History, and The Next Hundred Million: America in 2050. He lives in Orange County, CA.

Wendell Cox is principal of Demographia, an international public policy and demographics firm. He is a Senior Fellow of the Center for Opportunity Urbanism (US), Senior Fellow for Housing Affordability and Municipal Policy for the Frontier Centre for Public Policy (Canada), and a member of the Board of Advisors of the Center for Demographics and Policy at Chapman University (California). He is co-author of the "Demographia International Housing Affordability Survey" and author of "Demographia World Urban Areas" and "War on the Dream: How Anti-Sprawl Policy Threatens the Quality of Life." He was appointed to three terms on the Los Angeles County Transportation Commission, where he served with the leading city and county leadership as the only non-elected member. He served as a visiting professor at the Conservatoire National des Arts et Metiers, a national university in Paris.

Photo: Via Catalyst Group.


Superstar Effect: Venture Capital

$
0
0

Richard Florida has a new piece over at City Lab analyzing recent data on venture capital from Pitchbook. The conclusion is that venture capital funding is hyper-concentrated, and getting even more so:

"The Bay Area—that is, San Francisco and Silicon Valley—currently accounts for nearly 45 percent of total venture capital investment in the entire United States. And the Acela Corridor, spanning Boston, New York, and Washington, comprises another third. Together, these two geographic regions attract nearly three-quarters of America’s venture capital investment. And, just the five leading metros account for more than 80 percent of total venture capital investment and 85 percent of its growth over the past decade. That’s spatial inequality on steroids."

MetroVC Investment 2017 (millions)Share of U.S. Total 2017
San Francisco$25,21533.20%
New York$12,34416.25%
Boston$8,73711.50%
San Jose$8,34510.99%
Los Angeles$6,5458.62%
Chicago$1,8392.42%
Seattle$1,7342.28%
Washington$1,5512.04%
Austin$1,1741.55%
Atlanta$1,1571.52%
Miami$1,0431.37%

It looks like the big four: the Bay Area, New York, Boston, and LA, completely dominate the charts. This confirms some previous analysis Florida had posted.

The increase in venture capital in America over the previous decade was also extremely concentrated in these cities. SF accounted for 40.1% of the national growth and New York 20.1%. The biggest market outside of the big four is Chicago, which only accounted for 2.8% of national growth.

Click through to read the whole thing.

This piece originally appeared on Urbanophile.

Aaron M. Renn is a senior fellow at the Manhattan Institute, a contributing editor of City Journal, and an economic development columnist for Governing magazine. He focuses on ways to help America’s cities thrive in an ever more complex, competitive, globalized, and diverse twenty-first century. During Renn’s 15-year career in management and technology consulting, he was a partner at Accenture and held several technology strategy roles and directed multimillion-dollar global technology implementations. He has contributed to The Guardian, Forbes.com, and numerous other publications. Renn holds a B.S. from Indiana University, where he coauthored an early social-networking platform in 1991.

Photo: Michael Caven, via Flickr, using CC License.

Southern California’s Growing Demographic Dilemma

$
0
0

For much of the past century, Southern California has been driven by ever increasing population growth. That area has now ended as the region’s demographics stagnate, a trend that, according to the latest Census numbers, is, if anything, accelerating. This follows a distinct national trend, notes demographer Wendell Cox, where the largest metropolitan areas are losing domestic migrants and growing far slower than smaller, often less expensive regions.

But even among the nation’s largest metropolitan areas, the Los Angeles-Orange County region’s growth rate last year dropped precipitously — .19 percent — less than one third the average for the country’s 53 largest metro areas. By itself, Los Angeles’ rate was even lower, an insignificant .13 percent. Overall, L.A.-Orange County ranked lower than all but Chicago and Detroit among the top 20 major metropolitan areas.

One reason: growing net out-migration. The Los Angeles-Orange area — which already lost well over 350,000 migrants between 2010 and 2016 — ranked fourth from the bottom of the nation’s 53 largest metro area last year, ahead of only of New York, Chicago, and, surprisingly, San Jose. Despite a somewhat improved economy, L.A.’s area’s rate of outmigration in 2016-2017 was 40 percent over the annual average since 2010 average while the O.C. outmigration rate nearly tripled.

The one area that continues to grow remains the Inland Empire. The population rose 1.26 percent last year, more ten times that our Los Angeles-Orange, and net in-migration rose by more than 80 percent. Although its rate of growth is far slower than a decade ago, the Inland region’s growth reflects a broader national trend that is seeing shifting population away from dense metropolitan areas with dense urban cores and towards generally more suburban regions.

Read the entire piece at The Orange County Register.

Joel Kotkin is executive editor of NewGeography.com. He is the Roger Hobbs Distinguished Fellow in Urban Studies at Chapman University and executive director of the Houston-based Center for Opportunity Urbanism. His newest book is The Human City: Urbanism for the rest of us. He is also author of The New Class ConflictThe City: A Global History, and The Next Hundred Million: America in 2050. He lives in Orange County, CA.

Photo: Al Pavangkanan, via Flickr, using CC License.

What the Census Numbers Tell Us

$
0
0

The most recent Census population estimates revealed something that the mainstream media would prefer to ignore—the slowing population growth of big cities, including New York. The New York Times, for example, trumpeted Gotham’s historically high population yet failed to mention that the city’s growth is not only dramatically slowing but also, in the case of Brooklyn, declining for the first time since 2006. New York’s rate of growth, impressive earlier in this decade, now ranks among the nation’s lowest, mostly because of rising domestic outmigration. In 2017, nearly three times as many domestic migrants left the city as in 2011. This may be one reason why rents, which have soared for a decade, have begun to flatten, though they remain at a level many potential newcomers may still find difficult to afford.

New York’s population slowdown is hardly unique. Many of the largest U.S. metropolitan areas have seen domestic outmigration surge over the last few years. The highest-percentage declines were found in Los Angeles, Chicago, New York and, remarkably, tech-heavy San Jose, which ranked worst among 53 metropolitan areas with populations above 1 million. Last year, the San Francisco Bay Area’s seven metros experienced outmigration more than ten times higher than the annual average since 2010. This includes the “boomtown” San Francisco metropolitan area, which attracted domestic migrants from 2010 through 2015 but saw strong net outmigration last year. At 0.60 percent, San Francisco’s 2017 population growth was half its post-2010 average. In 2017, population growth in Los Angeles was among the lowest in the nation, and at 0.19 percent, down two-thirds from its annual average since 2010.

Read the entire piece at City Journal.

Joel Kotkin is executive editor of NewGeography.com. He is the Roger Hobbs Distinguished Fellow in Urban Studies at Chapman University and executive director of the Houston-based Center for Opportunity Urbanism. His newest book is The Human City: Urbanism for the rest of us. He is also author of The New Class ConflictThe City: A Global History, and The Next Hundred Million: America in 2050. He lives in Orange County, CA.

Wendell Cox is principal of Demographia, an international public policy and demographics firm. He is a Senior Fellow of the Center for Opportunity Urbanism (US), Senior Fellow for Housing Affordability and Municipal Policy for the Frontier Centre for Public Policy (Canada), and a member of the Board of Advisors of the Center for Demographics and Policy at Chapman University (California). He is co-author of the "Demographia International Housing Affordability Survey" and author of "Demographia World Urban Areas" and "War on the Dream: How Anti-Sprawl Policy Threatens the Quality of Life." He was appointed to three terms on the Los Angeles County Transportation Commission, where he served with the leading city and county leadership as the only non-elected member. He served as a visiting professor at the Conservatoire National des Arts et Metiers, a national university in Paris.

Photo: s.yume, via Flickr, using CC License.

The Urban Containment Effect (Zoning Effect) on Australian House Prices

$
0
0

In delivering the Annual Report of the Bank to the House of Representatives Standing Committee on Economics, Finance and Public Administration on August 18, 2006, (now former) Reserve Bank of Australia Governor Ian MacFarlane expressed concern about Australia’s house prices, which had escalated severely in relation to incomes.

"…why has the price of an entry-level new home gone up as much as it has? Why is it not like it was in 1951 when my parents moved to East Bentleigh, which was the fringe of Melbourne at that stage, and were able to buy a block of land very cheaply and put a house up on it very cheaply? Why is that not available? Why is that not the case now?"

MacFarlane told the Committee that “that reluctance to release new land plus the new approach whereby the purchaser has to pay for all the services up front—the sewerage, the roads, the footpaths and all that sort of stuff—has enormously increased the price of the new, entry-level home. That is a supply-side issue, not a demand-side issue.” MacFarlane questioned whether the existing “land release policies” are “front-loading of all charges” are the right set of policies.

Urban Containment

For context, by the time of MacFarlane’s testimony virtually all Australian states as well as the Australian Capital Territory (Canberra) and the Northern Territory had adopted land release policies characterized by urban containment strategies (called “urban consolidation” in Australia) with urban growth boundaries (or equivalent). These policies severely ration or even prohibit new houses from being built on the urban periphery.

These policies mimic those of Great Britain, which spread not only to Australia, but also to other metropolitan areas around the world (such as Vancouver, Portland, Seattle, San Francisco, Toronto, Auckland and many others). It should not be surprising that much higher land prices are associated with urban containment’s rationing of land, much like petroleum prices shot up during the oil embargoes of the 1970s. Meanwhile, corrective policy reforms have not been implemented by the states and housing affordability has deteriorated compared to median household incomes and inflation, as is clear by looking at Sydney (Figure 1).

Another central banker, former Governor of the Reserve Bank of New Zealand, Donald Brash explained the consequences: “...the affordability of housing is overwhelmingly a function of just one thing, the extent to which governments place artificial restrictions on the supply of residential land.”

The New Reserve Bank of Australia Published Research

This insight is illustrated by a new report by Reserve Bank of Australia (RBA) economists Ross Kendall and Peter Tulip (The Effect of Zoning on Housing Prices). According to supplemental data published with the report, the effect of overly restrictive land use regulations, which the authors call the “zoning effect,” had added considerably to the cost of the detached houses that most Australians prefer. By 2006, the zoning effect had already added 55% (nearly $155,000) to the cost of a house in the Sydney metropolitan area, up from 21% in 2000. This phenomena was also significant by 2006 in the three other largest metropolitan areas studied by Kendall and Tulip, Melbourne, Brisbane and Perth, where the zoning effect added from $74,000 to $98,000. Australia’s other major metropolitan area (more than 1,000,000 population), Adelaide, was not included in the analysis, though its housing affordability is now the third worst, behind Sydney and Melbourne.

The Zoning Effect Urban Containment Effect

Actually, the term “zoning effect” is insufficiently precise. There are plenty of arguments for and against zoning, but zoning’s effect on housing affordability between metropolitan markets was only marginal until metropolitan areas began adopting urban containment. Pre-urban containment zoning, such as parking requirements, permitted uses in small areas of a municipality and building lot sizes have not been associated with housing affordability differences that can “hold a candle” to the huge differences caused by urban containment.

It was only with the imposition of urban containment policies that the huge disparities in housing affordability emerged, whether in Australia, the United Kingdom, or New Zealand, as well as the troubled U.S. markets. For example, traditional zoning did not seek to outlaw the housing most people preferred, or ban building outside the already built-form. Urban containment represented a “sea-change,” a radical turn in urban land use policy. Indeed, urban containment is urban planning’s “killer app.” The term “zoning effect” is far too broad. The more appropriate term would be “urban containment effect.”

The Urban Containment Effect in Major Australian Cities (2016)

The message of the RBA report is that houses are more costly because as a result of urban containment. According to the research, and assuming typical mortgage provisions, (Note) the urban containment effect (our term) adds from $150,000 to nearly $500,000 to house prices in major Australian metropolitan areas --- this is not the house price, but the additional impact of urban containment (Figure 2). The urban containment adds up to $29,000 to annual payments on the average house in Australia’s major metropolitan areas (Figure 3).

• In Sydney, the urban containment effect adds $489,000 to the house price making the annual mortgage payments $29,000 higher. Figure 4 shows the components of the average house price in Sydney.

• In Melbourne, the urban containment effect adds $324,000 to the house price, making the annual mortgage payments $19,000 higher.

• In Brisbane, the urban containment effect adds $159,000 to the house price, making the annual mortgage payments $9,000 higher.

• In Perth, the urban containment effect adds $206,000 to the house price, making the annual mortgage payments $12,000 higher.

• No data is available for Adelaide, but the present median multiple (median house price divided by median household income) suggests that urban containment effect adds at least $13,000 to the mortgage.

These are significant amounts, especially to families starting out and renters who would like to participate in the proverbial “Great Australian Dream” of home ownership.

The Less Lucky Country (At Least for Some)

Australia is one of the world’s most prosperous countries and Australians enjoy a high standard of living. Home ownership is fundamental to all of this, as the “Great Australian Dream” illustrates (we Americans only have an “American Dream,” without the “Great”). It is not without justification that Australia has been called the “lucky country.” But for those forced to accept a lower standard of living because of its unnecessarily high housing prices, Australia has become a “less lucky country.”

To Restore the Great Australian Dream

Tony Recsei, the President of Save Our Suburbs in Sydney suggested the needed policy reform in a letter to the Australian Financial Review, the Australia’s premier business publication:

The obvious solution is to bring back competition by allowing any landowner on the outskirts to subdivide subject to reasonable environmental constraints. The result decrease in prices will flow through to all markets. This will not suit land hoarders, but will provide our young people with the opportunity to own their own home.

Recsei gets to the heart of the matter. Public policy should seek to maximize the standard of living and minimize poverty. Urban containment does the opposite.

Under the current policy framework, housing affordability is likely to continue getting worse. The RBA researchers were not so much concerned about stronger, recently enacted regulations. They noted that regulation has not been materially strengthened 2000, but that nearly all the urban containment effect had added much more to the price of houses just because as demand has risen, the effects have gotten stronger. In this observation the researchers raised an issue usually missed --- that when land use regulations are too tough, they continue to drive prices higher, unless reformed.

So long as Australian cities have housing markets distorted by urban containment, more and more Australians will be denied the “Dream.” And, it can be expected that more investors, foreign and domestic, will be drawn to Australia’s rigged housing markets. It is as if a “Speculators Welcome” sign has been hung from the Sydney Harbour Bridge (photograph above), a boon to speculators but a bane to the ordinary aspirations of Australians.

Note: Assumes a 5 year fixed rate 30 year mortgage, with monthly payments (from the Westpac Mortgage Repayment Calculator, https://www.westpac.com.au/personal-banking/home-loans/calculator/mortga...).

Wendell Cox is principal of Demographia, an international public policy and demographics firm. He is a Senior Fellow of the Center for Opportunity Urbanism (US), Senior Fellow for Housing Affordability and Municipal Policy for the Frontier Centre for Public Policy (Canada), and a member of the Board of Advisors of the Center for Demographics and Policy at Chapman University (California). He is co-author of the "Demographia International Housing Affordability Survey" and author of "Demographia World Urban Areas" and "War on the Dream: How Anti-Sprawl Policy Threatens the Quality of Life." He was appointed to three terms on the Los Angeles County Transportation Commission, where he served with the leading city and county leadership as the only non-elected member. He served as a visiting professor at the Conservatoire National des Arts et Metiers, a national university in Paris.

Photograph: Sydney Harbour Bridge (by author)

What Can We Do to Reduce the Spike in Pedestrian Deaths?

$
0
0

The recent pedestrian death by a self-driving Uber car brought renewed attention to a major problem in this nation, pedestrian deaths, which have risen from 4,000 to 6,000 annually in just 2 years!

An increasing number of people are walking and biking, resulting from a renewed awareness in the health benefits of a stroll over a drive. Today’s driver is distracted not only by their smart phone but a multitude of screens with cumbersome touch controls distracting the driver.

The Urban Planners Agenda:

New Urbanists and Smart Growth guidelines have been against the use of autos, promoting public transportation, biking and walking instead. The good news is, we actually do walk and bike more. However, against their preferences, we also drive more.

The recommended urban guidelines position walkways in close proximity to the street. Their recommended short blocks swell the number of intersections significantly, endangering pedestrians further. Throw in a few pesky roundabouts with pedestrian crossings - and that danger skyrockets.

To make matters worse, we are an aging population. A young person hit by a car at 25 MPH has a good chance of survival – not so with a 60 year old person hit at the same speed.

There are a few actions YOU can take to reduce the number of deaths.

First: When buying that next car, if it’s available with an automatic braking system that sees pedestrians – BUY IT. You need not be limited to a Volvo, even the 2018 Mustang can be purchased with pre-collision assist that can recognize pedestrians – at night!

Second: If you are involved in the land development process, either as a developer, a designer, or a regulator, how can you reduce pedestrian deaths?

It’s quite simple:

From a design perspective: Do the opposite of a New Urban TND (Traditional Neighborhood Design i.e. Grid) and instead, design the pedestrian interface separately of the vehicular system.

Instead of decreasing the walkway proximity to the street – increase it.

Instead of increasing the number of intersections – decrease them.

Instead of building more streets for walking connectivity – decrease them. Build more walkways as a separate system.

Design Automation: Want to know how to kill a pedestrian? Press a button in CAD to instantly create walks one foot inside all right-of-way’s.

The regulatory minimum walk width is not necessarily a functional width.

Designing an elegant walking system sized for actual use, that gracefully meanders as far from the curb line as possible, will encourage a stroll and be safer. The increased (walk to curb) distance solves another major headache when street trees mature, destroying walks and curbs by their roots.

Crosswalks at the intersection are another automated design process in CAD. Drivers in traffic are watching for other cars and may not notice a person walking or biking at the crosswalk.

Roundabouts with traffic are much worse, yet automated design places the walks at the worst possible locations. Why? Because it’s always been done this way, not for decades, but for centuries.

A safer design requires thinking and effort, using logic to pull pedestrians as far away as practical from danger spots. Yet smart growth advocates have implemented the most illogical methods by increasing conflict points and proximity to vehicular traffic.

Developers can demand better design from their consultants. If the consultants they are paying a significant sum to, are simply allowing the CAD system to create a design, they are not getting what they are paying for – the best possible neighborhood.

The reliance on automation has dumbed down the industry. Hire those who actually design, not just CAD operators (draftsman). Builders can demand better and safer neighborhoods to build their homes. Safety sells, so it will help expedite a home sale if in a safer neighborhood.

Cities can do a better job regulating. The pedestrian systems we have in place today have their basis from the days when speed limits were limited by the ‘gallop’ of a horse’s stride, which coincidentally is 25 to 30 miles per hour!

The typical regulatory 4’ wide (or less) sidewalk on both sides of the street is too narrow for a couple to walk side-by-side, so they are likely to walk in the street instead. A 5 or 6’ wide walk on one side of the street is more usable, especially if there is an independent trail system that connects through the area supplementing the walks. Yet, few city regulations address these options and instead replicate wording from past centuries, long before two ton cars with hundreds of horsepower existed.

A properly designed pedestrian and street system will reduce accidents without hampering vehicular flow.

There are many actions everyone can take – and especially those involved in the land developing process. You can be instrumental in increasing pedestrian safety and reduce this unnecessary problem.

Rick Harrison is President of Rick Harrison Site Design Studio and Neighborhood Innovations, LLC. He is author of Prefurbia: Reinventing The Suburbs From Disdainable To Sustainable and creator of LandMentor. His websites are rhsdplanning.com and LandMentor.com

Viewing all 3794 articles
Browse latest View live


Latest Images