Quantcast
Channel: Newgeography.com - Economic, demographic, and political commentary about places
Viewing all 3788 articles
Browse latest View live

If the tech oligarchs can’t beat the bad press, they’ll just buy it

$
0
0

What’s an oligarch to do? The putative tech masters of the universe now face unprecedented criticism from both left and right. The reasons extend from wanton privacy invasions of the people once described by Facebook’s Mark Zuckerberg as “dumb f***ks” to President Trump’s typically hyperbolic assaults on Amazon’s success at tax avoidance.

The public so far still does not disdain the tech oligarchs as they do Wall Street or energy firm but they are clearly threatened, both politically and in their wallets. Their once seemingly unstoppable hold of the capital markets also has started to slip somewhat as investors begin to worry about a potential decline in social media as well as technical failures undermining the value of companies like Uber, Tesla and Snapchat.

Not that the oligarchs will change their ways without coercion. Mark Zuckerberg, amid the uproar, still seems determined to block privacy protections in California or elsewhere. Facebook’s arrogance has even incited tension between the tech overlords, with Apple’s Tim Cook assaulting Mark Zuckerberg for privacy violations. The fact that Cook did this in Beijing, world capital of advanced surveillance, makes the public spanking ever more bizarre.

Read the entire piece at The Orange County Register.

Joel Kotkin is executive editor of NewGeography.com. He is the Roger Hobbs Distinguished Fellow in Urban Studies at Chapman University and executive director of the Houston-based Center for Opportunity Urbanism. His newest book is The Human City: Urbanism for the rest of us. He is also author of The New Class ConflictThe City: A Global History, and The Next Hundred Million: America in 2050. He lives in Orange County, CA.

Photo: ali asaria, via Flickr, using CC License.


Deconstructing “Yimbyism”

$
0
0

California’s housing crisis has emboldened grandstanding Sacramento politicians who measure their own “success” by the number of bills they can pass with their own names attached.

We now have Scott Wiener’s SB827, a bill which would use “mass transit” (defined as four buses an hour during rush hour) to eliminate local governments’ ability to zone single-family housing and to replace locally crafted General Plans with increased density levels dictated by Sacramento politicians.

SB827 would effectively eliminate any protections for single-family housing in cities and allow developers to build up to ten-story buildings without any input, control or recourse from local communities. It’s the Developer Industrial Complex’s dream come true.

Wiener’s SB827 is the absolute wrong prescription to deal with the housing crisis.

Despite Wiener’s attempts to blunt criticism by making some cosmetic amendments to SB827, the bill continues to be opposed by a wide variety of diverse communities and social justice organizations such as the Crenshaw Subway Coalition. And last week, the LA City Council, hardly a bastion of reaction, rejected it by a 13 to 0 vote.

So who’s backing Wiener’s bill? It’s the oddest combination of special interests and committed densifiers, many of whom have banded together under the moniker of “Yimby,” which wittily and ingeniously changes the pro-density pejorative “Nimby,” “not in my back yard,” to “yes in my back yard”. On the one hand we have hardline Ayn Rand “free market” property rights advocates, who in principle oppose government regulation; on the other hand, we have radical ideologues, who think zoning is inherently “racist” and that opponents are selfish people who want to exclude people from their neighborhoods. Wiener’s bill seems to have created a curious case of “intersectionality,” including Cliven Bundy-style radical libertarians and those partial to Soviet style top-down planning.

The Yimby movement

Although sometimes characterized as a product of the left, the “Yimby” movement is largely funded by Silicon Valley billionaires who seek to cram tech workers into expensive multi-family housing as well as developers who don’t like pesky zoning restrictions or environmental protections. The alliance of developers and tech oligarchs look to Yimbyism as a means to eliminate zoning and environmental restrictions in order to increase profits. Should it surprise anyone that developers and developer interests represented the largest donor base to senator Wiener?

Sonja Trauss, a professional Yimby who runs San Francisco BARF (Bay Area Renters Federation), openly endorses indiscriminate building, fiercely defending the rights of “those who haven’t moved to the Bay Area yet.” Her notion is based on a simplistic supply-side argument which argues that we can somehow build our way out of the housing crisis and into affordability.

Trauss and her supporters seem unconcerned that, given the costs of constructing multifamily housing, particularly in coastal California, this will likely increase new luxury housing. The theory is that the luxury housing would relieve the pressure for this market sector and ultimate filter down to create affordability.

These “trickle down” theories are singularly ill-suited for application to the housing crisis. For one thing, they don’t consider the phenomena of absentee landlordism and speculation. How many foreign investors, for example, might purchase condos for speculative purposes or as second homes which they might occupy for only a few weeks a year?

Trauss’s “build, baby, build” pseudo-solutions fail to take into account the demonstrated results of densification by design. The most unaffordable markets in Australia, Canada, Great Britain as well as the United States are those that are generally densest and, in many cases, prevent construction of housing where it is most affordable --- the periphery.

Yimbys are not as interested in stabilizing the system and solving the crisis for those who already live here but in creating housing for future residents. In fact, Yimby anti-zoning policies lead directly to the displacement of existing residents, including many lower income groups and minorities.

Wiener’s bill, rather than a boon for affordable housing, is a potential bonanza for well-placed developers. Developers hate having to pay for parking for their projects. Check that: SB827 eliminates parking requirements near bus stations, even if public transportation, compared with driving, takes triple the amount of time to get from Point A to Point B. Developers hate design review, as they don’t want to be bothered with such niceties as aesthetics. Check that: SB827 eliminates design review requirements. Developers hate to enter into development agreements with municipalities, which would provide for additional public benefits, including funding necessary to provide services. Check that: SB827 gives them by-right development rights, representing an exponential increase in property values and profits – all without having to negotiate additional public benefits or give municipalities an extra nickel.

This comes at a time when cities are notoriously bad at extracting benefits from developers whose profits they enable. Rather than look to strengthen cities’ ability to make good deals with developers, which would create revenue cities could use to provide residents services or even build affordable housing, SB827 literally gives away the game away by taking away their leverage.

In fact, by taking zoning out of the hands of municipalities, SB827 will also cause cities to incur significant additional expenses in the form of more staff needed to serve more residents, just for starters. The scraps from the table which municipalities would receive in the form of some fees and taxes would in no way counterbalance the additional expenses.

"Transit-Oriented Development"

Ultimately, the whole notion of TOD (“transit-oriented development”) which is the main rationale for SB827, is itself a backward-looking mid-20th Century concept, which ignores developments in technology and advocates transit “solutions” which could soon be obsolete or, at best, second-best. Communities and regions should instead look to 21st Century transit and urban models such as AOD (“Autonomous Oriented Development”), which look to the ways in which technology can and will impact commuting patterns and even the notion of commutes themselves.

In fact, some of the decreasing ridership in LA’s MTA system has been explained by poor people, including illegal immigrants who now can get drivers’ licenses under state law, and who now are moving away from expensive areas near transit and themselves abandoning public transit in favor of driving. This is no small wonder since public transportation can often take exponentially more time to reach a destination even in the worst LA rush hour traffic.

Ultimately self-styled "progressive" senator Wiener is pushing for the single largest wealth transfer in modern California history for the benefit of wealthy developers. So, with Scott Wiener, at least, the word "progressive" actually means: "regressive." We are truly living in a world which would put Lewis Carroll to shame (not to mention Orwell and Huxley).

Naturally, Wiener is in denial about the rabbit hole he has gone down. Wiener claims he has “no issue” with single-family homes. He and his handlers claim he never said that he considers single-family housing to be “racist.” But, despite the senator’s denials, many of the most ardent supporters of SB827 have made it clear that they consider single-family housing to be “racist.”

In defending SB827, Senator Wiener himself wrote the following: “Severely limiting density around transit perpetuates an ugly American reality: that restrictive low-density zoning has historically been a tool to exclude people of color, especially African-Americans, and poor people from neighborhoods. Indeed, low-density zoning – banning apartment buildings – was invented shortly after the U.S. Supreme Court ruled that racially restrictive zoning laws were unenforceable.”

The irony of this statement is that most of the people who actually live in our City today were excluded from doing so under the covenants which were in effect in the very early years. Some things, thank goodness, do change for the better.

Clearly, actions speak louder than words: SB827 could eliminate more than 90% of single-family housing in San Francisco, more than 50% in Los Angeles, and a figure somewhere in between that in Beverly Hills, literally destroying many communities. “Community” with a capital “C” is the most elemental form of human beings coming together to live among one another; the concept of Community is an extension of the concept of family. SB827 would not only destroy Beverly Hills, but a multitude of unique communities throughout the state.

But, hey, at least ideological purity would be served by eliminating much of that “racist” form of housing.

Ideological purity is why Wiener and the radical Yimbys would burn down all urban planning theories which don’t conform to their own notion of density. They are convinced that only their level density is the only “right” way to live and would impose their dogma on everyone else by force.

At its core, that’s what SB827 is about.

This kind of ideological Yimbyism is marked by a complete lack of tolerance about divergent views or lifestyle choices. It represents an urban planning form of totalitarianism – or Soviet-style master planning at its finest.

Needed: More Humanity and diversity

A humanistic urban planning perspective, on the other hand, accepts that people are individuals and respects that individuality by embracing a multitude of living options. From single-family housing to ultra-dense, Manhattan-style living, along with everything in between, humanistic urban planning offers choice and diversity.

Far be it from Wiener & Co., their corporatist sponsors or academic boosters to look at people as dynamic, living, breathing and, yes, individual human beings, who go on to form dynamic, living, breathing and, yes, individual communities. For them, all too often, human beings seem to just widgets, stats or marks.

But cities are in many ways like human beings themselves. And the best, most successful communities develop and grow organically. Once a community has reached the urban planning version of its ideal height and weight, it can continually try to improve and regenerate itself. It can improve roads. It can add municipal fiber (something that Sacramento politicians are now trying to ban). It can replace failed buildings while protecting character-defining ones. It can work out rules to stabilize rents and encourage continuity.

But if outside forces, like zealot planners or politicians with an agenda, attempt to force feed the community, if they shove forced development down the community’s throat, then the community will become bloated and unhealthy, and its arteries will clog.

If Scott Wiener and his Yimbys were really interested in solving the housing crisis they would fight to bring back redevelopment agencies which could fund truly subsidized housing. They would help empower municipalities to share substantially in developer profits and to use the funding generated to create truly inclusionary housing.

And, overall, they would try to create a nexus between job magnets which create a demand for housing and those corporations profiting from the growth. He’d get his Silicon billionaire buddies and their corporations to step up and pay for housing in cities and communities which would welcome the investment.

But Scott Wiener, his Yimbys and their Big Developer allies aren’t really interested in solving the housing crisis.

They’re interested in profiteering from it.

And they don’t care if they have to destroy communities to do it.

Vice Mayor John Mirisch has served on the Beverly Hills City Council
since 2009, including as mayor in 2013-2014 and 2016-2017. He created the City's Sunshine Task Force in 2013 to increase transparency and public participation in local government.

Photo: Via SocketSite

World Urban Areas: 1,064 Largest Cities: 2018 Update

$
0
0

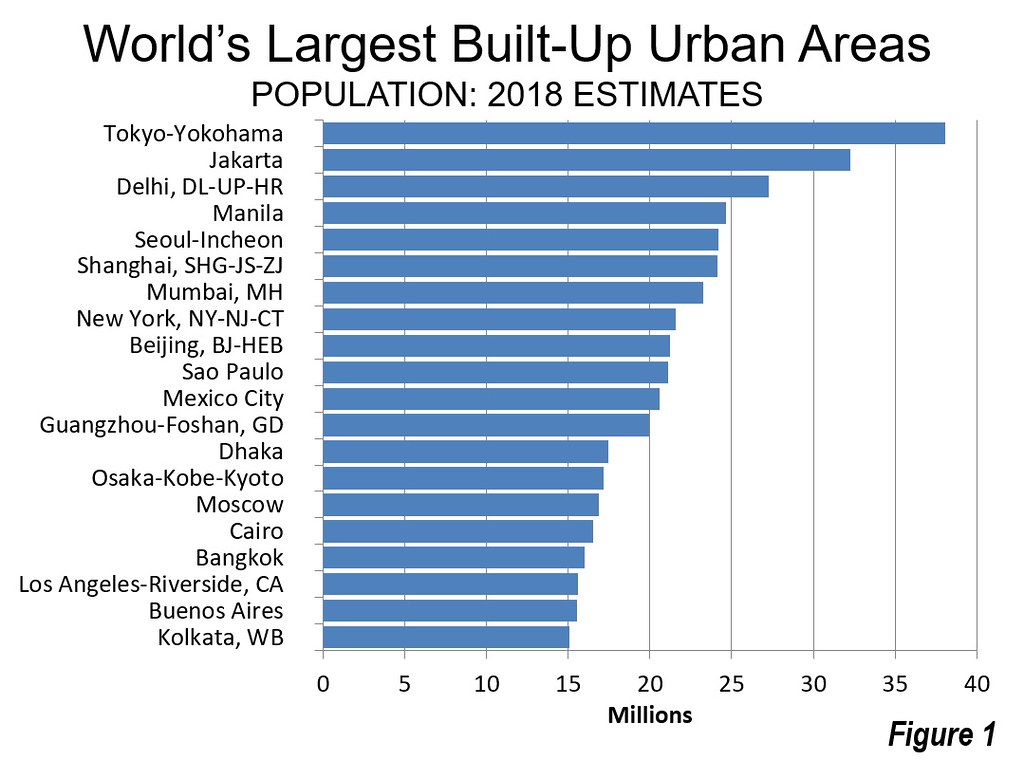
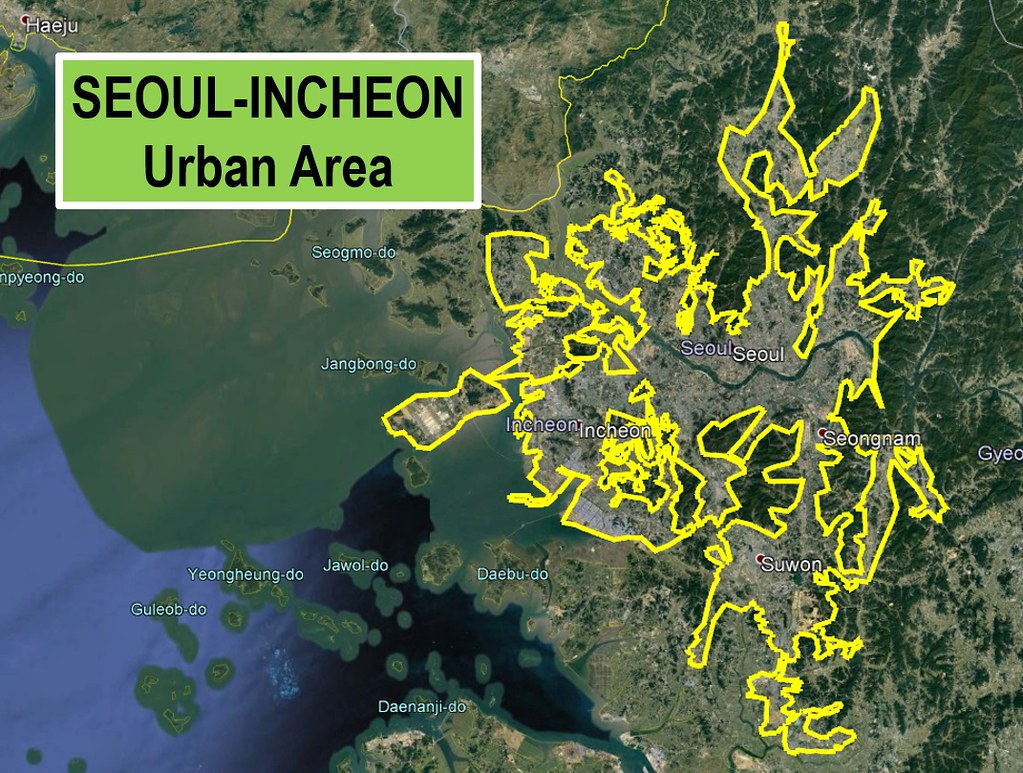
This year, as in 2017, there are 37 megacities --- urban areas estimated to have more than 10 million residents. The 20 largest urban areas are indicated in Figure 1. Tokyo-Yokohama continued to be the largest, as it has been for more than six decades. Second ranked Jakarta and third ranked Delhi continue to edge up on Tokyo-Yokohama. Even if their much faster growth were to continue at the current rate, neither would assume the top position over Tokyo-Yokohama until after 2030. The top five is rounded out by Manila and Seoul-Incheon (Figure 2). The balance of the top ten includes Shanghai, Mumbai (Figure 3), New York, Beijing and Sao Paulo.

The 14th Annual Demographia World Urban Areas contains data on the 1,064 urban areas that have been identified as having more than 500,000 residents in 2018 (Note: Estimating Urban Density). Table 2 in the report lists all of these urban areas in order by population. Table 1 is a world summary of urban density data.

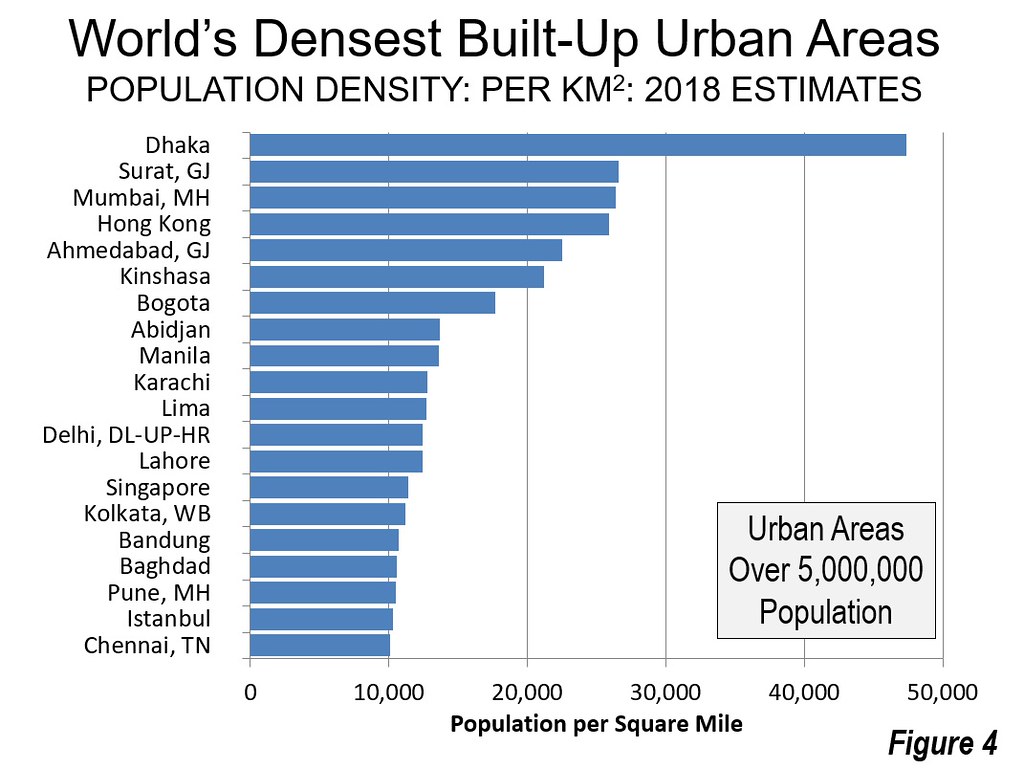
Table 4 in the report lists the 1,064 urban areas in descending order by urban density. The 20 densest urban areas with more than 5,000,000 population are shown in Figure 4 (below). Dhaka remains by far the highest density urban area, with 123,000 residents per square mile (47,000 per square kilometer). Dhaka’s urban area of 17.4 million residents ranks as the 13th largest in the world and stands among the fastest growing. With a land area only 368 square kilometers (142 square miles), the Dhaka urban area covers less land than the city (municipality) of New York, covers 97 percent less land than the New York urban area, is five times as dense as the city of New York, and 25 times as dense as the New York urban area.

The second densest large urban area is Surat (Gujurat), India, at 69,000 residents per square mile (27,000 per square kilometer). Four other large urban areas exceed 20,000 per square kilometer; India’s Mumbai, Hong Kong, Ahmadabad (Gujarat), India and Kinshasa, in the Democratic Republic of the Congo. The 20 densest large urban areas include only two in the high-income world, Hong Kong and Singapore. Both have artificially high densities because geo-political factors have made development of suburbs virtually impossible.

World Urban Population and Median Urban Area

As has been widely reported in recent years, more of the world’s people live in urban areas than in rural areas for the first time in history. The urban population has risen to 55.4 percent, according to the United Nations. This does not mean, however, that most people live in megacities or even the largest cities.

Based on the current population estimates, it is estimated that the median sized urban area has approximately 645,000 residents, the size of either Tyumen (Ural District), Russia or Cape Coral (Florida), United States. These urban areas are tied for 831st largest in the word.

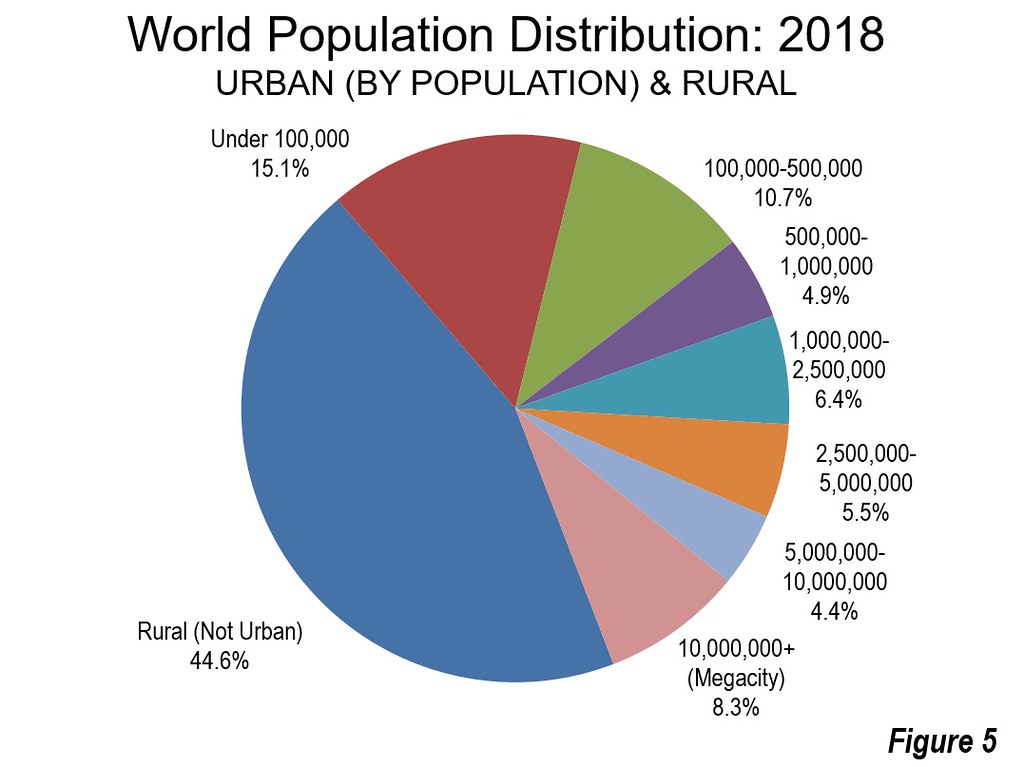
More than 70 percent of the world’s urban population lives in urban areas with less than 500,000 population and in rural areas. The megacities, those with more than 10 million population, have 8.3 percent of the population (Figure 5).

World Urban Areas Aggregate Population Densities

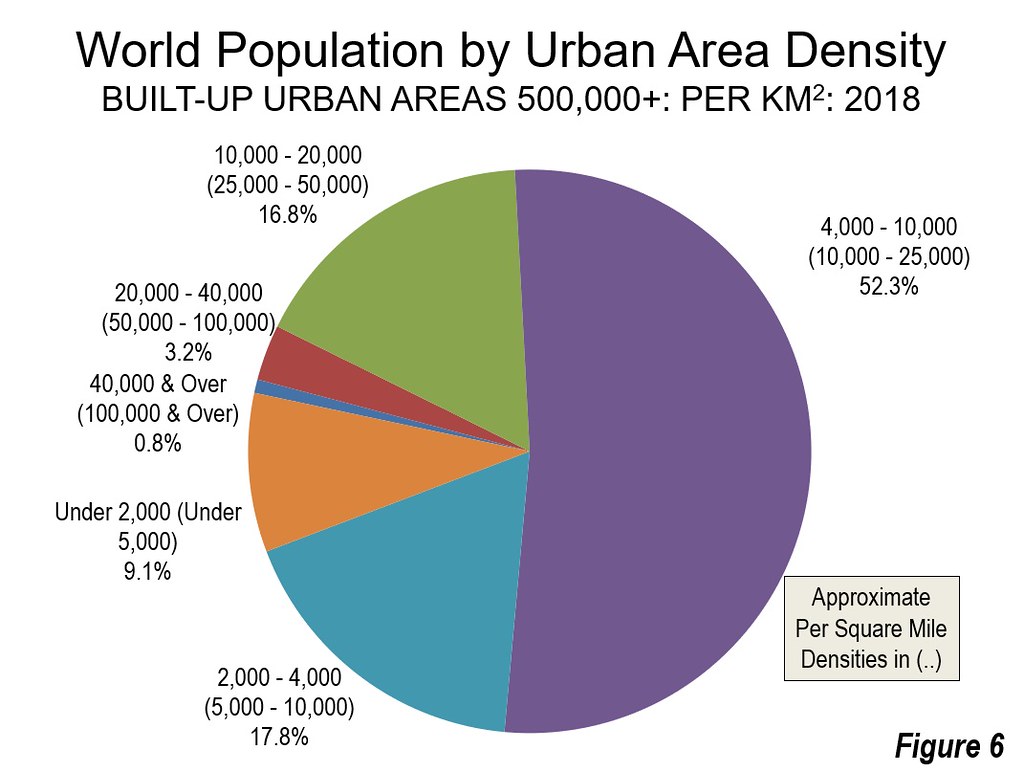
Much of the population (52.3 percent) in the 1,064 urban areas over 500,000 population lives at densities between 10,000 and 25,000 per square mile (4,000 and 10,000 per square kilometer). Approximately one-quarter lives at higher densities, and one-quarter at lower densities (Figure 5). Few high-income urban areas will be found in higher density categories.

Geographical Distribution of the Largest Urban Areas

As the world has become increasingly more urban, more of the largest urban areas are outside Western Europe, Canada, the United States and Japan, which had the largest affluent cities in the world in the second half of the 20th century. The United Nations publishes historical lists of the 30 largest urban areas in the world, starting with 1950 and in five year increments following that. In 1950, these nations contained 16 of the 30 largest urban areas in the world, according to the United Nations. London was ranked 3rd, and Paris ranked 5th. Osaka-Kobe Kyoto, then ranked 4th. Others that have fallen from the top 30 include Chicago, Philadelphia, Detroit, Boston, San Francisco, Rome, Milan, Barcelona, Berlin and Manchester.

In 1950, the United States had seven of the 30 largest urban areas in 1950; by 2018 that number has fallen to two.

Globally, urbanization continues apace, with the United Nations projecting that by 2050 66 percent of the world’s population will be urban. By current trends, few or perhaps no urban area from Western Europe, the United States, or Japan will break into the top 30. The modest growth rates in New York and Los Angeles could take these out of the top 30 as well.

Note: Estimating Urban Density

Demographia World Urban Areas is in its 14th year of publication. It was established for the purpose of bringing some consistency to the subject of urban density, in hopes of replacing often grossly invalid anecdotal comparisons between cities. The built-up urban area is the only level at which there is sufficiency consistency and sufficient data to estimate the urban densities of the urban organism at anything approximating international standards.

Demographia World Urban Areas uses base population figures, derived from official census and estimates data, to develop basic year population estimates within the confines of built-up urban areas. These figures are then adjusted to account for population change forecasts, principally from the United Nations or the various national statistics bureaus for a 2018 estimate.

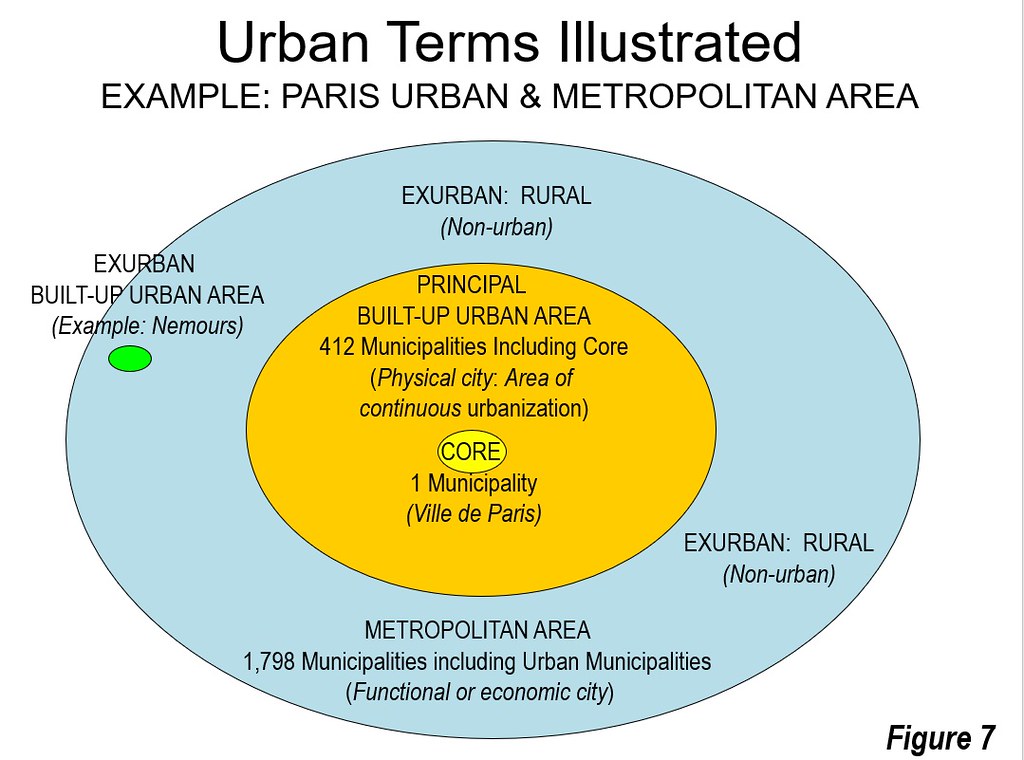
There continues to be considerable confusion about the measurement of urban densities. The key is in comprehending the differences between urban areas and metropolitan areas. Built-up urban areas are continuously built-up development that excludes rural lands. Built-up urban areas are the city in its physical form, as opposed to metropolitan areas, which are the economic or functional cities (the labor and housing markets). These terms are defined by Cheshire, et al. of the London School of Economics (see: “People rather than places, ends rather than means: LSE economists on urban containment”).

The built-up urban area is the only level at which there is sufficient data to estimate the densities of the urban organism (see: “Density is not the issue: The Urban Scaling Research”) at anything approximating international standards. Even with this data, the science of urban area density is in its infancy. Demographia’s principal aim has been to advance the state of urban density comparisons. Academics and the press have all too often been led by faulty data into comparisons in which (1) data that includes huge rural areas and is therefore not urban (2) includes only parts of urban areas that are not at all representative of the urban form (the urban organism). An example of the first is metropolitan areas, which by definition include rural areas and cannot possibly be reflective of urban density, such as in the United States. The second is illustrated by the ville de Paris, which is only a small part of the Paris urban area (Figure 7).

Demographia World Urban Areas was the first source to identify the under-estimation of population in some of the world’s largest urban areas, due to the significant under-estimation of urban land area by other sources. For example, Demographia’s early estimates of the Jakarta, Delhi, Manila, Seoul-Incheon and Kuala Lumpur urban area populations were far higher than reported by others at the time. Other sources have revised their estimates upward. The earlier, lower estimates of others were, in actuality, municipal estimates that did not sufficiently take into consideration the spread of urbanization beyond city or other geographical limits. Demographia’s larger population estimates were the result of examining actual satellite maps to determine the extent of individual built_up urban areas. As has been noted elsewhere, the improving satellite maps have permitted greater accuracy in later years. Similarly, in many cases, Demographia’s estimates have been lower than reported elsewhere for the opposite reason --- satellite examination has often shown other urban area estimates to include rural areas, which are by definition not urban.

Wendell Cox is principal of Demographia, an international public policy and demographics firm. He is a Senior Fellow of the Center for Opportunity Urbanism (US), Senior Fellow for Housing Affordability and Municipal Policy for the Frontier Centre for Public Policy (Canada), and a member of the Board of Advisors of the Center for Demographics and Policy at Chapman University (California). He is co-author of the "Demographia International Housing Affordability Survey" and author of "Demographia World Urban Areas" and "War on the Dream: How Anti-Sprawl Policy Threatens the Quality of Life." He was appointed to three terms on the Los Angeles County Transportation Commission, where he served with the leading city and county leadership as the only non-elected member. He served as a visiting professor at the Conservatoire National des Arts et Metiers, a national university in Paris.

Photograph: Cover from the 14th Annual Demographia World Urban Areas.

Is Mass Media Good or Bad For You and Your Family?

$
0
0

Since the internet, and particularly smartphones, became household commodities, mass media's impact on people and societies has increased exponentially.

As you might expect, there is a swinging pendulum of public opinion which often shifts from decrying the ills of this trend to extolling the many virtues of on demand technology.

Whether you tend toward the former or latter opinion, it's obvious that mass media and social media are having profound effects upon individuals and society as a whole. Many people are concerned about the implications of these effects, and find themselves asking questions like:

• How is media affecting me?

• How is mass media impacting the next generation?

• How do video games change us?

• How does on-demand media impact health?

• Is mass media truly important?

• How do we use mass media and social media well?

• Is mass media a good thing?

Answering these questions can help you to be smart about how you interact with the constant barrage of media being directed at you and your family.

So let's think through the implications of mass media together so that we can come to informed conclusions.

How Does Mass Media Affect You?

Many are wondering mass media, and social media in particular, is a good thing or bad thing. Of course, for every type of media, there are a host mixed opinions, some based on research, some not. Neil Postman was asking these same types of questions over the mass adoption of the television.

On the one hand, a positive use of technology and mass media enables people to become informed, collaborate in innovative ways, or stay in touch with friends and family. On the other hand, these same connections can be used for dangerous cyber crime.

Social media can help people to feel connected and happy, to connect with old friends and make new ones. However that same social media can lead to depression or anxiety, when life doesn't meet the expectations created by perfectly edited profiles.

The internet may be a source of motivational messages, videos, or blog posts that improve your life and increase productivity or healthy living. However, it's just as possible that these very messages can prevent you from getting out there and living.

These are just a few examples of the vastly different ways media can impact our daily lives.

Because mass media affects each person differently, you need to look at your own life to make informed decisions.

Where do you fall on the pendulum? How does your use of social media affect your mood, productivity, and sense of well being? If you tend more toward the negative impacts – depression, anxiety, inactivity – it may be time to limit your media consumption.

What Is the Impact of Mass Media on Children?

Television is the best researched area of mass media effect on children. It has the potential to help, and to harm, as is true with most media types.

Many negative effects have been recorded, and kids often spend more time watching television than on any other activity. However, if the television time includes educational programming and parent supervision, the power can be harnessed to help with learning and have positive effects.

With this in mind, parents must think critically about how their children are consuming television. Are they largely involved in what and how often their children are watching, or is it more of a hands-off experience?

This is perhaps even more important to think through now that most "television" consumption consists of Netflix, Hulu, and other streaming platforms.

Making the decision to be diligent about these decisions now will improve children's interactions with television, and prepare them to interact well with other types of media as they mature.

What is the Impact of Media on Teens?

Media often is described as harmful to teens, and while this is certainly true in some circumstances, it can be best understood as having mixed effects.

The key is to be aware of how mass media and social networking affect the brain so that you can make intentional decisions about how to use it.

Some positive effects include:

• Motor skills are improved by typing, clicking, playing games, and other tech related finger skills.

• Hand eye coordination or even quick thinking can be helped.

•Access to mass news media can improve reading skills.

• Social network activity is theorized to improve writing and socializing skills.

Additionally, the content of media stories or social media posts can be useful and meaningful to teens. With platforms like YouTube and Instagram, they have access to people's stories they might never have heard otherwise. In this way, teens may learn that many others are experiencing similar struggles to their own, giving courage and confidence.

However, there are significant negative effects as well.

Negative effects include:

• Depression or anxiety over body image

• Normalizing violence

• Unfettered access to pornography

• Increased risk of obesity from inactivity

• Decreased attention to schoolwork

Knowing about these potential risks of social and mass media consumption is important for both teens and their parents. In this respect, knowledge really is power, as it will enable both parties to be strategic about the role of media in their lives.

Read more about media communication master’s in communication options.

What About Video Games?

Video games are a frequent concern, particularly as technology continues to advance and gaming becomes more and more realistic. Research shows some mixed effects from video game use.

Though the problem solving and dexterity skills employed can lead to higher intelligence or better motor skills, the violent or other disturbing content in games is of high risk to well being. It's established that seeing violence can desensitize one to its effects.

As with other types of media mentioned, it's critical that parents exercise caution about what types of games their children play and how often they do so.

Does Mass Media Damage Health?

The proliferation of mass media and electronic devices has had profound effects on health. There are numerous physical problems which may arise from this consumption, particularly if left unchecked.

The effects of smartphones often first show up as eye strain and neck pain, the inevitable result of constant screen-time and often slumped positions while using these devices. Obesity is a risk if much time is spent in sedentary activity.

Some research shows links between mass media consumption and anxiety and depression. There can be a change in happiness, social skills, and peace of mind that is attributed to media and the internet.

It is most important to monitor your happiness and health, and correlate them with your own practices so you can make informed decisions for your or your family's well being.

Read more about health communication master’s in communication options.

How Can You Protect Yourself and Your Family?

There are many recommendations for being wise with media consumption.

Parents must be familiar with current sites and channels, and the types of content that their children come into contact with. Ask questions and browse with your child. Set clear and appropriate ground rules for young ages, which then build a strong foundation for future responsible use.

Make sure to discuss the difference between fantasy and reality with your children. If exposed to gratuitous violence and sexuality, children and teens should know these are fantasy, and not the norm or real life. The dangers of violent and risky behavior should be a topic of conversation.

For almost any age from 1- 99, limiting media to a few hours per day is reasonable and enforceable. Discuss education, values, and the intrusion of media regularly with your family.

Conclusion

There is no definitive answer to whether mass media is "good" or "bad". Research has shown that it can have both positive and negative effects, and often these effects are dependent on how the media is being used and consumed.

The solution isn't to totally cut yourself off from all mass media or to wholeheartedly embrace every facet of it. Rather, it must be carefully analyzed and evaluated. If you're a parent, you need to help your children understand both the positives and negatives of things like video games, social media, and streaming television.

Unless you plan on moving to an isolated island with no internet connection, this issue isn't going away. The best approach is to tackle it head on, rather than hoping things just work themselves out.

Many people are choosing to engage with mass communication head on with master’s degrees in mass communications. It’s with this progress we are able to understand the effects of mass media and other emerging social channels have on society currently and in the foreseeable future.

This piece originally appeared on MastersInCommunication.org.

John Hawthorne is a health nut from Canada with a passion for travel and taking part in humanitarian efforts. His writing not only solves a creative need it has also lead to many new opportunities when traveling abroad.

Constitutional Localism Will Heal American Democracy

$
0
0

America is amid a period of intense stress on its political and governmental values and institutions. Two of the leading candidates for President in the last election said our politics was “rigged,” and one of them won.

A recent poll by the Democracy Fund Voter Study Group found that nearly 30% of Americans would prefer government “with a strong leader who doesn’t have to bother with Congress and elections” or even “army rule” to our current constitutional democracy. For those of us who regard freedom and democracy as the cornerstones of American identity this is alarming.

To heal our body politic and restore faith in our democracy, we need a new civic ethos or governing framework that doesn’t revolve around the largely homogenous society with uniform beliefs that emerged post-World War II, To provide better governance and reinforce the appeal and practicality of our democratic processes, America must replace its increasingly obsolete New Deal civic ethos with one that better reflects the times in which we now live.

The current deadlock in Washington, a major source of the growing disillusion with democracy, reflects the difficulty of forging broad national policy majorities in a nation characterized by extraordinary cultural, demographic, generational, racial and ethnic differences. Some say the only way to make America work again is through leadership that “brings us together” by reestablishing greater cultural and lifestyle conformity. We disagree and see an ever more varied nation as the product of freedom, choice, and dynamism.

Instead, we propose an innovative approach which we call Constitutional Localism. It is built on a civic ethos that intentionally shifts the greatest possible number of public decisions out of Washington and the state capitals to the community level, albeit within a clear Constitutional framework that protects the individual freedoms and rights won over the last 250 years.

Of course, certain responsibilities, such as enforcing and interpreting the Constitution, conducting foreign relations, providing national security, monetary and fiscal policy, and regulating inter-state commerce must remain at the assigned federal level. States also retain critical responsibilities under their own constitutions and must deal with some issues on a multi-community basis. But, Constitutional Localism argues for a system which prefers that decision making be as close to the citizens as possible. That is where consensus and effective solutions are most likely to emerge.

Already there is growing evidence that America’s diverse local communities are successfully displacing states as the new “laboratories of democracy,” by finding their own innovative solutions to problems. Their smaller scale and generally greater cultural, ethnic, and economic homogeneity make it easier to achieve consensus and find solutions to challenges that elude effective response in Washington and state capitals. Issues related to the environment, economic development, education, the social safety net, crime and health care are being crafted at the local level, with much less controversy and contention than attempts to address the same problems at the federal level. Both economic and social innovations are taking root more readily in localities than at more distant and bureaucratic levels of government.

We believe intentionally supporting a systematic shift of governance from the federal and state levels down to communities offers two benefits. In the near term, moving key public decisions to local venues with greater cultural and political homogeneity and smaller scale will result in more successful public responses to citizens’ needs that will improve lives.

In the longer term, effective local democratic decision-making will provide the successful governing experiences needed to rebuild the country’s belief in democratic decision-making. This is a critical formula for democratically governing a vast nation with a highly fragmented set of cultural values and lifestyle preferences.

Maintaining the “Constitutional” part of Constitutional Localism is critical to its success. Increased local preferences must not be allowed to risk the divisions that would arise from any attempt to undo the historical consensus on individual and civil rights the country has struggled to achieve for 250 years. A bias towards local action cannot be an invitation to individual communities for selective secession from the Constitution. For the shifting of certain public decisions to the local level to work, it must build upon the expansion of rights that so many have fought for in a way that aligns with our Constitution and Bill of Rights. For this reason, we call our proposed new civic ethos Constitutional Localism and believe it is the right way to preserve American democracy in these trying times.

We believe—and history seems to demonstrate—that America periodically needs a new civic ethos to move forward. We believe this is one of those times, and that Constitutional Localism offers the best path to heal American democracy and preserve it for future generations.

Mike Hais, Doug Ross, and Morley Winograd are co-authors of a new book, Healing American Democracy: Going Local, which you find on Amazon.

Dr. Michael Hais has served as Vice President for Entertainment Research at Frank N. Magid Associates. He earned his PhD in Political Science from the University of Maryland.

Doug Ross is a former Michigan State Senator, U.S. Assistant Secretary of Labor, and candidate for Governor. More recently, he has founded and led a number of public charter schools in Detroit.

Morley Winograd is a Senior Fellow at the University of Southern California’s Annenberg School Center on Communication and Leadership Policy. Morley Winograd and Mike Hais are co-authors of three books on the millennial generation. Mr. Winograd is also the President of the non-profit Campaign for Free College Tuition.

Population Transformation in Pittsburgh and Chicago

$
0
0

Out of the 53 metro areas with more than a million people, only four lost population last year. The two biggest losers were Pittsburgh and Chicago.

Both cities are ones where a significant cadre of local boosters brush off population loss, arguing that a closer look shows that they actually are undergoing a demographic transition that is actually putting them in a stronger position. So let’s take a look.

In Pittsburgh’s case, you have a city that was devastated by the steel collapse, lost a generation of people, and now skews very old. Pittsburgh is the only metro area in the country with natural decrease in population. That is, more people are dying than being born. Pittsburgh’s natural decrease last year was -3,825. Pittsburgh also has net domestic outmigration, last year to the tune of -8,633. However, a good chunk of these are likely retirees; the top net migration destination for Pittsburgh is Florida.

However, Pittsburgh’s share of young people with degrees has been surging. It added over 50,000 of them since 2000, an increase rate of 52% that was tops in the Midwest. Their share of young adults with college degrees increased by over 14 percentage points. This is a big contrast to regions like Detroit and Cleveland, which in addition to their poor headline demographics, had low growth in young adults with degrees. Pittsburgh’s international migration isn’t particularly high at 4,359, but I believe is mostly highly educated immigrants.

Folks like Christopher Briem and Jim Russell have already written voluminously on Pittsburgh so I won’t say more.

Chicago is another interesting case. Chicago’s population problems seem to be driven by three factors, which are different from Pittsburgh:

1. The continuing loss of black population, especially in the city but also in the region.

2. A collapse in Mexican immigration (which had been Chicago’s biggest source of new immigrants).

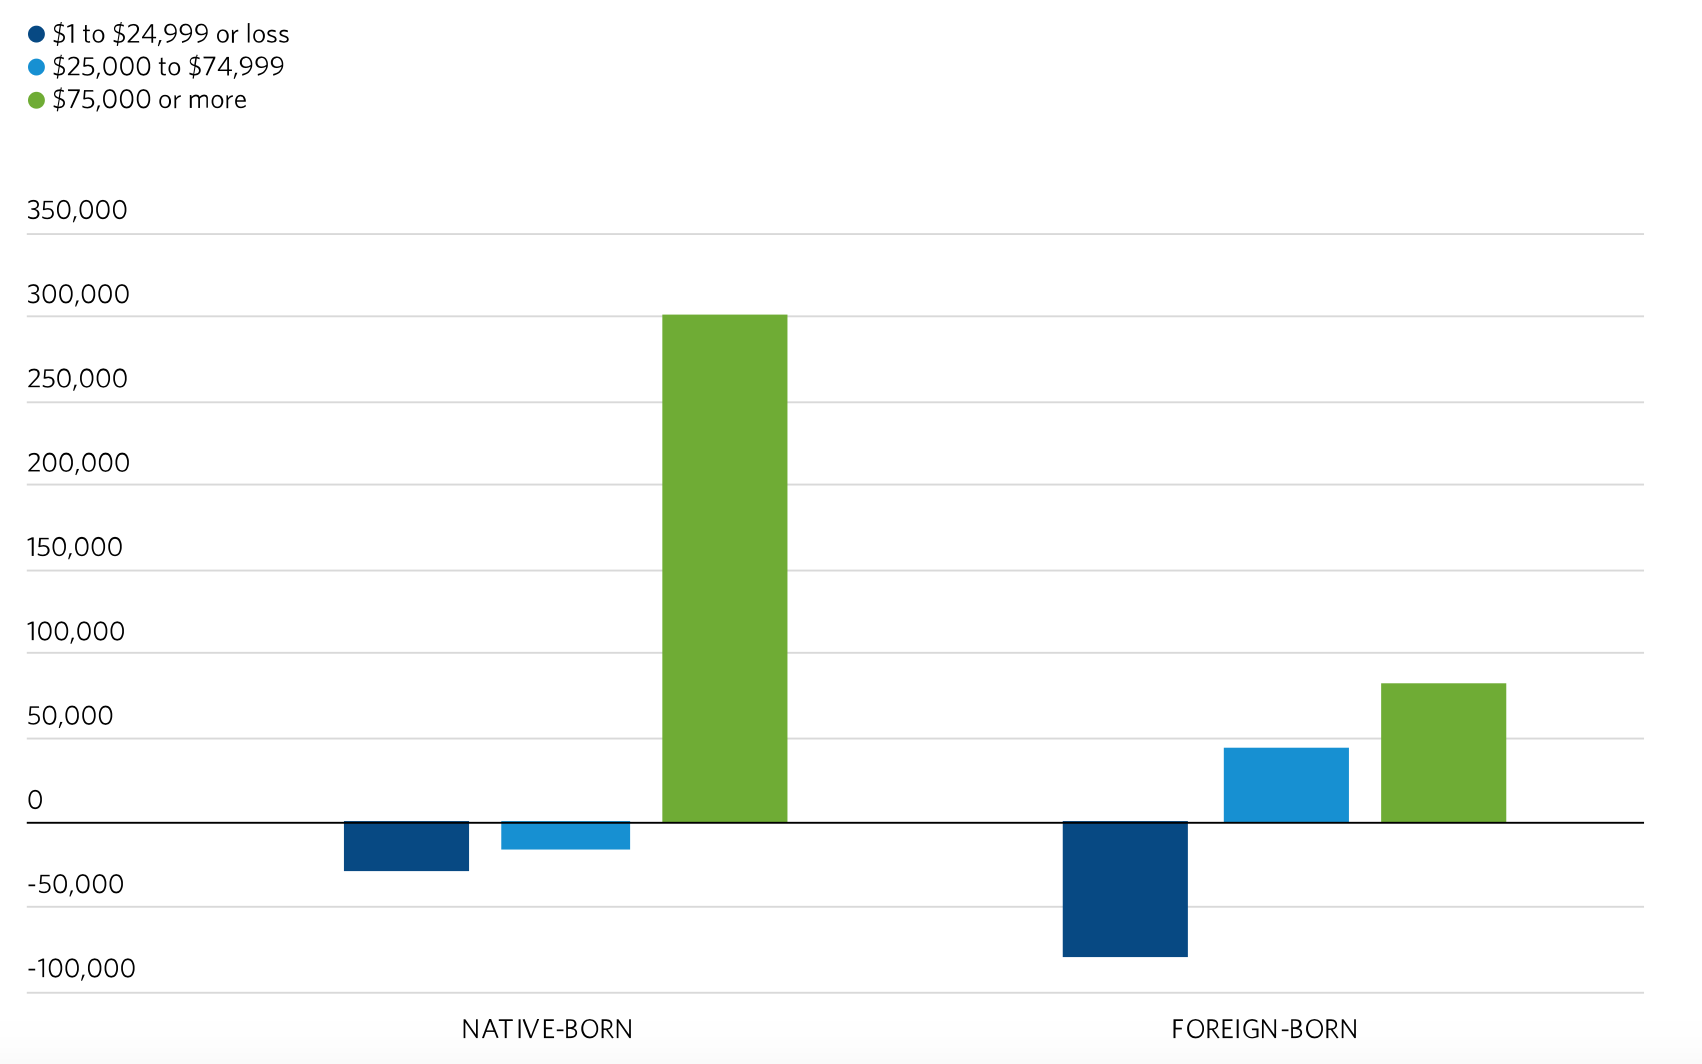
3. A significant migration loss from people making less than $75,000 per year, and especially less than $25,000 per year.

None of these forces appear to make the upscale classes of Chicago sad. You certainly don’t hear anyone sounding the alarm about black population loss, and saying that the city needs to do something about it. In fact, the city’s ineffective policing would appear to be a contributor to driving blacks out, meaning black population decline is de facto public policy.

Likewise, the community seems blasé about the collapse in immigration. We are constantly assured that a steady flow of immigrants is a necessity for urban success. Back when the immigrant flow was positive, you’d hear local boosters talk about how Mexican immigration saved Chicago, and well as the frequently cited (as it turns out) poorly substantiated claim that 26th St. was the busiest retail strip in the city apart from Michigan Ave. But now that the Mexicans aren’t coming anymore, all of a sudden it’s no longer a big deal civically.

As for the loss of lower earning population, the Chicagoland Metropolitan Agency for Planning (CMAP) published a recent study on this. Interestingly, it was timed with the census estimates release, but does not really draw on them for its conclusions on this point. It would appear that they had some of this analysis in the can, and were anticipating that the census data would be bad news. Here’s their chart:

Again, I’m not hearing people shed a lot of tears over this.

As the CMAP study indicates, Chicago has been attracting a large number of high end earners and highly educated people, especially to the North Side of the city. This part of the city is booming.

Pete Saunders has described the situation in Chicago as “one-third San Francisco, two-thirds Detroit.” (Interestingly, author Andrew Diamond appears to have jacked Pete’s formulation by calling it“a combination of Manhattan smashed against Detroit.”) The surge in high education, high income residents, combined with black population loss, a collapse in low skill immigration, and a bleed off of lower education, lower income residents should shift the ratio in the city over time, maybe towards 50% San Francisco, 50% Detroit.

That kind of demographic shift would give the city of Chicago a composition closer to those of coastal elite cities, which is probably one reason it is tacitly desired by many locals. (Increasing tax rates actually fuels this transition as well, so the fiscal mess will be an accelerant).

Beyond troubling questions of equity – see this Atlantic piece on Chicago’s divide – it’s unclear whether this is something Chicago can actually pull off successfully. For one thing, it is almost entirely a city phenomenon. Most of the positive analysis on Chicago focuses on the city proper, or even subareas of it. It’s harder to generate great stats on the region.

Weak population dynamics also affect things like the housing market. Chicagoland has more underwater mortgages than New York and LA combined. Chicago’s housing market was dead last in appreciation among major markets last year – even worse than Cleveland. Demographics will be a drag on the region in ways like this.

A more elite city in a demographically declining region and state also has downsides. Those elite sectors of the city will be called on to pay the bills for everyone else, just as happens in California and New York. Can the Greater Loop and North Side of the city generate enough wealth to pay the freight for the rest of a sclerotic Illinois? It’s hard to say.

So like Pittsburgh, Chicago is not just in demographic decline, but also in part in demographic transition. Where that leads is a question only the future will tell.

This piece originally appeared on Urbanophile.

Aaron M. Renn is a senior fellow at the Manhattan Institute, a contributing editor of City Journal, and an economic development columnist for Governing magazine. He focuses on ways to help America’s cities thrive in an ever more complex, competitive, globalized, and diverse twenty-first century. During Renn’s 15-year career in management and technology consulting, he was a partner at Accenture and held several technology strategy roles and directed multimillion-dollar global technology implementations. He has contributed to The Guardian, Forbes.com, and numerous other publications. Renn holds a B.S. from Indiana University, where he coauthored an early social-networking platform in 1991.

Photo: Tim Tierney [CC BY-SA 4.0], from Wikimedia Commons

Suburbs Could End Up On the Cutting Edge of Urban Change

$
0
0

Over the past decade, the old urban model, long favored by most media and academia, became the harbinger of the new city. We were going back to the 19th century, with rising dense urban cores, greater densities and thriving transit systems.

That paradigm now lives on in myth and media, but not so much in reality. As the census data this year, and indeed since at least 2012, suggests, Americans continue to do what they have done for at least a half century – spread out, innovate and, in the process, re-create the urban form.

Growth shifts to smaller places

Over the past several decades, the welcome recovery of select urban “legacy” cores – San Francisco; Chicago; Seattle; Washington, D.C.; and, most importantly, New York – has dominated the discussion of the urban future. Now these areas are experiencing a decline in growth rates, largely due to accelerating out-migration.

In contrast, the fastest growth is taking place in sprawling areas like Riverside-San Bernardino and Sunbelt metros such as Dallas; Orlando, Fla.; Phoenix and Las Vegas. These areas now lead in gains of both people and, increasingly, jobs. Midwestern redoubts like Columbus, Ohio; Indianapolis, Ind.; Omaha, Neb.; and Des Moines, Iowa; are growing far faster than core-dominated regions like New York, Chicago or San Francisco.

Overwhelmingly, suburbs are where most growth is happening. Since 2010 suburbs and exurbs have produced roughly 80 percent of all new jobs. Even tech growth is shifting, with more of the action taking place in like Orlando, Charlotte, N.C. (each at 7 percent); Grand Rapids, Mich. (6 percent ); Salt Lake City; Tampa, Fla.; Seattle; Raleigh, N.C.; Miami and Las Vegas.

Read the entire piece at The Orange County Register.

Joel Kotkin is executive editor of NewGeography.com. He is the Roger Hobbs Distinguished Fellow in Urban Studies at Chapman University and executive director of the Houston-based Center for Opportunity Urbanism. His newest book is The Human City: Urbanism for the rest of us. He is also author of The New Class ConflictThe City: A Global History, and The Next Hundred Million: America in 2050. He lives in Orange County, CA.

Photo: Via West Des Moines

The High Speed Rail 2018 Business Plan – A Classic Model Of Deception

$
0
0

The California High Speed Rail Authority has released its 2018 Business Plan. It portends to finally reveal the true cost for construction of Phase I of the project. The new cost estimate is at a base of $77.3 billion to a possible $98.1 billion dollars. Completion of Phase I is now projected for year 2032. Please remember the old promise to the voters was the project would be running by 2020 and the cost to California voters would be $10 billion (the rest of the $32 billions needed to build Phase I would come from Federal and private sources).

Looking a bit beneath the headlines, we find many questions that are not explained. Phase I as defined in the 2008 Prop 1A ballot measure, runs from the Trans Bay Terminal (TBT) in San Francisco to LA Union Station and Anaheim. This new business plan suddenly truncates the route to start at the 4th and King Street station in San Francisco, not at the TBT. Estimated costs for the needed tunnel from 4th and King to TBT are at $3.9 billion. This cost should have been included in the business plan but was omitted.

Furthermore, $400 million in Federal Funds for the needed “train box” to service the HSR trains at the TBT has already been spent, and is not included in Phase I projected costs.

Adding in these costs drives up projected cost estimates for Phase I to a range of $81.6 to $102.4 Billions.

Looking further, we now find, due to the lack of funding for a complete Phase I, the new plan essentially is building commuter lines in the Central Valley (Madera to Bakersfield) and Gilroy to San Francisco (using existing Caltrain tracks on the Peninsula).

The citizens of Southern California are being short-changed, and will have to be satisfied with funding of a couple hundred million dollars, to upgrade a rail intersection, and maybe an upgrade of LA Union station.

The published example train schedule shows no mention of a trip from San Francisco to LA in 2 hours 40 minutes; a trip time mandated in Prop 1A. No indeed. We are now on notice that such a trip would be 3 hr 30 minutes at best and many travel times on some runs are up to 5 hours in length.

The new plan delays construction of the needed tunnel to connect the Central Valley to the Bay Area and needed tunnels to connect Bakersfield going south to Los Angeles. These tunnels must wait for funding which is nowhere to be found.

The dream of the Authority and Governor Brown to construct a High Speed Rail line in California is indeed dead. What is now to be built are disconnected tracks claimed to improve commuter / passenger routes, mostly in the Central Valley and Silicon Valley. And by the way, a guarantee of Prop 1A, was no operating subsidies would ever be required to run the train. What commuter service do you know, that doesn’t require a subsidy?

The new business plan is not a plan for a State wide High Speed Rail project. No one should be deceived by the colorful pictures and non-existent funding which is so artfully displayed in the plan.

Now is the time to stop this project!

This piece originally appeared on Fox & Hounds.

Morris Brown is the founder of DERAIL, the original Grass Roots group opposing the High Speed Rail project.

Photo: Via ENR.com


Boomers: Meet the Plurals

$
0
0

America is fascinated by the skill, pluck, and personal composure of the students from Parkland, Florida who survived the horrific shooting at Marjory Stoneman Douglas High School on Valentine’s Day. Their initial quick success in getting the recalcitrant Florida legislature to make some modest changes to one of America’s loosest set of gun laws brought a ray of hope to a nation depressed by the inability of its civic institutions to accomplish just about anything. When the same students organized the March for Our Lives national protests demanding stricter gun laws and drawing hundreds of thousands of people to demonstrations in Washington and across America, many adults were captivated by these young people who proved ready to take on the toughest of political challenges, even in the face of long odds against their winning.

The March for Our Lives was a great coming out party for members of the Pluralist generation who have been growing up in the shadow of their better-known predecessors, Millennials. For liberal Baby Boomers, it was a chance to relive the glory years of their own youth and claim the new generation as their own.

But Plurals differ from the Boomer generation in several critical ways that make them less the heirs to the older generation’s political style and more like the rarely-commented-upon Silent Generation that preceded the Boomers. Silents were born from 1925-1945 and have the unfortunate distinction of being the only generation to not have seen a President elected among its members, although not for want of trying in recent years by Senator John McCain and Vice-President Joe Biden. Even “their war”, the Korean conflict, ended in stalemate rather than victory, leaving nothing to celebrate and little to talk about.

There are, however, some famous Silents whose role in our nation’s history suggests what lies ahead for the Pluralist generation. Boomers like to think that they invented Rock n’ Roll, but the first of that genre’s stars, Elvis Presley, was very much a Silent, if in name only. Boomers also like to take credit for the civil rights victories of the 1960’s, and some of its members were certainly important in Mississippi and Alabama as part of the Freedom Riders as well as in North Carolina’s lunch counter sit-ins. But the spiritual leader and supreme strategist of the movement was Reverend Martin Luther King, a Silent who was assassinated fifty years ago this month at age 39. Still alive and continuing her fight is one of the foremost leaders of the Feminist movement, Gloria Steinem, born in 1934, more than a decade before Boomers were even a twinkle in their parent’s eyes. So, while Boomers immediately sought to draw a straight line between the Plurals’ March for Our Lives and their own marches against the war in Vietnam, history suggests a more direct generational line runs to Silents and their efforts to change America in essentially more fundamental ways than Boomers ever accomplished.

Plurals are also much less divided than Boomers were in their 1960’s heyday and still remain so a half century later. Many of the nation’s cultural wars began in the clashes between Boomer anti-war demonstrators and the equally Boomer National Guard troops sent out to challenge them. Echoes of those confrontations can be heard today in Congress and on cable news networks as Boomers invest much of their energy in settling old scores with their ideological opponents rather than solving problems.

Plurals would prefer to take small steps toward their goal, as they did in Florida, rather than bask in the purity of their cause. But they are also more determined to achieve their goals; in contrast, many Boomers, once their attempts to completely remake America failed, retreated and focused their efforts on the pursuit of money and personal satisfaction. Plurals are more likely to exhibit the type of determination to succeed eventually that their 19th century generational counterpart did as the heroine in the movie, “True Grit.” That personality trait — grit — is one that Plurals’ parents have tried to drill into their children. The evidence so far suggests they were successful.

All of which is not to say that Boomers are either a particularly good or bad generation, just that they are different from Plurals. Baby Boomers’ role in our history was to challenge through rebellion and ridicule a conformist culture that had gone stale and lost its purpose and sense of values. That’s not the problem facing American today, nor is it the way Plurals will go about making their mark on our nation’s history.

Instead, Plurals are destined to play a role like the one the Silent Generation played after World War II--smoothing out society’s disruptions and divisions with straight talk and being willing to compromise. Should such efforts fail, as they well might about national gun control legislation, we are sure a Martin Luther King - or Gloria Steinem - like figure will arise to take the problem head on and make major, lasting change in doing so. (As Silents ourselves, we also hope that a Pluralist Elvis Presley will come along and overturn the current status quo in popular music.)

When they do all these things and more, Plurals will prove once again the wisdom of the maxim that America gets the generation it needs about every twenty years. So welcome Plurals to our national stage, but Boomers, just for once, don’t try and upstage them by claiming they are just like you. Thankfully, they are not.

Note: Jack MacKenzie, Executive Vice-President of PSB Research, was the first person to suggest members of the next generation be named Plurals and provided valuable input to this blog.

Dr. Michael Hais has served as Vice President for Entertainment Research at Frank N. Magid Associates. He earned his PhD in Political Science from the University of Maryland.

Morley Winograd is a Senior Fellow at the University of Southern California’s Annenberg School Center on Communication and Leadership Policy. Morley Winograd and Mike Hais are co-authors of three books on the millennial generation. Mr. Winograd is also the President of the non-profit Campaign for Free College Tuition.

Photo: Ziggyfan23 [CC BY-SA 4.0], from Wikimedia Commons

Nashville’s Hopeless Rail Transit Proposal

$
0
0

Nashville is the 36th largest metropolitan area in the nation, having long since passed historic Tennessee leader Memphis. Nashville was the 10th fastest growing major metropolitan area in 2017. At the current growth rate Nashville will reach 2 million residents by the 2020 census and seems likely to pass slower growing San Jose soon after. Effective transportation is necessary for a growing metropolitan area to maintain its competitiveness. Yet voters are being asked to sink billions into a hopeless rail transit system that could cost more per capita than any in US history.

The key to Nashville’s growth is net domestic migration: many more people are moving in than moving out to other parts of the nation. Just since 2010, the Nashville metropolitan area has attracted more than 125,000 net domestic migrants.

Further, Nashville’s net domestic migration is up from earlier in the decade, averaging more than 20,000 for the last four years, up from under 9,000 in 2011. In contrast, high-flying Denver saw domestic migration collapse from 32,000 in 2015 to just 12,000 in 2017.

Proportionally, Nashville’s performance has been even more impressive. Only four metropolitan areas have gained more domestic migrants in relation to their 2010 population, Austin, Raleigh, Charlotte and San Antonio, with the latter two only slightly ahead of Nashville. Nashville’s net domestic migration rate was 20 percent greater than rapidly growing Phoenix (ranked 10th) and more than half greater than 13th ranked Portland (Figure 1).

Nashville’s Suburban Oriented Urban Form

The problem facing transit planners is Nashville’s urban form, which mirrors that of virtually all 10 of the nation’s fastest growing metropolitan areas. Little of Nashville is urban core, by pre-World War II standards, with more than 95 percent of the population living in automobile oriented lower-density development, per the City Sector Model (Figure 2). A city sector model analysis indicates that 68 percent of the new jobs created in the metropolitan area from 2010 to 2015 were in earlier (outer ring) suburbs.

Like elsewhere in the nation, most people moving to Nashville are moving to the suburbs (see: “Moving Away from the Major Metropolitan Areas: 2017 Estimates”). The core county, Davidson County (Nashville has a consolidated county-core city government, see Note below) gained 5,300 net domestic migrants between 2010 and 2017. By contrast, the suburban counties gained 120,800 net domestic migrants, nearly 25 times as many (Figure 3).

Planning for a Nashville that Never Was and Will Never Be

One might expect that local leaders are busy planning for this expanding population. Voters in the city of Nashville (which is consolidated with Davidson County), are being asked to fund the same obsolete, and costly 19th century rail strategies that presume everyone works downtown. Profoundly miscast to serve the modern metropolitan area, America’s many new urban rail systems have simply not attracted net drivers from cars. According to Aaron Renn of the Manhattan Institute, rail makes sense only in the six metropolitan areas with transit legacy cities (See: “Does America Need More Urban Rail Transit?”).

It is hard to imagine a more inappropriate transportation system for Nashville. Transit carries less than one percent of work trips in the metropolitan area, less than one-fifth the national average (which includes areas that don’t even have transit). Out of the 53 major metropolitan areas (over 1,000,000 population), Nashville ranks 49th in transit work trip market share, ranking with other domestic migrant centers Tampa-St. Petersburg, Charlotte and Raleigh (Figure 4).

Most Nashville residents rely on contemporary, rather than obsolete, technologies for their mobility. Driving alone dominates mobility in Nashville, as it does in virtually all US major metropolitan areas. In 2016, 81.8 percent of work trips were by solo drivers, the 12th highest figure among the 53 major metropolitan areas. At the same time, Nashville’s drive alone share is fairly close to the major metropolitan median (middle value), which is 79.4 percent. It is not hard to imagine why Americans drive alone --- it provides the by far the fastest travel times and maximizes leisure time.

But there’s a way of commuting that conserves time even more --- working at home. Nashville ranks 12th in the share of commuters who work at home, at 6.1 percent. This is a higher share of workers than ride transit in oft-cited transit examples Denver and Salt Lake City, and nearly as many as in Portland. A principal advantage is that working in home does reduce traffic volumes and also reduces greenhouse gas emissions, since it eliminates the traveling to work. This is done at virtually no cost to the driving public or to taxpayers. This is in contrast to transit operating costs, which have risen far more than justified by the economic fundamentals.

Vain Hopes

Proponents claim, predictably, that the system will reduce traffic congestion, speed up travel and provide greater connectivity. They say that the five route rail system will cost only $5.4 billion dollars (though they don’t say “only”). All of these are vain hopes.

It is hopeless to believe that rail transit will reduce traffic congestion in Nashville. That would require a significant decrease in the percentage of commuters driving alone and an astronomical increase in the percentage of commuters using transit. With transit carrying less than one percent of commuters, even doubling transit use (highly inconceivable) would not be able to keep up with the annual growth, which in the metropolitan area is 1.8 percent.

It is hopeless to believe that rail transit will improve average commute times. The average transit commute time is nearly twice the average automobile commute in Nashville and substantially exceeds that of driving alone in every major metropolitan area, according to Census Bureau data.

It is hopeless to believe that rail transit will improve connectivity throughout Nashville-Davidson County. Transit’s principal market is downtown. For travel that does not begin or end downtown, the transit system requires one to go downtown and transfer to another line to get to the ultimate destination. The resulting circuitous travel and the time waiting between trains or buses makes travel times on transit especially longer where transfers are required.

It is hopeless to believe that the system will cost only $5.4 billion. Seminal international research by Bent Flyvbjerg of Oxford University (United Kingdom), Nils Bruzelius University of Stockholm and Werner Rothengatter of the University of Karlsruhe (Germany) in Megaprojects and Risk: An Anatomy of Ambition shows that rail projects average 45 percent more expensive than promised, with cost overruns occurring in 90 percent of cases.

I speak from experience on this, having played a pivotal role in establishing the rail transit system in Los Angeles). By any measure, the Los Angeles rail system has been a profound failure. Now, with more than $15 billion in new rail lines operating, ridership is 20 percent below the peak 1985 bus-only level, while increasing taxes three times.

But from a cost perspective, Honolulu is far worse. Shortly after the tax to support the system was approved (2006), taxpayers were told that the cost would be $3 billion. The latest estimates are around $10 billion, and will probably rise further.

Nashville-Davidson: Poised to be the Most Costly System in History?

With that in mind, Nashville-Davidson voters could see the $5.4 billion project escalate to a final cost rising above $17 billion. This is particularly sobering, because on a per capita basis, the Honolulu project may have been the most expensive ever (the greatest tax burden). Worst case cost escalation (Honolulu rate) in Nashville-Davidson would result in even higher per-capita costs, because Nashville-Davidson has 300,000 fewer residents.

If the purpose of the Nashville-Davidson rail transit proposal is to spend taxpayer money, its success seems guaranteed. For the public, if misled by claims of traffic reduction, faster travel or improved connectivity, experience suggests success will be hopeless.

Note: The city-county government is called the “Nashville and Davidson County Metropolitan Government.” However, it is not a genuinely metropolitan government. Davidson County is only one county out of the 14 in the Nashville metropolitan area.

Wendell Cox is principal of Demographia, an international public policy and demographics firm. He is a Senior Fellow of the Center for Opportunity Urbanism (US), Senior Fellow for Housing Affordability and Municipal Policy for the Frontier Centre for Public Policy (Canada), and a member of the Board of Advisors of the Center for Demographics and Policy at Chapman University (California). He is co-author of the "Demographia International Housing Affordability Survey" and author of "Demographia World Urban Areas" and "War on the Dream: How Anti-Sprawl Policy Threatens the Quality of Life." He was appointed to three terms on the Los Angeles County Transportation Commission, where he served with the leading city and county leadership as the only non-elected member. He served as a visiting professor at the Conservatoire National des Arts et Metiers, a national university in Paris.

Photograph: Seal of the Nashville and Davidson County Metropolitan Government
https://en.wikipedia.org/wiki/Davidson_County,_Tennessee#/media/File:Sea...

Future Hubs of Africa and Asia

$
0
0

On UN projections between 2015 and 2050, the world population will grow by nearly 2.38 billion people, from 7.35 billion to 9.73 billion. Although this 32% growth is a big increase, it marks a slowdown from the 66% growth rate recorded in the preceding 35 years (1980-2015). Total Fertility Rates (TFRs) have come down all over the world and are expected to continue falling.

About half of the 2.38 billion increase will take place in sub-Saharan Africa and nearly 40% in Asia. India is the biggest contributor with a net addition of 394 million, followed by Nigeria (216m), Pakistan (120m), DR Congo (118m) and Ethiopia (89m). By 2050, all of these countries will feature in the top 10 populations by size, a list that will include the United States (expected to rank fourth) but not one European country. Outside of Africa and Asia ex-China, regional populations will be growing slowly (the Americas), stagnating (China, Europe), or receding (Japan, Eastern Europe).

This demographic boom could, under the right conditions, result in a regional or even a global economic boom. These conditions are first and foremost 1) an increase in literacy and 2) an improvement in governance, in the poorest countries where the population is growing rapidly. Higher literacy, in particular among young women, sets off a chain reaction that drives down infant mortality rates and total fertility rates. In time, this evolution leads to a falling dependency ratio and creates an opportunity for the economy to realize a demographic dividend. This was in large part the dynamic that created the China boom in the past three decades.

At the same time, the demographic center of gravity of the world will shift from North to South and from the richest to the poorest countries. This new center of gravity would lie in 2050 somewhere between Africa and South Asia, in theory somewhere in the Indian Ocean or in Eastern Africa or Western Asia.

Just as Singapore and Hong Kong were large beneficiaries of expanded trade between China and the rest of the world, there will likely be a number of cities that will benefit from being at the nexus of the coming population boom if it happens to also translate into an economic boom. Some will gain by dint of their large size and thanks to their expanded infrastructure in air and maritime transport. Others may gain by becoming specialized hubs for services such as finance, technology or other.

Approaching it from the perspective of air travel, we look below at a small sample of cities that are geographically well situated and that could be significant beneficiaries. Although this is not intended to be an exhaustive list, it probably does contain most of tomorrow’s winners.

Most striking at first glance is the low level of air passenger traffic throughout sub-Saharan Africa. Except for South Africa, the number of passengers at every airport in 2016 was below 10 million. These are indeed very small totals relative to the populations served by these airports. Lagos in Nigeria for example had fewer passengers than Beirut in Lebanon despite serving a local population that is at least ten times larger. The traffic at Kinshasa in DR Congo is abysmally low and roughly in line with that at Kigali in Rwanda, a much smaller country.

We place possible winners in three categories: the Ambitious Giants, the Smaller Specialists and the Legacy Players.

THE AMBITIOUS GIANTS

The most ambitious air transportation hubs at the intersection of sub-Saharan Africa and South Asia in the next 35 years appear to be Addis Ababa, Dubai and Istanbul, the last situated not in Africa or Asia but at a valuable crossroads of Africa, Asia and Europe. All three of these cities have ambitious expansion plans for their airports (see table) and all three are home to fast-growing airlines that harbor big global ambitions, Ethiopian Airlines, Emirates and Turkish Airlines.

Addis Ababa is expanding its current Bole International Airport and has designs for a new airport (video) that could handle as many as 80 million passengers per year. The two airports together would handle over 100 million passengers annually.

Dubai already enjoys a high level of traffic at Dubai International Airport but has also been building the Al Maktoum International Airport (at Dubai World Central) that could become the busiest in the world. The combined Dubai airports could potentially handle over 200 million passengers. On current trends, Doha and Abu Dhabi airports will also be contenders, albeit on a smaller scale.

Istanbul is also expanding its existing Istanbul Ataturk Airport as well as building a new airport (video). This “new center of aviation” and “world’s largest transfer point” has designs to handle over 200 million passengers in the next decades. As with Addis Ababa and Dubai, Istanbul airport’s ambition is equal to that of its home airline.

THE SMALLER SPECIALISTS

Beirut is well situated and enjoys a common heritage with the Lebanese business diaspora in Nigeria and the rest of West Africa. Notwithstanding political uncertainties, Beirut could develop as an important Africa-Asia hub for business conferences, finance, tourism and other services.

Cyprus and Malta could also be contenders, given their EU memberships and locations.

Kigali has an enviable central location in sub-Saharan Africa and is enjoying a renaissance as the capital of Rwanda. It has the potential and ambition to become an important hub and destination for conferences and other industries and services.

Mauritius has staked a claim as a leading offshore finance center servicing Africa and the Indian Ocean. It may be able to sustain its advantage in financial services or other.

Nairobi is a leading choice for multinationals’ regional offices. Cisco Systems, Coca-Cola, General Electric, Heineken, IBM, Intel, Nestle, Pfizer, Toyota and many other companies have located regional headquarters or important operations in Nairobi. Casablanca, Johannesburg and Lagos boast similar appeal.

Tel Aviv and Haifa could also leverage their location and growing expertise in startups and in technology, software, pharmaceuticals and other services.

THE LEGACY PLAYERS

Paris and London are further afield but both benefit from a long history in Africa and Asia. Both will try to leverage their economic and financial power to be significant players. To a lesser extent, the same is true of Lisbon and other European capitals.

Asian cities too stand to be big winners if education, infrastructure and governance improve fast enough to enable a demographic dividend. Among them are Mumbai, New Delhi, Jakarta and Manila.

This piece originally appeared on Populyst.net.

Sami Karam is the founder and editor of populyst.net and the creator of the populyst index™. populyst is about innovation, demography and society. Before populyst, he was the founder and manager of the Seven Global funds and a fund manager at leading asset managers in Boston and New York. In addition to a finance MBA from the Wharton School, he holds a Master's in Civil Engineering from Cornell and a Bachelor of Architecture from UT Austin.

Photo: Jeremy Weate from Abuja, Nigeria (Tinubu Square city scape) [CC BY 2.0], via Wikimedia Commons

Shovel Ready

$
0
0

Many years ago I remember a television commentator saying more Americans have outhouses than computer connections. This was in the early days of dial up modems. He seemed to suggest that household computers were little more than Japanese video games, which was actually true at the time. Well, thirty years have passed and this afternoon I received a package for one of my neighbors. Evidently he ordered a shovel on the interwebs.

This same neighbor used to ask me for a ride to the big box hardware store whenever he needed such things. No more. How exactly did we all make the journey from Atari to Amazon? (Try Netflix bingeing “Halt and Catch Fire.”) From a city planning and economic development standpoint no one connected the dots between ubiquitous personal computers and the end of travel agencies, book stores, or video rental shops. Neither did they link the rise in wages for technically proficient professions and the precipitous decline of redundant less skilled workers. Creative destruction makes as many opportunities as it eliminates, but the new distribution stresses society in ways we aren’t good at managing.

I’ve become inured to the autonomous vehicles that perpetually beta test their way around my neighborhood. Two days ago I saw a herd of white Cruise cars go by one after the other as General Motors attempts to keep up with nascent competitors. The first pedestrian fatality by a self driving Uber just occurred in Arizona. While it’s a personal tragedy for her and her family the larger trend toward driverless cars will continue. Each year about 37,000 people die in plain old regular car accidents, so in addition to the autonomous incident another 100+/- people also died by car across the country that same day. Ultimately the insurance industry will sort things out and determine that computers are actually much better drivers than humans – and they’ll price that statistical reality in to the cost of coverage. Wetware (people) will eventually have to pay a premium to drive themselves.

I was in Schaumburg, Illinois a while back standing in the drive-thru area of a dead bank branch looking out at a vacant office building, a dormant Applebee’s, and an anemic debt-ladened Guitar Center across an ocean of empty parking lots. What I was witness to was the same dynamic that created endless unoccupied factories and warehouses in the late twentieth century as manufacturing matured and transformed. We’re simply not going to need all these auto oriented suburban buildings anymore, just like we’re not going to need truck drivers and cabbies. Who (under a certain age) goes to a physical bank anymore? Do banks even have much paper money in them these days?

As aging shopping malls and office parks lost their luster towns embraced entertainment zones designed to pull in visitors from other jurisdictions. The casino, sports stadium, aquarium, convention center… They’re all really just malls in disguise. They work for a while, until every one horse town in the region also has one and the market saturates. North America is massively over supplied with such places and most of them are heavily reliant on subsidies. An aquarium rarely pays for itself in admission tickets, particularly in third tier markets. This place in Kentucky does well enough on weekends at certain times of year, but it’s already working its way down the value chain with multiple vacant spaces and too little foot traffic.

I’ve had city officials all over the country explain that each new resident costs the municipal government money, but each new business generates tax revenue and creates jobs. Preferential zoning to induce more income has been the default model for planning agencies chasing cash for decades. This new retail plaza on the side of a Northern California freeway isn’t adding needed capacity. It’s cannibalizing existing retail sales from older shopping centers. There’s a limit to how many shoe stores and kitchenware shops the area population can support. Online sales are cutting in to already slim margins. It won’t be long before this place is hollowed out and half vacant, not least because the chain stores will be offered special incentives to relocate to a new place a few miles away. That’s when city officials and developers will hatch a public private partnership to turn the venue into a “technology park” to lure in some other heavily subsidized scheme that will also prove economically wobbly.

Just down the road in the same town is a premium outlet mall that, not too long ago, was the guarantied-to-succeed cash cow favored by municipal planners. But these things just don’t perform well beyond the first tenant lifecycle, particularly when there’s a parade of similar establishments for a hundred miles in every direction. Meanwhile, this failing mall is in a location with a critical housing shortage. The median home price here is $700,000 and very few homes are on the market. Median rent is $2,900 if you can find a vacancy. Most people can’t.

Retail complexes like this outlet mall are already fully amortized and equipped with all the required fire sprinklers, handicap accessible features, ample parking, stormwater management ponds, sewer, water, gas, and electric service, HVAC… The interior spaces of these existing building shells could easily and inexpensively be reconfigured to accommodate hundreds of families at a very reasonable and profitable price point. But this town doesn’t want more residents. It wants jobs and tax revenue, although it currently isn’t getting much of either. Every nurse, cop, and teacher in the county could live comfortably in the empty retail space that already exists. These are the real shovel ready sweet spots. But we don’t really want to solve this problem. So we won’t. Instead we’ll continue to absorb the consequences of not solving it.

This piece first appeared on Granola Shotgun.

John Sanphillippo lives in San Francisco and blogs about urbanism, adaptation, and resilience at granolashotgun.com. He's a member of the Congress for New Urbanism, films videos for faircompanies.com, and is a regular contributor to Strongtowns.org. He earns his living by buying, renovating, and renting undervalued properties in places that have good long term prospects. He is a graduate of Rutgers University.

The End Of The ‘Libertarian Moment’

$
0
0

The decision by Speaker Paul Ryan to leave the House reflects the failings of our current flawed political configuration. Ryan may have been personally a cut above his critics on the right and left, but he ended up the victim of his own ideology.

We often talk about “political Islam” as a challenge. But America too, over the past two decades also has been driven by two dueling political religions — libertarianism and progressivism. Encouraged by ideologically driven donors, supported by their own media and academic claques and dominated by university-educated professionals, these ideologues are often deaf to the needs of middle- and working-class Americans. Their failings opened the door for the ideologically incoherent and emotionally unmoored Donald Trump.

The strange death of libertarian America

Throughout much of the past quarter century, libertarianism — largely the negation of government regulation and reliance on private initiative — has been the unofficial faith of the GOP. As the old-time religion of social conservatism married to overseas adventurism lost credibility, and deservedly so, libertarian ideals provide younger conservatives both an upbeat message and a welcomed consistency.

Now intellectual right-wingers fear that the much anticipated “libertarian moment” has come and gone. Free marketers may have won many intellectual arguments, but they never developed a sustainably popular political program. Virtually all the GOP candidates running against Trump embraced standard principles on deregulation and free trade as well, and for the most part, immigration. All went down in flames against Trump’s strongly nationalist and even xenophobic appeal.

Once the tax bill passed and regulatory reforms, notably in the energy sector, were enacted, libertarians like Ryan shared little common ground with Trump. The president was never going to follow their lead on entitlements given that almost nine in 10 voters favor maintaining Social Security and a majority favor expanding Medicare. For any politician seeking a political future, attacking entitlements is largely a suicide mission.

Read the entire piece at The Orange County Register.

Joel Kotkin is executive editor of NewGeography.com. He is the Roger Hobbs Distinguished Fellow in Urban Studies at Chapman University and executive director of the Houston-based Center for Opportunity Urbanism. His newest book is The Human City: Urbanism for the rest of us. He is also author of The New Class ConflictThe City: A Global History, and The Next Hundred Million: America in 2050. He lives in Orange County, CA.

Photo: Gage Skidmore from Peoria, AZ, United States of America (Paul Ryan) [CC BY-SA 2.0], via Wikimedia Commons

World Megacity Growth Lags – Smaller Cities Grow More

$
0
0

Never in history have so many people lived in urban areas (that is, outside rural areas). There are now 37 megacities (urban areas with more than 10 million residents) in the world, according to the 14th Annual Demographia World Urban Areas. This represents a substantial increase over the past century. But most urban growth, contrary to popular belief, is not taking place in megacities but in large urban areas that have not achieved megacity status.

One hundred years ago, there were no megacities. It was not until 1930 that the first megacity emerged, New York. By that time, London had reached 8 million residents, having been the largest urban area in the world, passing long-time leader Beijing about 1825. London held the top spot until passed by New York in the 1910s. Tokyo-Yokohama became the second megacity, reaching 11.3 million in 1950, just behind New York’s 12.3 million, according to United Nations data. By 1960, Tokyo-Yokohama had passed New York. Meanwhile, London had been left far behind, reaching megacity status only in the 2010s. London’s growth stalled because of planning policies that forced nearly all growth outside a Greenbelt. The metropolitan area (labor market), which includes areas separated from London by the Greenbelt, has experienced healthy growth since that time.

This article describes the results of a three year analysis of estimated population growth by population categories from 2015 to 2018, using data from Demographia World Urban Areas. The composition of each population category is kept constant based on 2015 data (urban areas are analyzed within their 2015 population category).

Megacities and Smallest Urban Areas Growing Slowest

There are plenty of good reasons why megacities have caught the attention of the media and researchers. Moreover, the continuing increase in urbanization has been of great interest. According to the United Nations, only two percent of the world’s population was urban in 1800. The world is now more than one-half urban. It is estimated that, on average, world urban population grew 2.07 percent annually between 2015 and 2018.

But, despite the urbanizing trend, megacities are not the fastest growing. Indeed, they tend to be among the slowest growing in the world. Over the three years of this analysis megacities are estimated to have grown only 1.83 percent annually (Figure 1). The greatest growth was among urban areas with 5 million to 10 million residents, the category just below megacities, with a 2.29 percent annual growth rate, 25 percent above that of the megacities. Each of the smaller categories grew more slowly but faster than the megacities. The 2,500,000 to 5,000,000 urban areas expanded by 2.21 percent while those between 1,000,000 to 2,500,000 grew 2.13 percent. The urban areas with 500,000 to 1,000,000 population grew 2.05 percent. Only the urban areas under 500,000 population grew slower than the megacities, with 1.79 percent annual rate, slightly lower than that of the megacities.

All of the population categories from 500,000 to 10,000,000 experienced gains in their share of the world urban population. The largest gain was 1.03 percent, from 2015 to 2018 in the “near-megacities,” from 5,000,000 to 10,000 population. The megacities lost 0.33 percent in share over the three years, though less than the minus 0.44 percent loss by the urban areas with fewer than 500,000 residents (Figure 2).

Most People Live in Smaller Urban Areas

Another surprise may be that, among the population categories, the smallest cities (under 500,000) contain by far the most people. In 2015, the smallest cities accounted for 47.2 percent of the world’s urban population, more than three times that of the megacities.

But, these urban areas accounted for only 43.4 percent of the world’s urban growth (Figure 3). At the same time, megacities accounted for 14.3 percent of world urban population in 2015 but their population growth has lagged, at only 13.5 percent of the total. The population growth rates in each of the middle categories has been greater than their population shares.

Further, even though more than half of the world’s population lives in urban areas, only one-half of that number live in the larger urban areas. Six years ago, an examination of world urban area sizes indicated that the smallest was Godegård, located in the Motala municipality of Sweden, with 200 residents (See: “What is a Half-Urban World”).

According to the 2018 update of Demographia World Urban Areas the median urban resident in the world lives in an urban area with approximately 645,000 residents, a distinction shared by Tyumen, in the Ural District of Russia, and Cape Coral, Florida in the United States. These urban areas have approximately are tied as the 831st largest urban areas in the world.

The Future

The percentage of people living in megacities could increase in the future, even if the population of the present megacities grows at a lower rate as a result of smaller cities that may reach the 10 million resident mark. There are 14 urban areas that have between 7.5 million and 10 million population, and another 35 have more than 5 million.

Among them, these near-megacities appear to be the most likely additions to the ranks of megacities in the near future: Bogota, Chongqing, Hanoi, Hyderabad (India), Johannesburg and Luanda.

Wendell Cox is principal of Demographia, an international public policy and demographics firm. He is a Senior Fellow of the Center for Opportunity Urbanism (US), Senior Fellow for Housing Affordability and Municipal Policy for the Frontier Centre for Public Policy (Canada), and a member of the Board of Advisors of the Center for Demographics and Policy at Chapman University (California). He is co-author of the "Demographia International Housing Affordability Survey" and author of "Demographia World Urban Areas" and "War on the Dream: How Anti-Sprawl Policy Threatens the Quality of Life." He was appointed to three terms on the Los Angeles County Transportation Commission, where he served with the leading city and county leadership as the only non-elected member. He served as a visiting professor at the Conservatoire National des Arts et Metiers, a national university in Paris.

Photograph: Chongqing: Continuously built-up urban area soon likely to exceed 10 million (by author).

Eyes From the Street – The Neighbourhood Fabric That Matters

$
0
0

In the 50 plus years since Jane Jacobs coined the phrase “eyes on the street”, most planners have taken it as an article of faith. After all, some argue, it is common sense. But as we found out when looking at complex, self-organising systems such as cities, common sense is woefully inadequate to explain, let alone predict, outcomes.

I live in an ideal Jacobsian neighbourhood: Centertown, Ottawa. Centertown has the second highest density among city districts, the widest mix of land uses, and an unmatched range of incomes and ethnic backgrounds. It is laid out on a grid and includes buildings that span the entire gamut of types, functions, forms, and history; no other ward in this city is as diverse. Yet, something essential is missing from the anticipated outcomes of an urban fabric such as this—security. Here we seek to find out why.

This district has at least three east-west and four north-south “main street” arteries, where small businesses thrive, professional services are offered, and numerous people live above shops, just as in Jane Jacobs’ actual Manhattan neighborhoods. Invariably, these streets buzz with activity all day. Routine destinations are within a ten to twenty minute walk. Everything that the “eyes on the street” neighbourhood model recommends is present. As theory has it, improved security should be a natural, expected outcome.

Figure 1. Crime rate in 19 city wards including the one where I live.

Yet I live in the most dangerous neighbourhood of my city—not by mere percentage points but a manyfold difference. And, surprisingly, this abnormal difference belies the fact that Ottawa registers the second lowest crime rate among the top eight major Census Metropolitan Areas in Canada. How can that be explained, knowing that no other district in this city comes even close to its level of “eyes on the street” potential? By contrast, and belittling theory, Barhaven (a suburban neighhorhood in the southwest of Ottawa) has the lowest crime rate. Perhaps research has answers to this baffling incongruity.

Research

In a Jane Jacobs biography titled Eyes on the Street, the question of whether "eyes on the street" reduces crime is professionally disputed.

I quote: “May be not, a University of Pennsylvania Law Review suggested; pedestrian-dense, mixed-use development in Los Angeles neighbourhoods did record lower crime than those exclusively commercial; but purely residential areas had crime rates lower than either. A meta-study of research drawn from the broad discipline of environmental criminology came away similarly skeptical.”

A single study can be disputed as a basis for drawing credible conclusions, but the results of a meta-study are usually reliable. Whatever research could unveil would be interesting academically. My mission is closer to home. I live in an Alchemist’s jar with a mix of ingredients presumed to produce safety gold but instead it delivers lead. Transmutation attempts failed because the nature of elements was misunderstood. Could this be the case of the factors that nurture crime in a neighbourhood?

Districts and Streets in History

New York’s West Village and my district share certain physical characteristics that purportedly increase safety: density, diversity of built form, and proximity to daily destinations. These were also defining characteristics of most cities in history but, in notable cases, with strikingly different streetscapes than contemporary ones.

For example, a thriving commercial port city, Pompeii, representative of a Roman period (~50 AD), had 11,000 people in its small, walled-in area—over triple Centertown’s density. But its streets could hardly differ more from those I tread on daily: narrow, leafless, drab, malodorous, and ominous, particularly after dusk. No windows faced the street, just the infrequent opaque door—an ideal setting for illicit activity.

Figure 2. Roman and Arab city streets shun contact between house and street and create a dreary, ominous streetscape (left Pompeii, right Fez)

Similar streetscapes prevailed in Fez (still intact), the largest city in the world around 1100 AD (~ 200 k pop), and a major commercial and cultural centre. Its streets were laid out in a perplexing maze and were just as narrow and opaque as Pompeii’s. Small windows were put, by code, above pedestrian eye level to prevent prying into houses. Such streets and layouts were common in ancient and medieval cities. Not only were they opaque and crooked, they were also empty. Most streets functioned simply as necessary conduits, not places for socializing.

Lacking any casual, informal surveillance, districts such as these must have been most antisocial, dreary, even deadly places. This was decidedly not the case, history tells us - in fact, it was quite the opposite. People in these cities were close-knit, bonded by religion, tradition, familial relations, and customs.

It seems that neither research, nor history, nor the Centertown case statistics, support the “eyes on the street” proposition.

Eyes from the street

While the Roman and Arab court-centered buildings without windows blocked eyes from the street, contemporary houses achieve the same effect with a variety of means appropriate for them—distance, walls, fences, hedges, and elaborate curtains. Most vulnerable to intrusion are detached houses and, among them, those at street corners. The rationale for these commonplace measures is explained in Jacobs’ book: “Privacy is precious in cities. It is indispensable. Perhaps it is precious and indispensable everywhere, but in most places you cannot get it.[…]”.

Figure 3. A common corner house hedge treatment that avoids all contact with pedestrians or cars ensuring maximum privacy and minimum distraction by shunning eyes from the street.

Other directions for clues

Streets and the buildings that frame them, including their functions, are but the stage on which uncivil, offensive acts are performed; it is human actors that carry them out. These actors form the intricate social fabric of a neighbourhood—each actor with their individual, but always invisible, characteristics. The same built form could house populations with starkly different characteristics over time, as districts evolve, and produce distinct safety outcomes. Perhaps it is the social fabric that could unravel the mystery of Centertown. It has been repeatedly shown that poverty and its related conditions are associated with errant behaviour in its many guises.

Detailed stats show that Centertown occupies the low end of the median income scale and the high end of the crime scale. Next to it, a neighbourhood also in a central location with similar physical characteristics, exhibits even lower income level and similar crime rates suggesting a consistent trend, evidenced in the graph. (Fig 4)

Figure 4. As the median neighbourhood income increases crime rate drops.

Median income values could result from relatively uniform or widely ranging incomes, potentially hiding part of the social fabric’s texture. Another measure of neighbourhood income—the percentage of people living in low-income —might spotlight the difference of incomes within a neighbourhood.

Figure 5. As the percentage of people* living in low income increases in a neighbourhood, so does the crime rate. (*families or persons not in economic families)

Combining the evidence from these two strong correlations leads to the realization that the social fabric of a neighbourhood is a much better predictor of its relative crime level than its physical fabric. It does not eliminate the physical factors; it simply reduces their degree of importance for this outcome.

Other social fabric descriptors, such as education, employment, Gini coefficient, cohesion, and more could add explanatory power to social fabric as a determinant of the frequency of antisocial acts. Equipped with such power, we might be able to say, "show me the social characteristics of your neighbourhood and I will tell you the odds of being victimized." I was victimized twice in this Jacobsian neighbourhood and now I understand why.

Photo by Matti Blume [CC BY-SA 4.0], from Wikimedia Commons


Neat, Plausible, and Wrong

$
0
0

The Antiplanner is frequently reminded of H.L. Mencken’s statement that “there is always a well-known solution to every human problem: neat, plausible, and wrong.” Millennials, for example, blame baby boomers for ruining the world. Most of the mistakes that baby boomers made were in adopting simple and plausible but wrong solutions to complex problems. Now the millennials are promoting their own simplistic and wrong solutions to the problems created by the baby boomer’s errors.

For example, around 1970 people accurately pointed out that there were environmental problems with American lifestyles, including air pollution, water pollution, and loss of wildlife habitat. These were complex problems, and one of the simplistic solutions was to draw urban-growth boundaries around cities to protect wildlife from urban sprawl and reducing pollution by encouraging people to drive less. Growth boundaries didn’t solve any of those problems, but they created a lot of other problems, such as unaffordable housing, traffic congestion, and increased taxes.

Instead of abolishing the growth boundaries, millennials want to solve the problems the boundaries created using such techniques as rent control and regulations on landlords. Washington DC, for example, passed an ordinance giving tenants first right of refusal if a landlord decides to sell a dwelling. This has led to a “cottage industry of attorneys who use this law to prey on homeowners.”

Here’s the thing. Most of our problems are ones of resource allocation: who gets to consume how much of what. After thousands of years of social evolution, humans have developed three main tools for allocating resources: government, religion, and markets. Government and religion always come up with simplistic solutions that usually don’t match the complexity of the problems they are trying to solve.

Markets, however, have the unusual property of being able to use simple rules to solve complex problems. That’s because markets depend on the simultaneous processing of billions of computers called human beings. Those human beings base their individual decisions on two simple metrics.

The first metric is price. Prices determined through supply and demand give consumers incentives to conserve valuable resources and produces incentives to produce more of those valuable resources. Through the laws of supply and demand, there will always be enough supply of any given resource to meet the demand for that resource (provide there is no interference from politics or religion).

The second metric is reputation. So long as transactions are repeated, people making those transactions develop reputations. Even if you haven’t had a transaction with someone else, you can rely on the reputation they have developed in their transactions with others — something that has become even more powerful using internet tools such as eBay and Amazon reviews, though consumers have to be wary of false reviews.

Some may complain that markets are biased by the initial allocation of resources, enabling the rich to get richer at the expense of the poor. But history shows that few families stay very rich for very long, and those that do become adept at using the power of government, not markets, to maintain their preeminence. In general, poor societies have higher levels of inequality, and since market economies tend to be wealthier, they tend to reduce inequality.

Portland’s latest simplistic solution to housing affordability problems is to take the money “freed up” from expiring tax-increment finance (TIF) districts and spend it on construction of affordable housing. But TIF was a theft in the first place from schools, fire, and other programs funded out of property taxes aimed at promoting economic development. Usually, in Portland, that meant building high-density housing and forcing other taxpayers to pay for the urban services consumed by the residents of that housing (since their taxes were going for the TIF subsidies).

TIF apologists always said that the schools and other property-tax-dependent services would benefit in the long run because they would get the higher revenues paid by the developments after TIF bonds were paid off. But now it appears the TIF diversions will go on indefinitely, forcing residents of unsubsidized housing to choose between receiving a lower level of urban services or raising their taxes to maintain their services and pay for those consumed by the high-density and affordable housing developments.

Another name for TIF is value capture, the claim that some new project (such as transit) enhances property values and so the taxes from such properties should be used to subsidize the project. But, as New York City mayor Bill de Blasio recently learned, it all depends on whose value is being captured. That city recently raised property taxes and now New York governor Cuomo wants to divert half of those taxes to mass transit under the guise of value capture. de Blasio hates that idea.

The Antiplanner admits that there are some projects that do increase the total value of a city, but transit projects are generally not among them. But even if we could identify for certain a project that did increase total values, attempting to tax the city to subsidize that project would only invite backers of every other project to make similar claims, with the result that allocation of the tax benefits would be made on political, rather than economic grounds.

Fortunately, transportation and housing are among those resource allocation problems that can be solved entirely through markets. Forget about TIF. Forget about value capture. Forget about subsidies. Just get the government out of the way and let the market work.

This piece first appeared on The Antiplanner.

Randal O’Toole is a senior fellow with the Cato Institute specializing in land use and transportation policy. He has written several books demonstrating the futility of government planning. Prior to working for Cato, he taught environmental economics at Yale, UC Berkeley, and Utah State University.

Photo by Diana Robinson via Flickr, using CC License.

Ten Infrastructure Projects We Should Actually Build

$
0
0

I have argued that the primary infrastructure need in the US is for maintenance, not new builds or expansion. But clearly building nothing new isn’t realistic, so what projects should we build and why?

I just released a new Manhattan Institute issue brief highlighting some criteria for when new infrastructure can be justified, along with a list of 10 specific projects that make sense. I include transit, freight rail, highways, airports, and energy on the list.

My criteria:

• where the existing infrastructure is at or over capacity and is experiencing a significant historical (not just projected) growth in demand, in a region that is growing overall; (this last bit is to rule out sprawl subsidizing roads in regions that are stagnant);

• where infrastructure is obsolete or nearing the end of its useful life; where the original networks did not envision the current distribution of demand, such as highway links between cities that used to be very small but now are very large; and

• where the project costs can be recovered from user fees such as tolls

And my project list:

Passenger Rail

1. Gateway Project (New York City and New Jersey)

2. North–South Rail Link (Boston)

Freight Rail

3. Chicago Region Environmental and Transportation Efficiency (CREATE) program (includes passenger rail benefits)

Highways

4. I-11 link between Phoenix and Las Vegas

5. I-35 Capitol Express project (Austin)

6. SR 37 freeway improvement (Indianapolis)

7. I-345 freeway removal (Dallas)

Airports

8. Kansas City International Airport terminal improvement

9. Denver International Airport expansion

Energy

10. New England gas pipeline

Click through to read the whole thing.

This piece originally appeared on Urbanophile.

Aaron M. Renn is a senior fellow at the Manhattan Institute, a contributing editor of City Journal, and an economic development columnist for Governing magazine. He focuses on ways to help America’s cities thrive in an ever more complex, competitive, globalized, and diverse twenty-first century. During Renn’s 15-year career in management and technology consulting, he was a partner at Accenture and held several technology strategy roles and directed multimillion-dollar global technology implementations. He has contributed to The Guardian, Forbes.com, and numerous other publications. Renn holds a B.S. from Indiana University, where he coauthored an early social-networking platform in 1991.

Giving Common Sense a Chance in California

$
0
0

In California, where Governor Jerry Brown celebrates “the coercive power of the state” and advocates “brainwashing” for the unanointed, victories against Leviathan are rare. Yet last week brought just such a triumph, as a legislative committee rejected an attempt by San Francisco state senator Scott Wiener to take zoning power away from localities in areas within a half-mile of a bus or train stop. Wiener had sold his measure as a solution to California’s housing crisis and a means of bringing about the dense, green, transit-oriented development that the governor and his supporters prefer. Yet it failed, in large part because few cities wish to give up their zoning power and because even affordable-housing advocates don’t believe that handing blank checks to developers will do much to lower rents or housing prices.

Read the entire piece on City Journal.

Joel Kotkin is executive editor of NewGeography.com. He is the Roger Hobbs Distinguished Fellow in Urban Studies at Chapman University and executive director of the Houston-based Center for Opportunity Urbanism. His newest book is The Human City: Urbanism for the rest of us. He is also author of The New Class ConflictThe City: A Global History, and The Next Hundred Million: America in 2050. He lives in Orange County, CA.

Photo via Connect California.

The Midwest Is Booming—Just Not Where You Think

$
0
0

The Midwest is booming, but not where you might think. Kansas City, Minneapolis, Indianapolis, Columbus, Grand Rapids, and Des Moines are the fastest-growing cities in the Midwest—lapping bigger hubs like Detroit, Cleveland, Buffalo, Pittsburgh, St. Louis, and even Chicago that are still suffering from stagnant economies and slow or even negative population growth.

America’s high-priced “superstar” cities are not about to be supplanted soon by Midwestern comeback towns. But the demographic evidence provides ample proof of shifting momentum since 2010. New York City’s population growth, impressive earlier in this decade, now ranks among the lowest in the nation. Brooklyn, the reinvented hipster capital, last year suffered its first population decline since 2006.

The same can be said of Los Angeles, San Francisco, Boston, Chicago. None grew faster than 0.6 percent last year, the national growth rate for the 107 largest metro areas, are often by a wide margin.

The burgeoning populations in places like Des Moines, which grew by 1.76 percent last year, is being driven by domestic out-migration from the superstar cities. In 2017, nearly three times as many domestic migrants escaped New York as in 2011. Chicago, Los Angeles, and even San Francisco and San Jose also have experienced sharp rises in domestic out-migration. The biggest percentage declines were found in Los Angeles, Chicago, New York and, remarkably, San Jose, which was worst among the 53 metropolitan areas with a population of more than 1 million. Even the “boomtown” San Francisco metropolitan area, which had been attracting domestic migrants from 2010 through 2015, last year experienced a considerably higher rate of out-migration than even Rust Belt hard cases like Detroit, Buffalo, or Cleveland.

The coasts’ loss ended up, to some extent, as Indianapolis, Minneapolis, Des Moines, and Columbus’ gains, reflecting a growing flight from what are increasingly gated cities, affordable only to the affluent, the subsidized (students), and those older residents who bought when the buying was good. High housing costs—sometimes three times higher adjusted for income compared to the rising Midwest cities—make attaining homeownership all but impossible. Once people get to the age that most want to settle down and start a family, they see buying a home as impossible, unless of course you can cash out of an expensive startup, have wealthy parents, or maybe robbed a bank.

This pattern could well accelerate with the aging of millennials. For decades, urban mythologists claimed these young people would be irrevocably attracted to big, dense coastal cities. This has changed as millennials flee expensive coastal cities looking for affordable single-family homes, much like their parents did before them. The Sun Belt cities have been the most conspicuous beneficiaries, but the Midwest is thriving, too. Since 2010, notes demographer Wendell Cox, Indianapolis, Des Moines, Kansas City, and Columbus have all enjoyed higher rates of millennial population growth than New York, Chicago, Boston, San Jose, San Francisco, or Los Angeles.

That’s understandable, what with how at current savings rates the average millennial would need about 28 years to save enough for a 20 percent down payment on a median-priced house in the San Francisco area, compared to nine years in Minneapolis and less than three in Kansas City, according to a study by Apartment List. This is surely a big reason why a recent Urban Land Institute survey found that 74 percent of Bay Area millennials are considering a move out of the region in the next five years (PDF). Similarly, a UCLA study found younger people are the most dissatisfied with Southern California’s opportunities and high costs.

Increasingly, for many millennials, the Midwest comeback cities, albeit perhaps less glamorous, seem places where aspirations can meet reality.

The Economy Moves to the Interior

Dating back to the end of the last millennia, much growth in high-end jobs took place in a handful of big coastal metros. Some pundits traced this expansion to such things as culture, density, and even the presence of rapid transit systems. The thesis was somewhat accurate, until it wasn’t.

The fastest growth in business and professional services, the largest generator of high-wage employment, has been shifting to Sun Belt cities for years, and now is also moving to Midwestern comeback towns. Over the past three years, for example, Kansas City expanded its business service employment by 15.7 percent, faster than San Francisco or New York, three times faster than Los Angeles, and six times Chicago. Des Moines and Indianapolis also grew faster than New York, L.A., or Chicago.

The shift in tech-related jobs is perhaps even more surprising, though the preponderance of the highest-paid positions remain in the familiar hubs. Outside the Bay Area, the fastest STEM (science, technology, engineering, and mathematics related) job growth is now taking place in southern cities like Charlotte, Raleigh, Austin, and Nashville and in the resurgent Midwest, where Indianapolis saw its tech sector swell by 68 percent over the past decade—faster than high-fliers Seattle, Denver, Boston, and New York.

Kansas City and Grand Rapids also enjoyed faster STEM growth than those cities, as well as New York, Chicago, Los Angeles, and San Diego. Last August, Apple announced plans to open its newest data center in metro Des Moines, investing $1.3 billion in the area. Although perhaps unlikely to win the prize, two of the comeback cities—Indianapolis and Columbus—made the cut for Amazon’s 20 finalists for a second headquarters (Richard Florida and I collaborated on Kansas City’s failed bid).

The STEM recovery in the traditionally engineering-rich Midwest could just be starting. In the early part of the decade, notes a 2016 Brookings study, software focused on search, social media, and systems design; now, much of the impetus is coming from manufacturing-related industries, such as autos and industrial products, which may help explain the strong growth experienced by places like Grand Rapids.

The Midwestern resurgence, already underway, may pick up speed thanks to Donald Trump, who’s president thanks to his surprisingly strong showing in the region. Trump has identified two sectors—manufacturing and energy—for de-regulation and support. Despite predictably dour accounts in the anti-Trump press about the impact of his trade policies on industrial growth, the evidence shows strong growth in manufacturing jobs on his watch so far, following a lull at the end of the Obama era. Similarly the unleashing of the energy industry has benefited not just Texas, but shale-driven economies in places like Ohio, which is emerging as a major oil and gas producer.

Down, but Far From Out

It would be wonderful if this resurgence covered the entire Midwest, restoring the regions standing a century ago, when, as author Jon Lauck writes, “the Midwest stood tall as the republic’s ascendant and triumphant region.” Yet today many of the premier Midwest industrial hotbeds have not yet recovered their dynamism. Almost all the comeback Midwestern cities were never strictly manufacturing burgs, but rather state capitals, university towns, and trade and distribution centers. Places like Kansas City, Columbus, and Des Moines may have been hit hard by de-industrialization but not as thoroughly as places like Detroit, Cleveland, and even Pittsburgh.

The once great manufacturing cities still suffer from low job creation rates, and dismal demographics. Unlike the comeback towns, the old industrial capitals still suffer from net domestic out-migration and continue to lose millennials. Even the industrial expansion—now in its seventh year and accelerating—has not done enough to turn things around. Since 2014, industrial growth and the revival of the auto industry have boosted Midwestern cities such as Warren, Michigan; Grand Rapids; Des Moines; Indianapolis; and Kansas City far more than Detroit. Cleveland, Buffalo, and Pittsburgh all continue to lose industrial jobs.

The old industrial towns are still saddled with deep-seated social problems. Starting in the 1920s, people from the Deep South migrated to Detroit and Cleveland in huge numbers to take advantage of opportunities. These people were largely left behind when the industrial economy shrank, and have suffered generations of poverty. Cities like Detroit, Milwaukee, and Cleveland remain among the nation’s poorest. Detroit, St. Louis, and Cleveland remain saddled with persistently high crime rates. These present huge barriers to any immediate resurgence.

Yet these cities do maintain some potential for rebirth. Places like St. Louis, Detroit, and Cleveland still retain the architectural residue that makes for vibrant downtowns; in fact, all three central districts have experienced some revival in recent years. Legacy institutions such as Carnegie Mellon in Pittsburgh, the Cleveland Clinic, and Washington University’s sprawling medical center in St. Louis could provide linchpins for future growth. Detroit’s central role in the auto industry could be bolstered by technology involved in creating autonomous and electric vehicles. These cities are still down, but they are far from out.

Meanwhile, the resurgence already under way in many parts of the Midwest creates new frontiers for urban growth and personal aspiration. The region’s opportunities stand in marked contrast to the kind of big-city coastal clustering advocated by many pundits—most of them living in these same cities that offer only the prospect of ever greater class division and stunted opportunity. Very few newcomers can hope to buy a house, or start a business in Manhattan.

Ultimately the comeback cities could recover a lost piece of America’s magic. This nation’s dynamism, as Alexis de Tocqueville noted some 180 years ago, stemmed not from concentration in one great city like Paris or London, but through the vibrancy of its many urban centers so that “the intelligence as well as the power of the country are dispersed,” he wrote. “Instead of radiating from a point, they cross each other in every direction; the Americans have established no central control over the expression of opinion, any more than over the conduct of business.”

This piece originally appeared on The Daily Beast.

Joel Kotkin is executive editor of NewGeography.com. He is the Roger Hobbs Distinguished Fellow in Urban Studies at Chapman University and executive director of the Houston-based Center for Opportunity Urbanism. His newest book is The Human City: Urbanism for the rest of us. He is also author of The New Class ConflictThe City: A Global History, and The Next Hundred Million: America in 2050. He lives in Orange County, CA.

Photo: Phil Roeder, via Flickr, CC License.

New Localism and Old Institutions

$
0
0

Last week I posted an article talking about the maturity curve, or the lifecycle arc from incubation to growth to maturity to decline that applies to so many things. And this weekend my review of Bruce Katz and Jeremy Nowak’s book The New Localism was published in the New York Times Book Review. These two items are related.

It’s been widely noted that trust in institutions has been declining across the board in America. Government, religion, media, and business have all seen declining trust. To be quite honest, that decline in trust is deserved. These institutions by and large are not meeting the challenges of our present day and are often dysfunctional.

The root of this at some level is the maturity curve. Our institutions are old and either in maturity or decline. (As I’ve observed many times, one reason sprawly suburbs seem so great in the now is simply that they are new, and so in the youth phases of their lifecycle).

At some level it’s hard to appreciate how old many of our institutions are. Some of them date to the American founding or before. Others are legacies of the 19th century or the New Deal. The high water mark of institutions was in the immediate postwar era – the Marshall Plan, NATO, the UN, the institutional infrastructure between things like the interstate highway system, structures like the GI bill, a then decently functioning corporatist combination of big business and big unions, and many other things.

But World War II ended almost 75 years ago. This is roughly the same distance as from the Civil War to World War II, and from the Revolution to the Civil War. These roughly 70 to 80 year epochs (the span of a human life, interestingly), produced major institutional resets in America, often after a process of upheaval. If history is any guide, we’re due for another one. (I gather that this might be the premise behind the book The Fourth Turning, which I have not read. My observations are my own, but I think rather obvious).

New Localism as Institutional Decay Workaround

I see “new localism” initiatives as an attempt to address this institutional decay. The premise seems to be that Washington is hopelessly broken and the state the wrong functional unit, hence cities and metropolitan areas need to find a way to accomplish institutional refresh for the 21st century.

Looking at the two domestic examples Katz and Nowak use, Pittsburgh and Indianapolis, what we see is the creation of new connectivity between institutions, and the creation of new layers or types of institutions to solve problems.

I will look at Indianapolis because I know that case the best. Katz and Nowak wrote up a case study on the Central Indiana Corporate Partnership. CICP is an economic development vehicle created by the top 50-60 major companies and universities in the broader Central Indiana area. CICP has developed and launched almost every major economic development effort in the state in the past 15 years or so. Here’s a map of everything they do.

Key attributes of CICP are that it is a civic sector initiative (though has partnerships with government), that is truly regional in scope, and which has a long-term time horizon that transcends politicians and electoral cycles.

Most cities and states have managed to create pretty much all of the initiatives that CICP has done. Most places have some sort of corporate council, either inside the chamber of commerce or separate from it. They have young professional groups, tech booster clubs, life sciences initiatives, etc. Yet the Indianapolis civic sector has been unusually cohesive and effective over the long term. CICP was a good choice for Katz and Nowak.

If the structures and institutions of government are inadequate to the 21st century, the CICP solution addresses this by essentially bypassing government and creating new, parallel institutions through which important things can get done. It’s essentially a workaround. It’s additive to existing institutions rather than reinvigorating them or replacing them.

CICP is a high functioning organization of its type, but the nature of this kind of institutional strategy (of which CICP is only one manifestation) leads to negative consequences elsewhere, namely in state and local government.

Though non-partisan (the current CEO is a Democrat, I believe), CICP has been tight with the Republican dominated state government. The state has a transactionally oriented economic development group called the Indiana Economic Development Corporation (IEDC), but otherwise has essentially outsourced economic development in the state to CICP.

CICP is thus a good example of what has happened generally in the state. A robust civic sector has essentially financed and enabled the retreat of government from its functions and responsibilities. The state loves to brag about its low taxes, AAA credit rating, and $2 billion in cash reserves, but part of that has been been accomplished because it has offloaded responsibilities to the private sector.

Just as one example, consider higher education. I’ve been writing a lot about the problems facing higher ed. It’s been widely observed that states have reduced their support for higher ed. Some of this has been because of financial problems at the state level due to mismanagement of pensions and debt, or understandable stress because of the Great Recession. Neither of these apply in Indiana today.

Given the link between research universities and economic development, you would think the state would see funding its flagship institutions as a critical economic development priority. But while I believe state funding has been relatively stable in Indiana recently, you can’t say that the state has been investing into its higher ed institutions.

In a superstar economy where the benefits flow disproportionately to the top of the pyramid, moving up the ladder is critical. Purdue is a top ten engineering school. That’s good. But it would be vastly more impactful if it were in the top five. Look at the economies around MIT, Stanford, and Berkeley, or around CMU’s #1 ranked computer science department.

What if the state of Indiana gave IU and Purdue another $100 million each annually for research? There’s nothing magic about that number and I’m not claiming that’s enough money for a radical change. I just picked it because the state could do that for a decade – a billion extra research dollars each for IU and Purdue – just with the money it already has in the bank – not a dime of extra taxes involved. But it’s not doing that.

So CICP doesn’t have a good partner in state government. Instead of being an entity that complements government investment, CICP effectively took over things that government would be much more heavily involved in elsewhere. If that freed the government to do things like invest in university research, it could be a big benefit to the state. Unlike many fiscally distressed states, Indiana is positioned to invest. Instead, it acts like Smaug sitting on its hoard of gold. The universities are actually investing the other direction, such as by participating in groups like CICP.

The situation is far worse at the local level. Indianapolis was historically famous for its mayors like Richard Lugar, Bill Hudnut, and Steve Goldsmith. But since then (Goldsmith left office in the 90s) the government of the city has atrophied to the point where it is largely ineffective. This winter saw the streets of the city turn into a cratered moonscape of potholes, forcing the city to do $14 million in emergency (and temporary) repairs. The parks department is all but non-existent. The Trust for Public Land ranked it dead last among American cities in spending on parks. It has only a fraction of the urban planners on staff of other cities its size, and last time I saw a job posting was only paying around $32,000 for someone with a masters degree in planning.

A highly functioning civic sector in Indianapolis effectively masked the collapse of government at the city level.

I believe a similar story could be told in Northeast Ohio. A group of local foundations created something called the Fund for Our Economic Future, and a series of regional economic development groups. It’s been widely praised and justly so. But these foundations and organizations are simply stepping into a vacuum. That’s admirable, but fixing the underlying institutional issues that created that vacuum in the first place is also critical. The Cleveland Foundation is America’s oldest and largest community foundation, but if it’s just funding things government ought to be doing anyway but isn’t, the region doesn’t really get the full benefit of that firepower.

This illustrates the limit of a new localism approach based only on new institutions and connectivity. New institutions can do very good things, but they can also become co-dependent enablers of the failure of existing institutions.

Our old institutions are still there and still declining. Something has to be done to fix or change them to become higher functioning. In particular, local government needs to be repaired and local services rebuilt and restored over time in many places. Other institutions probably need to be eliminated completely. This repair or replacement of existing institutions is a key part of any complete new localism and can’t be overlooked just because it’s hard.

This piece originally appeared on Urbanophile.

Aaron M. Renn is a senior fellow at the Manhattan Institute, a contributing editor of City Journal, and an economic development columnist for Governing magazine. He focuses on ways to help America’s cities thrive in an ever more complex, competitive, globalized, and diverse twenty-first century. During Renn’s 15-year career in management and technology consulting, he was a partner at Accenture and held several technology strategy roles and directed multimillion-dollar global technology implementations. He has contributed to The Guardian, Forbes.com, and numerous other publications. Renn holds a B.S. from Indiana University, where he coauthored an early social-networking platform in 1991.

Photo by tpsdave (Indianapolis-1888215) [CC0], via Wikimedia Commons

Viewing all 3788 articles
Browse latest View live


Latest Images