Quantcast
Channel: Newgeography.com - Economic, demographic, and political commentary about places
Viewing all 4164 articles
Browse latest View live

Rust Belt Cities: Invest in Odysseus, Not Barney Fife

$
0
0

Given its legacy of shrinking, the Rust Belt has issues. The issues arose naturally, and relate to the fact things leave, or that so much has left. Particularly, when things leave, the mind—both the individual and the collective city mind—can get protective and restrictive. Neediness arises. The smell of desperation ensues like a pall that can tend to hang over cities, influencing decision making on all levels.

Enter “brain drain”, or that term coined to refer to the outmigration of an area’s educated citizens, particularly it’s young. You know the drill: Johnny goes to State college, comes back home for a spell, but then leaves Cleveland, Ohio for Chicago or New York. That is brain drain. And city leaders hate it, spending billions of dollars to stop it—often at the cost of coming off ridiculous, lame.

For instance, in Pittsburgh, there was a civic booster campaign thought up to keep educated folks from going. It was called “Boarder Guard Bob”. According to researcher Chris Briem, “Bob” was a Smokey-the-Bear-type of public service announcement made into a Barney Fife character, with the billboard-size messaging of “Bob” intended to “stop young people at Western Pennsylvania’s borders before they had a chance to leave for other cities”. And while this particular retention strategy (luckily) never went to print, various “plug the brain drain” strategies persist in one form or another at exorbitant cost to taxpayers.

But beyond the near-pitiful messaging, there are major problems with the brain drain approach, especially from an economic development perspective. For example, when, as a community, you are intentionally telling your citizen’s not to go, you are asking them to sacrifice personal development for the benefit of a place. To this point, my colleague, Jim Russell—a leading thinker in brain drain boondoggles and blogger at Burgh Diaspora—says it best, stating: “Discouraging geographic mobility is the same as restricting access to higher education”. In other words, it’s like telling Johnny to stick with his high school diploma so as to forego leaving the community for a 4-year degree.

What’s more, getting people to stay put does little to grow a local economy. In fact it hurts it. Because leaving home is often a rite of passage. It develops a person. I mean, can you imagine if there was no odyssey in the epic Odyssey? If so, Odysseus wouldn’t be the changed man with perspective and experience as he was when he returned back to his homeland, and so there’d be no “there” there. In this sense, the Rust Belt needs to engage their young to embark on their own “Hero Journey” if only to gain skills and broaden geographic connections. This is international economics 101 (see China, India, Brazil, etc.). It should be a domestic economic priority for the Rust Belt, and it would be if only the Cleveland’s of the world could let go of the protectionism that defines their longstanding existential fears of shrinking into one big pile of ruin porn.

Of course confidently encouraging outmigration is part and parcel with an understanding that many expats will “boomerang” back. But many are, and at a faster rate. To wit: as the alpha cities of the America like NYC get too expensive or creatively-class cute, many Rust Belt refugees are pivoting back from a certain left-wanting lifestyle if only for the opportunity, tradition, and honest-to-god reality that is “Rust Belt Chic”. And when they do, they often become “economic ass kickers”, which is term Russell uses to exemplify the fruits of the Hero Journey that is not only individually experienced, but felt in the local economy as well.

Take Sean Watterson, the co-proprietor of the wildly successful restaurant the Happy Dog on Cleveland’s Near West Side. He moved back from D.C. because, according to a recent Plain Dealerarticle, “Cleveland-ness is like Polish-ness or Irish-ness. It’s an ethnicity”. Here, Watterson not only runs a great hot dog business, but uses his establishment to advance a circulation of ideas by hosting a variety of events like “Life, the Universe, and Hot Dogs”, which is a series hosted by researchers from the Institute for the Society of Origins. Another big hit is the live performances by members of the Cleveland Orchestra called Classical Revolutions.

Cool sounding events, sure. But there is more to it than that, as such happenings spark cross-fertilization between parts of Cleveland—the blue collar West Side and the intelligentsia of the East Side—that have long been divided, often at the cost of Cleveland as a place of cultural and economic innovation. And how exactly does Watterson’s own “Hero Journey” come into play in his self-stated goal to break down barriers “between east and west and between high culture and low culture”? It likely relates to the fact he experienced experience outside of a legacy city bubble that enabled him to see and cross bridges that others have difficulty envisioning.

Now, does this mean that cities simply need to let people leave to prosper? Obviously not. If the place expats are boomeranging back to is stagnant and disparate, with openness and connection disabled by a collective insular mentality that: “that’s just the way things are done around here”, well, the boomeranging effect won’t hold. And the economic ass-kickers won’t ass-kick.

The goal, then, of cities should be on fostering return migrant connections, or to know who they are, why they are there, and to help get them together so that their collective unchained perspective can pop bubbles of inert status quo. This need is real. For instance, take this first-hand return migrant account published in Rust Belt Chic by Dana Marie Textoris:

Funny how your location-based identity, your physical and mental place in the world, can flip like a switch: Before I was a Clevelander managing to make it in San Francisco….right now I feel a lot like a San Franciscan stuck in Cleveland. In either place, I felt just a little bit Other. A bit of a novelty. Just a tad on the outside looking in. Where does that leave me? Where is home? As I type this, I realize, with sort of an internal groan, that the place I’m left in, the guide to what I’m searching for, is probably just right here, inside me, where my two lives — West Coast and Midwest — are now combined. I’m not really a true Clevelander anymore…I’ve picked up way too much San Francisco for that. The balance I’ve become, a little of this and that, is just what I’m hoping I’ll find, one day.

So, to all Rust Belt cities—this is where your attention must be turned: not on the ones who are leaving for good reason, but on those returning who have not left for good. They have brought the path of their self-discovery back to your doorstep.

Don’t close the door by screaming at the backs of others.

Richey Piiparinen is a writer and policy researcher based in Cleveland. He is co-editor of Rust Belt Chic: The Cleveland Anthology. Read more from him at his blog and at Rust Belt Chic.
Will Driverless Cars Help us Drive Less?

$
0
0

The war on automobiles is real. Backed by a legion of city officials, environmentalists, and new urbanists, the argument to mitigate vehicle has so far been an easy sell – at least in planning circles. Their assumptions echo concerns about the trajectory American cities – the downfall of rural life and open space to name a few.  The problem is the trifecta of pollution, congestion, and urban sprawl. Out with cars, they propose – people could ride high-speed transit instead of sitting in traffic.

But technical innovation could make this proposal more like a plea. Google, along with GM, Ford, and Daimler are now designing cars that drive themselves, making private vehicles more efficient, flexible, and thereby more irreplaceable. The US is not alone. Manufacturers in Japan and Germany are coordinating with their national government to launch their autonomous cars within the next decade. IEEE, a group of technology professionals, says that self-driving vehicles would comprise 75 percent of the global traffic stream by 2040. 

“Currently, a car spends 96% of its time idle,” says Koushik Dutta of ClockworkMod. He says there’s an unforgiving economic incentive to make sure an airplane is always in use, since they spend almost their entire lifetime in operation. To leave a plane idle is inefficient and unprofitable; similar logic applies to parked car. Some predict the autonomous vehicle technology will decrease this idle time as households begin to link their commutes in one car, rather than one car per person. Sergey Brin, Google’s cofounder, believes the technology, now tangible, will be on the market in five years.

But what precisely is this new technology? As it turns out, much of it is not new; a number of automated features can be found in today’s cars: timed braking during collisions, motion sensors that detect distance between the vehicle and what’s in front of it, and adaptive cruise control. Many of the latest features have applications that use advanced sensors to self-park and prevent drifting to adjacent lanes and self-park.

Unprecedented is the use of a network for vehicles to communicate with one another. A study finds that if vehicles use sensors alone, highway capacity can increase by 43 percent, and if all of the vehicles use both sensors and vehicle-to-vehicle (V2V) communication, the increase swells to 273 percent. Additionally, networks can facilitate information exchange between vehicles and road infrastructure (V2I). With live data streams, cars will be able to inform one another about oncoming traffic, and perhaps even instinctively reroute the car onto less congested roads.

The move to driverless cars will make the private vehicle much more attractive compared to other modes of travel. This is occurring just as an aging population could lead to reduced driving ;  the coming of driverless cars brings them back onto the road. Less reliant on their friends and family as chauffeurs, boomers may happily embrace the ability to travel further and more frequently.

This appeal will extend of course to all generations. The driverless car will offer the current conveniences of the private auto,– such as door-to-door travel, safety, and status – while reducing its level of rick and mental stress. Also, the stigmas of driving are eased; self-driving cars will likely be more eco-friendly, time-efficient, and user-friendly. Once available on the market, driverless technology will change lives by saving lives. Advocates of self-driving cars believe that with less human activity and more automated maneuvering on the road, fewer accidents will occur.

But before autonomous cars can save lives, it must squirm through some political barriers. For one, city officials in large metropolitans are glued to the idea that the best communities exemplify mixed used, high-density, transit-oriented development. Hoping to reverse the still far from over exodus to the suburbs, cities like Los Angeles are banking on public transit to revitalize its inner-urban areas. Though public transit ridership has increased in the last two decades, its market share of ridership has being declining. Metropolitan officials hope that millennials, who tend to be more cognizant of mankind’s carbon footprint, will reverse the trend. It is, however, difficult to imagine why any future generation would enjoy the conveniences of taking transit if a car ride can be just as untroubled. Driverless will make vehicle ownership much more attractive. Public transit will lose its status as an amenity. One of the chief advantages of public transit is the fact that one can ride it stress free without worrying about maneuvering to the destination. With driverless cars, this advantage is superseded.

Congestion may increase because more vehicles will find the frustrations of wading in traffic mitigated. Time in congestion can be replaced with a book, movie, perhaps even a nap. But there’s also the possibility that more households will link their trips using one shared vehicle, decreasing the number of vehicles on the road. Some suggest this may help Americans come to terms with letting go of the private vehicle and, instead, embrace the idea of having one household vehicle, a prevailing trend across the rest of the world.

Transportation planners often promote tolls as revenue sources because building high-occupancy and toll (HOT) lanes. The concept is deemed equitable since it links the payers with the users, begetting a sustainable funding model. Much of the funding for these projects is based on the congestion premium - what people will pay to avoid a crammed highway. This is useful in determining how much to price a toll or high-occupancy lane. But since driverless technology will likely lower this premium, the revenue of these lanes may be overvalued.

With the pieces in place, the journey to driverless cars is vastly feasible. In September 2012, California Governor Jerry Brown enacted a state measure to legalize driverless technology in cars running on public roads; at any given moment, a dozen driverless cars are operating somewhere in California. Currently, each vehicle is manned by two testers and marked by a distinguishable license plate. In the future, the vehicle will only be required to have a one driver. And not too far is the idea of a completely unmanned vehicle, what some call the robocar, which will revolutionize not just our mode of travel but our relationship with time and distance.

Jeff Khau graduated from Chapman University with a degree in business entrepreneurship. Currently, he resides in Los Angeles where he is pursing his dual-masters in urban planning and public policy at the University of Southern California.

Retrofitted driverless Lexus photo by WikiCommons user Steve Jurvetson via Mariordo.

The New Power Class Who Will Profit From Obama’s Second Term

$
0
0

When President Obama takes the oath of office for the second time, he will also usher in a new era in American power politics. Whereas the old left-wing definition of “who rules” focused on large corporations, banks, energy companies and agribusinesses, the Obama-era power structure represents a major transformation.

This shift stems, in large part, from the movement from a predominately resource and tangible goods-based economy to an information-based one. In the past, political struggles were largely fought over how to divide up the spoils generated by the basic productive economy; labor, investors and management all shared a belief in the ethos of economic growth, manufacturing and resource extraction.

In contrast, today’s new hegemons hail almost entirely from outside the material economy, and many come from outside the realm of the market system entirely. Daniel Bell, in his landmark 1973 The Coming of Post-Industrial Society, may have been the first to identify this ascension to “pre-eminence of the professional and technical class.” This new “priesthood of power,” as he put it, would eventually overturn the traditional hierarchies based on land, corporate and financial assets.

Forty years later the outlines of this transformation are clear. Contrary to the conservative claims of Obama’s “socialist” tendencies, the administration is quite comfortable with such capitalist sectors as entertainment, the news media and the software side of the technology industry, particularly social media. The big difference is these firms derive their fortunes not from the soil and locally crafted manufacturers, but from the manipulation of ideas, concepts and images.

Apple, Google, Facebook, Amazon and Microsoft are far from “the workers of the world,” but closer to modern-day robber barons. Through their own ingenuity, access to capital and often oligopolistic hold on lucrative markets, they have enjoyed one of the greatest accumulations of wealth in recent economic history, even amidst generally declining earnings, rising poverty and inequality among their fellow Americans.

Last year the tech oligarchs emerged as major political players. Microsoft, Google and their employees were the largest private-sector donors to the president. More important still, tech workers also provided the president and his party with a unique set of digital tools that helped identify potential supporters among traditionally uninformed and disinterested voters, particularly among the young.

An even greater beneficiary of the second term will be the administrative class, who by their nature live largely outside the market system. This group, which I call the new clerisy, is based largely in academia and the federal bureaucracy, whose numbers and distinct privileges have grown throughout the past half century.

Even in tough times, high-level academics enjoy tenure and have been largely spared from job cuts. Between late 2007 and mid-2009, the number of U.S. federal workers earning more than $150,000 more than doubled, even as the economy fell into a deep recession. Even as the private sector, and state government employment has fallen, the ranks of federal nomenklatura have swelled so much that Washington, D.C., has replaced New York as the wealthiest region in the country.

As a former professor at the prestigious University of Chicago, and a longtime ally of public-sector unions, Barack Obama’s political persona is all but indistinguishable from these new hierarchies. Their support for him has become critical, particularly as the onetime “hedge fund candidate,” decided to wage a very effective class warfare campaign on the hapless Mitt Romney.

This decreased Obama’s support among the plutocrats, even if they have thrived under his watch, but he made up for this in part by tapping bureaucracies that benefit from expanding government. Indeed the clerisy accounted for five of the top eight sources of Obama’s campaign funding, led by the University of California, the federal workforce, Harvard , Columbia and Stanford. Academic support for Obama was remarkably lock-step: a remarkable 96% of all donations from the Ivy League went to the president, something more reminiscent of Soviet Russia than a properly functioning pluralistic academy.

To understand the possible implications of the new power arrangement, it is critical to understand the nature of the new clerisy. Unlike traditional capitalist power groups, including private-sector organized labor, the clerisy’s power derives not primarily through economic influence per se but through its growing power to inform opinion and regulate everything from how people live to what industries will be allowed to grow, or die.

The clerisy shares a kind of mission which Bell described as the rational “ordering of mass society.” Like the bishops and parish priests of the feudal past, or the public intellectuals, university dons and Anglican worthies of early 19th century Britain, today’s clerisy attempts to impart on the masses today’s distinctly secular “truths,” on issues ranging from the nature of justice, race and gender to the environment. Academics, for example, increasingly regulate speech along politically correct lines, and indoctrinate the young while the media shape their perceptions of reality.

Most distinctive about the clerisy is their unanimity of views. On campus today, there is broad agreement on a host of issues from gay marriage, affirmative action and what are perceived as “women’s” issues to an almost religious environmentalism that is contemptuous toward traditional industry and anything that smacks of traditional middle class suburban values. These views have shaped many of the perceptions of the current millennial generation, whose conversion to the clerical orthodoxy has caught most traditional conservatives utterly flat-footed.

As befits a technological age, the new clerisy also enjoys the sanction of what Bell defined as the “creative elite of scientists.” Prominent examples include the Secretary of Energy, the Nobel Prize-winning physicist David Chu; science advisor John Holdren; NASA’s James Hansen; and the board of the U.N.’s Intergovernmental Panel on Climate Change. In the words of New York Times hyper-partisan Charles Blow, Republicans have devolved into the “creationist party.” In contrast Obama reigns gloriously hailed as “the sun king” of official science.

Let’s be clear — this new ascendant class is no threat to either the “one percent,”  or even the much smaller decimal groups. Historically, the already rich and large economic interests often profit in a hyper-regulated state; the clerisy’s actions can often stifle competition by increasing the cost of entry for unwelcome new players. Like Cardinal Richelieu or Louis XIV’s finance minister, Jean-Baptiste Colbert, our modern-day dirigistes favor state-directed capital that has benefited, among others, “green” capitalists, Wall Street “too big to fail” firms and, of course, General Motors.

More disturbing still may be the clerisy’s regal disregard for democratic give and take. Both traditional hierarchies, or new ones like the Bolsheviks after the 1917 revolution, disdain popular will as intrinsically lacking in scientific judgment and societal wisdom. Some leading figures in the clerisy, such as former Obama budget advisor Peter Orszag, openly argue for shifting power from naturally contentious elected bodies to credentialed “experts” operating in places Washington, Brussels or the United Nations.

Such experts, of course, see little need for give and take with their intellectual inferiors, in Congress or elsewhere. This attitude is expressed in the administration’s increasing use of executive orders to promote policy goals such as better gun control, reduced greenhouse emissions or reform of immigration. Whatever one’s views on these issues, that they are increasingly settled outside Congress represents a troublesome notion.

Like empowered bureaucrats everywhere, the clerisy also sometimes reserves a nice “taste” for themselves, much as the old bishops and upper clergy indulged in luxury and even prohibited pleasures of the flesh. Just look at the lavish payouts accorded to Orszag and Treasury Secretary-designate Jacob Lew, who, after serving in the bureaucracy, make millions off the same Wall Street firms that have so benefited from administration policies.

So who loses in the new order? Certainly unfashionable companies  – oil firms, agribusiness concerns, suburban homebuilders — face tougher times from regulators and the mainstream media . But the biggest losers likely will be the small business-oriented middle class. Not surprisingly Main Street, far more than Wall Street, harbors the gravest pessimism about the president’s second term.

The small business owner, the suburban homeowner, the family farmer or skilled construction tradesperson are intrinsically ill-suited to playing the the insiders’ game in Washington. Played up to at election time, they find their concerns promptly abandoned thereafter, outliers more than ever in a refashioned political order.

Joel Kotkin is executive editor of NewGeography.com and a distinguished presidential fellow in urban futures at Chapman University, and a member of the editorial board of the Orange County Register . He is author of The City: A Global History and The Next Hundred Million: America in 2050. His most recent study, The Rise of Postfamilialism, has been widely discussed and distributed internationally. He lives in Los Angeles, CA.

This piece originally appeared at Forbes.com.

Official White House Photo by Pete Souza.

California's Politics of Farce

$
0
0

Karl Marx wrote, "History repeats ... first as tragedy, then as farce." Nothing better describes how California, with its unmatched natural and human riches, has begun to morph into what the premier California historian Kevin Starr has called "a failed state" – a term more usually applied to African kleptocracies than a place as blessed as the Golden State.

The tragedy begins with the collapse of a governance system once widely hailed as a leader in efficiency and foresight but which now perpetually teeters at the brink of insolvency and suffers among the worst credit ratings of all the states. Only 20 years ago, the state's fiscal debt per capita was just below the national average; now it ranks consistently toward the bottom No surprise, then, that California routinely ranked as the "worst governed" state in America.

This poor performance has consequences, particularly in terms of business. Today, CEOs rank California as just about the worst place to do business in the country, and have for a remarkable eight years in a row. And it's not just the plutocrats who are angry; a survey by the economic forecasting firm EMSI shows that, in 2011, California also ranked 50th, just ahead of Michigan, in new business startups.

Unlike my conservative friends, I do not think the fault lies entirely with the Democrats. Instead, it has to do with the total eclipse of the state's once-lively two-party system. As Starr has noted, California's golden age of governance from the 1940s to the 1960s was largely a bipartisan affair, with power shifting between the parties. "Despite their differences," Starr writes, "Democrats and Republicans saw sufficiently eye-to-eye" to embrace policies that drove California's growth.

Progressives, for their part, often suggest this paradigm died with the 1978 passage of Proposition 13, which diminished local government and concentrated fiscal power in Sacramento. Yet even as late as early 1990s, when the state was facing a dire recession due to the end of the Cold War, liberal Democrats such as Assembly Speaker Willie Brown and state Sen. John Vasconcellos managed to work well with Republican Gov. Pete Wilson and business leaders like Peter Ueberroth to force policy changes that helped spur the state's last sustained recovery.

The more recent demise of California governance stems from demographic trends and political miscalculations that have turned our state increasingly into something akin to Mexico under the old dictatorship of the PRI (Institutional Revolutionary Party). Wilson's decision to embrace the anti-illegal-immigration measure Prop. 187 as part of his 1994 re-election strategy helped precipitate this shift. Although Prop. 187, which passed easily, helped in the short run, it crippled the Republican Party in the ensuing decades.

Before 1994, Republicans were capable of winning upward of two-fifths of the Latino vote. But after that, as the Latino portion of the electorate grew, from 7 percent in 1980 to more than 21 percent today, these voters became, much like the African-American vote, essentially a bloc owned by the Democrats. In 2010, Jerry Brown won nearly two-thirds of their votes in his bid to return as governor. Asian voters, despite their decidedly middle-class and entrepreneurial bent, sensed the whiff of nativism among Republicans and also turned to the Democrats. With minority communities' share of the electorate growing every year, the GOP essentially has backed itself into permanent minority status.

This has set the stage for a bizarre political farce, where minority representatives in Sacramento – with few exceptions – consistently vote against the interests of their own constituents on issues such as water allocations in the Central Valley or regulations that boost energy and housing prices. In their clamor to join the "progressive" team, they, in effect, are placing the California "dream" outside the reach of the state's heavily minority working class.

It's almost surreal to see people who represent impoverished East Los Angeles and Fresno, for example, vote exactly the same way as those who represent rich, white and older voters in Marin County and Westside Los Angeles. You don't have to watch "Downton Abbey" to see "upstairs, downstairs" politics. Despite mouthing progressive rhetoric, California's minority legislators seem intent of creating an increasingly feudalized California.

And what of the middle class – once the bastion of both the GOP and the kind of "responsible liberalism" that promoted growth under the late Gov. Pat Brown? This largely Anglo group has been shrinking, both for decades as a percentage of California's population and, during the past 10 years, in absolute numbers. From 2000-10 the number of non-Hispanic whites in the state dropped from 15.8 million to 14.95 million.

Increasingly, the residual California middle class is either part of the public sector nomenklatura or the swelling ranks of retirees. These people often feel no compulsion to leave California for the reasons – such as weather and high property taxes – that drive their counterparts out of places like New York or Illinois. In contrast, the productive, working-age private middle class, harassed by taxes, regulations and soaring costs, increasingly appears more of an endangered species than the famed Delta smelt.

Of course, there remain pockets of private sector strength, such as Silicon Valley and Hollywood, as well as the various biomedical and biotech companies that still thrive in places such as Orange County and San Diego. These, however, increasingly represent legacy industries, beneficiaries of past accomplishments and better entrepreneurial conditions. Yet, even here, despite the current tech boom, California's position over the past decade has declined relative to more business-friendly states.

In the immediate future, we should expect more of the same from our one-party government. Flush from the passage of Prop. 30, tax increases backed by public sector unions, there is little to restrain them beyond occasional resistance from Gov. Brown. Having made California's income taxes the highest in the U.S., legislators and local officials are already busily concocting new taxes, fees and another spate of bond issues to prop up the nation's most-cosseted public sector, and, of course, fund its rich pensions at the expense of mostly middle-class taxpayers.

Indeed the emphasis on income taxes, representing now close to half of state revenue, creates perverse economic outcomes. With their funds hidden in overseas accounts and other dodges, Hollywood moguls and their Silicon Valley counterparts may hang around, mouthing progressive shibboleths while dining exquisitely. But there is clearly erosion among the less-glamorous entrepreneurial class. The number of households earning above $300,000 dropped by 45,000 from 2006-09, according to the Department of Finance, while those earning under $100,000 has grown by more than 180,000. It's likely that Prop. 30 will accelerate this trend.

But it's not only taxes that will depress growth. Our Mad Hatter one-party, public-sector-dominated state seems keen to press its regulatory assault on employers and job creators. With climate change-related legislation certain to boost already high energy costs, we also can expect industries, from food processing to semiconductors and aerospace, to continue heading to friendlier locales.

Unless these policies are challenged, California will continue to underperform well below its potential. Even worse, a state that created the modern American Dream of upward mobility will continue to devolve toward a kind of neofeudalism dominated by a few rich, with many poor and a well-fed, tenured government caste. The only way to halt this continuing farce in Sacramento is for Californians of all backgrounds to recognize that government that so earnestly claims to serve "the people" is doing anything but that.

Joel Kotkin is executive editor of NewGeography.com and a distinguished presidential fellow in urban futures at Chapman University, and a member of the editorial board of the Orange County Register. He is author of The City: A Global History and The Next Hundred Million: America in 2050. His most recent study, The Rise of Postfamilialism, has been widely discussed and distributed internationally. He lives in Los Angeles, CA.

This piece originally appeared in the Orange County Register.

Demographic and Economic Challenges: The 9th Annual Demographia International Housing Affordability Survey

$
0
0

The just released 9th Annual Demographia Housing Affordability Survey (pdf) indicates that housing affordability has deteriorated modestly in the last year. A number of major metropolitan areas remain severely unaffordable.

Highlights: Metropolitan Areas

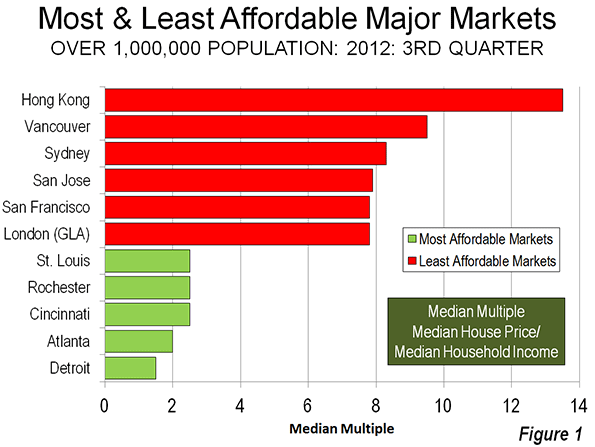
Among the 337 Metropolitan markets analyzed, Hong Kong remained the most unaffordable, with a median multiple (median house price divided by pre-tax median household income) of 13.5, up nearly a full point from last year's 12.6. No other housing market has ever reached such an intense level of unaffordability since the Survey began (Los Angeles reached 11.5 in 2007).

Rounding out the least affordable major markets (over 1,000,000 population) were Vancouver at 9.5, Sydney at 8.3, San Jose (US) at 7.9, and a tie in fifth place between San Francisco and London (Greater London Authority) at 7.8. The most affordable markets were Detroit at 1.5 (Note 1); Atlanta, at 2.0 (Note 2); and Cincinnati, Rochester (US), and St. Louis at 2.5 (Figure 1).

Rating Housing Affordability

The Demographia Housing Affordability Surveydefines four housing affordability categories (Table 1), starting with "affordable." Affordable housing markets have a median multiple of 3.0 or less, the upper bound of overall housing affordability that existed virtually across all major markets in the United States, the United Kingdom, Canada, Australia, Ireland and New Zealand before the adoption of urban containment policy (also called densification policy, urban consolidation, compact cities, smart growth, or growth management).


Table 1

Demographia International Housing Affordability Survey

Housing Affordability Rating Categories

Rating

Median Multiple

Severely Unaffordable

5.1 & Over

Seriously Unaffordable

4.1 to 5.0

Moderately Unaffordable

3.1 to 4.0

Affordable

3.0 & Under


Highlights: Nations

Of all nations, only the United States has affordable major markets and a strong representation in the moderately unaffordable category. Six major markets in the United States were rated in the severely unaffordable category, including San Jose, San Francisco, San Diego, Los Angeles and New York.

Canada had two markets rated moderately unaffordable, while one half of its major markets were rated severely unaffordable, including Vancouver, Toronto and Montréal. Ireland's one major market, Dublin, was rated moderately unaffordable.

One half of the major markets in the United Kingdom were also rated severely unaffordable, including London (GLA), Plymouth & Devon, the London Exurbs (Southeast and East of England), Bristol, Liverpool, Newcastle, Birmingham, and Sheffield. All of the major markets in Australia (Sydney, Melbourne, Brisbane, Perth and Adelaide), China (Hong Kong), and New Zealand (Auckland) were rated severely unaffordable (Table 2).

Hong Kong and Singapore are the world's largest city-states. An analysis of a large share of the Singapore market suggests a median multiple of approximately 6.0, which is substantially more affordable than Hong Kong.

Table 2

Housing Affordability Ratings by Nation: Major Markets (Over 1,000,000 Population)

 Nation

Affordable

(3.0 & Under) 

Moderately

Unaffordable (3.1-4.0)

Seriously Unaffordable (4.1-5.0)

Severely Unaffordable (5.1 & Over)


Total


Median

Multiple

 Australia

0

0

0

5

5

6.5

 Canada

0

2

1

3

6

4.7

 China (Hong Kong)

0

0

0

1

1

13.5

 Ireland

0

1

0

0

1

3.6

 New Zealand

0

0

0

1

1

6.7

 United Kingdom

0

0

8

8

16

5.1

 United States

20

20

5

6

51

3.2

 TOTAL

20

23

14

24

81


Longer Term Trends

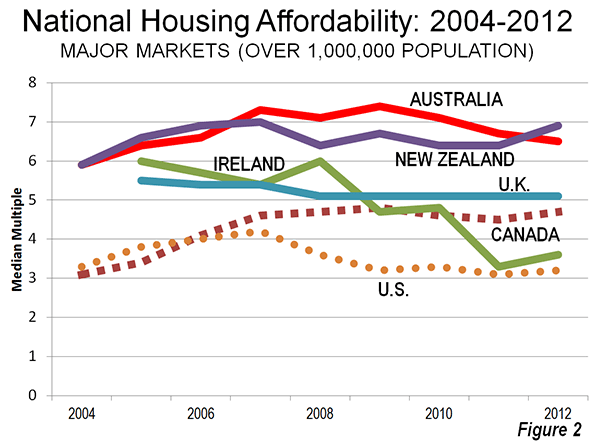
Over the years of the Demographia International Housing Affordability Survey, housing affordability has improved by far the most in Ireland. It has also improved in the United States. Affordability in Canada's major markets was the most favorable in 2004, but has seen large Median Multiple increases in each of the three largest metropolitan areas. As a result, there is increasing concern about housing affordability in Canada.

Australia and New Zealand have had the most unaffordable major markets, with every market being severely unaffordable in every year, reflecting earlier adoption of densification policy by states and metropolitan areas. Housing affordability has also been severely unaffordable in United Kingdom major markets over the period covered (Figure 2).

A Competitive Land Supply: Key to Housing Affordability

Overwhelming economic evidence indicates that urban containment policies, especially urban growth boundaries raise the price of housing relative to income. This inevitably leads to a reduced standard of living and increases poverty rates, because the unnecessarily higher costs of housing leave households with less discretionary income to spend on other goods and services. The higher costs ripple into rental markets, tightening the budgets of lower income households, who already suffer from lower discretionary incomes.

The principal driver of unaffordable housing relative to median incomes is failure to maintain a "competitive land supply." Brookings Institution economist Anthony Downs describes the process, noting that more urban growth boundaries can convey monopolistic pricing power on sellers of land if sufficient supply is not available, which, all things being equal, is likely to raise the price of land and housing that is built on it. This has, more often than not, been associated with urban containment policy and virtually never with the more liberal land use policy that preceded it.

Recent Policy Developments

The last year has seen public policy progress. The New Zealand central government plans to expand the land supply and provide alternatives for infrastructure finance, both of which are likely to lead to improved housing affordability. In his Introduction to this years' Survey, Hon. Bill English, Deputy Prime Minister of New Zealand pinpoints the factors leading to the policy changes:

It costs too much and takes too long to build a house in New Zealand. Land has been made artificially scarce by regulation that locks up land for development. This regulation has made land supply unresponsive to demand. When demand shocks occur, as they did in the mid-2000s in New Zealand and around the world, much of that shock translates to higher prices rather than more houses.

The Conservative-Liberal Democrat Coalition is proposing policies to build housing on more competitively priced land, to improve housing affordability. Planning Minister Nick Boles has called Britain's lack of housing affordability "the biggest social justice crisis we have," and called it bigger than education and unemployment (video). These proposals have been long in coming. It has been four decades since Sir Peter Hall and associates documented the consequences of urban containment, and nearly a decade since the similar conclusions of Kate Barker for the Labour Government.

In Hong Kong, facing public demonstrations on issues such as housing affordability, the government has adopted a plan to improve housing affordability.

However, the policy is deteriorating in California, where state regulations could virtually outlaw new single-family housing on the urban fringe. In the last year housing affordability losses have been substantial and could portend another housing bubble in this state that precipitated Great Financial Crisis with its egregious house price increases.

Evolving Perspectives

Planning perspectives could be evolving. New York University Professor Shlomo Angel writes in his book Planet of Cities of the importance of housing affordability and argues against urban planning restrictions that restricting adequate housing to ordinary households.

A team of UK academic researchers questioned the "default" preference for urban containment policy. This is an important development, since much of urban planning is committed to outlawing more liberal land-use policies.

The Economic Challenge

Nations around the world face serious economic challenges. Governments have taken on unaffordable obligations, and repayment continues to elude authorities in the United States, the European Union, and elsewhere. Future demographic trends are likely to only exacerbate this difficulty, driven by plummeting birth rates and a rising elderly population (See The Rise of Post-Familialism: Humanity's Future?).

Urban policy needs a "reset." The emphasis should be shifted away from "designing" urban areas toward facilitating a better standard of living for the people who live in them. In his epic Civilization: The West and the Rest, historian Niall Ferguson, in his Civilization notes that

The success of the civilization is measured not just in its aesthetic achievements but also, and surely more importantly in the duration and quality of life of its citizens.

This requires greater affluence and less poverty, both of which require more affordable housing.

-----

Note 1: The city of Detroit has experienced a severe economic decline. However, the Detroit metropolitan area (which includes the city, the suburbs and exurbs) has fared much better. The city (municipality or local government authority of Detroit experienced a population loss from 1,850,000 to 714,000 in the last 60 years, while suburban and exurban areas added 2.2 million. There are a variety of theories about Detroit's municipal decline, involving both "push" and "pull" factors (such as the incompetence and corruption of the municipal government to the not unrelated attraction of suburban living).  Further, the overall population growth rate of the Detroit metropolitan area has not been strong, but exceeded that of the other three worst hit "Rust Belt metropolitan areas, Cleveland, Buffalo and Pittsburgh (which lost population). Metropolitan Detroit's growth rate was similar to that of the New York metropolitan area (35 percent compared to 42 percent), which ranked 46th in growth (out of 51) compared to Detroit's 48th.

Note 2: At the peak of the housing bubble, affordability deteriorated to a moderately unaffordable 3.1 in Atlanta. Atlanta had been among the high income world's fastest-growing metropolitan areas for at least three decades, but slowed briefly during the Great Financial Crisis. Growth has returned, with Atlanta ranking third in net domestic migration among US metropolitan areas with more than 5 million population.

----

Photograph: Hong Kong (by author)

Wendell Cox is a Visiting Professor, Conservatoire National des Arts et Metiers, Paris and the author of “War on the Dream: How Anti-Sprawl Policy Threatens the Quality of Life.”

Why Republicans Need the Cities

$
0
0

Republicans took an all around shellacking in the 2012 elections. Part of the reason is that Democrats dominated the cities. President Obama won 69% of the big city vote, according to a New York Times exit poll analysis. Some of this is perhaps on account of the racial makeup of the cities, as blacks overwhelmingly vote Democratic. Yet it’s clear that, even among the upscale white urbanist crowd, Republican policies and candidates are finding few takers.

This bodes ill for the Republicans, but also for the future of cities. Most places suffer when under single-party rule, whether liberal or conservative. This has plagued big cities. Chicago, for example, doesn’t have a single Republican member of its city council. For a long time Republicans dominated large tracts of the suburbs.

These geographically discrete monopolies have resulted in a thoroughly corrupt bi-partisan system that Chicago Tribune columnist John Kass has dubbed “The Combine.” Some competition remained at the state level, but it should come as no surprise that as the state as a whole as gone solidly blue, state and city finances have cratered, leaving Illinois as a national basket case.

Cities can benefit from Republican ideas on a variety of fronts. As Harvard Economist Ed Glaeser points out in City Journal, Republicans have been leaders in ideas around urban crime reduction, education reform, and privatization and rationalization of city services.

Unfortunately, Republicans have largely abandoned the urban playing field, preferring to condemn the cities as cesspools of Democratic corruption, high taxes, and decay. The Republican party today is largely driven by exurban and rural leaders, as well as populist movements like the Tea Party, with values that are not widely shared by urban dwellers. This has not only cost the party votes, but, critically, it has left it on the outside looking in on many debates, as culture is shaped in large urban centers where Republicans have little voice.

It’s well past time for Republicans to take cities seriously again. This starts with valuing urban environments, and respecting (or at least taking time to understand) the values of the people who live there. For example, urban dwellers expect and indeed require a higher level of public services than many suburban residents. The suburbs might not need quality street lighting, for example, but cities do. The rural area I grew up in can rely on people passing by in pickup trucks with chain saws to clear away trees that fall on the road. Cities can’t. Thus, Tea Party-type policy prescriptions in which basically everything the government does is considered bad, and in which cutting taxes is the main political value, aren’t likely to sell. Urban dwellers actually want to know how you are going to deliver services more effectively. Similarly, just bashing transit as a waste of money, lashing out against location-appropriate density, opposing all environmental initiatives, and shrill anti-immigrant rhetoric only turn urban dwellers off.

If Republicans took urban concerns seriously, they would find that they have much to offer urban residents and voters. For example, Democrats pay lip service to transit, but much transit policy in America today (heavily shaped by Democrats) is more oriented towards protecting entrenched constituencies than it is towards actual effectiveness. A serious Republican-led effort to reform the federal process and reduce the insane construction price premium (effectively a transit surtax) for American transit versus overseas systems would be welcomed, as long as it was not a Trojan horse for undermining transit. Republicans have so abandoned transportation (other than highway spending), that ideas which Republicans invented, like congestion pricing, have been claimed by the left as their own.

As an example of what a more urban focused Republican/conservative could be, consider the Manhattan Institute, a free market think tank (full disclosure: I have been a writer for their City Journal magazine). Because they are based in New York City, demonizing transit and such is just not realistic. Hence they’ve focused on policy ideas that are actually relevant to the city. They’ve also not hesitated to praise Mayor Bloomberg’s transportation reforms, and even gave an award to Rhode Island Democratic state treasurer Gina Raimondo for her leadership in pension reform. If more conservatives were similarly focused on driving better urban outcomes in the inner city rather than demonizing it, or on scoring political points, Republicans might be back in the game.

Republicans have a huge opportunity in the enormous income and wealth gap in inner cities, which Democratic policies, focused on things like greening the city, have done little to address. Indeed, all too much urbanism amounts to a sort of trickle down economics of the left, in which a “favored quarter” of artists, high end businesses, and the intelligentsia are plied with favors and subsidies while precious little ever makes it to those at the bottom rungs of society. A key lever to end this is to cut away at the massive regulatory burden that stifles small scale entrepreneurs, particularly minorities and immigrants. Regulatory relief is right up the Republicans’ alley.

Republicans also need to take on cities, especially the biggest ones, in order to get more of a voice in the cultural debates. Culture and media emanate from big cities, particularly New York, Los Angeles, and Washington, DC. Major academic centers also are idea generation factories.

Republicans became all but excluded from the cultural/media industry as the 60s generation took over. The party's response has been to create a parallel infrastructure of think tanks, talk radio shows, web sites, and even its own TV network, Fox News. This worked well in the era immediately following the end of the Fairness Doctrine, but as the so-called mainstream media reacted by shifting to the left, this has left the Republicans often talking mostly to themselves while the national culture gets shaped by Hollywood, etc. A good example is the web site Atlantic Cities, which fully embodies the values of the international urban elite left, with few identifiable conservative ideas.

The 2012 election shows the limits of this strategy. Just as evangelical Christians have decided that they must look to plant their flag in the inner cities – both to reach an increasingly secularized, ,upscale population, and to engage with culture where it is made – Republicans need to start showing up seriously in the cities again if they want to influence the culture. There are already some top-notch conservatives participating in and writing about serious culture (e.g., Terry Teachout). More ambitious, talented young conservatives should seek to enter culture and media industries apart from simply writing for conservative magazines. This battle won’t be easy by any means, but defeat is certain if you never fight.

One thing is for sure: if Republicans want to have any future in America, they can’t afford to cede any more constituencies as monolithic Democratic voting blocks. Urban America is one constituency the Republican Party can’t afford to ignore.

Aaron M. Renn is an independent writer on urban affairs and the founder of Telestrian, a data analysis and mapping tool. He writes at The Urbanophile.

Flickr photo by jvoves: Immigrants protest a Republican-sponsored proposal in Chicago.

State Components of Population Change: 2010-2012

$
0
0

What have the last two years of modest recovery meant to the growth and redistribution of population among the states? New data on the components of change for states are now available.  In March county level data will permit a more detailed portrait.

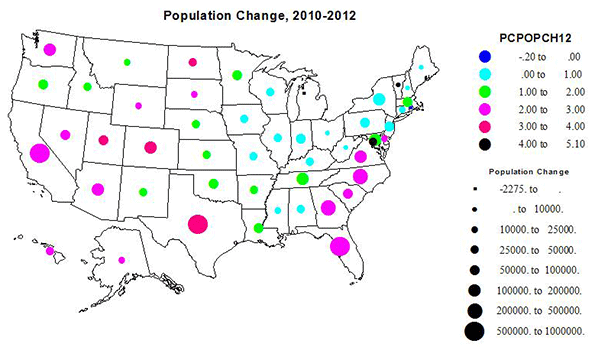
For states I present four maps, overall population change, change from natural increase, immigration (net international migration) and internal migration between states.

Population Change

Not surprisingly, most of the states with larger absolute and percent gains continue trends from the last decade: the South Atlantic states from Florida to Delaware, in the South dominantly Texas (both amount and rate), along with Colorado and Washington State as centers of substantial Western growth. But North Dakota, due to rapid energy development, is the prime addition to the “winning” state for growth, with South Dakota following. The District of Columbia had the highest rate of growth,a beneficiary of expanding government growth, and perhaps more importantly, power.

Conversely, low rates of growth, even a loss for Rhode Island and possibly Michigan, characterize the northeast and the south central states.

Natural Increase

For most states, natural increase (the difference between births and deaths) is the largest component of growth. The rates and amounts are significant to overall growth across the west, California still leads in absolute growth, entirely due to natural increase. In contrast Utah and Idaho also stand out for high rates, in part from their Mormon population.  Some slower growth northeastern states do have substantial natural increase, due to their size, including IL, MI, OH, and NY, while NC and SC and especially FL have lower rates of natural increase due to aging of their populations and migration of older people from the north.

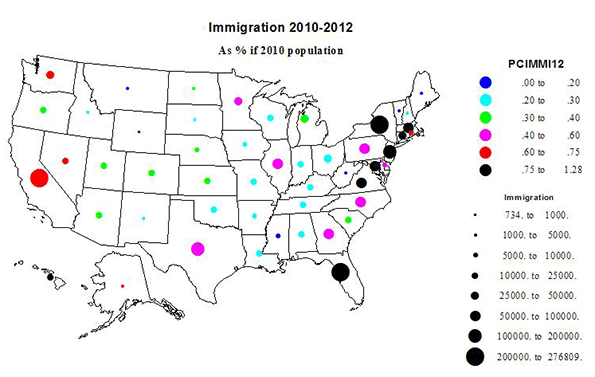
Immigration

Total US population growth from 2010-2012 was 5.17 million, of which 3.32 million was from natural increase (8.9 million births and 5.6 million deaths), leaving a substantial part of growth from international migration of 1.85 million. Despite the flak about immigration, the pace has not slowed.

While immigration in the West (CA, WA, HI) of 277,000 remains significant, the  dominant flow of immigrants went to the  Atlantic seaboard states – how old-fashioned! – such as greater New York,  Florida, and increasingly to GA and NC. New York gained 210,000 and Florida 212,000!   Immigration was fairly modest to the interior of the country. This reflects largely the decreasing immigration from Mexico. Illinois (with a gain of 61,000 from immigration) and Texas are both are experiencing slowdowns.  And note that AZ and NM immigration have become quite small.

The highest rate of immigration was to HI followed by NJ and FL.

Internal Migration

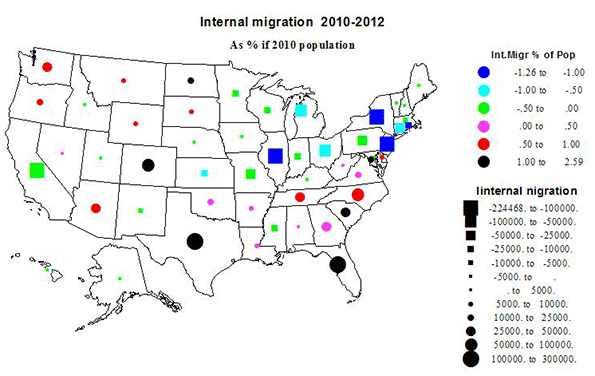
The volume of interstate migration was still lower than was typical in the 1960s through the 1990s, but still potent in explaining the growth differential among the states.

The pattern of absolute and relative gains and losses was essentially a continuation of trends over the last twenty years, with net in-migration to much, but not all of the South and to the West, except for California, which grows from natural increase and immigration but loses to the rest of the country. 

Texas, with a net gain of 291,000, easily grew the most, followed by Florida (219,000), then North Carolina (72,000) and Colorado (62000). The highest rate was North Dakota, with net in-migration at 2.6% of the base population, followed by the District of Columbia (2.35%) and Colorado (1.24%). The North Dakota phenomenon is the most remarkable, since it marks an abrupt reversal from decades of loss, and of unknown duration.  In the West, Colorado became the preferred destination, followed by Washington, with Arizona and Nevada less popular than a decade earlier. South Dakota also changed to a small gain due to its strong economy and low unemployment.

Out-migration characterized 28 states, encompassing the entire northeastern part of the country, from Minnesota to Maine, Kansas and Nebraska to Pennsylvania and New Jersey, and several states experienced high amounts and rates of loss, e.g. New York, -224,000; Illinois, -156,000; New Jersey, -103,000; and Michigan, -93,000; but the highest rates of loss were for Rhode Island, Illinois, New Jersey and New York. Outside the northeast, the biggest loss, as usual was for California: 104,000.

Differences in Components of Change From the 2000-2010 Decade
Population growth

Overall the rates of population growth, of natural increase, and of international immigration are remarkably unchanged. The perhaps surprising turnarounds towards much greater rates of growth occurred in DC, LA (recovery from Katrina), and  the Dakotas. States whose growth slowed markedly were AZ, ID, NV, NM, and UT in the West (partly due to much lower migration from Mexico), and Georgia. Only RI shifted from growth to a loss.

AK, HI, LA and ND enjoyed increased immigration, while it fell for AZ, CO, NM and TX.  Natural increase grew in ND and DC.  

Internal migration

DC, LA and ND changed the most, changing from losses to gains, and CO and SD had increased rates. Twelve states had lower rates of in-migration: AL, AZ, AR, DE, GA, KY, NV, NC, OK, OR, SC, and even VA – presumably a recession effect. But it was worse for seven states which shifted from gains to losses: ID, ME, MO, NH, NM, PA and VT, and for 3 states with bigger losses: CT, IN and NJ. But then seven states reduced rates of loss: CA, HI, IA, MD, MA, NE, and NY. Obvious explanations for some of these changes do not spring quickly to mind.

What all this shows is that it is hard to make long term projections on the basis of seemingly robust trends over even fairly long periods. Preferences change, economic sectors rise and fall.

Political Implications

Analysis of the 2012 elections have shown that the Obama victory is a consequence of demographic change as the country shifts from a domination of white males to a rainbow coalition of yes, white liberals, mostly urban, but propelled largely by a strongly supportive minority population moving toward a majority. At first glance the maps seem to tell us that growing areas in the South and mountain states favor the Republicans while the declining Northeast was the stronghold of Democrats. Yet it is more complex, since states like Virginia, Florida, Colorado and even North Carolina – all with large and growing minority as well as white urban populations – vote increasingly Democratic.

Richard Morrill is Professor Emeritus of Geography and Environmental Studies, University of Washington. His research interests include: political geography (voting behavior, redistricting, local governance), population/demography/settlement/migration, urban geography and planning, urban transportation (i.e., old fashioned generalist).

World's Most Affluent Metropolitan Areas: 2012

$
0
0

Late in 2012, the Brookings Institution published its annual Global Metro Monitor (by Emilia Istrate and Carey Anne Nadeau), which estimates economic data for the 300 world metropolitan areas with the largest gross domestic product (GDP). The Global Metro Monitor also provides estimates of the GDP per capita for each of the qualifying metropolitan areas. The surprising news: after at least five years of the most laggard economic performance in adult memory, the United States continues to dominate the highest GDP per capita data.

Summary by Geography

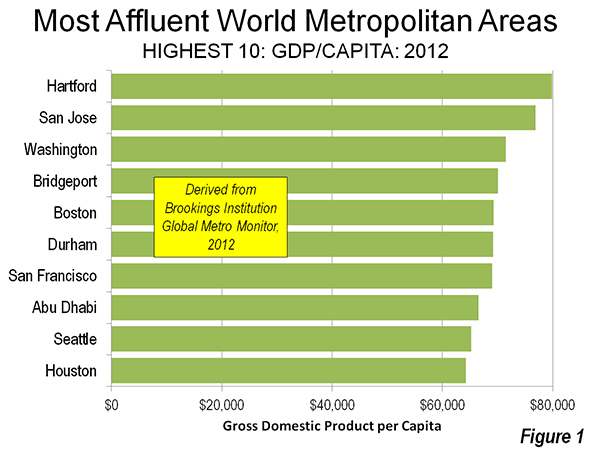
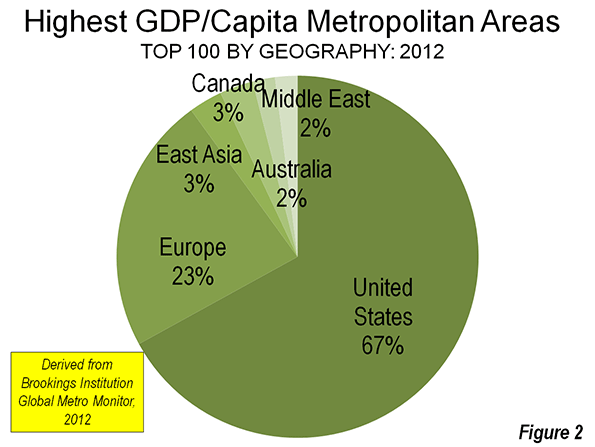
Among the 10 metropolitan areas with the highest GDP per capita, nine are in the United States (Figure 1). Hartford ($79,900 per capita), for the second year in a row, was ranked the most affluent metropolitan economy by Brookings. The US accounts for 36 of the top 50 metropolitan economies, and 67 of the top 100.

Europe is also strongly represented, with 23 of the most affluent 100 economies as rated by Brookings. Yet for the most part European metropolitan regions were concentrated between 50th and 100th. Only seven European metropolitan areas made the top 50. The highest ranking was Edinburgh, Scotland ($59,400), at 21st. Two former East Bloc European metropolitan economies also broke into the top 100, Prague at 70th and Moscow at 92nd.

East Asia placed 3 metropolitan areas in the top 100. Singapore ($62,500) did best at 14th.  Singapore's ranking behind so many US metropolitan areas may be surprising, since Singapore has a higher GDP per capita than the United States. However, the most affluent US metropolitan areas are more affluent than Singapore, which is both a city and a country. The highest ranking Chinese metropolitan area was Macau, the former Portuguese Special Administrative Region, which ranked 26th.

No mainland Chinese metropolitan area was in the top 100. However, should China's economic growth continue at its fast pace, it will not be long before the most affluent metropolitan areas break into the top 100. The strongest candidates could be Suzhou and Wuxi (between Shanghai and Nanjing) and Hong Kong neighbor Shenzhen (Note).

Two Middle Eastern metropolitan economies were represented in the top 100, both in the top 50. Oil-rich Abu Dhabi ($66,500) was the only metropolitan area outside the United States to place in the top 10, ranking 8th, while Kuwait City ($56,100) ranked 32nd.

Three of Canada's largest metropolitan areas made the list, led by Calgary ($61,600), which ranked 15th, while Edmonton ($52,000) rounded out the top 50. Two of Australia's largest metropolitan areas were represented. The most affluent was Perth ($63,400), which ranked 11th and was the second ranking metropolitan area outside the United States (Figure 2). Perth was also the only Australian metropolitan area to rank in the top 50.

None of the metropolitan areas of Latin America, South Asia (such as India or Indonesia) or Africa was ranked in the top 100.

Highlights: Metropolitan Area Highlights

Some of the metropolitan areas that might have been expected to be ranked the highest were instead well down on the list.

This is particularly evident with respect to the large financial centers. New York ranked 12th, behind Perth and immediately ahead of Des Moines, which experienced the greatest percentage growth in financial sector jobs in the United States over the last five years (See: The Dispersion of Financial Center Jobs). Other principal financial centers were ranked even lower, London was ranked 51st, behind its perennial competitor, Paris, which was 43rd.

Other money centers did even worse, with Frankfurt 53rd, Hong Kong 65th, and Tokyo 112th. Canada's principal financial center, Toronto, was ranked 96th, well behind Calgary and Edmonton (but ahead of Ottawa at 108th, Vancouver at 114th, and Montreal at 150th). Australia's leading financial center, Sydney, was ranked 88th, far behind Perth but ahead of Melbourne (113th).

Information technology centers were well represented in the top 10, including San Jose (2nd), Boston (5th), Durham, home to most of Research Triangle Park (6th), San Francisco (7th), and Seattle (9th).

The high rankings of Abu Dhabi, Perth, Calgary, as well as Houston (10th), Kuwait City (32nd), Oslo (34th) and Edmonton (50th) demonstrate the importance of natural resources to metropolitan economies.

GDP Per Capita and Urban Population Density

There has been considerable confusion about cities, productivity and population density. For example, the urban scaling research of the Santa Fe Institute has been misinterpreted to indicate that higher density cities are more productive. In fact, the research specifically denies any such relationship, finding that productivity generally rises simply as a function of higher metropolitan populations (see Density is not the Issue: The Urban Scaling Research). Further, it has often been suggested that as cities grow they become more dense. In contrast, the evidence is overwhelming that cities tend to become less dense as they grow (see The Evolving Urban Form).

Supplementing the Brookings Institution GDP per capita estimates with population density estimates (from Demographia World Urban Areas) provides further indication that greater affluence is not associated with higher population density.

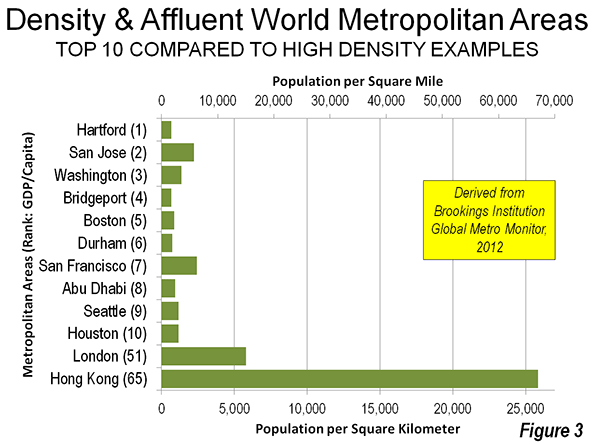
For example, Hartford, with the highest GDP per capita of all 300 metropolitan areas covered by Brookings has an urban area density (1,800 per square mile or 7000 per square kilometer) similar to that of Atlanta, the least dense urban area in the world with more than 2 million population. Bridgeport and Durham (North Carolina) have similarly low densities and are ranked in the top 10. San Jose (5,800 per square mile or 2,200 per square kilometer) and San Francisco (6,300 per square mile or 2,400 per square kilometer) have the highest density urban areas among the 10 most affluent metropolitan areas, though their densities are low to middling by European standards and well below East Asian densities (Figure 3).

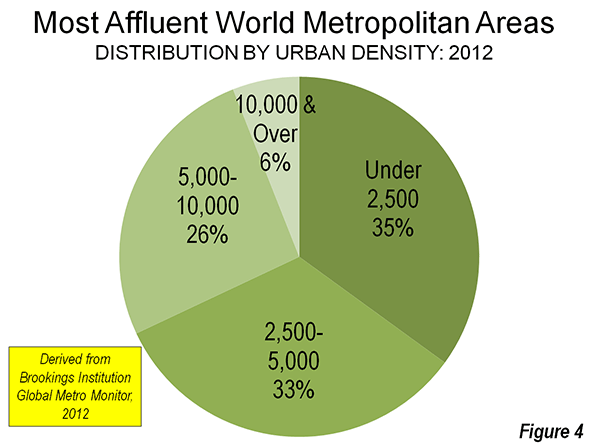
Out of the 100 most affluent metropolitan areas (Figure 4), 35 have population densities under 2,500 per square mile (1,000 per square kilometer). Many have very low densities, with 17 have density similar to or lower than Atlanta (such as Knoxville, TN, Little Rock, AR, Worcester, MA and Columbia, SC).

Another 33 metropolitan areas have urban densities between 2,500 and 5,000 per square mile (1,900 per square kilometer). This includes metropolitan areas such as Denver, Perth, Dallas-Fort Worth, Houston, Vancouver, Portland and Seattle. There are also 26 metropolitan areas with between 5000 and 10,000 per square mile (3,900 per square mile), such as Los Angeles, Paris, Stockholm, Toronto and Vienna. There were only six metropolitan areas with urban densities above 10,000 per square mile (3,900 per square kilometer), Macau, Hong Kong, Singapore, London, Kuwait City and Prague.

The Future?

The continued strong showing of the United States in the world affluent metropolitan area league tables cannot be taken for granted. While it seems likely that US metropolitan areas will not be displaced by their European counterparts, the strong growth in Canada and Australia could propel their metropolitan areas much higher. And then, there is always China and other increasingly affluent cities of east Asia.

Wendell Cox is a Visiting Professor, Conservatoire National des Arts et Metiers, Paris and the author of “War on the Dream: How Anti-Sprawl Policy Threatens the Quality of Life.”

-----

Note: The GDP per capita of metropolitan areas in China is adjusted, using the population figures from the 2010 census (which included the urban migrant population). The issue is described in Endnote 19 in the Brookings Global Metro Monitor.


Detroit Future City

$
0
0

Recently the Detroit Works Project released their long awaited strategic plan for the city. This is the one led by Toni Griffin that produced a lot of public controversy because of suggestions it would result in the planned shrinkage or decommissioning (or even forced residential relocations) in sparsely populated neighborhoods.

Called “Detroit Future City,” this plan doesn’t shy away from facing the tough realities that face Detroit, but its recommendations are somewhat muted with regards to shrinkage. Nevertheless, the message is clear: in a broke, declining city, neighborhood triage is a must.

The full document is 184 pages. I perused it, but wasn’t able to review at the level of detail I normally like to. Partially this is because it was published in a hyper-annoying “cinemascope” type format that makes it almost impossible to read on screen without magnification and lots of horizontal scrolling. This aspect of the plan’s publication was an immediate knock against it in my view. However, it will share a few observations I gleaned.

Neighborhood Development

The plan is notable for admitting that Detroit can never be repopulated. In fact, its only goal is to stabilize population loss 20 years from now, and settle in for a population of 600-800,000 people, or approximately the same as now.

The plan is frank about the scale of the challenges, including 150,000 vacant and abandoned parcels, empty land equal to the area of Manhattan, and vastly oversized infrastructure relative to the population and industrial base, along with poor service delivery in areas ranging from public safety (Detroit has the second highest violent crime rate in the country) to street lighting (about half of the street lights don’t work).

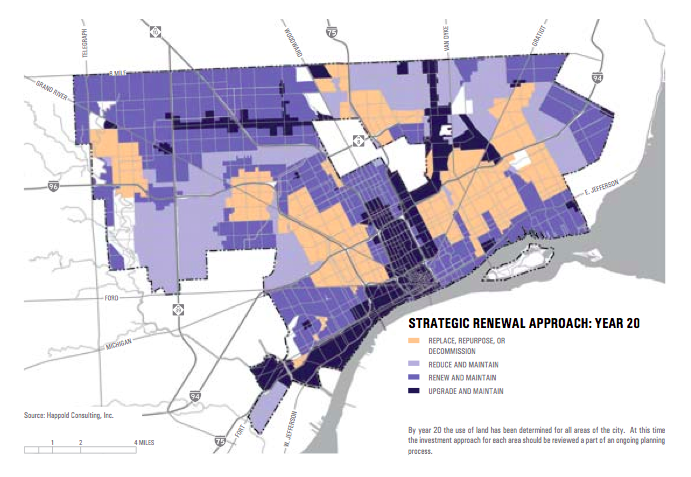
Part of that does involve identifying how to deploy infrastructure in neighborhoods. Here’s a graphic on that which will no doubt get some airplay:


Some areas are slated for upgrades, others reductions, and some perhaps “decommissioning.”

The strength of the plan, however, is in its approach to development in which the core concept is to develop a multi-nodal network of neighborhoods, and to have neighborhoods that are strategically differentiated from each others. This is very different from the core-centric or “hub and spoke” model that exists today, and is somewhat similar to my “100 Monument Cirles” concept for Indianapolis. Suffice it to say, I like it. What was missing from this was strengthening neighborhood identify, something Pete Saunders identified as a key weakness of the city.

A lot of the content behind this is disappointingly standard, however. The focus is green infrastructures, transit, mixed use neighborhoods, etc. This is basically planning conventional wisdom that would be at home in lots of different cities.

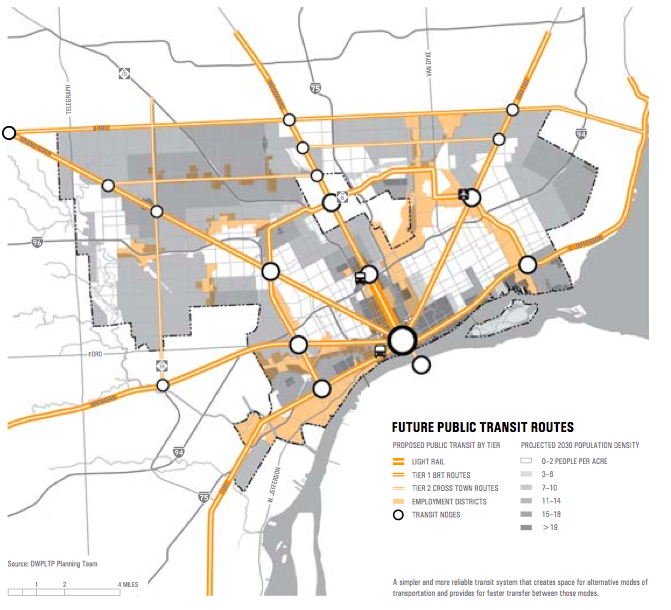
I was pleased to see that they de-emphasized rail transit. Only the M-1 light rail on Woodward remains. The rest of the core network would be BRT. I’d argue that reliable and higher frequency “plain old bus service” is the core need, however. There’s the proposed transit map:


Some may decry this, but in a city that’s over-infrastructured as it is, the last thing you need is more physical plant to maintain over time.

And perhaps the focus on green is to some extent understandable given the vast quantity of vacant land in Detroit. One of their intriguing concepts is “landscape as infrastructure”, though it didn’t fully connect with me. They did talk about ideas like medium intensity agriculture and new urban forest typologies. The Hanzt Farm example shows this already underway.

Lastly, the focus, and especially the near term recommendations around, regulatory restructuring is critical. Detroit benefits today from a sort of laissez-faire environment because government is so ineffective. If government effectiveness were restored, it could easily strangle the good things happening in Detroit, which are largely non-conforming. The answer is to get the regulatory system up to date with what we want to see. I would have preferred to see some types of harder targets around this, such as “85% of new development approved as of right.”

Economic Development

The plan considers boosting the number of jobs in Detroit as the most important mission. The city today has the 5th lowest number of jobs per resident of any of the top 100 cities in America, this despite large population losses. Jobs in the city are needed both for residents and rebuild the tax base.

The numbers on this seemed a bit squishy though. The report says that there is one job for ever four residents of Detroit. As there are about 700,000 residents, this would mean about 175,000 jobs. Yet they say there are 350,000 jobs. (If the resident figure included only working age adults, the projected number of current jobs would be even lower than my estimate).

The goal by 2030 is to increase this to between 2 and 3 jobs for every resident. This implies simply staggering job growth. Their mid-point population estimate for 2030 is still 700,000, so to go from 0.25/1 to 2/1 or 3/1 implies 700-1100% job growth. This is a CAGR of 11-13% – off the charts. To put it in perspective, metro Houston’s job growth CAGR from 2000 to 2011 was only 1.3%.

I may be totally off base on what they were getting at in these numbers, but having solid and realistic projections is critical, and, alas, all too rare. Unrealistic growth rate assumptions are common in civic plans, as I highlighted in the example of Cincinnati’s Agenda 360 plan.

[ Update: I was contacted by someone from the study's technical committee indicating that the 2 or 3 jobs per resident figure was an error in the PDF that was not present in the official version of the plan. There are apparently about 193,000 jobs in the city, with the plans actual goal a doubling of that over 30 years. Still ambitious, but not mathematically impossible. ]

The job growth is projected to come from four key target sectors: eds and meds, digital and creative, industrial, and local entrepreneurship. These sectors are reasonable as these things go given where Detroit is, but seem unlikely to drive the major growth they seek, excepting possibly entrepreneurship.

Neither Wayne State nor Detroit’s health care/life science infrastructure is nation leading. Every city and state in America is chasing eds and meds, and as I noted, the great growth curve in these industries may be over. Additionally, the trend nationally seems to be towards more decentralization of health care infrastructure in metro areas. While I’m sure there will be some growth here, I’m not optimistic about major expansion.

Similarly, digital and creative jobs are the fad du jour. I strongly doubt anyone will even consider there to be categories of jobs called “digital” or “creative” by 2030. These will be absorbed into industry generally. These are also the same types of sectors being pursued everywhere. Detroit certainly has a concentration of these because of its auto design cluster and just simply being a big city. But other than autos, does it really have a competitive advantage here? The big expansion opportunity would seem to be mostly suburban relocations of the type spearheaded by Dan Gilbert. I wonder how much gas is left in that tank, however.

The other two are more promising. Local entrepreneurship is a catch-all, but clearly indigenous startups are a great way to boost the economy. The report’s focus on equipping and facilitating minority entrepreneurship was especially relevant. Given the collapse of the city, Detroit’s residents have had to become innovative and self-sufficient of necessity. These skills from the school of hard knocks are in many ways worth much more than formal education when it comes to starting a business. If the city can figure out how to marry these “survival skills” of residents with a commercial orientation, it could be powerful. The same recipe of figuring how to do business in unstable and tough environments is common in the Middle East, where there’s a longstanding entrepreneurial and trading tradition. Unsurprisingly, Middle Easterners have been prominent among those who’ve thrived in Detroit. The challenge is how to activate the similar skills in other ethnicities for business purposes.

Industrial employment would also seem to be a possible area of growth, but not in the way envisioned in this plan. Industrial employment has been in decline, and new industrial facilities have tended to locate in outlying areas, not traditional urban manufacturing zones.

However, there are types of industrial businesses that can have a hard time finding a home. For places that are willing to welcome them, there could be opportunity. I noted this around the heavy industrial zone in Northwest Indiana.

This involves being willing to take on more brown than green industry, however. And it raises a whole host of issues around environmental justice, etc. However, Detroit, as this plan notes, is desperate for jobs. Trade-offs at least need to be considered. Rather than “focusing on the look and feel” of industrial areas, as the plan put it, why not roll out the red carpet for businesses like tanneries, scrap metal processing, etc. that are increasingly unwelcome in places like Chicago? Being friendly to to these types of businesses is probably the most likely road to success in industrial employment.

Conclusion

On first read, there’s some interesting stuff in here. They plan is less creative than I’d hoped overall, but probably takes the most aggressive line that was politically realistic. The real questions is, what happens next? Can any of this actually be actioned, or will fiscal and other problems effectively render it a dead letter? Only time will tell.

Aaron M. Renn is an independent writer on urban affairs and the founder of Telestrian, a data analysis and mapping tool. He writes at The Urbanophile, where this piece originally appeared.

Prescription for an Ailing California

$
0
0

Only a fool, or perhaps a politician or media pundit, would say California is not in trouble, despite some modest recent improvements in employment and a decline in migration out of the state. Yet the patient, if still very sick, is curable, if the right medicine is taken, followed by the proper change in lifestyle regimen.

The first thing necessary: Identify the root cause of California's maladies. The biggest challenge facing our state is not climate change, or immigration, corporate greed, globalization or even corruption. It's the demise of upward mobility for the vast majority of Californians, and the rise of an increasingly class-ridden, bifurcated society.

California's class problem spills into virtually every aspect of our malaise. It is reflected in both the nation's highest poverty rate, above 23 percent, and a leviathan welfare state; California, with roughly 12 percent of the population, now accounts for roughly one-third of the nation's welfare recipients. This burgeoning underclass exacerbates the demand for public services, deprives the state of potential taxpayers and puts enormous pressure on the private sector middle-class to come up with revenue.

The growing class chasm also distorts state priorities, creating an inordinate demand for public sector employment – and related jobs in health and education – while inculcating deep-seated resentment among private-sector entrepreneurs and professionals toward a state that asks much of them, but gives increasingly little.

Conservatives generally have recoiled from a class-based analysis, hoping to play on ethnic or cultural fears to advance their agenda of lower taxes and less regulation. Their incoherence and inability to adjust to changing demographics have left them increasingly irrelevant.

On the other hand, progressives feel comfortable with class as an issue, but see more regulation and ever higher taxes on the private sector as the solution. Yet the experience of the past decade has shown their folly, as California's middle class has continued to shrink, and poverty has worsened, particularly in the state's interior. The dangers of a large permanent underclass of unemployed and underemployed should be clear even to the most dreamy progressive.

Essentially, there is only one practical solution to this dilemma: a program that promotes economic growth. This strategy would transcend the recent reliance on asset-based bubbles that have boosted property markets and technology stocks. Another bubble, whether an investor-driven spike in property values in Newport Beach or a stock mania in Silicon Valley, may provide a temporary boost in revenue but will do very little to improve employment for the vast majority or to stabilize long-term finances.

The recent surge in tech employment in places like Silicon Valley is neither likely to persist or improve conditions for many Californians. The days of huge employment gains in Silicon Valley – where jobs more than tripled from 1970-2000 – are over. Even in the current boom, the Valley's employment remains down from a decade ago, and the rest of the state is doing decidedly worse. Social media simply will never be a major job producer or productivity enhancer; Facebook has 4,300 American employees, while old-line firms, like Intel, which have been shifting employment out of the state, have 10 times as many.

Other proposed bromides, like Gov. Jerry Brown's promised 500,000 "green jobs," need to be dismissed for what they are – stories we tell our children so they will fall asleep. High-speed rail, another modern-day Moonbeam program, is seen, even by many progressives, such as Mother Jones' Kevin Drum, as an "ever more ridiculous" boondoggle based on "jaw-droppingly shameless" assumptions.

Instead of delusion, California needs policies that can boost economic growth in precisely those areas – construction, agriculture, manufacturing and energy – with the best prospects for creating good, high-paying jobs for both blue- and white-collar Californians. Yet, right now the Legislature and, even more so, the empowered state apparat, seem determined to do everything they can to strangle an incipient recovery in these industries.

Sadly, much of this is done in the name of the environment, but often based on dubious assumptions. Laws that seek to reduce water allocations to the Central Valley are justified as protecting a bait fish, but create windswept new deserts, along with shocking poverty, in the state hinterland. It is no longer enough to protect the still-wild environment; mankind itself must be pushed away from areas that, in some cases, for generations, has provided food for the world, income for families and revenue to the state.

Concerns over climate change have justified much of the state's regulatory tsunami. Yet it is absurd to assert that California by itself can change global climate conditions in any meaningful way, given that the big increases of carbon emissions are all coming from the developing world; overall, America's emissions already are dropping far more quickly than in other high-income parts of the world, largely due to the natural gas boom.

Yet such mundanities matter little when our greatest policy goal seems to be to make the regulatory apparat, Hollywood and Silicon Valley moguls and their favored nonprofits feel better about themselves; if it provides job opportunity for zealots or the rent-seeking kind for favored venture capitalists and companies like Google, all the better.

Worse, the consequences of these policies, such as soaring energy prices, likely will not be felt in Portola Valley, Corona del Mar or Pacific Palisades, but, rather, in Santa Ana, Modesto and Oakland. Our regulatory regime already has cost California the opportunity to cash in on two significant booms – in manufacturing and in fossil fuel energy – that are creating middle-income job opportunities and upward mobility in other parts of the country.

On the environmental side, these policies could have an overall negative effect by driving both people and industries to areas that, because of climate and regulatory environment in their new homes, likely will expand their carbon footprint. Arguably the best thing California can do to reduce global carbon emissions would be to boost its industrial profile. The state also should be leading the shift to natural gas, which California, a potentially big player, so far largely has refused to join.

Another great opportunity lies in housing, a key source of both white- and blue-collar jobs. Population growth may have slowed, but the pent-up demand, largely from immigrants and millennials, for single-family homes, remains potentially strong. If the supply was increased, and prices moderated, homebuying would become more attractive for families with children. Emissions could be cut in more family-friendly ways, by encouraging more fuel-efficient cars, the dispersion of industry and, most particularly, telecommuting.

Sparking the revival of these basic industries and higher-wage employment would enhance California's budget situation over time far more than increasing taxes on the remaining residue of entrepreneurs and professionals. Energy work, in particular, pays high wages, often more than for many tech jobs, and both manufacturing and construction generally provide higher incomes than the low-wage service work that has become the only option for millions of Californians.

Getting kids from the Central Valley or East Los Angeles working on housing sites, factories and energy facilities is both the most humane, and practical, way to right our fiscal ship. Growth in these industries would also spur the knowledge sector of the economy; many of the strongest gains in STEM (science, technology, engineering and mathematics) jobs in recent years have occurred in manufacturing regions, such as Detroit, or in the energy belt, notably Houston. California's technical know-how should not be expended simply on developing computer games and social networks; resuscitating the tangible economy would also diversify employment opportunities for the highly skilled.

Government can play a critical, even determinative, role here. But it needs to shift priorities from redistribution and wealth suppression to providing the basic infrastructure essential for a growth economy. It means transforming our education system from a jobs and pension program for public sector workers and corporate rent-seekers to a focus on providing our economy with the skills – including those used in basic industries – needed for a revived California. It means spending money on the kind of infrastructure, such as gas pipelines, roads, urban bus lines, water and energy systems, that can spur growth instead of misallocations such as high-speed rail and subsidized green energy boondoggles.

This back-to-basics approach could restore California's aspirational promise, and not only for a favored few in a handful of favored places, but for the majority of our people, from the mountains to the sea.

Joel Kotkin is executive editor of NewGeography.com and a distinguished presidential fellow in urban futures at Chapman University, and a member of the editorial board of the Orange County Register. He is author of The City: A Global History and The Next Hundred Million: America in 2050. His most recent study, The Rise of Postfamilialism, has been widely discussed and distributed internationally. He lives in Los Angeles, CA.

This piece originally appeared in the Orange County Register.

Britain's Housing Crisis: The Places People Live

$
0
0

For twenty years British house building has fallen behind demand, forcing up prices and rents. Here's a series of photos showing some of the things people have had to do to live.

Victoria Campbell was living in a shed in her parents' garden in Havant, while she and her fiance saved up for a deposit, but the Council has told her that she has to move out.


This family in Plashet Park have been living in a shed for some time.


In East London, council officers are going checking out garden sheds to make sure that they are not being rented out, as they check too to see if houses are over-occupied.

In Caledonian Road, super-exploiting landlord Andrew Panayi converted unprofitable shops into money-making flats, and decided to convert their cellars into more flats.


This is the flats' skylight, outside.


This is the passage and stairway down to the flats.


This is the underground landing with the flats' front doors.


And this is the interior.

These garden sheds in Southall have been turned into homes, and ones like them are rented out to labourers.

Carl Bond and Stacey Drinkwater converted a double-decker bus for somewhere to live.

In Crystal Palace Laura Park lives in this converted public toilet.

Many people have tried to evade the planning laws that stop people from building, but disguising homes as sheds or barns.

Alan and Sarah Beesely built their home inside a barn, as you can see from the skylights. They were told by the council to knock it down.

Carl Jones built this garage, but building inspectors decided it was really a house, and told him to take it down.

So too this toolshed in a garden centre in Stroud was found to be a home, and ordered was ordered to come down.

In the Pembrokshire National Park Brithdir Moor, Janet and Tony Wrench built the Roundhouse, which was also ordered taken down.

For years now housebuilders in Britain have failed to build enough homes for people to live in.

We were told that more homes would encroach on the 'green belt' and the countryside. Foolish commentators like Simon Jenkins and Tristram Hunt warned - laughably - of a 'Tsunami of concrete' threatening the countryside. Powerful lobbies like the Campaign to Protect Rural England, the Urban Taskforce and the Green Party did all they could to stop new building. But it turns out that less than one tenth of Britain is developed.

Instead of developing the land we need government and municipal authorities said that they would 'build up, not out', and that they could get more people, into less space, by more compact, smart growth. At the time the development advocacy Audacity told them that this could only lead to overcrowding, and that their 'smart growth' would take us back to Victorian social problems.

Today, more people are willing to acknowledge that there is a problem with a shortage of affordable housing - but too few are willing to grasp the nettle and say we need to build many, many more houses to meet housing need.

Some commentators have made the point that there should be council housebuilding to meet the need. Others that the planning laws should be liberalised so that private developers can build. Both of those would be a good idea, but neither should be turned into a dogma that must be observed before new homes are built. The issue is that however it is done, Britain needs to build the houses that people need to live in.

James Heartfield's book Let's Build! Why We Need Five Million New Homes in the next 10 Years is available from Amazon.

The Evolving Urban Form: Rio de Janeiro

$
0
0

Rio de Janeiro was the capital of Brazil from before independence from Portugal was declared in 1822. That all changed in 1960, when the capital moved to the modern planned city of Brasilia, more than 500 miles (800 kilometers) inland. The move, however, did nothing to slow Rio de Janeiro's growth, as the metropolitan area (as designated by Brazil's census agency, the Instituto Brasileiro de Geografia e Estatística),  added 7 million people – a 150 percent increase in population – over the ensuing 60 years

The placement of the federal government in Brasilia has had positive economic impacts on the interior, but it did not make Rio de Janeiro less crowded (factor Indonesian officials should note as they consider moving the capital from Jakarta,).

The Urban Area

However, it is clear that Rio de Janeiro has fallen behind even faster growing Sao Paulo, which has become one of the world's 10 largest urban areas (with a population of approximately 20.5 million in 2013). Nonetheless, as an urban area with a 2013 population of 11.6 million (Figure 1) Rio de Janeiro still ranks among the world's megacities (urban areas over 10 million).

The urban area covers 720 square miles (1,870 square kilometers),   a population density of 16,100 per square mile (6,200 per square kilometer). This is similar to the density of Sao Paulo, 20 percent above that of Buenos Aires, but 35 percent less dense than the western hemisphere's most dense megacity, Mexico City. In contrast, Rio is more than twice as dense as the most dense Canadian and US urban areas, Toronto and Los Angeles, but less than 1/6th the density of Dhaka, the world's most dense megacity.

Metropolitan Dispersion

As this series on world urbanization has shown, cities tend to become less dense as they grow (at least until they reach predominantly automobile oriented densities). This can be seen in Rio de Janeiro as well. Since the 2000 census, virtually all of the population growth has been in less dense areas. The inner core (the districts or bairros of Zona Centro), for example, accounted for two percent of the urban area's growth over the past decade. The larger, inner core (around the urban core) accounted for three percent of the growth (principally the Zona Sul and some additional bairros adjacent to Zona Cento and Zona Sul).

A Suburbanized Core City: Like many core municipalities around the world, Rio de Janeiro contains large expanses of suburbanization (Photo: Rio's In-City Suburbs). The suburban portions of the municipality accounted for 43 percent of the growth, while the outside-the-municipality suburbs and exurbs (inside the metropolitan area, but outside the urban area) represented 53 percent of the growth (Figure 2). Most of the growth outside the municipality of Rio de Janeiro has been across Guanabara Bay, with the large suburbs of Niteroi and São Gonçalo, and to the north, where there are a number of large municipalities (such as Duque de Caxias and Nova Iguaçu).


Photo: Rio's In-City Suburbs

This preponderance of growth outside the dense core has been developing since 1950. The municipality of Rio de Janeiro has added 3.9 million residents since 1950, while the suburbs and exurbs have added 4.8 million. The municipality continues to have more than half of the population (53 percent), down from 76 percent in 1950 (Figure 3). However, the retention of this strong share of the population has been made possible only by the large amount of land available for suburban development within the municipality (this is similar to the experience of other suburbanized core cities, such as San Jose, Edmonton, Phoenix, Denver, and Kansas City).

The Physical Setting

Rio de Janeiro sits on the Atlantic Coast and is one of the world's leading tourist beach areas (Copacabana and Ipanema). The urban area straddles Guanabara Bay, with the municipality of Rio de Janeiro on the west side. A bridge leads to Niteroi, on the east side. The municipality of Rio de Janeiro covers virtually the same land area as the city of Los Angeles and like its American counterpart also includes mountainous areas. The mountains include Sugar Loaf and Corcovado, site of the world famous "Cristo Redentor" statue ("Christ the Redeemer") and others.  North and West of the mountains are the broad plains that contain most of the suburbanization (both within and outside the municipality).

Favelas

Favelas, also called shantytowns or informal housing proliferate throughout much of Latin America. It is estimated that 20 percent of new municipality's population lives in favelas. The largest of these is Rocinha, which accounted for a full one third of the inner and outer core growth over the last 10 years, despite having less than 5% of the population. Rocinha is located on a steep hill adjacent to affluent São Conrado, which provides employment for many residents. This is typical for shantytowns around the world, which are located near principally domestic labor opportunities, since residents generally have only limited mobility options to employment in the rest of the urban area. The favela to affluent neighborhood model represents an effective example of a "jobs – housing balance," though   rooted in poverty and gaping class distinctions. (Photo: Rocinha Favela & São Conrado, top).

Transport

Mass transit is very important in Rio de Janeiro. More than one half of all travel is on the Metro, commuter railways, buses and informal vans. In recent decades, the rail share of travel has been falling substantially, while the van share of travel has increased substantially. Vans have also made serious inroads into mass transit ridership in other urban areas of Brazil.

This dependence on transit does not mean that the roads are uncongested. For example, Avenida Brasil, the main arterial leading to Centro from the North carries more than 200,000 vehicles each day, a figure that exceeds that of many US urban freeways. A new peripheral freeway is under construction arcing around the urban area from west to east.

Gross Domestic Product

According to the Brookings Institution Global Metro Monitor, Rio de Janeiro had a gross domestic product per capita of approximately $16,300 in 2012. This would rank Rio de Janeiro 100th out of the 300 top metropolitan area economies in the world (Note 1). This is below Latin American leaders Buenos Aires ($26,100) and Sao Paulo ($23,700). It is also below the more affluent Chinese metropolitan areas, such as Shenzhen ($28,000) and Shanghai ($21,400). Rio, however, ranked above Cape Town ($15,700) and Cairo ($10,000).

Life After the Capital Leaves

The growth of Rio de Janeiro shows that there is, indeed, life after the national capital leaves. Rio has experienced strong economic growth in recent years and remains a dynamic urban region.

Wendell Cox is a Visiting Professor, Conservatoire National des Arts et Metiers, Paris and the author of “War on the Dream: How Anti-Sprawl Policy Threatens the Quality of Life.”

----

Note: These rankings are based on the 300 metropolitan areas with the largest total gross domestic product (not per capita gross domestic product). As a result, many metropolitan areas that are more affluent per capita are not included because their total gross domestic product is not rank in the top 300. This would include a large number of metropolitan areas in the United States, Europe Canada and elsewhere. The ranking of metropolitan areas in China is adjusted for the 2010 census, which includes migrant workers. Additional details are provided in Endnote 19 in the Brookings Global Metro Monitor.

Top Photo: Rocinha Favela & São Conrado (photos by author)

Gentrification as an End Game, and the Rise of “Sub-Urbanity”

$
0
0

“It took a bit of wind out of my sails, watching what happened in this neighborhood, watching how it happened…I don’t know how to beat this [gentrification]. I don’t know how anyone can beat this machine.”—From the articleThe Ins and Outs

The Generalization of Gentrification

The forces of gentrification are taking hold in America’s alpha cities. You can check the numbers or see the maps, but to get a good idea of its unprecedented rapidity, I’d suggest the blogVanishing New York. There, you will see nearly each day the announcement of yet another old-school establishment losing the rent battle: Lenox Lounge in Harlem, Suzies Chinese Restaurant on Bleeker St., the Central Iron and Metal scrap yard below the High Line. And with the small-business soul of the city goes the regulars that gave places like New York City its identity before its global city branding.

For instance, speaking about the closing of the Big Apple meat market in Hell’s Kitchen, writer Jeremiah Moss vents on the city’s whitewashing:

The [Big Apple] exterior is wonderfully dreary, covered in graffiti and pigeon shit. Standing here, you could dream yourself into a lost New York. But not for long. It’s all coming down for more glass, more chain stores.

A couple of years ago, the Times did a piece on Big Apple. The article includes a wonderful slideshow of photos, featuring the sort of person who shops at Big Apple, the sort of person that is also vanishing from New York, replaced by the svelte and distracted, the hollow men and women, tapping away at iPhones in sterilized Whole Foods aisles.


Courtesy of The New York Times

This is not a localized thing, as cities everywhere are grappling with the abruptness and consequences of such change. And while gentrification has been occurring here and there for decades, with community capital unwound on a street-by-street basis for higher returns and bigger tax receipts, the sheer push from above, like meat through a grinder, is now so systematic—and no longer personified by the Robert Moses’s of the world but by a kind of faceless force blowing a current of yield and tidiness in—that it has just become what is, with the late scholar Neil Smith referring to this latest iteration as the “generalization of gentrification”.

In his article“New Globalism, New Urbanism: Gentrification as Global Urban Strategy”, Smith examines how gentrification has morphed from an unfortunate effect to an outright aim. One explanation for this relates to the ever-morphing private-public partnership in cities in which elected officials have forgone governing for investing, with policy no longer aspiring to guide economic growth but rather being crafted to “fit in the grooves” of market forces, particularly in the realm of real estate.

Why real estate?

Part of the reason is that economic leaders now primarily see Americans as consumers as opposed to producers, and so cities—particularly alpha dog global cities—have shifted their focus from payrolls to price per square feet, making real estate an increasingly important productive engine of cities as opposed to the productive capacity of the citizen. Enter, then, the volitional push of attracting as many creative class gentry as possible into the confines of a place, with real estate gimmicks—such as Mayor Bloomberg’s recent microapartment push—aimed at further squeezing blood from areas with far more density than available space.

Does such wealth-packing inject capital into a given space? Yes. Is it a viable economic growth model? Wrote Aaron Renn in a recent New Geography piece:

Indeed, all too much urbanism amounts to a sort of trickle down economics of the left, in which a “favored quarter” of artists, high end businesses, and the intelligentsia are plied with favors and subsidies while precious little ever makes it to those at the bottom rungs of society.

This is not to disown the fact that global cities are economic engines in their own right. They are. It is only to state that their long-term economic growth prospects are being sold down the river at an exorbitant price. After all, people develop, not places.

Gentrification of the Mind

Allocating supply is one thing, but stoking the psychogeography of the creative class to want and squeeze into high-priced real estate is another. Historically, the common desire to move to an alpha dog city is to be where the action is. Moreover, NYC, Chicago and the like can graduate you. They can defang your limits while toiling the mind to the experiencing of new people and ideas. Said John Lennon:

I regret profoundly that I was not an American and not born in Greenwich Village. It might be dying, and there might be a lot of dirt in the air you breathe, but this is where it’s happening.

Yet this “if you can make it here you can make it anywhere” pull is arguably not what’s driving the generalization of gentrification. Rather, it is the idea of big city suburbanization, or more exactly: the hybridization of city “vitality” with the comforts of suburbanization, creating for a kind of third place called “sub-urbanity”.

In many respects, this is not surprising, as the most recent “return-to-city” movement is largely fueled by younger suburbanites who are tired of missing out on big city action. Not the action per se of Charles Bukowski’s L.A. or Patti Smith’s New York, but the action of, well, Chandler, Kramer, and Carrie. Said Alan Ehrenhalt, author of The Great Inversion and the Future of American Cities:

This is the generation, don’t forget, that watched Seinfeld and Sex and the City and Friends – usually from sofas safe in the confines of the suburbs. I think they find suburban life less exciting than urban life. While they are in a single or childless situation, they’re particularly eager to try it.

And try it they should: varied experiences make varied lives make more richly contextualized societies. But the rub here is that the mentality sewn from “the confines of the suburbs” is not being sacrificed for the beautifully unnerving experience that is “the real” of city life, but rather that creative class enclaves are increasingly being appropriated into the domesticated lifestyle embodied by traditional suburbia.

Of course John Lennon’s Greenwich Village this is not. And this bodes ill for alpha dog cities in that vanilla-ing a people and a place is a death knell to collective urgency, if only because comfort puts to sleep the burn that has traditionally sparked the next generation of ideas. Writes Sarah Schulman, author of The Gentrification of the Mind: Witness to a Lost Imagination:

Gentrification is a replacement process. So it is where diversity is replaced by homogeneity, and this, I believe, undermines urbanity and changes the way we think because we have much less access to a wide variety of points of view. We are diminished by it. So literally, the range of our mind’s reach is much more limited because of gentrification.

But again: lest we think this is all a mistake, or simply the byproducts of shifting demographics or economic and cultural change. Rather, it is the point. It is today’s path toward urban renaissance. And it’s a path creating for a “sub-urbanity” that is emerging when the generalization of gentrification meets the gentrification of the mind.

So, what does this mean for the future of urban development? My guess is that there will be a growing unhappiness with sub-urbanity that’s going to create for a lot of people left wanting, be they young suburbanites longing for urban authenticity or indigenous urbanites who are tired of the schtick. As such, cities would do well to prepare for the “return-of-the-city movement”, which means prioritizing urban integrity and community capital against the temptations of the gentrifying machine.

Richey Piiparinen is a writer and policy researcher based in Cleveland. He is co-editor of Rust Belt Chic: The Cleveland Anthology. Read more from him at his blog and at Rust Belt Chic.
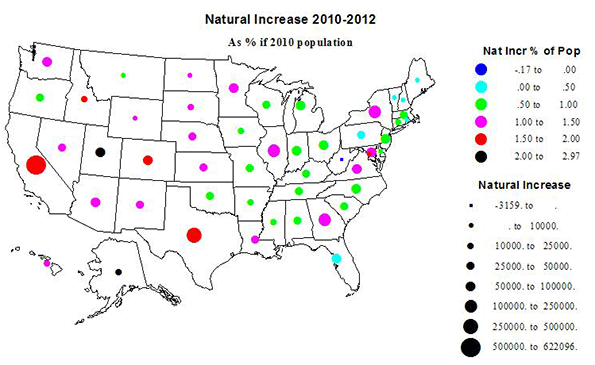
Lead photo by Liz Ferla, flickr user lism.

How The South Will Rise To Power Again

$
0
0

The common media view of the South is as a regressive region, full of overweight, prejudiced, exploited and undereducated numbskulls . This meme was perfectly captured in this Bill Maher-commissioned video from Alexandra Pelosi, the New York-based daughter of House Minority Leader Nancy Pelosi.

Given the level of imbecility, maybe we’d be better off if the former Confederate states exiled themselves into their own redneck empire. Travel writer Chuck Thompson recently suggested this approach in a new book. Right now, however, Northeners can content themselves with the largely total isolation of Southerners from the corridors of executive power.

Yet even as the old Confederacy’s political banner fades, its long-term economic prospects shine bright. This derives from factors largely outside the control of Washington: demographic trends, economic growth patterns, state business climates, flows of foreign investment and, finally and most surprisingly, a shift of educated workers and immigrants to an archipelago of fast-growing urban centers.

Perhaps the most persuasive evidence lies with  the strong and persistent inflow of Americans to the South. The South still attracts the most domestic migrants of any U.S. region. Last year, it boasted six of the top eight states in terms of net domestic migration — Texas, Florida, North Carolina, Tennessee, South Carolina and Georgia. Texas and Florida alone gained 250,000 net migrants. The top four losers were deep blue New York, Illinois, New Jersey and California.

These trends suggest that the South will expand its dominance as the nation’s most populous region. In the 1950s, the South, the Northeast and the Midwest each had about the same number of people. Today the region is almost as populous as the Northeast and the Midwest combined.

Perhaps more importantly, these states are nurturing families, in contrast to the Great Lakes states, the Northeast and California. Texas, for example, has increased its under 10 population by over 17% over the past decade; all the former confederate states, outside of Katrina-ravaged Mississippi and Louisiana, gained between 5% and 10%. On the flip side, under 10 populations declined in Illinois, Michigan, New York and California. Houston, Austin, Dallas, Charlotte, Atlanta and Raleigh also saw their child populations rise by at least twice the 10% rate of the rest country over the past decade while New York, Los Angeles, San Francisco, Boston and Chicago areas experienced declines.

Why are people moving to what the media tends to see as a backwater? In part, it’s because economic growth in the South has outpaced the rest of the country for a generation and the area now constitutes by far the largest economic region in the country. A recent analysis by Trulia projects the edge will widen in the rest of this decade, sparked by such factors as lower costs and warmer weather.

But some of this comes as a result of conscious policy. With their history of poverty and underdevelopment, Southern states are motivated to be business friendly. They generally have lower taxes, and less stringent regulations, than their primary competitors in the Northeast or on the West Coast. Indeed this year the four best states for business, according to CEO Magazine, were Texas, Florida, North Carolina and Tennessee. They are also much less unionized, an important factor for foreign and expanding domestic firms.

Despite a tough time in the Great Recession, overall unemployment in the region now is less than in either the West or the Northeast. As manufacturing has recovered, employment has rebounded quicker in the Southeast than in the rival Great Lakes region.

A portent of the future can be seen in new investment from U.S.-based and foreign companies. Last year Texas, Louisiana, Georgia and North Carolina were four of the six leading destinations for new corporate facilities.

Some of this growth is centered on the automobile industry, which is increasingly focused on the southern tier from South Carolina to Alabama. The other big industrial expansion revolves around the unconventional oil and gas boom. The region that spans the Gulf Coast from Corpus Christi to New Orleans includes the country’s largest concentration of oil refineries and petrochemical facilities. In 2011 the two largest capital investments in North America — both tied to natural gas production — were in Louisiana.

In the long run some critics suggest that the region’s historically lower education levels ensure that it will remain second-rate. Every state in the Southeast falls below the national average of the percentage of residents aged 25 and older with a bachelor’s degree.

Yet the education gap is shrinking, particularly in the South’s growing metropolitan areas. Over the past decade, the number of college graduates in Austin and Charlotte grew by a remarkable 50%; Baton Rouge, Nashville, Houston, Tampa, Dallas and Atlanta all expanded their educated populations by 35% or more. (See “The U.S. Cities Getting Smarter The Fastest“) This easily eclipsed the performance of such “brain center” metropolitan areas as Los Angeles, New York, San Francisco or Chicago. Then there’s the question of critical mass; Atlanta alone added more than 300,000 residents with bachelor’s degrees over the past decade, more than Philadelphia and Miami and almost 70,000 more than Boston.

Perhaps more revealing, an analysis by Praxis Strategy Group suggest a good portion of these new educated residents are coming from places such as greater New York, Boston, Chicago and Los Angeles. The South’s new breed of carpetbaggers increasingly bring  diplomas, skills and high wage jobs with them. The main attraction: not only jobs, but lower housing prices, lower taxes and, overall, a more affordable quality of life.

Rather than some comic-book version of a sleepy old south, the South’s dynamic metropolitan regions — not surprisingly, among the nation’s fastest growing — represent the real future of the region. They are becoming more diverse in every way. Houston and Dallas are already immigrant hotbeds; Nashville. Charlotte, Atlanta, Raleigh and Orlando all have among the nation’s fastest-growing foreign populations.

Growth in the South, as elsewhere, is concentrated in their suburban rings but there’s also been something of central city revivals in Houston, Raleigh, Atlanta and Charlotte. Increasingly these places boast the amenities to compete with the bastions of hipness in everything from medicine and banking to technology and movies. The new owners of the New York Stock Exchange are based in Atlanta and some financial professionals are moving to low-tax states such as Florida.

For its part New Orleans, where I am working as a consultant , is challenging New York and Los Angeles in the film and video effects industry. Houston boasts the country’s largest medical center. Raleigh, Austin, Houston and San Antonio rank as the largest gainers of STEM jobs over the past decade.

Over tine, numbers like these will have consequences politically, as well as culturally and economically. In the next half century, more Americans will be brought up Southern; the drawls may be softer, and social values hopefully less constricted, but the cultural imprint and regional loyalties are likely to persist. Rather than fade way, expect Southern influence instead to grow over time. It is more likely that the culture of the increasingly child-free northern tier and the slow-growth coasts will, to evoke the past, be the ones gone with the wind.

Joel Kotkin is executive editor of NewGeography.com and a distinguished presidential fellow in urban futures at Chapman University, and a member of the editorial board of the Orange County Register . He is author of The City: A Global History and The Next Hundred Million: America in 2050. His most recent study, The Rise of Postfamilialism, has been widely discussed and distributed internationally. He lives in Los Angeles, CA.

This piece originally appeared at Forbes.com.

Photo by Belle of Louisville.

Why Are There So Many Murders in Chicago?

$
0
0

After over 500 murders in Chicago in 2012, the Windy City’s violence epidemic continues – 2013 saw the deadliest January in over a decade– and continues to make national news.  The New York Times, for example, ran a recent piece noting how Chicago’s strict gun laws can’t stem the tide of violence.

The NYT piece predictably spurred much debate over gun policy, but that distracts from the real question: why exactly does Chicago have so many murders?  Chicago had 512 murders in 2012. New York City – with three times Chicago’s population – had only 418 murders, the lowest since record keeping began in the 1960s.  Los Angeles, with over a million more people than Chicago, had only 298 murders.  These other cities can’t be accused of lax gun laws or somehow being immune to guns being brought in illegally from more lenient jurisdictions. So what’s different about Chicago?

It’s impossible to say for certain what is causing Chicago’s unique murder problem, but a few possibilities suggest themselves.

  1. The number of police officers.  Depending on the report, Chicago’s police department is about 1,000 officers short of authorized strength and is facing a large number of looming retirements while few new recruits are brought in due to budget constraints. This clearly has had an impact. However, NYPD has also seen a decline in the number of officers without this effect.
  1. Police tactics. New York has made headlines with controversial, but apparently effective, tactics like the so-called “stop and frisk” policy.  The city hasn’t hesitated to defend these, even in the face of enormous negative press and lawsuits. Los Angeles has made huge strides in moving past its Detective Mark Furhman era reputation to build bridges to minority communities while Chicago has spent years and millions of dollars ignoring and defending officers who used torture to extract confessions. New York and Los Angeles also have more experience with statistically driven policing than Chicago.
  1. Politically controlled policing.  Mayor Daley hired Jody Weis from the FBI as police superintendent, but neutered his ability to run the department by assigning a political operative as Weis’ chief of staff.  Similarly, Rahm Emanuel, a fan of centralized control, has been heavily involved in driving major decisions like disbanding the anti-gang strike forces. It’s not clear whether police decisions have been driven by purely professional crime fighting concerns or, as in likely given the city’s culture, political considerations.
  1. William Bratton. Both New York and Los Angeles saw the start of their major successes against crime under the leadership of William Bratton. Los Angeles in particular was extremely smart to go hire him after his success in New York. While other cities have experienced murder declines, often with similar strategies, they are not places of the same scale, demographic diversity and political complexity of New York and LA. Perhaps Chicago should have spent whatever it took to get Bratton as police superintendent, though whether Bratton would have been willing to come into a place with such a history of political meddling with the police is uncertain.
  1. Gang fragmentation. Local and federal officials had great success taking out the leadership of many of the city’s gangs. The result has been significant gang fragmentation and a lack of hierarchical control over the rank and file that some have blamed for contributing to the violence epidemic.
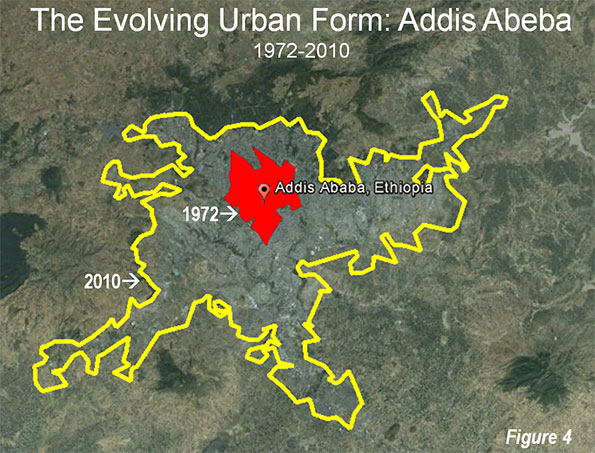
  1. Depopulation. Few analyses of Chicago’s murder problem focus on the city’s very poor demographic performance.  New York City and Los Angeles are at all time population highs. Other urban areas like Boston and Washington, DC have started rebounding from population losses. However, Chicago lost a stunning 200,000 people in the 2000s and now has a population rolled back to levels not seen since 1910.  Loss of population in many neighborhoods has had many pernicious effects, including a loss of social capital (notably middle class families), loss of businesses due to loss of customers, and a diminished tax base.  It’s hard to maintain social cohesion in the face of both extreme poverty and population decline.  Similarly, the Chicago region had the worst jobs performance of any large metro in the US during the 2000s, which couldn’t have helped.
  1. Public housing demolitions. Chicago’s high rise projects like Cabrini-Green and the Robert Taylor Homes were yesterday’s national shame as hotbeds of crime and the killing of youths. Chicago was one of the most aggressive demolishers of these, with all of the high rises effectively destroyed. While this perhaps reduced localized crime, it destroyed the only homes many people had ever known, and, like depopulation, destroyed significant social capital and possibly simply redistributed and dispersed crime, as some research in other cities has suggested.  New York’s public housing is hardly problem free, but NYC  took a very different approach, investing in the high-rises rather than destroying them.  It’s hard not to speculate on what this has meant to the trajectory of crime in those two cities.

Whatever the actual answer may be, Chicago’s murder epidemic continues to ravage families and neighborhoods. Given the results in January, it would appear the city is no nearer to getting a handle on it than it was a year ago. A reconsideration of the differences between Chicago and other large cities, and a resulting adjustment in strategy, would seem to be long overdue.

Aaron M. Renn is an independent writer on urban affairs and the founder of Telestrian, a data analysis and mapping tool. He writes at The Urbanophile.

Chicago photo by Bigstock.


More Bubble Trouble in California?

$
0
0

Just six years since the last housing bubble, California is blowing up another. This may seem like good news to homeowners and speculators alike but it could further accelerate the demise of the state's middle class and push more businesses out of the state.

On its face, a real estate turnaround should be a strong sign of an economic recovery. In Southern California, home sales have jumped 14 percent over last year and the median price is up 16 percent, some 25 percent in Orange County. We may not quite be at 2007 super-bubble levels but we're getting there, particularly in the more desirable areas.

Yet, before opening the champagne, we need to look at some of the downsides of this asset recovery. We are not seeing much new construction, particularly of single-family homes, so the supply is not being replenished as inventory sinks. Meanwhile, many of the homebuyers are not families seeking residences, but flippers, Wall Street types and foreign investors. A remarkable one-in-three Southern California home purchasers paid with cash, up from 27 percent from last year.

It's clear that this increase is not being fueled primarily by income growth among middle-class Californians; these "prices are rising disconnected from household incomes," notes one analyst. Indeed, California incomes have been dropping somewhat more rapidly, down $2,600 per household from 2007-11, according to the American Community Survey, compared with a $200 drop nationwide. California incomes are still 13 percent higher than the national average, but a lot less so than in the past, particularly given the much higher costs and taxation.

This leads to what is becoming the biggest problem facing the state – a decline in the rates of affordability. The previous bubble left us a legacy of more-affordable housing, an advantage we may now be losing. Historically, and in much of the country, the median multiple, which compares the median-price home to median household income, was in the three range. At the height of the previous bubble, the median multiple for the Los Angeles-Orange County metropolitan area, reached 11.5 in 2007, then fell to a still-elevated 5.7 in 2009, notes demographer Wendell Cox. It remained steady in 2011, but in just the past year the measurement has shot up to 6.2. A few more years at this rate, and housing affordability could worsen materially.

The new bubble can be seen elsewhere in the state. The most prominent inflation in housing values can be seen in the San Francisco Bay Area, which has enjoyed the most buoyant recovery from the recession. Never a cheap area, in 2006, San Francisco reached a median multiple of10.8 and Silicon Valley (San Jose) rose to 9.3. When the bubble imploded, the median multiple fell to 6.7 in both metropolitan areas, still well above any level recorded before the housing bubble. But now, amidst a concentrated boom in the western side of the Bay, the median multiple rose the equivalent of 1.1 years of income in San Francisco (to 7.8) and 1.0 years of income in San Jose (7.9) in a single year.

Of course, you can argue that the higher prices in the Bay Area are explainable at least in part by a growth in employment and wealth generated by tech start-ups. But what about soaring prices in places like the Inland Empire (Riverside-San Bernardino), Sacramento or Fresno, where economic growth has been torpid, and unemployment remains well north of 10 percent? Over the past year, Sacramento's median multiple has risen from an affordable 2.9 to 3.2, the Inland Empire from 3.2 to 3.7 while Fresno's has gone from 3.1 to 3.5.

As these prices rises, the California dream, already increasingly off-limits in the coastal areas, begins to become less achievable even in the inland areas. Already, barely 55 percent of Californians own their own home, down from the bubble-period high of 60 percent in 2005 and compared with upward of 65 percent nationally.

Traditionally, the pent-up demand for houses would be met in the marketplace, but California's Draconian planning laws make this very difficult. In the first 11 months of 2012, the Census Bureau reports that the Los Angeles-Orange County metropolitan area had half as many construction permits than much smaller Dallas-Fort Worth, 60 percent of Houston's permits and fewer even than the relatively tiny Austin, Texas, metropolitan area. More to the point, more than 70 percent of L.A.'s construction was in multifamily units while the majority in most areas, (except for such areas as New York, San Francisco, San Jose and San Diego) was in single-family homes.

Given the state's planning preference for high-density housing, even in suburban and exurban areas, there's little hope that California single-family home buyers can expect much relief. As millennials age, and seek out this form of housing as they start families, they will likely look increasingly elsewhere, for example, in Dallas-Fort Worth, Houston, Phoenix or Atlanta. The great California exodus, which slowed during the housing bust, will likely pick up, joining up with the continued movement of employers to more business-friendly states.

In the short run, of course, not everyone loses from a new bubble. Owners of homes, particularly along the coast, will see a big increase in their net worth. There could be good times ahead again for what author Bob Bruegmann calls "the incumbent's club." With projected new units running at one-half their 2007 level until 2015, scarcity will help the state's graying gentry. These same citizens also enjoy a double bonus, since most are protected by Proposition 13 from paying higher property taxes on their rising property values.

The bubble may also have short-term positive impact on local governments, which may benefit from high property taxes if more homes change hands at higher prices. The "wealth effect" could also bring new capital-gains income to a state government whose revenue stream increasingly depends on the upper-class taxpayer, particularly after the passage of Proposition 30, which increased the state's reliance on high-income earners. In this sense, the asset inflation could help Gov. Jerry Brown enjoy his much-trumpeted surplus, and he may even avoid the deficit projected next year by the Legislative Analyst.

These positive effects may be outweighed by bigger concerns. The pushback against single-family homes will restrain the growth of the construction industry, still down 400,000 jobs from its 2006 peak. This is particularly critical for working-class Californians, many of whom previous made decent livings in this industry.

But workers and homebuilders won't be the only ones affected; so, too, will consumers. Without a loosening of regulatory constraints, pent-up demand for housing, particularly the single-family variety, will remain largely unaddressed. This will further inflate the bubble even in unfashionable areas. We may soon see a surplus of rental apartments, but not enough single-family homes; the ownership market, as evidenced by the rising median multiples, will continue to tighten, and prices could rise even more, even in a mediocre economy.

The groups hit hardest by this scenario will be middle- and working-class Californians, particularly above the age of 30-35, most of whom desire to own their own home. Unable to qualify, or unwilling to overleverage, many will be forced either to give up their dreams or look elsewhere, taking their talents and, eventually, their offspring, with them.

Joel Kotkin is executive editor of NewGeography.com and a distinguished presidential fellow in urban futures at Chapman University, and a member of the editorial board of the Orange County Register. He is author of The City: A Global History and The Next Hundred Million: America in 2050. His most recent study, The Rise of Postfamilialism, has been widely discussed and distributed internationally. He lives in Los Angeles, CA.

This piece originally appeared in the Orange County Register.

Photo by Sean Dreilinger: One of two adjacent bank owned homes.

How Green Are Millennials?

$
0
0

Besides his history-making embrace of full equality for gays and lesbians, the most surprising part of President Barack Obama’s Second Inaugural Address may have been the emphasis placed on dealing with the challenge of climate change. The president devoted almost three whole paragraphs, more than for any other single issue, to the topic. His remarks suggested that America’s economic future depended on the country leading the transition to sustainable energy sources and that “the failure to do so would betray our children and future generations.”

Different generations reacted differently to the speech. The President’s rhetoric seemed like standard liberal fare to many Baby Boomers (born 1945-1965), who either vehemently agreed or disagreed with what Obama had to say depending on their political ideology. But members of the Millennial Generation (born 1982-2003) were in almost unanimous agreement with the way the President defined the context of this challenge. It was as if he was channeling the thinking of Millennials such as David Weinberger at the Roosevelt Institute’s Campus Network (RICN) who wrote, almost a year ago, “Millennials view environmental protection more as a value to be incorporated into all policymaking than as its own, isolated discipline. We are concerned with economic growth, job creation, enhancing public health, bolstering educational achievement, and national security and diplomacy. Young people recognize that each of these concerns is inextricably tied to the environment.”

President Obama was also right, from a Millennials’ perspective, to emphasize the need for America to become a leader in sustainable energy technologies. Seventy-one percent of Millennials believe America’s energy policy should focus on developing “alternative sources of energy such as wind, solar and hydrogen technology; only a quarter believes that it should focus on “expanding exploration and production of oil, coal and natural gas.” Similarly, the RICN’s “Blueprint for a Millennial America,” a report prepared by thousands of Millennials who participated in their “Think 2040” project, placed the development and usage of renewable sources of energy at the top of all other environmental initiatives.

The participants’ proposed solutions to the challenge, however, were not focused on the kind of top-down change so common to Boomers. .Instead the proposals  emphasized taking action at the community level. No one, the RICN blueprint said , should be asked to “make sacrifices without fully considering the cost to communities” whose “texture” is most likely to be impacted dealing with the challenge.

Many politicians fail to notice this unique Millennial perspective. Members of the generation disagree sharply with their elders on the best way to address environmental challenges, preferring to tackle them through individual initiative and grassroots action rather than a heavy-handed top down bureaucratic approach.

Of course,  Millennials are the most environmentally conscious generation in the nation’s history. Almost two-thirds of Millennials believe global warming is real and 43% of them think that it is caused by human activity, levels much higher than among all other generations. But, as Weinberger also wrote, “While environmentalists of years past were primarily aiming to bring clean air and clean water concerns into the national policymaking calculus, environmentalists today are far more worried about solving global problems like climate change by using local environmental solutions.”

Adapting a Millennial approach to dealing with global warming would mark a major change for the Administration. All four of Obama’s first term environmental policy heavyweights were Boomers, whose preference for top down dictates was evident in almost every decision they made. Secretary of the Interior Ken Salazar established new controls on off shore oil drilling that satisfied neither side. Secretary of Energy Stephen Chu tried to jump start the development of renewable energy technologies in the United States by funding startups with dubious chances of marketplace success. And most conspicuously   EPA Administrator Lisa Jackson’s plans for regulating smog were rejected by the President. Fortunately ,  all of them have  announced plans to leave their posts. They will follow in the footsteps of environmental czar, Carol Browner, who left two years ago after a less than stellar performance during the Horizon Deepwater drilling disaster.

There is talk within the administration of subtle changes in policy.   The departure of this quartet of ideologically-driven Boomers gives the President an excellent opportunity to appoint a new team to execute his vision for meeting the environmental challenges of our time.

President Obama’s  new team will have to continue to link the need to develop U.S. energy production to both environmental concerns and economic development. It will need to couch the call for progress on reducing carbon dioxide emissions in the context of strengthening, not weakening, local communities and preserving the nation’s natural resources. Just who the president  finds to take on this politically nuanced task will say a great deal about his sensitivity to his Millennial Generation supporters’ attitudes and beliefs. It will also foretell a great deal about how successful he will be in matching the lofty rhetoric of his Second Inaugural Address with today’s political realities during his final term in office.

Morley Winograd and Michael D. Hais areco-authors of the newly published Millennial Momentum: How a New Generation is Remaking America and Millennial Makeover: MySpace, YouTube, and the Future of American Politics and fellows of NDN and the New Policy Institute.

Photo by gfpeck

Dispersion in the World's Largest Urban Areas

$
0
0

No decade in history has experienced such an increase in urban population as the last. From Tokyo-Yokohama, the world's largest urban area (population: 37 million) to Godegård, Sweden, which may be the smallest (population: 200), urban areas added 700 million people between 2000 and 2010.

Nearly one in 10 of the world's new urban residents were in the fastest growing metropolitan regions (see: Definition of Terms used in "The Evolving Urban Form" Series), which added nearly 60 million residents. They ranged from a an estimated increase of more than 8.5 people in Karachi (Note 1) to 4.4 million people in Bangkok and Guangzhou-Foshan (Figure 1). The average population growth in these 10 metropolitan regions was 6 million, approximately the population of Dallas-Fort Worth or Toronto, which were fast-growers on their own in comparison to other high income world cities.

By comparison, the largest growth over any single decade over the past half century in US metropolitan areas has been less than one half of the 6 million average: 2.43 million in New York (1920s) and 2.37 million in Los Angeles (1950s). Only Tokyo-Yokohama (1960s) and Shenzhen (1990s) have added more than 5 million people in a single decade before the last decade.

Growth has been overwhelmingly concentrated outside the urban cores (Note 2) in these 10 fastest growing metropolitan region. Excluding Karachi (for which sufficient data is unavailable), approximately 85 percent of the growth was outside the urban cores (A 43 million increase in the suburbs and 8 million in the urban cores).

Dispersion in World Megacities

This is consistent with the findings of The Evolving Urban Form series, which is now two years old. These analyses have generally demonstrated that urban spatial expansion (pejoratively called "sprawl") is world-wide and contrary to some perceptions, not limited to the United States. Cities expand geographically as they add population, though this organic tendency is sometimes contained by urban planning. Peripheral growth is virtually always at lower densities than in urban cores, which means that as cities grow they tend to become less dense (Note 3).

This process ironically is sometimes accelerated by planning decision-making. London's greenbelt ---which banned the extension of housing into the near periphery of the city --- has result in even greater sprawl to far outside the principal urban area. This trend since World War II, has forced commuters to travel longer times and distances to the urban core (All of metropolitan London's growth has been suburban for 100 years, with a loss of 1.8 million in inner London, while the suburbs and exurbs grew by 10.5 million).

The Evolving Urban Form has now covered 23 of the world's 28 megacities (Note 4). As the Table indicates, population growth has been strongly oriented away from the urban cores and toward more suburban areas


Table
Summary of Megacity Population Trends
URBAN AREACORRESPONDING METROPOLITAN REGION
Bangkok10 Years: 55% of growth outside core municipality
Beijing10 Years: 99% of growth outside core districts
Buenos Aires60 Years: 100%+ of growth outside core municipality
Cairo16 Years: 2/3 of growth outside core governate
Delhi10 Years: 90% of growth outside core districts
Dhaka10 Years: 50% of growth outside core municipalities
Guangzhou-Foshan10 Years: 75%+ of growth outside core districts
Istanbul25 Years: 100%+ growth outside core districts
Jakarta20 Years: 85% of growth outside core jurisdiction
Kolkata20 Years: 95% of growth outside core municipality
Los Angeles60 Years: 85% growth outside core municipality
Manila60 Years: 95% growth outside core municipality
Mexico City60 Years: 100%+ of growth outside core districts
Moscow8 Years: 95% of growth outside core districts
Mumbai50 Years: 98% of growth outside core districts
New York60 Years: 95% growth outside core municipality
Osaka-Kobe-Kyoto50 Years: 95% of growth outside core municipalities
Rio de Janeiro10 Years: 95% of growth outside core districts
Sao Paulo20 Years: 2/3 of growth outside core municipality
Seoul20 Years: 115%+ of growth outside core municipality
Shanghai10 Years: 99% of growth outside core districts
Shenzhen10 Years: 70%+ of growth outside core districts
Tokyo50 Years: 95% of growth outside core municipalities


In US examples, New York and Los Angeles, 95 percent and 85 percent of growth respectively of their corresponding metropolitan region growth has occurred outside the core municipalities since 1950. But these US regions are joined by middle income Buenos Aires and Mexico City where all growth has been outside urban core since 1950. In lower income Manila, 95 percent of the growth has been outside the urban core since 1950.

The world's largest metropolitan region, Tokyo-Yokohama, has experienced a virtual monopoly of suburban growth over the past 50 years, as has Japan's second largest metropolitan region, Osaka-Kobe-Kyoto.

Over the past quarter century, all of Istanbul's growth has been outside the urban core. The urban expansion has been going on for much longer, as is illustrated over the past 60 years (Figure 2). Cairo's urban expansion is similarly substantial (Figure 3). In one of the developing world's poorer megacities, nearly all population growth in the Mumbai region has been outside the urban core for 50 years

For the last 20 years, more than 115 percent of the growth in the Seoul-Incheon metropolitan region has been outside the core city. In the world's second largest urban area, Jakarta (Jabotabek), growth is also strongly suburban, accounting for 85 percent of growth over the past two decades. In Kolkata suburban growth has been 95 percent over the same two decades.

The same tendency is evident in the other megacities. Over the past decade or two, nearly all population growth in China's four megacities (Shanghai, Beijing, Guangzhou-Foshan and Shenzhen), Delhi and Rio de Janeiro has been outside the urban cores.

Dispersion in Other Large Urban Areas

The Evolving Urban Form has also examined smaller urban areas. The same pattern of dispersal is evident there as well even in traditionally compact cities. Zürich, for example has had all of its growth outside the core city since 1950. All of the growth in Barcelona and Milan has been outside the core cities for 40 years. Even high density Hong Kong has experienced all of its growth outside the urban core for the third years. Low income Addis Abeba indicates a pattern of urban expansion is not unlike that of Istanbul or Cairo (Figure 4). In megacity wannabe Chicago (1.4 million short), 125 percent of growth since 1950 has been outside the core; this number reflects that the central city has been shrinking even as the periphery expands. Even in fast-growing Dallas-Fort Worth, more than 80 percent of population growth over the past 60 years has been outside the city of Dallas (which itself is largely suburban in form, see Suburbanized Core Cities).

The one notable exception to the peripheral growth model is Quanzhou (Fujian, China), which is developing under an even more dispersed pattern, described by Yu Zhu, Xinhua Qi, Huaiyou Shao and Kaijing He at Fujian Normal University. Typically, urban areas expand from an urban core on the periphery. Quanzhou is experiencing "in situ" urbanization, the spontaneous conversion of rural areas into urban development that does not expand from the urban core. The result is a sparsely developed urban area (especially for China), with plenty of land for potential infill development in the future.

The Future of Urbanization

It is likely that urban areas will continue to expand as they grow larger, consistent with what appears to be both economic pressures and market preferences for lower cost, more spacious housing. For example, fast growing Ho Chi Minh City is expected to see virtually all of its population increase over the next 15 years outside the urban core. Not surprisingly Shlomo Angel, Jason Parent, Daniel Civco, Alexander Blei and David Potere at the Lincoln Land Institute project significant expansions of urban land by mid-century. And, Angel, in his Planet of Cities, notes how important it is to allow the expansion, in order to improve the quality of life for the majority of people, who deserve to live as well as people in the West.

----

Note 1: Incomplete results of the 2011 Pakistan census have been reported by media in both Pakistan and India. However, no official announcement of the results has been identified from Pakistan census authorities. The Karachi population increase would be the largest metropolitan region 10 year rate of increase in history.

Note 2: Urban cores are generally the core historical jurisdiction, which often contains substantial non-core areas, even outside the United States. Core district data within these jurisdictions is used where available. Thus, this estimate over-states the urban core population increase.

Note 3: The driving factor in declining densities is principally transportation advances. Substantial urban expansion began with the coming of mass transit in the 19th century. However an even greater expansion began occurring with the availability of the automobile. As automobile orientation replaces transit orientation, densities tend to decline until it nearly all travel is by automobile. Even among automobile oriented urban areas, there can be large differences in urban densities. For example, transit's market share in the Boston urban area is substantially greater than in the Los Angeles urban area. Yet the Los Angeles urban area has a population density of 7000 per square mile (2,700 per square kilometer), more than three times that of the Boston urban area, at 220 per square mile (850 per square kilometer). The difference is that in Los Angeles residential development has largely occurred densities determined by the market, with single-family housing being typically built on 1/4 acre lots. In Boston, suburban lot sizes were forced higher by urban planning requirements for large lot zoning. The result is much greater land consumption than would have occurred if people's preferences (the market) had driven development. If Los Angeles had been developed at the same low density as Boston, its urban land area would equal that of the state of Connecticut.

Note 4: Megacities are urban areas with more than 10 million population. Five megacities remain to be described in The Evolving Urban Form (Karachi, Lagos, Nagoya, Paris and Teheran). Corresponding metropolitan regions are used for this analysis, since historic urban area data (areas of continuous urban development) is not available for most nations.

Wendell Cox is a Visiting Professor, Conservatoire National des Arts et Metiers, Paris and the author of “War on the Dream: How Anti-Sprawl Policy Threatens the Quality of Life.”

-----

Photo: New detached housing, suburban Tokyo-Yokohama (by author).

Is Urbanism the New Trickle-Down Economics?

$
0
0

The pejoratively named “trickle-down economics” was the idea that by giving tax breaks to the wealthy and big business, this would spur economic growth that would benefit those further down the ladder. I guess we all know how that worked out.

But while progressives would clearly mock this policy, modern day urbanism often resembles nothing so much as trickle-down economics, though this time mostly advocated by those who would self-identify as being from the left. The idea is that through investments catering to the fickle and mobile educated elite and the high end businesses that employ and entertain them, cities can be rejuvenated in a way that somehow magically benefits everybody and is socially fair.

Trickle down economics type policies failed both because while they contained a great deal of truth – tax rates do matter in economic development – they were a reductionist oversimplification, and perhaps more importantly were self-interested recommendations of the very class that would benefit from them. The tax breaks for the wealthy and big business were in fact the real goals, not primarily policies intended for socially beneficial consequences it was said would result from them.

As it turns out, urbanism in its current form appears to suffer from the exact same problems, as Richard Florida has just documented in an article over at Atlantic Cities called “More Losers Than Winners in America’s New Economic Geography.”

A key question remains: Who benefits and who loses from this talent clustering process? Does it confer broad benefits in the form of higher wages and salaries to workers across the board or do the benefits accrue mainly to smaller group of knowledge, technology, and professional workers?

The University of California, Berkeley’s Enrico Moretti suggests a trickle-down effect, arguing that higher-skill regions benefit all workers by generating higher wages for all workers. Others contend that this new economic geography is at least partially to blame for rising economic inequality.
….
I’ve been examining the winners and losers from this talent clustering process in ongoing research with Charlotta Mellander and our Martin Prosperity Institute team….Our main takeaway: On close inspection, talent clustering provides little in the way of trickle-down benefits. Its benefits flow disproportionately to more highly-skilled knowledge, professional and creative workers whose higher wages and salaries are more than sufficient to cover more expensive housing in these locations. While less-skilled service and blue-collar workers also earn more money in knowledge-based metros, those gains disappear once their higher housing costs are taken into account.

In short, there’s no flow through to people who aren’t directly tapped into the knowledge economy itself. I might add that this probably does include a number of service sector workers like celebrity chefs and personal trainers who cater to the luxury end of services. But the majority of residents are missing out.

To put it in political speak, the creative class doesn’t have much in the way of coattails.

These findings also foot to the implications of Saskia Sassen’s global city theories, in which the global city functions of a region comprise a sort of “city within a city” which has little in common with the rest of the metro region as thus perhaps little impact on it. Indeed, we might even view the two economic geographies as being in conflict.

Florida and Sassen are academics and so can’t necessarily be seen as advocates for the phenomena they describe. They are describing what is, not what should be. The question is, what have policy makers done with this information?

As with the tax rate example, there really is an importance to attracting educated people to your city. College degree attainment explains almost everything about per capita income in a region. (Though as Florida notes, per capita values, as means, can be misleading and median is a better way to do analysis where it’s available).

Have urbanists used this as a call to arms to put all of their energy into helping those left behind in the knowledge/creative class economy? No. Instead, urban advocates have gone the other direction, locking onto this in a reductionist way to develop a set of policies I call “Starbucks urbanism.” That is, the focus is on an exclusively high end, sanitized version of city life that caters to the needs of the elite with the claim that this will somehow “revitalize” the city if they are attracted there.

As with trickle-down economics, this a) doesn’t work and b) is being promoted by the self-interested.

Firstly, it doesn’t work because it more or less operates on the basis of displacement. So it might revitalize certain select districts, but only as physical geographies not human ones. This is exactly because of the phenomenon Florida identified: there are few trickle down benefits to be had. Also, this only works in a handful of districts or in cities that are so small that you can plausibly gentrify the entire thing. The area left behind in these places, as the in the violence stricken neighborhoods of Chicago that are making national news, receive virtually no benefit. And as Bill Frey of Brookings once said, “There aren’t enough yuppies to go around to save Detroit.” Thus only a comparatively small number of cities benefit from talent concentrations anyway. (Indeed, the notion of “concentration” is inherently a relative one).

Secondly, and here I go beyond Florida’s article, urban advocates are a largely self-interested class. Everybody knows that a hedge fund plutocrat is looking out for number one and has a class interest, but if we were honest with ourselves, most of us probably do the same at some different level. For example, it’s easy to cry nepotism when a politician’s relative gets put on the payroll, but if a man gets his son on at the ironworkers union, it generally flies under the radar. I don’t claim to be exempt from this myself.

The people most aggressively pushing urbanist policies like bike lanes, public art, high end mixed use developments, high tech startups, swank boutiques and restaurants, greening the city policies, etc. are disproportionately those who want to live that lifestyle themselves, or hope to someday. Like me in other words. The fact that you’re a Millennial who rides around to microbreweries on your fixie without necessarily having a high paying job yourself (yet) doesn’t matter. You are still advocating for your own preferred milieu, and that of others who think like yourself.

I have observed that when challenged on this, urbanists grow indignant, talking about their commitment to the planet or how transit benefits the poor, etc. But ultimately as with the tax cut advocates, that’s just a self-justification. With some notable exceptions, you don’t see social justice and equity issues front and center in the urbanists discussions outside of old-school community organizing/activism circles, groups that are almost totally distinct from Atlantic Cities style urbanism.

Most urbanists I know are quick to advocate tax increases for the 1% but fail to see how their own policies contribute to a widening of the income gap and class divide in their own cities. Even if they are genuinely motivated to help the entire civic commonwealth, hopefully they recognize that they at least have the same conflict of interest situation they would be quick to highlight in a businessman or politician.

The answer isn’t to junk urbanism. Just as class warfare rhetoric that demonizes the wealthy and business and wants to tax the daylights out of them isn’t the solution to what ails our economy, neither is abandoning many of the principles of urbanism. After all, tax rates do matter for economic growth. Similarly, liveable streets and such are indeed very important to urban revitalization.

What’s needed is a new orientation of these ideas so that we don’t end up with an explicitly elitist policy rationale and policy set that caters to the already privileged at the expense of the poor and middle classes of our cities. We need to be asking the question of what exactly we are doing to benefit the people without college degrees beyond assuring them that if we attract more people with college degrees everything will be looking up for them. We need to sell ideas like transit in a way that isn’t totally dependent on items like “enabling us to attract the talent we need for the 21st century economy.” If I read half as much about providing economic opportunity and facilitating upward social mobility for the poor and middle classes as I do about green this, that, or the other thing, we’d be getting somewhere. (Observe Robert Munson’s recent call to broaden the practical definition of green as one example of starting to think this way). I need to do this as much as anyone.

It’s easy to see why people default to trickle-down type theories even beyond class interest. Both sets of prescriptions – tax cuts for the elite and urbanism for the elite – took place against a backdrop of globalization and deindustrialization that eviscerated the engines of traditional working and middle class prosperity. The answers to how to fix this core problem aren’t obvious. Richard Longworth recently put together a compilation of views on middle class malaise and it is sobering reading.

In a sense, elite boosting policies have “worked” because they’ve successfully boosted the elite – a reasonably tractable problem in the new economy. But they’ve had few benefits to anyone else and have fueled huge class-based resentments that threaten civic cohesion. But just because the problem of opportunity for the poor and middle classes isn’t easy, doesn’t mean it doesn’t need to be solved. Indeed, rebuilding an engine of broad-based prosperity and upward mobility is the signature challenge of our age, and one to which urbanists should be encouraged to apply their fullest efforts.

Aaron M. Renn is an independent writer on urban affairs and the founder of Telestrian, a data analysis and mapping tool. He writes at The Urbanophile, where this piece originally appeared.

Chicago skyline photo by Bigstock.

The Cities Winning The Battle For The Fastest Growing High-Wage Sector In The U.S.

$
0
0

In an era in which many businesses that pay high wages have been shedding jobs, the wide-ranging employment category of professional, scientific and technical services has been a relatively stellar performer, expanding some 15% since 2001. In contrast, employment dropped over 20% in such lucrative fields as manufacturing and information-related businesses (media, telecom providers, software publishing) over the same period, and finance and wholesale trade experienced small declines.

With an average annual wage nearing $90,000, this category— which includes computer consulting and technical services, accounting, engineering and scientific research, as well as legal, management and marketing services  — increasingly shapes the ability of regions to generate higher-wage jobs. In order to determine which metropolitan areas are doing best, Mark Schill of Praxis Strategy Group compiled rankings based on both long and short-term growth, as well as the extent and growth of each region’s business service economy compared to the national average.

Notably absent from the top 10 are Chicago and the big metropolitan areas of the Northeast and California that have traditionally dominated high-end business services. The only exception is the third-ranked San Francisco-Oakland-Fremont metropolitan statistical area, which has logged 21% growth in this sector since 2001, while expanding the proportion of such jobs in the local economy to nearly twice the national average. Over the past year alone the region added 22,000 professional and business services jobs, which was more than a quarter of all new positions during that period.

The continuing vitality of nearby Silicon Valley, and the region’s attraction to educated workers, have made the Bay Area easily the best performer of the nation’s mega-regions. Yet the other leaders on our list are generally smaller, growing metro areas whose expansions have been propelled by a rapid increase in employment in technology and professional management services. These include our top-ranked metro area, Austin-Round Rock-San Marcos, Texas, which enjoyed over 46% growth in employment in professional services since 2001;  fourth-place Raleigh-Durham, N.C.; and No. 5 Salt Lake City, Utah. These areas have enjoyed strong net-in migration of educated workers, and have poached companies from more expensive regions.

More surprising still has been the rapid ascent of such unheralded regions as second-place Jacksonville, Fla., and Oklahoma City (sixth place). In Oklahoma City, where business and professional services employment has grown over 30% since 2001, progress can be traced to the city’s burgeoning energy sector.

But some other areas on our list are benefiting from a hitherto unnoted shift of high-end services to lower-cost and often lower-density regions. Jacksonville may be the poster child for this. Over the past decade, the northern Florida metro area’s population has grown 20% to over 1.3 million, but business services employment has expanded nearly 50%, the biggest jump of any of the country’s 51 largest metropolitan areas. Once a business services backwater, the share of jobs in that sector in the local economy has rapidly climbed towards the national average. This growth has been driven by management consulting as well as computer and data center services, an area in which Jacksonville has enjoyed among the highest growth rates in the country. One major player is web.com, which employs 500 people at its headquarters in south Jacksonville.

Other industries that rely on professional and business service providers have recently added jobs in the market, including BI-LO and Winn Dixie, which moved their combined headquarters  there, as did environmental services company Advanced Disposal. Financial giant Deutsche Bank has also  expanded in the area.

Jerry Mallot, president of the local business development group Jaxusa Partnership, suggests that low costs, a high rate of housing affordability and Florida’s lack of income tax make Jacksonville attractive to companies seeking to expand or relocate. The state, according to a recent report from New Jersey-based www.BizCosts.com, is now home to five of the country’s least expensive and most pro-business cities. Jacksonville, Orlando, and Tampa also are all among the U.S. metro areas adding college-educated residents the fastest.

Of course up-and-comers like Jacksonville, Charlotte, and Oklahoma City, and even Portland (10th place), still lack the critical mass of high-end business services of many of the larger, more established metropolitan areas. Some have continued to see strong growth in their professional services sectors. Not surprisingly, this includes greater Washington, D.C. (11th), with 26% growth since 2001, keyed by the expansion of government and the regulatory apparat in recent years. The share of professional services jobs in the local economy is two and a half times the national average, the highest concentration in the country.

Yet many of America’s largest metro areas, including longtime business service bastions, have lagged well behind. New York, home to Wall Street and many leading consulting, legal and professional firms, ranks a mediocre 32nd out of the 51 largest metro areas, with relatively meager growth of 8.5%. The share of professional services jobs in the New York economy fell, as it did in Los Angeles-Long Beach-Santa Ana (36th) and Chicago-Joliet-Naperville (43rd). This suggest trouble ahead for the future.

Chicago was among the few areas that actually lost employment in this generally fast-growing field. The other big losers include Detroit-Warren-Livonia, Mich. (39th) , despite a decent  pickup in the last two years as the auto industry has rebounded;  the Cleveland metro area (47th); Milwaukee-Waukesha-West Allis, Wisc. (49th); Birmingham-Hoover, Ala. (50th); and last-place Memphis.

What do these trends tell us about the future of high-wage employment? Certainly size is not enough, nor even the possession of strong legacy in business service industries. The relative declines of our three largest metro areas — New York, Los Angeles and especially Chicago — alone tells us that. Chicago, which has touted itself as a capital of business expertise, now seems to be falling into the nether reaches long inhabited by older Rust Belt cities and Southern backwaters.Chicago leaders such as Mayor Rahm Emmanuel needs to spent less time being possessed by what Time Out Chicago called a “world class city complex” and look into why, as urban analyst Aaron Renn suggests, the city’s vaunted global economy is not enough to produce enough high-wage jobs to sustain its vast surrounding region.

At the same time, being small and affordable, while helpful, is also not sufficient for business services success, as the presence of a number of smaller metro areas at the bottom of the list suggests. But the strong performance of many mid-sized cities  – ranging from Austin, Raleigh and Salt Lake to less-heralded Jacksonville, Kansas City, Oklahoma City and Richmond — suggest that these jobs will likely continue to migrate to smaller, less costly and generally less dense urban regions.

Once considered the natural domain of megacities and dense urban cores, high-wage business service jobs, largely due to technology, can increasingly be done anywhere. This suggests that the playing field for such positions, rather than concentrating, will become ever wider. As the struggle for good jobs intensifies in the years ahead, expect the competition between regions to get even greater.


Professional, Technical, and Scientific Services in the Nation's Largest Metropolitan Areas
Rank Index Score2001 - 2012 Growth2005 - 2012 Growth2010 - 2012 Growth2012 LQ2001 - 2012 LQ Change2012 Avg. Annual Wage
1Austin-Round Rock-San Marcos, TX79.646.9%38.8%13.8%1.435.9%$90,649
2Jacksonville, FL79.150.2%17.6%8.4%0.9928.6%$72,913
3San Francisco-Oakland-Fremont, CA67.221.4%23.6%12.9%1.9711.3%$120,442
4Raleigh-Cary, NC63.534.5%26.1%10.8%1.400.7%$81,025
5Salt Lake City, UT63.333.4%26.2%9.8%1.106.8%$76,341
6Oklahoma City, OK59.931.1%16.6%11.0%0.898.5%$62,374
7Kansas City, MO-KS59.524.2%17.6%10.4%1.2410.7%$82,060
8Richmond, VA57.728.9%16.9%8.2%1.019.8%$82,184
9Charlotte-Gastonia-Rock Hill, NC-SC56.129.9%24.4%6.3%0.975.4%$81,171
10Portland-Vancouver-Hillsboro, OR-WA55.124.6%17.3%10.2%1.055.0%$73,601
11Washington-Arlington-Alexandria, DC-VA-MD-WV55.126.1%11.7%3.5%2.451.7%$119,460
12Riverside-San Bernardino-Ontario, CA54.645.5%3.1%2.1%0.5811.5%$52,617
13Nashville-Davidson--Murfreesboro--Franklin, TN52.831.7%11.3%5.6%0.887.3%$81,189
14Buffalo-Niagara Falls, NY52.422.7%19.4%5.2%0.9310.7%$64,449
15Atlanta-Sandy Springs-Marietta, GA52.218.6%14.4%10.7%1.303.2%$87,575
16Columbus, OH51.923.4%17.6%5.8%1.166.4%$81,027
17San Diego-Carlsbad-San Marcos, CA50.924.7%13.4%3.4%1.515.6%$98,390
18Sacramento--Arden-Arcade--Roseville, CA50.329.6%11.0%1.1%1.0610.4%$81,973
19San Antonio-New Braunfels, TX48.130.5%13.2%5.3%0.800.0%$69,979
20Baltimore-Towson, MD47.420.0%8.4%6.1%1.343.9%$93,263
21Seattle-Tacoma-Bellevue, WA47.118.3%21.3%6.6%1.21-1.6%$88,345
22Tampa-St. Petersburg-Clearwater, FL46.718.7%7.6%5.0%1.178.3%$72,087
23Boston-Cambridge-Quincy, MA-NH44.810.5%15.5%7.6%1.62-1.8%$118,694
24Dallas-Fort Worth-Arlington, TX44.620.1%17.1%5.4%1.12-2.6%$89,392
25Denver-Aurora-Broomfield, CO44.214.3%16.5%5.5%1.44-1.4%$91,922
26Las Vegas-Paradise, NV43.633.4%-1.1%1.6%0.744.2%$74,939
27Louisville/Jefferson County, KY-IN41.816.4%13.8%4.7%0.822.5%$65,664
28Cincinnati-Middletown, OH-KY-IN41.313.3%7.6%7.8%0.961.1%$71,259
29Orlando-Kissimmee-Sanford, FL39.926.6%0.0%3.0%0.98-2.0%$72,368
30Houston-Sugar Land-Baytown, TX39.020.4%15.0%4.1%1.15-10.2%$101,352
31New Orleans-Metairie-Kenner, LA38.86.0%11.8%2.5%0.9710.2%$78,866
32New York-Northern New Jersey-Long Island, NY-NJ-PA37.58.5%9.8%7.1%1.36-6.2%$110,211
33Indianapolis-Carmel, IN36.217.2%10.6%1.9%0.85-2.3%$76,393
34San Jose-Sunnyvale-Santa Clara, CA35.4-5.5%13.7%7.9%2.10-9.1%$143,640
35Pittsburgh, PA35.06.8%10.0%6.4%1.06-4.5%$81,614
36Los Angeles-Long Beach-Santa Ana, CA34.87.8%4.3%5.6%1.22-3.2%$89,157
37Minneapolis-St. Paul-Bloomington, MN-WI32.24.5%7.1%7.8%1.04-8.0%$89,476
38Miami-Fort Lauderdale-Pompano Beach, FL31.910.5%0.4%3.5%1.13-4.2%$76,567
39Detroit-Warren-Livonia, MI31.6-6.4%-2.1%10.5%1.48-3.3%$87,909
40Philadelphia-Camden-Wilmington, PA-NJ-DE-MD30.86.0%1.0%4.2%1.27-5.2%$100,423
41Rochester, NY30.35.8%0.7%6.7%0.83-4.6%$65,787
42Phoenix-Mesa-Glendale, AZ28.512.9%1.3%2.4%0.92-8.9%$77,201
43Chicago-Joliet-Naperville, IL-IN-WI25.6-2.1%2.3%5.8%1.20-9.8%$97,746
44St. Louis, MO-IL25.51.0%0.9%4.2%0.93-6.1%$77,086
45Hartford-West Hartford-East Hartford, CT25.12.9%3.9%2.5%0.91-7.1%$84,846
46Virginia Beach-Norfolk-Newport News, VA-NC24.57.4%1.1%-1.3%0.89-4.3%$71,609
47Cleveland-Elyria-Mentor, OH19.9-6.5%-3.3%5.0%0.92-8.0%$75,584
48Providence-New Bedford-Fall River, RI-MA19.84.4%-3.3%-2.2%0.72-4.0%$68,834
49Milwaukee-Waukesha-West Allis, WI15.8-5.0%-5.1%2.3%0.81-10.0%$76,264
50Birmingham-Hoover, AL4.2-9.2%-7.8%-2.8%0.84-17.6%$75,561
51Memphis, TN-MS-AR2.2-8.2%-11.6%-2.2%0.52-17.5%$63,943


Analysis by Mark Schill, Praxis Strategy Group
Data Source: EMSI 2012.4 Class of Worker - QCEW Employees, Non-QCEW Employees & Self-Employed 

The LQ (location quotient) figure in the table above is the local share of jobs that are professional, technical, and scientific services (PSVS) divided by the national share of jobs that are PSVS. A concentration of 1.0 indicates that a region has the same concentration of PSVS as the nation.

Joel Kotkin is executive editor of NewGeography.com and a distinguished presidential fellow in urban futures at Chapman University, and a member of the editorial board of the Orange County Register . He is author of The City: A Global History and The Next Hundred Million: America in 2050. His most recent study, The Rise of Postfamilialism, has been widely discussed and distributed internationally. He lives in Los Angeles, CA.

This piece originally appeared at Forbes.com.

Viewing all 4164 articles
Browse latest View live