Quantcast
Channel: Newgeography.com - Economic, demographic, and political commentary about places
Viewing all 4170 articles
Browse latest View live

Peyton Manning for President?

$
0
0

Is the free agency of Colts quarterback Peyton Manning, or the trade of the evangelic Tim Tebow to the New York Jets a far more compelling story than anything yet to emerge from the presidential election news?

Compared with Peyton Manning’s dignified handling of his neck injuries and his complicated departure from Indianapolis, Mitt Romney seems about as stately as those hair-rinsed, middle-aged men who show up on halftime advertisements with that Viagra look in their eye. (In Romney’s case he is trying to get a few primary delegations to head upstairs.)

Even those seeking a greater religious presence in public life seem to find the faith of All-American Tim Tebow more engaging than the awkward positions of Rick Santorum, who sounds like he would pass out scarlet letters after his inauguration. And the YouTube Tebowing craze has breathed more fun and light into Christianity than any of Newt Gingrich’s C-SPAN homilies.

Ron Paul, who speaks in complete sentences about Federal Reserve economics and the national surveillance state, must wish he could command the respect of a retired football coach, someone like John Madden, so that people would listen when he is drawing his Xs and Os to explain the gold standard.

Had Peyton Manning tearfully retired from the Colts and announced his intention to campaign for president, I am sure he could have given Romney a run for his money. At least no one would begrudge him his millions. Romney’s two-Cadillac wife, $10,000 friendly bets, and country club bearing have doomed him with large swathes of the electorate. By contrast, Manning was able to spin four neck surgeries, a 36-year-old arm, and bad playoff performances into a Denver contract that could pay him $96 million over five years.

When he signed his deal, you would have thought he had won a Nobel or negotiated a truce in Syria, such was the public acclaim, relief, and satisfaction that he would not have to face the off-season playing fantasy football or that he might be down to his last $200 million.

The reason the electorate cares more about its quarterbacks than its candidates is because those running for office all sound like team owners, promising everyone season tickets to the American dream, while siphoning the revenue from the concessions and the sky boxes. At least NFL quarterbacks have to play the games and get their uniforms dirty.

To be sure, professional football organizations no more want to dilute their market share than Democrats or Republicans want to open up the U.S. electoral system to all the small parties — greens, social democrats, Christian socialists, trade unionists, nationalists, etc. — that you find in European countries.

The reason that the Broncos can afford to gamble $100 million on Peyton Manning’s neck surgeon is because professional football enjoys antitrust exemption, and collectively cashes the dividends of a market rigged more closely than one of Leland Stanford’s freight lines.

With the blessings of Congress, football hires indentured servants (the draft), limits ownership franchises (the protected guild of the NFL), shares cable contracts, and raids public treasuries to build billion dollar stadiums that only benefit the owners (and perhaps a few beer vendors). Think of the NFL as just another political action committee.

No wonder Mitt Romney campaigns for president as if auditioning to become the league commissioner, who serves at the grace of the owners and whose job it is speak sternly on 60 Minutes about “the integrity of the game.” In recent years, the real NFL Commissioner, Roger Goodell, has taken to fining players for violent hits and suspending coaches for tolerating bounties on opposing players.

NFL careers are nasty, brutish and short. Who would pay NFL stars tens of millions if on any given Sunday the game looked like Ultimate Frisbee? As a result of football's violence, ex-NFL players are prone to dementia and other crippling diseases, with little more support from the league than a handshake when their time on the field is up.

Listening the bounty tapes, the NFL has no more claim to “integrity” than a hockey enforcer, but the façade is maintained that the league promotes “sport” and “fairness,” even if the Saints’ locker room was home to the mentality of a hit squad.

Just as Goodell’s job is to preside over a closed chop shop but make it all look and sound like Chariots of Fire, President Obama is the league commissioner of the Fortune 500. That team can only dream of football’s antitrust exemption, even if it got in on some revenue sharing through the stimulus plan and TARP bailouts.

If the president, even in a minor way, were serious about creating jobs, he could deregulate the football industry by ending the antitrust exemption and allow other owners and cities to form their own teams. Why does the US limit the supply of its professional football?

Going long, the president could campaign against state and local subsidies ($20 billion by some accounts) for white-elephant stadiums that benefit only political cronies. He could take on the cable television oligopoly and let anyone with a webcam “broadcast” games that should be considered news events, not pay-per-view entertainments. He could also urge that college players be paid, as they work hard at many things, although school usually isn’t one of them.

The reason that the football establishment has trouble tolerating quarterback Tim Tebow is because he represents the sandlot game as it was played before the sport became a subsidiary of the advertising business -- a colorful if violent spectacle around which to plug Taco Bell or Coors Lite. (Players are best understood as animated billboards.) His passes may flutter like wounded ducks, but he’s a free spirit. Tebow is closer to democratic rule than to the corporate hierarchy of the football industry, no doubt one reason that the Broncos moved him along to the Jets, who at least have credentials in preferring anarchy to victories.

In the presidential election, candidates Romney and Obama will raise and spend more than $1 trillion, and speak endlessly about the “integrity of the country,” even as the CIA posts bounties on the heads of American citizens living abroad. (Maybe disgraced Saints coach Sean Payton should pass his suspended year in Yemen? At least there his talents would not be wasted.)

An election between Manning and Tebow would at least be fun, instructive, engaging, and offer clear choices. Manning would be the voice of protected industry, in which team owners or corporate sponsors are always munificent and wise, and always in the game for yet another government protection racket under the banner of competition. By contrast, Tebow would stand for a grassroots revival, prairie chapels, and the sense that the game has yet to be fixed.

Flickr Photo by Tennessee Journalist: Peyton Manning at the podium, looking presidential.

Matthew Stevenson is the author of Remembering the Twentieth Century Limited, a collection of historical travel essays, and recently edited Rules of the Game: The Best Sports Writing from Harper's Magazine. His next book is Whistle-Stopping America.


Still Moving to the Suburbs and Exurbs: The 2011 Census Estimates

$
0
0

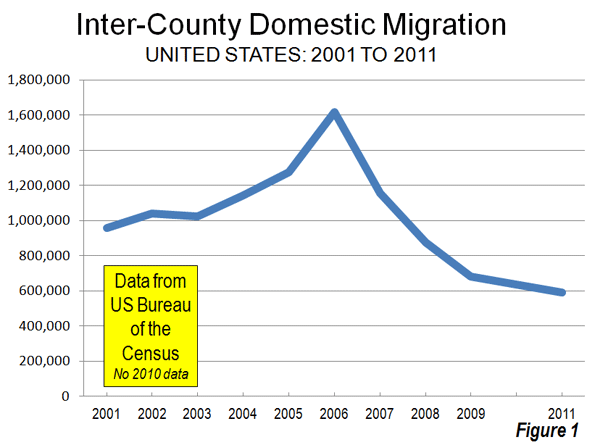
The new 2011 Census Bureau county and metropolitan area population estimates indicate that Americans are staying put. Over the past year, 590,000 people moved between the nation's counties. This domestic migration (people moving within the nation) compares to an annual rate of 1,080,000 between the 2000 and 2009. Inter-county domestic migration peaked in 2006 at nearly 1,620,000 and has been falling since that time (Figure 1). The continuing low rate of domestic migration has been reinforced by the economic malaise that has kept job and income growth well below levels that would be expected in a more genuine recovery.

Yet the nation has continued to grow. With less domestic migration, natural growth (births minus deaths) and considerable, but slower international migration, growth over the past year has been more in proportion to total population. The movement between counties within major metropolitan areas has become less of a factor. Predictably, there the usual doom and gloom reports  about suburbs and exurbs and how poorly they are doing compared to before, and how people are returning to the cities (Note 1). As usual, the data shows no such thing, as people continue to move from core counties in greater numbers than others move in (See Note 2 on county classifications).

Domestic Migration: Despite the higher gasoline prices and the illusions of a press that is often anti-suburban, both the suburbs and the exurbs continued to attract people from elsewhere in the nation. The core counties, which contain the core cities, continued to lose domestic migrants to other parts of the country, principally to the suburbs and the exurbs of the large metropolitan areas.

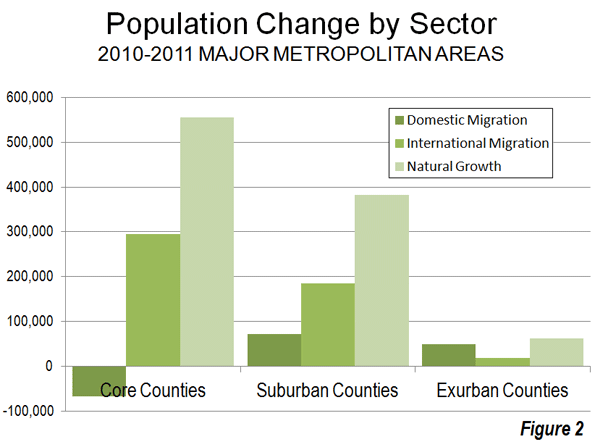
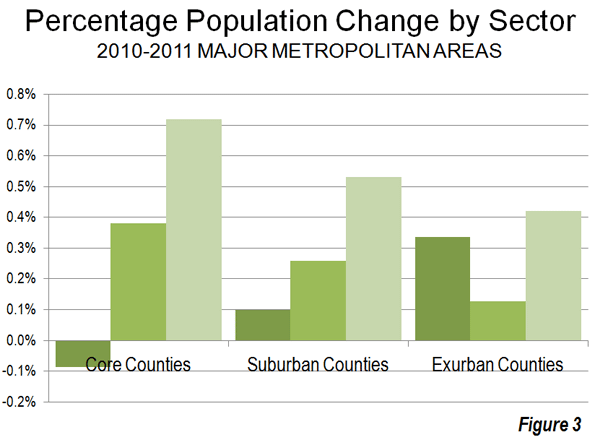
Over the past year, the core counties of major metropolitan areas lost 67,000 domestic migrants (people move between a metropolitan area and somewhere else in the nation). Suburban counties gained approximately 72,000 domestic migrants, while exurban counties gained 49,000 domestic migrants (Figure 2). Because of their lower population base, exurban counties had the highest relative rate of net domestic migration, at 0.34% of their 2010 population. This is more than three times the rate of the suburban counties (0.11%) and far higher than the minus 0.09% of the core counties (Figure 3). Thus, the overall slower rate of growth among exurban counties was due to a lower natural growth rate and less international migration, not the result of any losses to the core. The same is true, to a lesser extent, of the suburban counties.


Overall, the major metropolitan areas gained 48,500 domestic migrants between 2010 and 2011. By contrast, between 2000 and 2009, the major metropolitan areas lost, on average, nearly 200,000 domestic migrants to the rest of the nation each year. The huge domestic out migration in the last decade has been associated with the housing bubble. Less affordable housing markets lost 3.2 million domestic migrants between 2000 and 2009. More affordable markets gained 1.7 million domestic migrants. This was not enough to negate the losses in the higher cost markets, and major metropolitan markets lost 1.5 million domestic migrants overall.

Natural Growth: As the grim economic times induced people to stay put, core counties grew marginally faster than suburban and exurban counties principally because of higher natural growth rates, which is the net of births minus deaths. More than 70% of the higher population in core counties was from natural growth. Natural growth was less of a factor in the suburban counties, at 60%. In the exurban counties, natural growth accounted for only 47% of the population growth (Table 1). The higher core county natural growth rates are especially evident where there are large foreign born populations, due to their generally higher birth rates (such as Los Angeles, Dallas-Fort Worth, Houston, Austin and Riverside-San Bernardino, as well as Raleigh and Salt Lake City).

International Migration: The other component of growth was international migration, which contributed 38% of the growth in core counties and 29% of the growth in suburban counties. International migration was much less important in the exurban counties, contributing only 15% of the growth (Table 1)


Table 1
Major Metropolitan Areas
Components of Population Change: 2010-2011: Summary by Sector
 Net Domestic Migration   Net International Migration   Natural Increase (Births Minus Deaths) 
Core Counties -8.5% 37.6% 70.8%
Suburban Counties 11.2% 29.0% 59.8%
Exurban Counties 37.9% 14.5% 47.4%
Multi-County Major Metropolitan Areas 3.5% 32.1% 64.3%
Single County Major Metropolitan Areas -10.9% 34.5% 76.7%
Major Metropolitan Areas with More Than 1 County 3.0% 32.2% 64.7%
Single County Major Metropolitan Areas: San Diego and Las Vegas


The Gainers: The fastest growing major metropolitan areas were dominated by the four largest Texas metropolitan areas. Austin (3.2%), Dallas-Fort Worth (2.0%), Houston (1.9%) and San Antonio (1.9%) were all among the five fastest growing. Raleigh placed second, with a one-year growth rate of 2.3%. The top five numeric gainers in domestic migration were in all in Texas or Florida --- Dallas-Fort Worth (39,000), Miami (36,000), Austin (31,000), Tampa-St. Petersburg (27,000) and Houston (21,000). The much improved housing affordability in Florida seems likely to be a factor in the recovery of Miami and Tampa-St. Petersburg. Further, Houston became the second Texas metropolitan area to exceed Philadelphia in population, following Dallas-Fort Worth in the last decade. Texas thus becomes the first state to place two metropolitan areas in the five largest in the nation (Table 2).


Table 2
Major Metropolitan Areas: Population
Population: 2010-2011
Metropolitan Area 2010 2011 Change % Change
New York, NY-NJ-PA        18,919,649        19,015,900                  96,251 0.51%
Los Angeles, CA        12,844,371        12,944,801                100,430 0.78%
Chicago, IL-IN-WI          9,472,584          9,504,753                  32,169 0.34%
Dallas-Fort Worth, TX          6,400,511          6,526,548                126,037 1.97%
Houston. TX          5,976,470          6,086,538                110,068 1.84%
Philadelphia, PA-NJ-DE-MD          5,971,589          5,992,414                  20,825 0.35%
Washington, DC-VA-MD-WV          5,609,150          5,703,948                  94,798 1.69%
Miami, FL          5,578,080          5,670,125                  92,045 1.65%
Atlanta, GA          5,286,296          5,359,205                  72,909 1.38%
Boston, MA-NH          4,559,372          4,591,112                  31,740 0.70%
San Francisco-Oakland, CA          4,343,381          4,391,037                  47,656 1.10%
Riverside-San Bernardino, CA          4,245,005          4,304,997                  59,992 1.41%
Detroit. MI          4,290,722          4,285,832                   (4,890) -0.11%
Phoenix, AZ          4,209,070          4,263,236                  54,166 1.29%
Seattle, WA          3,447,886          3,500,026                  52,140 1.51%
Minneapolis-St. Paul, MN-WI          3,285,913          3,318,486                  32,573 0.99%
San Diego, CA          3,105,115          3,140,069                  34,954 1.13%
Tampa-St. Petersburg, FL          2,788,151          2,824,724                  36,573 1.31%
St. Louis, MO-IL          2,814,722          2,817,355                     2,633 0.09%
Baltimore, MD          2,714,546          2,729,110                  14,564 0.54%
Denver, CO          2,554,569          2,599,504                  44,935 1.76%
Pittsburgh, PA          2,357,951          2,359,746                     1,795 0.08%
Portland, OR-WA          2,232,896          2,262,605                  29,709 1.33%
San Antonio, TX          2,153,891          2,194,927                  41,036 1.91%
Sacramento, CA          2,154,583          2,176,235                  21,652 1.00%
Orlando, FL          2,139,615          2,171,360                  31,745 1.48%
Cincinnati, OH-KY-IN          2,132,415          2,138,038                     5,623 0.26%
Cleveland, OH          2,075,540          2,068,283                   (7,257) -0.35%
Kansas City,  MO-KS          2,039,766          2,052,676                  12,910 0.63%
Las Vegas, NV          1,953,927          1,969,975                  16,048 0.82%
San Jose, CA          1,841,787          1,865,450                  23,663 1.28%
Columbus, OH          1,840,584          1,858,464                  17,880 0.97%
Charlotte, NC-SC          1,763,969          1,795,472                  31,503 1.79%
Austin, TX          1,728,247          1,783,519                  55,272 3.20%
Indianapolis, IN          1,760,826          1,778,568                  17,742 1.01%
Virginia Beach (Norfolk), VA-NC          1,674,502          1,679,894                     5,392 0.32%
Nashville, TN          1,594,885          1,617,142                  22,257 1.40%
Providence, RI-MA          1,601,065          1,600,224                      (841) -0.05%
Milwaukee, WI          1,556,953          1,562,216                     5,263 0.34%
Jacksonville, FL          1,348,702          1,360,251                  11,549 0.86%
Memphis, TN-MS-AR          1,318,089          1,325,605                     7,516 0.57%
Louisville, KY-IN          1,285,891          1,294,849                     8,958 0.70%
Oklahoma City, OK          1,258,111          1,278,053                  19,942 1.59%
Richmond, VA          1,260,396          1,269,380                     8,984 0.71%
Hartford, CT          1,212,491          1,213,255                        764 0.06%
New Orleans, LA          1,173,572          1,191,089                  17,517 1.49%
Raleigh, NC          1,137,297          1,163,515                  26,218 2.31%
Salt Lake City, UT          1,128,269          1,145,905                  17,636 1.56%
Buffalo, NY          1,135,293          1,134,039                   (1,254) -0.11%
Birmingham, AL          1,129,068          1,132,264                     3,196 0.28%
Rochester, NY          1,054,723          1,055,278                        555 0.05%
Total      167,462,456      169,067,997             1,605,541 0.96%
Data derived from US Bureau of the Census
Major Metropolitan Areas: Over 1,000,000 Population


The Losers: Four metropolitan areas, Detroit, Cleveland, Providence and Buffalo suffered small population losses. Pittsburgh had a small gain, but was alone in having an excess of deaths over births. New York again led the nation in its net domestic migration loss, at 99,000. Chicago lost 54,000 and Los Angeles lost 51,000 residents to other areas of the country between 2010 and 2011, while Detroit lost 24,000. Domestic migration data is available for New York City because it is composed of five counties. New York City lost 57,000 domestic migrants (Table 3).


Table 3
Major Metropolitan Areas
Components of Population Change: 2010-2011
 Net Domestic Migration   Net International Migration   Natural Increase (Births Minus Deaths)  Total Components of Change (Note)
New York, NY-NJ-PA              (98,975)                83,322                112,336               96,683
Los Angeles, CA              (50,549)                54,725                  96,150             100,326
Chicago, IL-IN-WI              (53,908)                24,422                  61,483               31,997
Dallas-Fort Worth, TX                39,021                23,291                  63,504             125,816
Houston. TX                21,580                24,105                  64,363             110,048
Philadelphia, PA-NJ-DE-MD              (13,133)                11,413                  22,769               21,049
Washington, DC-VA-MD-WV                21,517                24,872                  48,235               94,624
Miami, FL                36,191                35,215                  20,440               91,846
Atlanta, GA                12,419                17,370                  42,908               72,697
Boston, MA-NH                 (1,627)                15,494                  18,143               32,010
San Francisco-Oakland, CA                  5,880                17,996                  23,939               47,815
Riverside-San Bernardino, CA                15,131                  9,065                  35,826               60,022
Detroit. MI              (24,170)                  7,468                  11,734                (4,968)
Phoenix, AZ                  5,585                15,866                  32,847               54,298
Seattle, WA                17,598                12,228                  22,280               52,106
Minneapolis-St. Paul, MN-WI                      536                  7,832                  24,296               32,664
San Diego, CA                      816                  9,591                  24,703               35,110
Tampa-St. Petersburg, FL                27,157                  6,857                     2,318               36,332
St. Louis, MO-IL              (10,260)                  2,671                  10,256                 2,667
Baltimore, MD                 (1,341)                  5,004                  10,941               14,604
Denver, CO                19,565                  5,204                  19,997               44,766
Pittsburgh, PA                  3,740                  1,426                   (3,260)                 1,906
Portland, OR-WA                11,388                  4,806                  13,511               29,705
San Antonio, TX                19,515                  3,841                  17,486               40,842
Sacramento, CA                  2,856                  6,173                  12,659               21,688
Orlando, FL                10,394                  9,767                  11,557               31,718
Cincinnati, OH-KY-IN                 (7,149)                  2,152                  10,624                 5,627
Cleveland, OH              (12,521)                  1,896                     3,344                (7,281)
Kansas City,  MO-KS                 (2,820)                  3,009                  12,705               12,894
Las Vegas, NV                 (6,353)                  8,007                  14,395               16,049
San Jose, CA                 (2,704)                11,072                  15,376               23,744
Columbus, OH                  2,219                  3,329                  12,390               17,938
Charlotte, NC-SC                13,778                  4,581                  13,038               31,397
Austin, TX                30,669                  6,134                  18,085               54,888
Indianapolis, IN                  1,940                  2,953                  12,827               17,720
Virginia Beach (Norfolk), VA-NC                 (7,086)                  2,382                  10,044                 5,340
Nashville, TN                  9,323                  3,015                     9,867               22,205
Providence, RI-MA                 (6,254)                  2,487                     2,940                   (827)
Milwaukee, WI                 (4,862)                  1,796                     8,384                 5,318
Jacksonville, FL                  2,911                  1,935                     6,691               11,537
Memphis, TN-MS-AR                 (2,933)                  1,841                     8,615                 7,523
Louisville, KY-IN                  1,886                  1,711                     5,400                 8,997
Oklahoma City, OK                  8,746                  2,228                     8,904               19,878
Richmond, VA                  1,546                  1,965                     5,519                 9,030
Hartford, CT                 (4,749)                  3,066                     2,493                     810
New Orleans, LA                10,153                  1,563                     5,630               17,346
Raleigh, NC                13,262                  3,228                     9,608               26,098
Salt Lake City, UT                      915                  3,090                  13,674               17,679
Buffalo, NY                 (2,558)                  1,185                        176                (1,197)
Birmingham, AL                 (2,452)                  1,245                     4,421                 3,214
Rochester, NY                 (3,320)                  1,235                     2,650                     565
Total                48,513              517,129             1,039,221         1,604,863
3.0% 32.2% 64.8% 100.0%
Data derived from US Bureau of the Census
Major Metropolitan Areas: Over 1,000,000 Population
Excludes San Diego and Las Vegas, which have only a single county


Captive v. Discretionary Markets? One year's data does not make a trend, especially in unusual times. Until the nation returns to normal economic growth, many young who would otherwise move are staying put, as well as young families that would be looking for larger houses. The driving factor in the more modest domestic migration trends observed today could well be necessity rather than desire.

Wendell Cox is a Visiting Professor, Conservatoire National des Arts et Metiers, Paris and the author of “War on the Dream: How Anti-Sprawl Policy Threatens the Quality of Life

----

Note 1: It is a misconception that suburbs and exurbs have grown principally because people have moved from cities. In fact, most suburban and exurban growth has been from smaller towns and rural areas. See Cities and Suburbs: The Unexpected Truth. Components of change data (domestic migration, international migration and natural growth) is available only at the county level. Thus, city or municipality data is only available where a municipality and a county are combined.

Note 2: The core county contains all or most of the largest historical core municipality (see Suburbanized Core Cities) in the metropolitan area, except in New York, where all five counties that comprise the city of New York are classified as core counties. The suburban counties are those designated by the Bureau of the Census as central counties, but exclude the core counties. The exurban counties are as classified by the Bureau of the Census.

Note 3: The largest historical core municipalities comprise slightly more than 55 percent of the core county population (both figures combined).

Photo: Chicago (West Wacker Drive) By Author

Enjoying the Kool-Aid in Omaha

$
0
0

I left Santa Monica for Omaha less than 3 months before the collapse of the global financial infrastructure in September 2008. The impending problems in housing and credit markets – obvious from early 2007 and exacerbated by the pile-on effect of derivatives gone wild – were increasingly in the bank of my mind. I made the decision to leave the dense urban population center of southern California and head to a place where —as recently described in an episode of The Walking Dead – there is a small population and lots of guns. I figured if the world was going to fall apart (something short of being over-run by zombies but worse than a minor recession) I’d rather not be sitting with my back to the ocean and no boat.

Omaha has turned out to be blessed. The farm economy is strong. It is home to 5 of the Fortune 500: ConAgra, Berkshire Hathaway, Union Pacific, Peter Kiewit Sons’ and Mutual of Omaha Insurance all call Omaha home. Best of all, Omaha is home to Warren Buffett – the Oracle of Omaha and financial genius of Wall Street, one of the world’s richest men, head of legendary Berkshire Hathaway and, best of all for me, patron of the arts, humanities, community and politics in Nebraska.

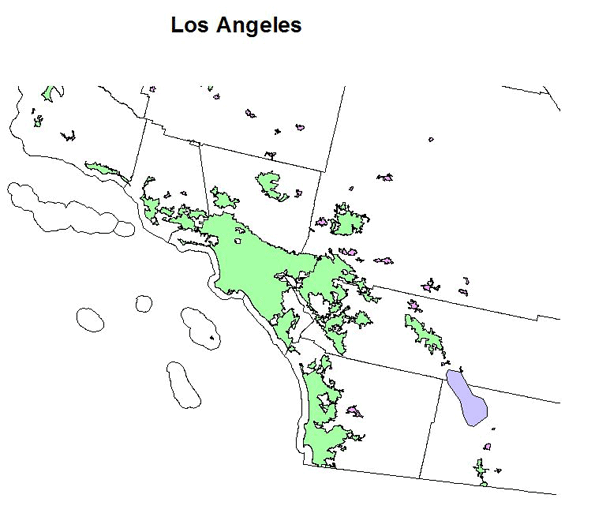
We all hail Uncle Warren’s beneficence but we may not want to look too closely at where the money comes from – like the 15 percent return he’s earning on the $5 billion investment he made in Goldman Sachs the week before they got a $10 billion bailout; or the fact that Berkshire Hathaway was the largest shareholder in American Express Co. when they received $3.4 billion from Uncle Sam. Nebraska may be a red state but Buffett has chosen Democrats, like retiring Senator Ben Nelson, to service his economic agenda. According to data from the Federal Election Commission, Uncle Buffett’s political contributions go almost exclusively to Democrats. I could write a whole story just on what Ben Nelson has done for Nebraska, but to conserve space, let me just say “Cornhusker Kickback” – you get the picture. We have more roads, bridges, and military contractors than can likely be required in a state with a population of 2 million – about the same as the population of Manhattan. This in a place where rush hour means there is a car in front of you and you can see more than 12 cars on either side of the road – compare that to Los Angeles (see photos above). The one electoral vote from Nebraska that went to Obama in 2008 is the one that includes Uncle Buffett’s house.

Author Peter Schweizer (Reason March 2012) describes Buffett using a “bootleggers and Baptists” comparison that’s too close to Immanuel Kant’s “Private vice, public virtue” dichotomy to be accurate. I think Uncle Buffett is much more open about his vices. He does his good works in public but clearly   publically influences his politicians. Buffett made that $5 billion investment in Goldman Sachs on September 23, 2008 – a week before Senator Nelson voted “aye” on the bailout that greatly enhanced Goldman’s value and protected it from the massive losses which would have resulted from the need to raise capital by liquidating assets at collapsing market prices. The Wall Street Bailout not only gave Goldman Sachs an infusion of capital but it also covered the credit default swap payments that Goldman Sachs demanded from American International Group (AIG) as it was going into bankruptcy.  Goldman’s share of the AIG bailout was $2.5 billion in credit default swap payments, plus $5.6 billion in payments from the Federal Reserve Bank of New York and another $4.8 billion as “vig” for lending securities to AIG. That’s enough to cover the dividend payments to Buffett for 14 years with enough left over to pay back the principle. Ten percent rate of return with zero risk – not the risk/reward tradeoff I learned about in college.

Most Omaha residents know Buffett’s political savvy and appreciate his understated style. Ben Nelson does. He bragged at a Chamber of Commerce meeting that he took advice from Warren before he voted for the Wall Street Bailout. He completely ignored the irony: a Senator asks a banker for advice on a bank bailout, the banker encourages the senator to payout $750 billion of taxpayer money to banks. This is something much less benign than drinkin’ likker on Saturday night and singin’ in the choir on Sunday morning.

Ben Nelson is among the members of congress who invested in shares of Berkshire Hathaway before passing the Bailout that Benefited Buffett – a move that would probably have gotten them fired from Berkshire Hathaway. The very fact that Buffett was reported as saying something so banal as “I’d never be so brave as to try to influence congress” is all you need to hear to know that he’s not telling the truth. According the Congressional testimony of former- Special Inspector General for the Troubled Asset Relief Program (SigTARP) Neil Barofsky, and a report from the Government Accountability Office, the TARP bailout program was rigged. Firms with “political connections,” were more likely to get TARP funds. This was reported to Congress at hearings and reported here in 2009:

“Treasury, the New York Federal Reserve and even Presidential Economic Advisor Larry Summers may be passing information to their friends that can be used for financial gain, giving positions in bailout programs to business associates, and engaging in ‘too cordial relationships’ with bailout recipients.”

We may object to Warren Buffet’s manipulations on moral ground but residents of Omaha and Nebraska get to enjoy his largess. The procession of bailouts is anathema to many here. Uncle Buffett may live halfway from Wall Street but he is an insider in the classic sense. His huge bets on municipal bonds mean he needs to work to keep cities and counties from bankruptcy. In March 2008, just months after credit markets began to seize up, Buffett told CNBC he had “written 206 transactions in the last three weeks” which were default swaps on municipal bonds – the financing used by cities, counties and states to fund everything from building schools to running services. Since that means Buffett will have to payout if the municipalities experience “credit events” (like missing bond payments), he has the incentive to push for another bailout. The virtue? The bailout will also benefit the millions of people who live and work in places like Detroit, Illinois, and Jefferson County, Alabama. The vice? He controls enough bank stock to have managed a refinance for those municipalities without siphoning off significant premiums for profit. Buffett is willing to pay to get a government that caters to profligate cities and offers bailouts to companies in his industry, too. Buffett hosts a fundraiser for Obama’s political campaign and Obama names a tax-reform after Buffett – one hand washes the other, all done in the bright sunshine of Sunday morning.

There is no denying that Buffett is smart with his money. In the same way, it would be foolish to suggest that he does this for some personal gratification instead of for profit. His long-hailed strategy of “value investing” has now gone by the wayside in favor of a strategy that can only be described as “grab the profit while you can but don’t stray too far from the government teat.”  When the music stops Uncle Buffett will get bailed out, again, by his good friend Uncle Sam.

So I’m not disagreeing with the point being made by Shweitzer and others that “America’s favorite billionaire plays politics to make money.” I’m not even disagreeing that this is bad for America. In fact, I side with Nebraska’s Republican Governor Dave Heineman when it comes to the doings of Buffett and Nelson: If it’s bad for America in the short run, it can’t be good for Nebraska long term. I don’t agree with what Buffett and Nelson have been doing for Nebraska but I am enjoying the benefits. And maybe that’s your answer – move into their neighborhoods, enjoy the protection, but whatever you do – don’t drink the Kool-Aid.*

*Wikipedia cites a reporter from the Washington Post who wrote about seeing “’packets of unopened Flavor Aid’ scattered in the dust in Guyana….”, not actual Kool-Aid. (Source: Krause, Charles A. (Dec. 17, 1978). "Jonestown Is an Eerie Ghost Town Now.") As an aside, Kool-Aid was invented in the 1920s by a Nebraska mail-order entrepreneur.

Susanne Trimbath, Ph.D. is CEO and Chief Economist of STP Advisory Services. Dr. Trimbath’s credits include appearances on national television and radio programs and the Emmy® Award nominated Bloomberg report Phantom Shares. She appears in four documentaries on the financial crisis, including Stock Shock: the Rise of Sirius XM and Collapse of Wall Street Ethics and the newly released Wall Street Conspiracy. Dr. Trimbath was formerly Senior Research Economist at the Milken Institute. She served as Senior Advisor on United States Agency for International Development capital markets projects in Russia, Romania and Ukraine. Dr. Trimbath teaches graduate and undergraduate finance and economics.

Lead Photo: 7:15pm May 21, 2011, Santa Monica Freeway, Eastbound © STP Advisory Services, LLC

The Urban US: Growth and Decline

$
0
0

The urban population of the United States is now 249 million, according to the 2010 Census, 81 percent of the total. This is impressive, and not all surprising for a large developed economy. Yet the urban population --- meaning cities, suburbs and exurbs --- is not everything. And in many ways for everything from food, resources and recreation, the urban areas still depend on the nearly sixty million who live in rural America

It is fascinating to review how American demography has changed over the last decade. So I will briefly look at some obvious points, such as the largest, most important, places, those that grew the most absolutely and relatively, and those that, on the contrary, declined.

Our Giant Metropolises 

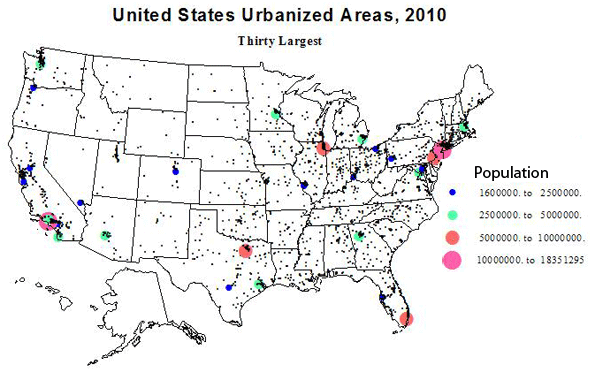
The Census is very generous, probably way too generous, in their defining the outer limits of our urbanized areas (agglomerations with over 50,000 people). They tend to respect the independence of historically separate places, which from a satellite view would appear to be part of a united larger agglomeration. For example, New York, as defined, is huge enough but dense settlement goes far beyond its census limits. (I’ll take a look at conurbations, like Megalopolis, in a separate discussion). The 30 giants are shown in Table 1. The top three, New York, Los Angeles and Chicago have kept their positions for decades, but  story of more recent times has been the upsurge of Southern giants of Houston, Dallas, Miami, Atlanta, and of course, Washington, DC. Detroit is still in the top 15, but its position has fallen to 11th, while other historic places like Cleveland, St. Louis and Pittsburgh have dropped into the second set of 15.


Table 1: Largest US Urbanized Areas
Urbanized Area Name  2010 Population 2000 Population Change % Change
1 New York--Newark, NY--NJ--CT 18,351,295 17,799,861 551,434 3.10
2 Los Angeles--Long Beach--Anaheim, CA 12,150,996 11,789,487 361,509 3.07
3 Chicago, IL--IN 8,608,208 8,307,904 300,304 3.61
4 Miami, FL 5,502,379 4,919,036 583,343 11.86
5 Philadelphia, PA--NJ--DE--MD 5,441,567 5,149,079 292,488 5.68
6 Dallas--Fort Worth--Arlington, TX 5,121,892 4,145,659 976,233 23.55
7 Houston, TX 4,944,332 3,822,509 1,121,823 29.35
8 Washington, DC--VA--MD 4,586,770 3,933,920 652,850 16.60
9 Atlanta, GA 4,515,419 3,499,840 1,015,579 29.02
10 Boston, MA--NH--RI 4,181,019 4,032,484 148,535 3.68
11 Detroit, MI 3,734,090 3,903,377 -169,287 -4.34
12 Phoenix--Mesa, AZ 3,629,114 2,907,049 722,065 24.84
13 San Francisco--Oakland, CA 3,281,212 3,228,605 52,607 1.63
14 Seattle, WA 3,059,393 2,712,205 347,188 12.80
15 San Diego, CA 2,956,746 2,674,436 282,310 10.56
90,064,432 82,825,451
16 Minneapolis--St. Paul, MN--WI 2,650,890 2,388,593 262,297 10.98
17 Tampa--St. Petersburg, FL 2,441,770 2,062,339 379,431 18.40
18 Denver--Aurora, CO 2,374,203 1,984,889 389,314 19.61
19 Baltimore, MD 2,203,663 2,076,354 127,309 6.13
20 St. Louis, MO--IL 2,150,706 2,077,662 73,044 3.52
21 San Juan, PR 2,148,346 2,216,616 -68,270 -3.08
22 Riverside--San Bernardino, CA 1,932,666 1,506,816 425,850 28.26
23 Las Vegas--Henderson, NV 1,886,011 1,314,357 571,654 43.49
24 Portland, OR--WA 1,849,898 1,583,138 266,760 16.85
25 Cleveland, OH 1,780,673 1,786,647 -5,974 -0.33
26 San Antonio, TX 1,758,210 1,327,554 430,656 32.44
27 Pittsburgh, PA 1,733,853 1,753,136 -19,283 -1.10
28 Sacramento, CA 1,723,634 1,393,498 330,136 23.69
29 San Jose, CA 1,664,496 1,538,312 126,184 8.20
30 Cincinnati, OH--KY--IN 1,624,827 1,503,262 121,565 8.09
29,923,846 26,513,173


Cities with the Largest Gains  

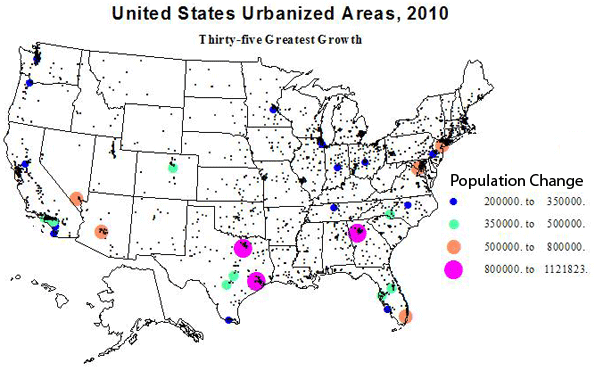
Urbanized areas which gained the most population over the last decade are listed in Table 2. These numbers are truly large; these are clear leaders in “population power”. I’ll first draw our attention to the five cities which are in the top 35 in both absolute growth and in percent growth. These include Temecula-Murrieta, CA (most folks will never have even heard of it: think inland sunshine of Riverside county); Charlotte and Raleigh, NC; Cape Coral, FL (again, huh?); and Austin, TX (you were thinking Dallas or Houston? See below).

Temecula-Murietta : 25th absolute growth, 6th % growth               
Charlotte : 9th and 19th
Raleigh : 18th and 21st               
Cape Coral : 30th and 27th  
Austin : 10th and 34th

North Carolina wins the race for the fastest growing areas.  But in sheer growth in people, the winners are (Table 2) Houston, Atlanta, Dallas, Phoenix, Washington, Miami, Las Vegas (despite the recession), New York, Charlotte and Austin. Giant New York is the only non-sunbelt place in the elite, and it had a quite slow rate of growth (3%). The next places outside the southern tier are Denver (13th) and Seattle (18th).  The total absolute growth in these top 15 cities was a phenomenal 7.24 million, a rate of growth of 8.7 %. For the top 30 urbanized areas, the growth was 10.3 million, with a percent growth of 9.7 – the same as the rate of growth of the nation. This includes slow growing but still very big places like Los Angeles (growth displaced to its satellites), Philadelphia, Chicago, Indianapolis, Portland and Minneapolis.


Table 2: Largest Absolute Change in US Urbanized Areas
Urbanized Area Name  2010 Population 2000 Population Change % Change
1 Houston, TX 4,944,332 3,822,509 1,121,823 29.35
2 Atlanta, GA 4,515,419 3,499,840 1,015,579 29.02
3 Dallas--Fort Worth--Arlington, TX 5,121,892 4,145,659 976,233 23.55
4 Phoenix--Mesa, AZ 3,629,114 2,907,049 722,065 24.84
5 Washington, DC--VA--MD 4,586,770 3,933,920 652,850 16.60
6 Miami, FL 5,502,379 4,919,036 583,343 11.86
7 Las Vegas--Henderson, NV 1,886,011 1,314,357 571,654 43.49
8 New York--Newark, NY--NJ--CT 18,351,295 17,799,861 551,434 3.10
9 Charlotte, NC--SC 1,249,442 758,927 490,515 64.63
10 Austin, TX 1,362,416 901,920 460,496 51.06
11 San Antonio, TX 1,758,210 1,327,554 430,656 32.44
12 Riverside--San Bernardino, CA 1,932,666 1,506,816 425,850 28.26
13 Denver--Aurora, CO 2,374,203 1,984,889 389,314 19.61
14 Tampa--St. Petersburg, FL 2,441,770 2,062,339 379,431 18.40
15 Los Angeles--Long Beach--Anaheim, CA 12,150,996 11,789,487 361,509 3.07
16 Orlando, FL 1,510,516 1,157,431 353,085 30.51
17 Seattle, WA 3,059,393 2,712,205 347,188 12.80
18 Raleigh, NC 884,891 541,527 343,364 63.41
19 Sacramento, CA 1,723,634 1,393,498 330,136 23.69
20 Chicago, IL--IN 8,608,208 8,307,904 300,304 3.61
21 Philadelphia, PA--NJ--DE--MD 5,441,567 5,149,079 292,488 5.68
22 San Diego, CA 2,956,746 2,674,436 282,310 10.56
23 Indianapolis, IN 1,487,483 1,218,919 268,564 22.03
24 Portland, OR--WA 1,849,898 1,583,138 266,760 16.85
25 Minneapolis--St. Paul, MN--WI 2,650,890 2,388,593 262,297 10.98
26 Columbus, OH 1,368,035 1,133,193 234,842 20.72
27 Nashville-Davidson, TN 969,587 749,935 219,652 29.29
28 Murrieta--Temecula--Menifee, CA 441,546 229,810 211,736 92.14
29 McAllen, TX 728,825 523,144 205,681 39.32
30 Cape Coral, FL 530,290 329,757 200,533 60.81


Rate of Population Growth

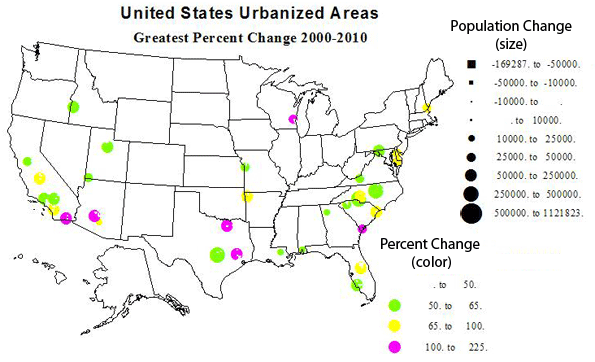
Thirty six cities had a growth rate of more than 50 percent between 2000 and 2010, a decade not that fabulous in economic growth!  Only three of these are independent metropolises of over a half-million: Charlotte and Raleigh, NC, and Austin, TX. With growth numbers and rates of 491000 (65%), 343000 (63%), and 460000 (51%)—clearly places on the move up. The others fall more or less into these categories: (please see table 3 for a list of all 35).

Satellite places to larger urban areas: 21 places
Smaller regional capitals or centers: 10 place

The superstars in rate of growth were McKinney, TX (Dallas satellite), 212% growth; Avondale, AZ (Phoenix suburb), 190%; The Woodlands, TX (Houston satellite), 168%; Lady Lake, FL (Orlando satellite), 123%; West Bend, WI (Milwaukee satellite, 106%); El Centro , CA (Imperial Valley center), 103%; and  Hilton Head, SC (retirement, etc.), 101%.


Table 3: Greatest Percent Gains
Urbanized Area Name  2010 Population 2000 Population Change % Change
1 McKinney, TX 170,030 54,525 115,505 211.84
2 Avondale, AZ 197,041 67,875 129,166 190.30
3 The Woodlands, TX 239,938 89,445 150,493 168.25
4 Lady Lake, FL 112,991 50,721 62,270 122.77
5 West Bend, WI 68,444 33,288 35,156 105.61
6 El Centro, CA 107,672 52,954 54,718 103.33
7 Hilton Head Island, SC 68,998 34,400 34,598 100.58
8 Temecula--Murrieta, CA 441,546 229,810 211,736 92.14
9 Concord, NC 214,881 115,057 99,824 86.76
10 Visalia, CA 219,454 120,044 99,410 82.81
11 Los Lunas, NM 63,758 36,101 27,657 76.61
12 Myrtle Beach, SC 215,304 122,984 92,320 75.07
13 Portsmouth, NH--ME 88,200 50,912 37,288 73.24
14 Casa Grande, AZ 51,331 29,815 21,516 72.17
15 Fayetteville--Springdale, AR 295,083 172,585 122,498 70.98
16 Dover, DE 110,769 65,044 45,725 70.30
17 Kissimmee, FL 314,071 186,667 127,404 68.25
18 Salisbury, MD--DE 98,081 59,426 38,655 65.05
19 Charlotte, NC--SC 1,249,442 758,927 490,515 64.63
20 Victorville--Hesperia--Apple Valley, CA 328,454 200,436 128,018 63.87
21 Raleigh, NC 884,891 541,527 343,364 63.41
22 Manteca, CA 83,578 51,176 32,402 63.31
23 Cape Coral, FL 530,290 329,757 200,533 60.81
24 Provo--Orem, UT 482,819 303,680 179,139 58.99
25 Nampa, ID 151,499 95,909 55,590 57.96
26 St. George, UT 98,370 62,630 35,740 57.07
27 Cartersville, GA 52,477 33,685 18,792 55.79
28 Hammond, LA 67,629 43,458 24,171 55.62
29 Mauldin--Simpsonville, SC 120,577 77,831 42,746 54.92
30 Blacksburg, VA 88,542 57,236 31,306 54.70
31 Lee's Summit, MO 85,081 55,285 29,796 53.90
32 Hagerstown, MD--WV--PA 182,696 120,326 62,370 51.83
33 Santa Clarita, CA 258,653 170,481 88,172 51.72
34 Austin, TX 1,362,416 901,920 460,496 51.06
35 Daphne--Fairhope, AL 57,383 38,110 19,273 50.57


Losers

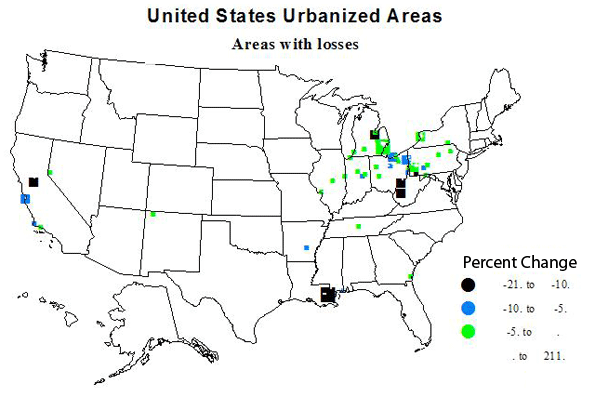
Urban growth is the expected norm, but not all areas of the country prospered 2000-2010. What kinds of place lost population and why? See Table 4 for a list of larger absolute and percent losses. Despite the comeback of the automobile industry, Detroit experienced the greatest loss, arguably because much of the industry has moved to the non-union and lower wage South. New Orleans had the second biggest loss, with almost an 11 percent loss, recovering only gradually from hurricane Katrina. Partly race or perhaps more a legacy of poverty and inept governance?  Other large numerical losses were in rust belt industrial and mining cities, such as Buffalo, Youngstown and Pittsburgh and Charleston, WV.  At least one was quite different: Seaside-Monterey CA, with losses due to reduced military operations as well as a generally weak California economy.

High rates of losses were mostly in the same places, but included several smaller industrial towns in Ohio, Indiana and Pennsylvania.


Table 4: Greatest Percent Losses  and Greatest Absolute Losses
Relative posses
Urbanized Area Name  2010 Population 2000 Population Change % Change
1 Mansfield, OH 75,250 79,698 -4,448 -5.58
2 Lorain--Elyria, OH 180,956 193,586 -12,630 -6.52
3 Pascagoula, MS 50,428 54,190 -3,762 -6.94
4 Youngstown, OH--PA 387,550 417,437 -29,887 -7.16
5 Wheeling, WV--OH 81,249 87,613 -6,364 -7.26
6 Lompoc, CA 51,509 55,667 -4,158 -7.47
7 Mayagüez, PR 109,572 119,350 -9,778 -8.19
8 Hightstown, NJ 64,037 69,977 -5,940 -8.49
9 Pine Bluff, AR 53,495 58,584 -5,089 -8.69
10 Seaside--Monterey--Marina, CA 114,237 125,503 -11,266 -8.98
11 Anderson, IN 88,133 97,038 -8,905 -9.18
12 Johnstown, PA 69,014 76,113 -7,099 -9.33
13 Saginaw, MI 126,265 140,985 -14,720 -10.44
14 New Orleans, LA 899,703 1,009,283 -109,580 -10.86
15 Uniontown--Connellsville, PA 51,370 58,442 -7,072 -12.10
16 Yauco, PR 90,899 108,024 -17,125 -15.85
17 Charleston, WV 153,199 182,991 -29,792 -16.28
18 Lodi, CA 68,738 83,735 -14,997 -17.91
19 Parkersburg, WV--OH 67,229 85,605 -18,376 -21.47
20 Ponce, PR 149,539 195,037 -45,498 -23.33
Absolute Losses
Urbanized Area Name  2010 Population 2000 Population Change % Change
1 Seaside--Monterey--Marina, CA 114,237 125,503 -11,266 -8.98
2 Lorain--Elyria, OH 180,956 193,586 -12,630 -6.52
3 Saginaw, MI 126,265 140,985 -14,720 -10.44
4 Lodi, CA 68,738 83,735 -14,997 -17.91
5 Yauco, PR 90,899 108,024 -17,125 -15.85
6 Parkersburg, WV--OH 67,229 85,605 -18,376 -21.47
7 Pittsburgh, PA 1,733,853 1,753,136 -19,283 -1.10
8 Charleston, WV 153,199 182,991 -29,792 -16.28
9 Youngstown, OH--PA 387,550 417,437 -29,887 -7.16
10 Buffalo, NY 935,906 976,703 -40,797 -4.18
11 Ponce, PR 149,539 195,037 -45,498 -23.33
12 San Juan, PR 2,148,346 2,216,616 -68,270 -3.08
13 New Orleans, LA 899,703 1,009,283 -109,580 -10.86
14 Detroit, MI 3,734,090 3,903,377 -169,287 -4.34


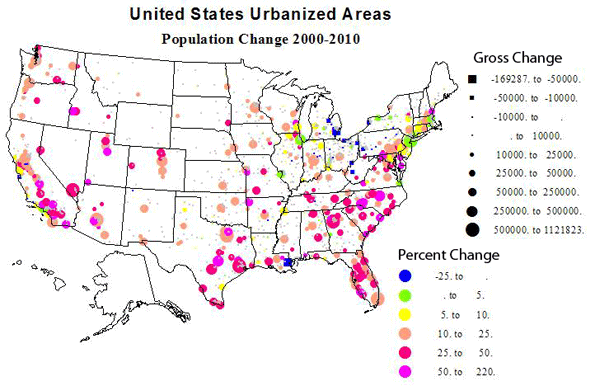
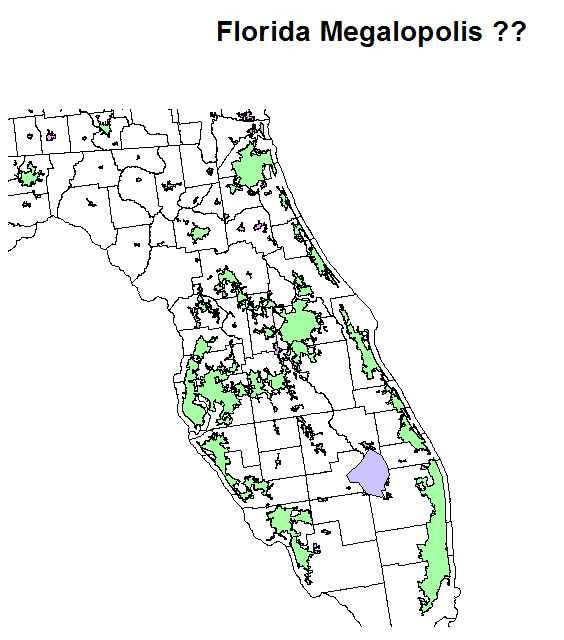
These statistics are also summarized in 5 maps – one showing the size and rate of growth of all urbanized areas, followed by maps of the largest 30 places, the 35 places with the highest absolute and highest relative growth, then a map of the largest absolute and percent losses.

Density, Size and Location

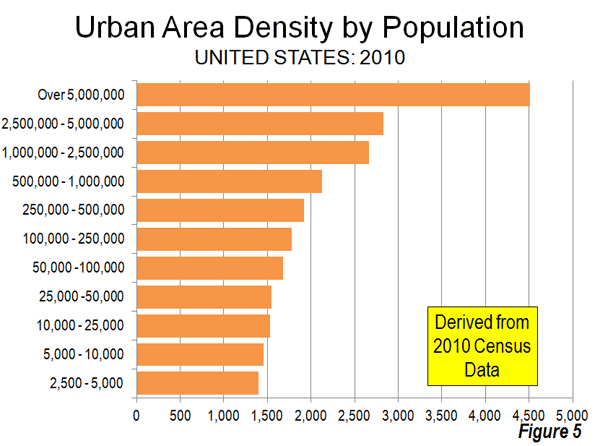
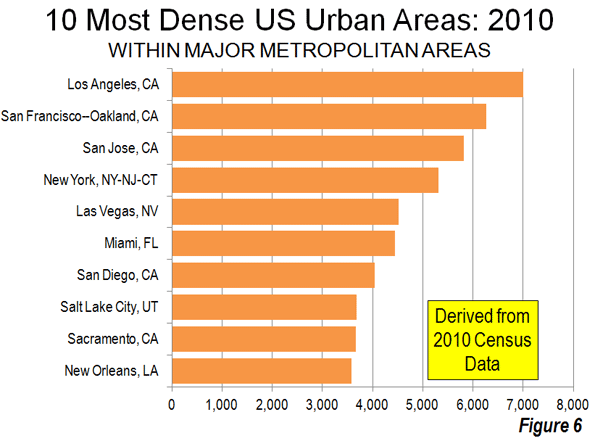
People are often surprised by the fact that the highest urban densities are not in the historic eastern cities but in newer western cities. Los Angeles, often called the epitome of sprawl, is in fact the densest urbanized area in the US, for the third straight census! Table 5 lists the densest urbanized areas and the densities of the largest areas.


Table 5: Highest and lowest urban densisties
Highest urbanzed area densities
Place State Population (Thousands) Density
Los Angeles CA 12,151 6,999
San Francisco CA 3,281 6,266
San Jose CA 1,664 5,820
Delano CA 54 5,483
New York NY 18,351 5,319
Davis CA 73 5,157
Lompoc CA 52 4,816
Honolulu HI 802 4,716
Woodland CA 56 4,551
L:as Vegas NV 1,886 4,525
Densities of largest places (not on above list)
Chicago IL 8,608 3,524
Miami FL 5,502 4,442
Philladelphia PA 5,442 2,746
Dallas TX 5,122 2,879
Houston TX 4,944 2,979
Washington DC DC 4,586 3,470
Atlanta GA 4,515 1,707
Boston MA 4,182 2,232
Detroit MI 3,734 2,793
Phoenix AZ 3,629 3,165
Seattle WA 3,059 3,028
Lowest density places
Hickory NC 212 811
Hammond LA 68 883
Barnstable MA 247 890
Gadsden AL 64 892
Homosassa Spgs FL 81 895
Anniston AL 80 920
Los Lunas NM 64 921
Spartanburg SC 181 952
Hilton Head SC 69 1,020
Anderson SC 76 1,022


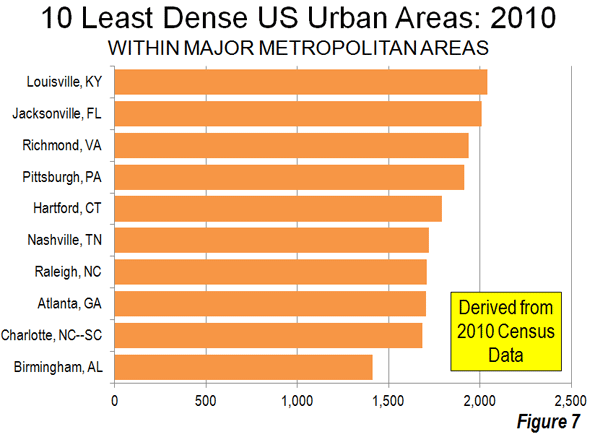
The remarkable story is that of the 10 densest areas, 9 are in the west, and 7 in the Golden State. Four of these are fairly small, another surprise. The only eastern city in the top 10 is New York, which is fairly sharply limited by the census. Los Angeles, San Francisco and San Jose are the three most densely settled areas. The main underlying reason is not just planning regulations, although these probably play a role, but the issue of providing water to developable land. Both are restricted. This is one reason why growth in the southwest tends to be relatively dense. These drier areas lack the local water supplies that enable the kind of low density sprawl typical of the historic eastern cities like, yes, Boston with a density of only 2231, less than one-third that of Los Angeles!!  Other large urban areas with lower densities include Chicago, Philadelphia, Detroit, Houston, Dallas and Atlanta, a mere 1707!

The winners for low density are an interesting mix of satellite places, such as Hammond, Barnstable, Los Lunas, and independent places like Hickory, Gadsden and Anniston, AL, and Spartanburg and Anderson, SC, many in hilly Appalachian environments, with settlement limited to valley floors. This is why the density could be below 1000 per square mile, the usual demarcation point of urban densities. Several are rather resort-like, e.g., Barnstable, Hilton Head and Homosassa Springs.

Even if our urban definition is a little generous, 80 percent of the population or 250 million persons is an impressive total. Most of us cannot escape the city, where most jobs and opportunities are. We need to live in cities and perhaps most of us love the city. So the settlement issue in our lives becomes what city to live in and where to live within that place.

Richard Morrill is Professor Emeritus of Geography and Environmental Studies, University of Washington. His research interests include: political geography (voting behavior, redistricting, local governance), population/demography/settlement/migration, urban geography and planning, urban transportation (i.e., old fashioned generalist).

Next: Megalopolis and its rivals.

Los Angeles skyline photo by Bigstockphoto.com.

Alternative Growth Paths for Sydney: A New Report and its Implications

$
0
0

Population growth in Australia is double the world average and the New South Wales Department of Planning has projected that the population of the Sydney region will increase by 57,000 people annually. How will these extra people be housed?  The NSW Government follows the usual doctrines based on higher population densities. Its planning policy, known as The Metropolitan Strategy, works on locating some 70% of new dwellings within existing urban communities (in-fill) and 30% in new greenfield sites. 

This policy is implemented by orders issued by the New South Wales Minister of Planning and imposed by ministerial fiat which are neither tabled nor debated in parliament.

To achieve this 70/30 strategy the Department of Planning in effect has placed a restrictive growth boundary around Sydney to force higher-densities into existing residential areas. Greenfield land release has been reduced from an historic 10,000 lots per year to less than 2,000. This has caused a severe land shortage. 

These policies are undemocratic and widely resented. What is more, the government has not justified them in terms of public good.  Indeed they might find that hard to do. For example, Australian studies show that greenhouse gas emissions per person are higher in high-density living, congestion is worse, human health is compromised, the costs of electricity, gas and water services increase, heritage conservation areas valued by the community are often lost and irreplaceable urban patchwork of greenery and wildlife within the city is decimated.

The CIE Report

The previous Labor Government commissioned a report on possible planning alternatives for Sydney. This report, by the Centre for International Economics (CIE) titled The Benefits and Costs of Alternative Growth Paths for Sydney: Economic, Social and Environmental Impacts was delivered back in December 2010. It has only now been released by the current government. 

The report discusses three different scenarios for Sydney.  These portray alternatives of 90%, 70% and 50% of new housing to be built in existing urban areas (in-fill) - and correspondingly 10%, 30% and 50% in greenfield sites.

The report compares the costs of the 90/10 and 50/50 scenarios with those of the current Metropolitan Strategy 70/30 ratio over a twenty-five-year period. It finds the cost differences between them are comparatively trivial. When compared to the Metropolitan Strategy 70/30 policy, the annual non-discounted cost saving per new dwelling for the 90/10 scenario is only A$151.  For the 50/50 scenario the additional annual cost per new dwelling is found to be A$950.

This report contains two significant flaws. The first is an implicit assumption that the price of land will be the same for all three scenarios. It also fails to properly consider additional cost factors.

Price of Land

Each scenario examined changes the amount of new land that would be released for development. When compared with the current baseline 70/30 strategy, the 90/10 scenario would require even greater restrictions on the release of new housing land and hence an even greater land shortage. By contrast, the 50/50 scenario would allow for a more generous release of new land and hence more land available for construction.  The immutable laws of supply and demand ensure that the degree of land restriction would significantly affect the cost of housing in each scenario, completely swamping the relatively minor cost differences due to other factors.

Incredibly, the report appears to fail to take the effect of relative scarcity on costs into consideration. It simply assumes that the price of land will remain the same for each scenario.

This is significant because the report includes in its calculations factors that are highly dependent on the cost of land. If the report’s findings are to be credible, the variation of these factors caused by land price variation in each scenario examined should also be taken into account.  When land is scarce high-density developers can make greater profits as they have less competition from low-priced houses and landholders can get higher prices for their land than would be the case otherwise. 

Other Costs

The report alleges that electricity consumption is greater in houses than it is in apartments. This is incorrect. Studies show that consumption per capita is greater in apartments. It appears that the data the report relies on does not take into account the consumption of electricity common to the whole apartment block such as lifts and lighting common areas such as foyers and car spaces. 

The report also does not take into account costs to existing residents arising from forcing high-density into communities originally designed for low-density. These include:

  • The impact on a single-residential property that has high-rise built next to it. This can involve theft of amenity: new in-fill residents look over gardens of existing residents while the latter have to look onto unsightly structures, and suffer lack of privacy and overshadowing.
  • Congestion. Existing residents have to suffer from increasingly congested streets and shortage of street parking.
  • Shortage of recreational facilities. As more vacant land is built upon in a community originally designed for low-density, it becomes difficult to secure new open areas to service the needs of the additional population at a reasonable standard.
  • Reduction in housing choice, particularly for families.  Most infill development consists of apartments which are not suitable for bringing up young children.  Indeed the majority of those currently living in apartments do not do so by choice. A survey indicates multi-story apartments are not even acceptable to most people wishing to downsize, if they have other choices such as smaller single residential houses or villas.
  • Reduction in biodiversity. When gardens and open space are replaced with unit blocks this has a severe effect on urban plant and animal life.
  • Heritage items valued by the community such as traditional period architect designed housing are often lost.
  • Atmospheric pollution.  There is a local effect on residents of atmospheric pollution in high-density areas.  This is due to higher traffic densities and to less volume of air being available for the dilution and dispersion of pollutants.

If these considerations had been quantified into the report’s calculations, they would have changed its overall findings.

Conclusions

As is not unusual in reports by density advocates throughout the English-speaking world, the report’s findings are marred by the fact that significant factors are omitted.  If costs and benefits were fully accounted for, including the costs and benefits borne by existing residents, an already weak case for emphasising densification over fringe development would vanish.

As we have seen, even with the flawed accounting used in the report, the magnitude of the cost differences that it finds between its three scenarios is trivial. These tiny differences make the unpopular Metropolitan Strategy 70/30 policy hard to justify, and any intensification of this strategy to 90/10 impossible to justify.   Cost differences of either A$151 or A$950 are small compared to the price that people have to pay for a house (the median price in Sydney is A$650,000). These insignificant figures need to be considered in the light of providing people with the opportunity of living in the housing style of their choice.

If costs and benefits were to be fully accounted for, including those borne by existing residents, the case for a policy of enforced densification cannot be supported.   When asked voters want less rather than more densification.

High land prices due to restrictive land-releases are already making housing unaffordable for the next generation.  Unwanted high-rise development represents theft from the community, reducing the amenity of existing residents and transfers that value to property developers without recompense. This theft is aided and abetted by the policies of the State Government. Moreover, it continues to result in well-publicised favours being granted to developers with connections to government.

The Metropolitan Strategy needs to be replaced. A good start would be for the New South Wales government to adopt the suggested 50/50 strategy as the first step towards reform.  The provision of more choice will allow people to demonstrate whether they prefer to live in high-density or in lower cost, more spacious housing with a garden in the suburbs.

(Dr) Tony Recsei has a background in chemistry and is an environmental consultant. Since retiring he has taken an interest in community affairs and is president of the Save Our Suburbs community group which opposes over-development forced onto communities by the New South Wales State Government.

Sydney suburb photo by BigStockPhoto.com.

The Right Steps to a Post-College Job

$
0
0

What will become of today's middle class college students after they graduate? Opposing points of view come, on one side, from a voice of the education establishment, the American Association of Colleges & Universities (AACU), and on the other from rhetorical bomb thrower and author Aaron Clarey Worthless: The Young Person’s Indispensible Guide to Choosing the Right Major.

Clarey asks: Who has your family hired recently? Whenever you buy a car, or drive on a road, or use a computer you indirectly hire an engineer. And when you put money in a bank, or go to the doctor, or consult an accountant, those people provide a useful service. But when did you ever hire a person competent in feminist theories? When did you last hire a sociologist or a philosopher, or a historian? Chances are - never - unless you were forced to by the involuntary expenditure of your tax dollars. Those degrees, according to Clarey, are worthless.

If Clarey is dismissive of intellectual pursuits, the AACU is the opposite. Part of its justification for liberal education:

“Many of the questions shaping higher education today spring from an interdependent world community in the midst of profound social, political, economic, and cultural realignments. Systems are being redesigned, relationships renegotiated, and modes of commerce and communication transformed. The problems we face—as individuals and societies—are urgent and increasingly defined as global: environment and development, health and disease, conflict and insecurity, poverty and hopelessness. Similarly, the goals of democracy, freedom, equity, justice, and peace are increasingly understood to encompass the globe and play out across multiple and complex cultures. Such global challenges cut across academic disciplines and require perspectives beyond the training and experience of most faculty members.”

While Clarey is an engaging and entertaining writer, the AACU webpage is turgid. Clarey writes for students and their parents; the AACU page is directed to college administrators and faculty. Beyond that, two words pepper the AACU website, but appear not at all in Clarey’s book: “globalization” and “21st Century.”

Clarey definitely has the easier job when it comes to entertainment value. He scores a lot of points ridiculing the women’s studies major, a pinata full of belly laughs. And surely, if any major is worthless it is women’s studies. That’s just too easy a target, and it’s hard to give Clarey much credit for the criticisms.

He’s on much weaker ground when he attacks historically legitimate disciplines such as English, philosophy, or history. “English has got to be the most worthless degree in the entire English-speaking world. The reason why should be blindingly obvious. You already speak English.” This is a silly argument, however entertaining. The problem with English is not that it is “worthless,” but rather that it has very little economic value. It’s been oversold - there are way too many English majors for the market to absorb.

The AACU has a much harder task: defending the value of the liberal arts. The difficulty of the read thus roughly corresponds to the difficulty of the task. Their webpage underplays any claim of direct economic benefit from a liberal education. The supposed benefits lie in citizenship, global awareness, and political sensibility, etc. But an argument for liberal education that ignores earning a living is a weak argument.

For all the talk about globalization, the AACU clearly has no clue as to what it really is. For college students, it means only one thing: lower salaries. Exceptions include those rare geniuses in business or the culture that beat the odds. But for the remaining 99%, a college degree is a commodity. They are competing against similarly educated people in China, India, Brazil, and around the world. All they have to offer the marketplace is a skill - surgery, law, accounting, programming, writing, etc. - that they must perform at least as well and as cheaply as the competition or a computer.

For an example of the value of a liberal arts degree, a WSJ article describes “Eric Probola, who got a bachelor's degree in global cultural studies from Point Park University in Pittsburgh in 2010, accepted an administrative assistant's job at a nonprofit there for less than $30,000 a year.” Many, many BA graduates are working as secretaries, plumbers, and pizza deliverers. I know more who are going back to school to get nursing degrees. Why didn’t they do it right the first time?

The AACU uses the term “21st Century” as shorthand for “we’re hip and we’re planning for the future.” Clarey, on the other hand, doesn’t account for the future at all. His solution is that students should major in disciplines that are well paid today, and he chooses engineering as the best example.

Ten years ago he might have suggested law school, when it really was a ticket into the upper middle class. Since then, both technology and globalization have put paid to that. The same trends may occur in engineering and other disciplines. Clarey doesn’t address this possibility at all.

In response, I'm guessing that he might say something like, 'OK, I’m sorry about the lawyers. I really am. And maybe you’re right that ten or twenty years from now engineers will suffer the same fate. I can’t predict the future, and neither can you. But I do know that a student graduating in engineering today will move into a well-paid, upper middle class job. A student graduating in Environmental Policy Studies, with a senior thesis entitled “The Role of Women Farmers on Environmental Sustainability in Southern Malawi,” will not.' Fair enough. Still, Clarey would benefit from studying the Three Laws of Future Employment.

The AACU argument goes something like this:

  1. Globalization means that problems (climate change, human rights, etc.) that once were local become global.
  2. Governments, NGOs, and the United Nations, along with multinational corporations, will all take steps to address these pressing concerns.
  3. Students majoring in the liberal arts will increasingly find jobs managing global polity.
  4. Thus students who understand culture, politics, people, language, and science will be in demand.

In a word, the liberal arts represent the future.

In my view every step in this chain of reasoning is flawed. But the fatal flaw is economic. Where will governments, NGOs or the UN get the money to hire all these liberal arts students? Are American pensioners going to sacrifice their social security checks to employ the Malawi expert above, or are Malawi farmers going to chip in part of their $3/day profit for the purpose? Clarey is right: most liberal arts graduates will not earn a middle class living. Economically speaking, the degrees are worthless.

Photo of Student on Steps from the University of Denver.

Daniel Jelski is a professor of chemistry at SUNY New Paltz, and formerly served as the dean of science and engineering.

A Little Snooki in the French Presidential Campaign

$
0
0

As a reality television series, it’s hard to beat the prime-time adventures of the French presidential election; as endless as the Republican primaries, but racier than Snooki's antics on “Jersey Shore”. This ought to give pause to anyone who is relying on Parisian politics to save the European Union.

To ensure that the Élysée Palace is inhabited occasionally by bigamists (François Mitterand), megalomaniacs (Charles de Gaulle), diamond smugglers (Valéry d’Estaing), or influence peddlers (Jacques Chirac), the presidential electoral system works like this: In the first round on April 22nd, candidates from a diverse number of parties across the spectrum will face off. If none of the candidates get more than 50 percent of the vote (unlikely), a runoff is then held two weeks later, featuring the top two finishers of round one.

In the current cycle, the major candidates are President Nicolas Sarkozy (right of center; best imagined as a tough detective on “Law and Order”), François Hollande (socialist; looks like Seinfeld’s friend George Costanza), Marine Le Pen (far-right nationalist; uses the word deportation as a noun, verb, adjective, and term of endearment), François Beyrou (centrist; keen on the moral purity of centrism), and Jean-Luc Mélenchon (far left; speaks for those whom Le Pen would deport).

According to the latest polls, which are notoriously inaccurate, Sarkozy should pull the most votes in the first round—followed by Hollande, Mélenchon, Le Pen, and Bayrou—but not enough to win outright.

Enthusiasm for Hollande is tepid, and hardline voters, fearing he is a margarine socialist, might ditch him to vote for the florid, far left candidate, Mélenchon, although it is doubtful that Mélenchon would ever place second. In the runoff, if Sarkozy were to face Hollande, the forecasts are that the socialist candidate would beat the standing president, 54 - 46 percent.

Campaigning in France takes place on nightly news programs that feature breathless, non-stop reports about the day’s political events. Sarkozy loves big indoor rallies in halls that look like Madison Square Garden, where only his supporters are admitted. They madly wave “La France Forte” placards (“For a Strong France”), while he denounces illegal immigration, Islamic terrorists, and economic stagnation. He has even campaigned against himself, saying, if re-elected, he would be “a different president.”

The mundane facts of the campaign don't explain why the election has become a prime-time drama, with most talk shows spending hours on the candidates’ love lives or on the scandal of the week.

When he ran for president in 2007, Sarko was married to Cécelia Sarkozy. They met when, as mayor of Neuilly in Paris, he officiated at her first wedding. Three years later, they were a couple.

During the presidential campaign in 2007, however, she told one interviewer that perhaps she might not vote. After her husband won, she acted bored at the thought of moving into the Élysée Palace (“all those rooms and servants...”), and famously blew off a Bush family cookout at Kennebunkport when she found out that it would involve spending the day with her husband.

Those Sarkozys divorced. Cécelia said Sarko conceived of political office as a platform on which to seduce women, including some not dressed up as brides. Sarko brooded for about an afternoon and then took up with the singer, songwriter, and supermodel fashionista Carla Bruni, who sees herself as this generation’s Jacqueline Kennedy.

Not to be outdone on “How the President Met Your Mother,” François Hollande has four children with Ségolène Royal, the socialist party candidate for president in 2007. Imagine a relationship—they never officially married—in which both partners want to be president of France? Ségo lost to Sarko in 2007. During that election it turned out that life-partner Hollande was “campaigning” with a Madame de Pompadour-like magazine journalist, who now might become the first official live-in girlfriend at the Élysée Palace.

Although France is not a country that bores easily on the subject of sex, when voters are looking for other electoral diversions (why dwell on recession, illegal immigrants, angry Arabs, or the Greek invoice?), the newspapers are ready with a host of tabloid scandals.

The mud sticking to the sides of Sarko’s Nixonian smile is his relationship with the rich heiress of the L’Oréal fortune, Liliane Bettencourt, who is suspected of having financed his 2007 campaign with envelopes that were stuffed from a Swiss bank account. Her bagman has been arrested, and the accountant is singing to the judges, but as a sitting president Sarkozy is immune from prosecution. Nor, until he leaves office, does he even have to answer questions about the bulging envelopes.

Were the Bettencourt scandal a Burgundy wine, the review notes on the shelf might read, “Lush hints of the Swiss alps, with just the right amount of perfume and hidden pleasure, yet classically French. Drink now or hold until the election.”

Because the socialists don’t want to go into pre-election prime-time sweeps without a scandal of their own, they can always rely on former party chief Dominque Strauss-Kahn, the excommunicated head of the International Monetary Fund, who on a slow day for news can be counted on to harass women, cavort with prostitutes, or land in jail, with each headline reminding the French that, save for the odd rape charge, he could well have been their next president.

The latest DSK charges involve call girls who provided pleasures at a Lille hotel, and whom, when the mood and cash were right, flew off to far-flung DSK soirées. There, the president-in-waiting together with some (socialist?) corporate donors would loosen their chains and unite with these workers. (Marx would have approved.)

In court, DSK’s lawyer claimed his client didn’t know the ladies were escorts because he only saw them in a natural state, when it’s harder to discern the “provenance” of the “goods,” which is how Strauss-Kahn referred to the women.

Alas, scandals are included in a French presidential election only for entertainment. Neither sacks of cash nor tales of sexual escapades will determine how people vote. The working classes, based in large cities, vote for the left. Agrarian, conservative France guards its pocketbook and votes for the right. Centrism isn’t a French concept.

Sarko’s chance is that he appeals to the middle right, a law-and-order president angry at Islam who has the backs of shopkeepers and farmers, all of whom are tired of strikes and lazy functionaries.

Hollande — if he makes it to the second round, where he could well beat Sarkozy — can point to an incumbent who is presiding over a stagnating economy with high unemployment. But Hollande’s sonorous campaign might make voters long for someone more passionate, even Sarko, who each day reminds the electorate of some new red scare.

Marine Le Pen, for her part, has made it clear that she would not put up with any more nonsense—not with rioting Algerians, not with bankrupt Greeks, not with German alliances.

Still, nonsense and naughtiness might be exactly what the French are looking for, and that raises this question: Are the French toast?

Photo: Nicolas Sarkozy at Davos, 2011; copyright World Economic Forum

Matthew Stevenson is the author of Remembering the Twentieth Century Limited, a collection of historical travel essays, and recently edited Rules of the Game: The Best Sports Writing from Harper's Magazine. His next book is Whistle-Stopping America.

Millennial Generation Safe at Home

$
0
0

Each emerging American generation of adolescents and young adults tends to have a distinctive relationship with its parents. For the Baby Boomers of the 1960s and 1970s, that relationship was often conflicted, even adversarial. For Generation X in the 1980s and 1990s it was frequently distant and disrespectful. By contrast, the interactions with their parents of most of today’s Millennial Generation (born 1982-2003) are close, loving, and friendly. That’s a very good thing because, to a far greater extent than for the previous two or three generations, Millennials in their twenties live with their parents, and even grandparents, in multigenerational households.  To the surprise of many members of older generations, most Millennials—and their parents—believe the experience is beneficial and even enjoyable. It may even help America in the years ahead.

A Pew survey conducted last December indicated that nearly two-thirds (63%) of young adults 25-34 knew someone who had recently moved back in with their parents.   Almost three in ten (29%) said that they were currently living with their parents. That is nearly three times the percentage of those of that age who lived with their parents in 1980 (11%). Multigenerational households, once seen as a lagging trend, have been growing as a share of households since 1980, rising from 12 to 16 percent over the past three decades.

More recently, the powerful and disproportionately large impact of the Great Recession on young Americans appears to have further accelerated this trend toward multigenerational households. According to Pew, in 2011, the unemployment rate for 18-24 year olds (16.3%) and 25-29 year olds (10.3%) was well above that of those 35-64 (7%).

But the growth in multigenerational households represents more than simply the result of economic stress. It also reflects how Millennials were raised and the value both they and their parents place on family life.  According to Pew, the large majority of young adults who now live with their parents are both satisfied with this arrangement (78%) and optimistic about their future (77%). In fact, more than a third (34%) of them actually believe that living with their parents at this stage of life has been good for their relationship with their parents, about twice the number who say it has been bad (18%). From the parents’ perspective, those who say an adult child of theirs has moved back home recently are just as satisfied with their family life and housing situation as are those parents whose adult children have not returned home. In this regard, these upbeat parents resemble Cliff and Clair Huxtable, the original TV role models for the proper rearing of Millennials on “The Bill Cosby Show,” who outwardly complained, but inwardly seemed pleased, every time one of their children (and sometimes grandchildren) “boomeranged” back to the family’s home.

Furthermore, both the adult Millennials who are living with their parents as well as their parents seem to be benefitting from this arrangement. This contradicts the notion, popular among Boomers, that living with parents after one becomes an adult represents some sort of personal failure or lack of initiative. Nearly three-fourths (72%) of the adult children say that living with their parents has had a positive impact on their own personal finances. Young adults who live with their parents also contribute to the household in a variety of ways. Nearly all (96%) say they do chores around the house. Three-quarters contribute to paying household expenses such as groceries or utility bills. More than a third (35%) pay rent to their parents. Given all this, it is not surprising that multigenerational households have become increasingly common with so little complaint from any of the generations involved.

However, many pundits have expressed a concern about what this trend means for America in the decades ahead. For example, in a recent New York Times article Todd and Victoria Buchholz wrote disparagingly of the “go-nowhere generation” that refuses to take risks, bestir itself from the insulation of home and “go on the road” to seek a better future. Along the way, the Buchholzes praise the Greatest Generation [which] “signed up to ship out to fight Nazis in Germany or the Japanese imperial forces in the Pacific,”  almost seeming to imply that the GI’s fought the battles of Normandy and Iwo Jima  simply to demonstrate their rugged individualism by leaving the parental home.

History tells a different story. Like Millennials, the GI Generation (born 1901-1924) was of a type labeled “civic” by those who study generational change. Like the Millennial Generation, the GI Generation was raised in a protected manner by its parents and even tended to stay with their parents well into adulthood; multi-generational households according to Pew, after all, were far more common—nearly one in four in 1940—than today. This led to complaints about the generation that later became known as the Greatest Generation which sound strikingly like what is said about Millennials today. According to William Strauss and Neil Howe, the creators of generational theory, early in World War II, Army psychiatrists even fretted about “how badly Army recruits had been over-mothered in the years before the war.”

Perhaps as a result of this protected upbringing, the GI Generation also was a “stay-at-home” cohort when its members were young adults. A Pew analysis of US Census data from 1940 indicates that when this generation were all 25-34 year olds about 28% of them lived in multigenerational households, a number almost identical to that of Millennials today. As a result, members of the GI Generation married and had children later than previous or subsequent generations, just as Millennials are doing today. However, once the pressures of depression and war were behind them, the GI Generation more than caught up. It parented the Baby Boom Generation, the largest in American history before Millennials came along. Aided by favorable governmental policies such as the GI Bill and the Federal Housing Administration, it grew the American economy to unprecedented heights, and expanded the American middle class, homeownership, and enjoyed en masse the chance to escape crowded cities for more bucolic suburbs.   

There is every reason to expect achievements from America’s newest civic generation, just as we have seen from previous cohorts of this kind. As was the case with their GI Generation great-grandparents before them, almost all negative social indicators—youthful crime, substance abuse, and out of wedlock teen pregnancy—have fallen to some of the lowest levels in modern history. Meanwhile, positive indicators, such as school test scores and educational achievement, have risen to the highest levels in decades. No less than other generations, Millennials value being good parents, home ownership, having a successful marriage, and helping others in need.  Perhaps the alarmists are wrong. Maybe being “safe at home” especially during times of adversity, is a good thing for young adults, their parents, and the nation.

Morley Winograd and Michael D. Hais are co-authors of the newly published Millennial Momentum: How a New Generation is Remaking America and Millennial Makeover: MySpace, YouTube, and the Future of American Politics and are fellows of NDN and the New Policy Institute.

Mother and son photo by Bigstockphoto.com.


California Recovery: No, It Is Not East vs. West

$
0
0

Every now and then, some East Coast based publication sends a reporter out to California to see how the West Coast's economy is doing.  I think they write these things sitting at a restaurant patio overlooking the Pacific Ocean.  That can be seductive, and lulled into a comfortable sense that all is well with the world, the reporter always gets it wrong. 

The most recent example is this New York Times article.  The second paragraph summarizes the article:

Communities all along the state’s coastline have largely bounced back from the recession, some even prospering with high-tech and export businesses growing and tourism coming back. At the same time, communities from just an hour’s drive inland and stretching all the way to the Nevada and Arizona borders struggle with stubbornly high unemployment and a persistent housing crisis. And the same pattern holds the length of the state, from Oregon to the Mexican frontier.

The next paragraph contains the mandatory quote from California's favorite economic Pollyanna, Steve Levy:

“This is really a tale of two economies,” said Stephen Levy, the director of the Center for Continuing Study of the California Economy. “The coastal areas are either booming or at least doing well, and the areas that were devastated still have a long way to go. The places that existed just for housing are not going to come back anytime soon.”

The article is accompanied by a photo of a couple driving a red Ferrari convertible.  The caption says "Driving through Newport Beach in Orange County. Communities along the coast have largely rebounded from the recession."

This is all nonsense.

There are two reasonable measures of recovery, jobs and real estate values.  You can forget the real estate values measure.  Values throughout California are down from pre-recession highs.  They are down a lot.  Only San Francisco and Marin counties, with median home prices down 27.7 percent and 32.3 percent, respectively, have seen net median home price declines of less than 40 percent.  Monterey and Madera counties top the state in median home price declines, in excess of 67 percent.

So let's use jobs.  An area has recovered if it has as many jobs today as it had at the beginning of the recession, December 2008. 

We monitor 37 California MSAs.  Combined they represent about 96 percent of California's population.  By jobs, only one of California's larger MSAs has recovered, and that county does not fit the story.  Not only is Kings County not on the ocean, it doesn't even border or have a naturally occurring year-round piece of water.  Kings County, with 37,700 jobs, has about 900 more jobs than it had at the beginning of the recession.  Still, Kings County's unemployment rate is 17 percent.  Some recovery!

Orange County, which the New York Times article cites as largely rebounded, is down 127,800 jobs from its pre-recession high.  That's an 8.5 percent decline.  Los Angeles County is down 337,000 or 8.1 percent of jobs.  The difference between unemployment rates, 8.0 percent in Orange County versus 12.1 percent in Los Angeles County, reflects different unemployment levels at the beginning of the recession and the high cost of living in Orange County.  Most people can't afford to be unemployed long in Orange County.  You either find a job, or you leave.

Here are the Counties that have lost, on net, less than 6 percent of jobs in the recession:


County/MSA

Job gain
or Loss

percent change

Unemployment
Rate

Imperial

-100

-0.2%

26.7%

Kings

900

2.4%

17.0%

Merced

-2,800

-4.8%

20.0%

Monterey

-5,600

-4.3%

15.3%

San Diego

-66,400

-5.1%

9.3%

San Francisco
San Mateo
Marin

-33,600

-3.4%

8.0%
7.3%
6.6%

Santa Clara
San Benito

-19,900

-2.1%

8.8%
18.3%

San Luis Obispo

-5,900

-5.7%

8.7%

Santa Barbara

-8,200

-4.7%

8.9%

Santa Cruz

-3,800

-4.1%

13.6%

Solano

-6,100

-4.8%

10.9%


It's hard to find real recovery here.  Three of the sub-10-percent-unemployment-rate counties (Marin, San Luis Obispo, and Santa Barbara) are home to the wealthy, those who serve them, and a very small middle class.  They have not had and will never have anything like robust economies.  Think of them as big Leisure Villages for the terminally fashionable.

That leaves San Diego, San Francisco, San Mateo, and Santa Clara counties as potential vigorous economies.  Let's look at these regions' job creation last month.  Unfortunately, the data are only available by MSA.  San Diego County saw job growth of 1,300 jobs in February, an increase of about 0.11 percent.  Santa Clara/San Benito saw job growth of about 4,100, or 0.46 percent.  San Francisco/San Mateo/Marin saw growth of about 7,100 jobs, or 0.74 percent.

It looks to me like there is a small island of relative prosperity: San Francisco, San Mateo, and Santa Clara Counties, but even these counties have not fully recovered.  This island is indeed on the coast, but it represents just a small fraction of the coastal county population. 

The idea that there is some sort of Coastal resurgence in California is just absurd.  Certainly, the 593,800 still unemployed in Los Angeles --- by far the state’s most populous --- are not likely to agree that “The coastal areas are either booming or at least doing well..."

Bill Watkins is a professor at California Lutheran University and runs the Center for Economic Research and Forecasting, which can be found at clucerf.org.

California coast photo by BigStockPhoto.com.

The Myth of the Republican Party’s Inevitable Decline

$
0
0

The map is shifting, and Democrats see the nation’s rapidly changing demography putting ever more states in play—Barack Obama is hoping to compete in Arizona this year, to go along with his map-changing North Carolina and Indiana wins in 2008—and eventually ensure the party’s dominance in a more diverse America, as Republicans quite literally die out.

Ruy Teixeira and others have pointed to the growing number of voters in key groups that have tilted Democratic: Hispanics, single-member households, and well-educated millennials. Speaking privately at a closed-door Palm Beach fundraiser Sunday, Mitt Romney said that polls showing Obama with a huge lead among Hispanic voters “spell doom for us.”

But, as the fine print says, past results do not guarantee future performance—and there are some surprising countervailing factors that could upset the conventional wisdom of Republican decline.

Let’s start with Hispanics. Straight-line projections suggest an ever-increasing base, as the Latino population shot up (PDF) from 35 million in 2000 to more than 50 million in 2010, accounting for half of all national population growth over the decade. Exit polls showed Democrats winning the vote in each election cycle over that stretch, with Republicans never gaining more than 40 percent of the vote. And the problem is getting worse: a recent Fox News Latino poll showed Obama trouncing Romney, 70–14, among Hispanic voters—even leading among Latinos who backed John McCain in 2008.

But longer term, Hispanic population growth is likely to slow or even recede, and Republicans are likely to do better with the group (in part because it would be hard to do much worse), as assimilation increases and immigration becomes less volatile an issue.

Rates of Hispanic immigration, particularly from Mexico, are down and are likely to continue declining. In the 1990s, 2.76 million Mexicans obtained legal permanent-resident status. That number fell by more than a million in the 2000s, to 1.7 million, according to the Department of Homeland Security. A key reason, little acknowledged by either nativists or multiculturalists, lies in the plummeting birth rate in Mexico, which is mirrored in other Latin American countries. Mexico’s birth rate has declined from 6.8 children per woman in 1970 to about 2 children per woman in 2011.

Plummeting birth rates suggest there will be fewer economic migrants from south of the border in coming decades. In the 1990s Mexico was adding about a million people annually to its labor force. By 2007 this number declined to about 800,000 annually, and it is projected to drop to 300,000 by 2030.

These changes impacted immigration well before the 2008 financial crisis. The number of Mexicans legally coming to the United States plunged from more than 1 million in 2006 to just over 400,000 in 2010, in part because of the 2008 financial crisis here. Illegal immigration has also been falling. Between 2000 and 2004, an estimated 3 million undocumented immigrants entered the country; that number fell by more than two thirds over the next five years, to under 1 million between 2005 and 2009.

Increasingly, our Latino population—almost one in five Americans between 18 and 29—will be made up of people from second- and third-generation families. Between 2000 and 2010, 7.2 million Mexican-Americans were born in the U.S., while just 4.2 million immigrated here.

This shift could spur the faster integration of Latinos into mainstream society, leaving them less distinct from other groups of voters, like the Germans or the Irish, whose ethnicity once seemed politically determinative. A solid majority of Latinos, 54 percent, consider themselves white, according to a recent Pew study, while 40 percent do not identify with any race. Most reject the umbrella term “Latino.” Equally important, those born here tend to use English as their primary language (while just 23 percent of immigrants are fluent in English, that number shoots up to 90 percent among their children).

To be sure, most Latinos these days vote Democratic. But they also tend to be somewhat culturally conservative. Almost all are at least nominally Christian, and roughly one in four is a member of an evangelical church. They also have been moving to the suburbs for the past decade or more—a trend that is of great concern to city-centric Democratic planners.

A more integrated, suburban, and predominantly English-speaking Latino community could benefit a GOP (assuming it eschews stridently nativist platform). After all, it wasn’t so long ago that upward of 40 percent of Latinos voted for the likes of George W. Bush, who won a majority of Latino Protestants.

More than race, family orientation may prove the real dividing line in American politics. Single, never-married women have emerged as one of the groups most devoted to the Democratic party, trailing only black voters, according to Gallup. Some 70 percent of single women voted Democratic in 2008, including 60 percent of white single women.

While the gender gap has been exaggerated, a chasm is emerging between traditional families, on the one hand, and singles and nontraditional families on the other. Married women, for example, still lean Republican. But Democrats dominate in places like Manhattan, where the majority of households are single, along with Washington, D.C., San Francisco, and Seattle.

In recent years Republican gains, according to Gallup, have taken place primarily among white families. Not surprisingly, Republicans generally do best where the traditional nuclear family is most common, such as in the largely suburban (and fairly affordable) expanses around Houston, Dallas, and Salt Lake City.

To be sure, Democrats can take some solace, at least in the short run, from the rise in the number of singletons. Over the past 30 years the proportion of women in their 40s who have never had children has doubled, to nearly one in five. Singles now number more than 31 million, up from 27 million in 2000—a growth rate nearly twice that of the overall population. And only one in five millennials is married, half that of their parents’ generation.

Yet as with Latino immigration, the trend toward singlehood is unlikely to continue unabated. Demographic analyst Neil Howe notes that living alone has been more pronounced among boomers (born 46–64) than millennials (born after 1980) at similar ages. Assuming marriage is delayed rather than dropped, it remains to be seen if the former singletons will maintain their liberal allegiance.

Varying birth rates also suggest that the Democrat-dominated future may be a pipe dream. Since progressives and secularists tend to have fewer children than more religiously oriented voters, who tend to vote Republican, the future America will see a greater share of people raised from fecund groups such as Mormons and Orthodox Jews. Needless to say, there won’t be as many offspring from the hip, urban singles crowd so critical to Democratic calculations.

And millennials are already more nuanced in their politics than is widely appreciated. They favor social progressivism, according to Pew, but not when it contradicts community values. Diversity is largely accepted and encouraged, but lacks the totemic significance assigned to it by boomer activists. They are environmentally sensitive but, contrary to new urbanist assertions, are more likely than their boomer parents to aspire to suburbia as their “ideal place” to live.

Some economic trends favor Republicans. Households, for example, are increasingly more dependent on self-employment, and the number relying on a government job is dropping as deficits and ballooning pension obligations force cuts in government payrolls. Republicans would do well to focus on these predominately suburban, private-sector-dependent families.

All this suggests that if they can achieve sentience, Republicans could still compete in a changing America continues changing. But first the party must move away from the hard-core nativist, authoritarian conservatism so evident in the primaries. Rather than looking backward to the 1950s, the GOP needs to reinvent itself as the party of contemporary families, including minority, mixed-race, gay, and blended ones.

This piece originally appeared in The Daily Beast.

Joel Kotkin is executive editor of NewGeography.com and is a distinguished presidential fellow in urban futures at Chapman University, and contributing editor to the City Journal in New York. He is author of The City: A Global History. His newest book is The Next Hundred Million: America in 2050, released in February, 2010.

Voter sign photo by BigStockPhoto.com.

California Declares War on Suburbia II: The Cost of Radical Densification

$
0
0

My April 9 Cross Country column commentary in The Wall Street Journal (California Declares War on Suburbia) outlined California's determination to virtually outlaw new detached housing. The goal is clear:    force most new residents into multi-family buildings at 20 and 30 or more to the acre. California's overly harsh land use regulations had already driven housing affordability from fairly typical levels to twice and even three times higher than that of much of the nation. California's more recent tightening of the land use restrictions (under Assembly Bill 32 and Senate Bill 375) has been justified as necessary for reducing greenhouse gas (GHG) emissions.

It is All Unnecessary: The reality, however, is that all of this is unnecessary and that sufficient GHG emission reductions can be achieved without interfering with how people live their lives. As a report by the McKinsey Company and The Conference Board put it, there would need to be "no downsizing of vehicles, homes or commercial space," while "traveling the same mileage." Nor, as McKinsey and the Conference Board found, would there be a need for a "shift to denser urban housing." All of this has been lost on California's crusade against the lifestyle most Californians households prefer.

Pro and Con: As is to be expected, there are opinions on both sides of the issue. PJTV used California Declares War on Suburbia as the basis for a satirical video, Another Pleasant Valley Sunday, Without Cars or Houses? Is California Banning Suburbia?

California's Increasing Demand for Detached Housing? A letter to the editor in The Wall Street Journal suggested that there are more than enough single-family homes to accommodate future detached housing demand in California for the next 25 years. That's irrelevant, because California has no intention of allowing any such demand to be met.

The data indicates continuing robust demand. In California's major metropolitan areas, detached houses accounted for 80 percent of the additions to the occupied housing stock between 2000 and 2010, which slightly exceeds the national trend favoring detached housing (Figure 1). If anything, the shift in demand was the opposite predicted by planners, since only 54 percent of growth in occupied housing in the same metropolitan areas was detached in 2000 (Figure 2).


Watch What they Do, Not What they Say: It does no good to point to stated preference surveys indicating people preferring higher density living. Recently, Ed Braddy noted in newgeography.com (Smart Growth and the New Newspeak) that a widely cited National Association of Realtors had been "spun" to show that people preferred higher density living, from a question on an "unrealistic scenario," and ignoring an overwhelming preference for detached housing – roughly eighty percent – in other questions in the same survey. People's preferences are not determined by what they say they will do, but rather by what they do.

Off-Point Criticism: There was also "off-point" criticism, which can be more abundant than criticisms that are "on-point." Perhaps the most curious was by Brookings Institution Metropolitan Policy Program Senior Researcher Jonathan Rothwell (writing in The New Republic) in a piece entitled "Low-Density Suburbs are Are Not Free-Market Capitalism." I was rather taken aback by this, since none of these three words ("free," "market" or "capitalism") appeared in California Declares War on Suburbia. I was even more surprised at the claim that I defend "anti-density zoning and other forms of large lot protectionism." Not so.

Indeed, I agree with Rothwell on the problems with large lot zoning. However, it is a stretch to suggest, as he does, that the prevalence of detached housing results from large lot zoning. This is particularly true in places like Southern California where lots have historically been small and whose overall density is far higher than that of greater New York, Boston, Seattle and double that of the planning mecca of Portland.

Rothwell’s own Brookings Institution has compiled perhaps the best inventory of metropolitan land use restrictions, which indicates that the major metropolitan areas of the West have little in large lot zoning. Yet detached housing is about as prevalent in the West as in the rest of the nation (60.4 percent in the West compared to 61.9 percent in the rest of the nation, according to the 2010 American Community Survey). Further, there has been little or no large lot zoning in Canada and Australia, where detached housing is detached, nor in Western Europe and Japan (yes, Japan, see the Note below).  

On-Point: Urban Growth Boundaries Do Increase House Prices: However, to his credit, Rothwell points out the connection between urban growth boundaries and higher house prices. This is a view not shared by most in the urban planning community, who remain in denial of the economic evidence (or more accurately, the economic principle) that constraining supply leads to higher prices. This can lead to disastrous consequences, as California's devastating role in triggering the Great Recession indicates.

The Purpose of Urban Areas: From 1900 to 2010, the urban population increased from 40 percent to 80 percent of the US population. Approximately 95 percent of the population growth over 100 years was in urban areas. People did not move to urban areas the cities for "togetherness" or to become better citizens. Nor did people move out of an insatiable desire for better urban design or planning. The driving force was economic: the desire for higher incomes and better lives. A former World Bank principal urban planner, Alain Bertaud stated the economic justification directly: "large labor markets are the only raison d’être of large cities."

And for the vast majority of Americans in metropolitan areas, including those in California, those better lives mean living in suburbs and detached houses. All the myth-making in the world won’t change that reality, even if it pushes people out of the Golden State to other, more accommodating pastures.

The performance of urban areas is appropriately evaluated by results, such as economic outcomes, without regard to inputs, such as the extent to which an area conforms to the latest conventional wisdom in urban planning.

  • Land use policies should not lead to higher housing costs relative to incomes, as they already have in California, Australia, Vancouver, Toronto and elsewhere. If they do, residents are less well served.
  • Transport policies should not be allowed to intensify traffic congestion by disproportionately funding alternatives (such as transit and bicycles) that have little or no potential to improve mobility as seems the likely outcome of radical densification. If they do, residents will be less well served.

This gets to the very heart of the debate. The "smart growth on steroids" policies now being implemented in California are likely to lead to urban areas with less efficient personal and job mobility, where economic and employment growth is likely to be less than would otherwise be expected. The issue is not urban sprawl. The issue is rather sustaining the middle-income quality of life, which is now endangered by public policy in California, and for no good reason.

Wendell Cox is a Visiting Professor, Conservatoire National des Arts et Metiers, Paris and the author of “War on the Dream: How Anti-Sprawl Policy Threatens the Quality of Life

----

Note: Despite its reputation for high density living, Japan's suburbs have many millions of detached houses. In 2010, 47 percent of the occupied housing in Japan's major metropolitan areas was detached (Tokyo, Osaka-Kobe-Kyoto, Nagoya, Sapporo, Sendai, Hiroshima, Kitakyushu-Fukuoka, Shizuoka and Hamamatsu).

Photo: An endangered species: Detached houses in Ventura County (Photo by author)

Census Estimates: Slowing Metropolitan Growth and the Future of the Exurbs

$
0
0

Recently the Census Bureau released 2011 county and metro area population estimates that showed overall slowing population growth and particularly showing slow to halting growth in exurban counties.

Someone once said to me about Chicago’s Mayor Daley that if he did something you liked, he was a visionary genius leader, but if he did something you hated, he was a corrupt machine dictator.

That seems to be how too many urbanists view the Census Bureau.

I’ll come back to the exurbs in a minute, but first a look at a map of metro area growth last year:


Metro area percent change in population, July 1, 2010 to July 1, 2011. Source: Census Estimates via Telestrian

Here’s the county map:


County percent change in population, July 1, 2010 to July 1, 2011. Source: Census Estimates via Telestrian

Someone once said to me about Chicago’s Mayor Daley that if he did something you liked, he was a visionary genius leader, but if he did something you hated, he was a corrupt machine dictator.

That seems to be how too many urbanists view the Census Bureau.

Back in the 90s when the Census estimates showed cities growing more slowly than boosters believed, they pressured the Census Bureau into adjusting the estimates to provide higher values. As it turned out, in most cases even the original estimates for cities proved inflated. In fact, the 90s were actually better for a lot of major cities than the 2000s were (e.g, New York, Los Angeles, and Chicago). This led to a new narrative that the Census had undercounted cities somehow.

Now this new data shows slowing exurban growth. All of a sudden, the Census Bureau has become once more a source of Gospel Truth, and I’ve seen many articles suggesting that the exurbs are dead, killed by rising gas prices and new Millennial preferences.

Let’s not get ahead of ourselves here.

Yes, exurban growth slowed recently. While cities on the whole fared more poorly than expected in the last census, we did see strong growth in downtowns and adjacent areas. I myself wrote about improving migration trends for core cities. That’s good news worth celebrating for cities. But don’t overstate the case.

I have a different though admittedly speculative take on the exurbs. I think a chunk of the fringe migration was from very low end home builders skipping out beyond established jurisdictions into unincorporated territory with few buildings restrictions. They threw up dirt cheap homes there and often sold them to people with marginal credit and income who had no business buying homes, using a variety of gimmicks to do so. (I know someone who sold homes for one of these builders, so I heard about some of these). Loose credit policies and government guarantees fueled this. The housing crash killed this market. Now that subsidies for this type of growth aren’t available, so that market is probably never coming back.

But when the economy improves and the market normalizes, I’d expect some level of suburbanization to resume. Part of the logic is simple math. If you add up the population of the municipalities of New York City, Los Angeles, Chicago, Philadelphia, San Francisco, Boston, Seattle, Washington, Portland, and Miami you only get 20 million people. That’s only about 20% of what the Census Bureau is projecting for just population growth by 2050. With the difficulties of building in urban areas, there’s no way to accommodate just the new growth even if everybody wanted into the city. In other words, there’s just no way there is going to be some massive back to the city movement. I hate to break it to you, but that’s reality.

Here’s the full list of large metros, sorted by population growth percentage:

Row Metro Area 2010 2011 Total Change Pct Change
1 Austin-Round Rock-San Marcos, TX
1,728,247
1,783,519
55,272
3.20%
2 Raleigh-Cary, NC
1,137,297
1,163,515
26,218
2.31%
3 Dallas-Fort Worth-Arlington, TX
6,400,511
6,526,548
126,037
1.97%
4 San Antonio-New Braunfels, TX
2,153,891
2,194,927
41,036
1.91%
5 Houston-Sugar Land-Baytown, TX
5,976,470
6,086,538
110,068
1.84%
6 Charlotte-Gastonia-Rock Hill, NC-SC
1,763,969
1,795,472
31,503
1.79%
7 Denver-Aurora-Broomfield, CO
2,554,569
2,599,504
44,935
1.76%
8 Washington-Arlington-Alexandria, DC-VA-MD-WV
5,609,150
5,703,948
94,798
1.69%
9 Miami-Fort Lauderdale-Pompano Beach, FL
5,578,080
5,670,125
92,045
1.65%
10 Oklahoma City, OK
1,258,111
1,278,053
19,942
1.59%
11 Salt Lake City, UT
1,128,269
1,145,905
17,636
1.56%
12 Seattle-Tacoma-Bellevue, WA
3,447,886
3,500,026
52,140
1.51%
13 New Orleans-Metairie-Kenner, LA
1,173,572
1,191,089
17,517
1.49%
14 Orlando-Kissimmee-Sanford, FL
2,139,615
2,171,360
31,745
1.48%
15 Riverside-San Bernardino-Ontario, CA
4,245,005
4,304,997
59,992
1.41%
16 Nashville-Davidson–Murfreesboro–Franklin, TN
1,594,885
1,617,142
22,257
1.40%
17 Atlanta-Sandy Springs-Marietta, GA
5,286,296
5,359,205
72,909
1.38%
18 Portland-Vancouver-Hillsboro, OR-WA
2,232,896
2,262,605
29,709
1.33%
19 Tampa-St. Petersburg-Clearwater, FL
2,788,151
2,824,724
36,573
1.31%
20 Phoenix-Mesa-Glendale, AZ
4,209,070
4,263,236
54,166
1.29%
21 San Jose-Sunnyvale-Santa Clara, CA
1,841,787
1,865,450
23,663
1.28%
22 San Diego-Carlsbad-San Marcos, CA
3,105,115
3,140,069
34,954
1.13%
23 San Francisco-Oakland-Fremont, CA
4,343,381
4,391,037
47,656
1.10%
24 Indianapolis-Carmel, IN
1,760,826
1,778,568
17,742
1.01%
25 Sacramento–Arden-Arcade–Roseville, CA
2,154,583
2,176,235
21,652
1.00%
26 Minneapolis-St. Paul-Bloomington, MN-WI
3,285,913
3,318,486
32,573
0.99%
27 Columbus, OH
1,840,584
1,858,464
17,880
0.97%
28 Jacksonville, FL
1,348,702
1,360,251
11,549
0.86%
29 Las Vegas-Paradise, NV
1,953,927
1,969,975
16,048
0.82%
30 Los Angeles-Long Beach-Santa Ana, CA
12,844,371
12,944,801
100,430
0.78%
31 Richmond, VA
1,260,396
1,269,380
8,984
0.71%
32 Louisville/Jefferson County, KY-IN
1,285,891
1,294,849
8,958
0.70%
33 Boston-Cambridge-Quincy, MA-NH
4,559,372
4,591,112
31,740
0.70%
34 Kansas City, MO-KS
2,039,766
2,052,676
12,910
0.63%
35 Memphis, TN-MS-AR
1,318,089
1,325,605
7,516
0.57%
36 Baltimore-Towson, MD
2,714,546
2,729,110
14,564
0.54%
37 New York-Northern New Jersey-Long Island, NY-NJ-PA
18,919,649
19,015,900
96,251
0.51%
38 Philadelphia-Camden-Wilmington, PA-NJ-DE-MD
5,971,589
5,992,414
20,825
0.35%
39 Chicago-Joliet-Naperville, IL-IN-WI
9,472,584
9,504,753
32,169
0.34%
40 Milwaukee-Waukesha-West Allis, WI
1,556,953
1,562,216
5,263
0.34%
41 Virginia Beach-Norfolk-Newport News, VA-NC
1,674,502
1,679,894
5,392
0.32%
42 Birmingham-Hoover, AL
1,129,068
1,132,264
3,196
0.28%
43 Cincinnati-Middletown, OH-KY-IN
2,132,415
2,138,038
5,623
0.26%
44 St. Louis, MO-IL
2,814,722
2,817,355
2,633
0.09%
45 Pittsburgh, PA
2,357,951
2,359,746
1,795
0.08%
46 Hartford-West Hartford-East Hartford, CT
1,212,491
1,213,255
764
0.06%
47 Rochester, NY
1,054,723
1,055,278
555
0.05%
48 Providence-New Bedford-Fall River, RI-MA
1,601,065
1,600,224
-841
-0.05%
49 Buffalo-Niagara Falls, NY
1,135,293
1,134,039
-1,254
-0.11%
50 Detroit-Warren-Livonia, MI
4,290,722
4,285,832
-4,890
-0.11%
51 Cleveland-Elyria-Mentor, OH
2,075,540
2,068,283
-7,257
-0.35%


Aaron M. Renn is an independent writer on urban affairs based in the Midwest. His writings appear at The Urbanophile, where this piece originally appeared. Renn is the founder of Telestrian, a data analysis and mapping tool used to create the maps seen here.

As Filmmaking Surges, New Orleans Challenges Los Angeles

$
0
0

For generations New Orleans‘ appeal to artists, musicians and writers did little to dispel the city’s image as a poor, albeit fun-loving, bohemian tourism haven. As was made all too evident by Katrina, the city was plagued by enormous class and racial divisions, corruption and some of the lowest average wages in the country.

Yet recently, the Big Easy and the state of Louisiana have managed to turn the region’s creative energy into something of an economic driver. Aided by generous production incentives, the state has enjoyed among the biggest increases in new film production anywhere in the nation. At a time when production nationally has been down, the number of TV and film productions shot in Louisiana tripled from 33 per year in 2002-2007 to an average of 92 annually in 2008-2010, according to a study by BaxStarr Consulting. Movies starring Leonardo DiCaprio, Morgan Freeman, Harrison Ford are being made in the state this year.

Of course many states and cities have thrown money at the film industry, hoping to establish themselves as cultural centers. Texas, Georgia, British Columbia, Toronto and Michigan all wagered millions in tax dollars to lure producers away from Hollywood and the industry’s secondary hub of New York. There were 279 movies shot in New York State in 2009 and 2010. For all its gains, Louisiana still trails far behind the Empire State with 95 film productions in that period.

Yet New Orleans and Louisiana possess unique assets which make its challenge far more serious than that of other places. A Detroit, Atlanta or Dallas might be a convenient and cost-efficient place to make a film or television show, but they lack the essential cultural richness that can lure creative people to stay. The Big Easy is attracting that type, plus post-production startups, and animation and videogame outfits, giving a broader foundation to the nascent local entertainment industry.

“This is different,” notes Los Angeles native and longtime Hollywood costumer Wingate Jones, who started Southern Costume Co. last year to cash in on the growth in production in the state. “It’s the combination of the food and the culture that appeals to people. It must have been a lot like what Hollywood was like in the ’20s and ’30s. It’s entrepreneurial and growing like mad.”

Critically, Jones adds, Louisiana’s unique culture comes without the fancy New York or Malibu price tag. This is a place where small roadside cafes serve up bowls of gumbo, crayfish and shrimp that would cost three to five times as much in New York, the Bay Area or Los Angeles. Excellent music — from rap to jazz to blues and gospel — can be found simply by walking into a bar and paying the price of a couple of beers. And then there are housing costs, roughly half as high, adjusted for income, than the big media centers.

This mixture of affordability and culture is attracting young people — the raw material of the creative economy — as well as industry veterans like Jones. In 2011, we examined migration patterns of the college-educated and found, to our surprise, that New Orleans was the country’s leading brain magnet. New Orleans was growing its educated base, on a per capita basis, at a far faster rate than much-ballyhooed, self-celebrated places like New York or San Francisco. In fact, its most intense competition was coming from other Southern cities such as Raleigh, Austin and Nashville, the last two of which also share a strong, and unique, regional culture.

Another sure sign of the city’s growing appeal has been a torrent of applications to Tulane University, the city’s premier institution of higher education. In 2010 the school received 44,000 applications, more than any other private university in the country. The largest group, more than even those from Louisiana, came from California, with New York and Texas not far behind.

Increasingly, the Big Easy merits comparison not only to the Hollywood of the 1920s but also Greenwich Village of the ’50s, Haight-Ashbury in the ’60s and “grunge” Seattle in the mid-’80s. These, too, were once appealing places that were less expensive, less predictable and more open to cultural outsiders. Now they’re increasingly too pricey and yuppified for creative people bereft of large trust funds.

Ironically, Katrina provided the critical spark for this transformation. It devastated the torpid, corrupt political and business culture that viewed the arts as quaint and fit only as a selling point for tourists. In its place came more business-minded administrations in New Orleans and in Baton Rouge, the state capital. In both places, economic developers seized on motion pictures, television, commercials and videogames as potential growth industries that fit well with the state’s expanding appeal to this generation’s creators.

This piece originally appeared in Forbes.com.

Joel Kotkin is executive editor of NewGeography.com and is a distinguished presidential fellow in urban futures at Chapman University, and contributing editor to the City Journal in New York. He is author of The City: A Global History. His newest book is The Next Hundred Million: America in 2050, released in February, 2010.

New Orleans Jazz Band photo by BigStockPhoto.com.

Review: The Great Inversion and the Future of the American City

$
0
0

Is gentrification the “fifth great migration,” that will fill old downtowns with upper-middle-class white folks, while the tract mansions of the outer ring become slums for immigrants? So suggests Alan Ehrenhalt, the former executive editor of Governing magazine. In The Great Inversion and the Future of the American City, he proposes that a demographic shift is under way that is reversing generations of suburbanization and white flight.

This book will gain Ehrenhalt nothing but friends, admirers, and speaking engagements among the New Urbanist set, just as Richard Florida, perhaps today’s best-known urban theorist, has made a good living with his work. Ehrenhalt believes that “the massive outward migration of the affluent that characterized the second half of the 20th century is coming to an end.” Soon, he predicts, scarcely anyone “will be buying large, detached single family houses 30 miles from the city limits.” And, more specifically, “Chicago in 2030 will look more like the Paris of 1910 than like the Detroit of 1970.”

As corroboration of this vision of the future, he notes the undeniable fact that the ’burbs have not been lily white for decades. Their good jobs, good schools, property values, and low crime rates continue to attract great numbers of hard-working, middle-class Africa Americans and immigrants. Meanwhile, as some inner-city neighborhoods become safer, they are drawing the market segment that developers refer to as “the risk oblivious.” Often, these are intrepid young white people without school-age children who recognize that it was always nuts to ignore the marvelous real estate near the old downtowns. Frequently, they are followed by the somewhat less adventurous and more affluent.

For those of us who have long admired Ehrenhalt’s astuteness, however, this book’s theme is undercut by some real head scratchers: His “great inversion” thesis isn’t supported by the 2010 Census data, the location of high paying white-collar jobs, or the rise of the Internet as a social and economic force.

As demographer Wendell Cox and others have noted, suburbs are capturing a growing share of the population increase in the nation’s major metropolitan areas. “Historical core municipalities accounted for nine percent of metropolitan area growth between 2000 and 2010,” Cox writes, “compared to 15 percent in the 1990–2000 period. Overall, suburban areas captured 91 percent of metropolitan area population growth between 2000 and 2010, compared to 85 percent between 1990 and 2000.”

The old real estate mantra “location, location, location” applies to American jobs, too. If you imagined the map of the Washington, D.C., metropolitan area as a waiter’s tray, with each white-collar job assigned the same weight, you’d discover that the balance point was just east of the “edge city” of Tysons Corner in Fairfax County, Virginia. New residential areas such as wealthy Loudoun County, Virginia, are booming because of their proximity to concentrations of high-paying jobs around Dulles International Airport, Reston, Fair Oaks, and Tysons. People living in these areas can go years without visiting the District of Columbia, much less commuting to it.

Because the Internet is, in effect, a transportation device, it is transforming the built environment. There are nearly 100 classes of real estate—including grocery stores, warehouses, and offices—from which cities are built, noted the late urban theorist William J. Mitchell of MIT. All are being transfigured more swiftly and dramatically than they were by the rise of the automobile.

In addition, the Internet is, counterintuitively, putting a new value on face-to-face contact. This has led to the rise of village-like places where people can easily meet. Some are embedded in old downtowns—the sort of places Ehrenhalt cites, such as Chicago’s University Village. Some are part of what traditionally have been regarded as suburbs. But the fastest-growing segment consists of places such as Santa Fe, New Mexico. Home to a world-renowned opera, charming architecture, distinguished restaurants, quirky bookstores, sensational desert and mountain vistas, and a great deal of diversity, Santa Fe, with a population of 68,000, is also little more than a village, far from the nearest metropolis. It represents aggregation and dispersal.

If and when real estate begins to increase in value, it may be instructive to look at the metropolitan areas that were appreciating fastest before the recent crash. Number one was Wenatchee, Washington. On the dry, east side of the Cascade Range, it has lots of sunshine, great skiing, and beautiful views, and thus attracted a lot of hip people who brought with them the arts, cafés and restaurants, and increased educational opportunities. Then came the Seattle-area software people, who extended their outdoorsy weekends using cell phones and laptops to stay in touch with the office, eventually moving there and starting their own businesses. Almost the entire top-20 list of fast appreciating metro areas similarly became urbane without really becoming urban.

Ehrenhalt is absolutely correct that “we are moving toward a society in which millions of people with substantial earning power or ample savings will have the option of living wherever they want.” Whether that choice will amount to a great inversion, in which the roles of cities and suburbs “will very nearly reverse themselves,” remains to be seen.

© 2012 Joel Garreau as first published in The Wilson Quarterly.

Joel Garreau’s is the Lincoln Professor of Law, Culture, and Values at the Sandra Day O’Connor College of Law at Arizona State University and aFuture Tense Fellow at the New America Foundation. His books include Edge City: Life on the New Frontier (1991) and Radical Evolution: The Promise and Peril of Enhancing Our Minds, Our Bodies—and What It Means to Be Human (2005). He is Director of “The Prevail Project: Wise Governance for Challenging Futures.”

Megalopolis and its Rivals

$
0
0

Jean Gottman in 1961 coined the term megalopolis (Megalopolis, the Urbanized Northeastern Seaboard of the Unites States) to describe the massive concentration of population extending from the core of New York north beyond Boston and south encompassing Washington DC. It has been widely studied and mapped, including by me. (Morrill, 2006, Classic Map Revisited, Professional Geographer).  The concept has also been extended to describe and compare many other large conurbations around the world.

Maybe it’s time to see how the original has fared?   And what has happened to other metropolitan complexes in the US, most notably Los Angeles, San Francisco, Chicago and should we say Florida?


Table 1 summarizes the population of Megalopolis from 1950 to 2010 and Table 2 compares Megalopolis with other US mega-urban complexes.  Megalopolis grew fastest in the 1950s and 1960s, with growth rates of 20 and 18.5 percent. The  northeast has since been outpaced by the growth in other regions, but growth was still substantial in the last decade. Megalopolis added almost 3 million people, by 6.8 %, to reach an amazing 45.2 million.


Table 1: Growth of Megalopolis 1950-2010
Year Population Change % Change
2010 45,357 2,983 7
2000 42,374 5,794 15.8
1990 36,580 2,215 6.4
1980 34,365 360 1.2
1970 34,005 5,436 18.5
1960 29,441 4,910 20
1950 24,534

From Table 2 I note four major subregions of Megalopolis: Boston, New York, Philadelphia and Washington, DC. New York is still the biggest player, but the locus of growth over time has shifted South. This reflects the increasing world importance of Washington, DC. New York’s almost 20 million may not surprise, but the fact that greater Boston has grown to almost 9.5 million may be more surprising.  The Washington-Baltimore area grew by far the fastest at almost 15 percent (not much sign of shrinkage of government!). In contrast New York, Boston and Philadelphia’s growth was relatively paltry.


Table 2: Megalopolis and Its Rivals
Place
2010 Pop
2000 Pop
Change
% change
Megalopolis
  New York 19,923 19,209 717 3.7
  Boston   9,445 8,967 478 5.3
  Philadelphia 8,415 76,781 773 9.5
  Baltimore-Washingt 7,403 7,681 960 14.9
All 45,181 42,302 2,888 6.8
Chicago 10,817 10,305 512 5
Los Angeles 12,151 11,789 362 3.1
  Central 903 857 46 5.4
  North 928 634 294 46
  East 2,884 2,105 475 37
  South 3,543 3,210 337 10.4
All Los Angeles 20,404 18,599 1,810 9.8
San Francisco-Sacramento
  San Francisco 7,330 6,946 384 5.5
  Sacramento 3,171 2,604 572 22
All San Francisco-Sacramento 10,501 9,550 951 10
Florida
  Miami 6,027 5,311 716 13.5
  Tampa 4,818 3,894 974 25.3
  Orlando 2,915 2,193 722 33
  Jacksonville 1,483 1,191 2,242 24.5
All Florida 15,243 12,544 2,699 21.5

Greater Los Angeles is the second largest conurbation, with some 20.4 million, growing by 1.8 million, and 10 percent from 2000. In the table I distinguish between the core Los Angeles urbanized area and the satellite urbanized areas west, north, south and east. The core LA area grew by only 3 percent, while the spillover areas to the north and east had astonishing growth, at 46 and 37 percent over the decade.  These include several places with a fairly long history, such as Riverside and San Bernardino, San Diego and Santa Barbara, but many are rapidly growing large suburbs and exurbs, a spillover of growth from the Los Angeles core. Much of the fastest growth has been in  Mission Viejo, Murietta-Temecula, Indio, Lancaster, Santa Clarita and Thousand Oaks.

For greater San Francisco, I distinguish two subregions, the Bay area of San Francisco-San Jose (west) and Sacramento (central valley).  Some might consider these totally distinct, but they have become one in a conurbation sense, as evidenced by commuting patterns. Many people live in the less costly Central Valley area but commute to the expensive Bay Area cities. Together, the conurbation is now 10.5 million, up 10 percent from 2000. The central valley (Sacramento) portion grew far more rapidly than San Francisco-San Jose (22 percent compared to 5.5 percent).  

Compared to its rivals the Chicago conurbation has grown less rapidly but is still large, with a population of 10.8 million in 2010 , growing 512,000 (5 percent) since 2000.  Chicago and Milwaukee are the well-known core cities, but there are also less well known components with far faster growth such as Round Lake-McHenry and West Bend, WI.   

Florida

The more interesting and difficult conurbation to try to define is what might be called the Florida archipelago. Greater Miami has long been recognized as a conurbation, but I contend that virtually all the urbanized areas of the state are in effect a complex web of urban settlement, with little clear demarcation. This is in part a reflection of   rapid and expansive  growth.  Nevertheless it makes sense to recognize four sub-regions, centered on Miami, Tampa-St. Petersburg, Orlando and Jacksonville. 

Together these areas have reached an astonishing 15.2 million, up 2.7 million or 21.5 percent in one decade.  Because settlement is spread across the state in such a web-like fashion with no single dominant center, they constitute a newish form of urban concentration. Besides the well-known centers such as   Miami, Tampa-St. Petersburg ), Orlando and Jacksonville,  there are many satellite cities, often quite large. These include North Port, Cape Coral  encompassing older Ft. Meyers, Bonita Springs, Kissimmee, Palm Bay-Melbourne, Palm Coast-Daytona, and Port St. Lucie.  An interesting but hard to answer question is how much of Florida’s phenomenal growth is a result of transfer of people and accumulated wealth from the North (and especially from the original Megalopolis).

The United States is a large and diverse country, with many other giant cities and a vast countryside. But it is important to realize the importance of these megalopolitan areas, with an aggregate population of 102.6 million, one third of the nation’s population.

What’s next? Look for the rise of now just somewhat smaller conurbations such as Houston, Dallas, Atlanta, Minneapolis, Seattle, Phoenix, and Denver. In terms of numbers and rates of growth Texas is a front runner, but its stars do not coalesce into a megalopolis, at least not yet. The belt of urban growth from Atlanta, through Greenville, SC, Charlotte to Raleigh-Durham is also a likely future conurbation candidate.

Richard Morrill is Professor Emeritus of Geography and Environmental Studies, University of Washington. His research interests include: political geography (voting behavior, redistricting, local governance), population/demography/settlement/migration, urban geography and planning, urban transportation (i.e., old fashioned generalist).


Goodbye, Chicago

$
0
0

Odd as it may seem for someone known as The Urbanophile, I actually grew up in the countryside. I spent most of my childhood on a country road about four miles outside the town of Laconia, Indiana, population 50.  I always used to get confused when John Cougar sang about living in a small town, because I knew he was from Seymour, and with over 15,000 people that seemed a big town in my book.

Today I still laugh at these urbanites who brag about their green ways like having “rain barrels” to catch reclaimed rainwater from the roof for watering their yard.  For many years that's what I drank growing up, as we didn't have city water supplies and had to rely on our cistern.

After graduating high school I went to Indiana University. Then armed with my bachelors it was on to Chicago, the result of an accident: that’s where my job offer came from.  I had no strong feelings on where to live other than that I didn't want to go back to my home town. In Chicago I ended up, like many young professionals, in the Lincoln Park neighborhood on the North Side. Though this too was pretty much an accident. I had relatives who lived there and invited me to stay with them when looking for an apartment.

For many people from small town or suburban environments, going to college is a time of tremendous personal transformation and growth. I didn't have that experience. For me, the great transformation came from moving to Chicago. Exiting the L in the Loop on my first day going to work, wearing a suit, surrounded by tall buildings and crowds of people, I felt like I was on the set of a movie. It was an almost surreal experience.

Though urban life was new to me, I fell in love with it. And I was transformed by the experience. I knew nothing about culture, food, fashion, architecture, actually relating to people with different backgrounds from me, traveling, or how to get around in anything other than a car.  Beyond merely learning how to go to work every day, living in Chicago provided a non-stop stream of stimulating and educational experiences that helped me grow as a person.

But it wasn’t just me who was being  transformed. The urban renaissance of Chicago was underway by the time I arrived in 1992, but it was very early in the process. I recall recruiters for the company I worked for bragging about how Chicago was now an outpost of that uber-hip coffee chain Starbucks. The gentrified areas were still largely confined to a narrow strip along the north Lakefront. Many of the places that later became yuppie playgrounds were then ethnic enclaves or undeveloped. Some were still close to slums.  On the outer reaches of Lincoln Park itself, streetwalkers openly plied their trade along North Ave.

The 90s were heady a heady decade for  Chicago. The city, like select other major urban metros around the country, exploded with new growth and attracted many new migrants. Chicago experienced perhaps the largest urban condo building boom in America, transforming huge tracts of the city.  The quality on offer improved radically.  The population increased, and the city even added more jobs than Houston. It was a great time to be a Chicagoan, and I enjoyed every minute of it.

But come the 2000s, the condo boom continued but an economic and political malaise  had clearly set in. Even new mayor Rahm Emanuel has labeled it a lost decade. As the decade ended, I had increasingly made up my mind to leave the city, now the place where I'd spend nearly as many years as my native Indiana. Early this year, I left Chicago behind.

What made me decide to leave?  There are a few factors, some more personal than others.

The first is that I simply had done Chicago. The Chicago experience had been transformational when I got there, but after nearly 20 years it was getting stale. It was just more of the same. It was time for new challenges.

I was also motivated by the bleak economy. I owned a condo, an  anchor that left me at great risk of getting marooned in the city, a phenomenon recently written about by Crain's Chicago Business. I was willing to sell near the bottom of the market to avoid the risk of getting stranded. There is no clear sense of an imminent major turnaround. There are huge unfunded liabilities at all levels of government in the region and state. The city’s economy seems to have lost a clear raison d'etre. No longer the “city of big shoulders”, it is losing out to urban areas with stronger economic identities --- New York, San Francisco, Los Angeles, Washington and, even emerging cities like Houston.  So in the end I decided it was worth paying a “breakup penalty” to get out. Interestingly, no one, not even my alderman, suggested I was wrong in this.

Lastly, I no longer saw Chicago as a good platform for my personal ambitions. The city likes to see itself as occupying a “sweet spot” as a legitimate urban oriented big city with a lower price tag and higher quality of life. Yet for me Chicago was a “sour spot” that offered neither the opportunities of say a New York, Washington, or San Francisco, but still came with a high price tag. I would rather live in a small city that’s dirt cheap where I can have more impact, or in a place like New York where the cost of living might be greater, but the opportunities are matchless.

That is ultimately where the city will stand or fall. I'm but one example, but it's a decision repeated with various results day after day: is this where I'll plant my flag, seek my fortune and dreams, raise my family, or build my business?  Chicago has to be seen as a success platform for both people and businesses. The demographic and economic results of the 2000s suggest it is losing that battle for the moment, though given the 90s results, it is certainly possible to think that might change again tomorrow.

As for me, Chicago will always hold a special place in my heart and I'll treasure my experiences there.   But for now it's on to new adventures.

Aaron M. Renn is an independent writer on urban affairs and the founder of Telestrian, a data analysis and mapping tool. His writings appear at The Urbanophile.

Chicago skyline photo by Bigstockphoto.com.

Homebuilding: Recovery & Red Tape

$
0
0

The Recovery Blueprint is a multipart series of articles that offers suggestions on how to recover from the homebuilding recession.

Since the recession began, there haven't been any significant changes in how regulations could be improved to energize the housing market and foster innovation. Three areas where big regulation changes are needed? Environmental subsidies, density requirements, and zoning laws.

Environmental Incentives: Repeating the mistakes of the Carter era, federal and state governments have thrown vast sums of tax money at ‘green’ solutions likely to fail. A massive amount of our nation’s total energy use seeps out of inefficient housing, draining families of income at a time when they can least afford it. The subsidization of inefficient construction that incorporates energy saving alternatives is as flawed today as it was 25 years ago. Federal and state credits allow funding for improvements such as insulation, solar panels, wind generation, geothermal systems, and the like. These tax credits have to be balanced against taxes paid by families who are barely surviving this recession, if they are still in their homes making mortgage payments.

Who benefits? Not the mortgage companies that repossess energy inefficient homes. Not the families in traditional homes burdened with high energy costs. Only those wealthy enough to need tax breaks can benefit. But a household at the income level where it makes financial sense to upgrade an existing home can easily afford the upgrade without burdening the already overtaxed public.

In a low income, possibly downtrodden neighborhood, upgrading a home for energy efficiency results in an expense (even after tax breaks) not likely to be recovered at the sale of the home. It would make more sense to use the same amount of funds to replace older, inefficient homes with new construction. New construction essentially replaces homes with the least efficient HVAC (heating/ventilation/ air conditioning) and insulation with new ones that operate the most efficient systems. But new construction gets almost no tax benefits; only geothermal or solar systems on new construction are subsidized. Does that make sense?

Density Targets: Making funds available to cities on the condition that certain higher densities are met is not a solution, either. What I hear most often is that we need to provide high-density housing and public transportation so that poor people can get to their jobs, assuming, of course, that all people of low income work downtown.

Are multi-billion dollar light rail projects and heavily subsidized low-income high-rise towers justified by such rhetoric? A low-income family on the 6th floor of a high-density building will not have the same quality of living or the pride-of-place that a home with a yard would provide. Travel dependent on a train or bus schedule does not offer the independence of owning a vehicle and travelling on one’s own schedule. Travel by foot or bike makes perfect sense for some of those who live in San Diego, but in the rest of the world those alternatives are viable only for the few nice weather days.

When the recession began, urban architects and planners celebrated the death of the suburbs and the coming advent of an urban rebirth. While the suburbs were certainly hard hit, urban areas did not receive the expected mass migration.

There is a myth that sprawl was the result of large lots and low density in the suburbs. Over the past 20 years, the firm I founded has planned over 730 developments in 46 States and 15 countries. I would estimate the average density of our suburban developments at between four and five units per useable acre. Today’s suburban development must preserve wetlands, steep slopes, wooded areas, and most often contain a minimum percentage of the site in open space. None of those requirements were in place when our core cities were built. One simply gridded streets through swamps (the previous term for wetlands) and bulldozed slopes and woodlands. Had our existing core cities been built under today’s regulations, they would likely sprawl 30% or more beyond the areas they currently occupy.

Density targets that must be hit in order to receive government financial assistance not only doesn't increase the quality of lower income life, it doesn't result in more sustainable and affordable cities. Instead, most funding has resulted in displacing low-income neighborhoods with gentrified, wealthy development. Many of these projects were initial financial failures. The next developer — the one who picked up the project at bargain prices — realized the profit. Successful, affordable urban redevelopment remains elusive.

Ordinances & Codes: The designer of any development, suburban or urban, will squeeze every inch out of the site to stay within the most minimal dimensions allowed by local ordinances. This effort to maximize the client’s profits can only result in monotonous, cookie-cutter development.

Many city planning boards have been manipulated into believing the illusion that a ‘forms based' or ‘smart-code’ approach is a solution. These new regulations simply increase the number of minimum standards, and restrict innovative solutions. What a ‘forms based' or ‘smart' code does accomplish is to significantly increase the consulting income of the firm that promotes this alternative.

Many engineers and architects base their fees on a percentage of the final construction costs. A consultant who charges on a percentage of infrastructure costs has an incentive to introduce excessive sewer pipes, retaining walls, or other non-needed construction. A fee structure based upon increased profit derived on the least efficient design is a huge roadblock to developing sustainable cities.

Innovations in land development and in methods of design now allow a reduction of both environmental and economic impact from 15% to over 50%, compared to conventional or New Urban planning methods. While these new methods take more time and effort to design, the reward is more attractive, affordable, and functional neighborhoods.

What's the blueprint for better planning? For starters, two ideas: government aid should be based on a ‘plan’ showing how the resulting development will enhance the living standards, and not be tied only to density levels. And agencies should reward contracts to the consultant with the best solution. This means creating a financial mechanism to increase – not decrease — profitability for sustainable planning and engineering solutions that require the least amount of construction costs.

Photo by Stripey Anne: "I am an NHS Bureaucrat…These, dear friends, are the tools of my trade: red tape, pen, ink…"

Rick Harrison is President of Rick Harrison Site Design Studio and Neighborhood Innovations, LLC. He is author of Prefurbia: Reinventing The Suburbs From Disdainable To Sustainable and creator of Performance Planning System. His websites are rhsdplanning.com and pps-vr.com.

Understanding Chongqing and the Fall of Bo Xilai

$
0
0

The demise of Bo Xilai, the former Party Secretary of Chongqing, has turned into one of the biggest political scandals in China in recent memory and now includes allegations that Bo’s wife Gu Kailai is connected to the murder of a British businessman close to Bo’s family. It is even rumored the businessman, Neil Heywood, may have had an affair with Gu.

Yet the international espionage drama has not shed much light on the peculiar politics and evolution of Chongqing, the western Chinese city which has become its unlikely setting. As a three year resident of Chengdu, a city two hours northwest by train and a traditional economic rival, I have been fascinated by Chongqing’s unique history and political culture.

1940-1946: China’s Wartime Capital

In many ways, Chongqing is China’s version of the Wild West. Known for the rough and tumble nature of its locals, the city, divided by the mighty Yangtze River, has carried with it a crude reputation since the days of Chiang Kai-Shek when his Kuomintang (KMT) held the city as their capital. Even after the remainder of the KMT fled from the Mainland to Taiwan after defeat, the atmosphere of gangsterism and corruption nurtured by Chiang Kai-Shek and the KMT remained deeply imbedded.

China might’ve taken a different path had the American forces succeeded in getting the KMT and the Communist Party to unite against the common Japanese enemy. It was in Chongqing at the KMT compound where U.S. General Joseph Stilwell arranged a meeting between Chiang-Kai Shek and Mao Zedong to try to broker the deal that ultimately failed. On an official tour of the city last year, Joel Kotkin and I had the opportunity to visit the site of the meeting- a leafy hillside compound which is now a museum and a must see for visitors to the city.

1997: The Creation of Chongqing ‘Direct-Controlled Municipality’

After breaking from Sichuan province 15 years ago, Chongqing direct-controlled municipality became by some measures the biggest city in the world.

Though the specific reasons for the creation of Chongqing municipality were never officially articulated, general consensus is that the decision was to administratively abate the negative effects of Three Gorges Dam project and the resulting destruction of nearby villages. Incorporating these villages as part of Chongqing was an easy way to solve the administrative problem of transferring household registration (‘hukou’) status and mobility for the hundreds of thousands of residents who had to relocate.

Separating Chongqing from Sichuan also had the added benefit of removing competition with the provincial capital of Chengdu. Under the administration of the Central Government, Chongqing could now move forward with unfettered development without having to deal with the demands of Chengdu. This would also provide Bo Xilai a far greater stage to promote his career ambition.

2007 - 2012 : The Reign of Bo Xilai

Bo landed in Chongqing in late 2007 with what some analysts saw at the time a demotion from his previous position as China’s Minister of Commerce. Prior to working for the Central Government, Bo was governor of north China’s Liaoning Province and Mayor of Dalian- the second largest city in the province.

A port city of about 3 million people, Dalian sits on the Liaodong Peninsula that juts out into the Bohai Sea. It is here where Bo proved himself as an adept politician, serving the city as Mayor from 1992 - 2000. Bo was noted for his progressive urban planning policies, putting emphasis on modernizing the city, improving the environment, adding greenbelt corridors and preserving architectural gems from Russian and Japanese colonial periods. For his progressive urban planning policies, Bo was even awarded a UN-HABITAT “Scroll of Honour” award in 1999.

To this day, Dalian still often ranks as one of China’s most ‘livable’ cities, a title that the city’s residents attribute to the work of Bo. Yet, if top-down urban planning initiatives were a popular success in Dalian, the same could not be said as unequivocally for Chongqing. While some applauded Bo’s efforts, others saw his overly aggressive methods as detrimental to the existing urban fabric.

Chongqing and Dalian couldn’t be further apart in character or its stage of economic development. Whereas Dalian is a pleasant seaside town based on tourism, banking and IT, Chongqing is a rough manufacturing megalopolis, known for its craggy mountains chopping through the city and unbearably hot summers.

Perhaps Bo thought he get away with a more strong-arm approach given Chongqing’s history of being a city on the frontier far away (both physically and psychologically) from Beijing. When he became Party Secretary of the municipality, he came in with guns blazing, initiating a bloody campaign to crack down on organized crime. He and Wang Lijun (his former right-hand man and police chief who would later try to defect to the U.S. Consulate in Chengdu) took down the previous police chief, Wen Qiang, sentencing him to death for corruption.

Initially many locals were pleased with Bo’s very public display of taking down the gangs, but not everyone was as easily convinced. As one of my friends who is a native of the city once said to me “Bo Xilai just replaced the previous mafia with his own mafia”. If this is ultimately discovered to be the case, then it is perhaps not surprising for a city with a history of such internal struggles.

In Chongqing, Bo also initiated similar strategies he employed in Dalian by promoting greenbelts, the development of public transportation networks (including monorails to traverse the unforgiving topography), and an ambitious affordable housing program. Yet these urban planning projects were overshadowed by Bo himself, who wanted to be seen both by the residents of Chongqing and the decision-makers in the Communist Party headquarters in Beijing as the new star in China’s political firmament.

In addition to the organized crime crackdown, Bo also initiated the now well-documented ‘red’ campaigns, promoting the singing of Mao-era songs in public parks and converting the local television stations into 24-hour commercial free broadcasts of red propaganda. He even went so far as to establish a museum at the city’s Public Security Bureau (PSB) displaying his crackdown on crime to show off to visiting delegations.

Somewhat unnervingly, Kotkin and I were taken to the PSB as the last stop on our visit to the city. The compound, a huge Stalinist piece of architecture, features two quarter-mile long covered colonnades extending out in front of each side of the building. We were led down the first wing by an attractive young woman shouting into a microphone, introducing us first to pictures of the ‘great leader’ Bo shaking hands with China’s top leaders, Hu Jintao and Wen Jiabao, as well as with visiting foreign officials.

Immediately following, we were bombarded with gruesome images of Bo and Wang’s campaign to oust crime, showing the horrors committed by the gangs. Dead, mutilated bodies filled the walls, as well as photomontage of images from the execution of Wen Qiang. Inside the PSB main building, the contraband seized from Wen Qiang and his associates was on display, including every kind of narcotic you can think of, weapons including AK-47s and gigantic machetes, and millions of dollars worth of historic Chinese art pieces that were used for money laundering.

The exhibit was meant to show the righteous power of Bo, and belittle the previous group who ruled Chongqing. Afterwards, we were invited to coffee in the opposite wing, where prominent images of Josef Stalin, Vladimir Putin, and Mao Zedong were displayed next to imaged of Bo. The experience was so bizarre that by the time we made it onto the high-speed train to Chengdu both Kotkin and I breathed a sigh of relief to make it out of the city alive.

All of that is gone now, and Chongqing moves on without Bo. The Bo Xilai saga is a very telling narrative about where China is today. On the political side of things, Bo’s takedown is a message to Chinese citizens and the world that nothing will get in the way of the country’s urban development program, especially a rogue politician who draws too much attention to himself.

It also means that, for commentators in the West who think that China needs to urgently reform to a more democratic system of free elections, the individuation of high-level charismatic politicians required for this kind of style of government cannot be tolerated at this stage in development. Unfortunately at this stage, popular elections run the risk of choosing someone who cultivates a personality cult.

From the urban development standpoint (which is actually inextricably linked to the political realm, both in China and in the West), the more top-down local government policies are, the more there is the risk that those in power will abuse those powers in other ways. Finding a balance is key. Many of Bo’s initiatives both in Dalian and Chongqing have their merit in improving urban life, but the manner they were initiated, and the authoritarian, self promoting style, appear now to have been a cover for something more sinister.

Adam Nathaniel Mayer is an American architectural design professional currently living in China. In addition to his job designing buildings he writes the China Urban Development Blog.

Chongquing at Night photo by Wiki Commons user Jonipoon.

Staying the Same: Urbanization in America

$
0
0

The recent release of the 2010 US census data on urban areas (Note 1) shows that Americans continue to prefer their lower density lifestyles, with both suburbs and exurbs (Note 2) growing more rapidly than the historic core municipalities.  This may appear to be at odds with the recent Census Bureau 2011 metropolitan area population estimates, which were widely mischaracterized as indicating exurban (and suburban) losses and historical core municipality gains. In fact, core counties lost domestic migrants, while suburban and exurban counties gained domestic migrants. The better performance of the core counties was caused by higher rates of international migration, more births in relation to deaths and an economic malaise that has people staying in (counties are the lowest level at which migration data is reported). Nonetheless, the improving environment of core cities in recent decades has been heartening.

The urban area data permits analysis of metropolitan area population growth by sector at nearly the smallest census geography (census blocks, which are smaller than census tracts). Overall, the new data indicates that an average urban population density stands at 2,343 per square mile (904 per square kilometer). This is little different from urban density in 1980 and nearly 10 percent above the lowest urban density of 2,141 per square mile (827) recorded in the 1990 census. Thus, in recent decades, formerly falling US urban densities have stabilized .

Urban density in 2010, however, remains approximately 27 percent below that of 1950, as many core municipalities lost population while suburban and suburban populations expanded. This resulted in the substantial expansion of urban land area reflecting the preference for low-density lifestyles among Americans and most people in other high-income areas of the world.   Between the 1960s and 2000, nearly all of the growth in the major metropolitan regions of Western Europe and Canada has taken place in suburban areas, as these nations’ urban areas have dispersed in a manner similar to that of the United States. The trend continued through 2011 in Canada and domestic migration data in Western Europe shows a continuing movement of people from the historical cores to the suburbs and exurbs.

This dispersion, pejoratively called "urban sprawl" has been routinely linked with everything from obesity and global warming to "bowling alone." In fact, while population densities have fallen, households densities have remained steady, barely droppping at all. Average household size has fallen dramatically, as fewer children have been born and divorce rates have soared. New households have been formed at more than 1.5 times the rate of population growth. The result is that a 27 percent decline in urban density since 1950 translated into a much more modest 4 percent decline in household density. A more genuine target for anti-suburban crusaders would be household sprawl rather than urban sprawl (Figure 1).

Smaller Urban Areas Growing Faster

Even as urban densities have reached a floor, Americans still continue to move to areas of lower density and smaller populations. For example, the urban areas of more than 1 million population in 1990 attracted 48 percent of the nation's urban growth between 1990 and 2000. Between 2000 and 2010, these areas attracted a smaller 38 percent of urban growth (Figure 2).

The Exurbs: A Two-Way Exodus

For much of the last decade (and even before), the media has been heralding an epochal “return” to core cities. This idea is fundamentally misleading since most suburbanites actually came not from core cities but smaller towns and rural areas. The census results have made it clear that the urban focus of population growth was largely anecdotal, although  small inner city areas of some core cities (such as small sections of  St. Louis, Chicago, Dallas, Seattle, San Diego and Portland)  have experienced uncharacteristic growth. But overall, most growth continued to be in the suburbs and exurbs.  Measured at the census block level, exurbs are constantly at risk of being converted into suburbs as they become a part of the continuously developed area. Even so, as of 2010, exurban areas accounted for 16.1 percent of the population in the 51 major metropolitan areas. The historical core municipalities accounted for 26.3 percent of the population, while suburban areas housed 57.6 percent of the population (Figure 3).

It should be considered, however, that in many urban areas --- such as Houston, Los Angeles, Phoenix, Portland, Seattle and Orlando --- many historic city neighborhoods were developed as and remain suburban in their form, being dominated detached homes and automobiles. It is unlikely that exurban areas (measured at the census block level) will exceed the historical core cities in population, since they are at constant risk of being merged with suburbs (as the urban area expands).

Smaller Urban Areas: Where the Sprawl Is

The principal urban areas of the major metropolitan areas are nearly twice as dense as the rest of America's urban areas. These urban areas have 53 percent of the urban population, but occupy only 39 percent of the urban land area. By contrast, the smaller urban areas have 47 percent of the urban population, while occupying 61 percent of the urban land area (Figure 4). It seems odd  that the fury of urban planners is directed at the larger, more dense urban areas rather than the smaller, much less dense urban areas, that sprawl to a far greater degree (Figure 5).

Most and Least Dense Major Urban Areas

Among the major metropolitan areas, the most dense urban area is Los Angeles, at a density of 6,999 per square mile (2,702 per square kilometer). This is a 32 percent denser than fourth ranked New York whose  hyper-dense core is offset by its low density suburbs. In fact, San Jose, which is virtually all suburban in its urban form and was a small urban area in 1950 (link to 1950-2010 data), ranks third and also is more dense than the New York urban area. Second ranked San Francisco is also more dense than New York (Figure 6). New Orleans ranked 10th most dense, however experienced a reduction in density of more approximately 30 percent due to the devastation of Hurricanes Katrina

It may be surprising that Portland, with by far the most radical densification policies in the nation, does not even rank among the 10 most dense urban areas. Portland ranked 13th, behind urban areas like Las Vegas, Salt Lake City, San Diego, Sacramento, Denver and exclusively suburban Riverside-San Bernardino (and even the much smaller urban areas of Fresno, Bakersfield, Turlock and Los Banos in California's San Joaquin Valley). However Portland did densify, reaching one-half the density of Los Angeles.  Portland will catch Los Angeles in density by 2120 at the current rate.   

The least dense urban area is Birmingham, with a population density of 1,414 per square mile (546 per square kilometer). Atlanta, the least dense urban area of more than 3 million population in the world right is the third least dense at 1,707 per square mile (659 per square kilometer). The second least dense urban area, Charlotte, had a density of 1,685 per square mile (651 per square kilometer), while increasing its land area over the decade at twice the rate of Atlanta (Figure 7).

Staying the Same

Urbanization in the United States over the last decade can be characterized by the old French proverb that "the more things change the more they stay the same."

As in Europe and elsewhere (see the Evolving Urban Form series), when they move, Americans go to less dense areas such as to suburban and exurban areas within the larger metropolitan areas as well as smaller, lower density urban regions. The extent to which they move, however, will depend more upon economic improvement than the lure of core areas that, in reality, continue to lose younger people in their thirties while continuing not attracting their boomer parents as they get older.

Wendell Cox is a Visiting Professor, Conservatoire National des Arts et Metiers, Paris and the author of “War on the Dream: How Anti-Sprawl Policy Threatens the Quality of Life

----

Note 1: Urban Areas and Metropolitan Areas: An urban area is the area of continuous development and as Sir Peter Hall put it, is thus the "physical" urban form. The urban area is a similar, but fundamentally different concept than a metropolitan area and analysts routinely confuse the terms. The United States Census Bureau calls urban areas over 50,000 population "urbanized areas." The metropolitan area is larger, and includes one or more urban areas as well as economically connected rural areas. . The metropolitan area is the "functional" urban form. There is no rural territory within urban areas, but there can be substantial rural territory in a metropolitan area (For example, the US defines metropolitan areas by counties. This can lead to artificially large metropolitan areas. For example, the Riverside San Bernardino metropolitan area, in the West where counties tend to be larger, covers 27,300 square miles (a land area larger than Ireland). The Cleveland metropolitan area, with a principal urban area similar in population to Riverside-San Bernardino, covers only 2,000 square miles, because it is located in Ohio, where counties are smaller. At the same, the far lower population density of the Riverside-San Bernardino metropolitan area is despite the fact that the urban area is approximately 50 percent more dense than the Cleveland urban area

Note 2: Historical Core Municipalities, Suburbs and Exurbs: For the purposes of this article, an area outside a historical core municipality is considered a suburb if it is in the urban area and an exurb if it is in the corresponding metropolitan area, but outside the principal urban area. Urban areas are delineated at a small census geographical area (the census block), which makes more precise analysis possible than is available at the county level, the lowest level at which domestic migration data is available.

Note 3: Principal Urban Areas: The principal urban area is the urban area within a metropolitan area that has the largest population. For example, in the Riverside-San Bernardino metropolitan area, the Riverside-San Bernardino urban area is the principal urban area. Other urban areas, such as Murrietta, Hemet and Indio (Palm Springs) would be secondary urban areas.

----

Photograph: Exurban St. Louis (photo by author)

As California Collapses, Obama Follows Its Lead

$
0
0

Barack Obama learned the rough sport of politics in Chicago, but his domestic policies have been shaped by California’s progressive creed. As the Golden State crumbles, its troubles point to those America may confront in a second Obama term.

From his first days in office, the president has held up California as a model state. In 2009, he praised its green-tinged energy policies as a blueprint for the nation. He staffed his administration with Californians like Energy Secretary Steve Chu—an open advocate of high energy prices who’s lavished government funding on “green” dodos like solar-panel maker Solyndra, and luxury electric carmaker Fisker—and Commerce Secretary John Bryson, who thrived as CEO of a regulated utility which raised energy costs for millions of consumers, sometimes to finance “green” ideals.

Obama regularly asserts that green jobs will play a crucial role in the future of the American economy, but California, a trend-setter in the field, has yet to reap such benefits. Green jobs, broadly defined, make up only about 2 percent of jobs in the state—about the same proportion as in Texas. In Silicon Valley, the number of green jobs actually declined between 2003 and 2010. Meanwhile, California’s unemployment rate of 10.9 percent is the nation’s third highest, behind only Nevada and Rhode Island.

When Governor Jerry Brown predicted a half-million green jobs by the end of the decade, even The New York Times deemed it “a pipe dream.”

Obama’s push to nationalize many of California’s economy-stifling green policies has been slowed down, first by the Republican resurgence in 2010 and then by his reelection considerations. But California’s politicians, living in what’s become essentially a one-party state, have doubled down on green orthodoxy. As the president at least tries to cover his flank by claiming to support an “all-in” energy policy, California has simply refused to exploit much of its massive oil and gas resources.

Does this matter? Well, Texas has created 200,000 oil and gas jobs over the past decade; California has barely added 20,000. The state’s remaining energy producers have been slowing down as the regulatory environment becomes ever more hostile even as producers elsewhere, including in rustbelt states like Ohio and Pennsylvania, ramp up. The oil and gas jobs the Golden State political class shuns pay around $100,000 a year on average.

Instead, California has forged ahead with ever-more extreme renewable energy mandates that have resulted in energy costs roughly 50 percent above the national average and expected to rise substantially from there. This tends to drive out manufacturing and other largely blue-collar energy users.

Over the past decade the Golden State has grown its middle-skilled jobs (those that require two years or more of post-secondary education) by a mere 2 percent compared to a 5.3 percent increase nationwide, and almost 15 percent in Texas. Even in the science-technology-engineering and mathematics field, where California has long been a national leader, the state has lost its edge, growing just 1.7 percent over the past 10 years compared to 5.4 percent nationally and 14 percent in Texas.

A recent Public Policy of California study shows that since the recession, the gap between rich and poor has widened more in California than in the rest of the nation. Lower-income workers have seen their wages drop more precipitously than those of the affluent. And the middle class is proportionately smaller and has shrunk more than elsewhere. Adjusted for cost of living, it stands at 47.9 percent in California compared to nearly 55 percent for the rest of the country.

Meantime, many Californians have been departing for more affordable states, with a net loss of four million residents to other states over the past 20 years (while continuing, of course, to attract immigrants.) Of those who remain, nearly two-in-five Californians pay no income tax, and one in four receive Medicaid.

There are some people are prospering in California, including many of the affluent supporters who Obama courts on his frequent fundraising forays here. Tenure-protected academics from the University of California constitute his third-largest donor base, while Google ranks fifth and Stanford twelfth, according to Open Secrets.

Silicon Valley may emerge as the biggest source of campaign cash for Obama and the Democrats in the years ahead. After losing 18 percent of its jobs earlier in the decade, the Valley has resurged, along with Wall Street, aided by the cheap-money-for-the-rich policies of Federal Reserve Chairman Ben Bernanke. But while California’s high-tech job growth, largely in software, has been significant, the rate of increase has been less than half that of key competitors such as Utah, Washington, and Michigan.

The IPO-lottery, Hollywood, and inherited-wealth crowds can afford the state’s sky-high costs, especially along the coast, but most California businesses can’t. Under Brown and his even less well-informed predecessor, Arnold Schwarzenegger, the official mantra has been that the state’s “creative” entrepreneurs would trigger a state revival. This is very much the hope of the administration, which trots out companies like Facebook, Apple, and Google as exemplars of the American future. “No part of America better represents America than here,”  the president told a crowd at the Computer History Museum in Mountain View last fall.

Yet Silicon Valley represents just a relatively small part of the state’s economic base. Although the Valley—particularly the Cupertino to San Francisco strip—has recovered from the 2008 market meltdown, unemployment in the blue-collar city of San Jose hovers around 10 percent. The Oakland area, just across the Bay, ranked 63rd out of 65 major metropolitan in terms of employment trends, trailing even Detroit according to a recent analysis done by Pepperdine University economist Michael Shires. Other major California metros, including Los Angeles, Orange County, Riverside-San Bernardino, and Sacramento all ranked near the bottom.

The newer companies that can afford the sky-high costs of coastal California, and can pay their employees adequately to do the same—places like Google, Apple, Facebook, and Twitter—employ relatively few people compared to older, manufacturing-oriented technology firms such as Hewlett-Packard and Intel. While cherry picking highly educated professionals, the new firms create few local support positions that would spread some of the wealth. What middle-income jobs they do create tend to be located in lower-cost, more business-friendly American cities like Salt Lake City or Austin, or, increasingly, overseas.

Elite institutions like Stanford still thrive, but the state’s once-great educational system is creaking under reduced funding, massive bureaucracy, and skyrocketing pensions. Once among the best-educated Americans, Californians are rapidly becoming less so. Among people over 64, California stands second in percentage of people with an associate degree or higher; among those aged 25 to 34, it ranks 30th.

For devoted Californians, accustomed to seeing their state as a national and global exemplar, these trends are deeply disturbing. Yet the key power groups in the state—greens, public employees, and rent-seeking developers—seem intent on imposing ever more draconian regulations on energy and land use, seeking for example, to ban construction of the single-family houses preferred by the vast majority of Californians.

The increasingly delusional nature of the state’s politics is best captured by the urgent political push to build a fantastically expensive—potentially costing as much as $100 billion—high-speed rail line that would eventually connect the Bay Area, Los Angeles and the largely rural places in between. Obama has aggressively promoted high-speed rail nationally, but has been pushed back by mounting Republican opposition. Yet in one-party California, Jerry Brown mindlessly pushes the project despite the state’s huge structural deficits, soaring pension obligations, and decaying general infrastructure. He’s continued doing so even as the plan loses support among the beleaguered California electorate.

It’s hard to see how these policies, coupled with a massive income tax increase on the so-called rich (families, as well as many small businesses, making over $250,000), can do anything other than widen the state’s already gaping class divide. Yet given the power of Californian ideas over Obama, one can expect more such policies from him in an electorally unencumbered second term. California’s slow-motion tragedy could end up as a national one.

This piece originally appeared in The Daily Beast.

Joel Kotkin is executive editor of NewGeography.com and is a distinguished presidential fellow in urban futures at Chapman University, and contributing editor to the City Journal in New York. He is author of The City: A Global History. His newest book is The Next Hundred Million: America in 2050, released in February, 2010.

Barack Obama photo by BigStockPhoto.com.

Viewing all 4170 articles
Browse latest View live