Quantcast
Channel: Newgeography.com - Economic, demographic, and political commentary about places
Viewing all 3795 articles
Browse latest View live

How Much Value Do Economists Assign to Having Married Parents Who Aren’t on Drugs?

$
0
0

Yesterday I posted my new column from the September issue of Governing magazine in which I write:

"There are a number of people in the national media who make the argument that things aren’t so bad, that if you look at the numbers this idea that things are horrible in much of America just isn’t true. It’s easy for me to believe this is actually the case in a quantitative sense. But man does not live by bread alone. When you have an iPhone but your community is disintegrating socially, it’s not hard to see why people think things have taken a turn for the worse."

Conveniently the Wall Street Journal published an op-ed last week by Harvard economist Martin Feldstein called “We’re Richer Than We Realize” that makes the kind of argument I was talking about, right down to talking about iPhones:

"Government statistics paint an excessively grim picture of what is happening to real wages and the growth of real national income. Although most households’ take-home cash has been rising very slowly for decades, their standard of living is increasing more rapidly because those wages can now buy new and better products at little or no extra cost. The government’s measure of real incomes gives too little weight to this increase in what take-home pay can buy….First, government statisticians grossly understate the value of improvements in the quality of existing goods and services. More important, the government doesn’t even try to measure the full contribution of new goods and services.

The other source of underestimation of growth is the failure to capture the benefit of new goods and services. Here’s how the current procedure works: When a new product is developed and sold to the public, its market value enters into nominal gross domestic product. But there is no attempt to take into account the full value to consumers created by the new product per se.

Or consider consumer electronics. New York University economist William Easterly recently tweeted an image of a 1991 RadioShack newspaper ad and noted that all the functions of the devices on sale—clock radio, calculator, cellphone, tape-recorder, compact-disk player, camcorder, desktop computer—are “now available on a $200 smartphone.” The benefits to consumers from these advances don’t show up in GDP."

I don’t dispute anything Feldstein says in the article, which to me sounds completely correct. If you’re a Journal subscriber, you should read it. But it’s very incomplete.

Feldstein says we should consider the full value of the product innovations we’ve created. He cites improvements in health, for example.

But where is the expansive treatment of the economic value – the negative economic value – of declines in social conditions? Is the fully expansive impact of violence in some of Chicago’s neighborhoods fully counted? Is the quality of life impact of having a mother strung out on opioids, or having a father who is just plain gone? What’s the impact of going from being able to leave your keys in your car and your house unlocked to realizing that burglary is a very real possibility? And speaking of health, what is the all in effect on a community of the declining life expectancy we’ve experienced? What’s the community impact of an HIV crisis?

The truth is that along with real economic progress there has been a parallel big degradation in the lived experience of life in much of America, a part of America largely invisible to and certainly not relatable to on a visceral level by most of those in booming sections of global cities. I’m all in favor of understanding the very real way that technology and other innovations have made our lives better, and fully capturing that in statistics. But we need to be equally as diligent in capturing and measuring the downsides of those trends, an effort I’ve read much less about in the papers.

This piece originally appeared on Urbanophile.

Aaron M. Renn is a senior fellow at the Manhattan Institute, a contributing editor of City Journal, and an economic development columnist for Governing magazine. He focuses on ways to help America’s cities thrive in an ever more complex, competitive, globalized, and diverse twenty-first century. During Renn’s 15-year career in management and technology consulting, he was a partner at Accenture and held several technology strategy roles and directed multimillion-dollar global technology implementations. He has contributed to The Guardian, Forbes.com, and numerous other publications. Renn holds a B.S. from Indiana University, where he coauthored an early social-networking platform in 1991.

Photo: The house Aaron grew up in.


Big Tech Finds Itself Lacking Political Allies

$
0
0

Our nation’s ruling tech oligarchs may be geniuses in making money through software, but they are showing themselves to be not so adept in the less quantifiable world of politics. Once the toast of the political world, the ever more economically dominant tech elite now face growing political opposition, both domestically and around the world.

For its part, the right has been alienated by the tech establishment’s one-sided embrace of progressive dogma in everything from gender politics and the environment to open borders and post-nationalism. The left is also now decisively turning against tech leaders on a host of issues, from antitrust enforcement to wealth redistribution and concerns about the industry’s misogynist culture, so evident in firms such as Uber.

This mounting bipartisan opposition is placing the oligarchs into an increasingly uncomfortable political vise. As left-leaning Buzzfeed’s Ben Smith put it recently, there’s “a kind of ‘Murder on the Orient Express’ alliance against big tech: Everyone wants to kill them.”

Politics after Obama

It’s hard to recall that Occupy Wall Street demonstrators in 2011 actually celebrated the life of Apple founder Steve Jobs — a brilliant, but ruthless, capitalist, but also one who founded a religion-like technology cult. President Barack Obama also clearly embraced the techie economic model, and used Google and other tech talent in his data-driven campaigns.

Obama was their kind of progressive — socially liberal but comfortable with hierarchy, particularly of the college-educated kind. Just a few years ago, author Greg Ferenstein suggested that Silicon Valley would forge an entirely new liberal political ideology built around its technocratic agenda. Big tech’s ascendency was further bolstered by a “progressive” Justice Department that allowed the large tech firms to buy out and squeeze competitors with utter impunity.

Advocating antitrust at a nonprofit organization dominated by tech oligarchs, as one of my former colleagues at the liberal-leaning New America Foundation recently found out, can be dangerous for your employment status. Gradually, the image of spunky, enlightened entrepreneurs has morphed into one of monopolists reigning over what is rapidly becoming the most consolidated of our major industries.

No one really expects competition to rise against venture capital-created firms like Google, which owns upwards of 80 percent of the global search ad market, or Facebook, which uses its power to undermine upstarts like Snap, and calls for greater government oversight are now found on both sides of the aisle.

Kowtowing to the left has not turned out to be as clever a move as the tech oligarchs believed.

The Democrats, as it now appears, have been taken over by Sen. Bernie Sanders, whose redistributionist, pro-regulation agenda does not sit well with the likes of Amazon CEO Jeff Bezos, the world’s third-richest man, who last year used the Washington Post to try to undermine Sanders during his presidential campaign.

Read the entire piece at The Orange County Register.

Joel Kotkin is executive editor of NewGeography.com. He is the Roger Hobbs Distinguished Fellow in Urban Studies at Chapman University and executive director of the Houston-based Center for Opportunity Urbanism. His newest book is The Human City: Urbanism for the rest of us. He is also author of The New Class ConflictThe City: A Global History, and The Next Hundred Million: America in 2050. He lives in Orange County, CA.

Photo: TechCrunch [CC BY 2.0], via Wikimedia Commons

A Layman's Guide To Houston After Harvey: Don't Throw The Opportunity Baby Out With The Stormwater

$
0
0

In the aftermath of Hurricane Harvey, and the disastrous flooding, Houston has come under extreme scrutiny. Some in the global, national as well as local media assaulted the area's flood control system and its development model, criticisms that were echoed by some in the local area.

Much of the current debate starts from a firm misunderstanding of the region’s realities. This could lead to policies that ultimately undermine the keys that have propelled the region’s success. Below is a primer to inform future discussions of Houston’s future trajectory.

Click here to read more or download the full paper.

Photo: Michael Coppens, via Flickr, using CC License.

Where America's Highest Earners Live

$
0
0

The mainstream media commonly assumes that affluent Americans like to cluster in the dense cores of cities. This impression has been heightened by some eye-catching recent announcements by big companies of plans to move their headquarters from the ‘burbs to big cities, like General Electric to Boston and McDonald’s to Chicago.

Yet a thorough examination of Census data shows something quite different. In our 53 largest metro areas, barely 3% of full-time employed high earners (over $75,000 a year) live downtown, according to Wendell Cox’s City Sector Model, while another 11.4% live in inner ring neighborhoods around the core. In contrast, about as many (14.1%) live in exurbs while suburbs, both older and new ones, are home to 71.5% of such high earners.

New county-level research by Chapman University researcher Erika Nicole Orejola also sheds light on the geography of wealth. Orejola ranked the nation’s 136 largest counties by the proportion of full-time workers in the population who earned over $75,000 in 2015, which represented the 77th percentile of incomes then, and by the share of households earning over $200,000.

She found that 16 of the 20 counties with the largest share of full-time employed residents earning over $75,000 were functionally suburban, with most people driving to work and living in low to moderate density environments. The other four, interestingly enough, are among the most urbanized parts of the country, including Manhattan and San Francisco.

Where The High-Wage Earners Are

The very top of this pyramid consists largely of two archetypes, elite “superstar” cities, but more so well-located suburbs, often near the most dynamic cores. Many are areas that have benefited the most from the post-Great Recession boom in technology as well as in the much larger business and professional services sector.

Ranking first is New York County, otherwise known as Manhattan, where a remarkable 49.2% of all full-time workers earn over $75,000. That’s up from 40.2% in 2006. Other big counties with high concentrations of high earners include No. 3 San Francisco (49.1%), No. 7 Washington, D.C. (44.9%, up sharply from 29.5% in ’06), and No. 14 King County, Wash. (41.3%), which includes Seattle and its closer in suburbs.

Virtually all the rest are counties that are primarily suburban, usually close to high-wage core cities. These include, not surprisingly, the California counties of Santa Clara (fourth place) and San Mateo (ninth), which make up Silicon Valley. (In Santa Clara, a whopping 21% of households have annual incomes over $200,000, tops in the country.) Several New York suburbs make the top 20, including Monmouth, N.J. (eighth), Westchester, N.Y. (10th), Fairfield, Conn. (11th), and Nassau County, N.Y. (Long Island) (13th).

There are also strong pockets of high-wage workers in suburban counties surrounding Boston, including Norfolk (fifth) and Middlesex (12th). Washington, D.C., is flanked by wealthy suburban Fairfax County, which ties with Manhattan for the highest percentage of resident full-time workers making over $75,000 (49.2%) – we gave Manhattan the top ranking for its greater population (1.63 million vs. 1.13 million for Fairfax). Another D.C. suburb, Montgomery County, Md., ranks sixth. And outside Philadelphia, Chester County ranks 17th.

The pattern holds away from the East and West coasts. The Houston suburb of Fort Bend County ranks 18th and the Dallas suburb of Colin County ranks 19th. Near Chicago, DuPage County ranks 24th and Lake County 27th. Oakland County outside of Detroit ranks 25th, and 29th-ranked Johnson County, Kan., is the most dynamic part of the Kansas City regional economy.

Counties housing some of the nation’s largest cities don’t fare well in this ranking, but that isn’t necessarily because the wealthy aren’t there. The nation’s largest county, Los Angeles, ranks a mere 74th, with 24% of the full-time employed population earning over $75,000; in nearby suburban Orange County the proportion is 33.8%. But that’s because L.A. is much larger– L.A. County has more than double the number of high earners as Orange Country, 808,000 vs. 360,000. Similarly Cook County in Illinois, which includes Chicago and its closer in suburbs, places 55th with a 27.7% share of high earners, but it’s still home to 499,350 people making over $75,000, 2.3 times as many as live in higher-ranked DuPage and Lake County combined, and the high earner population in Cook County has been growing faster. Kings County, N.Y., aka Brooklyn, comes in 66th with 25.4% of the full-time working population making over $75k, but that’s still 221,000 high earners, and it’s had the second fastest growth rate in its high earner population of any large county since 2006.

The Bronx, long a poster child for urban poverty, clocks in 132nd, fourth from the bottom, but it ranks 11th for the growth rate in the proportion of its population that earns high incomes, up from 7.2% in 2006 to 12.3% in 2015.

Households Over $200,000 Income: The Suburban Connection

Much the same pattern applies to households with incomes over $200,000 annually. The same four urban core counties rank highly: San Francisco is third with 20.4% of households making over $200,000 a year, more than double the proportion in 2006, New York County is fifth, Washington, D.C., ranks 16th and the mixed suburban-urban core of the Seattle area, King County, Wash., places 20th. All the rest of the top 20 are firmly suburban, led by Santa Clara, where 21% of households earn $200,000 a year, followed closely by the D.C. suburb of Fairfax County, Va.

So what gives here? The Center for Demographics and Policy at Chapman University just completed a national survey, fielded and tabulated by The Cicero Group, of 1,191 professionals aged 25-64 with household incomes greater than $80,000, and who work in education, healthcare, information technology, finance or other professional services jobs. What we found may help us understand what high income professionals are looking for in terms of location.

The survey found priorities for actual high-end workers do not largely follow the “hip and cool” agenda so promoted by some urban pundits and inner city developers. In fact, the biggest factors influencing location, the respondents told us, are such prosaic factors as housing costs -- generally the number one issue -- jobs for a spouse, commute times, proximity to family, and K-12 quality.

Features commonly cited as reasons for an urban revival, like cultural amenities and nightlife, are not so critical with this demographic. In our survey, nearly 40% cited housing costs and 30% commute times as reasons why they would choose not to move to a place. In contrast, barely 5% prioritized “access to culture” or “nightlife.”

The needs of families seem paramount. There are certain factors that are “must haves , such as affordable housing, jobs for spouses and reasonable commute times,” notes the survey’s designer, Chapman University analytics expert Marshall Toplansky.

The message for cities and counties seeking to lure professionals may be, think parks and playgrounds rather than edgy music venues -- focus on the basics that shape quality of life for families.

The Future

Where are these folks likely to go in the coming years?

There may be some good news here for central cities. Some of the biggest increases in the proportion of high earners in the population took place in places like Kings (Brooklyn) and Queens counties, which have been prime areas for gentrification over the past decade as Manhattan has become extraordinarily pricey. Since 2006, Kings has seen its number of high income earners soar by almost 94% while Queens saw a jump of 78%.

Other urban core counties have seen some impressive gains, although from a low base, including Baltimore and Philadelphia counties. But here too some suburban areas have shown strong increases, notably Snohomish County, Wash., just outside Seattle, which saw its $75k cohort grow by over 90%. Other suburban areas with strong growth trajectories including Utah County, south of Salt Lake City, Ft. Bend and Montgomery counties outside Houston, as well as several suburban counties outside Boston.

What appears to be occurring are two things at the same time. There’s a strong concentration of affluent households both in select suburbs of major cities and another one, far more urban, that is beginning to spread, but in many older cities although still at a much lower concentration. Other hotspots appear to be in the newer suburbs of the Sun Belt. The geography of affluence is changing, but in ways that are as diverse as the country as a whole.

This piece originally appeared on Forbes.com.

Joel Kotkin is executive editor of NewGeography.com. He is the Roger Hobbs Distinguished Fellow in Urban Studies at Chapman University and executive director of the Houston-based Center for Opportunity Urbanism. His newest book is The Human City: Urbanism for the rest of us. He is also author of The New Class ConflictThe City: A Global History, and The Next Hundred Million: America in 2050. He lives in Orange County, CA.

Photo: About Fairfax County website.

Too Many Rust Belt Leaders Have Stockholm Syndrome

$
0
0

One of the criticisms leveled at Richard Florida is that many of the Rust Belt cities that tried to cater to the creative class ended up wasting their money on worthless programs.

What this illustrates instead is that leaders in the Rust Belt have taken the contours of the current economy as a given, and attempted to find a way to adapt their community to that.

This is actually a smart way to approach it. The fact is, local leaders are market takers not market makers in most places. They don’t have much leverage. With a global economy and dominance by knowledge industries, trying to create a more favorable environment to tap into those is a rational decision. If that hasn’t turned around those places yet, then nothing else has either.

However, what I’ve noticed is that civic leaders in these places have gone beyond trying to adapt to the global economy, and have become cheerleaders for the status quo – the same status quo that has wrecked in their community.

To be sure, much of deindustrialization resulted from simple productivity and technology improvements. But globalization played a role, both in tearing these cities down and in building up the coastal capitals.

In the second edition of her book The Global City, Saskia Sassen wrote:

What comes out of this book is that the globalization of manufacturing activity and of key service industries has been a crucial factor in the growth of the new industrial complex dominated by finance and producer services. Yes, manufacturing matters, but from the perspective of finance and producer services, it does not have to be national. This is precisely, as this book sought to show, one of the discontinuities (between major cities and nations) in the operation of the economy today compared with two decades ago, the period when mass production of consumer goods was the leading growth engine. One of the key points in this book is that much of the new growth rests on the decline of what were once significant sectors of the national economy, notably key branches of manufacturing, that were the leading force in the national economy and promoted the formation and expansion of strong middle class [emphasis added]

In other words, deindustrialization and the rebirth of cities like New York are linked via globalization.

Given this, you might think urban leaders in post-industrial cities would be advocates for some type of macroeconomic policy changes. That doesn’t really seem to be the case though. Certainly they do not want to see any form of rollback or material alteration in the current globalization schema, apart from perhaps arguing for more of the same.

I noticed this after the election last year when I observed leaders from some of America’s most economically bleak locales bemoaning Trump’s win. That in and of itself wouldn’t be a problem. But it was also clear that they loved the status quo and wanted to preserve and extend it. It is there any reason whatsoever to think that Hillary Clinton would have done anything for Youngstown? I don’t think so. Yet they were enthusiastic about her entire agenda, a more or less stay the course approach that would continue to pile more and more success into existing superstar cities.

I wouldn’t expect them to embrace Trumpism. But one would think that flyover America’s leadership class would be promoting a reform agenda of its own, one which would benefit their cities and regions. But they don’t seem to have one. All of their ideas are more or less adaptions of things people in coastal cities came up with. And they don’t have a national policy change agenda to speak of other than “give cities more money.”

For the younger, educated Millennial types, this is somewhat understandable. Many of them hope aspire to actually be in a coastal city. But much of the leadership class of these places is older and deeply rooted in their community.

As along as these folks remain enthusiasts and staunchly committed to the global status quo that helped ruinate their city, economic policy will continue to be made in ways that disproportionately benefits the coastal, global city elite at their expense.

This piece originally appeared on Urbanophile.

Aaron M. Renn is a senior fellow at the Manhattan Institute, a contributing editor of City Journal, and an economic development columnist for Governing magazine. He focuses on ways to help America’s cities thrive in an ever more complex, competitive, globalized, and diverse twenty-first century. During Renn’s 15-year career in management and technology consulting, he was a partner at Accenture and held several technology strategy roles and directed multimillion-dollar global technology implementations. He has contributed to The Guardian, Forbes.com, and numerous other publications. Renn holds a B.S. from Indiana University, where he coauthored an early social-networking platform in 1991.

Photo: Jack Pearce from Boardman, OH, USA [CC BY-SA 2.0 or CC BY-SA 2.0], via Wikimedia Commons

Garden Grove: The Other Kind of Incremental Urbanism

$
0
0

This is the historic Main Street in Garden Grove, California. Back in 1874 land was platted in small twenty five foot wide lots and sold off with minimal infrastructure. Individuals built modest pragmatic structures with funds pulled largely from the household budget, extended family, and short term debt. This was long before the thirty year mortgage, government loan guaranties, mortgage interest tax deductions, zoning regulations, subsidies, economic development grants, or the codes we have today.

Many of these simple one story shops were specifically designed to be subdivided in to two smaller shops that were each about twelve feet wide and not terribly deep. These were ideal economic incubators with a low bar to entry for tenants, yet they generated a high yield per square foot for the landlord. Businesses could expand and contract as needs changed. Some things failed. Others succeeded. Time sorted it all out.

Families often lived above their own shops. In many cases rooms or apartments were rented to tenants. Sometimes the upper floors served as professional offices or hotel rooms. This was an additional layer of flexibility that allowed properties to adapt over time while providing affordable yet profitable accommodations. Everything expanded gradually as money and market demand permitted. This was the process that produced our Main Street towns all across the country.


Here’s an aerial view of Main Street courtesy of Google. At one time it was the economic and cultural center of a thriving farm community. Notice the amount of private value relative to public infrastructure. Let’s pull out a bit and see what the surroundings look like today.


Google

Whatever may have existed around Main Street is now a vast ocean of surface parking lots. Next door and across the street are big box stores along high speed arterial roads. Times change. When transportation switched from shoe leather and horses to cars and trucks the scale of absolutely everything in society ramped up exponentially. The the old Main Street became a relic.

Garden Grove’s civic leaders obviously thought its historic center was worth preserving, so planners did the best they could to keep it viable. Removing defunct buildings in favor of parking lots made the shops available to suburban motorists.

Decorative paving, ye olde lamp posts, hanging flower baskets, park benches, lots and lots of American flags, potted shrubbery, and piped in music created a respectable unified atmosphere for retail. The place is clean, safe, and orderly.

Events are programmed to keep Main Street active and attract customers. An Elvis festival, a vintage car show, the annual celebration of the strawberry… Shops that might otherwise go empty are filled with civic organizations like the Chamber of Commerce and the offices of elected representatives. Garden Grove’s remaining historic center – all one block of it – is well maintained. But it stopped functioning as a town a long time ago. It’s now an embellished strip mall. The current regulatory environment and larger economic context have halted the iterative wealth building process that might have otherwise continued. Now it’s dependent on city planning efforts to keep up appearances with grants for fresh lipstick and rouge. It’s an exercise in sentimentality and kitsch. Nothing else is legal anymore.

Advocates for a return to the kind of development pattern that existed a century ago are up against hard limits of every kind. Reforming the current system of regulations and cultural attitudes is a waste of time. What they don’t recognize is that the small scale, fine grained, mom and pop process is alive and well in places like Garden Grove. It just doesn’t look like a Norman Rockwell village. That era is gone and isn’t coming back anytime soon. But a new version is already here. The mobile shop is the new version. I see more and more of these all across the county, because this is the new low resistance entry point for small businesses to form.

This is only the visible stuff. Inside many suburban homes are businesses that you can’t see. These aren’t traditional retail stores. Operating a physical shop makes no sense in most cases. Who can compete with Costco or Amazon? Who wants to try to extract permission from the zoning authorities? But household ventures generate income in ways that aren’t readily apparent from the curb. I can’t publish photos of the best examples because I’d get a lot of good people in to trouble. But trust me. They’re out there in large numbers under the radar.

When it comes to housing it’s incredibly difficult to build anything simple and cost effective anymore. A combination of endless regulations and outraged neighbors means only production home builders are left in the game. They build whole subdivisions of single family homes, or they build two hundred unit apartment complexes. The middle range of modest accommodations is no longer a reasonable option. Under the circumstance the existing stock of suburban homes are pressed in to service as de facto multi family buildings. On my way out of Orange County I asked a waitress at the airport about her living arrangements. She said she rented shared space in a five bedroom house in Costa Mesa. The overall rent was $4,200 a month. Her share was $1,100. She had three room mates. She also had three kids. That’s why so many front lawns are parking lots.

There’s a general acceptance of the super sized suburban home. A plain vanilla ranch home can become a much larger house without breaking any rules. The neighbors don’t always love being in the shadow of such upscaled structures, but there’s the countervailing knowledge that surrounding property values go up with this kind of redevelopment. Borderline insolvent municipal authorities understand this sort of activity allows a rare opportunity for property taxes to be adjusted upwards without building more public infrastructure. And it’s difficult to create codes that forbid such additions so long as set back regulations, health and fire safety, and other concerns are addressed. It’s all still a regular house so the suburban imperatives remain inviolate.

I have a peculiar ability to wander around and get myself invited in to people’s lives. This place in Garden Grove was once a little 1950s tract home. It was added on to in a way that perfectly conformed to all the existing rules and procedures and is still a fully detached single family home. But individual rooms are rented out and the tenants share a common kitchen and baths. It’s a small apartment building by other means. This is what we get when we forbid the Norman Rockwell Main Street model. Some people hate it. I see it as a perfectly natural response to the artificial constraints that have been placed on the old Main Street model. We can’t go back. But we can adapt and move forward under the circumstances.

This piece first appeared on Granola Shotgun.

John Sanphillippo lives in San Francisco and blogs about urbanism, adaptation, and resilience at granolashotgun.com. He's a member of the Congress for New Urbanism, films videos for faircompanies.com, and is a regular contributor to Strongtowns.org. He earns his living by buying, renovating, and renting undervalued properties in places that have good long term prospects. He is a graduate of Rutgers University.

Transit Work Access in 2016: Working at Home Gains

$
0
0

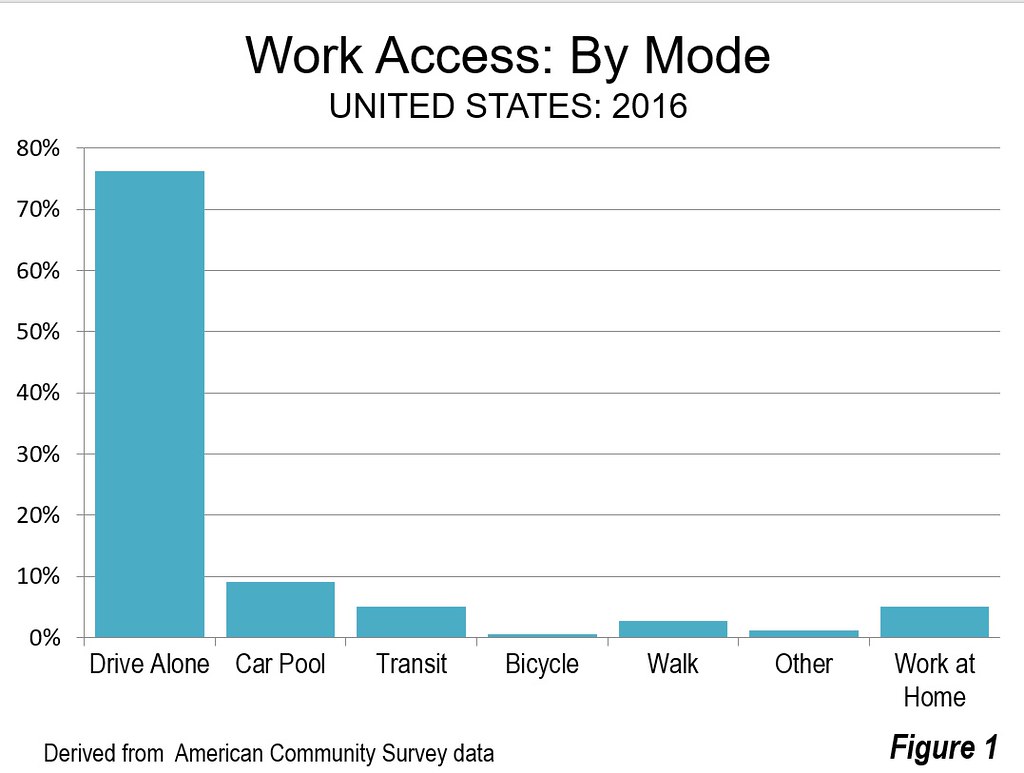
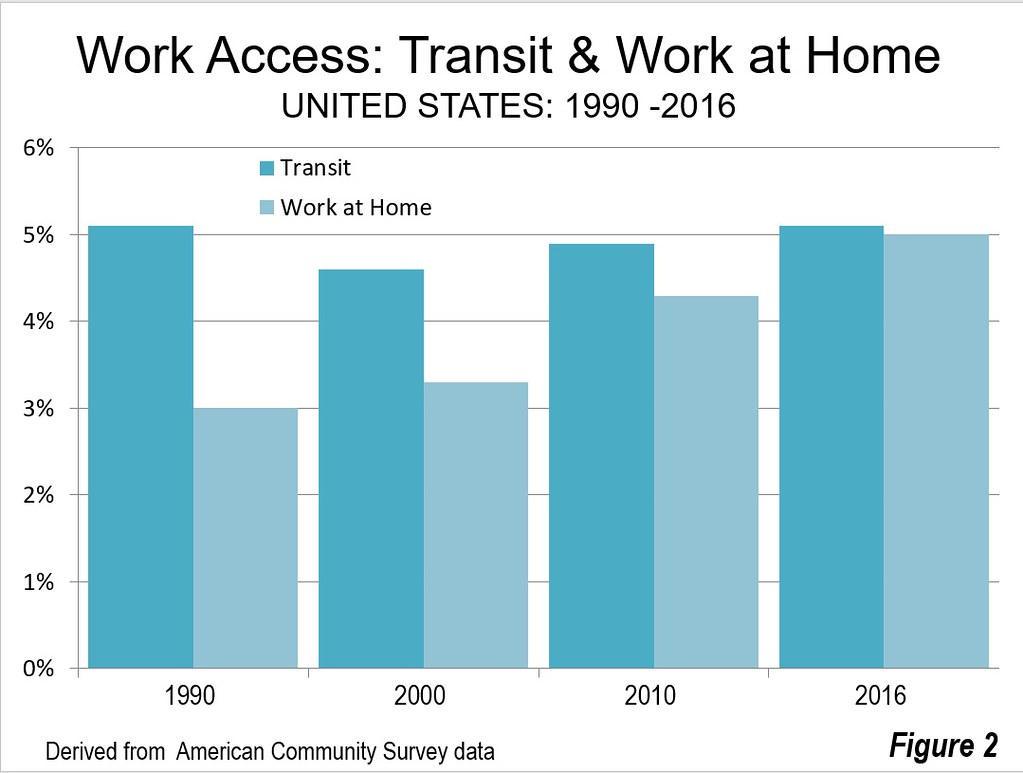
Working at home continues to grow as a preferred access mode to work, according to the recently released American Community Survey data for 2016. The latest data shows that 5.0 percent of the nation's work force worked from home, nearly equaling that of transit's 5.1 percent. In 2000, working at home comprised only 3.3 percent of the workforce, meaning over the past 16 years there has been an impressive 53 percent increase (note). Transit has also done well over that period, having increased approximately 10 percent from 4.6 percent.

Automobiles continue to be the "work horse" of employment access, with 76.3 percent of the market driving alone and 9.0 percent car pooling or van pooling. By comparison, driving alone was the mode of access for 75.7 percent of workers in 2000 and car pooling or van pooling accounted for 12.2 percent Walking has a 2.7 percent market share, down from 3.3 percent in 2000. On a percentage basis, bicycles, although still a comparatively tiny share, have done about as well as working at home, increasing percent, from 0.4 percent to 0.6 percent between 2000 and 2016, a 43 percent increase (Figure 1).

The market share in the "other" category has stayed constant, at 1.2 percent in both 2000 and 2016. This category includes other modes, including motorcycles, taxicabs and the more recently popular ride hailing services. Despite some thought that Uber and Lyft have begun to attract riders from transit, the work trip data contains no evidence of it. The "other" category market share in 2016 was the same as in 2010 (Figure 1 and Figure 2).

Transit and Work at Home Market Share

Transit has experienced by far its best work trip trend since World War II over the past 16 tears. The 4.6 percent share in 2000 was the nadir, in a fall from 12.1 percent in 1960, the earliest work trip data available. Transit's share has continued to grow modestly since 2010, from 4.9 to 5.1 percent, though widespread overall transit ridership declines have been reported in the last year (here and here).

The work at home share has, in contrast, risen strongly and nearly closed the gap with transit. In 2000, transit had an approximately 1.7 million advantage on working at home. By 2016, the difference had fallen below 60,000. Now, 43 of the 53 major metropolitan areas (over 1,000,000 population) --- including the second largest metropolitan area Los Angeles -- have more people working at home than riding transit to work.

Comparing Working at Home with Transit in New Rail Metropolitan Areas

Even huge expenditures of taxes have failed to keep transit more popular with workers than working at home in many metropolitan areas. This includes metropolitan areas that have built new rail systems:

     •  Austin, Charlotte, Dallas-Fort Worth, Nashville and Phoenix where nearly four or more times      as many work at home as commute by transit.

     •  Orlando and Sacramento where about three times as many people work at home as use      transit.

     •  Atlanta, Denver, Houston and Riverside-San Bernardino, St. Louis, San Diego and Virginia      Beach-Norfolk, where about twice as many people work at home as ride transit to work.

     •  The work at home advantage over transit is smaller in Miami, Minneapolis-St. Paul, Portland,      Salt Lake City and San Jose.

     •  The same is true of Los Angeles. Despite spending more than $15 billion (2016$) building and      opening an extensive urban rail and busway system, not only has working at home recently      passed transit, but ridership on the largest transit system has fallen from before opening the      first line.

On the other hand, rail ridership is more than double the work at home share in other metropolitan areas that have opened new rail systems since the 1970s. In San Francisco and Washington, the transit share is more than double the work at home share. In Seattle it is more than 50 percent higher, and it is also higher in Baltimore.

Where Working at Home is the Most

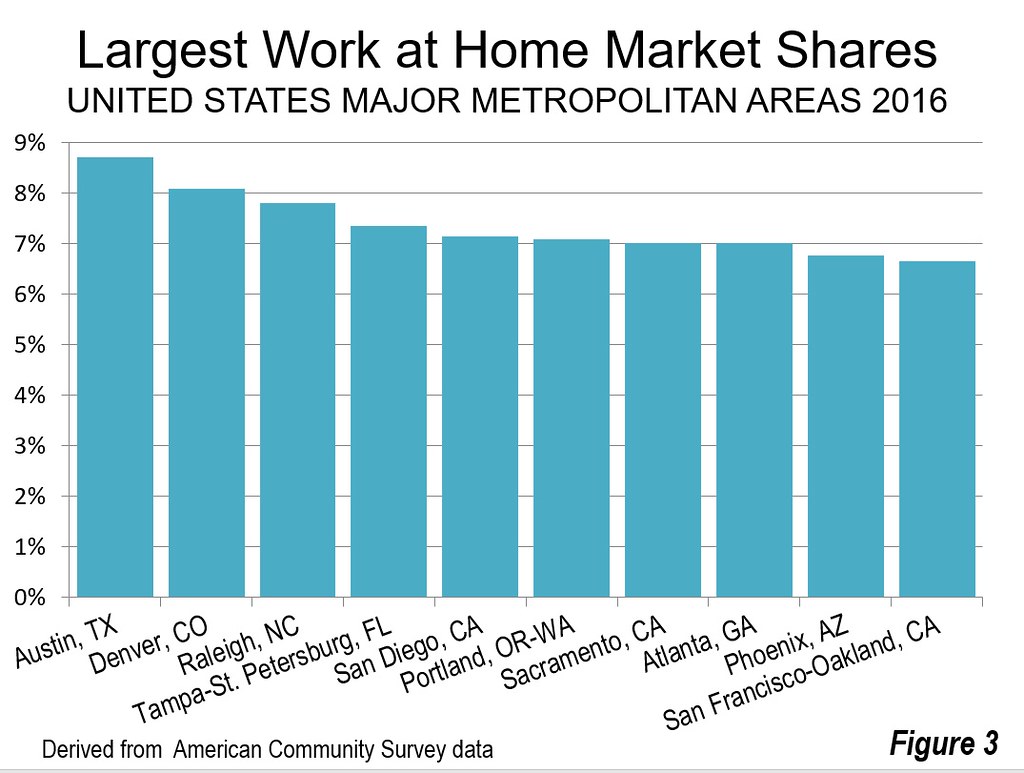
As might be expected, high-tech hubs lead in working at home. Austin has the largest work at home share, at 8.7 percent. Austin is followed by other tech-heavy metropolitan areas Denver (8.1 percent) and Raleigh (7.8 percent). Tampa-St. Petersburg, San Diego, Portland, Sacramento and Atlanta have shares of 7.0 percent or more. Charlotte and San Francisco-Oakland round out the top 10 (Figure 2).

The distribution of transit and work at home shares is much different. Among the 53 major metropolitan areas, the largest transit market share is in New York, at 31.2 percent, while the smallest is in Oklahoma City, at 0.4 percent, a spread of more than 80 times (8,000 percent). The median metropolitan area has a transit work trip market share of 2.6 percent.

Leader Austin's work at home market share is less than the transit shares in the six metropolitan areas with transit legacy cities (the core municipalities [not the metropolitan areas] of New York, Chicago, Philadelphia, San Francisco, Boston, Washington) as well as Seattle, in all of which more than nine percent of workers use transit. Nearly 60 percent of the transit work trips are to destinations in the core municipalities of these metropolitan areas, most of that in the downtown areas (central business districts). Thus, 60 percent of commuting is to areas having less than 7 percent of the nation's employment and less than one percent of nation's urban land area.

Working at home is much more evenly spread around the nation. The market share range is from 8.7 percent in Austin to 2.9 percent in Buffalo. The middle value is 5.2 percent, double that of transit. Thirty of the 53 major metropolitan areas have smaller transit work trip market shares than last ranking Buffalo's work at home market share (Table).


Work Access Mode: Major Metropolitan Areas: 2016
 Drive AloneCar PoolTransitBicycleWalkOtherWork at Home
Atlanta, GA77.6%9.2%3.1%0.3%1.3%1.5%7.0%
Austin, TX76.0%9.4%2.2%0.8%1.7%1.1%8.7%
Baltimore, MD76.6%8.3%6.1%0.3%2.6%1.1%4.9%
Birmingham, AL85.6%8.9%0.5%0.1%1.1%0.9%2.9%
Boston, MA-NH66.6%7.5%13.1%1.0%5.2%1.4%5.2%
Buffalo, NY82.8%7.4%3.5%0.4%2.4%0.6%2.9%
Charlotte, NC-SC80.9%9.2%1.4%0.0%1.3%1.0%6.3%
Chicago, IL-IN-WI70.3%7.6%12.0%0.7%3.1%1.2%5.1%
Cincinnati, OH-KY-IN81.7%7.8%1.9%0.2%2.1%0.7%5.5%
Cleveland, OH81.3%7.6%3.1%0.3%2.3%0.9%4.5%
Columbus, OH82.5%7.5%1.6%0.3%2.2%1.2%4.7%
Dallas-Fort Worth, TX80.8%9.7%1.4%0.1%1.2%1.1%5.7%
Denver, CO75.2%8.5%4.0%0.7%2.3%1.2%8.1%
Detroit,  MI84.3%8.2%1.5%0.3%1.3%0.8%3.6%
Grand Rapids, MI81.5%8.5%1.8%0.7%2.4%0.6%4.4%
Hartford, CT80.4%8.1%3.1%0.2%2.5%1.0%4.8%
Houston, TX80.8%10.2%1.9%0.2%1.4%1.3%4.1%
Indianapolis. IN84.5%7.4%0.7%0.3%1.6%0.8%4.6%
Jacksonville, FL81.0%7.7%1.7%0.6%2.0%1.4%5.7%
Kansas City, MO-KS83.8%7.9%0.9%0.2%1.3%0.8%5.2%
Las Vegas, NV79.4%9.9%3.7%0.3%1.2%1.5%4.0%
Los Angeles, CA75.0%9.6%5.1%0.8%2.5%1.4%5.5%
Louisville, KY-IN82.5%8.4%1.8%0.2%1.5%1.2%4.4%
Memphis, TN-MS-AR83.2%9.8%1.1%0.1%1.1%1.0%3.6%
Miami, FL77.7%9.3%3.8%0.5%1.7%1.4%5.5%
Milwaukee,WI80.4%8.2%3.6%0.5%2.7%0.7%3.9%
Minneapolis-St. Paul, MN-WI77.7%8.1%4.7%0.8%2.1%0.8%5.7%
Nashville, TN81.8%8.7%0.9%0.1%1.3%1.1%6.1%
New Orleans. LA77.2%11.0%2.6%1.1%2.2%1.4%4.4%
New York, NY-NJ-PA49.5%6.6%31.4%0.7%5.8%1.4%4.5%
Oklahoma City, OK83.2%9.2%0.4%0.4%1.5%1.1%4.1%
Orlando, FL80.5%9.1%1.9%0.4%1.1%1.3%5.8%
Philadelphia, PA-NJ-DE-MD72.6%7.9%9.3%0.6%3.6%1.0%5.1%
Phoenix, AZ76.2%11.2%1.8%0.7%1.5%1.7%6.8%
Pittsburgh, PA76.7%8.2%6.0%0.4%3.2%0.8%4.8%
Portland, OR-WA70.9%9.1%6.4%2.3%3.2%1.0%7.1%
Providence, RI-MA80.9%8.3%2.5%0.2%3.4%0.7%3.9%
Raleigh, NC80.6%8.1%1.2%0.3%1.0%0.9%7.8%
Richmond, VA82.4%8.1%1.4%0.5%1.9%1.0%4.7%
Riverside-San Bernardino, CA78.4%11.8%1.3%0.3%1.5%1.2%5.5%
Rochester, NY80.8%7.8%2.6%0.4%3.5%0.7%4.2%
Sacramento, CA76.9%9.5%2.1%1.6%1.8%1.1%7.0%
St. Louis,, MO-IL82.6%7.1%2.6%0.3%1.6%0.8%5.0%
Salt Lake City, UT74.8%10.7%4.6%0.7%2.5%1.0%5.8%
San Antonio, TX79.0%10.6%2.3%0.2%1.9%1.3%4.8%
San Diego, CA75.7%8.9%2.9%0.7%3.2%1.5%7.1%
San Francisco-Oakland, CA58.1%9.6%17.2%2.1%4.5%2.0%6.7%
San Jose, CA74.5%10.6%4.3%1.6%2.3%1.3%5.3%
Seattle, WA68.3%9.7%9.5%1.1%4.1%1.1%6.1%
Tampa-St. Petersburg, FL78.9%8.5%1.4%0.8%1.5%1.6%7.4%
Tucson, AZ76.4%10.5%2.6%1.6%1.9%1.5%5.4%
Virginia Beach-Norfolk, VA-NC79.7%9.3%1.8%0.4%3.8%1.6%3.5%
Washington, DC-VA-MD-WV65.9%9.3%13.4%0.9%3.4%1.4%5.7%
Major MSAs73.4%8.7%7.9%0.6%2.7%1.2%5.4%
United States76.3%9.0%5.1%0.6%2.7%1.2%5.0%
Outside Major MSAs80.4%9.4%1.2%0.5%2.7%1.2%4.6%
Source: American Community Survey, 2016


The Future

There is considerable potential for expanding the work at home share of work access, as is indicated by Global Workplace Analytics and Flexjobs in their report (The State of Telecommuting in the U.S. Employee Workforce). The advantages are great. Working at home is by far the most environmentally friendly mode of work access and requires virtually no public subsidies.

Note: Calculated using two-digit data.

Wendell Cox is principal of Demographia, an international public policy and demographics firm. He is a Senior Fellow of the Center for Opportunity Urbanism (US), Senior Fellow for Housing Affordability and Municipal Policy for the Frontier Centre for Public Policy (Canada), and a member of the Board of Advisors of the Center for Demographics and Policy at Chapman University (California). He is co-author of the "Demographia International Housing Affordability Survey" and author of "Demographia World Urban Areas" and "War on the Dream: How Anti-Sprawl Policy Threatens the Quality of Life." He was appointed to three terms on the Los Angeles County Transportation Commission, where he served with the leading city and county leadership as the only non-elected member. He served as a visiting professor at the Conservatoire National des Arts et Metiers, a national university in Paris.

Photograph: Texas State Capital, Austin (largest work at come work access mode).

https://commons.wikimedia.org/wiki/File:Texas_State_Capitol_Night.jpg

The Bottom Line of the Culture Wars

$
0
0

America’s seemingly unceasing culture wars are not good for business, particularly for a region like Southern California. As we see Hollywood movie stars, professional athletes and the mainstream media types line up along uniform ideological lines, a substantial portion of the American ticket and TV watching population are turning them off, sometimes taking hundreds of millions of dollars from the bottom line.

This payback being dealt out to urbane culture-meisters by the “deplorables” are evidenced by historically poor ratings for such hyper-politicized events as the Oscars last year as well as this year’s Emmys. The current controversy surrounds the NFL player protests, which are lowering already weak ratings, down 10 percent since the national anthem protests, as well as plunging movie ticket sales. The oddly political sports network ESPN has seen declines close to catastrophic, although how much their often strident “resistance” turns off viewers is widely debated.

Jettisoning your audience

Historically, the genius of American entertainment, particularly Hollywood, lay in the appeal to the everyman. American movie stars, whatever their background, were Anglicized and could, at very least, “pass” for northern Europeans. In recent decades, the definition of “everymen” thankfully expanded, albeit imperfectly, to African Americans, Hispanics, Asians, Jews, Muslims and gays.

In the process, Hollywood and sports managed to expand their market by appealing to an ever more diverse consumer base both here and abroad. But with the rampant politicization of culture, sports and information, the notion of a common cultural market has all but disappeared.

Among those in control of mainstream media culture — newspapers, magazines, movie studios and television networks — attention is focused on an affluent, progressive audience concentrated in urban centers. The ignored, or disdained, are not just the roughly 46 percent of voters who voted for Donald Trump, but a wider section of middle-class America.

Read the entire piece at The Orange County Register.

Joel Kotkin is executive editor of NewGeography.com. He is the Roger Hobbs Distinguished Fellow in Urban Studies at Chapman University and executive director of the Houston-based Center for Opportunity Urbanism. His newest book is The Human City: Urbanism for the rest of us. He is also author of The New Class ConflictThe City: A Global History, and The Next Hundred Million: America in 2050. He lives in Orange County, CA.

Photo: BDS2006 [CC BY-SA 3.0 or GFDL], via Wikimedia Commons


Bringing Soviet Planning to New York City

$
0
0

New York City Mayor Bill de Blasio wants to bring the same policies that worked so well in the Soviet Union, and more recently in Venezuela, to New York City. “If I had my druthers, the city government would determine every single plot of land, how development would proceed,” he says. “And there would be very stringent requirements around income levels and rents.”

As shown in the urban planning classic, The Ideal Communist City, soviet planners also believed they were smart enough to know how every single plot of land in their cities should be used. The cities built on their planning principles were appallingly ugly and unlivable. They were environmentally sustainable only so long as communism kept people too poor to afford cars and larger homes.

If de Blasio believes in this planning system so much, why doesn’t he implement it in New York City? The biggest obstacle, he says, is “the way our legal system is structured to favor private property.” He blames housing affordability problems on greedy developers who only build for millionaires.

The reality is that, under the control of private property owners, New York City housing was quite affordable in 1969. It was only when planners began to interfere with private property rights that housing prices spiraled out of control.

In 1969, New York City median family incomes were $,9692 and median home prices were $25,700, for a value-to-income ratio of 2.7. This was affordable because, at 5 percent interest, someone could devote 25 percent of their income to a mortgage that is 2.7 times their income and pay off the loan in 15 years. Housing was even more affordable in the suburbs, as value-to-income ratios in the New York metropolitan area were 2.6.

By comparison, value-to-income ratios in 2015 were 8.8 for the city and 5.1 for the metropolitan area. Even at today’s 3 percent interest rates, someone buying a home that is 8.8 times their income could devote a third of their income to the mortgage and not be able to pay it off in 40 years.

What happened since 1969 to make housing so much less affordable? Contrary to de Blasio, one thing that didn’t happen is that developers got greedier. While there is no accurate measure, I am sure that people were just as greedy in 1969 as they are today. The human desire to accumulate wealth hasn’t changed in thousands of years, which is one reason why the kind of socialism that de Blasio favors never works.

Instead, one thing that happened was rent control. New York state first imposed rent control in 1950, but the law exempted rental housing built after 1947, and other housing was gradually deregulated through 1969. But in 1969, New York passed a new law that applied rent control to all housing, thus discouraging anyone from building new rental housing.

Another thing that happened was the city’s historic preservation ordinance, which was passed in 1965 and which has gradually restricted more and more of the city from redevelopment. More recently, New York City responded to unaffordable housing by passing an inclusionary zoning ordinance which provides affordable housing for a tiny number of people at the expense of making it less affordable for everyone else.

New Jersey and Connecticut did their part by passing statewide growth management laws, thus restricting people’s ability to escape New York City’s high housing prices by moving to the suburbs. Connecticut first passed its law in 1974 and New Jersey in 1986.

All of these actions are examples of the kind of government control that de Blasio supports, and all of them contributed to the high housing costs that de Blasio objects to. The next time he wants to find a greedy person to blame for unaffordable housing, he should look in a mirror.

This piece first appeared on The Antiplanner.

Randal O’Toole is a senior fellow with the Cato Institute specializing in land use and transportation policy. He has written several books demonstrating the futility of government planning. Prior to working for Cato, he taught environmental economics at Yale, UC Berkeley, and Utah State University.

Photo: Kevin Case from Bronx, NY, USA (Bill de Blasio) [CC BY 2.0], via Wikimedia Commons

Local Empowerment Should Be About Local Matters

$
0
0

I’ve generally been someone who wants to see local governments have more power and flexibility to meet local needs. My rationale is simple. States are full of diverse communities that are a bad fit for one size fits all policies. Chicago, Danville, Peoria, Cairo, etc. are radically different places. They have different circumstances, needs, and local priorities. Hence it makes sense for them to have the ability to chart their own course to some degree. Some states have accommodated this to some extent through classes of cities with different powers based on size. Others give even more flexibility through home rule or individualized city charters.

A good example of responding to local needs was Austin’s regulation of Uber. They were responding to specific local complaints about sexual assault by Uber drivers. And they put in place regulatory requirements including fingerprint background checks directly targeted at this problem.

Similarly Oklahoma City used its sales tax powers to put forth a series of referendums to approve temporary tax hikes to fund capital improvements like parks, sidewalks, and school renovations. (This was their Metropolitan Area Projects (MAPS) initiative).

Today though we are seeing cities abuse their local authority. Rather than using them for bona fide local matters, they are deploying them to politically grandstand and/or affect federal or state policy.

For example, we hear about cities and mayors being the locus of the “Resistance” to Trump. We also see explicit strategies like the “Fight for $15” minimum wage effort that is attempting to create a new national minimum wage through bottoms up change at the local level. Note at the $15/hr minimum wage has little to do with local economic conditions, but is the target in all kinds of places. It may well be that people can’t get the full $15/hr through, but it’s being promoted as the new base.

Regardless of the merits or lack thereof of any of these items, when cities explicitly state their desire to, for example, subvert US foreign policy, this weakens the case against state preemption laws and for local empowerment generally. When local leaders get outside the areas where they are clearly chartered to do business (infrastructure, education, sanitation, etc) and get into areas traditionally more heavy on state or federal rulemaking and not nearly so obvious a local function (economic regulation, climate policy, etc), don’t be surprised when the other levels of government who see themselves running the show in those matters swoop in and drop the hammer.

Obviously, this won’t necessarily protect you. Austin was not trying to tell the state or national government or any other city how to regulate Uber. The Texas legislature, wrongly in my view, override their ordinance anyway. But it’s still not a good idea to gratuitously invite trouble.

Mayors do not in fact rule the world. In the US, municipalities are structurally weak entities in most cases. We can debate all day long whether things should be different, but at this point that’s reality. To earn the right to go to legislatures to get more authority, or even to just keep the authority that they have, cities should be good stewards of that authority and use it for matters and reasons they make very clear are local, not national or state in scope.

This piece originally appeared on Urbanophile.

Aaron M. Renn is a senior fellow at the Manhattan Institute, a contributing editor of City Journal, and an economic development columnist for Governing magazine. He focuses on ways to help America’s cities thrive in an ever more complex, competitive, globalized, and diverse twenty-first century. During Renn’s 15-year career in management and technology consulting, he was a partner at Accenture and held several technology strategy roles and directed multimillion-dollar global technology implementations. He has contributed to The Guardian, Forbes.com, and numerous other publications. Renn holds a B.S. from Indiana University, where he coauthored an early social-networking platform in 1991.

Photo: w:en:User:Soonerfever [Public domain], via Wikimedia Commons

Case Studies in Autonomous Vehicles, Part I: Shared Use Vehicles and the Challenge of Multiple, Intermediate Stops

$
0
0

There has been a lot of discussion about the potential of autonomous vehicles to change our transportation landscape, in particular the potential for such cars to be shared, reducing car ownership, parking needs and congestion on our roads. A principle idea behind this concept is that since autonomous vehicles can be driven from stop to stop without a driver, they will be cheaper and more mobile, prompting current car owners to switch to mobility as a service (MaaS) where rides are purchased on an as needed basis.

A recent report by the consulting firm McKinsey & Company notes that although ridesharing services are growing, they still represent only about one percent of the vehicles miles traveled in the United States each year. The development of autonomous vehicles by itself is unlikely to radically change this statistic. Why not? Viewed from the perspective of the consumer-passenger, the fact that autonomous vehicles can pick up passengers all day without a driver does not in itself present a compelling reason for a person to switch from ownership to sharing. Rather, a number of other considerations, including convenience, safety, speed, and overall cost, likely will shape consumer decisions about whether to own or share. So while autonomous vehicles may be a necessary condition for widespread ride sharing, they are not sufficient. In other words, automation alone will not be enough.

Viewed from this lens, we need to think about how to design autonomous vehicles and our urban landscape to encourage MaaS (even if this consists only of single passenger rides in one “shared” vehicle). In so doing, we should acknowledge that sharing will not just happen. Rather, the experience of sharing vehicles and/or rides must be equal to or more compelling than owning in terms of convenience, reliability, cost and other factors.

The Challenge of Multiple, Intermediate Stops

One of the biggest challenges to shared use of autonomous vehicles lies in the need for individuals to make multiple, intermediate stops during the course of their trip and store goods along the way. A few examples are helpful to consider:

Example 1 – Family Beach Day

A family goes to the beach for the day, stopping first by car at the convenience store for 15 minutes to pick up some sunscreen and some snacks. They throw these items into their trunk and then go to the beach. When they arrive at the beach, they need a place to store their personal belongings such as keys, etc. so they hide them in their vehicle. When they are ready to head back home, they put their used beach towels and other equipment back in their trunk and ride home. Since they are making multiple stops and need to store belongings both during the interim stop and at their destination, the family may choose to drive their own car rather than using a ride hailing service. Also, they don’t want to be dropped off at their initial stop at the convenience store, have to wait a second time to get picked up to go to the beach, and then a third time to return home, incurring charges for each ride.

Example 2 – Shopping Excursion

A couple wants to visit three shops in three different neighborhoods. Like our beach going family, they may need to store any goods they purchase during the course of their journey. This could lead them to drive themselves rather than use a ride hailing service. Also, if they use a ride-hailing service, they will have to pay for three sets of rides. Autonomous vehicles may make these rides less expensive but they will not necessarily solve the logistical considerations.

Multiple, intermediate stops raise two significant challenges for shared use vehicles: (1) the challenge of where passengers store belongings during multiple, intermediate stops; and (2) ride-hailing services become more expensive for passengers who need to pay for multiple-destination rides.

Most individuals at some point need to make multiple, intermediate stops and to store possessions along the way. If such individuals have such needs even a handful of times, there may be a compelling case for them to continue owning a vehicle rather than using shared car services. To encourage ride sharing will require some creative thinking about how to structure this service and accommodate shifting logistical and storage needs. This might include new forms of personal and urban storage or amenities included in shared vehicles that make it easier to handle multiple stops. The key point is that automation alone will not solve all our problems. Rather, we will need to “work on it” just like most other endeavors.

Conclusion

Much has been said about the potential for autonomous vehicles to drive MaaS and convert vehicle owners to purchasers of trips on an as-needed basis. There is exciting potential in this idea and one that could transform our landscape in a positive manner. However, such thinking sometimes ignores the need for multiple, intermediate stops, and the accompanying “dwell” time that comes with them. These types of trips present a significant challenge to utilization of shared use vehicles. Ride hailing companies and anyone with an interest in expanding the market for MaaS should carefully think through exactly how trips can be engineered so as to make them equivalent or superior to the experience of owning a vehicle.

Blair Schlecter is based in Los Angeles and writes about transportation policy and innovation. He can be reached at schlecterblair@gmail.com.

Photo: Flckr user jurvetson (Steve Jurvetson). Trimmed and retouched with PS9 by Mariordo [CC BY-SA 2.0], via Wikimedia Commons

Oh, for those good days without fossil fuels!

$
0
0

Maybe it’s time to start scaling back on our leisurely lifestyle to lower our greenhouse gas emissions and start reverting back to the pre-1900 horse and buggy days for our transportation systems, and the “snake oil” pitchmen for our healthcare system, and no medications, no cosmetics, no fertilizers, no computers nor IPhones, and shorter life spans. Our leisurely lifestyle has been driven by those “chemical ingredients” that are derived from the fossil fuels of oil, coal and natural gas that make all the “stuff” associated with our lifestyles, as they are NOT derived from nuclear electrical power, nor from intermittent electricity from solar panels and wind turbines.

Looking back, the development of the internal combustion engine at the beginning of the 20th century, combined with the introduction of mass-produced affordable vehicles, got people moving on an unprecedented scale — and we haven’t looked back. Yes, it’s crude oil from which we have produced transportation fuels, but more importantly for civilization, it’s the related chemicals and by-products that have revolutionized our infrastructures and dramatically improved our quality of life and especially our leisurely lifestyle.

The good news is that the chemicals and energy from fossil fuels have enabled us to cheaply build and run wondrous machines that give us the mobility to choose any particular climate and the ability to increase the livability of the climate, has made us safer and masters of climate from natural and man-made threats.

The international aviation industry has been booming, with aviation fuel consumption more than double what it was 30 years ago in 1986. Worldwide, the consumption of jet fuels is astoundingly in excess of 225 MILLION gallons PER DAY to fly those huge aircrafts.

Those huge cruise ships are consuming on average, 140-150 tons of fuel per day, which works out to roughly 30 to 50 gallons of fuel PER MILE !

And by the way, it’s those two industries, the airlines and cruise ships, that were the catalyst to the hotel and theme park leisure industries that were not accessible in the horse and buggy times of our society.

Complimentary to the international aviation and cruise industry are the billions of gallons of transportation fuels being consumed to get passengers back and forth from airports and the various ports, all in an effort to travel and see the beautiful cities and sites around the world, i.e., the tourism industry.

The good news is that the fossil fuel industry has been the major contributor to industrialization, economic growth and the creation of jobs in all the infrastructure sectors and all the industries that are the basis of our lifestyle and economy, and technology continues to get ever better at minimizing and neutralizing the risks. The bad news is that we’re all getting older and sicker.

Interestingly, a few side benefits associated with shorter life spans associated with those pre-1900 horse and buggy days would solve a few of our current financial problems:

•   The unfunded liabilities of every city and state for those growing defined benefit retirement entitlement plans would be instantly solved by eliminating decades of retirement benefits per person.

•   The single payer health care program to provide free health care for everyone may work be eliminating the exponential medical expenses associated with older folks.

•   Social Security would never run out of funds by eliminating decades of payments per person.

•   World population growth would be stagnated and relieve pressure on the world’s food supplies.

Rather than reverting back to those good-old emission free days without fossil fuels when lives were dirty, smelly, difficult – and short, we should continue to efficiently utilize the elements from crude oil, coal, and natural gas that have provided all the “stuff” in our lifestyle, to improve the lifestyles of all those on this planet! In addition, we should also be augmenting electricity from intermittent renewables to operate all of our ”stuff” and gradually reduce the burning of our crude oil and coal.

Ronald Stein is founder of PTS Staffing Solutions, a technical staffing agency headquartered in Irvine

Photo: Aero Icarus from Zürich, Switzerland (570dc) [CC BY-SA 2.0], via Wikimedia Commons

Progressive Cities: Home of the Worst Housing Inequality

$
0
0

America's most highly regulated housing markets are also reliably the most progressive in their political attitudes. Yet in terms of gaining an opportunity to own a house, the price impacts of the tough regulation mean profound inequality for the most disadvantaged large ethnicities, African-Americans and Hispanics.

Based on the housing affordability categories used in the Demographia International Housing Affordability Survey for 2016 (Table 1), housing inequality by ethnicity is the worst among the metropolitan areas rated "severely unaffordable." In these 11 major metropolitan area markets, the most highly regulated, median multiples (median house price divided by median household income) exceed 5.0. For African-Americans, the median priced house is 10.2 times median incomes. This is 3.7 more years of additional income than the overall average in these severely unaffordable markets, where median house prices are 6.5 times median household incomes. It is only marginally better for Hispanics, with the median price house at 8.9 times median household incomes, 2.4 years more than the average in these markets (Figure 1).

The comparisons with the 13 affordable markets (median multiples of 3.0 and less) is even more stark. For African-American households things are much better than in the more progressive and most expensive metropolitan areas. The median house prices is equal to 4.6 years of median income, 5.5 years less than in the severely affordable markets. Moreover, for African-Americans, housing affordability is only marginally worse than the national average in the affordable market.

Things are even better for Hispanics, who would find the median house price 3.8 times median incomes, 5.1 years less than in the severely affordable markets. This is better than the national average housing affordability.

Among the four markets rated "seriously unaffordable," (median multiple from 4.1 to 5.0) the inequality is slightly less, with African-Americans finding median house prices equal to 2.2 years of additional income compared to average. The disadvantage for Hispanics is 1.5 years.

In contrast, inequality is significantly reduced in the less costly "moderately unaffordable" markets (median multiple of 3.1 to 4.0) and the "affordable" markets (median multiple of 3.0 and less).

The discussion below describes the 10 largest and smallest housing affordability gaps for African-American and Hispanic households relative to the average household, within the particular metropolitan markets. The gaps within ethnicities compared to the affordable markets would be even more. The four charts all have the same scale (a top housing affordability gap of 10 years) for easy comparison.

able 2 illustrates housing affordability gaps by major metropolitan areas. There are also housing affordability ranking gap tables by African-American households (Table 3) and Hispanic households (Table 4).

Largest Housing Affordability Gaps: African American

African-Americans have the largest housing affordability inequality gap. And these gaps are most evident in some of the nation's most progressive cities. The largest gap is in San Francisco, where the median income African-American household faces median house prices that are 9.3 years of income more than the average. In nearby San Jose ranks the second worst, where the gap is 6.2 years. Overall, the San Francisco Bay Area suffers by far the area of least housing affordability for African-Americans compared to the average household.

Portland, long the darling of the international urban planning community, ranks third worst, where the median income African-American household to purchase the median priced house. Milwaukee and Minneapolis – St. Paul ranked fourth and fifth worst followed by Boston, Seattle, Los Angeles, Sacramento and Chicago (Figure 2).

Largest Housing Affordability Gaps: Hispanics

Two of the three worst positions are occupied by the two metropolitan areas in the San Francisco Bay Area. The worst housing affordability gap for Hispanics is in San Jose, a more than one-quarter Hispanic metropolitan area where the median income Hispanic household would require 5.0 years of additional income to pay for the median priced house compared to the average. Boston ranks second worst at 3.9. San Francisco third worst at 3.3 years. Providence and New York rank fourth and fifth worst. The second five worst housing inequality for Hispanics is in San Diego, Hartford, Rochester, Philadelphia and Raleigh (Figure 3).

The San Francisco Bay Area: "Inequality City"

Perhaps no part of the country is more renowned for its progressive politics and politicians than the San Francisco Bay Area. Yet, in housing equality, the Bay Area is anything but progressive. If the African-American and Hispanic housing inequality measures are averaged, disadvantaged minorities face house prices that average approximately 6.25 years more years of median income in San Francisco and 5.60 more years of median income in San Jose.

Moreover, no one should imagine that recent state law authorizing a $4 billion "affordable housing" bond election will have any significant impact. According to the Sacramento Bee, voter approval would lead to 70,000 new housing units annually, when the need for low and very low income households is 1.5 million. The bond issue would do virtually nothing for the many middle-income households who are struggling to pay the insanely high housing costs California's regulatory nightmare has developed.

Smallest Housing Affordability Gaps: African-American

Tucson has the smallest housing affordability gap for African-Americans. In Tucson, the median income African-American household would pay approximately 0.4 years (four months) more in income for the median priced house than the average household. In San Antonio, Atlanta and Tampa – St. Petersburg, the housing affordability gaps are under 1.0. Houston, Riverside – San Bernardino, Virginia Beach – Norfolk, Memphis, Dallas – Fort Worth and Birmingham round out the second five. It may be surprising that eight of the metropolitan areas with the smallest housing affordability gaps for African-Americans are in the South and perhaps most surprisingly of all that one of the best, at number 10, is Birmingham. (Figure 4).

Smallest Housing Affordability Gaps: Hispanic

Among Hispanic households, the smallest housing affordability gap is in Pittsburgh, where the median priced house would require less than 10 days more in median income for a Hispanic household compared the overall average. In Jacksonville the housing affordability gap for Hispanics would be less than two months. In Baltimore, Birmingham, St. Louis and Cincinnati, the median house price is the equivalent of less than six months of median income for an Hispanic household. Detroit, Memphis, Virginia Beach – Norfolk and Cleveland round out the ten smallest housing affordability gaps for Hispanics (Figure 5).

Housing Affordability is the Best for Asians

Recent American Community Survey data indicated that Asians have median household incomes a quarter above those of White Non-– Hispanics. This advantage is also illustrated in the housing affordability data. Asians have better housing affordability than White Non-– Hispanics in 37 of the 53 major metropolitan areas (over 1 million population).

The Importance of Housing Opportunity

Housing opportunity is important. African-Americans and Hispanics already face challenges given their generally lower incomes. However, by no serious political philosophy, progressive or otherwise, should any ethnicity find themselves even further disadvantaged by political barriers, such as have been created by over-zealous land and housing regulators.

Wendell Cox is principal of Demographia, an international public policy and demographics firm. He is a Senior Fellow of the Center for Opportunity Urbanism (US), Senior Fellow for Housing Affordability and Municipal Policy for the Frontier Centre for Public Policy (Canada), and a member of the Board of Advisors of the Center for Demographics and Policy at Chapman University (California). He is co-author of the "Demographia International Housing Affordability Survey" and author of "Demographia World Urban Areas" and "War on the Dream: How Anti-Sprawl Policy Threatens the Quality of Life." He was appointed to three terms on the Los Angeles County Transportation Commission, where he served with the leading city and county leadership as the only non-elected member. He served as a visiting professor at the Conservatoire National des Arts et Metiers, a national university in Paris.


Table 2
Housing Affordability Gap by Ethnicity: 2016
53 Major Metropolitan Areas (Over 1,000,000 Population)
Median Multiple (Median house price divided by median household income)
MSAMedian Multiple: All HouseholdsMedian Multiple: African-AmericanAfrican American Housing Affordability Gap in YearsRanked Most to Least Equal: African-AmericanMedian Multiple:

Hispanic
Hispanic Housing Affordability Gap in YearsRanked Most to Least Equal: HispanicExhibit: Median Multiple: AsianExhibit: Median Multiple: White Non-Hispanic
  
 Atlanta, GA      2.95          3.83           0.88              3        3.65          0.70           13       2.30            2.45
 Austin, TX      4.00          5.69           1.69            19        5.04          1.04           24       3.23            3.52
 Baltimore, MD      3.29          4.75           1.46            12        3.64          0.34             3       2.60            2.83
 Birmingham, AL      3.57          4.99           1.42            10        3.96          0.39             4       2.95            3.02
 Boston, MA-NH      5.11          8.69           3.58            47        9.02          3.90           52       4.67            4.62
 Buffalo, NY      2.48          4.79           2.32            38        4.58          2.10           43       2.90            2.20
 Charlotte, NC-SC      3.47          4.95           1.47            13        4.77          1.30           32       2.31            3.08
 Chicago, IL-IN-WI      3.56          6.30           2.75            43        4.45          0.90           20       2.69            2.94
 Cincinnati, OH-KY-IN      2.53          4.70           2.17            35        2.99          0.46             6       1.75            2.33
 Cleveland, OH      2.54          4.50           1.96            27        3.17          0.63           10       1.49            2.16
 Columbus, OH      2.91          4.78           1.87            24        4.10          1.19           30       2.50            2.68
 Dallas-Fort Worth, TX      3.56          4.98           1.42              9        4.70          1.14           26       2.55            2.87
 Denver, CO      5.34          7.64           2.29            37        7.40          2.05           42       5.33            4.76
 Detroit,  MI      4.01          6.71           2.70            41        4.53          0.52             7       2.56            3.48
 Grand Rapids, MI      2.68          4.66           1.98            28        3.85          1.16           28       2.95            2.53
 Hartford, CT      3.18          4.88           1.70            20        5.48          2.29           47       2.78            2.82
 Houston, TX      3.52          4.57           1.05              5        4.68          1.15           27       2.54            2.65
 Indianapolis. IN      2.82          4.89           2.07            31        4.45          1.63           38       2.48            2.50
 Jacksonville, FL      3.71          5.15           1.43            11        3.88          0.16             2       3.32            3.38
 Kansas City, MO-KS      2.95          4.96           2.00            30        3.97          1.02           23       2.64            2.68
 Las Vegas, NV      4.37          6.36           1.98            29        5.19          0.82           16       3.63            3.85
 Los Angeles, CA      7.69        11.15           3.46            45        9.74          2.05           41       6.68            6.03
 Louisville, KY-IN      2.99          4.90           1.91            25        3.92          0.93           21       2.48            2.71
 Memphis, TN-MS-AR      3.12          4.37           1.25              8        3.68          0.56             8       2.13            2.29
 Miami, FL      5.94          7.58           1.64            17        6.64          0.70           12       4.39            4.68
 Milwaukee,WI      3.93          7.88           3.95            49        5.79          1.86           40       2.78            3.33
 Minneapolis-St. Paul, MN-WI      3.24          6.83           3.59            48        4.64          1.40           34       3.25            3.01
 Nashville, TN      3.74          5.43           1.69            18        5.04          1.30           33       3.12            3.43
 New Orleans. LA      3.85          6.42           2.57            40        5.02          1.17           29       4.01            2.93
 New York, NY-NJ-PA      5.40          7.85           2.45            39        8.22          2.82           49       4.68            4.25
 Oklahoma City, OK      2.74          4.81           2.07            32        3.62          0.88           19       2.52            2.45
 Orlando, FL      4.28          6.00           1.72            22        5.21          0.94           22       2.93            3.60
 Philadelphia, PA-NJ-DE-MD      3.42          5.69           2.28            36        5.59          2.17           45       3.02            2.82
 Phoenix, AZ      4.01          5.54           1.53            14        5.07          1.06           25       3.17            3.62
 Pittsburgh, PA      2.68          4.61           1.93            26        2.70          0.02             1       1.97            2.54
 Portland, OR-WA      5.11          9.38           4.26            50        6.69          1.57           37       4.44            4.89
 Providence, RI-MA      4.26          6.38           2.12            34        7.21          2.95           50       3.09            3.95
 Raleigh, NC      3.46          5.01           1.56            15        5.59          2.13           44       2.47            3.12
 Richmond, VA      3.74          5.44           1.70            21        4.61          0.87           18       2.75            3.14
 Riverside-San Bernardino, CA      5.38          6.55           1.16              6        6.04          0.66           11       4.04            4.85
 Rochester, NY      2.42          4.52           2.10            33        4.67          2.25           46       2.26            2.21
 Sacramento, CA      5.00          7.81           2.81            44        6.21          1.21           31       4.63            4.46
 St. Louis,, MO-IL      2.74          4.46           1.72            23        3.15          0.41             5       2.41            2.45
 Salt Lake City, UT      4.00  No data         5.49          1.49           36       3.70            3.77
 San Antonio, TX      3.69          4.43           0.74              2        4.41          0.72           15       2.89            2.86
 San Diego, CA      7.98        10.72           2.74            42      10.65          2.67           48       6.88            6.94
 San Francisco-Oakland, CA      8.67        18.01           9.33            52      11.93          3.26           51       7.96            7.29
 San Jose, CA      9.09        15.28           6.19            51      14.08          5.00           53       7.80            8.24
 Seattle, WA      5.27          8.77           3.50            46        7.02          1.74           39       4.55            5.00
 Tampa-St. Petersburg, FL      3.87          4.86           0.98              4        4.74          0.87           17       2.85            3.65
 Tucson, AZ      4.00          4.41           0.41              1        4.71          0.71           14       4.17            3.54
 Virginia Beach-Norfolk, VA-NC      3.48          4.65           1.17              7        4.11          0.63             9       2.94            3.00
 Washington, DC-VA-MD-WV      4.08          5.64           1.57            16        5.54          1.46           35       3.76            3.38
 Overall median multiple from Demographia International Housing Affordability Survey: Updated with revised income data from 2016 ACS. 
 Median multiple: Median house price divided by median household income 
Table 3
African-American Housing Affordability Gap Ranked: Most to Least Equal 
53 Major Metropolitan Areas (Over 1,000,000 Population)
Median Multiple (Median house price divided by median household income)
MSAMedian Multiple: All HouseholdsMedian Multiple: African-AmericanAfrican American Housing Affordability Gap in YearsRanked Most to Least Equal: African-AmericanMedian Multiple:

Hispanic
Hispanic Housing Affordability Gap in YearsRanked Most to Least Equal: HispanicExhibit: Median Multiple: AsianExhibit: Median Multiple: White Non-Hispanic
 
 Tucson, AZ      4.00          4.41           0.41              1        4.71          0.71           14       4.17            3.54
 San Antonio, TX      3.69          4.43           0.74              2        4.41          0.72           15       2.89            2.86
 Atlanta, GA      2.95          3.83           0.88              3        3.65          0.70           13       2.30            2.45
 Tampa-St. Petersburg, FL      3.87          4.86           0.98              4        4.74          0.87           17       2.85            3.65
 Houston, TX      3.52          4.57           1.05              5        4.68          1.15           27       2.54            2.65
 Riverside-San Bernardino, CA      5.38          6.55           1.16              6        6.04          0.66           11       4.04            4.85
 Virginia Beach-Norfolk, VA-NC      3.48          4.65           1.17              7        4.11          0.63             9       2.94            3.00
 Memphis, TN-MS-AR      3.12          4.37           1.25              8        3.68          0.56             8       2.13            2.29
 Dallas-Fort Worth, TX      3.56          4.98           1.42              9        4.70          1.14           26       2.55            2.87
 Birmingham, AL      3.57          4.99           1.42            10        3.96          0.39             4       2.95            3.02
 Jacksonville, FL      3.71          5.15           1.43            11        3.88          0.16             2       3.32            3.38
 Baltimore, MD      3.29          4.75           1.46            12        3.64          0.34             3       2.60            2.83
 Charlotte, NC-SC      3.47          4.95           1.47            13        4.77          1.30           32       2.31            3.08
 Phoenix, AZ      4.01          5.54           1.53            14        5.07          1.06           25       3.17            3.62
 Raleigh, NC      3.46          5.01           1.56            15        5.59          2.13           44       2.47            3.12
 Washington, DC-VA-MD-WV      4.08          5.64           1.57            16        5.54          1.46           35       3.76            3.38
 Miami, FL      5.94          7.58           1.64            17        6.64          0.70           12       4.39            4.68
 Nashville, TN      3.74          5.43           1.69            18        5.04          1.30           33       3.12            3.43
 Austin, TX      4.00          5.69           1.69            19        5.04          1.04           24       3.23            3.52
 Hartford, CT      3.18          4.88           1.70            20        5.48          2.29           47       2.78            2.82
 Richmond, VA      3.74          5.44           1.70            21        4.61          0.87           18       2.75            3.14
 Orlando, FL      4.28          6.00           1.72            22        5.21          0.94           22       2.93            3.60
 St. Louis,, MO-IL      2.74          4.46           1.72            23        3.15          0.41             5       2.41            2.45
 Columbus, OH      2.91          4.78           1.87            24        4.10          1.19           30       2.50            2.68
 Louisville, KY-IN      2.99          4.90           1.91            25        3.92          0.93           21       2.48            2.71
 Pittsburgh, PA      2.68          4.61           1.93            26        2.70          0.02             1       1.97            2.54
 Cleveland, OH      2.54          4.50           1.96            27        3.17          0.63           10       1.49            2.16
 Grand Rapids, MI      2.68          4.66           1.98            28        3.85          1.16           28       2.95            2.53
 Las Vegas, NV      4.37          6.36           1.98            29        5.19          0.82           16       3.63            3.85
 Kansas City, MO-KS      2.95          4.96           2.00            30        3.97          1.02           23       2.64            2.68
 Indianapolis. IN      2.82          4.89           2.07            31        4.45          1.63           38       2.48            2.50
 Oklahoma City, OK      2.74          4.81           2.07            32        3.62          0.88           19       2.52            2.45
 Rochester, NY      2.42          4.52           2.10            33        4.67          2.25           46       2.26            2.21
 Providence, RI-MA      4.26          6.38           2.12            34        7.21          2.95           50       3.09            3.95
 Cincinnati, OH-KY-IN      2.53          4.70           2.17            35        2.99          0.46             6       1.75            2.33
 Philadelphia, PA-NJ-DE-MD      3.42          5.69           2.28            36        5.59          2.17           45       3.02            2.82
 Denver, CO      5.34          7.64           2.29            37        7.40          2.05           42       5.33            4.76
 Buffalo, NY      2.48          4.79           2.32            38        4.58          2.10           43       2.90            2.20
 New York, NY-NJ-PA      5.40          7.85           2.45            39        8.22          2.82           49       4.68            4.25
 New Orleans. LA      3.85          6.42           2.57            40        5.02          1.17           29       4.01            2.93
 Detroit,  MI      4.01          6.71           2.70            41        4.53          0.52             7       2.56            3.48
 San Diego, CA      7.98        10.72           2.74            42      10.65          2.67           48       6.88            6.94
 Chicago, IL-IN-WI      3.56          6.30           2.75            43        4.45          0.90           20       2.69            2.94
 Sacramento, CA      5.00          7.81           2.81            44        6.21          1.21           31       4.63            4.46
 Los Angeles, CA      7.69        11.15           3.46            45        9.74          2.05           41       6.68            6.03
 Seattle, WA      5.27          8.77           3.50            46        7.02          1.74           39       4.55            5.00
 Boston, MA-NH      5.11          8.69           3.58            47        9.02          3.90           52       4.67            4.62
 Minneapolis-St. Paul, MN-WI      3.24          6.83           3.59            48        4.64          1.40           34       3.25            3.01
 Milwaukee,WI      3.93          7.88           3.95            49        5.79          1.86           40       2.78            3.33
 Portland, OR-WA      5.11          9.38           4.26            50        6.69          1.57           37       4.44            4.89
 San Jose, CA      9.09        15.28           6.19            51      14.08          5.00           53       7.80            8.24
 San Francisco-Oakland, CA      8.67        18.01           9.33            52      11.93          3.26           51       7.96            7.29
 Salt Lake City, UT      4.00  No data        5.49          1.49           36       3.70            3.77
 Overall median multiple from Demographia International Housing Affordability Survey: Updated with revised income data from 2016 ACS. 
 Median multiple: Median house price divided by median household income 
Table 4
Hispanic Housing Affordability Gap Ranked: Most to Least Equal 
53 Major Metropolitan Areas (Over 1,000,000 Population)
Median Multiple (Median house price divided by median household income)
MSAMedian Multiple: All HouseholdsMedian Multiple: African-AmericanAfrican American Housing Affordability Gap in YearsRanked Most to Least Equal: African-AmericanMedian Multiple:

Hispanic
Hispanic Housing Affordability Gap in YearsRanked Most to Least Equal: HispanicExhibit: Median Multiple: AsianExhibit: Median Multiple: White Non-Hispanic
  
 Pittsburgh, PA      2.68          4.61           1.93            26        2.70          0.02             1       1.97            2.54
 Jacksonville, FL      3.71          5.15           1.43            11        3.88          0.16             2       3.32            3.38
 Baltimore, MD      3.29          4.75           1.46            12        3.64          0.34             3       2.60            2.83
 Birmingham, AL      3.57          4.99           1.42            10        3.96          0.39             4       2.95            3.02
 St. Louis,, MO-IL      2.74          4.46           1.72            23        3.15          0.41             5       2.41            2.45
 Cincinnati, OH-KY-IN      2.53          4.70           2.17            35        2.99          0.46             6       1.75            2.33
 Detroit,  MI      4.01          6.71           2.70            41        4.53          0.52             7       2.56            3.48
 Memphis, TN-MS-AR      3.12          4.37           1.25              8        3.68          0.56             8       2.13            2.29
 Virginia Beach-Norfolk, VA-NC      3.48          4.65           1.17              7        4.11          0.63             9       2.94            3.00
 Cleveland, OH      2.54          4.50           1.96            27        3.17          0.63           10       1.49            2.16
 Riverside-San Bernardino, CA      5.38          6.55           1.16              6        6.04          0.66           11       4.04            4.85
 Miami, FL      5.94          7.58           1.64            17        6.64          0.70           12       4.39            4.68
 Atlanta, GA      2.95          3.83           0.88              3        3.65          0.70           13       2.30            2.45
 Tucson, AZ      4.00          4.41           0.41              1        4.71          0.71           14       4.17            3.54
 San Antonio, TX      3.69          4.43           0.74              2        4.41          0.72           15       2.89            2.86
 Las Vegas, NV      4.37          6.36           1.98            29        5.19          0.82           16       3.63            3.85
 Tampa-St. Petersburg, FL      3.87          4.86           0.98              4        4.74          0.87           17       2.85            3.65
 Richmond, VA      3.74          5.44           1.70            21        4.61          0.87           18       2.75            3.14
 Oklahoma City, OK      2.74          4.81           2.07            32        3.62          0.88           19       2.52            2.45
 Chicago, IL-IN-WI      3.56          6.30           2.75            43        4.45          0.90           20       2.69            2.94
 Louisville, KY-IN      2.99          4.90           1.91            25        3.92          0.93           21       2.48            2.71
 Orlando, FL      4.28          6.00           1.72            22        5.21          0.94           22       2.93            3.60
 Kansas City, MO-KS      2.95          4.96           2.00            30        3.97          1.02           23       2.64            2.68
 Austin, TX      4.00          5.69           1.69            19        5.04          1.04           24       3.23            3.52
 Phoenix, AZ      4.01          5.54           1.53            14        5.07          1.06           25       3.17            3.62
 Dallas-Fort Worth, TX      3.56          4.98           1.42              9        4.70          1.14           26       2.55            2.87
 Houston, TX      3.52          4.57           1.05              5        4.68          1.15           27       2.54            2.65
 Grand Rapids, MI      2.68          4.66           1.98            28        3.85          1.16           28       2.95            2.53
 New Orleans. LA      3.85          6.42           2.57            40        5.02          1.17           29       4.01            2.93
 Columbus, OH      2.91          4.78           1.87            24        4.10          1.19           30       2.50            2.68
 Sacramento, CA      5.00          7.81           2.81            44        6.21          1.21           31       4.63            4.46
 Charlotte, NC-SC      3.47          4.95           1.47            13        4.77          1.30           32       2.31            3.08
 Nashville, TN      3.74          5.43           1.69            18        5.04          1.30           33       3.12            3.43
 Minneapolis-St. Paul, MN-WI      3.24          6.83           3.59            48        4.64          1.40           34       3.25            3.01
 Washington, DC-VA-MD-WV      4.08          5.64           1.57            16        5.54          1.46           35       3.76            3.38
 Salt Lake City, UT      4.00  No data         5.49          1.49           36       3.70            3.77
 Portland, OR-WA      5.11          9.38           4.26            50        6.69          1.57           37       4.44            4.89
 Indianapolis. IN      2.82          4.89           2.07            31        4.45          1.63           38       2.48            2.50
 Seattle, WA      5.27          8.77           3.50            46        7.02          1.74           39       4.55            5.00
 Milwaukee,WI      3.93          7.88           3.95            49        5.79          1.86           40       2.78            3.33
 Los Angeles, CA      7.69        11.15           3.46            45        9.74          2.05           41       6.68            6.03
 Denver, CO      5.34          7.64           2.29            37        7.40          2.05           42       5.33            4.76
 Buffalo, NY      2.48          4.79           2.32            38        4.58          2.10           43       2.90            2.20
 Raleigh, NC      3.46          5.01           1.56            15        5.59          2.13           44       2.47            3.12
 Philadelphia, PA-NJ-DE-MD      3.42          5.69           2.28            36        5.59          2.17           45       3.02            2.82
 Rochester, NY      2.42          4.52           2.10            33        4.67          2.25           46       2.26            2.21
 Hartford, CT      3.18          4.88           1.70            20        5.48          2.29           47       2.78            2.82
 San Diego, CA      7.98        10.72           2.74            42      10.65          2.67           48       6.88            6.94
 New York, NY-NJ-PA      5.40          7.85           2.45            39        8.22          2.82           49       4.68            4.25
 Providence, RI-MA      4.26          6.38           2.12            34        7.21          2.95           50       3.09            3.95
 San Francisco-Oakland, CA      8.67        18.01           9.33            52      11.93          3.26           51       7.96            7.29
 Boston, MA-NH      5.11          8.69           3.58            47        9.02          3.90           52       4.67            4.62
 San Jose, CA      9.09        15.28           6.19            51      14.08          5.00           53       7.80            8.24
 
 Overall median multiple from Demographia International Housing Affordability Survey: Updated with revised income data from 2016 ACS. 
 Median multiple: Median house price divided by median household income 


Photograph: San Francisco Bay Area: Where metropolitan housing opportunity is most unequal

https://upload.wikimedia.org/wikipedia/commons/archive/d/dc/200609291846...

What Does the Future Hold for the Automobile?

$
0
0

For a generation, the car has been reviled by city planners, greens and not too few commuters. In the past decade, some boldly predicted the onset of “peak car” and an auto-free future which would be dominated by new developments built around transit.

Yet “peak car,” like the linked concept of “peak oil” has failed to materialize. Once the economy began to recover from the Great Recession, vehicle miles traveled, sales of cars, and particularly trucks, began to rise again, reaching a sales peak the last two year. Instead, it has been transit ridership that has stagnated, and even fallen in some places like Southern California.

Demographics — notably the rise of the millennial generation — were once seen as the key to unlocking a post-car future. Yes, younger people have been slower to buy cars than their predecessors, much as they have been slow to get full-time jobs, marry or buy homes, but more are now driving, so to speak, the car market, representing the largest share of new automobile buyers.

Convenience can’t be banned

The persistence of personal transportation has little to do with the much hyped “love affair” with the automobile but convenience and access to work. Simply put, with a few notable exceptions, Americans live in increasingly “dispersed regions.” Transit works brilliantly, as Wendell Cox and I demonstrated recently in a paper for Chapman’s Center for Demographics, to downtown San Francisco and a few other “legacy” urban centers, notably New York which accounts for a remarkable 40 percent of all transit commuting in the United States.

Yet, overall, 90 percent of Americans get to work in cars. Access to jobs represents a key factor. University of Minnesota research shows that the average employee in 49 of the nation’s 52 major metropolitan areas can reach barely 1 percent of the jobs in the area by transit within 30 minutes while cars offer upwards of 70 times more access. This practical concern does much to explain why up to 76 percent of all work trips remain people driving alone.

Read the entire piece at The Orange County Register.

Joel Kotkin is executive editor of NewGeography.com. He is the Roger Hobbs Distinguished Fellow in Urban Studies at Chapman University and executive director of the Houston-based Center for Opportunity Urbanism. His newest book is The Human City: Urbanism for the rest of us. He is also author of The New Class ConflictThe City: A Global History, and The Next Hundred Million: America in 2050. He lives in Orange County, CA.

Photo: Nissan_LEAF_got_thirsty.jpg: evgonetwork (eVgo Network). Original image was trimmed and retouched (lighting and color tones) by User:Mariordoderivative work: Mariordo [CC BY 2.0], via Wikimedia Commons

Ending Economic Apartheid

$
0
0

Thanks to its greenbelt and slow-growth policies, Boulder, Colorado is the nation’s most-expensive and least-affordable housing market of any city not in a coastal state. As a result, as noted in an op-ed in The Hill, the number of black residents in Boulder declined by 30 percent between 2010 and 2016, leaving less than 1.6 percent of the city with African-American ancestry.

Closer to my home, the Bend Bulletinargues that the state of Oregon “works against affordable housing by, among other things. . . artificially increas[ing] the price of land through its urban growth boundary system.” Although cities are required to maintain an inventory of developable land within their growth boundaries, the paper notes that permission to expand their boundaries takes years.

The Oregon legislature effectively admitted that this is a problem last year when it passed a law allowing two cities to develop land on up to 50 acres of land outside of their growth boundaries. But can anyone seriously believe that adding 100 acres of new housing will make housing more affordable in Oregon?

To make matters worse, the law is to be administered by the state Land Conservation and Development Commission, the same commission that wrote the rules requiring urban-growth boundaries in the first place. Even if 100 acres were enough, they certainly won’t be timely. Applications to be one of the pilot cities are due November 1, more than a year after the law is passed. Considering this is actually only a preapplication, it could take another year to get final approval. Once approved, the pilot cities will probably take a year or more to implement their plans. Those plans will no doubt be appealed by 1000 Friends of Oregon or some other group. So it may be several years in all before ground is broken for the first new home under this law.

This is the wrong way of dealing with land use in general and housing affordability in particular. Oregon needs to abandon urban-growth boundaries and Boulder needs to abandon its greenbelt and its limit on construction permits. These policies violate people’s property rights and freedom of movement. In the end, it will probably take a court ruling, not a legislative action, to strike them down.

This piece first appeared on The Antiplanner.

Randal O’Toole is a senior fellow with the Cato Institute specializing in land use and transportation policy. He has written several books demonstrating the futility of government planning. Prior to working for Cato, he taught environmental economics at Yale, UC Berkeley, and Utah State University.

Photo: Eddyl [CC BY-SA 3.0], via Wikimedia Commons


Superstar Effect: Venture Capital Investments

$
0
0

This is the latest in my “superstar effect” series. Richard Florida posted an interesting analysis of venture capital investments over at City Lab.

Four cities dominate the charts: San Francisco Bay Area, New York, Boston, and Southern California. Call them the Big Four. No place else is even close.

It’s not just that they dominate in total dollars as in the above graph. They also dominate in total number of deals, with 52% of the national total. So it’s not just a handful of big deals making the Big Four standout.

Florida points out that the data don’t back up the idea of the rise of the rest. The superstars account remain in a league apart as far as VC investment goes.

That doesn’t mean the interior is getting nothing. Certainly plenty of cities now have tech startups where there were none before. That’s reason to celebrate. But it’s too early to declare a major decentralization of VC activity.

Also, tech has historically been a very cyclical industry. The last crash wiped out almost all emerging startup clusters – even New York’s Silicon Alley. We’ll have to see how things shake out in the next crash when it comes.

In the meantime, there remains a superstar bias in VC funding.

This piece originally appeared on Urbanophile.

Aaron M. Renn is a senior fellow at the Manhattan Institute, a contributing editor of City Journal, and an economic development columnist for Governing magazine. He focuses on ways to help America’s cities thrive in an ever more complex, competitive, globalized, and diverse twenty-first century. During Renn’s 15-year career in management and technology consulting, he was a partner at Accenture and held several technology strategy roles and directed multimillion-dollar global technology implementations. He has contributed to The Guardian, Forbes.com, and numerous other publications. Renn holds a B.S. from Indiana University, where he coauthored an early social-networking platform in 1991.

Photo: Vik Waters [CC BY-SA 2.0], via Wikimedia Commons

How We Are Kluging the World's Growth Process

$
0
0

The quirks of software and operating systems that we seem to experience on a daily basis are the result of Kluges – almost all software is written with fixes that work for a particular problem, often without knowing exactly why that fix works. As both a land planner and developer of high level precision design and engineering software, I do not allow kluged fixes – for either business.

Why do kluges exist?

Kluges are rampant in software and hardware development.


A kluge is a quick and easy fix to one problem, but hardware and software design is very complex, so what might fix one problem can have dramatic negative effects elsewhere. The potential of a larger problem occurring with a kluged fix is very real, and everyone suffers because what ‘seems to work’ on a particular problem may have a domino effect for things that could not be foreseen in normal testing.

What other industry has rampant kluges?

Subdividing land!

Kluge #1: A new subdivision is more than likely designed by the local civil engineer who is unlikely to possess a strong neighborhood design background. This is because the firm who plans the development will also get the lucrative engineering and surveying work. For that reason, every engineering firm, and most land surveying firms boast of their land planning abilities, even if there are no qualified and experienced ‘neighborhood’ designers on staff.

Kluge #2: Assuming the local consultants relationship with the staff, council, and planning commission will result in a better development for the developer and builder – and a better city. The local consultant will likely have a familiarity with the people involved in the approval process, but may be far too easy compliant with every demand and change – no matter how absurd, than to argue a valid point with the city. They may know the design or idea is superior to the same old way things are done, but will try to convince the developer (who is paying for their services) the good idea is a bad idea. Progress stagnates – and this a major reason many new subdivisions looks the same (or worse) than one designed in the 1960’s.

Kluge #3: The cities’ regulations. Cities have in-house staff or hire outside consultants to maintain and update their regulations which are essentially a boiler-plate document of the adjacent city. Nothing in the regulations reward developers for doing a better job. Will the development be an asset or an instant slum? If it meets the minimums – it must be approved! That’s it.

Smart Code? There is nothing smart about this dumb idea – it only guarantees the consultant pushing these incredibly complex and restrictive codes is forever retained to consult at every city meeting. Overly restrictive code guarantees mindless replication and places a roadblock to progress and innovation.

Kluge# 4: Technology used to develop land. I’ve been developing and marketing civil engineering, surveying, and design software for almost four decades. On a sales call – what do you think is the first question? How much faster can we get our work out? What’s the question I’ve never heard? How much better can we design our neighborhoods for our clients and those that will live within? The billions of dollars spent on CAD and GIS technology, training, updates, hardware, and support has resulted in zero difference in the actual pattern of growth! City planning commissions and councils are presented the same 2D plans that nobody can understand and visualize. Virtually unchanged since 1960, but presented in PowerPoint instead of transparency slides on an overhead projector.

Kluge #5: The land development consulting industry itself. I know of no other industry where the main design professionals (architects, planners, engineers, surveyors, etc.) are less likely to collaborate and communicate to assure the end user (the resident or business owner) is best served. There are many reasons why this is such a dysfunctional industry. The professionals involved have completely different skillsets. They often conflict with the others’ skillsets. All this can be solved with a new era of consulting industry where all involved have a common knowledge base to begin with – somewhat like the medical industry. This leads us to the next kluge...

Kluge #6: The universities only teach a narrow focus on an isolated aspect of the development process. With a ‘common knowledge base’ where a student will learn all aspects with technology and systems that can advance the industry we can tear down the barriers of communication and build collaboration. One major problem: the professors. They will need to harness better technologies and re-learn themselves – making an effort and need to communicate and collaborate among themselves.

Kluge #7: What happened to teaching - design? The world has morphed down to only a few major players in the software industry who have done nothing to advance the growth and redevelopment process through research and innovation. Over generations, gradually the world loses skillsets that were commonplace before computers existed. This is why all those new apartment projects and commercial buildings look the same, and that new subdivision is more mundane and cookie-cutter than in the past.

Kluge #8: Traffic regulations and trendy roundabouts. Don’t even try to convince me that roundabouts are a good idea, they are not. Of the well over 1,000 neighborhoods I’ve designed this past 26 years I’ve included a total of 3 roundabouts. There are much better alternatives that are safer and maintain flow, reducing time and energy while increasing safety.

Have you ever passed a restaurant thinking you are a bit hungry, but then decide to pass it up because you are routed a ridiculously long distance of multiple intersections to the place and instead pass it by? We all have. Instead of making access more efficient and convenient, often these rules do quite the opposite. As a pedestrian or on your bike have you ever tried to cross at a roundabout? Did you feel safer than at a signalized intersection? Progress? No. Kluge? Yes. Thus roundabouts are safer for pedestrians because most go far out of their way to avoid crossing them!

Kluge #9: Streets as the pedestrian route. Subdividing land is all about density – little about function. The pattern assures the most units (housing or commercial square footage) are sardined into a site. This pattern sets the street first – lots second. Nothing else. Pretty simple and quick with the latest technology (kluge #4). What of the streetscape (curb appeal, monotony)? What’s the views from within the home to adjacent open space? What open space? How easy is it to walk through the neighborhood to destinations you would want to walk or ride a bike to? Walks that simply follow the internal streets are highly unlikely to make a stroll convenient, thus the mindless walks designed automatically in CAD will discourage a stroll. To fix this deficiency, the vehicular and the pedestrian routes should be two different systems, merging where it makes sense.

Kluge #10: Revisions along the approval process. Suppose, an experienced and talented land planner carefully thought through the design of the neighborhood. The traffic entering maintains flow along streets void of monotony. There is a separate and connective pedestrian system, and the site plan follows the natural terrain honoring natures design, while reducing run-off and earthwork – which in turn saves the trees. At the first public meeting, the neighbors complain about traffic and the city planner demands you not connect at the proposed locations and add some new connections. You make small changes and as a result your traffic no longer flows as the planner designed. The engineer simply complies (see kluge #2). The length of the cul-de-sac is 70 feet longer than allowed, and will need to be adjusted, but that destroys the placement on top of a knoll which makes more sense, and the main trail connecting through the cul-de-sac is rerouted which destroys the pedestrian connectivity.

As a software developer and president of my company I do not allow kluges. The LandMentor system we developed has taken 12 years, mostly because it’s kluge free. I seriously doubt there is any software of any type that exists that has a 12 year initial development process. What we learned from the software business applies to land development and home design (single family and multifamily) - when problems arise or revisions are demanded, it’s most often better to start afresh than force an older ‘invested’ idea to work, the very definition of a kluge.

There is no quick fix to sustainable development, and no place for kluges.

Rick Harrison is President of Rick Harrison Site Design Studio and Neighborhood Innovations, LLC. He is author of Prefurbia: Reinventing The Suburbs From Disdainable To Sustainable and creator of LandMentor. His websites are rhsdplanning.com and LandMentor.com

Photo: Zoedovemany (Own work) [CC BY-SA 4.0], via Wikimedia Commons

Rising Rents Are Stressing Out Tenants And Heightening America's Housing Crisis

$
0
0

The home-buying struggles of Americans, particularly millennials, have been well documented. Yet a recent study by Hunt.com found that the often-proposed “solution” of renting is not much of a panacea. Rents as a percentage of income, according to Zillow, are now at a historic high of 29.1%, compared with the 25.8% rate that prevailed from 1985 to 2000.

No surprise, then, that 58% of the 1,300 renters in the Hunt survey said they felt “stressed” about their rent, or that many respondents said they couldn’t save for future purchases like homes. Rather than the sunny freedom promised by those who promote a “rentership society,” most of those surveyed said that finding a convenient place with the amenities they required – for example, fitness rooms, places for pets and adequate space – was very difficult. Some renters have been forced to euthanize their pets, spend upwards of 50 days looking for a place or move farther from family and friends.

All of this is taking place at a time when the national vacancy rate has fallen to 7.3% (in the second quarter of 2017), from 11.1% in the third quarter of 2009. That trend has continued even with apartment construction in many areas, notably core cities, because the new buildings tend to be too expensive for most renters.

Fuel for a Housing Crisis

There is a strong relationship between high rents and high house prices. Although rents have not risen as much as house prices generally, they tend to attract people who in the past might have become homeowners but instead have been crowded out by the high prices. This essentially brings into the rental market more affluent tenants who directly compete with those with lower incomes.

The result in many places, such as Southern California, is overcrowding. Two-thirds of the places in the United States (municipalities and census-designated places) with more than 5,000 residences and with more than 10% of housing units being overcrowded are in California, according to the American Community Survey.

The rent-related stress also points to a bigger crisis: the decline in the purchase of homes. One of the most prominent reasons for not buying a house directly relates to higher rents: It becomes all but impossible to save enough for a down payment. This also reflects changes in the labor market; service and blue-collar workers, whose incomes have been down in relation to rents, are the most burdened by rising rents. In San Francisco, even a teacher has been driven into the ranks of the homeless.

The situation is worst in the most expensive markets. In New York City, incomes for millennials (ages 18–29) have dropped in real terms compared with the same age cohort in 2000, despite considerably higher education levels, while rents have increased 75%. New York, Los Angeles and San Francisco have three of the nation’s four lowest homeownership rates for young people and among the lowest birthrates.

According to Zillow, for workers ages 22-34, rent costs claim up to 45% of income in the Los Angeles, San Francisco, New York and Miami metropolitan areas, compared with closer to 30% of income in metros like Dallas-Fort Worth and Houston. Home prices provide an even starker contrast. Dallas-Fort Worth, the nation’s fastest-growing housing market, as well as Houston, San Antonio and Charlotte have prices that are more like one-third those of the superstars.

That helps explain why, according to the Hunt survey, the highest percentage of people who cannot save for future purchases (almost 60%) live on the pricey West Coast. The West Coast also had the largest percentage of people stressed about their rent, followed, not surprisingly, by the East Coast.

High rents may also help explain recent shifts in migration to lower-rent areas. A recent survey by Apartmentalist.com found that the best prospects for renters becoming homeowners are in metropolitan areas like Pittsburgh, Provo, Madison, San Antonio, Columbus, Oklahoma City and Houston; the worst are, not surprisingly, in California, New York, Boston and Miami.

Profound Implications

What emerges from the Hunt study, and other research, is a renting population that may never achieve homeownership. This represents a sort of social evolution from the culture of self-assertion and independence that once so clearly characterized America after World War II and was so important to the unprecedented spread of middle-income affluence. Rather than striking out on their own, many millennials are simply failing to launch, with record numbers living with their parents or forced to shell out much of their income rent.

The implications of high rent, and declining home ownership, could be profound over time. In survey after survey, a clear majority of millennials — roughly 80%, including the vast majority of renters— express interest in acquiring a home of their own. A Fannie Mae survey of people under 40 found that nearly 80% of renters thought that owning made more financial sense, a sentiment shared by an even larger number of owners. They cited such things as asset appreciation, control over the living environment and a hedge against rent increases.

But it won’t just be renters impacted by rising rents. Jason Furman, who served as chairman of the Council of Economic Advisors under President Obama, calculated that a single-family home contributed two and a half times as much to the national GDP as an apartment unit.

The decline in investment in residential properties has dropped to levels not seen since World War II. By some estimates, if we had that kind of housing investment again, we would return to 4% growth, as opposed to our all-too-familiar 2% and below.

America’s housing crisis, long tied to ownership, is now extending into rising rents. But the stress that renters are feeling impacts all of us.

This piece originally appeared on Forbes.com.

Joel Kotkin is executive editor of NewGeography.com. He is the Roger Hobbs Distinguished Fellow in Urban Studies at Chapman University and executive director of the Houston-based Center for Opportunity Urbanism. His newest book is The Human City: Urbanism for the rest of us. He is also author of The New Class ConflictThe City: A Global History, and The Next Hundred Million: America in 2050. He lives in Orange County, CA.

Wendell Cox is principal of Demographia, an international public policy and demographics firm. He is a Senior Fellow of the Center for Opportunity Urbanism (US), Senior Fellow for Housing Affordability and Municipal Policy for the Frontier Centre for Public Policy (Canada), and a member of the Board of Advisors of the Center for Demographics and Policy at Chapman University (California). He is co-author of the "Demographia International Housing Affordability Survey" and author of "Demographia World Urban Areas" and "War on the Dream: How Anti-Sprawl Policy Threatens the Quality of Life." He was appointed to three terms on the Los Angeles County Transportation Commission, where he served with the leading city and county leadership as the only non-elected member. He served as a visiting professor at the Conservatoire National des Arts et Metiers, a national university in Paris.

Photo: Omar Bárcena, via Flickr, using CC License.

Housing Unaffordability Policies: "Paying for Dirt"

$
0
0

Issi Romem, buildzoom.com's chief economist has made a valuable contribution to the growing literature on the severe unaffordability of housing in a number of US metropolitan areas. The disparities between the severely unaffordable metropolitan areas (read San Jose, San Francisco, Los Angeles, Portland, Seattle, Portland, Denver, Miami, New York, Boston, Sacramento and Riverside-San Bernardino) and the many more affordable areas in America are described in "Paying For Dirt: Where Have Home Values Detached From Construction Costs". Romem points out that: "In the expensive U.S. coastal metros, home prices have detached from construction costs and can be almost four times as high as the cost of rebuilding existing structures."

"Paying for dirt" refers to the ballooning land costs that now comprise an unprecedented part of house values, such as in the severely unaffordable metropolitan markets above. This has created an environment where affordability is impossible. In many of these metropolitan areas, a modest house commands an exorbitant price well beyond the financial capacity of most middle income households. Land has become so expensive that it doesn't matter what is built on it, whether the average house or a tent, the price will be too high. The market distortions are so great that Romem is able to show that, for example, the average house value in Columbus, Ohio, a delightful metropolitan area, is less than the average land value per lot in Portland (Oregon).

The research suggests that the variation in construction costs between US metropolitan areas pales by comparison to the differences in the land costs. In the most expensive housing market, San Jose, the average house value is seven times that of Buffalo, the least expensive. By contrast, the highest cost construction market (San Francisco) is only twice as expensive as the least (Las Vegas). The land cost differences are stark, exceeding a 40 times difference in San Jose compared to Buffalo or Indianapolis. In Indianapolis, new detached house construction in 2017 was 2.5 times that of much larger and more expensive San Diego.

The Research

Romem's research is similar to that of Harvard's Edward Glaeser and Wharton's Joseph Gyourko ("The Economic Implications of Housing Supply"), who separated US metropolitan areas into those with "well-functioning" housing markets and those without. In the well-functioning housing markets homebuilders could construct houses for what the researchers called the "minimum profitable production cost. Their list of high cost markets that are not well-functioning nearly matches Romem's list of metropolitan areas where land costs have risen most compared to construction costs. Romem provides estimates down to the ZIP Code level in major metropolitan areas, illustrating a substantial depth of analysis.

Consistent with Glaeser and Gyourko, Romem finds that "absent restrictions on housing supply, competition among developers tends to maintain average metropolitan home prices tethered to the cost of construction."

The Problem of Excessive Land Use Regulations

In the highly regulated metropolitan areas, promoters of the urban containment policies often hide behind the fiction of topographical or geographical barriers as having created the land scarcity. A particular favorite for this blather is the San Francisco Bay Area (which includes the San Francisco and San Jose metropolitan areas) that has driven house prices up so much. There is no question that topography and geography can create such a shortage, as this photograph of Maldives capital Male shows. But nothing in the Bay Area looks like Male (photograph above).

But San Francisco and San Jose are nothing like Male. In fact, the San Francisco Bay Area has enough land for development that millions of new houses could be constructed. San Francisco's urbanization is dense, with at least 15 more residents per square mile than the New York urban area (population centre). Its population, nearly one-third that of New York, lives in an even smaller one-fourth the land area. There would be no need for urban containment in the Bay Area if the topography genuinely limited development.

Toward A More Unequal Society

In a note, Romem says that "The stark differences in land value per home are driven largely by land use policy enacted in the expensive coastal metros since the 1970s, which has inhibited these cities' growth. These metro areas have gradually slowed down their outward expansion, i.e. they have had success in stemming sprawl, but they have failed to compensate through densification. As a result, the economic vitality of these metros has been channeled away from population growth and into housing price growth."

"Stemming sprawl" while maintaining housing affordability through higher densities is a time-worn theory. The record seems to indicate that it is more likely Santa will come down the chimney than density will solve the problem. There are no virtually examples of housing markets (metropolitan areas) where increasing densities has restored affordability. This is not to suggest there is no value to increased density, but rather that it is an all too convenient diversion from solutions that have a chance of working.

Appropriately, Romem puts this childish notion to rest that increasing densities "will reduce the land value component of homes simply by dividing a fixed land value over a greater number of units."

The bottom line is that the house price appreciation in the high cost metropolitan areas suppresses population by "selectively determining who can and cannot afford to live there" according to Romem. This policy outcome could not be more inconsistent with encouraging economic aspiration among middle-income households, who pay the price of the greater inequality imposed by public policy. Further, those effectively "zoned out" by these policies have greater financial challenges than their parents, who generally grew up in periods of greater economic growth and were not saddled with unprecedented student loan debt.

The financial and exclusionary challenges weigh particularly hard on the large number of disadvantaged African-Americans and Hispanics, especially those living in the most progressive cities, where pious pronouncements about affordable housing initiatives are boilerplate, but rarely amount to anything remotely substantive. In fact, distorted land and housing markets in the expensive metropolitan areas represent a colossal government failure.

Necessary Reforms

To the contrary, housing affordability requires well-functioning housing markets. It requires home values that have not become detached from construction costs. A minimum condition is that land use regulations not stand in the way of building low cost housing tracts on the periphery of urban areas. This does not require building on the monstrous size lots of suburban Boston, where zoning and other land use restrictions have made housing far more expensive and exclusive than it needs to be. The key is to restore the competitive market for land, so that houses on comparatively small lots, such as one-quarter or one-fifth of an acre can be built at the historic land costs (including necessary infrastructure). Glaeser and Gyourko found this factor to account for about 20 percent of final purchase prices (as did I).

Romem expresses a hope that things will improve. "The disparity between the appearance of homes and their price tags is more than a home buyer’s gripe: it is a telltale indication of restricted housing supply. Such restrictions – rules governing land use, installed by incumbent residents or their predecessors – are exclusionary by nature and amount to the gating of access to opportunity. Hopefully, this study has helped identify where gates must be opened."

Indeed.

Wendell Cox is principal of Demographia, an international public policy and demographics firm. He is a Senior Fellow of the Center for Opportunity Urbanism (US), Senior Fellow for Housing Affordability and Municipal Policy for the Frontier Centre for Public Policy (Canada), and a member of the Board of Advisors of the Center for Demographics and Policy at Chapman University (California). He is co-author of the "Demographia International Housing Affordability Survey" and author of "Demographia World Urban Areas" and "War on the Dream: How Anti-Sprawl Policy Threatens the Quality of Life." He was appointed to three terms on the Los Angeles County Transportation Commission, where he served with the leading city and county leadership as the only non-elected member. He served as a visiting professor at the Conservatoire National des Arts et Metiers, a national university in Paris.

Photograph: Male (capital of the Maldives): Where there are genuine topographical constraints.
https://upload.wikimedia.org/wikipedia/commons/6/67/Male_maldives.jpg

The New State Role Models

$
0
0

With Congress on what appears to be a permanent hold, the search for a workable political model now shifts increasingly to states and localities. Today America’s divergent geographies resemble separate planets, with policy agendas from immigration and climate change that vary wildly from place to place.

The greatest divide lies between the deep blue states, notably California, and progressive America’s network of large urban centers and the generally less dense, more suburban-dominated red states. Their policy prescriptions may vary, but, if allowed to continue, the differing jurisdictions could end up serving as what Supreme Court Justice Louis Brandeis called “laboratories of democracy.”

So, the critical question remains what policies work best. The answers may not be as simple as ideologues on the left and right might claim, but instead suggest, as President Bill Clinton once did, that our stunning diversity cannot easily follow a single political script.

California and the blue state model

Democrats may be at a historic low in terms of control of states and local jurisdictions, but they boast almost total domination in many of the richest, most influential and powerful locales. New York, California, Connecticut, Illinois and New Jersey are all tilting left with policies driven by powerful public employees, greens, urban real estate speculators as well as ethnic and gender activists.

To be sure, kowtowing to these interests has landed these states among the worst fiscal situations in the nation. Yet some blue regions also have grown economically well above the national average since 2010, largely driven by asset inflation, particularly real estate and stocks, and technology. California’s robust growth, although now slowing, and its world-dominating tech sector has made it a creditable role model for similarly minded states.

But what has been good in the aggregate has not worked so well for most Californians. Despite all the constant complaining about inequality and racial injustice, California, notes progressive economist James Galbraith, has also become among the most economically unequal parts of the country, topped only by Connecticut, New York and New Jersey. Particularly damaged have been the prospects for the young and minorities, particularly in terms of achieving homeownership.

Read the entire piece at The Orange County Register.

Joel Kotkin is executive editor of NewGeography.com. He is the Roger Hobbs Distinguished Fellow in Urban Studies at Chapman University and executive director of the Houston-based Center for Opportunity Urbanism. His newest book is The Human City: Urbanism for the rest of us. He is also author of The New Class ConflictThe City: A Global History, and The Next Hundred Million: America in 2050. He lives in Orange County, CA.

Photo: Entheta (talk)Salt_Lake_Temple,_Utah_-_Sept_2004.jpg: Diliff (Salt_Lake_Temple,_Utah_-_Sept_2004.jpg) [CC BY 2.5, GFDL or CC-BY-SA-3.0], via Wikimedia Commons

Viewing all 3795 articles
Browse latest View live


Latest Images