Quantcast
Channel: Newgeography.com - Economic, demographic, and political commentary about places
Viewing all 3795 articles
Browse latest View live

The Great Betrayal of Middle America

$
0
0

America’s vast midsection, a region that has been hammered by globalists of both parties, has been abandoned by the great corporations that grew fat on its labor and resources.

To many from the Appalachians to the Rockies, Donald Trump projected a beacon of hope. Despite the conventional wisdom among the well-heeled of the great coastal cities, these resource and manufacturing hubs elected the new president.

Yet barely six months after his election, Trump is emerging as the latest politician to betray middle America.

Some of this is his awful management and communications style, which may well leave the country frozen until it is returned to the care of the coastal hegemons, tech oligarchs, high-level bureaucrats, academics, and media elitists whose views of the Heartland range from indifferent to hostile. The rise of China may have been a convenient source of cheap labor and more recently investment capital and lots of full load tuitions for universities, but according to the left-leaning Economic Policy Institute, our deficit cost the country 3.4 million jobs, most in manufacturing.

Trump’s trade rhetoric, like that of Bernie Sanders, excited the people and communities affected by these policies, but it remains questionable whether his own voters will benefit from his regime. Certainly the president’s tax proposals have been tailored to appeal to his billionaire friends more than the middle class. His health care reforms failed to prioritize those who feel threatened by loss of coverage, however much they gripe about the inanities of Obamacare.

Meanwhile promises that could help middle-America, like a massive infrastructure program, appear to be roadkill squashed beneath Trump’s staggering ineptitude and his Republican Party’s dysfunction.

There is no chance he will succeed in convincing voters he’s making America great again, let alone in actually doing so, if he cannot address the reasons why companies desert our towns and cities for all but elite functions, leaving so much of America in tatters.

A Failed Peasant’s Revolt

In its incoherence and lack of organization, Trump’s victory less resembled a modern social movement than a peasant’s revolt from the Middle Ages. His campaign lacked a coherent program, although its messenger, a New York narcissist, possessed a sixth sense that people “out there” were angry. Trump’s message was negative largely because he had nothing positive to say, though that had the useful effect of driving his enemies slightly insane.

So while he’s succeeded in stirring the blue hornet’s nest, he’s created no productive movement. Successful social movements—the Jacksonians, the New Dealers, the Reaganites, and the European social democrats—directly appealed to the working class with policies that for better or worse, challenged the existing social and economic hierarchy.

Trump, like Jackson, identified with the plight of the “left behind” America, notably rural areas and small towns that have seen their business communities shrink, while larger metropolitan areas have grown much faster. The new economic order, evident throughout the Obama era, represents what urban analyst Aaron Ren describes as “the decoupling of success in America. Those who are succeeding in America no longer need the overall prosperity of the country to personally do well. They can become enriched as a small, albeit sizable, minority.”

Trump brilliantly played off this geographic and class segmentation. But unlike others who successfully played populist themes, Trump did not emerge from and understand the mindset of those further down the social order, as did Jackson, Lincoln, Truman, Reagan, Nixon, and Bill Clinton. Trump simply stoked resentments, many but not all well-justified.

Trump has taken few concrete steps to address the causes of his supporters’ distress. Changes in trade negotiations and jawboning corporations are good first steps but limited in their effect. There is little in what he’s proposed since January that would help the middle and working class. Unlike Reagan, who cut rates across the board, Trump seems to be listening mostly to the Goldman Sachs grandees to whom he has entrusted our economy.

In the end Trump’s modern-day peasants will be left stranded like the supporters of European peasant rebellions of the European middle ages, like England’s Jack Cade in the 15th century, or the Taiping rebels in mid-19th century China. These movements grew bright, stormed across the countryside, and conquered cities, until the forces or order imposed themselves and eliminated the most rebellious of their subjects. Hong Xiuquan, the leader of the Taiping, committed suicide in 1864, as the 14-year rebellion failed. Cade, of course, was killed, as recounted in Shakespeare’s Henry the 6th, still proud of his “unconquered soul” but nevertheless despised by the ruling classes.

The Revenge of the Clerisy

Trump, of course, won’t end up executed, but simply excommunicated from polite society. He will creep back to his Manhattan keep, surrounded by gold and glitter, celebrated by as many retainers as he can afford. The same, however, cannot be said for those who rallied to his cause in the thus-far unrealized hopes that we could protect them from the cognoscenti’s plans to refashion, and largely diminish, ordinary American’s daily lives and economic prospects.

Trump’s faltering rebellion has been manna from heaven for the same swamp people—in both parties—who have been steering our democratic republic toward feudalism for a generation. Their ideology, notes author Michael Lind, sees themselves as a deserving meritocracy rather than a reflection of the persistence of social class.

In the end, Trump may succeed in doing something that, a few months ago, would have seemed impossible. He has elevated the very people who concocted policies, from “free trade” to open borders to the wars of the Middle East and Obamacare, that alienated millions of Americans. He has woken up the entire apparatus, from the CIA and FBI to the State Department and the EPA, who now send their insider effluence to the remaining journalists who consider bringing down the president as the new crusade.

It is not too much of an exaggeration that the media is now a fundamental part of progressive clerisy. According to the Center for Public Integrity, 96 percent of all media outlet donations went to Hillary Clinton last year. This process has been accelerated by the shift of media to an ever smaller, and ever more blue series of cities. More than half of all journalism jobs are now in cities which Clinton won by over 30 points; in 2008 they had less than a third.

This may explain why celebrating and even being participants in the “deep state resistance”—which would seem to be contrary to traditional liberal views about popular sovereignty—has become a critical part of the media messaging. Yet, particularly after Trump, the clerisy no longer feels it needs to contain its contempt for the population. One does not have to be a Trump supporter to see the long-term dangers to democratic governance from over-empowered civil servants openly contemptuous of voters and the people they vote for.

Over the next few years, Trump’s failure will elevate these “experts” who, in the anti-expert Trump, have found a perfect foil. Every time the president, or his minions, say something stupid (which is often), the talking heads and academics can harrumph about how the country should be run by Ph.D.s and J.D.s who, they feel, should direct rule on the unruly masses from above. To combat them, Trump lacks the eloquence of a Reagan, or the ferocity of a Jackson.

Oligarchs Restored

The notion of “Making America Great Again” had its flaws, but appealed to people who hoped to see middle-class jobs return to the country. It energized the suburbs and small cities who now find themselves led by an incompetent leader who appears to have used them, like patrons of a casino. Lured by an image of glamour they will find their wallets lightened rather than their spirits lifted.

The big winners long-term as Trump fails to deliver will be the country’s emergent tech oligarchy. Allied with the clerisy, and with an expanding, soon to be dominant, role in the media, they will create the conditions and define the future culture. Hollywood and Wall Street will be partners, but the nerds of the Valley will rule the economy.

To be sure automation and digitization brings many benefits, but Silicon Valley firms have secured advantage for reasons beyond being technically adept. Firms like Apple pay little in the way of taxes (thanks as much to Republicans as Democrats), and companies like Google manage to avoid anti-trust action. The rules are different for the oligarchs; they can afford to raise money without making a profit, as was the case of Amazon, Uber, and others. The shop on Main Street, or the store owner in the strip mall, enjoy no such advantage.

It is almost impossible to overestimate the power of these corporations. Apple alone for example has more cash on hand than the total reserves of both the United Kingdom and Canada. Four of the world’s richest people come from either the Seattle or Silicon Valley tech community. More important for the future, techno-nerds account for the most of 23 American billionaires under 40; 12 live in San Francisco, the de facto blue capital, alone.

The triumph of the oligarchs may spell the end of America as we have known it. Increasingly the core functions—and the big rewards—are concentrated in fewer hands and in fewer places. The distress being felt in rural areas and second-tier cities has its roots in globalization which, as Chicago sociologist Richard Longworth suggested two decades ago, undermines the industrial and routine business functions while boosting the already fantastic wealth of top echelon of executives, and those who serve them.

To keep the voters and the people they vote for at bay, the oligarchs will make common cause with the social justice warriors (as we saw during the election) and the greens to confine and control the terms of our national conversation as they work to expand and enforce a neo-feudal order.

The hoi polloi? They will get a stipend from the wealth generated by the oligarchs like Mark Zuckerberg. Likely not enough to start a business or own a home, but good enough to stave off homelessness or starvation. Silicon Valley and its media tools will forge a generation plugged into its phone but that owns little, and spends its limited capital on media, gadgets, and other idle pursuits. Americans will become more like a nature of serfs, their daily bread dependent on the kindness of their betters, their iPhone serving as both the new confessional and ephemeral town square.

This is precisely the America that Trump’s supporters sought to prevent, but may soon be stuck with. Not because the middle and working class has failed, but because Trump, due to his dysfunctional ways and inborn class biases, has betrayed the very people who put him in office.

This piece originally appeared on The Daily Beast.

Joel Kotkin is executive editor of NewGeography.com. He is the Roger Hobbs Distinguished Fellow in Urban Studies at Chapman University and executive director of the Houston-based Center for Opportunity Urbanism. His newest book is The Human City: Urbanism for the rest of us. He is also author of The New Class ConflictThe City: A Global History, and The Next Hundred Million: America in 2050. He lives in Orange County, CA.

Photo by Jax House, via Flickr, using CC License.


The Coming Democratic Civil War

$
0
0

Even before the election of Donald Trump, and more so afterwards, the dysfunction of the GOP has been glaringly obvious. Yet, despite the miserable favorability ratings for both Trump and the Republicans, those of the Democrats, notes Gallup, also have been dropping, and are nearly identical to that of the Republicans.

What gives? Simply put, the Democrats seem to know only what they are against — Trump — but have provided no clear sense of where they want to take the country. The party, and much of the nation, despises Trump, but there does not seem to be any huge pent-up national demand for the Democrats to take over — at least, not yet.

Part of the problem is major chasms underneath the absurd faux solidarity of the “resistance” movement on the left. These have been largely hidden in the increasingly uniformly pro-Democratic media. These differences extend beyond personal fiefdoms or stylistic differences. They reflect deep divides in terms of class and geography, and will not be easy for the party leadership to reconcile.

The gentry vs. populists

The two most remarkable campaigns of 2016 — those of Trump and Bernie Sanders — were driven by different faces of populist resentment. Yet, increasingly, the Democrats’ populist pretensions conflict with their alliance with ascendant “sovereigns of cyberspace,” whose power and wealth have waxed to almost absurd heights. Other parts of their upscale coalition include the media, academia and the upper bureaucracy.

This affluent base can embrace the progressives’ social agenda — meeting the demands of feminists, gays and minority activists. But they are less enthusiastic about the social democratic income redistribution proposed by Bernie Sanders, who is now, by some measurements, the nation’s most popular political figure. This new putative ruling class, notes author Michael Lind, sees its rise, and the decline of the rest, not as a reflection of social inequity, but rather their meritocratic virtue. Only racism, homophobia or misogyny — in other words, the sins of the “deplorables” — matter.

The Washington Post, owned by Jeff Bezos, the world’s third-richest man, reflects this socially liberal, but oligopolistic, worldview. Last spring, Bezos worked assiduously to undermine Sanders’ campaign, then promoted Clinton, and now has become a leading voice in the anti-Trump “resistance.” The gentry wing of the party, which dominates fundraising and media, as the opposition to Sanders reveals, likes its money. The tech community is famously adept at avoiding taxes.

How long can this odd pairing of socialism and oligopoly persist? There are growing sentiments on the left to begin confiscating some of the massive wealth of the tech firms. Bank of America’s Michael Harnett recently warned that continued growth of stock market wealth in a handful of tech stocks “could ultimately lead to populist calls for redistribution of the increasingly concentrated wealth of Silicon Valley.”

Read the entire piece at The Orange County Register.

Joel Kotkin is executive editor of NewGeography.com. He is the Roger Hobbs Distinguished Fellow in Urban Studies at Chapman University and executive director of the Houston-based Center for Opportunity Urbanism. His newest book is The Human City: Urbanism for the rest of us. He is also author of The New Class ConflictThe City: A Global History, and The Next Hundred Million: America in 2050. He lives in Orange County, CA.

Photo by AFGE, via Flickr, using CC License.
America's Most Suburbanized Cities

$
0
0

Recently, The Wall Street Journal and Newsday, in a photographic spread, trumpeted the 70th anniversary of Levittown, the New York suburban development that provided the model for much of the rapid suburbanization that occurred after the Second World War in the United States. Levittown's production line building also set the stage for the similar suburbs of cities in Canada, Australia, New Zealand and elsewhere.

Over the last seven decades, the United States has become a predominantly suburban nation. In 2011-2015, 85 percent of the population in the 53 major metropolitan areas (over 1,000,000 population) lived in the suburbs or exurbs. This is based on analysis at the small area level (zip code tabulation areas) from the American Community Survey that classifies population based on demographic data (Figure 1).

Generally similar findings have been made about Canada and Australia by research teams led by Professor David L. A. Gordon of Queen's University in Kingston, Ontario. Gordon and his Canadian team pioneered this type of analysis, which is not dependent on core municipality versus surrounding area analysis. Core municipalities often do not reflect the realities of metropolitan areas because they vary so greatly in their share of metropolitan area population. For example, the city of Atlanta has only 8 percent of the metropolitan area population, while San Antonio has more than 60 percent of the metropolitan area population.

Suburban Nation: United States

Many people, including urban analysts, are unaware of the extent to which American cities have become suburbanized. But the former mono-centricity that characterized most metropolitan areas at the end of World War II has been replaced first by multi-centered suburban employment development (polycentricity) and more recently by dispersion of employment. As early as 2000, more people worked in dispersed worksites in the major metropolitan areas, including New York, than in the downtowns (CBD's) and suburban office centers, according to research by Bumsoo Lee and Peter Gordon. City Sector Model analysis shows that CBDs lost two percent of their market share from 2000 to 2015, based on a City Sector Analysis of County Business Patterns data. It seems likely that the trend of dispersion has continued (Figure 2).

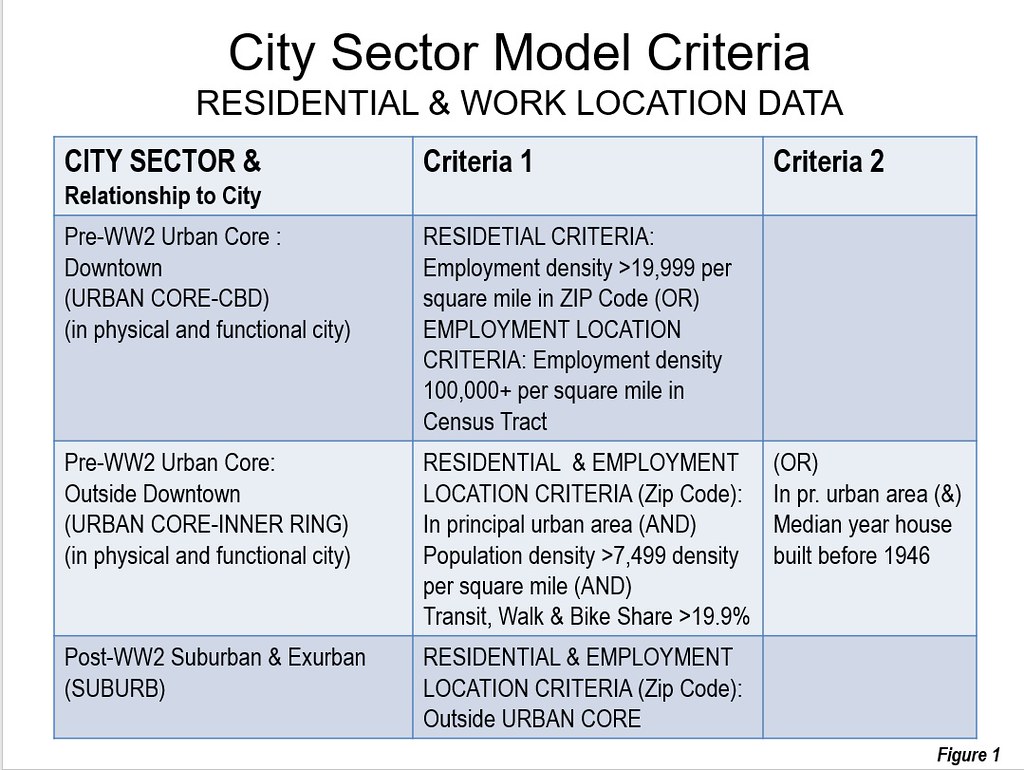
We took a look at the population distribution of the 53 major metropolitan areas (those with more than 1,000,000 population) to rate down by the extent to which they are suburban. The City Sector Model classifies the population of any area where there is an employment density of 20,000 or more as a CBD considers the urban core inner ring to have population densities exceeding 7500 per square mile. Such densities were characteristic of pre-automobile urban areas in the United States. According to estimates prepared by the Urban Land Institute, in 1920 the 24 urban areas with more 250,000 residents had an average population density of 7500.

As it turns out, 10 metropolitan areas have virtually no urban core population by this definition. To rank these metropolitan areas by their extent of suburbanization, we broke the 10 way tie by ranking the metropolitan areas by the extent of their exurban population. Exurban areas have very low population densities (250 per square mile or less) and are generally outside the urban area, which includes all contiguous built up area, surrounded by rural territory.

Seven of the 10 most suburban cities are in three states. Three are in Florida and two each in North Carolina and Arizona. They are listed in the Table 1, and data is provided for all 53 in Table 2.


Table 1
Most Suburban Cities: (Metroplitan Areas)
1Charlotte, NC-SC
2Riverside-San Bernardino, CA
3Raleigh, NC
4Orlando, FL
5Birmingham, AL
6Jacksonville, FL
7Phoenix, AZ
8San Antonio, TX
9Tampa-St. Petersburg, FL
10Tucson, AZ
Out of 53 with more than 1,000,000 population

The Most Suburban: Charlotte, NC-SC

Charlotte turns out to be the country’s most suburban metropolitan area. The exurban commuting patterns of Charlotte expanded substantially over the 2000 to 2010 decade, which resulted in the largest geographic expansion of any major metropolitan area. Its exurban population is 51 percent and its urban population density is approximately 1,700.

2nd Most Suburban: Riverside-San Bernardino, CA

Second ranked Riverside-San Bernardino, which in many ways is an extension of the Los Angeles metropolitan area (and is included in the Los Angeles combined statistical area), ranked as the second most suburban city. However, like other California cities, Riverside-San Bernardino is comparatively dense as an urban area, ranking above both Chicago and world renown densification model Portland as the 11th densest major urban area in the nation.

3rd Most Suburban: Raleigh, NC

At the opposite end of the density scale is third ranked Raleigh, a high tech center with an exurban population of 42 percent. Raleigh has an urban area population density of approximately 1,700, about the same as top ranked Charlotte and 16th ranked Atlanta.

4th Most Suburban: Orlando, FL

Fourth ranked Orlando has an exurban population of 34 percent and is suburban by nature. This is not surprising considering that it is virtually all new, having principally been developed since Walt Disney World made its decision to locate there and other entertainment venues followed.

5th Most Suburban: Birmingham, AL

Fifth ranked Birmingham, Alabama's largest city, had far slower growth than most major metropolitan areas of the South. In 1950, the metropolitan population was approximately 20 percent behind Atlanta, according to the 1950 census. Now, virtually all-suburban Atlanta has grown to nearly 5 times that of Birmingham since that time. Even so, Birmingham has expanded to have the lowest density of any principal urban area in a major metropolitan area.

6th Most Suburban: Jacksonville, FL

Sixth ranked Jacksonville, another all-suburban metropolitan area has an exurban population of 25 percent.

7th Most Suburban: Phoenix, AZ

Phoenix, like Orlando is virtually all a postwar product. With its 100 percent suburban population, 19 percent of it is in the exurbs ranking Phoenix as seventh most suburban. Phoenix is the largest among the all-suburban cities, with more than 4.6 million residents and is likely to displace San Francisco to become the nation's 11th largest metropolitan area this year, and could take 10th position away from Boston by the 2020 Census.

8th Most Suburban: San Antonio, TX

San Antonio, ranked as eighth most suburban, with an exurban population of 17 percent.

9th Most Suburban: Tampa-St. Petersburg, FL

Tampa – St. Petersburg ranks as the ninth most suburban city, with a 14 percent exurban population. Like San Antonio, Tampa has a comparatively strong downtown area, but its inner densities do not reach the levels necessary for population to be classified as urban core.

10th Most Suburban: Tucson, AZ

Tucson, the newest entry among the nations 53 major metropolitan areas takes the 10th position and rounds out the cities that are 100 percent suburban.

Other Cities

Nashville and San Jose ranked 11th, but are very different. Nashville, as the capital of Tennessee, has a comparatively strong CBD, but the urban area is one of the least dense. On the other hand, San Jose, which is really an extension of the San Francisco metropolitan area and a part of the San Francisco Bay combined statistical area has a weak CBD, but a very high urban area density. San Jose ranks after only Los Angeles and San Francisco in its urban density and ahead of the sprawling New York urban area.

There are a total of 34 metropolitan areas that are 95 percent or more suburban. These include examples such as Atlanta, at 99.2 percent San Diego at 98.9 percent Sacramento at 98.3 percent, Austin and 97.9 percent, Denver at 96.9 percent and Portland at 90.0 percent.

Los Angeles, with the nation's densest urban area, is 89.4 percent suburban, nearly matched by Seattle's 89.3 percent.

A number of older cities are overwhelmingly suburban as well, such as St. Louis at 88.4 suburban, Minneapolis-St. Paul at 86.8 percent, Washington at 83.3 percent, and Milwaukee at 76.6 percent. Chicago, Philadelphia, Providence, San Francisco – Oakland and Buffalo are all more than 70 percent suburban.

Boston and New York are considerably less suburban than the other 51 major metropolitan areas. Boston is 64.3 percent suburban, while New York is the only major metropolitan area that has a larger urban core population than its suburban and exurban area. New York is only 46.7 percent suburban.

Fast Growing and Automobile Oriented

As with all suburban areas, these suburban cities are automobile oriented. The journey to work transit market shares average 1.7 percent, one third of the national average for all areas. They are also among the fastest growing, with six ranking in the top 10 for 2010 to 2016 growth. A close look shows that the American urban form is changing, but not in ways commonly discussed among planners, urban land speculators and many academics.


Table 2
Cities (Metropolitan Areas) Ranked by Extent of Suburbanization
Major Metropolitan Areas: 2011-2015
Share (%) of Metropolitan Population by Sector
RankMetropolitan Area% SuburbanCBDUrban Core: Inner RingEarlier SuburbsLater SuburbsExurbs
1Charlotte, NC-SC100.0%0.0%0.0%10.2%39.2%50.6%
2Riverside-San Bernardino, CA100.0%0.0%0.0%28.9%29.6%41.5%
3Raleigh, NC100.0%0.0%0.0%7.4%56.8%35.8%
4Orlando, FL100.0%0.0%0.0%15.7%50.6%33.7%
5Birmingham, AL100.0%0.0%0.0%41.6%25.2%33.2%
6Jacksonville, FL100.0%0.0%0.0%25.6%49.0%25.4%
7Phoenix, AZ100.0%0.0%0.0%29.1%52.0%18.9%
8San Antonio, TX100.0%0.0%0.0%38.6%44.1%17.3%
9Tampa-St. Petersburg, FL100.0%0.0%0.0%44.2%41.7%14.1%
10Tucson, AZ100.0%0.0%0.0%46.9%41.0%12.2%
11Nashville, TN99.8%0.2%0.0%24.4%36.9%38.5%
12San Jose, CA99.8%0.1%0.1%77.5%9.3%13.0%
13Houston, TX99.6%0.4%0.0%33.2%50.0%16.4%
14Dallas-Fort Worth, TX99.5%0.2%0.3%33.7%43.1%22.7%
15Virginia Beach-Norfolk, VA-NC99.5%0.0%0.5%45.9%38.0%15.7%
16Atlanta, GA99.2%0.2%0.6%14.8%70.8%13.6%
17San Diego, CA98.9%0.0%1.1%61.3%30.9%6.7%
18Sacramento, CA98.3%0.0%1.7%37.7%40.9%19.8%
19Memphis, TN-MS-AR98.1%0.0%1.9%39.9%35.3%23.0%
20Austin, TX97.9%0.4%1.7%15.4%63.0%19.6%
21Las Vegas, NV97.6%0.4%2.0%16.2%77.7%3.8%
22Oklahoma City, OK97.2%0.4%2.4%34.1%32.6%30.6%
23Miami, FL97.1%0.3%2.6%50.0%44.8%2.4%
24Denver, CO96.9%0.5%2.7%42.7%42.7%11.4%
25Grand Rapids, MI96.5%0.0%3.5%33.0%15.4%48.0%
26Salt Lake City, UT96.5%0.0%3.5%47.9%39.2%9.3%
27Richmond, VA95.6%0.0%4.4%38.5%38.4%18.6%
28Columbus, OH95.3%0.0%4.7%28.5%38.6%28.3%
29Indianapolis. IN95.0%0.3%4.6%27.3%42.6%25.2%
30Kansas City, MO-KS94.8%0.2%5.0%37.5%26.9%30.4%
31Detroit,  MI93.7%0.1%6.1%60.2%16.6%17.0%
32Louisville, KY-IN91.2%0.5%8.3%44.5%26.0%20.8%
33Cincinnati, OH-KY-IN90.0%0.6%9.4%40.3%27.9%21.8%
34Portland, OR-WA90.0%0.7%9.3%36.0%39.7%14.3%
35Los Angeles, CA89.4%0.4%10.1%76.1%5.3%8.0%
36Seattle, WA89.3%1.1%9.7%35.9%40.7%12.6%
37New Orleans. LA89.1%0.2%10.7%50.3%7.0%31.8%
38Hartford, CT88.7%0.1%11.2%77.4%1.0%10.3%
39Rochester, NY88.6%0.3%11.1%46.8%7.9%34.0%
40St. Louis,, MO-IL88.4%0.1%11.5%39.6%26.1%22.7%
41Minneapolis-St. Paul, MN-WI86.8%0.5%12.7%31.4%33.7%21.7%
42Baltimore, MD84.3%1.4%14.3%42.0%20.6%21.8%
43Pittsburgh, PA84.1%1.3%14.5%56.0%5.0%23.1%
44Washington, DC-VA-MD-WV83.3%1.6%15.1%28.2%36.6%18.4%
45Cleveland, OH78.3%0.0%21.7%48.5%13.6%16.2%
46Milwaukee,WI76.6%1.6%21.7%50.7%10.5%15.4%
47Chicago, IL-IN-WI74.2%1.2%24.6%44.9%18.5%10.8%
48Philadelphia, PA-NJ-DE-MD74.1%0.9%25.0%50.5%15.1%8.5%
49Providence, RI-MA73.9%0.6%25.5%47.9%2.8%23.1%
50San Francisco-Oakland, CA73.0%3.3%23.7%54.0%7.6%11.4%
51Buffalo, NY71.0%0.3%28.7%51.3%3.1%16.6%
52Boston, MA-NH64.3%3.2%32.5%48.6%3.6%12.2%
53New York, NY-NJ-PA46.7%6.5%46.8%35.2%5.5%6.0%
Derived from American Community Survey using City Sector Model


Wendell Cox is principal of Demographia, an international public policy and demographics firm. He is a Senior Fellow of the Center for Opportunity Urbanism (US), Senior Fellow for Housing Affordability and Municipal Policy for the Frontier Centre for Public Policy (Canada), and a member of the Board of Advisors of the Center for Demographics and Policy at Chapman University (California). He is co-author of the "Demographia International Housing Affordability Survey" and author of "Demographia World Urban Areas" and "War on the Dream: How Anti-Sprawl Policy Threatens the Quality of Life." He was appointed to three terms on the Los Angeles County Transportation Commission, where he served with the leading city and county leadership as the only non-elected member. He served as a visiting professor at the Conservatoire National des Arts et Metiers, a national university in Paris.

Top photograph: Exurban Charlotte, by author.

Las Vegas Lessons, Part 1

$
0
0

I spent much of last week in Las Vegas for the International Council of Shopping Centers' RECON 2017, the world's largest real estate convention. It's a gathering for developers, brokers, property owners, retailers, architects, landscape designers, construction companies, municipalities and more to get together to discuss real estate possibilities, in the one city that owes its very existence to aggressive real estate ventures.

I had a good time, at least as much as I could; being there for a convention is far different from being there for pleasure. In fact, I've been to Vegas many times before, but always within a business context and never for pleasure. Also, I had not been in about 15 years, which is important for two reasons: 1) in Vegas time, with the rapid pace of development there, 15 years is an eternity; and 2) it completely predates the establishment of this blog, so I can include my thoughts on the city in this forum.

In that vein, here's a Corner Side Yard take on the Sin City -- part urbanist, part sociologist, part economist, all observational -- that details my thoughts on a truly unique place.

The Strip and the city of Las Vegas are two entirely different entities. I think this subtle distinction, which few outsiders really know about, is key to understanding Las Vegas' growth and development. Hal Rothman's book Neon Metropolis, published in 2003, notes that the Las Vegas Valley grew in three distinct phases: the Union Pacific Railroad, the construction of Hoover Dam and military investment enter the picture prior to 1945; organized crime arrives and Nevada legalizes gambling, driving investment and perceptions through the 1960s; and the passage of two Corporate Gaming Acts in 1967 and 1969, which drew corporate investment into the area (partly as a means to dilute criminal investment). In that second phase, and continuing into the third, casino developers sought to avoid city development and permitting regulations by setting up outside of the city boundaries, which is at Sahara Avenue on Las Vegas Boulevard (aka the Strip). What most people recognize as Las Vegas is actually the unincorporated communiites of Winchester, Paradise and Spring Valley -- significantly sized communities of their own, but under the jurisdiction of Clark County, Nevada. The county, which has two-thirds of Nevadans within its boundaries, takes a far more laissez-faire approach to development than the city of Las Vegas does, and directly reaps the benefits of development without having to pass through the city. That being said...

The Strip is a great pedestrian experience. Anyone familiar with the Strip knows that a stroll of the roadway is an experience unto itself. From north to south, the Strip builds as a visual spectacle beginning at the Stratosphere toward Circus Circus and continuing to the Wynn and Encore, before reaching a crescendo at the intersection of the Strip with Flamingo Road, where the Bellagio, the Venetian, the Flamingo, Caesar's Palace, Paris, and Planet Hollywood converge (see the picture above). The dense concentration of resorts continues southward past the MGM Grand to include the Tropicana, the Escalibur, the Luxor, and Mandalay Bay. Architects and urbanists Robert Venturi, Denise Scott Brown and Scott Izenour wrote of the Strip in their 1972 book Learning From Las Vegas, and one of their criticisms at the time was the isolation of the resorts via massive parking lots. If anything, the developers should be commended for revising their thinking on the Strip by creating the pedestrian environment. Yes, it's gaudy, yes, it's a jarring juxtaposition of architectural styles, but it does what so many other cities still fail to do -- bring the experience right to the street. A great addition to the Strip is the usage of escalators and pedestrian bridges to minimize pedestrian interaction with the high-traffic Strip, serving a dual purpose as entrances into connected resorts. Which means...

The Strip is an exclusively private space. It might be better to think of the Strip as the world's largest mall, because its private management reminds me of enclosed shopping centers, writ very large. It's clear that every inch of the Strip has been thought out as a way to collect and divert traffic into the resorts -- the Monorail stops, the signage on the pedestrian walkways. If you're looking dial down the Strip's intensity through quiet public open spaces, you're out of luck. The best you can do is find something inside one of the many resorts.

Downtown Las Vegas is quite different from the Strip. Continue northward on Las Vegas Boulevard and eventually you will enter downtown Las Vegas. This is where the earliest hotels and casinos were established, the ones that drew visitors in by railroad as opposed to automobile. Resorts here are smaller and less overwhelming. It has a long-standing reputation for being a little more downscale, even seedier, than the Strip further south, but the city has worked hard to clean up its image and make it a fantastic destination in its own right. The Fremont Street Experience, an open-air pedestrian mall with a super-sized LED canopy display, unites several of the downtown casinos with an experience that's completely different from the more well-known Strip. However, downtown Las Vegas probably maintains a secondary status in the Las Vegas Valley because...

There are poor linkages between downtown Las Vegas and the Strip. The Fremont Street Experience in downtown Las Vegas sits about two miles north of the city's southern boundary, where the Stratosphere hotel and casino are located. Downtown is about three miles north of where the real action and activity begins near the Wynn and Encore resorts. In between are the kinds of warehousing, light industrial, marginal commercial and grimy multifamily structures often found on the outskirts of downtown areas. There are wedding chapels, auto repair shops, convenience stores, and the like. There's nothing that easily draws visitors between the Strip and downtown. Why?

The north end of the Strip is plagued with high-profile failed projects. The Fountainbleau Resort Las Vegas and Echelon Place stand out as two high-profile casualties of the Great Recession, proposed just as the Strip was developing a continuous string of modern resorts that would reach from the Strip all the way into downtown. The Fountainbleau, a $2.8 billion project first proposed in 2005 with the second tallest structure in the Las Vegas Valley, managed to reach 70 percent completion before construction stopped in 2009 when the project went into bankruptcy. The $7.2 billion Echelon Place was announced in 2004, and the implosion of the Stardust Hotel and Casino, which it was to replace, happened in 2007. However, there were fits and starts in its construction due to the economy, until the developers sold the site in 2013. The new owners are proposing a new venture called Resorts World Las Vegas, but that project too has been plagued with delays. It's clear that had these two projects been developed, they would have had a catalytic impact on further development northward toward downtown.

That's enough about the city and the Strip; I'll follow up soon with more thoughts on the overall region's built environment, economy and potential future.

This piece originally appeared on The Corner Side Yard.

Pete Saunders is a Detroit native who has worked as a public and private sector urban planner in the Chicago area for more than twenty years.  He is also the author of "The Corner Side Yard," an urban planning blog that focuses on the redevelopment and revitalization of Rust Belt cities.

Photo by Carol M. Highsmith [Public domain], via Wikimedia Commons

Is Your Transportation Project a Boondoggle?

$
0
0

Tony Dutzik, writing for the progressive Frontier Group, offers a ten ways of recognizing whether a highway project is a boondoggle. A few of his ideas are valid: a highway widening project aimed simply at creating a continuous four-lane road even when there is no demand for four lanes seems silly. But most of his suggestions are wrong: for example, he thinks that, if environmentalists have delayed a project long enough, that proves it shouldn’t be built, when in fact all it proves is that our current planning process allows people to indefinitely delay projects for little or no reason.

In response, I’d like to offer my own list of ten ways to determine whether a transportation project is a boondoggle. His list focused on highways, though some of his suggestions (“It is sold as needed for economic development”) are valid for transit. Although my list starts out with transit projects, it eventually applies to all types of transportation projects.

1. It’s a streetcar. Streetcar technology is 130 years old and has since been replaced by less expensive, more flexible buses. Streetcars being built today are no faster and are far more expensive than the ones built 130 years ago. All new streetcar projects and rehabilitations of existing streetcar lines are boondoggles.

2. It’s light rail. What we call light rail is a slight improvement on streetcars developed in the 1930s, meaning it is “only” 80 years old. Light-rail lines constructed today are no better, and far more expensive, than ones built in the 1930s. Buses can move more people faster and for far less money. All light-rail lines, new and rehabilitations, are boondoggles.

3. It’s commuter rail outside of the New York metropolitan area. New York City is the only city in America with jobs and populations so dense that buses can’t substitute for rail. Elsewhere, new commuter rail lines in places such as Dallas-Ft. Worth, Nashville, Orlando, Salt Lake City, South Florida, and elsewhere are so ridiculously expensive and carry so few commuters that in many cases it would have been less expensive to give every daily round-trip commuter a new Toyota Prius every single year for the life of the train. This also includes what the FTA calls “hybrid rail“–Diesel-powered railcars operating on commuter-rail or light-rail schedules. The New York exception doesn’t mean it makes sense to start new commuter trains there, but maintenance and rehabilitation of existing trains may be worthwhile (though see #9 below). All new commuter trains, and rehabilitations of trains outside of New York, are boondoggles.

4. It’s rapid transit, a.k.a. heavy rail, outside of New York City. Again with the exception of New York (though this time the city, not the metro area), electric-powered rapid transit–which was invented in the early 1890s by the same man who perfected the electric streetcar–has been rendered obsolete by buses. A dedicated busway can move more people at higher speeds and lower costs than the Chicago Transit Authority or Washington Metro. No new rapid-transit lines should be built anywhere–even New York–and as older rapid-transit lines wear out–except in New York (again, see #9 below)–they should be replaced by buses. All new rapid-transit lines, and rehabilitations of rapid transit outside of New York, are boondoggles.

5. It’s a dedicated busway. I just wrote that dedicated busways can replace rapid transit, but very few places in America need dedicated busways. Instead, build high-occupancy/toll lanes, and as bus traffic increases, raise the tolls to insure the lanes never get congested. At some point, the tolls may get so high that they effectively become dedicated busways, but at that point the buses will be moving far more people than almost any rail line outside of, again, New York City. All dedicated busways are boondoggles.

6. It’s an intercity passenger train. Conventional speed, higher speed, high speed, it doesn’t matter: intercity passenger trains were rendered obsolete by cars, buses, and planes. Their infrastructure and maintenance costs are much higher than any of the alternatives, and their operating costs will always be higher than at least some of the alternatives. Amtrak claims its Northeast Corridor is profitable, but that’s only by pretending maintenance and depreciation don’t count. Railroads make sense for freight; they no longer make sense for passengers. All intercity passenger trains are boondoggles.

7. It’s a smart highway. Various electronics companies want the government to spend hundreds of billions of dollars building intelligent transportation systems into roads to prepare the way for self-driving cars. But this is dumb; it is much more cost-effective to put all the smarts in the cars and keep the infrastructure simple, especially since local governments can’t afford to maintain the infrastructure they have now, much less smart infrastructure. Since cars are replaced more often than infrastructure, this also enables more rapid updates in technology. All intelligent highway projects that require vehicle-to-infrastructure communications are boondoggles.

8. It’s a bike lane project that reduces the number of lanes for automobiles. Many cities are attempting to encourage cycling while simultaneously discouraging driving by converting auto lanes to bike lanes, such as by changing a four-lane street to a two-lane street with a center left-turn lane and two bike lanes. This probably doesn’t increase bicycle safety, but it does increase traffic congestion. It is nearly alway possible to find parallel local streets that can be turned into bicycle boulevards without impeding through or local auto traffic. All bicycle projects that reduce the capacity of arterial or collector streets to move automobiles are boondoggles.

9. It can’t be paid for out of user fees. The primary beneficiaries of all transportation projects are the transportation users. Paying for transportation out of user fees is equitable since it is only fair for users to pay for what they use. More important, user fees send signals to both users and transportation providers informing users of when and where travel is most cost effective and informing providers of where new transportation facilities might be needed. User fees also impose a discipline on both providers and users that prevents boondoggles from taking place. Any transportation facility that can’t be paid for out of user fees is a boondoggle.

10. It doesn’t generate increased travel or shipping. Anti-highway groups complain that new roads “induce” more driving, and they think that is a bad thing. They advocate instead for transit projects whose users were former auto drivers. They have it backwards. Transportation projects that merely transfer users from one mode of travel to another more expensive mode are a drag on society. Projects that generate new travel create new economic opportunities. Only by generating new travel can projects stimulate economic development. Given a choice between projects that can be paid for out of user fees, the ones that generate the most new travel should be funded first.

In truth, the last two points cover everything. But the first eight are important because there is so much pressure to do those things that are actually boondoggles.

This piece first appeared on The Antiplanner.

Randal O’Toole is a senior fellow with the Cato Institute specializing in land use and transportation policy. He has written several books demonstrating the futility of government planning. Prior to working for Cato, he taught environmental economics at Yale, UC Berkeley, and Utah State University.

Photo by Josh Truelson (San Diego Trolley) [CC BY-SA 2.0], via Wikimedia Commons

How Does Housing Stock Affect Urban Revitalization?

$
0
0

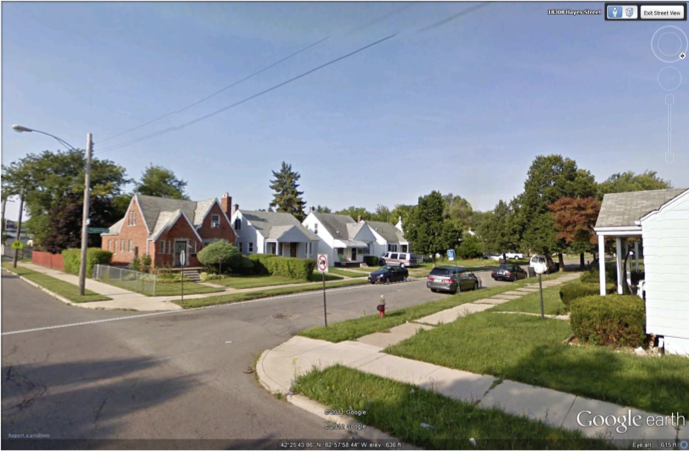
The second of Pete Saunders’ nine reasons why Detroit failed is “poor housing stock,” particularly its overweighting towards small, early postwar cottages. Here’s a sample:


Here’s what Pete had to say:

Detroit may be well-known for its so-called ruins, but much of the city is relentlessly covered with small, Cape Cod-style, 3-bedroom and one-bath single family homes on slabs that are not in keeping with contemporary standards for size and quality…..The truth, however, is that Detroit may have one of the greatest concentrations of post-World War II tract housing of any major U.S. city….True, Detroit has more than its share of abandoned ruins that negatively impact housing prices. But it also has many more homes that simply don’t generate the demand that higher quality housing would. That is a major contributor to the city’s abundance of very cheap housing.

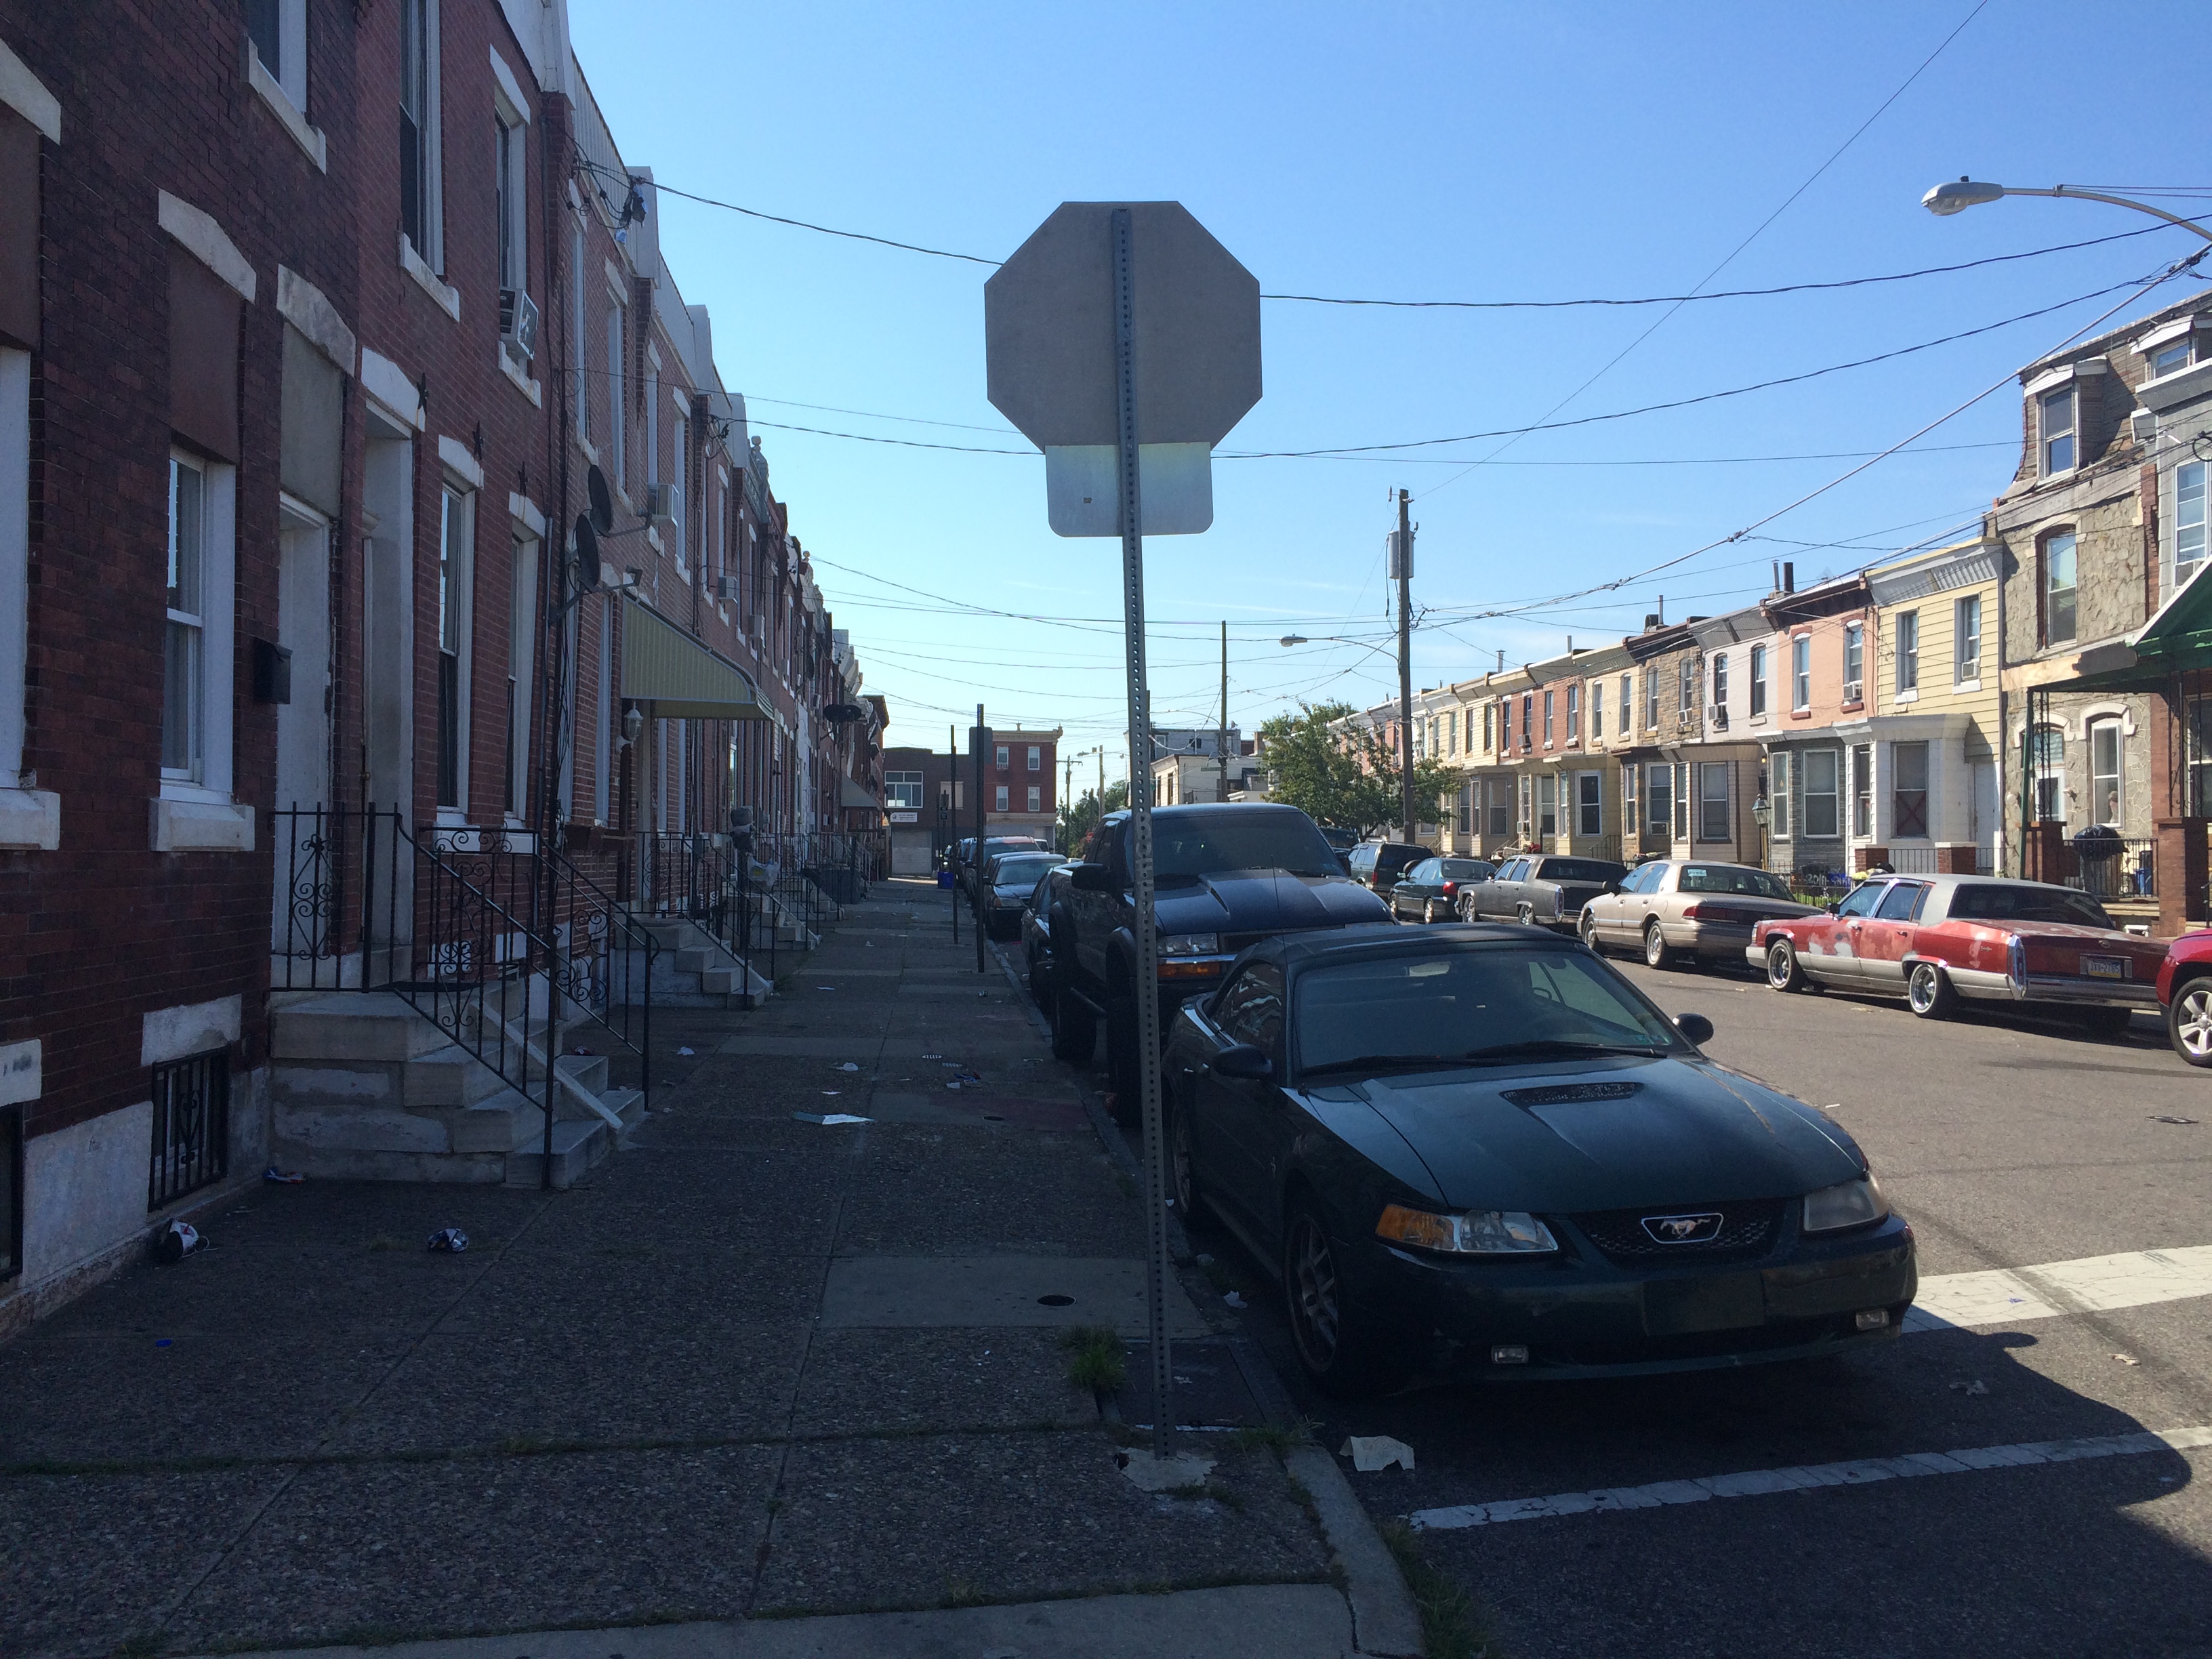
I have often been struck by the same thing in Philadelphia. There are some districts of great buildings, but most of the city is made up of mile after mile of two-story, very small row houses. Here’s a snap I took in the Kensington neighborhood that provides a sample.

This is decent density of these to be sure. However, keep in mind that most of these row houses contain a single unit. The Upper West Side brownstone I live in has been converted into ten units. Also, many of these rowhouse units are extremely shallow. Here’s a picture I found online that illustrates a typical depth.

Photo credit: Flickr/pwbaker CC BY-NC 2.0

As it happens, there has been some redevelopment activity in Kensington, both in residential and industrial spaces. (Some neighborhoods nearby are seeing significant redevelopment).

Someone I know recently bought and renovated a rowhouse in the neighborhood, so I got to tour it. It’s a two-bedroom unit, but very small. It’s barely bigger than your average one bedroom apartment. Unsurprisingly, the person who bought it is in her 20s and single.

As nice as this unit was, it’s basically a starter home, much like those Detroit Cape Cods. Cities need to have housing like that, but if it is overwhelmingly dominant, that’s not healthy.

It’s similar to how so many downtowns are seeing tons of Millennial targeting apartment construction. Older families can have trouble finding housing in these areas because there isn’t great housing to take you through your full lifecycle.

Philadelphia should be fine in the near term. The city has great bones and I really find it compelling in a lot of ways. But I wonder if this type of housing stock is one reason the city has seen less demand than other old major tier one urban centers with great transit.

I put out a poll on Twitter about this and most people didn’t seem to agree with me on the potential negative of being overweight very small rowhouses. We will see how this plays out for Philly.

Aaron M. Renn is a senior fellow at the Manhattan Institute, a contributing editor of City Journal, and an economic development columnist for Governing magazine. He focuses on ways to help America’s cities thrive in an ever more complex, competitive, globalized, and diverse twenty-first century. During Renn’s 15-year career in management and technology consulting, he was a partner at Accenture and held several technology strategy roles and directed multimillion-dollar global technology implementations. He has contributed to The Guardian, Forbes.com, and numerous other publications. Renn holds a B.S. from Indiana University, where he coauthored an early social-networking platform in 1991.

This piece originally appeared on Urbanophile.

Top photo by Aaron M. Renn.

California’s Descent to Socialism

$
0
0

California is widely celebrated as the fount of technical, cultural and political innovation. Now we seem primed to outdo even ourselves, creating a new kind of socialism that, in the end, more resembles feudalism than social democracy.

The new consensus is being pushed by, among others, hedge-fund-billionaire-turned-green-patriarch Tom Steyer. The financier now insists that, to reverse our worsening inequality, we must double down on environmental and land-use regulation, and make up for it by boosting subsidies for the struggling poor and middle class. This new progressive synthesis promises not upward mobility and independence, but rather the prospect of turning most Californians into either tax slaves or dependent serfs.

California’s progressive regime of severe land-use controls has helped to make the state among the most unaffordable in the nation, driving homeownership rates to the lowest levels since the 1940s. It has also spurred a steady hegira of middle-aged, middle-class families — the kind of tax-burdened people Gov. Jerry Brown now denounces as “freeloaders” — from the state. They may have access to smartphones and virtual reality, but the increasingly propertyless masses seem destined to live in the kind of cramped conditions that their parents and grandparents had escaped decades earlier.

A green people’s republic?

There is some irony in a new kind of socialism blessed by some of the world’s richest people. The new policy framework is driven, in large part, by a desire to assume world leadership on climate-related issues. The biggest losers will be manufacturing, energy and homebuilding workers, who will see their jobs headed to other states and countries.

Under the new socialism, expect more controls over the agribusiness sector, notably the cattle industry, California’s original boom industry, which will be punished for its cows’ flatulence. Limits on building in the periphery of cities also threaten future growth in construction employment, once the new regulations are fully in place.

Sadly, these steps don’t actually do anything for the climate, given the state’s already low carbon footprint and the fact that the people and firms driven out of the state tend to simply expand their carbon footprints elsewhere in their new homes. But effectiveness is not the motivation here. Instead, “combating climate change” has become an opportunity for Brown, Steyer and the Sacramento bureaucracy to perform a passion play, where they preen as saviors of the planet, with the unlikable President Donald Trump playing his role as the devil incarnate. In following with this line of reasoning, Bay Area officials and environmental activists are even proposing a campaign to promote meatless meals. It’s Gaia meets Lent.

Read the entire piece at The Orange County Register.

Joel Kotkin is executive editor of NewGeography.com. He is the Roger Hobbs Distinguished Fellow in Urban Studies at Chapman University and executive director of the Houston-based Center for Opportunity Urbanism. His newest book is The Human City: Urbanism for the rest of us. He is also author of The New Class ConflictThe City: A Global History, and The Next Hundred Million: America in 2050. He lives in Orange County, CA.

Photo by Fortune Live Media, via Flickr, using CC License.
Where Manufacturing Is Thriving In The U.S.

$
0
0

Throughout the dismal presidential campaign, the plight of America’s manufacturing sector played a central role. Yet despite all the concerns raised about factory jobs leaving the country, all but 18 of the country’s 70 largest metropolitan regions have seen an uptick in industrial employment since 2011. And despite the slowdown in car sales, the job count continues to expand, albeit more slowly. 

Although the share of industrial jobs has shrunken from 10.5%of all nonfarm employment in 2005 to 8.5% today, manufacturing continues to have an outsized influence on regional economies, as is spelled out in the latest paper from the Center for Opportunity Urbanism. This stems in large part from the industrial sectors productivity gains since2001 -- almost twiceas much as the economy-wide average, according to the Bureau of Labor Statistics-- and it has a far higher multiplier effect (the boost it provides to local job and wealth creation) than virtually any other sector. Manufacturing generates $1.40 in economic activity for every dollar put in, according to the U.S. Bureau of Economic Analysis, far greater than the multiplier generated by business services, information, retail trade or finance. 

To determine the places where manufacturing growth is the strongest, we looked at employment in the sector over time, assessing short-, medium- and long-term trends going back to 2005 and adding in variables for persistence and momentum as well. The results of these trends, based on three-month averages, are normalized and each MSA is assigned a score based on its relative position in each area. (For a more detailed description of the methodology, click here.) The rankings this year produced some surprising results, as well assome familiar stories. 

Gallery: The U.S. Cities Where Manufacturing is Thriving

Red States And The Rust Belt Win

Nine of this year’s top 10 regions for manufacturing job growth are in red states, led by top-ranked Louisville-Jefferson County, which straddles the border between Kentucky and Indiana. Since 2011, manufacturing employment in the metropolitan area has expanded 30.2% to a total of 83,300 jobs, led by a resurgent auto industry that accounts for 27,000 jobs in the area. Due to a slowdown in auto sales, the job count may be peaking, but the hub of the Bluegrass State has had a pretty good ride. 

Louisville is no outlier in the old Rust Belt. Second-ranked Grand Rapids-Wyoming, Mich., has logged a 22%gain in industrial jobs over the same span, spread across a range of sectors including aerospace, advanced metals, automotive, office furniture and medical device manufacturing.In the longtime furniture-making center, 20% of jobs are in manufacturing, the highest proportion amongthe nation’s largest metro areas 

Our ranking features several other Midwestern cities on the industrial upswing: No. 4 Kansas City, Mo., No. 5 Warren-Troy-Farmington Hills, Mich.,and No. 10 Detroit-Dearborn-Livonia. Taken together the latter two Michigan metro areas are now home to over 245,000manufacturing jobs, up dramatically from the 205,500 manufacturing jobs they accounted for in 2011 and just below the 252,300 jobs they tallied a decade ago, before the Great Recession hit. 

Among the other red state winnersare Florida with third place West Palm Beach-Boca Raton-Delray Beach, where the industrial job count has grown 27.67% since 2011,in part from older industries such as food as well as technology,and No. 8 Orlando-Kissimmee-Sanford, where manufacturing growth is tied to the burgeoning aerospace sector. And then there’s the Beehive State’s economically buzzing capital of Salt Lake City in ninth place, where manufacturing job growth is spread along many industries, including aerospace,construction materials, metals and oil and gas-related manufacturing. 

Blue State Surprises 

Only one region outside the red states made it to the top 10: seventh-place Albany-Schenectady, N.Y. In a state and region that has been losing industrial jobs since the late 1960s, Albany has bucked the trend witha 17.6% gain in manufacturing jobs from 2011 to 2016 to to 25,800 positions. The areaboasts factories that produce steam and gas turbines,computer chips and medical supplies --- an impressive and diverse collection of cutting-edge industries.Meanwhile the industrial workforce in once-mighty New York City continues to whither. In 1950 the city had nearly a million manufacturing workers; now there are 74,100 after 4.7% shrinkage in 2016. New York ranks second to last in our survey among the 70 largest metro areas in the U.S. 

Gallery: The 15 U.S. Cities Leading An Industrial Renaissance

 Even in heavily regulated California, which has been continuously shedding industrial jobs since 1988 (about 800,000 manufacturing jobs lost to date), some areas are showing surprising new strength. Take Oakland-Hayward-Berkeley, which has seen a 12.7% jump in industrial jobs to 89,600 since 2011, ranking it 13th on our list. The big player here appears to be Tesla, whose Fremont factory employs 6,500. The Fremont area has become something of a hotspot, withmorethan 900 manufacturing companies including AlterG and LAM Research. 

Some believe it’s a byproduct of the Valley’s attempt to lay claim to “the Internet of things,” but other parts of the Bay Area are showing some signs of an industrial renaissance, including No. 18 San Francisco-Redwood City-South San Francisco and 22nd-ranked San Jose-Sunnyvale-Santa Clara. One big problem in some of these areas is attracting enough skilled workers given ultra-high housing prices. 

Industrial Players In Decline 

Many of the largest industrial areas are not doing so well. Houston, the nation’s third-largest manufacturing center,has seen industrial employment drop since 2011 by 5.49% to 220,900 jobs amid the skid in energy prices. Other oil patch economies have lost industrial jobs, includingNo. 57 Oklahoma City and No. 64 New Orleans-Metairie, La. Hopefully improved conditions for energy companies, particularly under President Trump, may improve prospects there as well. 

 It’s somewhat harder to find much hope for the nation’s two largest industrial regions. The Chicago-Arlington-Naperville region ranks 56th, having lost 1.85% of its industrial jobs since 2011, continuing decades of decline.Manufacturing in the City of Broad Shoulders has slumped from just under a million jobs in 1966 to 520,000 in 1990, 465,000 in 2000 and 281,000 today 

Even worse is the performance of Los Angeles-Glendale-Long Beach, which still has the most industrial jobs in the nation, some 356,000. Since 2011, the region has lost 3.47% of its industrial jobs, and2.10% last year alone. On paper the L.A. region should be benefiting from hosting the headquarters of Elon Musk’s SpaceX and buzzy startups like Hyperloop and AIO Robotics. But whatever is being gained by way of these companies has been more than canceled out by downsizing, outsourcing and automation across the sector, as well as continuing lossesin the aerospace and apparel industries. 

Ultimately the future of high-cost metro areas like L.A. and the Bay Area may rest to a surprising extent on their ability to link up with cutting-edge tech industries. Elsewhere lower-cost regions should experience some continued growth as the current presidential administration seeks to encourage more on-shoring of basic production.

This piece originally appeared on Forbes.

Joel Kotkin is executive editor of NewGeography.com. He is the Roger Hobbs Distinguished Fellow in Urban Studies at Chapman University and executive director of the Houston-based Center for Opportunity Urbanism. His newest book is The Human City: Urbanism for the rest of us. He is also author of The New Class ConflictThe City: A Global History, and The Next Hundred Million: America in 2050. He lives in Orange County, CA.

Photo by Industrial Traffic.com, via Flickr, using CC License.

Dispersed Cities: Starting the 3rd Decade

$
0
0

Cities (urban areas or settlements) have been around for millennia. Over that time, cities have changed in form and function. But the way that people move around the city has materially changed only twice. Walking was predominant until less than 200 years ago, then came mass transit, the automobile and now autonomous cars and some substitution for driving by online technology.

The Walking City

When walking predominated, cities had to be very dense, because things had to be close enough for pedestrian access. Walking Paris reached approximately 250,000 persons per square mile and London over 100,000 in the 17th century. The US also had dense walking cities, but they were smaller , emerged much later and never reached the highest densities of old-world cities. By 1820, New York had an estimated 50,000 residents per square mile, but a population of less than 150,000.

Indeed in 1820 urban travel was little different than in for the average resident than in the pre-urban temple center of Gobekli Tepe (Turkey) 11,000 years ago, the Caral (Peru) of 4,500 years ago or the Wangchenggang (China) of 4,000 years ago.

The Transit City

However, the second quarter of the 19th century saw the emergence of the mass transit revolution. The new the horse drawn omnibuses were affordable to many people, unlike individual horses and horse drawn carriages. Over nearly all of the next century, transit shaped the city. Services were expanded and improved. Electric streetcars and interurbans appeared. If the Census Bureau had asked a "journey to work" question in the 1900 census, the answers would have shown transit's share of mechanized to be virtually 100 percent.

During this period, transit shaped the dominant downtowns (central business districts or CBDs), as is chronicled by Robert Fogelson in Downtown: Its Rise and Fall: 1880-1950. Transit lines converged on the CBD, which was the key to its emergence as the central point of a monocentric city. Transit retained its primacy through much of the 1910s, as people who worked downtown were able to move further away.

The Automobile City

But, just as the transit city was peaking, the car began its ascent, with automobile ownership expanding rapidly in the 1920s. By 1929, 90 percent of the world's car registrations were in the United States, according to Northwestern University economist Robert Gordon. All of this made it possible to travel farther in urban areas and to live even farther from the urban core.

After the Great Depression and World War II, which slowed growth, automobile ownership expanded even more. By 1950, New York region's urban density had dropped below 10,000 per square mile and the average density among the principal urban areas in today's 53 major metropolitan areas (more than 1,000,000 population) was approximately 6,000 per square mile. By 2010, New York's urban density had dropped to 5,300, and Los Angeles had become the densest at 7,000. The average of the principal urban areas to 3,100.

Polycentricity's Short Interlude

The dominance of the automobile ended much of the need for a CBD. As people moved farther away (suburbanized), employment and commercial development also suburbanized. Large retail shopping centers appeared throughout the suburbs. Soon after, large employment centers developed outside the downtowns, such as Bellevue (Seattle), Uptown (Houston), Century City (Los Angeles) and Research Triangle (Raleigh-Durham). In 1991 Joel Garreau first brought centers like this to public attention, coining the term "edge city" in his book Edge Cities: Life on the New Frontier. It had become clear to those who were paying attention that the monocentric, CBD oriented US city was a thing of the past. There were still CBDs, of course, but most were shadows of their former selves in employment and shopping shares. American cities were increasingly referred to as "polycentric."

Dispersion: The New Urban Form

But polycentricity did not last very long. In 1997, University of Southern California economists Peter Gordon and Harry W. Richardson noted the trend toward dispersion in Beyond Polycentricity: The Dispersed Metropolis, Los Angeles, 1970-1990. In a 1998 Brookings Institution paper, they highlighted one of the most important advantages of dispersion. Traffic “doomsday” forecasts, for example, have gone the way of most other dire predictions. Why? Because suburbanization has turned out to be the traffic safety valve. Increasingly footloose industry has followed workers into the suburbs and exurban areas and most commuting now takes place suburb-to-suburb on faster, less crowded roads."

Further evidence came in 2003 from University of Nevada Las Vegas Professor Robert Lang who documented the dispersion of office space outside the CBDs in Edgeless Cities: Exploring the Elusive Metropolis.

Finally, Bumsoo Lee (now at the University of Illinois, Champaign-Urbana) and Peter Gordon published Urban Spatial Structure and Economic Growth in US Metropolitan Areas which looked at 2000 census tract data and classified employment based on job density into three categories, CBDs, subcenters and dispersed.

Among metropolitan areas with more than 500,000 population, all had most of their employment outside CBDs and subcenters. In other words, all metropolitan areas were more dispersed than polycentric or monocentric. Further, in the largest metropolitan areas, more than twice as many jobs were in subcenters as the CBDs (Figure 1).

• Among metropolitan areas with more than 3,000,000 residents, 77.9 percent of employment was dispersed, 15.0 percent in subcenters and 7.1 percent in CBDs.

• Among metropolitan areas with from 1,000,000 to 3,000,000 residents, 82.2 percent of employment was dispersed, 7.0 percent in subcenters and 10.8 percent in CBDs.

• Among metropolitan areas with from 500,000 to 1,000,000 residents, 82.6 percent of employment was dispersed, 5.6 percent in subcenters and 12.2 percent in CBDs.

Unfortunately, this research has not been updated with the results of the 2010 census. But, there is every reason to believe that the dispersion continued. A City Sector Model (Figure 2) analysis of County Business Pattern data suggests that the dispersion has continued (Figure 3). Between 2000 and 2015, 90 percent of new jobs were in the suburbs and exurbs. The largest gains were in the Later Suburbs and Exurbs, while there were losses in the Urban Core Inner Ring and the Earlier Suburbs. While there was an increase in CBD employment, exurban job growth was nearly twice as great.

This reality of the dispersed city, however, does not get in the way of media and others who talk as if the city remains monocentric. Yet in an era of new possibilities unleashed by technology --- Uber, Lyft, autonomous vehicles --- the likely trajectory is for more dispersion not less.

Wendell Cox is principal of Demographia, an international public policy and demographics firm. He is a Senior Fellow of the Center for Opportunity Urbanism (US), Senior Fellow for Housing Affordability and Municipal Policy for the Frontier Centre for Public Policy (Canada), and a member of the Board of Advisors of the Center for Demographics and Policy at Chapman University (California). He is co-author of the "Demographia International Housing Affordability Survey" and author of "Demographia World Urban Areas" and "War on the Dream: How Anti-Sprawl Policy Threatens the Quality of Life." He was appointed to three terms on the Los Angeles County Transportation Commission, where he served with the leading city and county leadership as the only non-elected member. He served as a visiting professor at the Conservatoire National des Arts et Metiers, a national university in Paris.

Top photo: Los Angeles, CBD, polycentric (Wilshire district, Hollywood and Glendale) and dispersed (the rest), by author.

The Superstar Gap

$
0
0

The biggest challenge facing many cities in transitioning to the knowledge economy is a shortage of “A” talent, especially true superstars.

All “talent” isn’t created equal. Crude measures such as the percentage of a region with college degrees, or even graduate degrees, don’t fully capture this. It is disproporationately the top performers, the “A” players and superstars that make things happen.

Sections of the knowledge economy have long been geared to superstars. Economist Enrico Moretti cites research on biotech hubs, in which he notes that it is not just having a top university nearby that mattered in establishing biotech clusters, but having the true handful of academic superstars researchers. In The New Geography of Jobs, he writes:

In a fascinating and now classic article and in a series of subsequent studies, they argued that what really explains the location and success of biotech companies is the presence of academic stars – researchers who have published the most articles reporting specific gene sequencing discoveries. Among top universities, some institutions happened to have on their faculties stars in the particular subfield of biology that matters for biotech; others had comparable research but did not have stars in that specific subfield. The former group created a local cluster of biotech firms while the latter did not.

Richard Florida devotes a significant amount of his latest book The New Urban Crisis discussing the rise of the superstar phenomenon, which he also links to specific superstar cities.

Superstars are important in tech because of the 10x principle I mentioned in my recent post on the Silicon Valley mindset. The best coders are 10x as productive as the merely very good coder. The top entrepreneurs are probably 100x or or more. The presence of superstars, along with some amount of good fortune, can transform the economy of a city or region.

Jeff Bezos is a superstar. Mark Zuckerberg is a superstar. Michael Bloomberg is a superstar.

These superstars are disproporationately located in only a handful of regions.

To see this effect, just look at Austin vs. Seattle. Austin is a booming, prosperous city with a major tech industry. Yet Seattle is generating significantly greater value. Seattle’s real per capita GDP is $75,960 vs. only $55,323 in Austin. Seattle’s per capita income is $61,021 vs. $51,014 in Austin.

Austin had some good entrepreneurs like Michael Dell, but not superstars in industries that would create massive platforms like Microsoft and Amazon. Austin has a lot of quantity, but it looks to me like there’s a big quality gap vs. Seattle.

And it’s not just that superstars create things, they act like a magnet attracting others. As economic development consultant Kevin Hively once told me, “When you’re the best in the world, people beat a path to your door.”

To see this in action, just look at Carnegie Mellon University in Pittsburgh. CMU has the #1 ranked computer science program in the country. And companies like Google (600 employees), Uber (500 employees), Apple (500 employees), Intel, and Amazon been drawn there and set up shops around it. Ford is investing a billion dollars into autonomous vehicle ventures there. And GM also has a presence.

It’s interesting to contrast with the University of Illinois’ program. U of I is ranked 5th in computer science. My impression is that from a commercial impact, they used to be bigger time than they are now. The web browser as we know it was invented there, but that was a long time ago. They have a research park designed for companies wanting to take advantage of proxmity of U of I. There are a lot of companies there, but the tech roster isn’t as marquee as Pittsburgh’s and my impression is that the scale is smaller.

There’s a big differnce between being number one and number five, particularly when something like ownership of the driverless car market is at stake. Maybe that’s why former GE CEO Jack Welch said he only wanted to be in a business if he could be number one or number two.

Cities and states in the Midwest and elsewhere in the interior like to boast of their assets, which include many great schools, but very few world dominating number ones in important fields. This is a big challenge for them.

Superstars aren’t the entire world. The presence of superstar businesses also creates problems as well as wealth. But if these places want to not only thrive but perhaps for some of them even just survive in the knowledge economy world, they need to look at their attractiveness to the truly top tier talent (I will address “A” caliber but not superstar talent in a future post). I don’t often see this talked about.

For example, one thing I don’t see in most discussion of Chicago is its lack of superstar talent. Chicago is very good but not the best in a lot of things. Where they do have arguably world beating talent, such as in their culinary industry, they shine. (I know people in New York who happily admit Chicago has better restaurants).

If I were that city, I’d be looking to see how to create a world’s best talent pool in additional particular high impact industries. Maybe the state should consider some radical type action, such as relocating U of I’s entire computer science and select engineering programs to Chicago as part of UI Labs, and putting serious muscle behind getting at least some critical subspecialities with high commerical potential to be clear #1’s in the world.

This is actually a scenario I plan to study in the future. Right now I’m not sure it’s necessary and some of my initial thoughts are impressionistic. So this post is in part a honeypot to try to lure in those who might react to this or even help flesh out the facts (which might augur against it).

Regardless, this lack of superstar/number one type talent in the interior is a big handicap in the world we live in now. For example, just look back at a 2010 analysis Carl Wohlt did of where the people on Fast Company’s “100 Most Creative People in Business” list lived. Only six in the Midwest and seven in the South vs. 35 in the West and 32 in the Northeast (with 20 international). This isn’t a scientific survey but illustrates the scope of the problem.

Cities and states need to take a more finer grained view of talent, and understand the criticality of having at least some of the absolute best talent to kicking a region’s knowledge economy into high gear. Too many places have a superstar gap.

This piece originally appeared on Urbanophile.

Aaron M. Renn is a senior fellow at the Manhattan Institute, a contributing editor of City Journal, and an economic development columnist for Governing magazine. He focuses on ways to help America’s cities thrive in an ever more complex, competitive, globalized, and diverse twenty-first century. During Renn’s 15-year career in management and technology consulting, he was a partner at Accenture and held several technology strategy roles and directed multimillion-dollar global technology implementations. He has contributed to The Guardian, Forbes.com, and numerous other publications. Renn holds a B.S. from Indiana University, where he coauthored an early social-networking platform in 1991.

Photo by John Picken (Flickr: Chicago River ferry) [CC BY 2.0], via Wikimedia Commons

Connecticut's Future is Suburban, Not Urban

$
0
0

Connecticut is now grappling with a fiscal and economic crisis that, according to some leading Democrats, has been caused by ineffective urban policy. In late May, Hartford-based insurer Aetna confirmed long-discussed rumors that it will be moving its headquarters from Connecticut. General Electric announced plans to move from Fairfield, Connecticut to Boston in January 2016. Though the Great Recession officially ended eight years ago, state budget forecasters are projecting a $2 billion deficit for next fiscal year, or 11 percent of the budget. One policy report published in March, when rosier estimates pegged Connecticut’s deficit at only 9 percent, ranked Connecticut as having the 8th largest shortfall among American states. Hartford, the state capital, is on the verge of bankruptcy.

What course should Connecticut take to stabilize government budgets and stimulate the economy? Gov. Dannel Malloy and Hartford mayor Luke Bronin believe that stronger cities are the answer. As Malloy said recently, explaining why his budget increases state aid for cities, “I think there is a body of people who don’t understand urban environments, and I think Connecticut has too long pursued a public policy of insufficient support for our urban environments.”

But there are many questions to raise about just how vital urban Connecticut is to the state’s future. Connecticut’s major cities have their charms, especially Hartford and New Haven. But in terms of meeting the enormous fiscal and economic challenges with which the state is now faced, they are and will remain less important than its suburban regions.

With all due respect to Gov. Malloy and Mayor Bronin, there’s a certain glibness in how they presume that Connecticut’s poor urban areas can be revitalized. It’s not as if their predecessors haven’t been trying. Any visitor to downtown Hartford and New Haven will be struck by several imposing works of mid-20th century modern architecture. Examples include Constitution and Bushnell plazas in Hartford and New Haven’s Temple Street Garage. These projects date back to the “urban renewal” era of the 1950s and 1960s, when massive government resources were devoted towards breathing new life into tired central cities.

New Haven was nationally-renowned for its urban renewal efforts, both because it focused just as much on rehabbing old buildings as demolishing them . Mayor Richard Lee’s “human renewal” social service programs anticipated criticisms that poverty can’t be cured through real estate development alone. But the widely celebrated Mayor Lee failed to hit the mark. New Haven, the “Model City,” was rocked by a race riot in 1967, as was Hartford in 1969.

Despite growing evidence that Connecticut cities were not coming back, urban renewal in modified forms would continue throughout the decades. In 1974, Hartford gained the “Hartford Civic Center,” (now known as the XL Center), a sports and entertainment venue where the NHL’s Hartford Whalers played from 1980 to 1997. The state’s convention center opened in Hartford in 2005, and a minor league baseball park just came online in April. And yet, among American cities with a population above 100,000, Hartford’s poverty rate is 8th highest in the nation. Mayor Bronin himself describes the current fiscal state of affairs in Hartford as “the largest budget crisis in our city’s history.”

State government is not much better off. Connecticut’s budget deficit is driven by escalating costs for public pensions, which powerful government unions have balked at reforming, and weak tax receipts despite—or perhaps because of—a series of recent income tax hikes. Gov. Malloy, a progressive Democrat, has recently taken the position that trying to further increase the tax burden on the state’s 1 percent would be counterproductive.

Urban revitalization is an unsound strategy for addressing budget deficits because creating strong cities is the work of generations. The secret of Boston’s success is reflected in a famous saying attributed to Daniel Patrick Moynihan: “If you want to build a world-class city, build a great university and wait 200 years." Cities like New York that are now envied as talent magnets have had that reputation going back many years. Even in the 1970s, when New York was plagued by high crime and the threat of insolvency, it was still a national leader in finance, media and the arts.

Bronin and Malloy have said that they understand Hartford can’t become New York or Boston. But among Hartford’s true peers—formerly industrial small and mid-sized cities throughout the northeast and Midwest—it is very difficult to find any examples of an authentic comeback city. In an analysis I recently wrote about Hartford, New Haven, Waterbury and Bridgeport, I found that, since 1970, the number of poor people living in these cities had increased by 56.1%, 40.8%, 153.6% and 86.3%, respectively. Over the same span, all have seen their total populations decline with the exception of Waterbury, which has grown by 1.7%.

Despite all the hype over America’s urban renaissance, cities remain a tough sell for the middle class. However magnetic a city may be in attracting young millennials, as studies by William Sander of DePaul University and William Testa of the Chicago Fed have demonstrated, the more educated you are, the more likely you are to opt for suburbs when you settle down. If, 20 years ago, a given city had an underperforming school system that was unattractive to middle class families, it most likely remains unattractive to them now. According to the most up-to-date Census data we have, within most major metros, suburban areas are growing more rapidly than central cities.

Connecticut is often associated with suburban blandness. But it happens to boast one of the most talented labor forces in the nation. A 2016 McKinsey report ranked Connecticut second among states in productivity (GDP per worker). Statewide, 16.6 percent of adults have advanced degrees, a rate which trails only Massachusetts and Maryland. (Only 6.7 percent of adults in Hartford have advanced degrees.) In coming years, the high levels of productivity and educational attainment among Connecticut’s suburban residents will be essential to any growth the state manages to achieve. Fairfield County Connecticut boasts some of the strongest public schools in the nation, whereas the state’s urban school districts remain troubled.

As Connecticut officials contemplate a policy response to Aetna’s exit, it is crucial that they not lose sight of the following. We don’t know how to revitalize poor old industrial cities, especially small and mid-sized ones. Middle class families with children are opting for the suburbs just as reliably as in prior generations. One of the soundest economic development strategies is for a state to offer potential employers a productive and educated workforce, which Connecticut plainly does. State officials should build on current virtues, avoid chasing fads, focus more on budget discipline, and by all means stop trying to make Connecticut into something it’s not.

Stephen Eide is a Senior Fellow at the Manhattan Institute.

Photo by Doug Kerr, via Flickr, using CC License.
The Grenfell High-Rise Fire: A Litany of Failures?

$
0
0

At this writing, the London (Kensington) Grenfell high-rise fire has taken a confirmed 58 lives, with an unknown number missing and many more sent to hospitals. The 24 story low income housing tower block caught fire on Wednesday, June 14. It was virtually all consumed, as shown in the photograph above.

There is much to be concerned about here. This building was not owned by any of those private developers who politicians seem to blame for every all that's wrong with housing in severely unaffordable Britain. The building, now a burned out shell, is owned by the affluent Royal Borough of Kensington and Chelsea (a local government unit within the Greater London Authority).

This is how the structure appeared before the recent refurbishment (photo by R Sones).

Government Failure?

It is not as if the council had not been warned. The Grenfell Action Group has been monitoring problems at Grenfell Tower on behalf of tenants for years. On June 15, they published a blog with links to their previously express concerns about fire safety in the building, including one entitled KCTMCO Playing with Firethat details the frustrations of dealing with the Council's tenant manager. The post, from last November included called the conditions, including the management of the KCTMO (Royal Borough of Kensington and Chelsea Tenant Management Organisation) and the Borough "a recipe for a future major disaster." Of course, that's how it turned out.

There is talk of criminal proceedings, and doubtless the private contractor who installed the cladding (exterior building facing) currently thought to have spread the fire quickly will be at greatest risk. This installation was procured by the KCTMO, the agent of the RBKC Borough Council, including an approved award to the contractor. Further, all of this was related to a refurbishment of the building, in which the RBKC did not require include installation of sprinklers, which would have "prevented the fire from developing."

A Great Planning Disaster?

Worse, in a larger sense, the Grenfell fire may turn out to be one of the world's great planning disasters. One headline put it this way: "Report: Grenfell Tower Fire May Have Been Caused By Panelling Installed To Make Rich Neighbors Happy." Only slightly less incendiary was The Independent headline, which read "Grenfell Tower cladding that may have led to fire was chosen to improve appearance of Kensington block of flats."

According to planning documents obtained by The Independent:

“Due to its height the tower is visible from the adjacent Avondale Conservation Area to the south and the Ladbroke Conservation Area to the east,” ... “The changes to the existing tower will improve its appearance especially when viewed from the surrounding area.”

The Independent also reported that the planning document made repeated references to the "appearance of the area" and that this was the "justification for the material used on the outside of the building, which has since been claimed to have contributed to the horror." The materials were chosen, according to the planning document "to accord with the development plan (our emphasis added) by ensuring that the character and appearance of the area are preserved and living conditions of those living near the development suitably protected,”

One expert indicated apparent frustration at the use of flammable cladding materials: "We are still wrapping postwar high-rise buildings in highly flammable materials and leaving them without sprinkler systems installed, then being surprised when they burn down."

The extent and spread of the fire was unusual for a high rise building. London Fire Commissioner Dany Cotton told The Engineer: “This is an unprecedented situation, with a major fire that has affected all floors of this 24 storey building, from the second floor up. In my 29 years with London Fire Brigade I have never seen a fire of this nature.” According to the Evening Standard: "...flames engulfed the block from the second floor upwards “within seconds”

Concern in Australia

While the Grenfell fire's severity has been attributed to the flammable cladding installed during renovation, similar cladding is being used on new high rise buildings elsewhere. For example, according to The Agethe Melbourne Fire Brigade found that the fire at the contemporary LaCrosse building ignited external wall cladding, which quickly spread to the top of the building through the "combustible material located in the wall structure."

Australians apparently have plenty of reason to be concerned. Planning policies throughout Australia have sought to convince households to live in central city high-rises, seeking to entice them from their preferred suburban detached housing. In a June 15 story, The Age("London tower fire could happen here: Australian buildings cloaked in flammable cladding")reported that Australian buildings are clad in "millions of square meters" of flammable cladding. This is not a new problem. According to The Age building code authorities were advised of the problem seven years ago.

Tony Recsei, President of Save Our Suburbs in Sydney expressed concern in a Sydney Morning Herald letter. Referring to the New South Wales government policy that seeks to increase high rise living, Recsei said "But this calamity starkly reveals there can be long-term consequences. It is to be hoped that the Greater Sydney Commission will seriously consider all the implications of its current strategy of imposing density quotas onto local neighborhoods."

The extent of the concern in Australia is indicated in this video and article from news.com.au.

New Zealand and the United States

Even in New Zealand, where officials recently strengthened external materials fire regulations, the government asked local authorities to check buildings constructed before the regulatory reform to see if there are any with combustible cladding.

According to the Times of London, the cladding used on Grenfell Tower has been illegal in the United States for five years.

Further Developments in London

Meanwhile, back in London, there remains considerable anger. London Mayor Sadiq Kahn visited the site on June 16 was questioned and heckled by survivors. On the same day, Prime Minister Theresa May also visited the scene and was criticized for meeting only with emergency services personnel, but not with any residents.

The fatality count could go much higher. Fears of a building collapse are slowing inspection efforts. Metropolitan Police Commander Stuart Cundy told The Independentthat "he hoped the death toll would not be in “triple figures”.

No Clean Hands?

Of course, final assessments will have to await more formal inquiries. But there is plenty of reason to be concerned. Save the fire brigade, which has been roundly complimented for its work, including being on the scene in six minutes, there may be no clean hands. Cities, from the days of ancient Rome, have been vulnerable to fiery disasters like this one; policies that encourage densification while failing to provide adequate safety procedures are creating the potential for more such disasters.

Grenfell fire photo by Natalie Oxford.

Wendell Cox is principal of Demographia, an international public policy and demographics firm. He is a Senior Fellow of the Center for Opportunity Urbanism (US), Senior Fellow for Housing Affordability and Municipal Policy for the Frontier Centre for Public Policy (Canada), and a member of the Board of Advisors of the Center for Demographics and Policy at Chapman University (California). He is co-author of the "Demographia International Housing Affordability Survey" and author of "Demographia World Urban Areas" and "War on the Dream: How Anti-Sprawl Policy Threatens the Quality of Life." He was appointed to three terms on the Los Angeles County Transportation Commission, where he served with the leading city and county leadership as the only non-elected member. He served as a visiting professor at the Conservatoire National des Arts et Metiers, a national university in Paris.

Is America Now Second-Rate?

$
0
0

President Donald Trump’s recent renunciation of the Paris climate change accords has spurred “the international community” to pronounce America’s sudden exit from global leadership. Now you read in the media aspirations to look instead to Europe, Canada, or even China, to dominate the world. Some American intellectuals, viewing Trump, even wish we had lost our struggle for independence.

Yet, perhaps it’s time to unpack these claims, which turn out to be based largely on inaccurate assumptions or simply wishful thinking. In reality, these countries are hardly exemplars, as suggested by the American intellectual and pundit class, but rather are flawed places unlikely to displace America’s global leadership, even under the artless Trump.

We’ll always have Paris, or is it Beijing?

California Gov. Jerry Brown’s recent trip to China reflects the massive disconnect inherent in the progressive establishment worldview. The notion that the country that is the world’s largest emitter of carbon dioxide, emitting nearly twice as much as the United States, and is generating coal energy at record levels, should lead the climate jihad is so laughable as to make its critics, including Trump, seem reasonable. All this, despite the fact that the U.S., largely due to the shift from coal to natural gas, is clearly leading the world in greenhouse gas reductions.

Paris is good for China in that it gets it off the hook for reducing its emissions until 2030, while the gullible West allows its economies to be buried by ever-cascading regulations. The accords could have cost U.S. manufacturers as many as 6.5 million industrial jobs, while China gets a basically free pass. President Xi Jinping also appeals to the increasingly popular notion among progressives that an autocracy like China is better suited to address climate change than our sometimes chaotic democratic system.

Xi has played the gullible West with a skill that would have delighted his fellow autocrat, Joseph Stalin, who did much the same in the 1930s. (“Purges? What purges?”) Of course, Xi does not have to worry much about criticism from the media — or anywhere else. Trump may tweet insanely and seek needless fights with the media, but critics of the Chinese Communist Party end up in prison — or worse. To accuse Trump of loving dictators and then embrace Xi seems a trifle dishonest.

Ultimately, the Paris accords are much ado about nothing. The goals will have such little impact, according to both rational skeptics like Bjorn Lomborg and true believers like NASA’s James Hanson, as to make no discernible difference in the climate catastrophe predicted by many greens. In reality, Paris is all about positioning and posturing, a game at which both Brown and Xi are far more adept than the ham-handed Trump.

Read the entire piece at The Orange County Register.

Joel Kotkin is executive editor of NewGeography.com. He is the Roger Hobbs Distinguished Fellow in Urban Studies at Chapman University and executive director of the Houston-based Center for Opportunity Urbanism. His newest book is The Human City: Urbanism for the rest of us. He is also author of The New Class ConflictThe City: A Global History, and The Next Hundred Million: America in 2050. He lives in Orange County, CA.

Photo by Michael Temer via Flickr, using CC License.
Amazon Eats Up Whole Foods as the New Masters of the Universe Plunder America

$
0
0

“We must make our choice. We may have democracy, or we may have wealth concentrated in the hands of a few, but we can’t have both.” —Justice Louis Brandeis

With his $13.7 billion acquisition of Whole Foods, Amazon’s Jeff Bezos has made clear his determination to dominate every facet of mass retailing, likely at the cost of massive layoffs in the $800 billion supermarket sector.

But this, if anything, understates the ambitions of America’s new ruling class, almost entirely based in San Francisco and Seattle, as it moves to take over industries from entertainment and transportation to energy and space exploration that once thrived and competed outside the reach of the oligarchy.

Brandeis posed his choice at a time when industrial moguls and allied Wall Street financiers dominated the American economy. Like the oligarchs of the past, today’s new Masters of the Universe are reshaping our society in ways that could, if unchallenged, undermine the foundations of our middle-class republic. This new oligarchy has amassed wealth that would impress the likes of J.P. Morgan. Bezos’ net worth is a remarkable $84.7 billion; the Whole Foods acquisition makes him the world’s second richest man, up from the third richest last year. His $600 million gain in Amazon stock from the purchase is more than the combined winnings of Whole Foods’ 10 top shareholders.

The Emergence of Oligarchic America

Founded two decades ago, Amazon revenue has grown eightfold in the last decade. Bezos now wants to “reorganize the world,” as one tech writer put it, “as an Amazon storefront.” He has done this by convincing investors that despite scant profits, the ample rewards of monopoly await. Kroger, or the corner-food store, enjoys no such luxury. With a seemingly endless supply of capital and the prospect of never-ending expansion, the Silicon Valley-Puget Sound oligarchy now accounts for six of the world’s 13 richest people, and virtually all billionaires who are not either very old or merely inheritors.

Apple, even as it it evades American taxes, enjoys a $250 billion cash reserve that surpass that of the United Kingdom and Canada combined. Their new $5 billion headquarters in Cupertino—like those of firms such as Facebook, Alphabet, and Salesforce.com—reflect the kind of heady excess that earlier generations of moguls might have admired. The peculiar nature of the tech economy rewards even to failures, like Yahoo’s Marissa Mayer, who earned $239 million, almost a million a week, as she drove one of the net’s earliest stars toward oblivion.

The tech booms of the 1980s and 1990s rode on a wave of entrepreneurialism that provided enormous opportunities for millions of Americans, the current wave is characterized by stagnant productivity, consolidation, and disparities in wealth not seen since the mogul era. As one recent paper demonstrates, the “super platforms” of the so-called Big Five depress competition, squeeze suppliers, and drive down earnings, much as the monopolists of the late 19th century did.

Indeed for most Americans the once-promising new economy has meant a descent, as one MIT economist recently put it, toward a precarious position usually associated with Third World countries. Even Silicon Valley, the epicenter of the oligarch universe, has gone from one of the most egalitarian places in America to a highly unequal one where the working and middle class have, if anything, done worse, in terms of income, than before the boom.

The Oligarchs Outsmart the Political Class

In the past, progressive political thinkers like Brandeis sought to curb over-concentrated wealth and power. In contrast, today’s Democratic establishment rarely addresses such issues. That’s no wonder given that the party is now financed in large part by the tech giants, which have backed in almost lock-step the environmental, social, and cultural agenda that dominates today’s left. In exchange, they have bought political cover for things such as misogyny, lack of ethnic diversity, and of unions and fair labor practices that old-line companies like Walmart, Exxon, or General Motors could never enjoy.

Hillary Clinton made clear that she would, at best, tinker at the edges of the so-called sharing economy. That after President Obama’s Justice Department did virtually nothing to employ antitrust to block the tech oligarchs’ domination of key markets like search, social media, computer, and smartphone operating systems. Nor did they pressure them to stop avoiding taxes that burden most other businesses.

Nor can we expect the Republicans, with their instinctive worship of great wealth, to stand up against monopoly and abuse of power. A White House run by Donald Trump, whose true religion seems to be that of the Golden Calf, and his Goldman Sachs economic henchmen are inherently unable to oppose ever greater concentration of money in the hands of a select few. It’s no surprise that so far, in terms of stocks, the tech giants have been among the biggest winners under Trump.

Controlling the Means of Information

The Masters’ ascendency has been enhanced by their growing control of the means of communications. Facebook is already the largest source of news for Americans, particularly the young. They, along with Google, seem capable of shaping information flows to suit their particular world view, one increasingly hostile to any dissenting opinions from the right. (One key to understanding post-election concerns about “fake news” is to realize that a staggering 99 percent of growth in digital advertising in 2016 went to Google and Facebook.) At the same time, those two, along with Apple and Amazon, increasingly shape the national culture, essentially turning Hollywood into glitzy contract laborers.

But no one practices the politics of oligarchy better than Bezos. Under his ownership The Washington Post has been transformed into the Pravda of the gentry left. Last year, for example, they worked overtime to undermine Bernie Sanders’ campaign, whose victory might have led to stronger antitrust enforcement and the confiscation of some of their unprecedented wealth. Once Sanders was dispatched, Bezos, fearing the rise of uncontrollable Trumpian populism, sank his editorial resources into supporting the big money favorite, Hillary Clinton.

The New Political Agenda

Populism, left or right, represents the only viable threat to oligarchic ambitions. Bank of America’s Michael Harnett recently warned that if the growth of stock market wealth continues to be concentrated in a handful of tech stocks, that “could ultimately lead to populist calls for redistribution of the increasingly concentrated wealth of Silicon Valley.”

Deflecting populism is the central imperative of an oligarchy. They feel their dominance as evidence of their superior intellect and foresight, not the result of such things as political influence, or easy access to capital. They embrace, as former TechCrunch reporter Greg Ferenstein put it, the notion of “a two-class society of extremely wealthy workaholics who create technologies that allow the rest of society to enjoy leisurely prosperity. The cost for this prosperity will be inequality of influence.”

What Google’s Eric Schmidt calls the Valley’s “religion in-of-itself” has little in common with resuscitating grassroots Democratic capitalism, the old dream of libertarians, or empowering the working class, that of old leftists. The founders of the big tech firms may embrace progressive ideas on the environment, free trade, and immigration, but have little use for unions or raising capital gains rates.

Overall, notes Ferenstein, they eschew nationalism, favoring global governance, want more immigration and embrace the notion of a government nanny state to tell the masses how to live. They also prefer highly unequal conditions of urban density over the more traditionally egalitarian suburbs. Largely childless San Francisco, impossibly expensive and deeply divided by class, is the preferred model of the future.

The Problem is People

People, little or otherwise, now constitute the Masters’ biggest problem. Unlike the old moguls like Andrew Carnegie or Henry Ford, the new Masters do not promise greater prosperity, or even decent jobs for the middle or working class. Their vision, increasingly, seems to be a world where most people’s labor is largely superfluous, and will need to be satiated with regular basic income from the state, a position now widely embraced by such luminaries as Mark Zuckerberg and Elon Musk, supplemented by occasional “gig” work.

They imagine a future where few will ever own homes or control any real assets. Rather than being parts of a geography or even a country, the increasingly socially isolated masses can be part of Zuckerberg’s “global community” while ordering food from Amazon, delivered by a drone from an automated warehouse, employing social media and virtual reality to fill their long periods of idleness.

As Brandeis warned, this vision—dominated by the interests and influence of the few who possess the bulk of the wealth—is incompatible with the democracy that we have known.

This piece originally appeared on The Daily Beast.

Joel Kotkin is executive editor of NewGeography.com. He is the Roger Hobbs Distinguished Fellow in Urban Studies at Chapman University and executive director of the Houston-based Center for Opportunity Urbanism. His newest book is The Human City: Urbanism for the rest of us. He is also author of The New Class ConflictThe City: A Global History, and The Next Hundred Million: America in 2050. He lives in Orange County, CA.

Photo by National Museum of American History, via Flickr, using CC License.
California’s Global Warming High-Speed Train

$
0
0

The California High-Speed Rail Authority promises to “achieve net zero greenhouse gas (GHG) emissions in construction” and is committed to operate the system on “100% renewable energy” by contracting for “400 to 600 megawatts of renewable power”. These promises may please environmentalists, but they cannot be kept.

Construction Emissions

The Authority has provided only limited information regarding GHG construction emissions. Its 2013 Emissions Report estimated 30,107 metric tons in GHG “direct emissions” for the first 29 miles of construction. “Indirect emissions” associated with the manufacture and transport of materials, primarily concrete, steel, and ballast were not reported because, according to the Authority, precise quantities, sources, and suppliers were not known. A more plausible reason is the their desire to hide from the public more than 90% of GHG emissions associated with their project. Regardless, recent testimony by the Authority’s CEO clearly indicates that indirect emissions can now be tallied.

Speaking before the Assembly High-Speed Rail Oversight Committee on January 27, 2016, CEO Jeff Morales, spoke at length on how costs were estimated. He described the assemblage of 200,000 individual line items including concrete, steel, dirt, electrical, etc. and said each includes a unit cost which is multiplied by the units required to build the system.

Total GHG construction emissions would still be unknown today were it not for the work of professors Mikhail V. Chester and Arpad Horvath working in UC Berkeley’s Department of Civil and Environmental Engineering. They studied this issue, published their findings in 2010, and estimated that 9.7 million metric tons of GHG would be emitted during the construction of the statewide system; primarily because of the production of massive amounts of concrete and steel. Using mid-level occupancy for the three competing modes of travel (high-speed train, auto, and airplane) the authors estimated it would take 71 years of train operation to mitigate the project’s construction emissions. California’s Legislative Analyst Office came to a similar conclusion in a 2012 report critical of using GHG reduction funds to pay for Phase 1 (Los Angeles to San Francisco) of the statewide system because “if the high-speed rail system met its ridership targets and renewable electricity commitments, construction and operation of the system would emit more GHG emissions than it would reduce for approximately the first 30 years”. Here, the LAO appears to be citing an updated Chester and Horvath study, published in July 2012, which focused on only Phase 1 of the high-speed rail project, as outlined in the Authority’s Revised 2012 Business Plan. They took into account additional highway infrastructure that could be avoided as well as claims that “a future CAHSR system will likely see improved train performance and an opportunity for increased renewable electricity usage".

However, the Authority promised “zero net greenhouse gas emissions in construction”. A reduction in California’s GHG emissions due to the trains’ operations was to help reduce the state’s future GHG emissions, not merely mitigate construction releases. The Authority’s zero construction emissions promise relies heavily on a tree planting program. More than 5 million trees, each more than 50 feet tall, would need to be grown and perpetually maintained to recapture the 9.7 million tons of GHG construction emission. However, one year into construction, the Authority’s CEO admitted that not a single tree had been planted. Worse, as part of their project, the Authority plans to cut down thousands of trees south of San Francisco to electrify Caltrain trackage.

Emissions from Operation

Chester and Horvath generously assumed the trains would run on a power mix relatively high in renewable sources. However, high-speed electric trains would replace fossil fueled propelled automobiles and airplanes. When Phase 1 is completed, the trains will place a new demand on the electric grid that must be met immediately by starting up an idle generator capacity. It may be a peaking unit in California powered by natural gas or a coal burning plant in Utah. The exact source is unknowable, but it will not be a wind or solar powered electric plant. These sources will already be generating all the power they can produce when the first trains require additional power.

The Authority’s business plans are constantly changing as are their assumptions on energy consumption and energy cost. The 2012 Business Plan is cited, a plan that referred to paying 15.2 cents/kWh for electrical energy, inclusive of a 3 cent premium for renewable energy. Energy consumption was established at 63 kWh/mile. Train miles traveled between 2022 and 2030 was projected to be 99 million, resulting in an energy use of 6,300 million kWh. In order to make good on their claim that they will power the trains with 100% renewable energy the Authority needs to fund the construction of the necessary renewable power plants.

California Valley Solar Ranch, a 250MW facility producing 650 million kWh/year recently built at a cost of a $1.6 billion ($1.2 billion financed at a 3.5% interest rate using a federal loan guarantee coupled with a check from the U.S. Treasury for $430 million), serves as a proxy for the needed capital. The Authority’s trains would consume 1,200 million kWh in 2030 and need the output of 1.85 Solar Ranches; 460MW of capacity costing $3.0 billion. A premium of 42 cent/kWh, fourteen times the Authority’s offer, would be needed to raise the necessary capital by 2030. More than 20% of this capacity, costing half a billion dollars, must be constructed before the first trains run. Otherwise, those trains will be totally powered by fossil fuels, meaning the GHG emissions per passenger mile will be no better than for two passengers traveling in an automobile which meets the federal fuel efficiency standards scheduled to be in place in 2022.

The issue of global warming needs to be addressed. However, the planting of millions of trees and the spending of billions of dollars on a fossil fuel propelled train is not a practical or cost effective way to address the problem. From the climate point of view, the Authority’s project is detrimental because of its massive construction GHG emissions and because it diverts funds from other actions, such as providing financial incentives for ride-sharing and for the purchase of zero emission or low emission vehicles that could really help address the serious problem of global warming.

Michael J. Brady has been a litigator and appellate lawyer for 50 years; he has worked on opposing California’s high speed rail for 10 years.

Mark Powell has been assisting Mike Brady for seven years; he is a retired chemist for Union Oil Co.

Photo by California High-Speed Rail Authority [Public domain], via Wikimedia Commons


Las Vegas Lessons, Part II

$
0
0

A couple weeks ago I wrote some thoughts after a recent visit to Las Vegas. Most of what I wrote about concerned the Strip and downtown areas of the city, without question the two most recognizable and most frequently visited parts of the region. But in a rapidly growing region of nearly 2.2 million people (the Las Vegas Valley held only 273,000 residents in 1970, meaning it has increased its population by 8 times since then), clearly there's much more to the region than its most iconic and visible parts. Here I'll offer some thoughts on the broader region, its built environment, its economy, and thoughts on its future.

First, for those tl;dr readers who won't click through to read Part I, here's a quick summary of it:

• The Strip and Las Vegas are two entirely different entities.
• Strip is a great pedestrian experience.
• The Strip is an exclusively private space.
• Downtown Las Vegas is quite different from the Strip.
• There are poor linkages between Downtown Las Vegas and the Strip.
• The north end of the Strip is plagued with high-profile failed projects.

Again, as someone who's "part urbanist, part sociologist, and part economist," I offer some observations and thoughts on the rest of the city and region.

The balance of the city and region consists of unremarkable suburbia. This is probably evident to anyone who puts any amount of thought into it, but it does bear repeating. Step away from the Strip and downtown, and Las Vegas's built environment is amazingly consistent: according to the U.S. Census Bureau American Community Survey in 2015, the metro area is about 60% single family detached homes, with about 4,000-6,000 people per square mile throughout. There's no sudden or even slight gradation in density as one commonly finds in many eastern cities; the city quickly establishes its suburban character and spits it out relentlessly. And, I've been struck on this visit and previous ones at how similar Vegas looks to suburbia in other places. Yes, there are newer, upscale areas that stand out (Summerlin comes to mind), but if you replace Vegas's palm trees with oaks and elms, it looks a lot like suburbia anywhere else in America, except with Spanish tile roofs. Similarly...

Nothing in the region is old; the region will have to learn the art and skills of redevelopment. Fifteen years ago when I did some consulting work in Las Vegas, I thought it was weird when city officials referred to West Las Vegas, just northwest of downtown, as "historic". Most of the homes and businesses there were built in the '50s and through the '70s, and in my mind they were the kind of structures that were just beginning to establish some character. But when the median year of structure built in the region is 1995 (the same for Chicago's metro is 1967), you simply won't find the pre-WWII type of development that is called historic in other places. There will come a time when the structures of the Las Vegas Valley will be viewed as obsolete and inconsistent with modern living (whatever that is), and the region will have to undergo one of the more difficult transitions for municipalities -- shifting from easy greenfield development to complex redevelopment.

Low wage and low skill jobs proliferate in the region. Like the unremarkable nature of the suburban pattern, here's another conventional observation that bears repeating. As one would expect, the accommodations/food services employment sector dominates in Las Vegas -- nearly one-third of all Las Vegas workers work in hospitality. Those have traditionally been low-paying jobs, and that's true of the region today. Overall, 44% of Vegas workers earn less than $40,000 a year. Contrast that with Austin, a similarly-sized and similarly-fast-growth metro, where only 9% of workers are employed in accommodations/food services, and just 34% of workers earn less than $40,000 a year (and consider that Austin is a college town that has many recent grads, possibly pushing incomes downward). My concern for Vegas in this regard is that there is growing research that suggests that the kind of work automation that decimated much of the Rust Belt's manufacturing jobs may now enter a phase that targets food services, administration and office support, sales and even retail jobs -- precisely the kinds of jobs that many new Las Vegas residents moved there to occupy. Las Vegas workers could be quite vulnerable to the kinds of challenges that reshaped the Rust Belt.

The Las Vegas Valley is nearing its physical limits. According to Wikipedia, the Las Vegas Valley is a 600 sq. mi. basin surrounded on all sides by mountains. I don't know the precise delineations between flat and inclined topography, but a look at Google Earth tells me the region is near its limit:

I could be wrong, but it looks as if Vegas has available land to the north and southwest, and the Valley might be approaching 90% developed. It could be that the region hits the wall (literally) within the next 10 years. What will that mean for a region that is as low-density suburban as this one? Will the Valley's communities have the ability to shift their focus inward? Time will tell.

What happens to the region if tourism... changes? Wikipedia's Atlantic City page has a good explanation for the decline of tourism there after World War II. It connects its decline with the car; prior to the war, people generally traveled to Atlantic City by train and stayed for a week or two. Cars made people more mobile and they made shorter visits. Suburbanization and its creature comforts, like backyards and air conditioning, also took visitors away from AC. The final nail in the coffin was affordable jet service, opening up vacation spots like Miami, Havana, and the Bahamas (and Vegas) in the 50's and onward. I don't know what challenge is out there for Vegas now, but what will be crucial to the region's survival is how it responds.

What impact will climate change have on a desert resort city? When flying into Las Vegas I couldn't help but notice the low level of Lake Mead, just southeast of the city. It was clear from the air; bleached rock that had once been under water now exposed. Las Vegas is blessed to have one of the largest reservoirs in the nation at its back door, but could continued drought and increased demand for water undermine everything? The Strip's casinos tout themselves as leaders in water conservation, but whether their efforts will be enough as conditions worsen is an open question.

Las Vegas is truly a unique place. It's a place that seems to serve a certain time and space, and is concerned about now more than its future. But I'm sure if the region squints its eyes and looks, it will see the future is getting closer. It will need to figure out how it will be sustainable as that future approaches.

This piece originally appeared on The Corner Side Yard.

Pete Saunders is a Detroit native who has worked as a public and private sector urban planner in the Chicago area for more than twenty years.  He is also the author of "The Corner Side Yard," an urban planning blog that focuses on the redevelopment and revitalization of Rust Belt cities.

Photo by Stan Shebs [GFDL, CC BY-SA 3.0 or CC BY-SA 2.5], via Wikimedia Commons

Urban Talent Sheds Say a Lot About Cities

$
0
0

Jim Russell pointed me as the workforce report program that LinkedIn runs.  They use their data to show trends in 20 major job markets.

For each market they track, they put together a map of the 10 cities that market gains the most workers from and the ten in loses the most workers too.

These are interesting maps in their own right. They also highlight the extremely parochial nature of the talent flows into Midwestern cities. It’s pretty stark, actually. Here’s a set of comparisons, looking strictly at inflows. There are also outflow and gross migration charts and more information that’s interesting too, but I’ll leave you to dig into that yourself.

Minneapolis vs. Denver vs. Seattle

Let’s take a look at these three roughly peer cities. First, the top ten cities for Minneapolis.

Despite the Twin Cities enjoying a high reputation withing the Midwest region, their draw remains highly regional. Their top draws are from adjacent states plus Chicago.

By contrast, here’s Denver.

And here’s Seattle:

The difference is stark.

Chicago vs. New York vs. San Francisco

Living up to its reputation as the capital of the Midwest, Chicago’s draw is from a tightly focused region.

Now, here’s New York:

Four of New York’s top ten draws are actually from outside the country. That’s pretty amazing.

And here’s San Francisco.

You see the flows in mostly from other major tech hubs and big cities.

Again, a pretty start difference.

Cleveland vs. Nashville

We see the same thing in smaller tier cities. Here’s Cleveland.

And here’s Nashville.

Again, I’d encourage you to spend some time over at LinkedIn. You can tell a lot about these cities and their economies just by their migration maps. You can also instantly see another dimension of the challenge facing Midwestern cities.

This piece originally appeared on Urbanophile.

Aaron M. Renn is a senior fellow at the Manhattan Institute, a contributing editor of City Journal, and an economic development columnist for Governing magazine. He focuses on ways to help America’s cities thrive in an ever more complex, competitive, globalized, and diverse twenty-first century. During Renn’s 15-year career in management and technology consulting, he was a partner at Accenture and held several technology strategy roles and directed multimillion-dollar global technology implementations. He has contributed to The Guardian, Forbes.com, and numerous other publications. Renn holds a B.S. from Indiana University, where he coauthored an early social-networking platform in 1991.

Future Work: What, Where, and Why

$
0
0

The growth industries and professions of the future will shape our cities in very different ways to the industries and professions that shaped our cities in the past. There are profound implications for urban planning and property, if we’re ready for them.

The biggest growth industry for coming years and for the foreseeable future, the official forecasts all seem to agree on, will be in health care and social assistance. This includes professions from surgeons to GPs to nurses to child care or aged care, various therapies and counsellors, dental, and even laundry workers, cleaners and administrative support roles. Already our biggest single industry, it employs more than 1.5 million Australians. It grew by over 20% in the five years to 2015 and that rate of growth is unlikely to change going forward. Nearly half of everyone in this industry has a bachelor’s degree or some higher education qualification so they’re not all hospital cleaners – many will be skilled professionals.

This will be followed by the professional, scientific and technical services industry and very close behind that, the education and training industry. Construction, manufacturing (yes, still growing despite all attempts to kill it off) and accommodation and food services round up the top six biggest growth industries of the future.

This is important because the nature of the growth industries of the future and where they will be located is going to reshape our cities in a very different way to the industries that grew with and shaped our cities in the past. This was highlighted in a recent report on employment in the growing region of South East Queensland, prepared by Macroplan for The Suburban Alliance.

The health care and social assistance industry is predicted by government authorities to grow more than any other industry in the years to 2041, producing around 220,000 extra jobs. But this industry has very different spatial needs to, say, the legal industry which has the highest inner city concentration of any occupation in the region. In health and social assistance, 200,000 of those 220,000 jobs will likely be in suburban business districts or otherwise scattered across suburbia. The biggest growth industry has little need or preference for clustering in the inner city.

Consider the implications for transport networks, property development and urban planning. Our urban model, reflecting a 100 years of employment centralization, is changing to one of employment dispersal. Jobs are not moving from the city centre to the suburbs but the industries which fuel growth are changing, and with them, the patterns of employment location.

Even in the professional, scientific and technical services industry, much of that future growth will occur outside the inner city. Take the generically titled occupation of “professional.” There were 284,300 of these in the South East Queensland region but only 24% of them in the inner city. A further quarter were in a number of defined suburban business districts and the balance – half – elsewhere in suburbia. This is our second biggest growth industry and those patterns of employment distribution are unlikely to change meaning of the 146,000 new jobs in this industry to be created to 2041, the clear majority will likely be suburban based.

The third biggest growth industry with education professionals also shows little evidence of centralization – only 7% of educators are inner city workers the rest are suburban. Even for those who describe their occupation as “Chief executives, general managers or legislators” there are only 21% of them in the inner city. And for clerical and administrative workers, it’s a similar picture: only 22% are inner city workers. The rest are suburbia based.

Engineers appear to have a preference for central locations with 42% of the 16,639 engineers of South East Queensland in the inner city as do the lawyers with 65% of them in the entire region to be found in the inner city. But there are only (fortunately?) just over 9,000 lawyers in the entire region so unless there’s to be an unpredicted explosion of work in the legal profession in the future it’s hard to see this occupation fueling demand for space and transport in the inner city of the future.

Fifty years ago, cities were full of clerical and administrative, managerial and professional workers, shuffling in to centralized offices on trams or trains or buses to clock on at 9am and clock off at 5pm. In the suburbs there were centres of manufacturing and heavy industry. In fifty years’ time, our cities will have different industries generating the bulk of jobs and many of those jobs will need to be based in suburban centres to be closer to their markets or regional transport arteries.

What’s that going to mean for urban planning, transport systems or property development? Will we see existing commercial and retail centres in the suburbs expand to accommodate a growing need for premises associated with health or medical professions, education or professional suites? Will our city centres evolve to become more entertainment, recreational and culture based hubs for the regions they serve, rather than largely just places of work?

There’s much more to be explored in this because the implications are profound. Sadly, much of our thinking around urban planning seems firmly rooted in traditional models which owe more to a sentimental rear vision view of urban development rather than a forward looking one.

Footnote: If you or your organization is interested in exploring what this means in more detail, or for specific regions, please just drop me an email. I’d be very interested to discuss with you. I’ve got a handy presentation which runs through all this in a bit more detail which I’d be happy to share.

Ross Elliott has more than twenty years experience in property and public policy. His past roles have included stints in urban economics, national and state roles with the Property Council, and in destination marketing. He has written extensively on a range of public policy issues centering around urban issues, and continues to maintain his recreational interest in public policy through ongoing contributions such as this or via his monthly blog, The Pulse.

How to Take Advantage of the Retail Apocalypse

$
0
0

Amazon’s stunning acquisition last week of Whole Foods signaled an inflection point in the development of retail, notably the $800 billion supermarket sector. The massive shift of retail to the web is beginning to claw into the last remaining bastions of physical space. In the last year alone, 50,000 positions were lost in the retail sector, and as many as 6 million jobs could be vulnerable nationwide in the long term. Store closings are running at a rate higher than during the Great Recession.

Yet, there’s an opportunity opening for cities and regions to take advantage of new space for churches, colleges, warehouse space and, most importantly, housing. Nationally, an estimated 15 percent of all mall space will need to find new uses within the next decade. As many as 275 malls, according to Credit Suisse, will close in the next five years — roughly a quarter of the total. America already has four to five times as much retail space per capita as countries such as the United Kingdom or Japan.

The infill opportunity

The biggest opportunity for Southern California lies in the production of new housing, which would help to make up for providing less than half the needed supply for the past decade. To date, misguided state policy has created a raft of poor outcomes — rising prices, low inventory, declining affordability, the second-lowest homeownership rate in the nation — in effect, chasing middle-class, younger families out of the state.

State policy has made things worse by putting ever more regulatory burdens on housing, particularly for those who build single-family homes on the peripheral areas, where lower-cost residences have historically been built. But the state’s policy of pushing “infill” development has also foundered, as the price of new apartments has shot up, in part due to the limited land for developments.

These policies understandably upset residents of many urban neighborhoods, who feel that developers are seeking carte blanche to make their areas ever more congested and uniform. In contrast, a strategy of focusing on redundant retail properties — think attached townhomes or detached townhouses — would actually produce fewer cars than even a poor-performing mall, and would appeal to such key demographics as first-time homebuyers, immigrants, minorities and downshifting baby boomers.

Read the entire piece at The Orange County Register.

Joel Kotkin is executive editor of NewGeography.com. He is the Roger Hobbs Distinguished Fellow in Urban Studies at Chapman University and executive director of the Houston-based Center for Opportunity Urbanism. His newest book is The Human City: Urbanism for the rest of us. He is also author of The New Class ConflictThe City: A Global History, and The Next Hundred Million: America in 2050. He lives in Orange County, CA.

Photo by Mike Mozart, via Flickr, using CC License.
Moving to the More Suburban Metropolitan Areas

$
0
0

A review of the most recent US Census Bureau population estimates and components of population change indicates that US residents are overwhelmingly moving to the most suburban cities (metropolitan areas). We previously rated the 53 major metropolitan areas (over 1 million population) using the City Sector Model (see America’s Most Suburbanized Cities), which classifies small areas (zip codes) into five urban core and suburban categories based on factors such as density, transit use, and age of housing stock.(Figure 1). This article examines net domestic migration based on the extent of suburbanization identified in the previous article.

In this decade to date, the 30 most suburbanized cities gained 2.3 million net domestic migrants. These cities are from 94.8 percent to 100.0 percent suburban. The 23 cities that are less suburban had, overall, loss of 2.1 million net domestic migrants. Overall, the 53 major metropolitan areas gained 200,000 net domestic migrants.

The First Quintile: 100 Percent Suburban Cities

A total ten cities are rated 100 percent suburban this means that they have virtually no population densities high enough to qualify for urban cores in any zip code. This indicates that virtually all of their development has occurred during the post-World War II period and that any historical high density zip codes have experienced a decline to below 7500 persons per square mile. The most suburban of these cities is determined by the percentage of an urban population, since there is a 10 way tie for 100 percent suburbanization. This article examines net domestic migration trends in relation to the suburban character of the major metropolitan areas. Net domestic migration counts the number of US residents who move between counties (which are also the building block components of metropolitan areas).

Charlotte is the most suburban and the other nine cities that are 100 percent suburban all located in the South or West (Table 1).


Table 1
Most Suburban Cities: (Metroplitan Areas)
1Charlotte, NC-SC
2Riverside-San Bernardino, CA
3Raleigh, NC
4Orlando, FL
5Birmingham, AL
6Jacksonville, FL
7Phoenix, AZ
8San Antonio, TX
9Tampa-St. Petersburg, FL
10Tucson, AZ
Out of 53 with more than 1,000,000 population


For the purposes of analyzing domestic migration, these 10 cities are considered to be the top quintile in suburbanization. With 53 cities overall, two quintiles are one city short, the first and the fifth.

The all suburban cities had an average positive net domestic migration of 93,000 persons between the 2010 census (April 1) and the 2016 Census Bureau population estimates (Figure 2). Their total net domestic migration was 1,016,000.

Not all of the most suburbanized cities experienced positive net domestic migration. Birmingham, rated as the fifth most suburbanized city, lost 5000 net domestic migrants. But that’s an exception. Five fully suburban cities gained more than 100,000 net domestic migrants, including Phoenix (215,000), Tampa – St. Petersburg (163,000), San Antonio (146,000), Charlotte (143,000) and Orlando (132,000). Three of the other all suburban cities gaining domestic migrants added more than 50,000 including Raleigh, Jacksonville and Riverside – San Bernardino). Tucson gained only 3000 (Table 2).

Overall the net domestic migration averaged 4.5 percent relative to their 2010 Census population (Figure 3). Raleigh had the highest percentage net domestic migration gain at 8.3 percent, followed by San Antonio at 6.9 percent, Charlotte at 6.5 percent and Orlando at 6.1 percent (Figure 3).

The Second Quintile

The second quintile includes cities that are from 97.6 percent suburban to 99.8 percent suburban.

With 11 cities, the second quintile attracted more net domestic migrants than the top quintile (1,023,000), which has only 10 cities. The per city average was somewhat lower than in the first quintile, at 93,000. Five of the cities in the second quintile added more than 100,000 net domestic migrants, including Dallas – Fort Worth at 304,000 (the highest of any city), Houston at 283,000 Austin at 192,000, Atlanta at 153,000 in Nashville at 104,000. Three cities in the quintile lost net domestic migrants, including San Jose, Virginia Beach – Norfolk and Memphis.

The net domestic migration in second quintile averaged 2.5 percent of the 2010 population. Austin had the highest net domestic migration gain of any city at 11.2 percent. Nashville gained 6.2 percent.

Like the first quintile, all cities in the second quintile are in the South or West.

The Third Quintile

The third quintile includes cities that are from 91.2 percent suburban to 97.2 percent suburban.

The third quintile had an average net domestic migration of 15,000 per city and an average of 66,000 overall for the 11 cities. The largest gainers were Denver, at 155,000 and Oklahoma City at 52,000. Only two of the city’s lost net domestic migrants, Detroit at 131,000 and Miami at 7000.

On average, the third quintile added 1.2 percent to their 2010 population through domestic migration. The largest gain was in Denver, at six percent, followed by Oklahoma City at 4.2 percent. The largest loss was in Detroit at 3.0 percent.

The third quintile has cities from the Midwest as well as from the South and the West.

The Fourth Quintile

The fourth quintile includes cities that are from 84.1 percent suburban to 90.0 percent suburban.

Overall these cities lost 352,000 net domestic migrants, for an average of a 32,000 loss per city. The largest gainers were Seattle, at 106,000 and Portland at 94,000. The growth of these cities is being strengthened by the strong outmigration from California with its horrendously expensive housing costs. The largest loser in the fourth quintile was Los Angeles, at 373,000 which ranks it the third largest losing major metropolitan area.

Overall, the average city lost 0.5 cent of its population to net domestic migration. The largest gain was in Portland, at 4.3 percent and in Seattle at 3.1 percent. The largest losses were in Hartford, 3.9 percent and Rochester at 3.0 percent.

The Fifth Quintile

The fifth quintile includes cities that are from 83.3 percent suburban to New York, at 46.7 percent suburban ; the only city with a dominant urban core. Only one of these cities, San Francisco – Oakland gained net domestic migration, at 43,000 the largest net domestic migration losses were in New York at minus 903,000 and Chicago at minus 409,000.

San Francisco – Oakland had a net domestic migration gain of 1.0 percent relative to its 2010 population, though in the last year has fallen into decline as house prices continue to rise to the stratosphere. New York had the largest percentage loss of any city due to net domestic migration at minus 4.6 percent. Chicago’s loss was minus 4.3 percent.

Moving to the Suburbs and to the Most Suburban Cities

A couple of months ago we and others reported on the resurgence of suburban population growth in net domestic migration compared to that of the urban cores (see “Flight from Urban Cores Accelerates: 2016 Census Metropolitan Area Estimates”). When examined relative to the extent of suburbanization, the trend is even more significant, with strong net domestic migration to the most suburbanized cities. America continues to evolve, often not following the densification and anti-suburban proclivities of many planners and media outlets.


Table 2
Domestic Migration in Relation to Suburbanization of Cities
Major Metropolitan Areas: 2010 Census to 2016 Population Estimates
RankMetropolitan Area% SuburbanNet Domestic MigrationNet Domestic Migration %
1Charlotte, NC-SC100.0%       142,873 6.5%
2Riverside-San Bernardino, CA100.0%         59,453 1.4%
3Raleigh, NC100.0%         90,756 8.3%
4Orlando, FL100.0%       131,588 6.1%
5Birmingham, AL100.0%          (5,122)-0.5%
6Jacksonville, FL100.0%         68,237 5.1%
7Phoenix, AZ100.0%       215,447 5.1%
8San Antonio, TX100.0%       146,511 6.9%
9Tampa-St. Petersburg, FL100.0%       163,157 5.9%
10Tucson, AZ100.0%           3,372 0.4%
11Nashville, TN99.8%       104,331 6.2%
12San Jose, CA99.8%        (47,033)-2.5%
13Houston, TX99.6%       283,239 4.8%
14Dallas-Fort Worth, TX99.5%       304,468 4.7%
15Virginia Beach-Norfolk, VA-NC99.5%        (41,540)-2.5%
16Atlanta, GA99.2%       153,366 2.9%
17San Diego, CA98.9%        (15,477)-0.5%
18Sacramento, CA98.3%         38,745 1.8%
19Memphis, TN-MS-AR98.1%        (36,854)-2.8%
20Austin, TX97.9%       192,375 11.2%
21Las Vegas, NV97.6%         87,856 4.5%
22Oklahoma City, OK97.2%         51,983 4.2%
23Miami, FL97.1%          (6,762)-0.1%
24Denver, CO96.9%       154,847 6.1%
25Grand Rapids, MI96.5%           8,480 0.9%
26Salt Lake City, UT96.5%           2,006 0.2%
27Richmond, VA95.6%         21,389 1.8%
28Columbus, OH95.3%         29,167 1.5%
29Indianapolis. IN95.0%         21,365 1.1%
30Kansas City, MO-KS94.8%           5,866 0.3%
31Detroit,  MI93.7%      (130,532)-3.0%
32Louisville, KY-IN91.2%           8,475 0.7%
33Cincinnati, OH-KY-IN90.0%        (23,149)-1.1%
34Portland, OR-WA90.0%         94,284 4.3%
35Los Angeles, CA89.4%      (372,990)-2.9%
36Seattle, WA89.3%       105,516 3.1%
37New Orleans. LA89.1%         27,417 2.3%
38Hartford, CT88.7%        (46,980)-3.9%
39Rochester, NY88.6%        (32,196)-3.0%
40St. Louis,, MO-IL88.4%        (57,902)-2.1%
41Minneapolis-St. Paul, MN-WI86.8%          (8,015)-0.2%
42Baltimore, MD84.3%        (26,498)-1.0%
43Pittsburgh, PA84.1%        (11,742)-0.5%
44Washington, DC-VA-MD-WV83.3%        (46,264)-0.8%
45Cleveland, OH78.3%        (58,375)-2.8%
46Milwaukee,WI76.6%        (42,639)-2.7%
47Chicago, IL-IN-WI74.2%      (409,167)-4.3%
48Philadelphia, PA-NJ-DE-MD74.1%      (127,868)-2.1%
49Providence, RI-MA73.9%        (28,789)-1.8%
50San Francisco-Oakland, CA73.0%         42,847 1.0%
51Buffalo, NY71.0%        (22,091)-1.9%
52Boston, MA-NH64.3%        (36,483)-0.8%
53New York, NY-NJ-PA46.7%      (902,616)-4.6%
Derived from 2010 Census and American Community Survey using City Sector Model

Wendell Cox is principal of Demographia, an international public policy and demographics firm. He is a Senior Fellow of the Center for Opportunity Urbanism (US), Senior Fellow for Housing Affordability and Municipal Policy for the Frontier Centre for Public Policy (Canada), and a member of the Board of Advisors of the Center for Demographics and Policy at Chapman University (California). He is co-author of the "Demographia International Housing Affordability Survey" and author of "Demographia World Urban Areas" and "War on the Dream: How Anti-Sprawl Policy Threatens the Quality of Life." He was appointed to three terms on the Los Angeles County Transportation Commission, where he served with the leading city and county leadership as the only non-elected member. He served as a visiting professor at the Conservatoire National des Arts et Metiers, a national university in Paris.

Photograph: Downtown Dallas in the metropolitan area with the largest gain in net domestic migrants (by author)

Viewing all 3795 articles
Browse latest View live


Latest Images