Quantcast
Channel: Newgeography.com - Economic, demographic, and political commentary about places
Viewing all 3795 articles
Browse latest View live

Should Transit Fares Cover Operating Costs?

$
0
0

Maryland has long had a state law requiring transit systems to collect enough fares to cover at least 35 percent of their operating costs. While it is admirable to set a target, this particular target is disheartening for two reasons.

First, 35 percent is a pretty low goal. The 2015 National Transit Database lists 48 transit operations that cover between 100 and 200 percent of their costs, including New York ferries, the Hampton Jitney, several other bus lines, and a bunch of van pooling systems. No rail lines cover 100 percent of their operating costs, but BART covers 80 percent, Caltrains covers 72 percent, New York and DC subways cover 64 percent, and New York commuter trains cover 60 percent. On average, commuter bus and commuter rail systems earn half their operating costs. So 35 percent lacks ambition.

Even worse, most Maryland transit operations don’t come close to meeting the target. Maryland commuter trains cover 45 percent of their costs. But Baltimore’s light rail only covers 17 percent, and its heavy rail covers a pathetic 13 percent. Standard bus service also covers just 13 percent of its costs, though commuter buses come closer to the target, reaching 28 percent.

Maryland lawmakers have figured out a solution to the second problem, if not the first. They simply passed a bill abolishing the target. Now, transit advocates hope, the state can spend even more money building obsolete transit systems that won’t be able to afford to maintain because they can’t even cover a third of their operating costs.

Transit is “not profitable,” said one advocate, “but it’s essential for an economically competitive region.” Just how economically competitive has Baltimore been since it sunk billions of dollars into light- and heavy-rail lines that don’t cover even a fifth of their operating costs? Maryland certainly won’t make itself more economically competitive by increasing the tax burden still further so they can build more obsolete transit lines.

Failing to cover costs isn’t a symptom that you are economically competitive. It is a symptom that you’ve failed to provide things that people need and want. The Antiplanner can understand why people think we need to subsidize food stamps or other aid to low-income people. I can’t understand why people think nothing of throwing huge amounts of money towards marketable operations like transit.

C. Northcote Parkinson, the author of Parkinson’s Law, said that organizations that set goals low so they would be easy to meet were suffering from a disease he called injelititis. The transit industry has been suffering from this disease since the mid-1960s, when it discovered it could live off the public trough rather than actually have to provide services that people want. Once this disease reached its late stages, he said, the only cure required “a change of name, a change of site, and an entirely different staff.”

There’s still a chance that Maryland’s governor may veto the bill. Let’s hope he does.

Randal O’Toole is a senior fellow with the Cato Institute specializing in land use and transportation policy. He has written several books demonstrating the futility of government planning. Prior to working for Cato, he taught environmental economics at Yale, UC Berkeley, and Utah State University.

Photo: By AndrewHorne (Own work) [Public domain], via Wikimedia Commons


Deindustrialisation in Sydney

$
0
0

According to property analysts CoreLogic, the Sydney median vacant land selling price has hit $450,000, a massive 20.5 per cent higher than the same time last year. This follows the New South Wales Valuer-General’s January announcement that in the 12 months to July 2016, land values across the city’s north-western and south-western corridors rose by around 25 per cent. Yet a general reluctance to identify out-of-control land values as the prime cause of our housing crisis is matched by a strange indifference to their distorting effects on Sydney’s economic structure. One exception is Michael Cook of Investa Property Group, who recently captured the essential problem. “South Sydney, once the domain of the industrial juggernaut Goodman, is now dotted with high-density Meriton apartments,” he writes. “Where once ‘office’ or ‘industrial’ was the highest and best use, residential is now commanding the big bucks.”

Cook’s observations are consistent with this account of classic “deindustrialisation” from land economist Alan Evans of Reading University, applicable in many respects to conditions in Sydney:

It has already been argued that the high price of land will have led to the substitution of other factors for land where this is possible. Where substitution is more difficult, industries will face higher costs, and competition from countries where land or other prices are lower will force them to contract. The net result will have been a shift of production and employment away from some activities which use a lot of space, primarily in manufacturing industry, and towards activities which use relatively little space, primarily services. In this way the planning system will have contributed to the so-called de-industrialisation of Britain over the last 30 years or so.

While most of our civic and opinion leaders contemplate a “truly global city” for the world’s best and brightest, processes of contraction and dislocation are reshaping Sydney’s industrial base. “The broad trends being observed within Metropolitan Sydney, amplified over the past two years”, said Sass J-Baleh of Colliers International in March, “has been the shift in preference for industrial users, particularly those large users within the manufacturing and logistics industry sectors, to locate further west of Sydney, and the urban renewal of industrial-zoned land in pockets of inner and middle ring areas.” By ‘urban renewal’ she means the conversion of industrial land for residential and ‘mixed use’ purposes, and ‘pockets of inner areas’ means, mostly, the old industrial transportation axis of South Sydney, stretching from Sydney Harbour down to Central Station, Alexandra Canal, Kingsford-Smith Airport and Port Botany.

In a 2015 report to the NSW Department of Planning, consultancy Urbis note that “industrial land users traditionally located around Sydney’s East and South subregions (ie Botany, Mascot, Banksmeadow etc) have progressively moved west as the city’s population and urban footprint expanded and competition from alternative land uses increases.” Urbis found that in the east and south industrial development has been “priced out … because of their diminishing industrial base (a function of increased inner-city residential densities and planning pressures).” South Sydney industrial land values for larger sites reached $700 per square metre in 2012, say Urbis, while south west and outer south west values were as low as $300 and $250. In the case of industrial development that differential has a large impact, since it’s “delivered at lower margins than development for other land uses.” In other words “land value has a greater role in determining the overall feasibility of development.”

Colliers report that South Sydney land and capital values achieved a record growth rate of 19.4 per cent over 2016.

Across metropolitan Sydney, 35 hectares of industrial land was rezoned for other uses in 2013, of which 18.3 hectares was rezoned for medium-density housing. Unsurprisingly a high 79 per cent occurred in Botany Bay LGA (Local Government Area), the lower sector of the old South Sydney hub closest to the port, encompassing Mascot, Botany and Banksmeadow (renamed Bayside LGA in September 2016). While local industrial land values reached $850 per square metre in 2014, the equivalent figure for residential values in Mascot was $1,385. Hence the observation by Colliers’ Edward Princi in 2015, that “residential approvals and rezoning have reduced the traditional industrial base of the city’s south by about 2 million square metres.” CBRE Research estimate that South Sydney will lose 210,000 square metres of industrial stock over the next 5 years. In contrast, the residential populations of Botany Bay LGA and City of Sydney LGA were forecast to grow by 23 and 30 per cent respectively.

From the gentrified, inner-city band around the CBD, City of Sydney LGA extends down to the industrial zone’s northern Alexandria-Waterloo-Zetland sector. Here residential land values are more than triple those of Botany Bay, as much as $4,751 per square metre in the old factory suburb of Waterloo, just 4 kilometres south of the CBD. “Greater high density development and ongoing gentrification are underpinning the evolution of South Sydney from a blue collar, industrial working class area to an upmarket, mixed-use precinct with a rapidly growing local population”, say agents Jones Lang Lasalle. In June 2015, City of Sydney Council rezoned what are officially called the Southern Employment Lands (“employment lands” are roughly equivalent to industrial lands in NSW planning jargon) to allow for a range of other business activities and housing (parts like Green Square were already the subject of special arrangements). This may just be a case of responding to pressure from landowners, but Lord Mayor Clover Moore’s “green, global and connected” administration would have needed little encouragement.

By the 1940s, Alexandria/Waterloo was the “largest industrial municipality in Australia”, 415 hectares crowded with 550 smokestack factories churning out products as diverse as soap, tallow, fertilisers, springs, brushes, aircraft, storage batteries, furniture, sporting goods, glass, matches, industrial gases, paper containers, paints and varnishes. “The Birmingham of Australia”, was its nickname. Today Alexandria, Waterloo and Zetland converge on a very different landscape. “One of the largest urban renewal projects undertaken in Australia”, Green Square is a complex of towers providing 20,000 new apartments around a Town Centre with two public plazas, at least one park, an ‘urban stream’, an aquatic centre, a library, and an underground railway station. With an estimated 2030 population of 61,000 packed into 2.78 square kilometres, it will be the country’s most densely populated urban area. The economic principle, elaborated by Evans and others, that “capital is substituted for land in the production of space as land becomes more expensive”, is thus borne out.

Other parts of industrial South Sydney are being similarly transformed. In 2015 alone, no less than 1,701 apartments were planned or being built amidst the derelict factories and workingmen’s bungalows of neighbouring Rosebery.

While South Sydney was the heartland of the old industrial zone, it also branched off along the south shore of the harbour west of the CBD, where waterfront sites attracted bulk commodity processing industries reliant on seaborne transportation. Among them the woolstores at Darling Harbour, timber sawing at Rozelle Bay, coal-fired power generation at White Bay, sugar refining at Pyrmont, then further west as Sydney Harbour becomes the Parramatta River, livestock slaughter at Homebush Bay, iron ore smelting at Rhodes, coal-fired gasworks at Mortlake, and oil refining at Camellia. Over the decades, these industrial hubs were uprooted by rising land values and rents, and factors like the availability of motorised transportation. For instance, Urbis point out that between 1993 and 2012 (before the most recent explosion in prices) standard residential land values within a 15 kilometre radius of Sydney CBD rose at double the rate of small industrial land values, by 8.38 per cent and 4.44 per cent respectively.

Mostly, the old waterfront sites were rezoned for residential, commercial or recreational purposes, but not other industrial uses. Darling Harbour is now a convention, exhibition and entertainment precinct. Rozelle Bay and White Bay, along with Johnston Bay and Blackwattle Bay, are part of The Bays Precinct, an urban renewal plan for mixed use and 16,000 new dwellings on 95 hectares of derelict waterfront land. The small peninsula of Pyrmont is currently Australia’s most densely populated suburb following the completion of Jacksons Landing, a planned community featuring five massive high-rise apartment blocks. Redeveloped as the site of the Sydney Olympics, Homebush Bay is the subject of a 2030 Master Plan for several 45-storey residential towers housing 21,000 more people in 10,700 new apartments. At Rhodes, a project allowing up to five 25-storey buildings will take the expected population to 11,000, “making it one of the most densely populated areas of Sydney outside the CBD.” And Camellia has its own government Land Use and Infrastructure Strategy, proposing “a town centre … public plazas, high-rise apartments and parks.”

Dislocating land values are having an impact beyond the traditional zones, however. Now they are rippling out to the secondary or middle ring of industrial sites in Sydney’s central west region. From the 1960s and 1970s, places like Blacktown, Holroyd, Rydalmere, Rosehill, Silverwater, Chullora, Villawood, Milperra, Smithfield, Moorebank and Wetherill Park emerged as industrial centres in conjunction with the shift of working class population to the western suburbs and highway upgrades. Urbis identify Smithfield, Wetherill Park and Chullora, along with South Sydney, as locations from which industrial operators are relocating to the outer west and south west.

Ray White Commercial’s head of research Vanessa Rader explains that “the market extending from Enfield to Moorebank, taking into account regions such as Milperra, Villawood and Chullora in recent years, has been contracting due to competition from other uses such as retail and residential, resulting in increases in land value …” She describes the region as “home to manufacturing, fabrication and wholesale type uses.” Similar analysis came from CBRE’s Raj Chaudhary, who said “the withdrawal of about 100,000 square metres from the central west industrial market, due to rezoning and conversion to residential, is reducing supply in an already tight market …” Last year’s sale of 3 warehouse units in Holroyd for a price equivalent to more than $3,000 per square metre was “the highest industrial per square metre building rate ever achieved in the area.”

These processes of contraction, dislocation and relocation have transformed Sydney’s industrial geography. According to the NSW Department of Planning’s last Employment Lands Development Program (ELDP) report, 79 per cent of Greater Sydney’s total zoned employment lands, and 93 per cent of the 22 per cent zoned but not yet developed, are now in the central west, south west and outer west subregions. This is up from 60 per cent of all employment lands in 1991, say Urbis. The question is whether planning authorities are supplying enough zoned land serviced with water, sewerage, electricity and road connections on the western periphery to meet demand from new operators and those driven out of other locations, and to relieve pressure on land values generally. While this will receive more detailed treatment on another occasion, the evidence suggests they are failing. “Under the average take-up rate of 163 hectares per annum there is only 2.8 years of supply”, says the ELDP report, “this does not meet the supply standard for undeveloped and serviced land (5-7 years supply).” Malcolm Tyson of Colliers warns that Sydney could run out of industrial land in just 6 years. Dreaming of “global city” amenities like dense housing, commuter rail, walkability and bike paths, our planning elites may be occupied elsewhere. But this is a crisis in the making.

John Muscat is a co-editor, along with Jeremy Gilling, of The New City, a web journal of urban and political affairs.

Photo: Derelict White Bay Power Station, Rozelle, Sydney, 2014

California's Tribal Politics

$
0
0

To my fellow residents, and particularly fellow taxpayers of California, I have a special message: Your concerns don’t matter much anymore. Rather than a functioning democracy, California has become a one-party state dominated by a series of tribes whose special priorities are sacrosanct, however much they might hurt the rest of us.

In Gov. Jerry Brown’s California, the ruling tribes include the unions, the greens, the racial warlords and urban land speculators. All of these have flourished under Brown’s rule, and, as he and his occasional bouts with reality leave the scene, the tribes will only be further emboldened.

The steady erosion of the Republican Party has eliminated the need for Democrats to even feign moderation. Over time, moderate Democrats get purged, even in the interior of the state, as gentry liberals like Tom Steyer work to assure that the San Francisco agenda is imposed on Fresno.

Unions uber alles

Even by the standards of California politics, the California Teachers Association wields enormous power, and uses its massive political war chest to prevent serious reform of our low-functioning education system, which just received an impressive C-minus from a recent Education Week survey. Our system may have failed many of our young people, particularly in minority districts, but the union has done well by its members, guaranteeing them the maximum time off, virtual protection from being fired, and, of course, lavish pensions.

Now the teachers, aided by their “Mini-Me” legislators, have their eyes on a virtual exemption from paying income taxes. One rationale is to make up for high housing prices, although many of the “veteran educators” targeted by this legislation bought their homes long before the recent inflation of real estate prices. And, if teachers are special, why not firemen, policemen, sanitation workers or, for that matter, people who work in restaurants and hotels?

It seems odd that people who earn higher salaries — and have far better pensions — than the ordinary Californian, would be privileged in a move likely to worsen the state’s declining finances. Yet, the teachers are not alone in this ravenous feeding at the trough. Now we have legislation proposed in the form of Assembly Bill 199 that would force builders, even on small projects on private property, to hire only workers paid based on union wage levels, increasing labor costs for housing by an additional 30 percent, or something like $90,000 for a 2,000-square-foot home.

Read the entire piece at The Orange County Register.

Joel Kotkin is executive editor of NewGeography.com. He is the Roger Hobbs Distinguished Fellow in Urban Studies at Chapman University and executive director of the Houston-based Center for Opportunity Urbanism. His newest book, The Human City: Urbanism for the rest of us, was published in April by Agate. He is also author of The New Class ConflictThe City: A Global History, and The Next Hundred Million: America in 2050. He lives in Orange County, CA.

Photo: U.S. Army Corps of Engineers, CC License.

The 37 Megacities and Largest Cities: Demographia World Urban Areas: 2017

$
0
0

Many of the world’s biggest cities are getting bigger still. In 2017, the number of megacities --- urban areas with better than ten million people ---   increased to 37 in 2017, as the Chennai urban area entered their ranks. Chennai becomes India’s fourth megacity, along with Delhi, Mumbai and Kolkota. These are among the major findings in the just released 13th annual edition of Demographia World Urban Areas, which provides population, land area and population density estimates for the 1,040 identified built-up urban areas (cities) in the world. Built-up urban areas are the physical form of the city, a definition which separates out the urban, or constructed form of the city from the rural and smaller town areas with which they form a metropolitan area or labor market (Figure 1).

The World’s Largest Cities

Asia increasingly dominates the ranks of the world’s most populous cities. Tokyo-Yokohama continues to be the largest urban area in the world (Figure 2), a ranking it has held for more than six decades. It is estimated the Tokyo Yokohama house a population of 37.9 million, living in approximately 3300 square miles (8,500 square kilometers) with a population density of 11,500 per square mile (4,400 per square kilometer).

Jakarta is the second largest urban area, with a population of 31.8 million 9,600 per square kilometer). Delhi, India’s capital held onto third position, with a population of 26.5 million. Delhi has now opened up a more than 3.5 million lead on 8th ranked Mumbai, which had been India’s largest urban area before and which some experts had considered likely to become the world’s largest city. This prediction, like a similar ones made with respect to Mexico City in the 1980s has not come to fruition and it seems unlikely that either urban area will ever be, the world’s largest.

Manila moved up from fifth position to fourth position, passing Seoul-Incheon (Figure 3). Manila’s population is estimated at 24.3 million, in an area of 690 square miles (1,790 square kilometers) in a population density of 35,100 per square mile (13,600 per square kilometer), the highest density among the top five built-up urban areas.

Seoul-Incheon remains the only high income city, besides Tokyo,  in the top five. Seoul-Incheon is estimated to have a population of 24.1 million and an urban population density of 22,700 per square mile (8800 per square kilometer).

The second five includes Karachi, Shanghai, Mumbai, New York and Sao Paulo, with only New York in the high income world. Thus, seven  of the largest 10 cities in the world are now outside the high income world. New York was the largest city in the world from the 1920s until the mid-1950s. London, which was the largest city in the world from the early 19th century to the 1920s is now ranked 34th, while Beijing, which preceded London as largest ranks 11th. Among the next ten largest urban areas, only two --- Osaka-Kobe-Kyoto, at 14th and Los Angeles, at 19th are in the high-income world.  Formerly rapidly growing Los Angeles seems likely to drop out of the top 20 before long.

Dhaka’s High Density

Dhaka (Figure 4) remains far and away the highest density built-up urban area in the world (Figure 5), Dhaka has an urban density of 118,500 per square mile (45,700 per square kilometer). No other urban area exceeds 70,000 per square mile (27,000 per square kilometer). Yet, Dhaka is not dense enough for some critics, who perceive it to sprawl too much. Notably, Dhaka is about 50 percent denser than Mumbai or Hong Kong (the high income world’s densest city) and more than 30 times as dense as international densification model Portland, Oregon. Portland ranks 963rd in population density out of the 1040 built-up urban areas.

A Half Urban World?

In recent years, the population of the world has become majority urban for the first time. Yet, most people do not live in the largest urban areas. For example, only 15 percent of the urban population resides  in the 37 megacities. The middle of the urban population distribution is at a population of approximately 680,000. People who live in urban areas such as Shizuoka (Japan), Mangalore (India), not to be confused with Bangalore, Qitaihe (China) and Allentown (United States) are the average. The population of the urban areas that are larger have half of the urban population, while the smaller includes the other half.

Distribution of the Population

World urbanization is dominated by Asia, which has a majority (54 percent) of the built-up urban areas with at least 500,000 population. Asia’s dominance is even greater in population, with 58 percent of the residents in urban areas of 500,000 or more. North America has the second largest share of urban area population, at 12.5 percent, followed by Africa (11.2 percent) and Europe (9.9 percent). By contrast, Europe has the second largest number of urban areas of 500,000 population or more, reflecting the generally smaller population of its cities (Figures 6 and 7).

Concentration of Future Growth in Asia and Africa

The latest data underscores the substantial changes that have occurred in urbanization in recent decades. In 1950, 11 of the 20 largest cities were in the high income world, according to the United Nations. On average these cities had 5 million population. Today, only five of the 20 largest cities are in the high income world and their average population is 21.5 million.

In the decades to come, Asia  seems likely to continue its dominance, while Africa will capture an increasing share of urban population growth. By 2050, the United Nations projects that approximately 1.2 billion residents will be added to Asian urban areas, while nearly 900 million will be added to the urban areas of Africa. This would leave only about 125 million, or five percent of total urban growth for the rest of the world. Of course, projections can be wrong, but the strength of current trends make these forecasts all the more credible.

Note: Demographia World Urban Areas uses base population figures, derived from official census and estimates data, to develop basic year population estimates within the confines of built-up urban areas. These figures are then adjusted to account for population change forecasts, principally from the United Nations or national statistics bureaus for a 2016 estimate.

Built-up urban areas are continuously built-up development that excludes rural lands. Built-Up urban areas are the city in its physical form, as opposed to metropolitan areas, which are the city in its economic or functional form. Metropolitan areas include rural areas and secondary built-up urban areas that are outside the primary built-up urban area. These concepts are illustrated in Figure 1 (above), which uses the Paris built-up urban area (unité urbaine) and metropolitan area ("aire urbaine") as an example.

Wendell Cox is principal of Demographia, an international public policy and demographics firm. He is a Senior Fellow of the Center for Opportunity Urbanism (US), Senior Fellow for Housing Affordability and Municipal Policy for the Frontier Centre for Public Policy (Canada), and a member of the Board of Advisors of the Center for Demographics and Policy at Chapman University (California). He is co-author of the "Demographia International Housing Affordability Survey" and author of "Demographia World Urban Areas" and "War on the Dream: How Anti-Sprawl Policy Threatens the Quality of Life." He was appointed to three terms on the Los Angeles County Transportation Commission, where he served with the leading city and county leadership as the only non-elected member. He served as a visiting professor at the Conservatoire National des Arts et Metiers, a national university in Paris.

Photo: Cover of Demographia World Urban Areas: 13th Annual Edition.

Leaving California? After slowing, the trend intensifies

$
0
0

Given its iconic hold on the American imagination, the idea that more Americans are leaving California than coming breaches our own sense of uniqueness and promise. Yet, even as the economy has recovered, notably in the Bay Area and in pockets along the coast, the latest U.S. Census Bureau estimates show that domestic migrants continue to leave the state more rapidly than they enter it.

First, the good news. People may be leaving California, but, overall, the rate of leaving is about three-quarters less than that experienced in the first decade of the millennium. In the core, booming San Francisco metropolitan area, there was even a shift toward net domestic migration after 2010, something rarely seen since the 1980s.

Outmigration dropped with the initial economic slowdown of the last recession, particularly as housing prices in some areas, notably the Inland Empire and the Sacramento area, drifted toward the national norm of three times incomes by 2010, having been twice that high or more in the boom times. The initial recovery after 2010 may also have encouraged people to stay as well.

Back to mounting outmigration

The San Francisco Bay Area lost more than 600,000 net domestic migrants between 2000 and 2009 before experiencing a five-year respite. Now, sadly, the story seems to be changing again. Housing prices, first in the Bay Area and later in other metropolitan areas, have surged mightily, and are now as high as over nine times household incomes. In 2016, some 26,000 more people left the Bay Area than arrived. San Francisco net migration went from a high of 16,000 positive in 2013 to 12,000 negative three years later.

Similar patterns have occurred across the state. Between 2010 and 2015, California had cut its average annual migration losses annually from 160,000 to 50,000, but that number surged last year to nearly 110,000. Losses in the Los Angeles-Orange County area have gone from 42,000 in 2011 to 88,000 this year. San Diego, where domestic migration turned positive in 2011 and 2012, is now losing around 8,000 net migrants annually.

The major exceptions to this trend can be found in the somewhat more affordable interior regions. Sacramento has gained net migration from barely 1,800 in 2011 to 12,000 last year. Even some still-struggling areas, like Modesto and Stockton, have seen some demographic resurgence as people move farther from the high-priced Bay Area.

Read the entire piece at The Orange County Register.

Joel Kotkin is executive editor of NewGeography.com. He is the Roger Hobbs Distinguished Fellow in Urban Studies at Chapman University and executive director of the Houston-based Center for Opportunity Urbanism. His newest book, The Human City: Urbanism for the rest of us, was published in April by Agate. He is also author of The New Class ConflictThe City: A Global History, and The Next Hundred Million: America in 2050. He lives in Orange County, CA.

Wendell Cox is principal of Demographia, an international public policy and demographics firm. He is a Senior Fellow of the Center for Opportunity Urbanism (US), Senior Fellow for Housing Affordability and Municipal Policy for the Frontier Centre for Public Policy (Canada), and a member of the Board of Advisors of the Center for Demographics and Policy at Chapman University (California). He is co-author of the "Demographia International Housing Affordability Survey" and author of "Demographia World Urban Areas" and "War on the Dream: How Anti-Sprawl Policy Threatens the Quality of Life." He was appointed to three terms on the Los Angeles County Transportation Commission, where he served with the leading city and county leadership as the only non-elected member. He served as a visiting professor at the Conservatoire National des Arts et Metiers, a national university in Paris.

Photo: Marco Varisco, CC License

The Politics of Migration: From Blue to Red

$
0
0

Democratic “blue” state attitudes may dominate the national media, but they can’t yet tell people where to live. Despite all the hype about a massive “back to the city” movement and the supposed superiority of ultra-expensive liberal regions, people are increasingly moving to red states and regions, as well as to suburbs and exurbs.

This is the basic takeaway from the most recent IRS data and Census Bureau estimates, which have been widely ignored in the established media. Essentially, Americans are rejecting what Walter Russell Mead has labelled “the blue model,” and relocating to cities, states and regions that are less dense, less heavily taxed, and less regulated.

This suggests not an intrinsic political calculation so much as a series of very personal decisions by individuals and families. People move for varied reasons -- cheaper homes, lower  taxes, employment opportunities, better schools, more value to the paycheck -- but the upshot is that they are settling in states that tend to be red or, at least, purple in political coloration.

In 2016 alone, states that supported Donald Trump gained 400,000 domestic migrants from states that supported Hillary Clinton. This came on top of an existing advantage in net domestic red state migration of 1.45 million people from 2010 through 2015. Contrary to popular perception, these blue state emigres aren’t all fleeing economically challenged places such as upstate New York or inland California. Mostly, they have left the  biggest cities, which are the electoral base of the Democratic Party. Metropolitan New York has led the way in out-migration, followed by Los Angeles and Chicago. Since 2000, these metropolitan areas have lost a net 5.5 million domestic migrants to other parts of the country.

Even economic boom conditions have failed to reverse this trend. Overall, many big blue core cities now have overall population growth rates well below the somewhat tepid national average of 0.7 percent. So, who’s growing? Last year, all 10 of the top gainers in domestic migration were Sunbelt metropolitan areas: Austin, Tampa-St. Petersburg, Raleigh, Jacksonville, Las Vegas, Charlotte, Orlando, Nashville, Phoenix and San Antonio.

Perhaps most surprising, given the almost universal dismissal of their prospects, has been a shift to smaller cities, a more Trump-oriented part of the urban archipelago. Domestic migration has accelerated to cities between 500,000 and 1 million population, while declining in those above 1 million.

The Suburban Resurgence

More important still has been the revival in the suburbs, particularly in Sunbelt metropolitan areas. The most recent estimates suggest that last year was the best for suburban areas since the Great Recession. In 2012, the suburbs of the major metropolitan areas (over 1 million) attracted barely 150,000 more people than core counties, an edge that grew to 556,000 last year. Between 2010 and 2015, suburban counties of major metropolitan areas added 825,000 net domestic migrants, while the urban core counties lost nearly 600,000.

Critically, since 2010 more than 80 percent of all new jobs in our 53 leading metropolitan regions have been created in suburban locations. Many of the leading tech areas of the country --from Silicon Valley and Raleigh-Durham to tech centers surrounding the big Texas cities --- are primarily suburban. The economic future, contrary to the common media memes, will be primarily occurring in the periphery of the hip urban cores.

This trend may accelerate as millennials begin to enter their 30s and look for safe, affordable places to live. We already see this in the behavior of their predecessors, the X generation. Using census data of those 35-49 as our measurement, since 2000 the percentage of Gen-Xers living in the urban core has dropped by one percentage point, while the percentage living new suburbs and exurbs has grown by six percentage points. The latest estimates indicate over 80 percent of Xers in the 53 largest metropolitan areas lived in suburban areas.

Gen-Xer shares grew most dramatically in the affordable Sunbelt, like almost completely suburban Raleigh, which saw a 50 percent growth in the share of Xers relative to the national rate. Rapid growth also took place in Las Vegas, Charlotte, Phoenix, Orlando and Salt Lake City as well as the big four Texas cities: Austin, Houston, Dallas-Fort Worth, and San Antonio.

In contrast the Gen-X population share has remained stagnant in the San Francisco and San Jose areas, while the Los Angeles, New York, Boston, Chicago and Philadelphia areas have all seen declines in their Xer shares both since 2000 and since 2010.  This could be a harbinger of millennial behavior. Like the Xers, millennials are beginning to move into the suburbs, contradicting all predictions to the contrary. Since 2010, the biggest gains in millennial share have been in heavily suburban Orlando, Austin and San Antonio.

Generally speaking, notes economist Jed Kolko, the peak years for living in higher density multi-family neighborhoods take place between ages 18 and 30. Kolko calculates that while almost a quarter of these under-30 urban dwellers live in these higher density neighborhoods, by age 40 this drops well below 20 percent, and stays there until people are into their 70s. Given that the 30-something population is destined to grow far faster than 20-somethings in the coming decades, the move to suburbia, with its detached housing -- particularly in regions with lower home prices -- is expected to continue for the foreseeable future.  

This shift is likely to be driven in large part by unsustainable housing costs. In the San Francisco Bay Area, techies are increasingly looking for jobs outside the region, and some companies are offering cash bonuses for those willing to leave. A recent poll indicated that 46 percent of millennials want to leave the Bay Area. Meanwhile, these “best and brightest” have been gravitating to lower cost areas such as Austin, Orlando, Houston, Nashville, and Charlotte.

The basics that drive people to the suburbs remain: cheaper real estate, a preponderance of single family housing, better schools, a poverty rate roughly half  that of core municipalities as well as far lower incidence of violent crime  than in urban cores. This trend will be accelerated, as a recent policy analysis released by the consulting firm Bain shows, by services such as Uber or Lyft, the appeal of working at home as well as the development of automated vehicles.

Political Implications

Ultimately, the key political battlegrounds for the future will not be in blue cities but in purple suburbs, particularly in the booming periphery of major cities in red states. No matter how loud and pervasive the voices emanating from the urban core, or for that matter, ungentrified countryside, Trump won the election by taking by a significant five percentage point suburban margin nationally, improving on Romney’s two-point edge, and by more outside the coastal regions.

This contradicts the confident assertions by the New York Times and other establishment voices that Trump would get his clock cleaned in suburbia, particularly among college-educated voters in upscale communities. Suburban voters made the difference in the crucial Midwestern states of Michigan, Wisconsin and Pennsylvania, and Trump came close to winning in supposedly deep blue Minnesota.

In Michigan, Trump lost Wayne County (including Detroit) by more than 2-1, but captured four of the five surrounding suburban counties by margins that greatly exceeded that of Michigan native Romney. The pattern was similar in Pennsylvania where Clinton won in the Philadelphia metropolitan area – and Pittsburgh’s urban Allegheny County, while Trump was flipping the state with majorities in nearly every other county. Much the same can be said about Wisconsin and Ohio, states critical as well to the Trump win and the GOP future.

This pattern is not set in stone. Trump, as the New York Times recently enthused, does suffer from continuing problems with educated suburban voters. Perhaps even more threatening to the GOP is that minorities now account for more than 40 percent of all suburban and exurban residents, growing far faster in the periphery than non-Hispanic whites. Trump lost traditionally right-leaning but rapidly diversifying places such as Orange County, Calif., and Fort Bend County outside of Houston.

Yet, winning over suburbia in the long run may not be easy for the Democrats. As millennials and Xers, as well as minorities, begin to own property and earn more money, their attitudes on taxes tend to shift to a more conservative perspective, notes a recent Reason poll. Similarly many first-generation Asian immigrants tend to be far more conservative than second- or third-generation Chinese- or Korean-Americans, many of whom have been through college indoctrination and are comfortably ensconced in the generally Democratic-leaning high-end professional class.

Perhaps the biggest problem for the left lies in their embrace of policies that reject suburban lifestyles and, as we see in California, make housing hard to build and all but unaffordable. Most millennials and Xers, not to mention minorities, cannot afford to live in places like brownstone Brooklyn or San Francisco. In adopting policies to curb “sprawl,” blue state politicians are assaulting the suburban lifestyles clearly preferred by the clear majority. This leftist urban policy does not constitute an ideal strategy to appeal to those, including minorities, who want nothing more than to live comfortable lives on the periphery.

Right now, the demographic trends do not clearly favor either party. The new generation now forming families -- and heading towards the red states -- may not be as conservative as boomers but their politics are less lock-step progressive than many believe, even on gender-related issues. They may want health-care reform, good schools, and cleaner environments. But they also want jobs, would like to hold onto more of their paychecks, and cherish the same suburban amenities they enjoyed as children.

Ultimately, it’s a matter of which politicians can delineate the best path toward greater opportunity and homeownership for middle-class families. The political party that addresses these aspirations is likely to be the one that wins the race in the long run.

This piece first appeared on Real Clear Politics.

Joel Kotkin is executive editor of NewGeography.com. He is the Roger Hobbs Distinguished Fellow in Urban Studies at Chapman University and executive director of the Houston-based Center for Opportunity Urbanism. His newest book, The Human City: Urbanism for the rest of us, was published in April by Agate. He is also author of The New Class ConflictThe City: A Global History, and The Next Hundred Million: America in 2050. He lives in Orange County, CA.

Wendell Cox is principal of Demographia, an international public policy and demographics firm. He is a Senior Fellow of the Center for Opportunity Urbanism (US), Senior Fellow for Housing Affordability and Municipal Policy for the Frontier Centre for Public Policy (Canada), and a member of the Board of Advisors of the Center for Demographics and Policy at Chapman University (California). He is co-author of the "Demographia International Housing Affordability Survey" and author of "Demographia World Urban Areas" and "War on the Dream: How Anti-Sprawl Policy Threatens the Quality of Life." He was appointed to three terms on the Los Angeles County Transportation Commission, where he served with the leading city and county leadership as the only non-elected member. He served as a visiting professor at the Conservatoire National des Arts et Metiers, a national university in Paris.

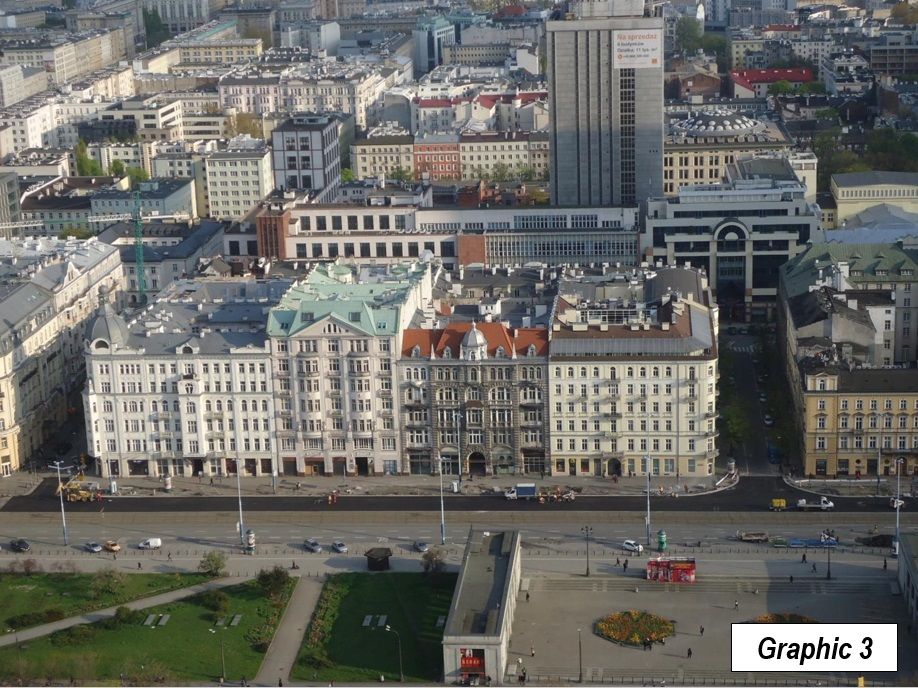
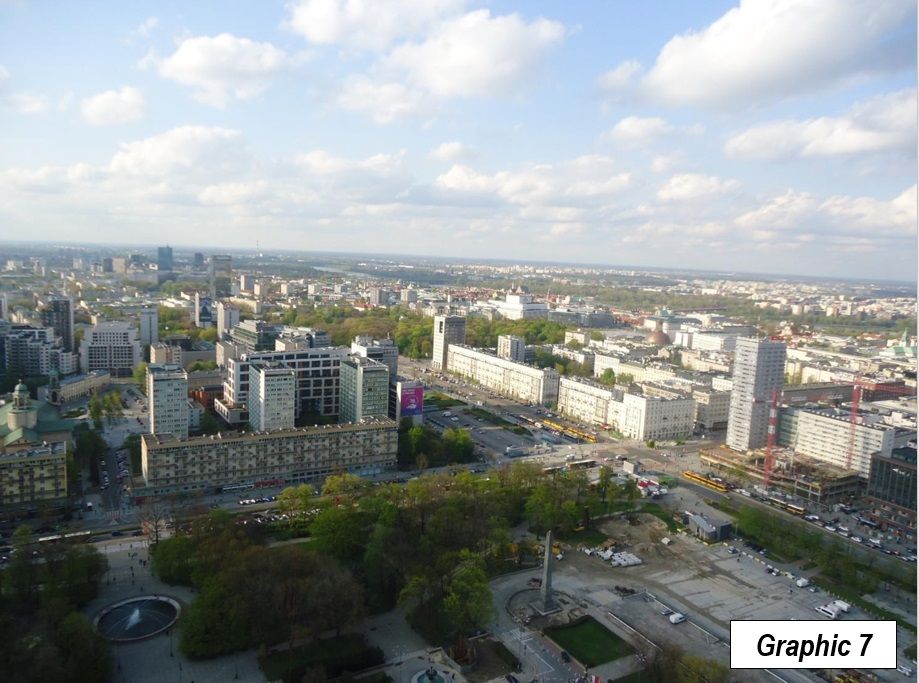
Photo: Mark Turner (Own work) [Public domain], via Wikimedia Commons

Reason #1 to End Transit Subsidies: It’s the Most Costly Transportation We Have

$
0
0

Fifty-three years ago, the transit industry was mostly private and earned a net profit. Today, it’s almost entirely publicly owned, and subsidies have grown out of control. It’s time to take a stand and say all transportation subsidies are bad, but transit subsidies are the worst.

The National Transit Database says agencies spent more than $64 billion in 2015 yet collected less than $16 billion in fares. They carried about 55 billion passenger miles, for an average cost of $1.15 per passenger mile, of which 87 cents was subsidized. No other major mode of passenger transportation is anywhere near this expensive.

Americans spent about $1.1 trillion buying, operating, repairing, and insuring cars and light trucks in 2015, but they also drove their autos nearly 2.8 trillion miles. At average auto occupancies of 1.67 people (see table 16), that’s 4.6 trillion passenger miles by auto, for an average cost of about 24 cents per passenger mile. We don’t have 2015 data yet, but in 2014, government agencies spent about $72 billion subsidizing roads (add the $98 billion in “other taxes and fees” to the minus $10 billion in “less amount for nonhighway purposes” and the minus $16 billion for “less amount for mass transportation”).

This is more than was spent subsidizing transit, but those roads not only produced 70 times as much passenger travel, they were used to ship more than a quarter of the freight moved in this country. Ignoring the freight, the subsidy was about 1.6 cents per passenger mile, meaning the total cost of transit was more than four times the cost of driving.

Airfares are about 14 cents a passenger mile, making air travel a bargain. Airline subsidies are only a couple of cents a passenger mile (subtract government expenditures from government revenues and divide by passenger miles). Amtrak subsidies are comparatively horrendous at 22 cents a passenger mile but are still only a quarter of transit subsidies.

Transit is expensive because it is subsidized. Lacking any need to keep costs within revenues, transit agencies spend way too much money accomplishing far too little. It is time to stop all transportation subsidies, but as the most-heavily subsidized form of transportation, transit should be the priority.

This piece first appeared on The Antiplanner.

Randal O’Toole is a senior fellow with the Cato Institute specializing in land use and transportation policy. He has written several books demonstrating the futility of government planning. Prior to working for Cato, he taught environmental economics at Yale, UC Berkeley, and Utah State University.

Photo: Robert Dyess, CC License

Driving Alone Hits High, Transit Hits Low in "Post-Car" City of Los Angeles

$
0
0

According to The New York Times, the car used to be “king” in the city (municipality) of Los Angeles. “'A Different Los Angeles', The City Moves to Alter its Sprawling Image,” was another story that seeks to portray the nation’s second largest municipality as having fundamentally changed. Following this now popular meme, a Slate story in 2016 referred to Los Angeles becoming “America’s next great transit city.” Los Angeles has surely become America’s greatest transit tax city, with Los Angeles County voters in 2016 approving a fourth half-cent sales tax increase principally for transit since 1980. Yet transit's market share has fallen, not only in the nation's largest county but even in the city of Los Angeles.

The Ascent of Transit: A False Narrative

The Los Angeles political establishment and media is virtually unanimous in its praise for the now quarter century old rail system. Yet, despite more than $15 billion being spent on rail transit the already meager levels of transit commuting in the city have fallen further, while solo driving has risen to an all time high. Unless platitudes are more important than results, rail’s success is a false narrative. People are driving more and using transit less according to the American Community Survey for 2015.

The share of city of Los Angeles residents commuting by transit fell from 11.2 percent in 2010 to 9.5 percent in 2015 (Figure 1, note truncated axis). The 2010 figure was the highest decennial census year transit figure in the period starting in 1980. Just five years later, in 2015, however, the city of Los Angeles transit commuting share had fallen below 1980 levels.

In 1980, 10.8 percent of the city’s commuters used transit, a figure that fell to 10.5 percent just before the initial Long Beach “Blue Line” opened in 1990. While new light rail lines and the Metro (subway) line opened after 1990, transit’s market share fell further, to 10.1 percent by 2010. During the 2000s, transit commuting rose 1.1 percentage points to the 11.2 percent figure, propelled by unprecedented gasoline price increases. But progress was short-lived as the share dropped to 9.5 percent in 2015.

City of Los Angeles Surge in Driving Alone

At the same time, commuters were turning even more to driving alone. In 2015, 69.8 percent of work trip access was by solo drivers. This represents a substantial increase from the 66.8 percent drive alone share in 2010. From 1980 to 2010, driving alone edged up slightly, much less than the increase in the last five years. In 1980, 65.1 percent of commuters drove alone. In 1990, a nearly identical 65.2 percent drove alone. In the last five years, driving alone has risen more than the entire previous 30-year increase in the city of Los Angeles.

The news could get worse. According to new American Public Transportation (APTA) data, total ridership on all Los Angeles County MTA services dropped more than five percent from 2016. The APTA reported decline is astounding, since the highly touted extension of the Expo light rail line to downtown Santa Monica opened in 2016. Even more astounding is that the expensive, at least seven line (counted at radial line ends plus the transverse Green Line) system has added not a soul to transit ridership on the Los Angeles MTA bus and rail system since 1985. Not all MTA service is in the city of Los Angeles, however, the APTA data could presage a further transit market share decline in the city with the American Community Survey data due in the Autumn.

All of this is consistent with the larger trend in the Los Angeles metropolitan area (which includes Los Angeles and Orange Counties). Overall, the transit work trip market share in the metropolitan area fell from 6.1 percent in 2010 to 5.1 percent in 2015. The MTA 2016 decline is likely to push this figure lower.

The Illusion of a "Different Los Angeles"

Yet to read the press and media accounts in Los Angeles, one might be inclined to believe an alternate reality that LA transit is ascendant.

Christopher Hawthorne, who teaches urban and environment policy at Occidental College told The New York Times that the recent defeat of a development moratorium, along with approval of the transit tax and an affordable housing measure is “a very clear statement from the voters that they want a different Los Angeles.”

The voters may want a different Los Angeles, but apparently commuters are sufficiently happy with driving and have been for the more than a quarter century since rail transit was restored to Los Angeles. This is not surprising, since the average commuter can reach 60 times as many jobs by car in 30 minutes in the Los Angeles metropolitan area as by transit. (30 minutes is the average one-way commute time in the metropolitan area). Data is not available for the city of Los Angeles (see: “Access in the City”).

However, it is a generally hopeless task for transit to be an alternative to the automobile, except for trips to and from the urban core (downtown and nearby). The reality is that it could take as much as the total income, every year, of a metropolitan area to provide transit that could effectively compete with the car throughout a metropolitan area for work and other trips.

Platitudes do not ride, people do. At least with respect to the implied transit ridership increases and forsaken cars, the “different” Los Angeles is an illusion, completely inconsistent with reality.

Wendell Cox is principal of Demographia, an international public policy and demographics firm. He is a Senior Fellow of the Center for Opportunity Urbanism (US), Senior Fellow for Housing Affordability and Municipal Policy for the Frontier Centre for Public Policy (Canada), and a member of the Board of Advisors of the Center for Demographics and Policy at Chapman University (California). He is co-author of the "Demographia International Housing Affordability Survey" and author of "Demographia World Urban Areas" and "War on the Dream: How Anti-Sprawl Policy Threatens the Quality of Life." He was appointed to three terms on the Los Angeles County Transportation Commission, where he served with the leading city and county leadership as the only non-elected member. He served as a visiting professor at the Conservatoire National des Arts et Metiers, a national university in Paris.

Photo: Los Angeles City Hall (by author)


The Jungle

$
0
0

Upton Sinclair’s 1906 novel The Jungle was intended to inform the larger American public of the miserable working environment and sub survival wages of Chicago’s meat packing employees. The popular response was huge and lead to new government agencies and protections, but not the kind Sinclair had hoped for. By describing the dangerous and unhealthy conditions in slaughterhouses he meant to elicit sympathy for the workers who were denied adequate pay and were routinely maimed or killed on the job with no recourse to improved safety, medical care, or compensation.

Source

Source

What the outraged American public focused on instead was tainted meat from unsanitary facilities. The general population was far less interested in the plight of the Lithuanian immigrant workers Sinclair described than the wholesomeness of the food supply. The Federal Food and Drug Administration was signed in to law by President Theodore Roosevelt in direct response to the uproar over the novel. Making life better for the underclass wasn’t nearly as gripping as making sure fingers weren’t getting ground up into the sausages.

Source

Source

Source

It wasn’t until the Great Depression of the 1930’s that government – at the insistence of American voters – actually began to create serious labor laws to lift the status of ordinary workers. The pain of being on the wrong end of the stick had migrated from an unloved minority to too many people who thought they were better off – until they weren’t. And it wasn’t until the onset of World War II when labor became scarce relative to the need for wartime production that wages began to rise.

Americans don’t actually care about the poor and never have. It’s important to keep this in mind. I recently found this comment on an economics website. It sums up the standard response to today’s struggle over increasing inequality.

“Millions of very decent and good people can’t afford to live in upper middle class cocoon cities like what San Francisco is becoming. We need to allow the responsible members of the shrinking middle class and growing lower classes to isolate themselves from the worst members of the lower classes. People who lack the buying power to move to nice protected towns full of professional workers need ways to separate themselves from social pathology. Our current elites inflict section 8 housing and a growing immigrant lower class on the responsible people who can’t afford bubble city life. This is just so wrong of them. Our elites are our enemies.”Source

So the problem is that elites are segregating themselves from the declining middle class – and the proposed solution is to provide a separate bubble for the squeezed former middle class to retreat to so they can segregate themselves from people lower down the ladder. Huh? I suppose I have to ask… who decides who is struggling but worthy and who is part of the “social pathology”? And what mechanism might deliver the protection the commentator desires?

As a society we don’t reach for solutions that might address the underlaying structural flaws that create the underclass or the elites. Instead we look for ways deserving individuals can distance themselves from the effects of those structural defects. We assume a big chunk of the population will be left behind and we don’t mind so long as it’s the undeserving that get screwed. That’s always been our de facto national policy.

This piece first appeared on Granola Shotgun.

John Sanphillippo lives in San Francisco and blogs about urbanism, adaptation, and resilience at granolashotgun.com. He's a member of the Congress for New Urbanism, films videos for faircompanies.com, and is a regular contributor to Strongtowns.org. He earns his living by buying, renovating, and renting undervalued properties in places that have good long term prospects. He is a graduate of Rutgers University.

America the Cheap

$
0
0

America is a price dominant culture, and we need to take responsibility for that when we complain about bad customer service, poor infrastructure, etc. Certainly American business and political leadership could be better, but they aren’t the ones who decided to shop at Wal-Mart instead of the local store (favoring short term financial gain over long term community loss). Nor are they the ones who force us to vote for politicians promising something for nothing.

This is the subject of my latest City Journal piece, “America the Cheap“:

American politicians understand this. That’s why they frequently promise voters something for nothing, or free stuff with other people’s money. Republicans promise to “eliminate fraud and waste” or to increase government revenues somehow by slashing taxes, or through some other cost-free method. Democrats say that they are going to tax “the rich,” such as when New York City mayoral candidate Bill de Blasio said that he would give all New Yorkers free pre-K education, funded by a special surtax on high-income households (i.e., somebody else).

European social democracies offer extensive government services and generously funded safety-net programs. But these come with high taxes for the average citizen. Few American politicians are willing to advocate explicitly for that. They keep promising citizens a free lunch. And why not? It seems to be what we want to hear: there’s some magic elixir that can transmute lead into gold.

The populists are right that corporate, governmental, and cultural elites have too often let America down, and even sometimes acted disgracefully. But that doesn’t mean that the man on the street is off the hook. Just because someone else is guilty doesn’t mean that we’re all innocent. If populism takes a high view of the ordinary citizen, then it should also recognize the importance of these citizens’ decisions in shaping the world we live in.

Click through to read the whole thing.

Aaron M. Renn is a senior fellow at the Manhattan Institute, a contributing editor of City Journal, and an economic development columnist for Governing magazine. He focuses on ways to help America’s cities thrive in an ever more complex, competitive, globalized, and diverse twenty-first century. During Renn’s 15-year career in management and technology consulting, he was a partner at Accenture and held several technology strategy roles and directed multimillion-dollar global technology implementations. He has contributed to The Guardian, Forbes.com, and numerous other publications. Renn holds a B.S. from Indiana University, where he coauthored an early social-networking platform in 1991.

Photo Credit: Mike Kalasnik, CC BY-SA 2.0

The Arrogance of Blue America

$
0
0

In the wake of the Trumpocalypse, many in the deepest blue cores have turned on those parts of America that supported the president’s election, developing oikophobia—an irrational fear of their fellow citizens.

The rage against red America is so strong that The New York Time’s predictably progressive Nick Kristoff says his calls to understand red voters were “my most unpopular idea.” The essential logic—as laid out in a particularly acerbic piece in The New Republic—is that Trump’s America is not only socially deplorable, but economically moronic as well. The kind-hearted blue staters have sent their industries to the abodes of the unwashed, and taken in their poor, only to see them end up “more bitter, white, and alt-right than ever.”

The red states, by electing Trump, seem to have lost any claim on usually wide-ranging progressive empathy. Frank Rich, theater critic turned pundit, turns up his nose at what he calls “hillbilly chic.” Another leftist author suggests that working-class support for Brexit and Trump means it is time “to dissolve” the “more than 150-year-old alliance between the industrial working class and what one might call the intellectual-cultural Left.”

The fondest hope among the blue bourgeoise lies with the demographic eclipse of their red-state foes. Some clearly hope that the less-educated“dying white America,“ already suffering shorter lifespans, in part due to alcoholism and opioid abuse, is destined to fade from the scene. Then the blue lords can take over a country with which they can identify without embarrassment.

Marie Antoinette Economics

In seeking to tame their political inferiors, the blue bourgeoisie are closer to the Marie Antoinette school of political economy than any traditional notion of progressivism. They might seek to give the unwashed red masses “cake” in the form of free health care and welfare, but they don’t offer more than a future status as serfs of the cognitive aristocracy. The blue bourgeoisie, notes urban analyst Aaron Renn, are primary beneficiaries of “the decoupling of success in America.” In blue America, he notes, the top tiers “no longer need the overall prosperity of the country to personally do well. They can become enriched as a small, albeit sizable, minority.”

Some on the left recognize the hypocrisy of progressives’ abandoning the toiling masses. “Blue state secession is no better an idea than Confederate secession was,” observes one progressive journalist. “The Confederates wanted to draw themselves into a cocoon so they could enslave and exploit people. The blue state secessionists want to draw themselves into a cocoon so they can ignore the exploited people of America.”

Ironically, many of the most exploited people reside in blue states and cities. Both segregation and impoverishment has worsened during the decades-long urban “comeback,” as even longtime urban enthusiast Richard Florida now notes. Chicago, with its soaring crime rates and middle class out-migration, amidst a wave of elite corporate relocations, epitomizes the increasingly unequal tenor of blue societies.

In contrast the most egalitarian places, like Utah, tend to be largely Trump-friendly. Among the 10 states (and D.C.) with the most income inequality, seven supported Clinton in 2016, while seven of the 10 most equal states supported Trump.

If you want to see worst impacts of blue policies, go to those red regions—like upstate New York—controlled by the blue bourgeoise. Backwaters like these tend to be treated at best as a recreational colony that otherwise can depopulate, deindustrialize, and in general fall apart. In California, much of the poorer interior is being left to rot by policies imposed by a Bay Area regime hostile to suburban development, industrial growth, and large scale agriculture. Policies that boost energy prices 50 percent above neighboring states are more deeply felt in regions that compete with Texas or Arizona and are also far more dependent on air conditioning than affluent, temperate San Francisco or Malibu. Six of the 10 highest unemployment rates among the country’s metropolitan areas are in the state’s interior.

Basic Errors in Geography

The blue bourgeoisie’s self-celebration rests on multiple misunderstandings of geography, demography, and economics. To be sure, the deep blue cites are vitally important but it’s increasingly red states, and regions, that provide critical opportunities for upward mobility for middle- and working-class families.

The dominant blue narrative rests on the idea that the 10 largest metropolitan economies represents over one-third of the national GDP. Yet this hardly proves the superiority of Manhattan-like density; the other nine largest metropolitan economies are, notes demographer Wendell Cox, slightly more suburban than the national major metropolitan area average, with 86 percent of their residents inhabiting suburban and exurban areas.

In some of our most dynamic urban regions, such as Phoenix, virtually no part of the region can be made to fit into a Manhattan-, Brooklyn-, or even San Francisco-style definition of urbanity. Since 2010 more than 80 percent of all new jobs in our 53 leading metropolitan regions have been in suburban locations. The San Jose area, the epicenter of the “new economy,” may be congested but it is not traditionally urban—most people there live in single-family houses, and barely 5 percent of commuters take transit. Want to find dense urbanity in San Jose? You’ll miss it if you drive for more than 10 minutes.

Urban Innovation

The argument made by the blue bourgeoisie is simple: Dense core cities, and what goes on there, is infinitely more important, and consequential, than the activities centered in the dumber suburbs and small towns. Yet even in the ultra-blue Bay Area, the suburban Valley’s tech and STEM worker population per capita is twice that of San Francisco. In southern California, suburban Orange County has over 30 percent more STEM workers per capita than far more urban Los Angeles.

And it’s not just California. Seattle’s suburban Bellevue and Redmond are home to substantial IT operations, including the large Microsoft headquarters facility. Much of Portland’s Silicon Forest is located in suburban Washington County. Indeed a recent Forbes study found that the fastest-growing areas for technology jobs outside the Bay Area are all cities without much of an urban core: Charlotte, Raleigh Durham, Dallas-Fort Worth, Phoenix, and Detroit. In contrast most traditionally urban cities such as New York and Chicago have middling tech scenes, with far fewer STEM and tech workers per capita thanthe national average.

The blue bourgeois tend to see the activities that take place largely in the red states—for example manufacturing and energy—as backward sectors. Yet manufacturers employ most of the nation’s scientists and engineers. Regions in Trump states associated with manufacturing as well as fossil fuels—Houston, Dallas-Fort Worth, Detroit, Salt Lake—enjoy among the heaviest concentrations of STEM workers and engineers in the country, far above New York, Chicago, or Los Angeles.

Besides supplying the bulk of the food, energy, and manufactured goods consumed in blue America, these industries are among the country’s most productive, and still offer better paying options for blue-collar workers. Unlike a monopoly like Microsoft or Google, which can mint money by commanding market share, these sectors face strong domestic and foreign competition. From 1997-2012, labor productivity growth in manufacturing—3.3 percent per year—was a third higher than productivity growth in the private economy overall.

For its part, the innovative American energy sector has essentially changed the balance of power globally, overcoming decades of dependence on such countries as Saudi Arabia, Russia, and Venezuela. Agriculture—almost all food, including in California, is grown in red-oriented areas—continues to outperform competitors around the world.

Exports? In 2015, the U.S. exported $2.23 trillion worth of goods and services combined. Of the total, only $716.4 billion, or about a third, consisted of services.In contrast, manufactured goods accounted for 50 percent of all exports.Intellectual property payments, like royalties to Silicon Valley tech companies and entrepreneurs, amounted to $126.5 billion—just 18 percent of service exports and less than 6 percent of total exports of goods and services combined, barely even with agriculture.

Migration and the American Future

The blue bourgeoisie love to say “everyone” is moving back to the city; a meme amplified by the concentration of media in fewer places and the related collapse of local journalism. Yet in reality, except for a brief period right after the 2008 housing crash, people have continued to move away from dense areas.

Indeed the most recent estimates suggest that last year was the best for suburban areas since the Great Recession. In 2012, the suburbs attracted barely 150,000 more people than core cities but in 2016 the suburban advantage was 556,000. Just 10 of the nation’s 53 largest metropolitan regions (including San Francisco, Boston, and Washington) saw their core counties gain more people than their suburbs and exurbs.

Overall, people are definitively not moving to the most preferred places for cosmopolitan scribblers. Last year, all 10 of the top gainers in domestic migration were Sun Belt cities. The list was topped by Austin, a blue dot in its core county, surrounded by a rapidly growing, largely red Texas sea, followed by Tampa-St. Petersburg, Orlando, and Jacksonville in Florida, Charlotte and Raleigh in North Carolina, Las Vegas, Phoenix, and San Antonio.

Overall, domestic migration trends affirm Trump-friendly locales. In 2016, states that supported Trump gained a net of 400,000 domestic migrants from states that supported Clinton. This includes a somewhat unnoticed resurgence of migration to smaller cities, areas often friendly to Trump and the GOP. Domestic migration has accelerated to cities between with populations between half a million and a million people, while it’s been negative among those with populations over a million. The biggest out-migration now takes place in Los Angeles, Chicago, and New York.

Of course, for the blue cognoscenti, there’s only one explanation for such moves: Those people are losers and idiots. This is part of the new blue snobbery: Bad people, including the poor, are moving out to benighted places like Texas but the talented are flocking in. Yet, like so many comfortable assertions, this one does not stand scrutiny. It’s the middle class, particularly in their childbearing years, who, according to IRS data, are moving out of states like California and into ones like Texas. Since 2000, the Golden State has seen a net outflow of $36 billion dollars from migrants.

Millennials are widely hailed as the generation that will never abandon the deep blue city, but as they reach their thirties, they appear to be following their parents to the suburbs and exurbs, smaller cities, and the Sun Belt. This assures us that the next generation of Americans are far more likely to be raised in Salt Lake City, Atlanta, the four large Texas metropolitan areas, or in suburbs, than in the bluest metropolitan areas like New York, Seattle, or San Francisco—where the number of school-age children trends well below the national average.

This shift is being driven in large part by unsustainable housing costs. In the Bay Area, techies are increasingly looking for jobs outside the tech hub and some companies are even offering cash bonuses to those willing to leave. A recent poll indicated that 46 percent of millennials in the San Francisco Bay Area want to leave. The numbers of the “best and brightest” have been growing mostly in lower-cost regions such as Austin, Orlando, Houston, Nashville, and Charlotte.

Quality of Life: The Eye of the Beholder

Ultimately, in life as well as politics, people make choices of where to live based on economic realities. This may not apply entirely to the blue bourgeoisie, living at the top of the economic food chain or by dint of being the spawn of the wealthy. But for most Americans aspiring to a decent standard of living—most critically, the acquisition of decent living space—the expensive blue city simply is not practicable.

Indeed, when the cost of living is taken into consideration, most blue areas, except for San Jose/Silicon Valley, where high salaries track the prohibitive cost of living, provide a lower standard of living. People in Houston, Dallas, Austin, Atlanta, and Detroit actually made more on their paychecks than those in New York, San Francisco, or Boston. Deep-blue Los Angeles ranked near the bottom among the largest metropolitan areas.

These mundanities suggest that the battlegrounds for the future will not be of the blue bourgeoisie’s choosing but in suburbs, particularly around the booming periphery of major cities in red states. Many are politically contestable, often the last big “purple” areas in an increasingly polarized country. In few of these kinds of areas do you see 80 to 90 percent progressive or conservative electorates; many split their votes and a respectable number went for Trump and the GOP. If the blue bourgeoisie want to wage war in these places, they need to not attack the suburban lifestyles clearly preferred by the clear majority.

Blue America can certainly win the day if this administration continues to falter, proving all the relentless aspersions of its omnipresent critics. But even if Trump fails to bring home the bacon to his supporters, the progressives cannot succeed until they recognize that most Americans cannot, and often do not want to, live the blue bourgeoisie’s preferred lifestyle.

It’s time for progressives to leave their bastions and bubbles, and understand the country that they are determined to rule.

This piece first appeared on The Daily Beast.

Joel Kotkin is executive editor of NewGeography.com. He is the Roger Hobbs Distinguished Fellow in Urban Studies at Chapman University and executive director of the Houston-based Center for Opportunity Urbanism. His newest book, The Human City: Urbanism for the rest of us, was published in April by Agate. He is also author of The New Class ConflictThe City: A Global History, and The Next Hundred Million: America in 2050. He lives in Orange County, CA.

Photo: Rafał Konieczny (Own work) [CC BY-SA 4.0], via Wikimedia Commons

California Squashes Its Young

$
0
0

In this era of anti-Trump resistance, many progressives see California as a model of enlightenment. The Golden State’s post-2010 recovery has won plaudits in the progressive press from the New York Times’s Paul Krugman, among others. Yet if one looks at the effects of the state’s policies on key Democratic constituencies— millennials, minorities, and the poor—the picture is dismal. A recent United Way study found that close to one-third of state residents can barely pay their bills, largely due to housing costs. When adjusted for these costs, California leads all states—even historically poor Mississippi—in the percentage of its people living in poverty.

California is home to 77 of the country’s 297 most “economically challenged” cities, based on poverty and unemployment levels. The population of these cities totals more than 12 million. In his new book on the nation’s urban crisis, author Richard Florida ranks three California metropolitan areas—Los Angeles, San Francisco, and San Diego— among the five most unequal in the nation. California, with housing prices 230 percent above the national average, is home to many of the nation’s most unaffordable urban areas, including not only the predictably expensive large metros but also smaller cities such as Santa Cruz, Santa Barbara, and San Luis Obispo. Unsurprisingly, the state’s middle class is disappearing the fastest of any state.

California’s young population is particularly challenged. As we spell out in our new report from Chapman University and the California Association of Realtors, California has the third-lowest percentage of people aged 25 to 34 who own their own homes—only New York and Hawaii’s are lower. In San Francisco, Los Angeles, and San Diego, the 25-to-34 homeownership rates range from 19.6 percent to 22.6 percent—40 percent or more below the national average.

Read the entire piece at City Journal.

Joel Kotkin is executive editor of NewGeography.com. He is the Roger Hobbs Distinguished Fellow in Urban Studies at Chapman University and executive director of the Houston-based Center for Opportunity Urbanism. His newest book, The Human City: Urbanism for the rest of us, will be published in April by Agate. He is also author of The New Class ConflictThe City: A Global History, and The Next Hundred Million: America in 2050. He lives in Orange County, CA.

Wendell Cox is principal of Demographia, an international public policy and demographics firm. He is a Senior Fellow of the Center for Opportunity Urbanism (US), Senior Fellow for Housing Affordability and Municipal Policy for the Frontier Centre for Public Policy (Canada), and a member of the Board of Advisors of the Center for Demographics and Policy at Chapman University (California). He is co-author of the "Demographia International Housing Affordability Survey" and author of "Demographia World Urban Areas" and "War on the Dream: How Anti-Sprawl Policy Threatens the Quality of Life." He was appointed to three terms on the Los Angeles County Transportation Commission, where he served with the leading city and county leadership as the only non-elected member. He served as a visiting professor at the Conservatoire National des Arts et Metiers, a national university in Paris.

Photo: Dirk Beyer (Own work) [GFDL, CC-BY-SA-3.0 or CC BY-SA 2.5], via Wikimedia Commons

Father of the Bernie Sanders Presidency

$
0
0

President Trump’s elite-managed populism opens a path for a more genuine version.

On the usual political spectrum, there are left and right, people who call themselves progressive or conservative, socialist/social democrat or capitalist. But these labels seem to mean less today than in the past. The Trump phenomenon highlighted another divide that has little to do with the historic left and right. Crudely speaking, we can call it coastal vs. non-coastal, urban vs. rural, ethnically diverse vs. more homogeneous, elitist vs. populist. This at least is the way the dominant media sees it.

(click chart to enlarge)

At the same time, the old labels are not completely dead. So if we try to overlay the new on the old and to categorize the Trump following, we could say that some of the old guard conservatives joined forces with the new rural populists. This is a little complicated and barely makes sense given that the former include some of the elites, in other words the very same people who have angered the populists for the past decade. Many people who want lower taxes and free trade and globalization voted for the same person, Donald Trump, as did people who want import tariffs and restrictions on the flows of people, capital and goods. Some of the same people who survived in 2008 thanks to Wall Street bailouts voted for the same candidate as did people who are still seething over the bailouts.

donald_trump_official_portraitWhen a human construct no longer makes sense because it is the product of decades of layering of one strain over another, it may be better to restart with a clean slate and to find new models to explain the present.

Our own favorite model is to hypothesize that the country has drifted away from laissez-faire for several decades and that it has been moving towards socialism. The current interregnum is the time when cronies rule the land. Starting around 1990, cronyism corrupted laissez-faire, an unsurprising evolution since laissez-faire is never pure anyway. And later cronyism heralded its own final mutation into socialism. The case we made in The Bridge from Laissez-faire to Socialism is that socialism is not the system that replaces capitalism, but the system that replaces one form of cronyism with another. The sequence therefore is laissez-faire to the first form of cronyism to the second form of cronyism.

The older form of cronyism claims to be capitalistic (thus the oft-seen oxymoron “crony capitalism”) and the newer form claims to be egalitarian but they are essentially the same, except for the identities of the cronies at the top who extract the most wealth for themselves and their friends. Because egalitarianism is usually less efficient at managing wealth, there may also be a smaller number of cronies under socialism, which makes the infighting among its leaders that much more bitter and savage.

Feel the Bern 2020

On this theory and on current trends then, Bernie Sanders would be elected President of the United States in 2020.

This may look like a bold assertion, mitigated only by the fact that Senator Sanders is already aged 75 today. If he were elected in 2020, could he remain in office until the age of 83? Very possible, given the medical profession’s ability to keep us alive and functioning well into our eighties. For example, another socialist, Robert Mugabe of Zimbabwe, is now 93 and intends to run for another five-year term in 2018.

At any rate, voters will not care about the Senator’s age, just as they did not care about candidate Trump’s own shortcomings. What will matter to them is that candidate Sanders will be the flag bearer leading in his wake a younger Vice-President and a slew of new generation Democrats who will be just as eager to undo four years of Trump/Pence as Trump/Pence have been to undo eight years of Obama/Biden.

To every action, there is an equal or, in the case of politics, a greater reaction. When President Obama alienated half of the electorate by passing the Affordable Care Act through unorthodox procedures, the seed for the Tea Party and then for the rise of Trump was planted. And Trump has already planted the seed for Sanders or of his young charismatic political heir, whoever he or she may be. Or, if that seed was already planted thanks to Senator Sanders’ own strong showing during the campaign, the President’s recent actions have provided a truckload of nutritious fertilizer. The anti-Trump blowback so far does not look like a slow growing plant.

The President’s Barbell Strategy

Although he has styled himself a populist, Mr. Trump is mainly a populist when he fires messages on Twitter or when he holds rallies in rural settings, places where he would otherwise rarely venture except perhaps to play golf. But when he goes back to New York, Washington or Mar-a-Lago, he is once again surrounded through his own choice by the same usual East Coast elites who for three decades have thrived at the courts of the Bushes, the Clintons and the Obamas.

President Trump’s entourage is more elitist than populistic. Even the unconventional Steve Bannon graduated from Harvard Business School and was a one-time banker, and cannot therefore claim the life story of an authentic populist. Team Trump’s populism is not truly organic, but looks instead like posturing and voyeurism, like that of investment bankers occupying the most expensive seats at a Bruce Springsteen concert. It can be very enjoyable for the elite to glimpse the world of the working class, so long as they are never at risk of becoming a part of it.

The President’s barbell strategy of on the one hand giving lip service to blue-collar populism while on the road, and on the other hand appointing some of the same people that a dyed in the wool elitist would have also appointed, has paid off very nicely so far. It is however inherently unstable and unsustainable except under the scenario of a thriving economy. To his credit, Mr. Trump knows this, which is why he will be holding a rally for his base every so often as a way to tell them that he has not forgotten them, even though finance and energy billionaires happen to be among his favorite people in the world. Normally, only a casuist would attempt to square this circle but the President’s distinct genius has enabled him to pull if off so far.

It will be interesting to see for how long this magical balancing act can be maintained. An easy answer would be: until the next economic slowdown. It is fine to play both sides as long as things are improving, or expected to be improving soon. People believe what they want to believe. But failure to deliver for the thriving elite or for the suffering working class will turn either or both into potent Trump adversaries. And this is how an opening would be created for Senator Sanders.

TRiUMPh of the Cronies

Sanders-021507-18335- 0004But why Sanders?

Instead of attacking cronyism, the endemic problem of our age, as a true populist might do, President Trump has instead given it a strong new lease on life. In truth, whether Hillary Clinton or Donald Trump prevailed last November, the die had been cast that the winner would represent the culmination of cronyism in its ultimate triumph. Both Mrs. Clinton and Mr. Trump have crony credentials that exceed those of former presidents. Therefore, the election of POTUS 45 probably signaled the end of something and not the beginning of something, notwithstanding Mr. Trump’s new-dawn declarations to the contrary.

For evidence of cronyism’s final ascent to the seat of power, consider again Mr. Trump’s selections for cabinet and advisory positions. Several are successful operators in business activities that are often associated with cronyism, in this case narrow sub-sectors of energy, finance, law and real estate. What differentiates them is not their success, which by itself would be admirable, but their success in cracks of the laissez-faire economy that are extractive or rent-seeking and largely reliant on government dealing and connections, which is less admirable.

The New York Times reported the following on 15 April 2017:

President Trump is populating the White House and federal agencies with former lobbyists, lawyers and consultants who in many cases are helping to craft new policies for the same industries in which they recently earned a paycheck.

Socialism’s day would come in four years because Mr. Trump has misread the economic tea leaves and has ascribed the moribund economy to an excess of taxes and regulations instead of to the true culprit, which is deteriorating demographics. As a consequence his efforts to ignite another Reagan style boom and to create 25 million new jobs are unlikely to succeed. Mr. Sanders is one of the most vocal critics of cronyism and his speech will be rich with I-told-you-sos if President Trump’s impending deregulation of Wall Street leads to another financial crisis on top of a weaker economy.

After being disappointed by both Obama and Trump, the struggling working class and shrinking middle class will be ready to try yet another new thing. Electing a socialist will be the boomers’ last hurrah and the millennials rose-tinted dream of a new paradise finally blanketing the earth. Joel Kotkin recently noted:

The millennials —arguably the most progressive generation since the ’30s—could drive our politics not only leftward, but towards an increasingly socialist reality, overturning many of the very things that long have defined American life.

and further:

The long-term hopes of the American left lie with the millennial generation. The roughly 90 million Americans born between 1984 and 2004 seem susceptible to the quasi socialist ideology of the post-Obama Democratic Party. They are also far more liberal on key social issues—gender and gay rights, immigration, marijuana legalization—than any previous generation. They comprise the most diverse adult generation in American history: some 40 percent of millennials come from minority groups, compared to some 30 percent for boomers and less than 20 percent for the silent and the greatest generations.

Millennials’ defining political trait is their embrace of activist government. Some 54 percent of millennials, notes Pew, favor a larger government, compared to only 39 percent of older generations. One reason: Millennials face the worst economic circumstances of any generation since the Depression, including daunting challenges to home ownership. More than other generations, they have less reason to be enamored with capitalism.

Sanders’ Math

As to Senator Sanders’ math in 2020, it should be remembered that Mr. Trump carried two pivotal states, Michigan and Wisconsin, by very narrow margins in the general election and that Mr. Sanders won both of these states in the primaries. It would not take a lot for both to tip to Mr. Sanders in a possible Sanders-Trump showdown in 2020.

screen-shot-2017-02-27-at-12-34-45-pm

The addition of Ohio or Pennsylvania, both of which were won by Trump in 2016 and by Obama in 2008 and 2012, would be sufficient to secure Mr. Sanders victory if no other states changed sides in 2020 vs. 2016.

As noted in So You Want a Revolution, the United States is one of many richer countries at risk of older age populism. These countries have relatively older populations (only 40% or less of the population aged 0-29) and higher GDP per capita ($20,000+).


Demographics, combined with breakthrough innovations and strong institutions, have made America very wealthy in recent decades. We are now at a critical juncture and at risk of squandering our prosperity by focusing on a wrong set of problems and by empowering the wrong leaders, Trump and stage 1 cronyism that will lead to Sanders and stage 2 cronyism, or socialism.

Sami Karam is the founder and editor of populyst.net and the creator of the populyst index™. populyst is about innovation, demography and society. Before populyst, he was the founder and manager of the Seven Global funds and a fund manager at leading asset managers in Boston and New York. In addition to a finance MBA from the Wharton School, he holds a Master's in Civil Engineering from Cornell and a Bachelor of Architecture from UT Austin.

Bernie Sanders photo by Michael Vadon [CC BY-SA 2.0], via Wikimedia Commons.

Reason #2 to Stop Subsidizing Transit: Subsidies Haven't Increased Ridership

$
0
0

In 2015, the American Public Transportation Association issued a press release whose headline claimed that transit ridership in 2014 achieved a new record. However, the story revealed that 2014 ridership was the highest since 1956. That’s no more a record than if it was the highest since 2013.

The truth is that America’s urban population more than doubled between 1956 and 2014. Using the ridership number that really counts–trips per urban resident–2014’s number was a near-record low of 41 trips per person. The only time it was lower before 2014 was a few years in the mid-1990s, when ridership dropped to as low as 38 trips per person. The rate may fall to nearly that level in 2016.

When Congress passed the Urban Mass Transportation Act of 1964, Americans took an average of 62 transit trips per person. At that time, 82 percent of all transit systems were privately owned. Within a decade, nearly every major transit system and all but a handful of minor ones were “municipalized” and the subsidies began to flow. At first, the federal government provided only capital subsidies, but in 1974 it also provided operating subsidies.

By 1978, half of operating costs and, of course, all of the capital costs were subsidized. By the late 1980s, fares covered only a little more than a third of operating costs. With most money coming from taxpayers, transit agencies were more beholden to politicians than transit riders, and they became more interested in spending money to please political interests than in boosting transit ridership.

Since 1965, transit operating subsidies (adjusted for inflation to today’s dollars) total close to $800 billion. We don’t have accurate capital cost data from before 1992, but since then we’ve spent close to $400 billion on capital programs (which in the transit industry include maintenance), most of it on rail transit.

Thus, well over a trillion dollars in subsidies has resulted in transit ridership falling from 61 trips per urban resident in 1965 to 41 trips in 2015, and even less in 2016. The chart above shows that trips per urbanite have fluctuated since 1970, but those fluctuations are mainly in response to gasoline prices while the general trend is downward. To a large degree, this downward trend is because the subsidies have made transit agencies more responsive to politics than transit riders.

Advocates of industrial policy argue that government should pick growth industries and nurture them along to help maintain American preeminence in new technologies. Skeptics suggest that government is more likely to pick losers than winners. Transit is clearly one of those losers.

Most statistics in this post are from the American Public Transportation Association’s 2016 Public Transportation Fact Book data spreadsheet. Data for 2015 is from the National Transit Database. Urban population data are from the Census Bureau.

This piece first appeared on The Antiplanner.

Randal O’Toole is a senior fellow with the Cato Institute specializing in land use and transportation policy. He has written several books demonstrating the futility of government planning. Prior to working for Cato, he taught environmental economics at Yale, UC Berkeley, and Utah State University.

Photo:

The Great Non-Profit Die Off

$
0
0

Marc Lapides wrote an op-ed in Crain’s Chicago Business calling for an 1871 accelerator for creating new non-profits.

Most cities could actually use the opposite. What they need is an infrastructure for euthanizing non-profits that are past their expiration date.

When I look around older cities, I frequently see that they’ve got a veritable armada of non-profits. Rarely do I see these making a huge difference in the trajectory of the city.

The usual complaint about too many non-profits is that they aren’t coordinated, and so often overlap or don’t work well together on whatever cause it is they are trying to advance.

This actually doesn’t bother me. The temptation to try to create a single uber-structure for everything is always there, but distributed systems have their own virtues. And where there are legitimate problems, the organizations generally come up with a solution. An example is the various “clearing house” organizations that charitable orgs use to prevent double-dipping.

The bigger problem is that all these non-profits are basically sand in the gears that make it harder to get anything done. While the Lapides talks about innovation, from what I’ve seen non-profits seem to be among the biggest advocates for the status quo.

Ironically, Lapides implicitly makes this point when he acknowledges funders prefer big, established organization.

Try to do anything in a city and you’ll be told to meet with all these “stakeholders”, a large percentage of whom are non-profit leaders who claim to speak in the name of some constituency or cause but too often represent their own personal fief.

Anyone wanting to do things in a city has to run this gauntlet of non-profits and find a way to placate them.

Sean Safford’s famous study “Why the Garden Club Couldn’t Save Youngstown” is a perfect example of this. The Garden Club – a non-profit – was basically a vehicle for reinforcing existing social networks, creating excess social capital that made change difficult.

Too many cities are like Safford’s Youngstown. They could use a culling of non-profits more than the creation of new ones.

Killing unneeded stuff off is hard almost everywhere. For example, eliminating an obsolete app or even a report can be very difficult, as I can tell you from my IT experience. But I can also tell you a lot of them do very little. One time I replaced a legacy system with over a thousand reports. We went live with less than 15 initially critical reports, and the lack of the other 1000+ made no difference. In cities, the Pareto principle likely applies to non-profits as it does everywhere else: the top 20% most effective non-profits deliver 80% of the public benefits.

But just because eliminating organizations is hard doesn’t mean it’s not worthwhile. In cities that are having trouble changing or dealing with problems, leaders should be looking harder at getting rid of a bunch of non-profits than they are at starting new ones.

This piece was originally published on Urbanophile.

Aaron M. Renn is a senior fellow at the Manhattan Institute, a contributing editor of City Journal, and an economic development columnist for Governing magazine. He focuses on ways to help America’s cities thrive in an ever more complex, competitive, globalized, and diverse twenty-first century. During Renn’s 15-year career in management and technology consulting, he was a partner at Accenture and held several technology strategy roles and directed multimillion-dollar global technology implementations. He has contributed to The Guardian, Forbes.com, and numerous other publications. Renn holds a B.S. from Indiana University, where he coauthored an early social-networking platform in 1991.

Image via Crain's Chicago Business.


The Springfield Strategy

$
0
0

I just enjoyed an adventure in Springfield, Massachusetts with Steve Shultis and his wife Liz of Rational Urbanism. Steve does a far better job of describing his town and his philosophy than I ever could, but my interpretation can be summed up with an analogy about an old college room mate.

At the end of my first year at university I was approached by an engineering student who asked if he could be my room mate next year. We didn’t know each other particularly well and didn’t have much in common, but he seemed harmless enough. I shrugged. Sure. We went our separate ways over the summer and in September he appeared at my door. After a few months of successfully sharing accommodations I asked him why he came to me when most guys in his situation would have gone in a very different direction. He explained.

The average college freshman tends to have an adolescent understanding of what a good independent life might be like. Young men are motivated by peculiar impulses and the siren song of the frat house calls. Beer. Parties. Girls. Sports cars. The prestige of hanging out with rich kids, athletes, and really popular older guys. He said that was usually a big mistake. The furniture is made of plastic milk crates. The place smells like a locker room. People eat ramen and cold day old pizza out of the box. They wear flip flops in the shower because no one has ever cleaned the bathroom. Ever. And when you bring a girl home there are a dozen bigger richer guys with fancier cars than you hovering around. You sit there trying to get your romance on with posters of naked women taped to the walls next to a collection of empty bottles. And you pay extra for all this… It’s just not a great situation.

Then he made a sweeping motion with his hand indicating our apartment. A pleasing mixture of antiques and modern pieces. Smells like lemons. When he brings a girl home I’m in the kitchen cooking brisket and home made bread. Soft lighting. Ella Fitzgerald is playing in the background. No competition. And it’s cheaper. For him, doing the unorthodox and socially uncomfortable thing was just… rational.

Back to Springfield. Steve took a version of the same strategy. He and his family live in a gracious four story French Second Empire mansion. The place is huge and everywhere you look there’s a level of detail and quality you can’t find in any home built today. There’s a legal apartment on the lower level that they use as a guest suite.  I looked up the address on a real estate listing site and he paid less for this house than many people spend on their cars. His family has a quality of life and a degree of financial freedom that none of his suburban piers can comprehend.

Most people load themselves up with massive amounts of debt in order to live the way they believe they’re supposed to. You wouldn’t want to put your kids in a substandard urban school with the wrong element. You wouldn’t want to buy a house that never appreciated in value. You wouldn’t want to have to explain to your friends, family, and co-workers that you live in a slum with poor black people and Puerto Ricans. And where do you park?! It’s so much “better” to soak yourself in debt to buy your way in to the thing you believe you can’t live without.

A walk around the block brought us to the family doctor, numerous great places to eat, and one of the best little Italian grocery stores I’ve seen in years.

A few more blocks and we arrived at the civic center, museum district, and numerous pubic parks. Like most older downtown areas Springfield experienced decades of depopulation and disinvestment with white flight to the suburbs and out migration to the sun belt. As the years passed and the economy shifted once again some downtowns boomed, but it was a winner-take-all scenario in Boston, New York, and San Francisco that hasn’t touched second and third tier towns farther afield. Springfield is half empty, but the full half is amazing and spectacularly affordable.

If you’re looking for a large fully detached home with a yard Springfield has an abundance. These elegant homes are right on the edge of downtown within bicycle distance. This is an excellent alternative to suburban living for families with children who appreciate urban amenities. Homes like these close to Boston sell for millions. In Springfield they sell for pennies on the dollar.

I like to poke around the ugly parts of town in search of hidden nuggets. The most interesting people tend to need two things: affordable property and a lightly regulated environment. It helps if absolutely no one with any authority cares about the location.

Gasoline Alley is the old industrial corridor that supplies Springfield with fuel and associated services. More than a few of the older buildings are no longer viable for their original purposes. Lo and behold, the void is being filled with good music, food and drink.

As much as I appreciate the “creative class’ and the importance of “third places” at the end of the day towns need to be productive before anything else can be supported. Local indoor food production is a viable business model in Springfield. It costs 56¢ to grow a head of lettuce hydroponically and it sells for $3. At first I questioned the level of electricity and other inputs associated with this kind of cultivation. Isn’t it just cheaper and easier to grow things in the ground with sunlight? Turns out… not so much most of the year in Massachusetts.  The alternative is bringing veggies in from California and Florida in refrigerated trucks. That involves far more energy and creates a critical dependency on systems locals have no control over. This particular entrepreneur can’t keep up with demand for his products.

That takes me to another point that no one seems to be talking about these days. Towns like Springfield were once the economic engines of their day. They managed to engage in national and international trade while doing so in an intensely local manner. The primary resources used for commerce and industry were readily at hand: hydro power from rivers, wood from abundant forests, and minerals from local quarries. And raw materials and finished products were transported along the canal system using nothing more than a mule pulling a barge. If you’re looking for an environmental, renewable, durable, and resilient economic base you could do a lot worse than re-inhabiting the mothballed facilities in a place like Springfield.

This piece first appeared on Granola Shotgun.

John Sanphillippo lives in San Francisco and blogs about urbanism, adaptation, and resilience at granolashotgun.com. He's a member of the Congress for New Urbanism, films videos for faircompanies.com, and is a regular contributor to Strongtowns.org. He earns his living by buying, renovating, and renting undervalued properties in places that have good long term prospects. He is a graduate of Rutgers University.

The news media are losing their search for truth

$
0
0

To someone who has spent most of his career in the news business, it’s distressing to confront the current state of the media. Rather than a source of information and varied opinion, the media increasingly act not so such as disseminators of information but as a privileged and separate caste, determined to shape opinion to a certain set of conclusions.

When you pick up a great newspaper like the New York Times, it is sometimes shocking how openly partisan the coverage tends to be. For example, when President Donald Trump unveiled his new tax plan, the headline was not about the proposal per se, but rather how it would serve the wealthy. This may indeed be the case, but such an approach would traditionally be the role of the editorial pages — not the Page 1 headline writers.

This approach oddly actually plays exactly into the president’s hands at a time when, according to a September Gallup poll, confidence in the media stands at a historic low of 32 percent, down from 55 percent in 1999. Even if they don’t like Trump, most Americans are turned off by the relentless negativity.

The unique challenge of Trump

Alienating customers is not good business, especially for an industry that has seen close to 40 percent of its jobs disappear over the past 20 years. Some of the problems, of course, reflect other issues, most notably the rise of online media and the fact that barely 5 percent of Americans aged 18 to 29 get their news from print newspapers. Cable and network news are not doing much better; their audience, notes a March 2014 Pew Research Center report, is now smaller than it was in 2007.

The public’s growing disdain allows Trump to give the media a “big, fat, failing grade” as one of his essential talking points. His no-show at the White House Correspondents’ Dinner plays well with a large part of the population that feels alienated from the mainstream media.

Conservatives have long railed against media bias. But under Ronald Reagan, media experts like Michael Deaver and Pete Hannaford flanked the press by using television and radio to go “over their heads.” The Trump approach, spurred by bully-in-chief Steve Bannon, decries the media as “enemies of the people,” an approach more Stalinesque than Reaganesque.

Trump’s often dubious relationship with the facts remains fair game, but does not excuse the media becoming so obvious and willing a tool of progressive Democrats. Under President Obama, the media simply ignored, or buried, stories such as the Internal Revenue Service’s targeting of conservatives, the expulsion of 2 million immigrants, Obama’s repeated foreign policy failures or his blatant misdirection over health care.

In contrast, some issues, like transgender issues, anything relating to immigration, particularly undocumented aliens, or climate change, are covered with a one-sided stridency characteristic of Vladimir Putin’s Russia. As a cub reporter, I was told by my editor at the Washington Post, “Nobody gives a crap about your opinion,” and we were obliged to look for dissenting opinions. Informing the public was our job, leaving analysis and opinion to the pundits on the inside pages.

Read the entire piece at The Orange County Register.

Joel Kotkin is executive editor of NewGeography.com. He is the Roger Hobbs Distinguished Fellow in Urban Studies at Chapman University and executive director of the Houston-based Center for Opportunity Urbanism. His newest book is The Human City: Urbanism for the rest of us. He is also author of The New Class ConflictThe City: A Global History, and The Next Hundred Million: America in 2050. He lives in Orange County, CA.

Photo: Steve Jurvetson [CC BY 2.0], via Wikimedia Commons

The Evolving Urban Form: Warsaw

$
0
0

Like other major cities in the high income world, Warsaw has seen central area population losses, with all of the population growth taking place outside the urban core, principally in the suburbs and exurbs (Graphic 1). The city's districts were reconfigured so that direct comparisons cannot be made before the 2002 census.


The Warsaw region consists of the city of Warsaw, a county-level national jurisdiction (powiat) and seven powiats in the suburbs and nine in the exurbs. The Warsaw region grew from 3.31 million residents in 2002 to 3.58 million in 2016, a 0.5 percent annual growth rate. Warsaw's slow growth is substantially faster than that of the nation, which has not gained in population since 2002, both as a result of a below-replacement fertility rate and migration to other parts of Europe.

The Central District

The central district (Śródmieście), which includes the central business district (CBD) and the central railway station (Warszawa Centralna) experienced a loss in population of 14 percent from the 2002 census to 2016, according to the Central Statistical Office of Poland.

The skyline of Warsaw (Graphic 2) used to be dominated by the Palace of Culture and Science, which was constructed as a "gift" to the Polish people from Soviet leader Josef Stalin in the early 1950s (though completed after his death). It is sometimes called the "Eighth Sister," referring to its similarity to the "seven sisters" in Moscow that share a very similar "wedding cake" design. Like Moscow State University and Ukraina Hotel buildings in the Russian capital, the Palace of Culture and Science is fully symmetric from the base up. The Palace is located at the very center of Warsaw, adjacent to Warszawa Centralna and even has suburban rail entry structures in the surrounding green area.

The building spent decades as a reviled reminder of Soviet domination and the restrictions imposed under Soviet communism. When the Poles took control of their own destiny about 28 years ago, there was considerable pressure to dismantle the Palace as many felt it was a symbol of oppression. The parliament defeated a measure to demolish the building, despite significant public pressure. Today, the Palace seems to have been, at least reluctantly accepted. It is now impressively lighted at night.

Since that time, the building has had a significant change in function. The building now houses offices, a museum, university facilities, the Polish Academy of Sciences, a fitness center and other functions. Even so, some people will still tell you that the best place to see Warsaw from is the Palace of Culture and Science, because it is the one place from which you cannot see the building. However, the view from the top is certainly worthwhile (Graphics 3-8).

A number of new, modern skyscrapers have been built, principally to the west. The buildings, however, are not closely packed, as would be expected in an American, Canadian, or Australian central business district. Graphic 9 shows the skyline, with the Palace of Culture and Science in the center and other large buildings around it. The distribution of Warsaw's post-Soviet commercial high rises is similar throughout both the central districts and the inner districts, widely spaced and reflecting a modern metropolitan area that has become much more automobile oriented.

The central district also includes the intersection of (Pope) Jana Pawla II and Solidarity (the trade union led by Poland's first post-Soviet president, Lech Walesa), boulevards named for two of the strongest forces responsible for separation from control by the Soviet Union and restoration of Polish independence (photograph at the top). Significantly, one of the corners of the intersection is occupied by a McDonald's, one of the most obvious symbols of the market economy that Poland has embraced.

The central district also includes the "old town," which like most of Warsaw was reduced to rubble by the bombing and street battles of World War II, including the premeditated destruction of the city by retreating German forces. It has been painstakingly rebuilt as it was before (Graphic 10).

Other Districts of Warsaw

The inner ring of districts, each of which borders on Śródmieście, lost eight percent of its population between 2002 and 2016. These six districts include Mokotów, Ochota, Praga Północ, Praga Południe, Wola and Żoliborz.

The outer city districts gained 13 percent in population. Their nearly 120,000 gain more than offset the 60,000 loss in the inner ring districts and the 20,000 loss in the central district.

Suburbs and Exurbs

The inner suburban powiats captured most of the growth, growing 20 percent, and adding 182,000 residents. Growth in the outer nine counties was much less, at three percent and 20,000. Nearly 85 percent of the Warsaw area's population growth occurred in these suburban and exurban areas (Graphics 11 and 12).

The suburban and exurban residential areas are comparatively sparsely developed. Development is more contiguous in the inner ring of suburbs and much less dense exurbs of the outer ring (Graphics 13-16). Many suburban and exurban residential streets are far narrower and often without sidewalks and curbs. The suburban infrastructure generally appears to be of a lower standard than is found in the suburban areas of Australia, Canada and the United States, where larger individual developments have been required to install wide streets, sidewalks and usually sewers, as opposed to the generally smaller or even individually developed parcels that are more evident in suburban Warsaw.

Nevertheless, Warsaw, and Poland, are developing rapidly. Real gross domestic product per capita in the nation has increased by at least three times since 1990. The shopping centers of Warsaw look very much like others in the core of western Europe, and even similar to those in Canada and the United States. The nation is constructing a high-speed motorway system, which has among the highest posted speeds in the world, at 140 kilometers per hour (87 miles per hour), though a number of important segments remain to be built. After many difficult decades, Warsaw and Poland are truly a part of modern Europe.

Wendell Cox is principal of Demographia, an international public policy and demographics firm. He is a Senior Fellow of the Center for Opportunity Urbanism (US), Senior Fellow for Housing Affordability and Municipal Policy for the Frontier Centre for Public Policy (Canada), and a member of the Board of Advisors of the Center for Demographics and Policy at Chapman University (California). He is co-author of the "Demographia International Housing Affordability Survey" and author of "Demographia World Urban Areas" and "War on the Dream: How Anti-Sprawl Policy Threatens the Quality of Life." He was appointed to three terms on the Los Angeles County Transportation Commission, where he served with the leading city and county leadership as the only non-elected member. He served as a visiting professor at the Conservatoire National des Arts et Metiers, a national university in Paris.

Top Photograph: Street signs at the intersection of Jana Pawla II and Solidarity, named respectively for their roles in securing independence from the Soviet bloc (Pope John Paul II and the Solidarity Trade Union, led by eventual President Lech Walesa). By author.

Déjà Vu and the Dilemma for Planners

$
0
0

Some planners may be feeling a little angst. A few months ago, the Federal Highway Administration released 2016 vehicle miles of travel data, indicating robust travel demand growth in 2016, up 2.8%. The increase pushed total vehicle miles of travel (VMT) to a new record and boosted travel per capita to levels not seen since mid-2008. That disappointment was compounded by the recent release of 2016 transit ridership data, indicating a decline of 2.3% in 2016, which compounds last year's 1.3% decline. The disheartening news continued with the recent release of Census data indicating growth trends that had many highly urbanized counties loosing population while growth flourished in predominately suburban style counties. The top ten shrinking counties had a transit commute mode share over twice as high as the top ten growing counties. Piling on, other data indicates that millennials are morphing toward more traditional characteristics as "Millennials are starting to find jobs and relocating to the suburbs and smaller cities," according to a recent Bloomberg article. "Everything we thought about millennials not buying cars was wrong," says the title of a Business Insider news story.

Meanwhile, in spite of an improving economy and the millennial generation aging, 31% of all 18- to 34-year-olds remain living in their parents' home in 2016 – 46.9% in New Jersey—a large group that has not yet necessarily expressed their unconstrained preferences with respect to living location and mobility choices.

Meanwhile, the expectations regarding automated (driverless) vehicles, most probably coupled with shared vehicle ownership and the adoption of electric vehicles, have ramped up. The trickle of public attention is now a firehose of media and policy interest as the public begins to grasp the speculated transformative implications.

The planner is left in a dilemma. How in the world do we do long-range planning if we have so badly missed the mark about the future of mobility and housing choice?

Future plans are influenced by four characteristics of interest: planners' aspirations, revealed phenomenon and behaviors, stated preferences of stakeholders and the engaged public, and innovation and change. Each is discussed briefly below.

Planners' Aspirations

Like in any profession, planners carry their own values and life experiences to work in the morning. These experiences and values influence their work. Historically the implications of varying politics was of subtle and nuanced relevance when there was a strong consensus on the critical role of providing transportation capacity, travel safety and cost effectiveness. However, in an era when everything is political, including transportation planning, different values have more significant implications going forward. As noted in a series of essays on planning theory nearly 40 years ago, the political nature of planning is no secret.

"One of the planning profession's most cherished myths – [is] that the planner is an apolitical professional, promoting goals that are widely accepted through the use of professional standards that are objectively correct." (Burchell and Sternlieb, 1978)

The recent past has seen the myth of an unbiased media exposed with explicit enumeration of political party registration, voting preferences, political contribution tallies, and measures of coverage bias. Such revelations show a media well out of sync with the public they serve. A consequence has been the polarization of media and audiences, which reinforces the value differences. Is the planning profession at risk of being similarly unmasked, and could political biases be impacting plans and their prospects for implementation? Can decision makers place full confidence in the objectivity of analyses and plans that are provided by planners? With the acknowledgement of the political nature of planning, should more senior planners be political appointees, or are other steps necessary to neutralize or expose planner biases?

I have always enjoyed the Albert Einstein quote, "The right to search for truth implies also a duty; one must not conceal any part of what one has recognized to be true," as it alludes to the sin of omission and the subtleties of objectivity. In our ever more politicized world, the politics of planning and planners is more relevant, yet it receives little attention.

Revealed Phenomenon and Behaviors

The foundation of planning practice is captured information about the behaviors of individuals and phenomenon and the use of that knowledge to predict how various policies and investments will perform in scenarios of future conditions. Examples include understanding the noise impacts of infrastructure as facilities are built, the emissions of vehicles in operation, and the travel of individuals when faced with various choices. Planners gain knowledge by observing history, discerning relationships, and extrapolating those relationships to reflect current and proposed future conditions—a process that often includes building and calibrating various models. Part of the current challenge of planning is understanding how valid historic relationships are for application to the future. People had, for example, observed changes in travel behavior and location decisions associated with millennials and extrapolated those to various conclusions regarding future transportation needs. Yet, a growing body of evidence suggests that the magnitude of those changes is not what had been expected, or perhaps hoped for. Many aspects of behavior are not fully understood and changes in demographics, economics, and technology are impacting behaviors in ways that are not reliably predicted based on current levels of knowledge. Our data and models are not always keeping up with changes. Thus, caution should be used in presuming significant variance from historic norms in fundamental travel and location behaviors, as the reversion toward historic trends in travel demand and development trends reveal.

Stated Preferences

"If I had asked people what they wanted, they would've said faster horses."

This quote, attributed to Henry Ford, is often used to characterize the fact that people's aspirations for the future are often constrained by the range of experiences to which they been exposed. While historians debate if this quote originated with Henry Ford, it has stirred discussion about the extent to which people's current aspirations should be a basis for guiding future actions.

The good intentions of planners have resulted in outreach and public participation initiatives to support planning efforts. Virtually ubiquitous communications have enabled broad dissemination of sophisticated information. The solicitation of input from the public offers many benefits: creating a sense of ownership of plans, bringing information and ideas to the table that have not previously been articulated, and cueing planners and decision makers to critical issues that may need to be addressed before approvals and successful implementation can occur. But public expressions about future desires or behaviors may not be a sound basis for action.

Stated preferences often run counter to revealed preferences. Everybody knows a doting parent who years earlier had sworn off having kids or has witnessed the bitter divorce of a couple not long after having seen them vow lifelong commitments. The stated expectations for how people will act in the future often run counter to strong evidence of how people actually behave. The literature is replete with examples of stated preferences varying substantially from actual choices, yet we have little guidance for how to "calibrate" expressions of stated preferences against revealed behaviors such that our plans will more closely address actual future needs.

Innovation and Change

The final factor influencing future plans is the impact of innovation and change. As we are beginning to grasp the potentially transformative impacts of technology, it has flummoxed our ability to plan for the future. Many marvel at the transformative impact of smartphones over a single decade, pointing out how everything from retail to media to business to social interactions has been profoundly impacted. Many are anticipating that self-driving vehicles will inevitably have a similar transformative impact on transportation and land-use. Massive financial and intellectual resources are being directed at transportation, and significant change is inevitable. The costs and impacts of transportation merit this attention. Unfortunately, the long lead times, high costs, and constrained flexibility of many traditional transportation investments make them particularly susceptible to risk if driverless, shared, and electric vehicles become dominant.

So What

So in summary, planners' biases might be more relevant than in the past, our foundational knowledge of behaviors and relationships is getting shaky as the world changes in multiple dimensions, we often don't know how to interpret the public's aspirations, and the pace of technological change might be undermining our historically infrastructure-intensive strategy for dealing with transportation. So planners have some big challenges and important issues to address to insure scarce resources serve the public well. Responding to that challenge is a noble calling, to be sure. On the other hand, if you are overwhelmed with the challenges planners face, both Uber and Lyft are looking for drivers. Bridj—not so much.

This piece first appeared on Planetizen.

Dr. Polzin is the director of mobility policy research at the Center for Urban Transportation Research at the University of South Florida and is responsible for coordinating the Center's involvement in the University's educational program. Dr. Polzin carries out research in mobility analysis, public transportation, travel behavior, planning process development, and transportation decision-making. Dr. Polzin is on the editorial board of the Journal of Public Transportation and serves on several Transportation Research Board and APTA Committees. He recently completed several years of service on the board of directors of the Hillsborough Area Regional Transit Authority (Tampa, Florida) and on the Hillsborough County Metropolitan Planning Organization board of directors. Dr. Polzin worked for transit agencies in Chicago (RTA), Cleveland (GCRTA), and Dallas (DART) before joining the University of South Florida in 1988. Dr. Polzin is a Civil Engineering with a BSCE from the University of Wisconsin-Madison, and master's and Ph.D. degrees from Northwestern University.

Top photo: Daryl Hutchison, darylhutchison.com

.

Guaranteed Minimum What?

$
0
0

I was on the road a while back and needed to stop to use the facilities. A chain restaurant on the side of the highway seemed like a reasonable spot. As I headed to the men’s room I noticed iPads on all the tables. These are the new electronic menus. They don’t replace wait staff, but they do make the whole process of ordering food more efficient with a likely reduction in the overall number of humans needed to do the same amount of work. And there are all the other benefits that come with data mining and systems optimization. The global supply chain managers must love it.

Here’s a multiplex movie theater with a generous supply of self serve ticketing machines. Swipe your card, touch a few icons on a screen, and presto!

Here’s the automated check out cluster at the big box store. Six or eight self serve machines are now overseen by a single human attendant.

CafeX is beta testing a robotic barista. Here’s where high tech and high touch converge on the masses.

Humans are aggressively being eliminated from as many business models as possible. The early adopters will be the largest companies with the most to gain from improvements in efficiency. Over the next few years we’ll see fewer and fewer people behind the counters. There will always be a need for someone to wipe down the tables, mop the floors, and take out the trash so a few minimum wage level positions will linger on. And there will need to be slightly better trained folks to manage the machines. But the overall level of employment in the service economy will consistently contract.

At the other end of the spectrum I enjoyed lunch at an upscale restaurant. The entree consisted of delicately prepared seasonal wild foraged mushrooms served with local organic mixed greens and “moss” which the attentive wait staff explained was sponge cake infused with pureed parsley. The dish was called The Forest. It was delicious. $80. Spot the difference?

Agriculture was mechanized a century ago and the population migrated away from small farm towns to big industrial cities where factory jobs were plentiful.

Industrial cities crested and then were depopulated as factories were sent elsewhere and people moved on to the suburbs to participate in the post industrial service economy.

We’re now seeing the next wave of creative destruction transforming society. We don’t yet know how it will end. At the moment it looks like people with the skills to create and manage complex systems or build and maintain computer guided equipment will do pretty well. So what about everyone else?

This isn’t a technical problem. It’s a cultural and political conundrum. Americans aren’t big fans of taxing the rich and redistributing the money to the folks lower down the food chain. We tend to think of that as social engineering and Godless communism. My best guess is that we’re not going to resolve these challenges in any intentional comprehensive logical manner. At least not at first. Instead circumstances are going to overwhelm us until enough of the population is miserable enough to demand real change. That’s been the historical model and it tends to be messy. Big fun.

This piece first appeared on Granola Shotgun.

John Sanphillippo lives in San Francisco and blogs about urbanism, adaptation, and resilience at granolashotgun.com. He's a member of the Congress for New Urbanism, films videos for faircompanies.com, and is a regular contributor to Strongtowns.org. He earns his living by buying, renovating, and renting undervalued properties in places that have good long term prospects. He is a graduate of Rutgers University.

Viewing all 3795 articles
Browse latest View live


Latest Images