Quantcast
Channel: Newgeography.com - Economic, demographic, and political commentary about places
Viewing all 3794 articles
Browse latest View live

The Persistence of Failed History: “White Infill” as the New “White Flight”?

$
0
0

“There is a secret at the core of our nation. And those who dare expose it must be condemned, must be shamed, must be driven from polite society. But the truth stalks us like bad credit.” – Writer Ta-Nehisi Coates

***

With the recent Supreme Courts strike down of the 1965 Voting Rights Act, which was created to protect minority representation, the headline in the Huffington Post read “Back to 1964?” While some contend the title hyperbolic, the HuffPost lead, if not the strike down itself, reflects the reality of a country still tethered to its discriminatory past.

This reality is reflected in all facets of American society, including urbanism. Specifically, is the “back-to-the-city” movement destined to become 1968 inverted; that is, instead of “white flight” there’s “white infill”? If so, the so-called “game-changing” societal movement will be a process of switching out the window dressing, with the style du jour less lace curtains, more exposed brick.

While debatable, there appears to be a back-to-the-city trend, particularly the inner-core areas of America’s largest and most powerful cities. For instance, according to a recent report by the Census Bureau, Chicago’s core exhibited a 36% boom in its population from 2000 to 2010—a gain of nearly 50,000. Rounding out the top five core-growth gainers were the cities New York, Philadelphia, San Francisco, and Washington D.C. The report finds that, on average, “[T]he largest metro areas—those with 5.0 million or more population—experienced double-digit percentage growth within 2 miles of their largest city’s city hall…”

Who is moving into these “spiky” urban cores?

Whites largely. For example, much of Chicago’s core gains comes from the downtown zip code 60654, in which 11,499 (77%) of the area’s 14,868 incoming residents were white, and where the median family income is $151,000. Other zip codes in Chicago’s core share similar proportions of growth, such as 60605, with 70% of its 12,423 new residents being white. Contrast this with a 5% growth rate for blacks.

As well, according to research by the Thomas B. Fordham Institute examining the zip codes with the largest growth in the share of white population from 2000 to 2010, 15 of the top 50 were located in Philadelphia, New York, and Washington D.C. Philadelphia’s downtown zip code 19123 grew its population by nearly 40%, and its proportion of whites increased from 25% to almost 50%.  In D.C., the growing core zip code of 20001 increased its white share from 6% to 33% in a mere 10 years. While in Brooklyn, the zip codes 11205 and 11206 showed similar growth dynamics, with overall gains of 15% and 18% respectively, and corresponding increases in the white share of approximately 30%. Also on the Institute’s list are zip codes in not-quite-global cities such as Chattanooga, Austin, Atlanta, St. Paul, Indianapolis, Tampa, and Portland, with the vast majority of the “whitening” areas located in, or besides, the downtown core.

Now, why does it matter if whites are leading the charge into those cores frequently championed as evidence of a new social order? After all, it is a step forward, right? Or, as urbanist Kaid Benfield recently wrote:

Inner cities are growing again.  People of means, especially young people, want to be in cities today.  While that carries its own set of challenges, I would submit that addressing the challenges of gentrification is a far better problem to have than coping with massive abandonment and rampant crime.

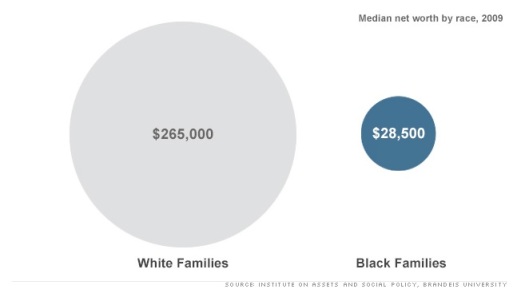
While that line of argument has merit, what’s missing is a deeper examination about those “people of means”. Specifically, a recent study out of Brandeis University showed the wealth gap between blacks and whites has nearly tripled over the past 25 years. That said, the people of means wanting to be in cities is largely the same people who always had means, and they are simply taking their means from one geography to the next; that is, from the suburban development to the urban enclave.

Gap


Of course many argue that infusing affluence into an area will create broad spillover effects. Tweeted urban planner Jeff Speck:

“A beautiful and vibrant downtown can be the rising tide that lifts all ships. #walkablecity”.

Yet there is little evidence of a “trickle down” effect within “rejuvenated” space. For instance, in his piece examining the aforementioned D.C. zip code of 20001, Dax-Devlon Ross writes:

In 2011 alone, condos accounted for 57 percent of total home sales (276), most at triple the 2000 median price. The zip code now boasts an Ann Taylor, a Brooks Brothers, an Urban Outfitters, enough bars to serve several university populations at once and a mind-boggling 10 Starbucks…

…What’s telling about the zip code’s “new build” makeover is that it did not move the poverty needle. The zip code’s poverty rate is exactly what it was in 1980, 1990 and 2000 — 28 percent — and the child poverty rate is nearly twice what it was in 1990 (45 percent).

In other words, such developmental strategy is a game of whack-a-mole in which the raison d’être for the mole won’t stop until real economic restructuring happens, or until equity truly starts entering into the lexicon of our shared language. Instead, we get the apologia of the status quo that is shifting the same affluence to the same pockets, switch out the spatial aesthetics of the parking lot for the parklet.


Trump Towers Chicago. Courtesy of Northwestern Univ.

That said, there is real doubt the country has the stomach for such discourse, let alone for policy that can affect the prioritization of human and community capital. From the article“Separate, Unequal, and Ignored”, the author suggests that “[r]acial segregation remains Chicago’s most fundamental problem”, and he questions why the issue remained muted during the recent mayor’s race. Answered Princeton sociologist Douglas Massey:

“[Segregation] is a very difficult and intractable problem. Politicians don’t like to face up to difficult and intractable problems, whatever their nature”.

Unfortunately for city proponents, this same inability to face the issue by leading urban thinkers is making the “new urbanism” movement look really old. Asked about the risk of racial and economic homogeneity at the hands of the “back-to-the-city” movement, Alan Ehrenhalt, author of “The Great Inversion and the Future of the American City”, answered this way:

I think you’re going to have class segregation no matter what you do. It would be nice to have people of all classes living right next to each other in gentrified downtowns. That’s probably not going to happen. It is true that a gentrified area tends to become less diverse. Cities can’t solve all problems.

No, cities can’t solve all problems. But neither should cities be used to make existing problems worse. Re-urbanism, or specifically the opportunities it creates for equitable reinvestment, should be respected for what it is: a chance to move forward from a divided, destructive past.

Yet such will take collective will and reflective honesty. Or the ability to look deep in the mirror at the American face and know that behind us is a persistence of failed history.

Richey Piiparinen is a writer and policy researcher based in Cleveland. He is co-editor of Rust Belt Chic: The Cleveland Anthology. Read more from him at his blog and at Rust Belt Chic.

Lead photo courtesy of Columbus Underground.


New Data on Commuting in Canada

$
0
0

New data from the National Household Survey indicates that driving to work continues to surge in Canada. In addition to providing work access market shares, the National Household Survey provides one-way work trip travel time estimates for all metropolitan areas.

The National Data

Between the 2006 census and the 2011 National Household Survey indicates an increase of nearly 750,000 additional work-bound cars on the road. The increase in driving exceeded the overall increase of 585,000 in employment (Figure 1). Transit also experienced a strong increase, adding nearly 230,000 one-way work trip riders. At the same time, there were declines in car pool passengers (266,100), walking and cycling (52,200), and working at home (87,700).

Driving (whether alone or in a car pool) reached a share of 68.9%, up 2.1 percentage points over the 66.8% registered in the 2006 census. Transit also increased, with its share rising from 10.2% in 2006 to 11.2% in 2011. The big loss was in carpool passengers which dropped from 7.1% to 5.9%. This declining carpool share mirrors the experience in the United States. There were also losses in the combined walking and cycling share, from 7.1% to 6.5% and in the work at home share from 7.7% to 6.9%.

Overall, the average one-way work trip travel time was 25.4 minutes, not much different than the US average of 25.5 minutes. However, among the major metropolitan areas, travel times generally exceeded those of similarly sized US metropolitan areas (below).

Major Metropolitan Areas

The story was similar among the major metropolitan areas (over 1,000,000 population).

Toronto: InToronto, now Canada's dominant metropolitan area, driving (alone or in car pools) increased from 59.4% to 60.2% between 2006 and 2011. Transit also experienced a full one percentage point increase to 21.7%. This transit work trip market share is higher than any other metropolitan area in Canada or the United States, with the exception of New York, at 31.1%). Toronto’s transit market share trails that of Sydney slightly (22.2%), though is much higher than that in Melbourne. Driving and transit took virtually all of their increase from a 1.9 percentage point loss in carpool passengers.

Toronto’s one way work trip travel time was 32.8 minutes, which is longer than all other major metropolitan areas and exceeded in the New World only by Melbourne (36 minutes), New York (34.9 minutes), Washington (34.5 minutes), and Sydney (34 minutes). Toronto’s work trip travel time is longer than that of larger Los Angeles (28.6 minutes), as well as similarly-sized Dallas-Fort Worth (26.6 minutes) and Houston (27.7 minutes).

Montréal: Montréal, the nation's second-largest metropolitan area experienced a 1.2 percentage point increase in driving, while transit rose 0.7 percentage points. Montréal had the largest decline in carpool passengers among major metropolitan areas, falling from 4.7% in 2006 to 3.2% in 2011.

Montréal’s average one-way work trip travel time was 29.7 minutes, also longer than the Los Angeles metropolitan area, which has more than three times as many residents. Among the 12 US metropolitan areas between 2,500,000 and 5,000,000 population, only Baltimore (30.3) and Riverside-San Bernardino (31.0) have longer work trip travel times than Montréal.

Vancouver:Vancouver was the only major metropolitan area with the decline in driving, from 61.7% to 60.9%. Vancouver also had the highest transit market share increase, from 15.1% to 18.2%. Vancouver experienced a huge (1.9 percentage point) loss in carpool passengers and a strong loss in working at home (0.8 percentage points).

The average work trip travel time in Vancouver was 28.4 minutes. This is nearly equal to that of Los Angeles (28.6 minutes), despite the fact that Los Angeles is nearly five times as large. Vancouver, with a population of 2.3 million has a longer work trip travel time than any US major metropolitan area under 2,500,000 population.

Ottawa:Ottawa, which includes suburbs in Quebec (across the Ottawa River), experienced the 1.4 percentage point increase in driving and a 0.7% increase in transit use. Ottawa's transit market share ranks third in the nation. The driving and transit gains were also largely at the expense of carpool passenger and working at home losses. The one-way work trip travel time was 26.3 minutes.

Calgary:Among the major metropolitan areas, Calgary experienced the largest increase in driving, a 2.7 percentage point increase, from 64.2% to 66.9%. This is the second largest driver market share among the major metropolitan areas. Transit was up a modest 0.4 percentage points, while the share of carpool passengers dropped 1.9 percentage points. Working at home declined by 0.9 percentage points. The one-way work trip travel time was 27.0 minutes, longer than any US metropolitan area in the 1,000,000 to 2,500,000 population category.

Edmonton:Driving increased 2.1 percentage points from 2006 to 2011 in Edmonton, from 70.5% to 72.6%. Edmonton had the highest driver market share in the nation. Transit was up 1.6 percentage points. Car pool passengers declined 2.2 percentage points and working at home declined 0.7 percentage points. Edmonton’s one-way work trip travel time was 25.6 minutes, the shortest among the major metropolitan areas. Work trip travel in Edmonton takes somewhat longer than the average of 24.5 minutes for US metropolitan areas with from 1,000,000 to 2,500,000 million residents

Medium Sized Metropolitan Areas

Five of Canada’s metropolitan areas have between 400,000 and 1,000,000 residents (Quebec, Winnipeg, Hamilton, Kitchener and London). Overall, these areas experienced a 1.9 percentage point increase in driver market share, to 72.4%. Transit was up 0.6%age points to 9.3%. Driving and transit experienced market share gains in each of the five metropolitan areas. As among the major metropolitan areas, the driver and transit gains were principally from losses in car pool passengers. Work trip travel times were below the national average in all but Hamilton.

Travel Time by Mode

At the national level, automobile drivers had an average work trip of 23.2 minutes, while transit commuters spent nearly 20 minutes more (42.2 minutes). Transit’s relative travel times were better in the major metropolitan areas, all of which have rapid transit or light rail lines to downtown (25.6 minutes for solo drivers and 41.6 minutes for transit). Even so, the average transit commuter spends nearly two-thirds more time on the way to work than solo automobile commuters (Figure 2)

Transit’s Market Share

Among the six major metropolitan areas, five (Toronto, Montréal, Vancouver, Ottawa, and Calgary) have transit market shares greater than all other New World (Australia, Canada, New Zealand, and the United States) major metropolitan areas with the exception of New York and Sydney (Figure 3).

Policy Implications

Major metropolitan areas in Canada have made substantial transit investments (see: Improving the Competitiveness of Metropolitan Areas) in recent years and have seen a strong escalation of operating subsidies (Figure 4). These expenditures did not prevent the substantial increase in driving. Transit’s increase was less than the decrease in car pool passengers. It is possible that many car pool passengers switched to transit, however any such diversion would not have had any impact on the number of cars on the road, but would have only reduced the number of passengers. Driving was up in all the major metropolitan areas, even Vancouver. This seems likely to have increased traffic congestion, which is already substantially worse in Canada than in the United States, though better than in Australia and New Zealand (Note).

A principal reason for the increased transit investment has been to reduce greenhouse gas emissions (GHG emissions). However, that impetus is weakening. Canada is adopting strong vehicle emissions standards, virtually identical to the US regulations projected to lead to a huge GHG emissions reduction, even as driving volumes continue to increase (Figure 5). Similar progress seems likely in Canada (projections for Canada are not yet available).


Table
Canada: Commuting Market Share: 2006-2011
2011: National Household SurveyDriverCar Pool PassengerTransitBike Or WalkOtherWork at Home
Major Metropolitan Areas
Toronto, ON60.2%5.1%21.7%5.3%1.0%6.7%
Montréal, QC62.5%3.2%20.9%6.7%0.8%6.0%
Vancouver, BC60.9%4.6%18.2%7.5%1.3%7.6%
Ottawa, ON-QC60.0%6.3%18.9%8.0%0.9%5.8%
Calgary, AB66.9%5.1%14.9%5.7%1.3%6.2%
Edmonton, AB72.6%5.2%10.7%4.9%1.3%5.3%
Metropolitan Areas: 400,000-1M
Quebec, QC72.7%3.9%10.8%7.1%0.7%4.8%
Winnipeg, MB67.9%6.9%12.8%6.8%1.3%4.3%
Hamilton, ON 73.0%6.2%8.7%5.0%0.9%6.2%
Kitchener, ON77.0%6.4%5.1%5.2%0.9%5.5%
London, ON73.4%6.3%6.4%6.4%0.8%6.6%
Major Metropolitan Areas62.5%4.6%19.3%6.2%1.0%6.4%
Metropolitan Areas: 400,000-1M72.4%5.8%9.3%6.2%0.9%5.3%
Balance of Canada75.3%5.8%2.8%7.0%1.4%7.8%
National Total68.9%5.2%11.2%6.5%1.2%6.9%
2006: CensusDriverCar Pool PassengerTransitBike Or WalkOtherWork at Home
Major Metropolitan Areas
Toronto, ON59.2%7.0%20.7%5.4%0.9%6.9%
Montréal, QC61.3%4.7%20.1%6.9%0.8%6.2%
Vancouver, BC61.7%6.5%15.1%7.3%1.1%8.4%
Ottawa, ON-QC58.6%7.5%18.2%8.3%0.8%6.6%
Calgary, AB64.2%7.0%14.5%6.2%1.0%7.1%
Edmonton, AB70.5%7.4%9.1%5.9%1.1%6.0%
Metropolitan Areas: 400,000-1M
Quebec, QC70.7%5.1%9.7%8.2%0.7%5.5%
Winnipeg, MB66.2%8.4%12.3%7.1%0.8%5.1%
Hamilton, ON 71.4%8.0%8.2%5.5%0.8%6.2%
Kitchener, ON73.9%8.9%4.5%6.3%0.7%5.7%
London, ON70.7%8.5%6.3%7.2%0.9%6.4%
Major Metropolitan Areas61.4%6.4%18.1%6.4%0.9%6.8%
Metropolitan Areas: 400,000-1M70.3%7.6%8.7%6.9%0.8%5.7%
Balance of Canada71.6%7.7%2.3%7.9%1.4%9.1%
National Total66.8%7.1%10.2%7.1%1.1%7.7%
From Statistics Canada data


Wendell Cox is a Visiting Professor, Conservatoire National des Arts et Metiers, Paris and the author of “War on the Dream: How Anti-Sprawl Policy Threatens the Quality of Life.

--------------------

Note: The INRIX Traffic Scorecard indicates that the average time lost in Canada’s traffic congestion was more than double the US rate (average delay of 15.6%, compared to 6.6% in the United States) in 2012. New data from Tom Tom indicates that traffic congestion is worse in Australia and New Zealand than in Canada.

Photo: Montreal Centre-Ville (downtown)

A Cri de Coeur for Localism

$
0
0

The current era of 21st century urban revolutions began in early 2011, with scores of cities during the Arab Spring. The uprisings have now taken on a newer, darker hue, with Sao Paolo’s protest over bus fares that has already spread to other cities in Brazil. A few uprisings have resulted in the deposing of hated Middle Eastern dictators, and many leaders have reached uneasy truces with their citizens, but observers sense that this conflict is far from over. Some see these as isolated incidents. It seems more like a global web of urban unrest searching for a voice.

Much of today’s social unrest was predicted by French philosopher Henri Lefebvre, writing in the mid-1970s about social space in the city, and how it has been constructed to favor capitalism. The separation of work and home, for example, is a relatively modern spatial arrangement favoring wealth, and for no better example of this, one can see the hike in Sao Paolo bus fares acting as the straw that broke the camel’s back for the Brazilian poor. Lefebvre’s evaluation of the currents of the late twentieth century can now be updated, and it points to a looming social crisis.

Western states– Chinese, Syrian, or what-have-you – have the tools to utterly crush any alternatives to their power. The state is universally promoted as the “stable center” without which, we are assured, we would descend into chaos. It enables both a spatial flatness and instantaneous communication, collapsing space and time.

The working class, instead of rising up in Marxist-style class struggle, has continually been pacified by consumerism. Anyone interviewing a modern Chinese young adult would, if they got a candid response, hear the anger of this generation over the Tiananmen Square generation’s sell-out; economic freedom was offered by the state, and the people, starved for so long, chose it, rather than political freedom. Today, they pay the price. Placating the lower classes has become expensive, and the state has become overextended in doing so, but cannot stop at the risk of seeding a genuine revolt.

As housing, transportation, food and living costs rise to newly unaffordable levels, a larger and larger segment of the population is left behind. An example of this is the phenomenon of food trucks, which has swept many cities in a few short years, creating a niche that is neither vending cart nor restaurant, but something new in between. Government regulation was swift in coming, notable not for its concern about health, but its concern about the economic protection of vested interests . In olden days, food vendors could just duke it out for the customer. Today, the government, anxious to keep the finely tuned economic hierarchy of the city in balance, rushes in to create order and regulate the problem away.

Struggles in Egypt, Syria, and now Brazil have nothing to do with traditional Marxist concerns about the rise of the industrial worker. With impoverished credibility, evidenced by the multiple failures of the socialist state, leftists have little to offer when considering the urban landscape that lies before us in cities like Aleppo, Damascus, Tunis, Cairo, and many others.

While the right cries “Marxist” at anyone protesting the greed and corruption of the global economic system, this smear is neither accurate nor serious. Old labels are used for lack of anything better, but the confrontations on the streets have neither a red flag nor a red book. Instead, the new mob – refusing to be pacified by the usual pop culture escapism – is searching for a new voice that is neither communist nor capitalist.

The American Occupy movement faded before it could contribute anything meaningful to the last election, but perhaps by consensus it decided that the election was already lost, regardless of which party won. Disbanded, the protest against the “one percent” was an inarticulate voice not ready for prime time. What is the opposite of globalism?

It is a new localism that will arise, refuting the power of the state and finding a yet- unnamed ethic that rejects our flattened, instantaneous space-time for something hilly and slower.
In the coming months and years these urban voices will continue to protest the state’s authoritarianism, as well as the high price of the global economic system. Eventually, these voices will likely converge into a newer socio-economic philosophy, yet to be defined. Lefebvre died in 1991 without ever seeing the protests at global trade talks at the turn of the millennium, but he would have approved of the dialectic. He would also have predicted that they would be crushed by the state, as happened. He would see today’s world as ripe for confrontation.

Flickr photo by Phillip Pessar, Frita Man Food Truck at Walgreens, Miami, Florida. "Food trucks in the Walgreens parking lot have become a regular thing."

Richard Reep is an architect and artist who lives in Winter Park, Florida. His practice has centered around hospitality-driven mixed use, and he has contributed in various capacities to urban mixed-use projects, both nationally and internationally, for the last 25 years.

The Truce That Could Save American Cities

$
0
0

Some states, such as New York and California, are loudly proclaiming that they have returned from the fiscal abyss. Maybe for now, but the future doesn’t look so good when long-term debt and pension obligations are factored in. Taken together, our 50 states owe $1 trillion in unfunded pension obligations.

But right now the most severe and imminent fiscal crisis is in the nation’s cities. For one thing, some states are trying to improve their balance sheets by cutting aid to localities while imposing new mandates for everything from housing to green policies. Governors in states like Pennsylvania, New York and California have b been pushing obligations down to levels of government below them. California Gov. Jerry Brown’s ‘Realignment’ strategy put the responsibility of state justice programs on local governments (though this came with promises of increased state aid). Brown also oversaw the dissolution of over 400 Finance Redevelopment Agencies, some of which may now be forced into bankruptcy. So while state debt is expected to decline by $1.7 billion next year, local debt is set to increase by $600 million.

Despite the mild recovery, many cities remain in dire fiscal straits. In April Moody’s Investors Service warned it could downgrade the ratings of Chicago, Cincinnati, Minneapolis, Portland and 25 other local governments and school districts as part of a change in how it factors public pensions into debt grades. In Chicago, teachers’ pensions alone cost $1 billion a year, while overall debt service accounts for close to a quarter of the city budget.

Seven major municipalities have already filed for bankruptcy, the largest being San Bernardino, Calif. The main cause is not hard to find: unfunded pension obligations to employees. A recent Lincoln Institute paper estimated that the aggregate unfunded liabilities of locally administered pension plans top $574 billion and eat up nearly 20% of municipal budgets. But the worst is yet to come. According to the Lincoln Institute’s Anthony Flint,  “If trends continue, over half of every dollar in tax revenue would go to pensions, and by some estimates in some cases would suck up 75% of all tax revenue.”

This dynamic will eventually be felt not only in long-term basket cases such as Detroit but also in America’s largest and most venerable cities such as Los Angeles, New York and Chicago. Part of the problem lies in legacy costs, similar to what we have seen in older industrial companies and airlines. The longer a municipality has been ladling out generous retirement benefits to public workers, the more they have to face the consequences, particularly as more retirees have the poor taste to live well into their eighties and beyond.

In New York, notes the Manhattan Institute’s Steve Malanga, annual pension costs during Michael Bloomberg’s 12 years as mayor have grown from $1.8 billion to over $8 billion. According to the 2012 NYC budget, by 2015 these “legacy costs” will account for 25% of the city’s total budget, up from 16% in 2005. Overall these costs will have doubled over 10 years while other spending will have grown by barely 30%.

A crisis is also brewing in Los Angeles, a once youthful city whose rent-seeking developer and union-dominated political structure has turned it into an economic and fiscal laggard. Former Mayor Richard Riordan has predicted that unless pensions and compensation are reformed dramatically, the city will slide toward bankruptcy. The nation’s second-largest city faces a projected $800 million deficit over the next four years and pensions that are underfunded by at least $15 billion.

These  huge obligations increasingly constitute a tax on the future of urban residents. As cities are forced to cough up ever more money to meet their retirement promises to workers, they become ever more incapable of addressing the basic infrastructure needs critical to maintaining economic competitiveness against younger, often faster-growing cities in less union-dominated parts of the country, notably in the South and Southwest, as well as newer, often more affluent suburban areas.

In the coming years count on the emergence of an increasingly dire conflict between urban boosters — who long for everything from improved schools to more bike lanes and better transit — and their traditional allies among the public-sector workforce. Essentially this will be not so much a war between conservatives and free-spending liberals, but what Walter Russell Mead has described as “blue on blue” conflict.

Conservatives, of course, have their own answers to this conundrum: large-scale budget cuts, severing of union contracts, privatization of essential services even if  basic infrastructure   deteriorate. All but the last alternative have some place in forward-looking urban strategy, but face enormous political challenges given the essentially one-party, union-oriented politics in most major cities. If a media-savvy plutocrat like Michael Bloomberg could not slow the expansion of the cost structure of New York, it’s unlikely that the more run of the mill mayors around the country can much succeed.

So is there a way out, short of the unlikely resurgence of conservative thinking in urban America? One possibility lies in restating urban priorities towards a  City Hall focus on boosting  the private sector as a means to meet at least some of its obligations. Rather than waging a war neither side can win, perhaps this new understanding could serve as the basis for a durable urban truce.

This, of course, requires a short course in economics for most urban officials and unions. The impending bankruptcy of cities such as Detroit, where service cutbacks and contract rollbacks are now the order of the day, should be held up as a stark lesson of what can happen. Continued tax increases, the preferred solution among progressives, are a mistake since they tend to drive businesses and middle class workers to places with less onerous burdens.

What needs to be drilled into the urban progressive mind is the basic reality that if the private economy fails, unions will find themselves confronted not by weak-kneed, weak-minded politicians they can own, but by bond holders, accountants, lawyers and judges who will press to either negate contracts or allow basic services to deteriorate to catastrophic levels.

At the same time, the private sector needs to recognize its inherent interest in the maintenance of efficient and reliable city services. Rather than simply denounce government, per se, the business community needs to appreciate the fundamental importance of the public sector to long-term economic growth. For much of western history urban infrastructure and efficient services played a critical role in the creation of strong urban economies.

This has been true as well in the United States, from the days of toll roads to late 19th century investments in water and sanitation systems. Modern Los Angeles would have been inconceivable without the aggressive, and often ruthless, building programs of the city-owned Department of Water and Power. And for all his many excesses, the resurgence of New York still rests on the road, bride and transit legacy created by the master builder Robert Moses.

These public efforts provided a basis for economic growth, that can  generate revenues to pay city workers. Sadly this virtuous cycle has given way to a vicious one, with much of municipal spending wasted on economically questionable  “bread and circuses” — subsidized condo development, sports stadia, convention centers, arts programs, often marginal rail transit investments  — over more mundane investments in roads, bridges, buses, ports and the like. With rising interest rates imposing higher costs for infrastructure projects, the need to be judicious on spending priorities will become only greater.

To assure the future of our cities, deals need to be struck between workers and cities to temporarily keep down costs as cities try to snap out of the post-recession doldrums and develop stronger growth-based economies. In economically distressed Rhode Island, State Treasurer Gina Raimondo, a former venture capitalist, led an effort to save that state’s cities and towns about $100 million this fiscal year and $1 billion over the next 20 years.

Ultimately leaders in both the private and public sectors in cities need to recognize that the only way out of recurring crisis and inevitable decline lies in job-generating economic growth. Many of the cities with the best job growth are running budget surpluses , ranging from ultra-blue, union-dominated San Francisco to red state stalwarts such as Nashville, Fort Worth and Oklahoma City.

This suggests that business and governments need not only to restrain spending, but spend public funds in ways that are most likely to stimulate economic growth. There should be a strong discussion about municipal priorities — they often differ somewhat by city – with the primary focus   on those things that promote job creation and upward mobility. The urban future can not be secured by providing lavish retirements for city workers or subsidies for rent-seekers. Cities can only truly prosper by promoting that foster  growth in ways that deliver  real benefits to the vast majority of their citizens.

Joel Kotkin is executive editor of NewGeography.com and R.C. Hobbs Professor of Urban Studies at Chapman University, and a member of the editorial board of the Orange County Register. He is author of The City: A Global History and The Next Hundred Million: America in 2050. His most recent study, The Rise of Postfamilialism, has been widely discussed and distributed internationally. He lives in Los Angeles, CA.

This piece originally appeared at Forbes.

City Hall photo by Flickr user OZinOH.

Eastvale, CA: Suburban Charm Trumps Urban Convenience

$
0
0

Eastvale, a new community just over the Riverside County line from Orange County, is a place that most urbanists would naturally detest. City Hall is no architectural masterpiece, occupying a small office inside the area's largest shopping mall. The streets are wide, and the houses tend to be over 2,500 square feet. There's nothing close to a walking district and little in the way of restaurants besides fast-food outlets and chain eateries.

Yet Eastvale, which incorporated in 2010 , is also among the fastest-growing places within California. Located in an area once known as Dairy Valley, it was settled by Dutch farmers and for years was known as "Fly Valley" because of the insect infestations associated with herds of cattle. Houses began to go up in the early 2000s, as families leaving congested and high-cost coastal Southern California began to move into the area.

Although hit by the housing bust, like much of Riverside County, Eastvale's home sales have been on the upswing, and real estate agents suggest that the biggest problem is finding properties to sell. Land prices, $5 an acre in 1974, rose to $525,000 at the peak of the boom, then collapsed, but are now back to over $300,000. The median price of a single-family home, $433,000, is just around the state average. In contrast, prices in coastal Orange County average $556,000 and, along the coast, closer to $1 million for a comparatively newer home.

With prices escalating again in Southern California, affordability is once again dropping, particularly for new buyers. Today, according to the California Board of Realtors, affordability of new housing in Orange County for first-time buyers has already dipped below 50 percent for the first time since 2008. It could be headed back to the 20 percent – or lower – rates experienced during the housing bubble.

Los Angeles, San Diego and other coastal cities are experiencing similar upticks, but with no appreciable likelihood of new home construction, which statewide is now running at one-third of annual demand. This is particularly true for single-family detached homes, the housing preferred by most consumers but most detested by the state's planning hierarchy.

In the short run, this shortfall benefits what historian Bob Bruegmann calls "the incumbent's club," current owners of single-family homes. But it also fundamentally functions as a tax on future generations. The costs of housing inflation are imposed on the offspring of the coastal cities, not to mention immigrants and new migrants, who still need someplace to live a basic middle-class lifestyle without draining all their financial resources.

Although people on the coast tend to look down on the "909s", the fact remains that, to retain a large, growing and vibrant middle class, the coast needs an outlet, particularly for the workers to staff its industries. Roughly a third of the Inland Empire's workforce labors in either Los Angeles or Orange County. Without the outlet represented by the area, companies in Orange and Los Angeles will increasingly be forced to relocate or expand further out of the region and the state.

Rather than being dismissed as second-rate, the oft-maligned Inland Empire remains a critical component for the future of Southern California. The media obsesses over the disasters that accompanied the housing bust but, in places where schools and parks are strong, like Eastvale, things have improved as foreclosures have plummeted.

In fact, after a long hiatus, local developers are beginning to put up more new houses to meet the demand. With over 50,000 residents, Eastvale already has more people than downtown Los Angeles, and the mayor, Ike Bootsma, seventh of nine children of a Dutch immigrant farming family, projects this population to swell to 76,000 by 2020.

Eastvale largely attracts upwardly mobile (average household income is around $100,000) families, many of them minorities. These are people who, a decade or two ago, might have settled closer to the coast, but can no longer afford to do so.

Kids are a big deal in Eastvale, at a time when coastal California, including both Orange and Los Angeles are becoming older, and dominated by childless households. One-third of Eastvale's population is made up of children under 18, well above the one in four average for California. The number of persons per household is over four, compared to less than three for the state as a whole.

The dream people are chasing is a traditional one, yet many of the new families are diverse. Located roughly an hour from downtown Los Angeles, almost half the city's households speak a language other than English at home. Asians account for close to a quarter of the population, Latinos roughly 40 percent.

"There's no way you can live this life in Mumbai," notes Indian immigrant Nibha Kothari, who moved to Eastvale with her husband and young daughter earlier this year. "There's a balance here between city and town here. In Mumbai, everything is so crowded and congested and there's so much stress. It's the little things, the quality of life for our family, that got us here."

Residents like Kothari admit it's not the aesthetics of the urban design that brings them to Eastvale. Instead, as in Irvine, it's the things urban pundits barely address, like good schools, a well-developed park system , low crime rates and, perhaps most importantly, larger house footprints. After all, family is the main reason people move to Eastvale, and many locals talk about having relatives living in the same community.

Andrea Hove, the wife of an Orange County sheriff's deputy with whom she has four kids, has several relatives in the neighborhood and a network of friends who also have extended families. "I wanted to stay home with the kids," she explains. "In Orange County, we'd be stuck with 1,800 square feet and send the kids to private school. Here, I have great schools, 3,000 square feet for less, and my walk-in closet is bigger than most people's bedrooms. It's a great family community in terms of schools and parks. I can't go anywhere without seeing someone I know."

Finally, she says, there's also an excitement from being in somewhere new that is still developing its sense of place and urban traditions. "This is a place where we can shape the community for our kids," she suggests. "We can make it the way we want it, not just live the way some politician says we should."

These kind of aspirations are rarely discussed among planners, academics or even many developers but they constitute much of what people actually want and reflects their most cherished priorities. It may seem mundane to urban aesthetes, but crucial in the locational decisions of many people.

"Everyday life," observed the great French historian Fernand Braudel, "consists of the little things one hardly notices in time and space."

Most people live ordinary lives, start businesses, raise families, go to church, play in little leagues and local softball tournaments. Concert halls, hip restaurants and striking architecture may thrill our media and design communities, but perhaps more critical to the long-term future may be places, like Eastvale, where Southern California's middle-class families still can comfortably thrive.

Joel Kotkin is executive editor of NewGeography.com and R.C. Hobbs Professor of Urban Studies at Chapman University, and a member of the editorial board of the Orange County Register. He is author of The City: A Global History and The Next Hundred Million: America in 2050. His most recent study, The Rise of Postfamilialism, has been widely discussed and distributed internationally. He lives in Los Angeles, CA.

This piece originally appeared at The Orange County Register.

Will Europe Hit a Demographic Tipping Point?

$
0
0

The best hope for the youth of France, according to a recent New York Times op-ed, is, well, to get out of France.  Youth unemployment in France is running at 26%.  No wonder some might believe their best opportunity lies elsewhere, including their old colony of New France (Quebec). 

But this punishing level of unemployment is only slightly worse than the EU-wide rate of 23%. Countries like Spain and Greece have astonishing youth unemployment rates of nearly 60%. What does the future of these countries’ youth look like? Or their adults for that matter? Maybe it’s a future on another continent, including former colonies.

Young people in France are starting to test the economic waters in Quebec. Fairly recently Spain became a place immigrants came to for opportunity, becoming one of the primary draws for immigrants for both Africa and Latin America. But now Spain is again seeing people leave for greener pastures in Latin America. It’s a similar case in Portugal, where tens of thousands of Portuguese natives have moved to their former colony of Angola in recent years.  

In 1968 Paul Ehrlich’s doomsday tome The Population Bomb predicted mass starvation and civilizational collapse in much of the world due to overpopulation. But the more serious problem – particularly in traditionally higher-income countries – today is actually too few, not too many new people. The pivot to seeing this as the problem has come through something very basic: pension math. Across the developed world, public pension systems built on the assumption of continued population growth are now facing an actuarial day of reckoning as the bills come due while birth rates have plummeted.

A society needs a total fertility rate – that is, the average number of children born to each woman – of 2.1 just to maintain its population without immigration. Some European countries like France (2.03) and the UK (1.98) are in reasonably good shape, but they are the exception. The total fertility rate in Greece is 1.43, in Germany 1.36, in Spain 1.36, in Portugal 1.30, and in Poland 1.30.  Much of southern and central Europe hovers near the so-called “lowest-low” rate of 1.3 in which the population is naturally being cut in half every 45 years.

Simple birth rates alone have caused some to posit a societal going out of business sale in Europe. However, just as extrapolation of high population growth rates in the past led to wildly alarmist claims that proved false, so today we must be careful about not proclaiming Europe is doomed. But with the population on tap to be halved every generation, the runway to turn things around is difficult to conjure. And while we’ve seen many countries make the shift from high to low birth rates, there isn’t a huge track record of success in the other direction.

It’s against this backdrop that Europe’s youth unemployment crisis must be seen.  Not only are Europe’s young facing short term pain from economic crisis, they also face the long term prospect of being a small population cohort that has to spend their entire working lives (when they eventually find jobs) paying for previous generations’ lavish retirement benefits never properly funded. Along with this, they are the ones who will likely bear the brunt of reduced pension payouts for themselves while the current and nearly retired are fully protected from cuts. This is on top of the massive official public sector debts that have been accrued, along with many years of pain from IMF and EU mandated austerity in a number of countries. Contracting demographics is like a “force multiplier” for unfunded liabilities, and this generation may never achieve the affluence – and buying power – of their parents.

Immigration has been heralded as a solution to demographic issues, but this seems unlikely to bail Europe out. Unlike the US or Canada, European nation-states are built primarily on ethnic identities that make integration difficult no matter how progressive the policies.  Sclerotic economies and regulations that reward incumbents and large “national champion” firms while punishing entrepreneurs – immigrants are disproportionately entrepreneurial – don’t help.  With Europe having a large percentage of unassimilated and unemployed immigrants along with high native born unemployment rates, there has been social unrest all around. Immigrants have rioted, even in unlikely locales like Stockholm, while there has been an alarming rise in far right extremist groups among the native born.  Unlike immigrant-friendly North America, immigration has been as much problem as solution in Europe.

So what exactly is in it for a young person in Greece, Italy, Spain, or apparently even France to stay home? Increasingly not a lot other than avoiding the difficulty involved in moving to another country far from home where the culture, language, etc. are different. That’s a daunting challenge to be sure, especially in a continent where people are very rooted, not just in their country, but often their town, though this can be reduced if they move to a former colony. But it appears we are seeing early signs of migration out of some European countries.

It’s way too early to say what this will turn into, but if an exodus of the youth does take hold, it isn’t hard to imagine how this could hit a catastrophic tipping point in some countries. Facing unemployment, unfunded pensions, massive debts, austerity, and social unrest – as well as the prospect of getting stuck as the bag holder for all this – it isn’t hard to imagine a flight for the exits among the young. This would be like a demographic Lehman Brothers. Once confidence is lost, there’s a run on the bank, or in this case, a run for the exit.

This is far from assured, of course. But it’s not an inconceivable outcome if things stay on the present course. Solving the nexus of issues around growth-euro-debt is critical for Europe, as is cracking the code on immigration. It seems unlikely birth rates will improve until these items are solved first. In the meantime, the US and Canada should be revisiting their own immigration laws to make sure they are poised to respond to – and benefit from – another wave of European economic refugees heads their direction.

Aaron M. Renn is an independent writer on urban affairs and the founder of Telestrian, a data analysis and mapping tool. He writes at The Urbanophile.

Photo by funtik.cat (Dasha Bondareva).

A Suburban Economic Future?

$
0
0

The basic, often unappreciated, fact  about economic life in Australia’s  metropolitan regions are that most of the jobs are in suburban locations. Our central business districts (CBDs) – prominent though they are – account for only around 10% of all metro wide jobs. That rises to maybe 15% if you include inner city areas. But still, 85% of everyone else who calls Brisbane, Sydney, or Melbourne home works somewhere other than the CBD or inner city.

Not only that, but the share of jobs in the suburbs versus the city has been rising, at least marginally. This doesn’t mean that CBD job markets are shrinking (in the main, they’re not) just that suburban employment markets are growing faster. So CBDs are becoming, perhaps inexorably, less dominant.

The evidence also shows that suburban employment isn’t distributed evenly but in various concentrations. Some of these areas add to very large numbers – rivalling the totals found in CBDs – but they do so at much lower densities of employment. Concentrations of 2,000 to 4,000 jobs per square kilometre are dense by suburban standards but still only a fraction of CBD concentrations, which can closer to 100,000 per square kilometre. For many suburban employment areas, concentrations are even lower at maybe 500 to 1000 jobs per square kilometre. While CBD office workers measure their space in square metres (roughly 15 to 20 per person) some suburban workers might measure theirs in acres.

The income profiles of CBD and suburban workers vary. Across the three major centres of Brisbane, Sydney and Melbourne, the research shows that suburban workers, on average, earn considerably less than CBD workers. The top ten income areas city wide are nearly all inner city areas, and these workers earn more than double the average of the bottom 10 areas (which are invariably suburban). The average CBD worker, according to the census, pockets between A$80,000 and A$90,000 per annum. The average suburban worker pockets around $50,000 per annum. Given that suburban jobs account for around 85% of all jobs, the CBD is indeed a privileged centre of income earning ability.

Having said that, there are still interesting pockets of suburban employment where above average incomes are to be found. The Brisbane airport and port region, for example, features in the top 10 income earning locations along with inner city locations, even though the majority of jobs (62% to 74% according to the Census) are blue collar.

CBDs and suburbs vary widely as well in transit choice. For suburban workers, the private car is the overwhelming mode of transport (above 80% to 90%), not by choice or because of some “love affair” with the car, but of necessity. The very nature of dispersed suburban employment makes public transport uneconomic, which is why only around 5% of suburban workers use it. For CBD workers though, public transport is more widely used because it’s more available and convenient: more than 50% (and more than 60% in Sydney’s case) of CBD workers make use of it.

The evidence also shows that the closer you live to the city, the more likely you are to use public transport to get to your CBD workplace. The proportion of people with CBD jobs falls the further you live from the CBD: meaning outer suburban residents are highly unlikely to have CBD jobs and hence only around 3% to 5% use public transport. Ironically, given CBD jobs earn the highest incomes and are also more likely to use public transport to get to work, we have a situation where those with the highest paying jobs are enjoying the biggest benefit of heavily subsidised public transport. You could argue on this evidence that those on lower suburban incomes are subsiding the train and bus fares of their higher paid CBD workforce cousins.

Now for the future

The evidence is one thing but where it all leads can provoke any number of alternative scenarios. Just for the sake of discussion, here’s one possibility: that cost and convenience factors will increasingly work against CBDs and inner cities and more and more businesses will establish, grow, or relocate to, suburban employment locations.

It’s possible this shift is already underway. The evidence shows a slow diminution of CBD prominence. Technology is increasingly reducing the person to person immediacy and co-location advantages of a highly concentrated CBD environment. We communicate more and more through electronic means, which also means physical location is less and less essential to daily business contact.

Costs are another factor. CBD offices and retail space are expensive relative to suburban locations. They are worth it in terms of prestige where this matters (leading legal or accounting firms for example), or where central location is important. But as costs via rents rise, the equation is constantly recalculated. Is it worth headquartering large numbers of staff in CBD offices when these staff have limited need for face to face business dealings outside the business? The cost/benefit analysis is an ongoing exercise and the business press contains plenty of evidence of companies who increasingly decide the suburban alternative is attractive. Rising car parking costs – for business visitors and clients along with staff – are just another factor in the falling competitive advantage for CBDs.

Employee costs could also be a factor. Even basic administrative roles in CBD locations command higher pay packets than similar roles in suburban locations, for whatever reason. If it is possible for administrative functions to be located in a suburban location where total employee costs are less, will this become a factor in the trade-off between CBD and alternative suburban locations?

Congestion may be another. As urban densities rise, especially around CBDs and inner city areas, congestion of all forms (private and public transport) will increase. Density is after all almost a synonym for congestion. Will businesses in increasingly congested CBD or inner city environments opt for suburban alternatives where congestion is less of an issue?  We can not yet say.

On the other hand, because CBDs and inner cities feature such a concentration of social amenities through public infrastructure (entertainment, cultural and recreational facilities) they may continue to appeal as residential addresses. Is it possible that as CBDs and inner cities develop their residential stock, we may find significant numbers of people who live in CBD locations for the inner city amenity, but who work in suburban locations? Time will tell.

Planning schemes would have to adapt to any of the above scenarios. Existing suburban economic areas may need their development density  under city plans increased to meet demand. TODs may become places where people travel to a suburban workplace centred on a train station or bus interchange, as opposed the current thinking which is that people will live near suburban transit nodes in order to work in inner city locations.

Any number of other scenarios are possible. My research has attempted to present the statistical evidence on the suburban nature of employment in our metropolitan regions, and make some observations about the public policy and future development implications. Given the extent of commentary, research and public policy concentration around the CBDs and inner city, the research suggests that some equally intense efforts to improve our suburban economic environment would yield significant community wide results.

Ross Elliott has more than 20 years experience in property and public policy. His past roles have included stints in urban economics, national and state roles with the Property Council, and in destination marketing. He has written extensively on a range of public policy issues centering around urban issues, and continues to maintain his recreational interest in public policy through ongoing contributions such as this or via his monthly blog The Pulse.

Metropolitan Dispersion: 1950-2012

$
0
0

America has become much more metropolitan since 1950, when the Office of Management and Budget released the first modern criteria for determining the boundaries of metropolitan areas. Metropolitan areas are the economic or functional definition of the "city." They are otherwise known as labor markets and include the physical "urban area" (the area of continuous development) as well as economically connected rural territory from which people commute into the urban area. A previous article examined the development of the “physical” form of the city (urban areas) in the United States, from 1920 to 2010 (See Observations on Urbanization: 1920-2010).

Major Metropolitan Areas in 1950

In 1950, there were 14 major metropolitan areas in the United States (over 1,000,000 population). Their combined population was 44.5 million. By 2010, there were 52 major metropolitan areas, with a total population of 169.5 million. This increase, 124 million, is approximately equal to the population of France and the United Kingdom combined. While major metropolitan areas were increasing their population by 281 percent, the rest of the nation grew only 106 percent (Note 1).

Dispersion to Smaller Metropolitan Areas

As the nation was moving to major metropolitan areas, much of the growth was in the 38 smaller metropolitan areas that passed the 1,000,000 mark after 1950. These areas had 17.7 million residents in 1950. By 2010 they had added more than 70 million new residents, for a total population of 88.5 million. In contrast, the 14 metropolitan areas that had more than 1,000,000 population in 1950 grew only 36.5 million, to 81.1 million (Figure 1).

Among the metropolitan areas that had reached 1,000,000 population by 2010, the fastest growing were all in the Sun Belt. Las Vegas, which was too small to be a metropolitan area in 1950, grew 39 times (3,941 percent) compared to the 1950 population for the area constituting the 2010 metropolitan definition (Clark County). Orlando grew 17.6 times (1,757 percent), while Riverside-San Bernardino grew 14 times (1,400 percent). Three other metropolitan areas grew 10 times or more, including Phoenix at 11.6 times (1,164 percent), Charlotte at 10.3 times (1,025 percent) and Miami at 10.2 times (1,017 percent).

Los Angeles added the most to its population, at 8.7 million residents from 1950 to 2010. Perhaps surprisingly, however, New York also grew strongly, adding 6.9 million residents. Los Angeles, which grew quickly until recently, managed to reduce New York’s 8.5 million 1950 lead by only one-fifth by 2010. Dallas-Fort Worth added the third greatest number of new residents (6.1 million), partially by absorbing the former (and smaller) Fort Worth metropolitan area during the period. Houston added 5.4 million residents. Miami added 5.4 million residents, also incorporating smaller metropolitan areas, Fort Lauderdale and West Palm Beach. Chicago ranked surprisingly high, adding 4.0 million residents, the result of comparatively strong growth in the early decades (Figure 2). The strong population growth evident in New York and Chicago is largely attributable to much faster growth rates between 1950 and 1970 period.

The ascendancy of Texas is illustrated by the fact that its two largest metropolitan areas, Dallas-Fort Worth and Houston added more residents (Note 2) than the two largest metropolitan areas in California, Los Angeles, and San Francisco (11.5 million compared to 10.9 million). However, stronger long term California growth was indicated by the 4.1 million addition to the Riverside-San Bernardino metropolitan area (the “Inland Empire”), which is adjacent to the Los Angeles metropolitan area and has emerged as the dominant growth center of the state in recent decades.

Similar Regions, Big Differences

There were substantial contrasts in growth between similarly sized metropolitan areas in 1950 over the period.

Atlanta and nearby Birmingham were similar in population in 1950. Atlanta had a population of 672,000 (ranked 23) and Birmingham had 559,000 (ranked 27). By 2010, Atlanta had risen to a population of 5.3 million and a rank of 9th, compared to Birmingham’s 1.1 million and a rank of 49th.

A somewhat smaller, but significant difference is evident between Seattle and nearby Portland, which were nearly the same size in 1950 (733,000 and 705,000 respectively) ranking 20th and 21st respectively. Over the next 60 years, Seattle grew 2.8 million (some of it from absorbing the former Tacoma metropolitan area). By 2010, Seattle was the 15th largest metropolitan area in the nation, while Portland had fallen to 23rd, adding a smaller 1.5 million residents. Portland and San Francisco were the only major metropolitan areas in the West to fall in the national rankings between 1950 and 2010.

Slower Growth Major Metropolitan Areas

The slowest growing major metropolitan areas were Buffalo (4 percent), Pittsburgh (6 percent), Cleveland (41.7 percent), Detroit 42.4 percent and New York (52 percent (Table 1).


Table 1
Major Metropolitan Areas: 2010, Change from 1950
PopulationRank
Metropolitan Area19502010Change201219502010
Atlanta, GA        671,797     5,286,732 687%    5,457,831 239
Austin, TX        160,980     1,716,286 966%    1,834,303 10735
Baltimore, MD    1,337,373     2,710,489 103%    2,753,149 1220
Birmingham, AL        558,928     1,128,050 102%    1,136,650 2749
Boston, MA-NH    2,389,986     4,552,402 90%    4,640,802 610
Buffalo, NY    1,089,230     1,135,511 4%    1,134,210 1447
Charlotte, NC-SC        197,052     2,217,035 1025%    2,296,569 9124
Chicago, IL-IN-WI    5,495,364     9,461,105 72%    9,522,434 23
Cincinnati, OH-KY-IN        904,402     2,114,580 134%    2,128,603 1528
Cleveland, OH    1,465,511     2,077,240 42%    2,063,535 1029
Columbus, OH        503,410     1,901,965 278%    1,944,002 3232
Dallas-Fort Worth, TX        614,799     6,426,210 945%    6,700,991 244
Denver, CO        563,832     2,543,478 351%    2,645,209 2621
Detroit,  MI    3,016,197     4,296,247 42%    4,292,060 512
Grand Rapids, MI        288,292         988,938 243%    1,005,648 6052
Hartford, CT        358,081     1,212,384 239%    1,214,400 4744
Houston, TX        806,701     5,920,456 634%    6,177,035 186
Indianapolis. IN        551,777     1,887,877 242%    1,928,982 2933
Jacksonville, FL        304,029     1,345,596 343%    1,377,850 5640
Kansas City, MO-KS        814,357     2,009,338 147%    2,038,724 1730
Las Vegas, NV          48,289     1,951,269 3941%    2,000,759 NA31
Los Angeles, CA    4,367,911   12,828,842 194%  13,052,921 32
Louisville, KY-IN        576,900     1,235,708 114%    1,251,351 2543
Memphis, TN-MS-AR        482,393     1,324,829 175%    1,341,690 3641
Miami, FL        498,084     5,564,657 1017%    5,762,717 348
Milwaukee,WI        871,047     1,555,908 79%    1,566,981 1639
Minneapolis-St. Paul, MN-WI    1,116,509     3,348,859 200%    3,422,264 1316
Nashville, TN        321,758     1,670,890 419%    1,726,693 5537
New Orleans. LA        685,405     1,189,863 74%    1,227,096 2246
New York, NY-NJ-PA  12,911,944   19,567,407 52%  19,831,858 11
Oklahoma City, OK        325,352     1,252,992 285%    1,296,565 5342
Orlando, FL        114,950     2,134,411 1757%    2,223,674 13827
Philadelphia, PA-NJ-DE-MD    3,671,048     5,965,341 62%    6,018,800 45
Phoenix, AZ        331,770     4,192,887 1164%    4,329,534 5114
Pittsburgh, PA    2,213,236     2,356,285 6%    2,360,733 822
Portland, OR-WA        704,829     2,226,009 216%    2,289,800 2123
Providence, RI-MA        737,203     1,600,852 117%    1,601,374 1938
Raleigh, NC        136,450     1,130,490 729%    1,188,564 12548
Richmond, VA        328,050     1,208,101 268%    1,231,980 5245
Riverside-San Bernardino, CA        281,642     4,224,851 1400%    4,350,096 6313
Rochester, NY        487,632     1,079,671 121%    1,082,284 3551
Sacramento, CA        277,140     2,149,127 675%    2,196,482 6425
Salt Lake City, UT        274,895     1,087,873 296%    1,123,712 6850
San Antonio, TX        500,450     2,142,508 328%    2,234,003 3326
San Diego, CA        556,808     3,095,308 456%    3,177,063 2817
San Francisco-Oakland, CA    2,240,767     4,335,391 93%    4,455,560 711
San Jose, CA        290,457     1,836,911 532%    1,894,388 5934
Seattle, WA        732,992     3,439,809 369%    3,552,157 2015
St. Louis,, MO-IL    1,681,281     2,787,695 66%    2,795,794 918
Tampa-St. Petersburg, FL        409,143     2,783,243 580%    2,842,878 4119
Virginia Beach-Norfolk, VA-NC        446,200     1,676,820 276%    1,699,925 3836
Washington, DC-VA-MD-WV    1,464,089     5,636,232 285%    5,860,342 117
Notes on changes from 1950
All first named municipalities were the central cites per OMB in 1950 except:
Norfolk was the central city of Virginia Beach
San Bernardino was the central city of Riverside-San Bernardino
Jersey City and Newark were also central cities of New York
Las Vegas 1950 is for Clark County (was not a metropolitan area)


Meanwhile, 11 metropolitan areas fell from the top 50 in 1950. All were in the Northeast or Midwest, except for Knoxville, TN. Youngstown has been beset by economic difficulties throughout most of the period. In 1950, Youngstown was the nation’s 30th largest metropolitan area, larger than Atlanta, Phoenix and Las Vegas. However, Youngstown added only seven percent to its population over the 60 years, and fell to 93rd place. Wheeling-Steubenville (WV-OH) is one of the nation’s few genuine “shrinking cities,” that is a metropolitan area or an urban area that is losing population. Wheeling-Steubenville was ranked 48th in 1950. Since that time, the economic influence of Wheeling has deteriorated so much that OMB has split the metropolitan area into two parts, removing Weirton, WV (which includes Steubenville, OH). The Wheeling metropolitan area is approximately 60 percent smaller than in 1950 (Table 2).


Table 2
Metropolitan Areas No Longer in Top 50
PopulationRank
 19502010Change19502010
Youngstown, OH-PA  528,498   565,773 7%3093
Albany, NY  514,490   870,718 69%3160
Dayton, OH  457,333   799,232 75%3770
Allentown, PA  437,824   821,173 88%3967
Akron, OH  410,022   703,205 72%4074
Springfield, MA  407,255   621,570 53%4283
Toledo, OH  395,551   610,001 54%4386
Wilkes-Barre, PA  392,241   563,630 44%4495
Omaha, NE-IA  368,395   868,116 136%4561
Wheeling, WV-OH  354,092   147,950 -58%48273
Syracuse, NY  341,719   662,578 94%4979
Knoxville, TN  337,105   837,571 148%5064


Cities: From Monocentric to Polycentric to Edgeless

The changes that occurred in cities of the United States and elsewhere around the world have extended well beyond the population increases. The former monocentric model of the city, organized around a dense core has been recent placed by the polycentric city (with the new suburban employment centers documented by Joel Garreau as “edge cities”). In its revisions of the metropolitan area criteria for the 2000 census (Note 2), the Office of Management and Budget began defining core (as used in the encompassing metropolitan area term “Core Based Statistical Area”) as the urban area (urbanized area), rather than the former “central cities.” OMB has designated many suburban employment centers as "principal cities," and in consequence no longer has any suburban designation.

Robert Lang of the University of Nevada Las Vegas has shown that the evolution of metropolitan areas has been extending beyond the “edge cities” and has heralded the “edgeless city.” The dispersion continues.

Wendell Cox is a Visiting Professor, Conservatoire National des Arts et Metiers, Paris and the author of “War on the Dream: How Anti-Sprawl Policy Threatens the Quality of Life.

----------------

Note 1: Some of the metropolitan growth occurred as residents in counties that were not metropolitan in 1950 were added to metropolitan areas as their borders were defined outward. The current boundaries of the major metropolitan areas would have increased their 1950 population by 17 percent.

Note 2: The OMB final notice for 2010 defines “core” as “A densely settled concentration of population, comprising either an urbanized area (of 50,000 or more population) or an urban cluster (of 10,000 to 49,999 population) delineated by the Census Bureau, around which a Core Based Statistical Area is delineated. According to the OMB definition, the core is now an entire urban area, not a central city. The “building blocks” of urban areas are census blocks (smaller than census tracts), rather than municipalities, as had been the case before 2000.

Photo: Crystal City Employment Center: Virginia suburbs of Washington (by author)


Singapore Needs A New Sling

$
0
0

Over the past half century, the tiny city-state of Singapore has developed arguably the most successful formula for growth and social uplift on the planet. Like the famous Singapore sling— a tropical cocktail blending gin, grenadine, sweet and sour mix, cherry brandy and club soda — the city’s mandarins created the perfect recipe for rapid economic growth by combining its strategic location and hard-driving, largely Chinese population, with first-class infrastructure, a relentlessly improved local workforce and an opportunistic immigration policy designed to fill gaps in the labor pool.

These policies turned what could have become just another steamy, racially divided, corrupt and crime-ridden Third World metropolis into a modern-day Venice with a stunning skyline, a per capita GDP higher than the U.S. and EU, and one of the world’s best-educated and disciplined workforces. It is a burgeoning financial center that in a recent survey, ranked fourth on the planet ahead of such self-important  places as Tokyo, Chicago and Toronto. It stands fifth in the amount of assets managed by institutional investors, ahead of much larger countriessuch as Japan, Great Britain and Brazil.

Yet as Singapore approaches its 50th year of independence in 2015, the strategy that worked so well, so long, may have reached its expiration date. In the place of a once swaggering self-assurance, many Singaporeans have turned decidedly negative. In a 2011 Gallup survey, the percentage of city residents who things would be worse in five years was among the highest in the world, along with such more understandable countries as Greece, Italy, Syria and Spain.

Some ascribe these attitudes to traditional Chinese fatalism — particularly among those living in the diaspora — but China itself was not high on the pessimist list, and, for the most part, as Pew suggests, Asian immigrants to the United States, an increasingly Chinese-dominated group, are actually more optimistic about the future than most Americans.

Economics may be part of the explanation behind this growing negativity. GDP growth continues to chug along at 5% per annum — something the U.S. and the EU would die for — but real wages for ordinary Singaporeans have stagnated.  From 1998 to 2008, the income of the bottom 20% of households dropped an average of 2.7% while the salaries of the richest 20% rose by more than half. Real median income for the middle class rose 11% from 2001 to 2010.

By contrast, between the 1970s and 2000, incomes doubled or better every decade.

The growing income equality is particularly troubling  in a country that under the brilliant leadership of legendary Prime Minister Lee Kuan Yew and his People’s Action Party, combined a meritocratic mentality with a powerful commitment to social democracy.

To be sure, Singaporean living standards remain very high by Asian standards, even for those toward the bottom of the social order. Largely through the efforts of the state-owned Housing Development Board the vast majority of Singaporeans live in clean apartments, spacious by Asian urban standards, which they also own.

Yet structural changes in the economy, notably the growth of financial services, could accelerate the growth of inequality. Financial centers tend to have vast disparities in wealth (see New York and London). This gap may be furthered by the rising importance of tourism, where the city ranks fifth in the world behind New York, London, Paris and Bangkok. Add to this gaming— the city is about to pass Las Vegas — and you see a rise of both high-rollers and lower paid hospitality jobs.

Then there’s city-state’s paramount problem: its plunging fertility. Three decades ago Lee and his PAP were rightly concerned about the city’s overpopulation. Now the big problem is a rock-bottom low birthrate — with a fertility rate under 1.2 – barely  half that necessary to replace the current population, which threatens to turn this ultra-dynamic city state into a giant old-age home.

The reasons for this plunge, according to demographer Gavin Jones at the National University of Singapore, lie largely in such things as long working hours and ever-rising housing costs, something that has been boosted by foreign purchases of private residences. With large apartments increasingly expensive, Singaporeans, particularly those with children, often think of emigrating to less expensive or at least roomier places such as the United States, Australia and New Zealand. One recent survey estimated that over half of Singaporeans want to migrate; the World Bank estimates upward of 300,000 Singaporeans have moved abroad, accounting for almost one in 10 citizens.

This emigration is taking place just as Singapore has turned increasingly to foreign workers to keep the economy humming, ranging from the relatively unskilled from neighboring countries and South Asia to some of the world’s most talented academic, technical and financial experts. Since 1970 the percentage of Singaporean citizens among the residential population has dropped from 90% to barely 63% today.

The growing immigrant presence has sparked some unease among Singaporeans. Some fear their city is evolving into what is sometimes called a “Hotel Singapore,” dominated by globalized culture, with its predictable glitzy panoply of shops, iconic structures and global restaurant brands. This reflects pressure in cities to conform to what the Dutch architect Rem Koolhass calls“a larger and seemingly universal style” whose impact on local culture he compares to “the disappearance of a spoken language.”

Fears of untrammeled globalization have been stoked by a recent government report, “A Sustainable Population for a Dynamic Singapore,” that suggested, in the name of global competiveness, that Singapore’s population expand to 7 million from its current five by 2030. Many natives saw this proposal, which relies heavily on immigrants, as a direct threat to their quality of life and job prospects . With 5.3 million people crammed onto an island of only 714.3 square kilometers, occasional  flooding and train breakdowns, it is unsurprising that many feel the city-state is already crowded enough.

These factors are sparking, for the first time in decades, something approaching political conflict. In 2011, the opposition won six seats in Parliament, the most since independence in 1965. The ruling party’s share of the vote dropped from 75% in 2001 to barely 60%.

Most Singaporeans admire the accomplishments of the PAP, and the generally successful outcomes of its policies , but clearly there is a desire for a change of direction. How Singapore addresses these problems is important not just for the city-state, or even Asia, but the entire world. The Singaporean model remains an inspiration to city-builders , and how it meets its contemporary challenges could prove critical in an age where the majority of people live in urban areas.

The first step for Singapore’s reinvention lies with recognizing the seriousness of its challenges. The policies of the past may have worked impressively, but may not be as appropriate in the future. As my old Japanese sensei Jiro Tokuyama once noted: the hardest thing to do is how to unlearn the secrets of your past success. The ingredients in the cocktail that is Singapore need to be tweaked for a new era.

Fortunately, Singapore enjoys the social cohesion, the human capital, and capable leadership to make the necessary changes. One key element relates to focusing on how to nurture families once again, and to recapture that sense of Singaporean-ness that makes the place so special. It is not so much a matter of financial incentives — these have not worked — as in controlling housing costs, expanding space for families,  and most importantly, finding better ways to balance life and work.

Already some initial steps to humanize the metropolis are taking place. These include a remarkable expansion and improvement of green space, and attempts to decentralize work around the newer state housing estates and commercial developments. Steps to increase the size of apartments, repurpose aging shopping and office structure for housing as well as encouraging more home-based work could also prove helpful. These changes will be critical if the world’s most successful city wants to remain so in the decades ahead.

Joel Kotkin is executive editor of NewGeography.com and Distinguished Presidential Fellow in Urban Futures at Chapman University, and a member of the editorial board of the Orange County Register. He is author of The City: A Global History and The Next Hundred Million: America in 2050. His most recent study, The Rise of Postfamilialism, has been widely discussed and distributed internationally. He lives in Los Angeles, CA.

This piece originally appeared at Forbes.

Singapore skyline photo by Bigstockphoto.com.

XpressWest Las Vegas Train: Where are the Venture Capitalists?

$
0
0

Recently, the US Department of Transportation indefinitely suspended a federal loan application for the XpressWest high-speed rail train from Victorville California to Las Vegas. The only public rationale for the decision was contained in a letter from former Secretary of Transportation Ray LaHood, who cited “buy-America provisions.” Important contents of the letter were not made public (presumably to protect confidential commercial information), but Secretary LaHood indicated that “serious issues” and “significant uncertainties” surrounding the project forced him to suspend “further consideration” of the loan request.

US Senate Majority Leader Harry Reid of Nevada hopes to resurrect the loan application. However even he is reported to have noted that the White House is “worried about XpressWest obtaining the remaining $1.5-billion in private financing needed to get the train running.”

That's just the beginning of the private investment concern. Current reports indicate that the Victorville to Las Vegas line will cost $7 billion to construct, $5.5 billion of which would be provided through a low interest 35 year loan from federal taxpayers, the initial payment on which would be deferred for six years.

Based upon the experience of high-speed rail programs around the world, it seems virtually inevitable that the Victorville to lost Vegas high-speed rail line would cost much more than $7 billion. All of those additional funds would be the responsibility of private investors, not federal taxpayers.

International Record of Cost Escalation

The problem is amply illustrated by   European research on world infrastructure costs.  Oxford professor Bent Flyvbjerg, along with Nils Bruzelius (a Swedish transport consultant) and Werner Rottenberg (University of Karlsruhe and former president of the prestigious World Conference on Transport Research) reviewed 80 years of infrastructure projects and found initial cost estimates to routinely be low (Megaprojects and Risk: An Anatomy of Ambition). They estimated that rail project costs escalation an average 40 percent and that 80 percent cost overruns are not unusual in passenger only rail (Note 1).

If the Victorville to Los Angeles high-speed rail train would escalate in costs at the average indicated by the research, the cost would rise to $9.8 billion, increasing the private investment share required from $1.5 billion to $4.3 billion. If the cost escalation were to be at the 80% level, the Victorville to Los Angeles high-speed rail train would cost $12.6 billion to build, raising the private investment requirement to $7.1 billion.

Britain’s Escalating Costs

The British, who continue to debate building a high speed rail line from London to just north of Birmingham already seen costs rise by nearly 1/3, while experts are predicting the cost will eventually escalate 120 percent or more.

Obviously, cost escalation at these levels would require additional private capital.

Nearby California’s Unprecedented High Speed Rail Cost Escalation

The actual experience of the nearby California high-speed rail line indicates that the results could be substantially worse than indicated in the academic research. Before the California High Speed Rail Authority abandoned plans to build a genuine high-speed rail line from Los Angeles to San Francisco, costs approximately tripled from the original estimates (Note 2).

A similar tripling of cost escalation on the Victorville to Las Vegas line would take the cost to $21 billion. This would require private capital of $22.5 billion – 15 times as much money as the current $1.5 billion that is apparently difficult to raise.

Serious Issues and Significant Uncertainties

Meanwhile, editorialists are raising “serious issues” and “significant uncertainties” about the project.

The Washington Post: The editorial board of the Washington Post said in a July 18 editorial (entitled “Good riddance to XpressWest, the high-speed boondoogle”) of the XpressWest project: “We’ve seen some bad policy ideas but not many more awful …” The Post continued “What XpressWest struggled to explain was why taxpayers should bet on a proposition that private investors apparently found too risky: hordes of travelers driving to Victorville, parking their cars and then boarding the train for an 80-minute ride to Vegas — as opposed to driving the whole way, flying or taking “My Party Ride,” a limo-like bus trip for up to 30 passengers at $99 each, including food and drinks.” The Post expressed relief that “common sense has prevailed,” though bemoaned the fact that “multiple federal and state agencies had given environmental and regulatory approvals.”

Las Vegas Review-Journal: The hometown metropolitan daily expressed similar concerns. In a July 18 editorial, the Review-Journal said: “Like most recent rail projects, XpressWest ridership projections were overly optimistic. The train certainly appeared capable of meeting its operational costs, but the idea that it could make good on repaying $5.5 billion in debt on top of that was a stretch. Las Vegas Monorail, anyone?” (Note 3).

The editorial continued: “The prospect of default on a train loan is too much to ask from a federal government already $17 trillion in debt,” adding, if the federal government “ is serious about “investing” those billions, spend them on improvements to the nation’s interstate system, which carries both passenger and commercial traffic and is in constant use, 24-7. Interstate 15, which runs between Los Angeles and Las Vegas and is heavily congested, could use the money. So could the planned Interstate 11 between Las Vegas and Phoenix.”

In addition, echoing my, “taxpayer risk assessment,” published by the Reason Foundation, had shown that the cost of expanding Interstate 15 to six lanes between Victorville and the California border would have been a fraction of the high speed rail costs, and would have been largely paid by highway user fees paid by drivers and truckers, and would reduce both traffic congestion, greenhouse gas emissions and energy consumption.

The editorial concluded: “Improved interstates would speed commerce, create permanent jobs and have billions upon billions of dollars in long-term economic impact across many states. That would be a return on investment. A tourist train on a high-speed trip to bankruptcy? No so much.”

Where are the Venture Capitalists?

There is no shortage of venture capital in the United States.The apparently difficulty being encountered in raising sufficient private capital for the project demonstrates that it is even more risky than the standard venture capital projects. The risks for private investors are huge at the $1.5 billion. The risks are even greater at double that number, which has to be considered among the more optimistic potential outcomes.

Wendell Cox is a Visiting Professor, Conservatoire National des Arts et Metiers, Paris and the author of “War on the Dream: How Anti-Sprawl Policy Threatens the Quality of Life.

------

Note 1: Flyvbjerg et al reviewed 80 years of infrastructure projects found consistent low-balling of cost estimates. They characterize the process as "strategic misrepresentation," which they shorten to "lying," in unusually frank language.

Note 2: In response to the public outcry, the California High Speed Rail Authority substituted a somewhat less expensive plan that requires high-speed rail to mix with conventional commuter rail trains in San Francisco and Los Angeles operations.

Note 3: The Las Vegas Monorail was similarly promoted as sufficiently viable to pay its operating and capital costs in the early 2000s. My 2000 analysis projected that ridership would be well below forecast and that the Las Vegas Monorail would eventually default on its debt. That occurred.

What Detroit’s Bankruptcy Teaches America

$
0
0

As has long been expected, the city of Detroit has officially filed for bankruptcy.  While many will point to the sui generis nature of the city as a one-industry town with extreme racial polarization and other unique problems, Detroit’s bankruptcy in fact offers several lessons for other states and municipalities across America.

The Day of Reckoning Can Take Much Longer Than We Think to Come

What’s most surprising about Detroit’s bankruptcy is not that it happened, but how long it took to get there. In authorizing the bankruptcy filing Gov. Rick Snyder talked about “60 years of decline.” He’s not joking. It’s been widely known that Detroit has been in trouble for a very long time.

Time Magazine ran a 1961 story called “Decline in Detroit.”  Jane Jacobs described its lack of vitality in her 1961 classic “The Death and Life of Great American Cities”:

Researchers hunting the secrets of the social structure in a dull-gray district of Detroit came to the unexpected conclusion there was no social structure….Virtually all of Detroit is as weak on vitality and diversity as the Bronx. It is ring superimposed upon ring of gray belts. Even Detroit's downtown itself cannot produce a respectable amount of diversity. It is dispirited and dull, and almost deserted by seven o'clock of an evening….Detroit today is composed of seemingly endless miles of low density failure.

Moving from urban planning to economics. She wrote in 1969’s “The Economy of Cities”:

This was the prosperous and diversifying economy from which the automobile industry emerged two decades later to produce the last of the important Detroit exports and, as it turned out, to bring the city’s economic development to a dead end.

These are both well known, but the record of troubles in Detroit even predates this, going back at least to Life Magazine’s 1942 article “Detroit Is Dynamite” which gave a prescient warning to the city just a year before 1943’s race riot.

For a city as uniquely troubled as Detroit to remain in serious decline for such an extended period of time before going bankrupt is a testament to the sheer resilience of cities. It also suggests that those predicting eminent doom for their own city unless it changes its ways are likely to end up as false prophets.

Indeed, Detroit’s day of reckoning may not even yet be fully given that various challenges to the bankruptcy filing are expected. The fact that Detroit has limped along for so long suggests that cities may be able to survive nearly definitely as “zombie municipalities” similar to zombie banks. Though this may possibly end a Greek style crisis at some point, a very lengthy existence as the undead would seem to be possible.

Decline Poisons Civic Culture and Sunders the Commonwealth

Detroit also illustrates that once decline starts it sets in motion a toxic civic dynamic that makes the tough choices needed to turn things around nearly impossible. Just as growth begets growth, decline begets decline, and part of the reason is social dynamics.

This comes about because in a city in decline – such as in late imperial Rome –people start thinking only about themselves and no longer come to see themselves as part of a greater enterprise or commonwealth. The city and suburbs, blacks and whites, taxpayers and unions no longer see their fortunes as linked. Rather than rising and falling together, it’s every man for himself.

When the pie is growing, it’s easy to come to an agreement over how to divide it because everybody can get a bigger slice at the same time. But when the pie is stagnant or shrinking, zero-sum thinking takes over. To make a sacrifice is seen to in effect allow someone else to profit at your expense. Perhaps these dynamics were present latently before, but tough times bring out the real civic character.

In Detroit’s case everyone from public employee unions who refuse to give up any of their benefits (and will no doubt fight to deny the bankruptcy filing) to suburban towns that would rather pretend the city does not exist have played a role in setting the disaster. With nobody willing to sacrifice for the greater good, prisoner’s dilemma logic results happen. You can see this playing out in nearly any troubled American city. By contrast, it seems to be healthier places like Denver that have managed to build stronger regional civic consensus. It’s simply easier in those places.

Instead, Detroit chased conventional wisdom approaches and fad of the month type endeavors ranging from constructing the fortress-like Renaissance Center to the People Mover to former Gov. Jennifer Granholm’s “Cool Cities” program, none of which did anything but generate hype. What they all had in common is a transfusion of subsidies to the city (and taking on debt) rather than building a consensus around addressing the real issues.

America Doesn’t Learn Lessons From the Past

The last thing Detroit teaches us is that America too often doesn’t learn from its mistakes. Detroit’s troubles have been evident for quite some time, yet it’s hard to see that many other post industrial cities have managed to carve out a different path. Rather, they pretended that Detroit’s civic was somehow unique due to its auto industry dependence – and managed to ignore other failed cities as well – while embarking on the same turnaround strategy via conventional wisdom and silver bullets.

They have even managed to ignore failures much closer to home. Booming new suburbs can look just 5-10 miles down the road to see yesterday’s hot spot now turned into a festering mess of dead and dying malls, declining schools, increasing poverty, and falling home prices. Yet most of them are simply replicating the same pattern that is destined to fail financially over the long term in any region without either severe building restrictions or very high population growth.

Sadly, none of these augur favorably for change. Detroit may continue to garner special international attention as a train wreck people can’t stop watching, but less spectacular slow motion civic failures seem likely to remain commonplace unless somebody finds a way to overcome these forces.

Aaron M. Renn is an independent writer on urban affairs and the founder of Telestrian, a data analysis and mapping tool. He writes at The Urbanophile.

Photo by Kate Sumbler.

Detroit, Why Hast Thou Forsaken Me?

$
0
0

Thou wouldst fain destroy the temple! If thou be Jesus, Son of the Father, now from the Cross descend thou, that we behold it and believe on thee when we behold it. If thou art King over Israel, save thyself then!

God, My Father, why has thou forsaken me? All those who were my friends, all have now forsaken me. And he that hate me do now prevail against me, and he whom I cherished, he hath betrayed me.

Lyric excerpts from the Fifth and Fourth and Words, respectively, of the Seven Last Words of Christ orchestral work by Joseph Haydn.

I’m pissed.

Ever since the announcement late Thursday that the City of Detroit was indeed going to file for Chapter 9 municipal bankruptcy protection, the Internet has been overflowing with commentary on the matter. The commentary has come from all places and taken on by all comers – from the political left and right; from hard news and general interest sources. And all usually with the same scripted and lazy tripe about how Detroit reached its nadir:

  • Single-minded dependence on a collapsing auto industry doomed Detroit.
  • An inability to diversify economically doomed Detroit.
  • Public mismanagement and political corruption doomed Detroit.
  • An inability to effectively deal with its racial matters doomed Detroit.
  • The dramatic and total loss of its tax base doomed Detroit.

That’s it, people, they seem to reason. The Motor City’s fall from grace is as simple as that. You do the things Detroit did, and you get what Detroit got. You defer decisions just as Detroit did, and you too will suffer the consequences. The speed with which the various articles on Detroit came out proved to me that many writers anticipated the announcement with at least a twinge of glee.

As I’ve written before, Detroit’s narrative serves everyone else as the nation's whipping boy, and that came through in the last couple of days:

You can find Detroit in Cleveland, St. Louis, Buffalo, Milwaukee, Baltimore and Philadelphia. You can find it in Indianapolis, Minneapolis, Cincinnati, Columbus and Louisville. You can find it in Atlanta, Miami, Houston, Dallas and Phoenix. You can even find it in Las Vegas, Seattle, San Francisco and Portland. And yes, you can definitely find it in New York, Chicago, Los Angeles and Washington, DC. You can find elements of the Detroit Dystopia Meme™ in every major city in the country. Yet Detroit is the only one that owns it and shoulders the burden for all of them.

But let’s leave that aside. I’m pissed because no one seems to acknowledge the central reason Detroit is filing for bankruptcy now. It has endured abandonment – white flight abandonment – on an absolutely epic scale. Before there was auto industry collapse, before there was a lack of economic diversity, before there was mismanagement and corruption, there was abandonment. People skirt and dance around the issue when they talk about the loss of Detroit’s tax base. What Detroit lost was its white people. The chart above illustrates how Detroit’s unique experience when compared to similar cities.

Detroit is what happens when the city is abandoned. And frankly, there is a part of me that views those that abandoned Detroit with the same anger reserved for hit-and-run drivers – they were the cause of the accident, they left the scene of the crime, and they left behind others to clean up the mess and deal with the pain. What’s worse, so many observers seem to want to implicate those left behind – in Detroit’s case a large African-American majority community – for not cleaning up the mess or easing the pain. Their inflicted pain which they’ve made ours.

White abandonment of Detroit did not start with the 1973 election of Coleman Young as mayor, or even the 1967 riots, yet those two events accelerated the process. And indeed, Detroit had a very unique set of circumstances that caused it to veer down a troubled path. The very first piece featured in my blog was about the land use and governing decisions that were made more than one hundred years ago in Detroit that literally set the city’s decline in stone. I identified eight key factors:

  • Poor neighborhood identification, or more broadly a poorly developed civic consciousness.
  • A housing stock of poor quality, cheap and disposable, particularly outside of the city’s traditional core.
  • A poorly developed and maintained public realm.
  • A downtown that was allowed to become weak.
  • Freeway expansion.
  • Lack of or loss of a viable transit network.
  • A local government organization type that lacked accountability at the resident/customer level.
  • An industrial landscape that was allowed to constrain the city’s core.

Conor Friedersdorf of the Atlantic wrote perhaps one of the best recent articles I saw on Detroit when he acknowledged that even a half-century ago, journalists were predicting a dire future for the D. Take this quote Conor found from The Reporter, published October 31, 1957:

The auto industry created modern Detroit simply as its dormitory and workshop, attracted polyglot millions to it, used it, and now threatens to abandon it. Civic consciousness played little part in the lives of the masses of Irish, German, Poles and Italians who flocked to Detroit in search of a Ford or Dodge or Packard pay check, and who settled there in islands of their own – any more than it played a part in the managements of Ford or Dodge or Packard themselves, or in the crowd of Negroes who also descended upon the city during the boom years of the Second World War… Indeed, it is remarkable that any sense of civic responsibility at all should have been generated in so rootless and transient a community.

What can a city do when it finds its patron industry and its middle class moving out, leaving it a relic of extremes?... But urban deterioration offers at least one advantage. Once a city core has become as run-down as Detroit’s you can start to rebuild fairly cheaply.

Yes, that is from 1957.

The chart at the top of this article was done for an article I did more than a year ago, looking at U.S. Census data for several peer cities over the last seven decennial censuses. In it, I concluded that Detroit’s experience of abandonment was entirely unique:

Between 1950 and 1970, the decline in Detroit’s white population was on the low end of the spectrum of cities on this list, but it was in the ballpark. Prior to 1970, Detroit and St. Louis were the white flight laggards. After 1970, the bottom fell out and Detroit stood alone. While there certainly are economic reasons white residents may have had for moving, this graph may lend credence to the twin theories of Motor City white flight – the 1967 riots and the 1973 election of Mayor Coleman Young.

I’m not trying to persuade anyone of the invalidity of their decision to move from Detroit. There were good reasons and not so good reasons. I’m only trying to describe its impact relative to other cities. And where exactly are those white residents who left over the last 60 years? Certainly many have passed on. Some are currently in the Detroit suburbs or elsewhere in Michigan. Some are part of that great Detroit Diaspora that took them to New York, Washington, Charlotte, Atlanta, Houston, Phoenix, Los Angeles, Seattle and Portland. There are clearly at least 1.5 million reasons why white residents left Detroit.

But the fact is, had Detroit experienced white flight at the same combined rate as the other cities on this list, and not experienced any other changes, there would be nearly 350,000 more white residents today. Maybe 140,000 more households. Maybe more stable neighborhoods.

Can you imagine that? An additional 350,000 residents means Detroit would still be a city with more than one million people. It would likely be viewed in the same way that a Philadelphia or Baltimore is now – challenged but recovering – instead of the urban dystopia it’s widely seen as today. What impact would that have had on the city’s economy? On the metro area’s economy? On the state’s economy? Or simply the city’s national perception?

I’ve mentioned here on several occasions that the reason I chose the planning profession is because I grew up in Detroit during the 1970s. I looked around and saw a city with an inferiority complex and saw people leaving in droves. My naïve and childish thinking was, “instead of leaving the city, why don’t people stay and work to make it better?”

Silly of me. Abandonment is the American way.

Nonetheless, I view Detroit’s bankruptcy announcement positively. It acknowledges that its troubles are far deeper than most realize. It can be the springboard for fiscal recovery, a re-imagining of the city and an actual and complete revitalization. Detroit indeed is in uncharted waters, and its abandonment means that in many respects it could be viewed as a frontier city once again. I would not be surprised if, after restructuring and reorganization, after recapturing its innovative spirit, the city could see growth almost like it did at the beginning of the twentieth century, mimicking what, say, Las Vegas has done for the last 40 years. Even at this dark moment, Detroit has assets that are the envy of other cities.

But let no one forget that it is abandonment that brought Detroit to this point.

This piece originally appeared at The Corner Side Yard.

Pete Saunders is a Detroit native who has worked as a public and private sector urban planner in the Chicago area for more than twenty years.  He is also the author of "The Corner Side Yard," an urban planning blog that focuses on the redevelopment and revitalization of Rust Belt cities.

Why Trayvon Martin Defines Sanford, Florida

$
0
0

For other rural cities in America, Sanford, Florida, home of the George Zimmerman trial, is useful as a cautionary tale: Define yourself now, before an incident like the shooting of Trayvon Martin defines you.

All of Florida is once again in an uncomfortable position, this time with the Zimmerman verdict. The state has by now earned a solid last-place position in its contribution to America’s culture. Its poor history was topped by its performance in the 2000 presidential election, but it includes lurid crimes going back well over a century. Most Florida residents quickly change the subject when the conversation gets around to asking what state you’re from, but Floridians must confront the fact – at least at home in the mirror, if not publicly – that we have a lot of hard work to do. Florida’s social ills, including racism, run deep. Its public-relations image as a tropical paradise of sandy beaches belies the real Florida lurking within, and its urban geography reflects a state that has still deep schisms that are not going away between residents.

When Henry Sanford built a railroad town in 1877, calling his place "the gateway to South Florida,” it quickly succeeded as a population magnet, swelling to a size far larger than sleepy Orlando by the turn of the century. Bustling with railroads, citrus, and celery, Sanford was a testbed for Spanish oranges, later sold as the “Valencia” variety. Like many Florida cities, it was home to both a black and a white population, and in 1891 the railroad workers to the west incorporated a new town called Goldsboro. One of the first African American towns in Florida, Goldsboro lasted twenty years until white Sanford petitioned to absorb it. Even a century ago, African-American urban success was a challenge to the status quo that was too much to stand.

Sanford lies on the northernmost edge of Seminole County, north of Orlando, a place named after a tribe whose history is another whole litany of sorrows. Today, it's a place of lakes, wetlands, and green rolling hills, with neighborhoods and commercial strips sandwiched in between — a sort of exurban enclave of Orlando, slightly more affluent than the average Florida household. A historic town, Sanford is a symbolic landmark more than a true city center, and suffers from being a bit too far from Orlando to be considered a realistic commute.

This unfavorable geography helped preserve the town’s distinctive historic architecture, as the forces of growth found more accessible real estate to develop elsewhere around it. Mostly new-ish, mostly white-ish subdivisions and commercial strips carve up the land along north/south corridors: US 441, Interstate 4, and US 17-92. Rural Florida has mostly been banished out of Seminole County by this miasma of growth that rings the north side of metropolitan Orlando.

Sanford preserved its downtown core and much of the surrounding neighborhood as National Historic Districts, keeping a strong sense of place but inhibiting modernization. Downtown, like a stage set waiting for players, hopes in vain for some kind of re-identification. Art galleries, restaurants and antique shops suggest a tourist destination, not a thriving, productive community. Second floor windows loom over Main Street with mostly empty eyes. The waterfront, a few blocks away, is absurdly disconnected from the downtown core. An obligatory six-story stucco condo — naturally almost empty — sits at the point where the city meets Lake Monroe, Sanford’s tribute to the great banking crisis of 2008.

Sanford’s struggle to survive has led to a grim sense of despair among many who gambled on development and continue to wait for the gentrification payoff. With the railroad and agriculture economy mostly gone, its quaint and highly affordable neighborhoods have yet to attract throngs seeking the good life.

So, in 2012, the city began a public campaign to reinvent itself. But the Trayvon Martin/ George Zimmerman case did this instead, tying Sanford to a troubling lack of progress in civil rights and race relations. It has laid bare the most difficult social problem in America, and pointed a fair share of blame squarely at Florida.

What happened in this case may be analyzed for some time to come, but it is not just a Sanford phenomenon. Florida’s geography seems to beget slightly deeper divisions than most other places do.
A have and have-not condition is almost certainly ingrained into the state’s subconscious culture. With over a thousand miles of coastline, half of which is beaches, Florida’s main contribution to the country’s economy is that of waterfront real estate; second homes for the wealthy and retirement communities. The interior is chock full of golf courses and theme parks that reinforce a sense of affluent leisure. This divides, not unites, into servant and served.

For the service workers in Florida, the living conditions are vastly different, with little or no upward mobility. A lack of connectivity between citizens, as well as low taxes, exacerbate problems in the state’s education system. Growth has created a big bottom, as well as a big top, with little investment in between.

Oceanfront condos and houses make good profits for lenders, and the state has gone from a glut to a bubble again. What this boom-bust economy may be doing, however, is helping to redefine Florida as a sort of third-world economy, uncomfortably latched to the underbelly of America. Anyone traveling to leisure destinations in the Caribbean, Asia, or much of South America may recall venturing off the hotel property, only to be immediately struck by a different living standard. Such a difference is striking overseas. Here in the Sunshine State, it's more subtle: a little less emphasis on schools, a little less melting-pot culture, a little more politically regressive… nothing one might notice while here on vacation. But it has been eating away at society’s veneer over time, and the Zimmerman trial has cast a harsh light on the realities in much of Florida.

With its emphasis on tourism and growth, Florida will remain a geography of privilege. For the unprivileged, it is a state of danger that is getting worse all the time. Gun law makes this land of sunshine and warm weather a cold, harsh place if you are not on the golf course, tanning on the sand, or in your beachfront condo.

And for those who want to make this place better? We have a lot of very hard work ahead if we are going to rebuild a state of compassion and shared ownership out of the ashes of our contemporary culture.

Richard Reep is an architect and artist who lives in Winter Park, Florida. His practice has centered around hospitality-driven mixed use, and he has contributed in various capacities to urban mixed-use projects, both nationally and internationally, for the last 25 years.

Photo by Christine Wood

Is the “Rust Belt” a Dirty Word?

$
0
0

Many people hate the term “Rust Belt”. They dislike the aesthetics of the Rust Belt. For others, the term is less loaded, but rather a moniker denoting who we are. Consider me in the latter camp. But I often cross paths with those who loathe the term, or more exactly any notion of there being a Rust Belt culture.

For instance, I recently ran into a top official for the City of Cleveland. We shook hands, discussed backgrounds, before the individual put a name to a book I co-edited called Rust Belt Chic: A Cleveland Anthology, which is a collection of stories detailing what it means to be a Clevelander, a Rust Belter. The official let on she didn’t care for the term “Rust Belt”, and in fact found the idea of celebrating a Rust Belt culture backwards and distasteful. I told the official there was a new generation taking ownership of having grown up in a post-industrial reality, and that make no apologies for it. The official insinuated those people are not in positions of power, so what does it matter. I responded in ten years many will be, and so it matters a lot.

Anyway, the conversation stayed with me for a few weeks, if only because it was a living, breathing example of what needs to go in Cleveland, if not the whole of the Rust Belt; namely, shame and false pride. Both characteristics go together. Said philosopher Lao Tzu:

Pride attaches undue importance to the superiority of one’s status in the eyes of others; And shame is fear of humiliation at one’s inferior status in the estimation of others. When one sets his heart on being highly esteemed, and achieves such rating, then he is automatically involved in fear of losing his status.

Shame. It’s pretty thick in these parts, and it’s linked to the region’s nickname, “The Rust Belt”. After all, rust connotes disuse, or of being left behind. Yet we are only shameful because the region did have status. We were a proud region once, as our forefathers and foremothers built this country. They protected this country. They enabled the defeat of Hitler. No hyperbole on that last part.

Specifically, before being the “Rust Belt” the region was the “Arsenal of Democracy”, which was a term coined by Detroiter Bill Knudsen in his conversation with a weary and worried President Roosevelt on the eve of WWII. At the time of the talk, May 28th, 1940, America had the 18th largest army in the world, and so what FDR needed from Knudsen was reassurance Detroit’s industrial infrastructure could produce weapons at a pace unimaginable. Knudsen replied Detroit’s manufacturing might could transform into the country’s “Arsenal of Democracy”, with term eventually gaining traction in an FDR fireside chat dated December 29, 1940. In it, the President states:

We must be the great arsenal of democracy. For us this is an emergency as serious as war itself. We must apply ourselves to our task with the same resolution, the same sense of urgency, the same spirit of patriotism and sacrifice as we would show were we at war.

Obviously, the area succeeded, with Pittsburgh having produced one-fifth of the Allied forces steel from 1940 to 1945 alone.


Courtesy of Seeking Michigan

Needless to say, the region has had a lot to be proud of. But then macroeconomic forces took hold. Things globalized, and thus the way we lived and the things we did became obsolete. Shit happened. Shit is still happening. Yet part of the reason this is so is because we cannot let go. Being proud turned into stubborn pride, particularly for the region’s leadership who is hanging on to the illusion that yesterday will happen as long as we adhere to the same thought processes and power structures that held tow during the region’s heyday. But then yesterday doesn’t happen. Year after year it doesn’t happen. The pride becomes desperation. The pride becomes false. Said William Blake:

Shame is pride’s cloak.

And so with the collective shame comes collective temptation and desperation. Casinos will save the cities. Convention centers will save the cities. If only the cities will beautify enough. If only we had an outdoor chandelier. Or a suburban-type downtown mall. Or a tech district. Or a critical mass of microbreweries and boutiques. Or whatever anyone else doing. Anyone else, but us.

Meanwhile, such city transformations erode the region’s true competitive advantage, which is who we are, and the various potentials inherent in our ability to persevere, i.e., our “learned resilience”. Writes Erie, PA native and economic development blogger Jim Russell:

What I mean is seeing opportunity hiding in a community struggling with survival. There’s just something about Youngstown that stirs passion in me. I’m not gawking at ruin porn or glossing over everything that is wrong. I love Rust Belt cities. I love Rust Belt culture. I’m proud to be from the Rust Belt. That’s what Rust Belt Chic now means to me. It’s personal. It’s who I am. For Pittsburgh, I could sense the tide turning. I see the same transformation taking place in other Rust Belt cities. A pejorative, Rust Belt-ness is an asset. It’s a starting point for moving forward, not a finish line or a civic booster campaign.

There is indeed a growing movement of Rust Belt pride taking hold. Yet it is not a false pride, rather a pride that’s derived from an acceptance of having become rust. Such can be immeasurable for the psychogeography of the region. After all, says William James,

Acceptance of what has happened is the first step to overcoming the consequences of any misfortune.

Richey Piiparinen is a writer and policy researcher based in Cleveland. He is co-editor of Rust Belt Chic: The Cleveland Anthology. Read more from him at his blog and at Rust Belt Chic.

High Confidence Not Translating to High Math Scores for American and European Students

$
0
0

Swedish fourth graders are leading the world in mathematics, followed closely by those in other developed European nations, at least if we look at students’ reported self-confidence in the subject. Fully 77% of Swedish students at fourth grade express a high level of confidence about their learning, compared to merely 5% who express a low level. In Austria, Germany, Denmark, and Norway seven out of ten students have high confidence about their mathematics knowledge. One in ten or fewer have low confidence. Self-confidence is somewhat less common amongst US fourth graders, where 67% believe that they perform highly in mathematics and 10% express the opposite view. Unfortunately, this confidence – in America and elsewhere – is not backed up by high achievement.

As shown by the Trends in International Mathematics and Science Study, the average US student with high confidence only scored 551 on the test. This is just half a standard deviation from the average score of 500. The phenomenon where many students believe that they are doing well in mathematics – while they are in fact lagging behind other nations – is even more evident in several European nations. In Sweden the average score of the self-identified high achievers is only 514. The sureness of Swedish students seems to rise from a progressive school system. As more focus is put on promoting self-expression and raising self-esteem than on actual knowledge gathering and hard work, students with only slightly higher international scores identify themselves as being high achievers.

When competing in the global marketplace, or applying for top universities, the self-identified high-achievers of Europe and the US are challenged by students from places such as Hong Kong and Singapore – where the school systems focus more on actual achievements and thrift. In Hong Kong and Singapore 46% of fourth graders identify themselves as high achievers. On average they score impressively 634 and 639 respectively on the international math test. Even the students who have a low self-confidence in Singapore score 544 on the international test. This is considerably higher than the values reached by those believing themselves to be high-achievers in Sweden and close to that of the same group in the US.

Hong Kong’s self-identified low-achievers score on average 574. The students who believe themselves to have low math skills in Hong Kong thus outperform those who believe themselves to have high skills in the US. In an increasingly knowledge intensive society, policy leaders should ask themselves what this western complacency does with the urge to learn more?

We should of course never blame the students, who simply react to the school system and the overall society created by their adults. It is the societies that are created by the adults who should consider changing. Encouraging high confidence in general is of course a good thing. But why not focus more on actually teaching out than focusing on self-esteem regardless of achievement?  

Norway is Perhaps the most interesting nation in terms of the gap between self-perception and reality. This may in part due to the country’s oil wealth that has allowed it to remain the only European country yet to challenge a traditional social democratic model. In Norway, public handouts can be as generous as work income.

Not surprisingly, the previously strong Nordic working ethic of the country seems to have plummeted while student perceptions of their own knowledge have strongly inflated. Fully 69% of Norwegian students have a high confidence regarding their math scores. On average this groups scores only 490 on the international test – below the international average.

In the same study, standardized tests are also given to eighth graders. Again, the average global score is set to 500. We can see that as students grow up, their perceptions somewhat adapt to reality. Only 49% of eighth graders in Sweden have high confidence, scoring on average 528. Half of Norway’s eight graders share the same optimistic view, scoring slightly above the average global values (505). In the United States, 53% of students have high confidence regarding their mathematic learning, with an average score of 537. Hong Kong and Singapore   students also face a reality check. Only 30% of the eight graders in the former country and 41% in the latter country have high confidence relating to their math knowledge. However, even the eighth graders with low confidence in these two countries do better on average than those with high confidence in the US and many rich European nations.

To be sure, mathematic scores are far from the only metrics of educational success. Mathematics is however interesting since it is a vital tool for logical reasoning and since skills in this subject can be readily compared amongst students from different cultures. Mathematics scores are deemed to be so important since they give a good expression of how much knowledge and analytical ability students in different nations have.

The progressive elements in the school systems in Norway, Sweden and the US seem to foster inflated views about mathematic knowledge that is not backed up by actual knowledge. I am sure there is much good to say about the softer school systems in these countries compared to more knowledge-focused school systems in for example South East Asia. Studying in a soft school system, after all, leads to less stress.

But at the same time, life is not always soft. The adults have a responsibility to create a system where as many students as possible are given good opportunities to further their knowledge, working-ethics and analytical ability. Without this human capital, many will face difficulties in the real world. Perhaps the school systems in rich European countries and the US could empower their students in the long-term by teaching the necessary knowledge, and making their students aware of their performance-gap in a global competition.

Dr. Nima Sanandaji is a Swedish author of Kurdish-Iranian origin. He has written numerous books and reports about issues such as entrepreneurship, women's career opportunities, integration, and welfare.

School bus photo by BigStockPhoto.com.


Manufacturing in Los Angeles: A Test Case in Why Increasing Concentration Isn’t Always a Positive

$
0
0

What comes to mind when you think of Los Angeles’ big industries? Motion pictures and other entertainment sectors, yes. Real estate and corporate headquarters, too. But probably not manufacturing.

No other sector, however, contributes more to the Los Angeles metro area’s gross regional product – the final market value of all goods and services in a region – than manufacturing. It accounted for 11% of L.A.’s GRP in 2012, narrowly beating out the real estate and rental and leasing sector (10%).

Manufacturing is also the fourth-largest major industry sector in Los Angeles by employment, with nearly 535,000 jobs. But the manufacturing labor market has taken a beating in L.A. — and the downward spiral began years before the Great Recession. In 2001, in fact, manufacturing was the largest sector in L.A., accounting for more than 800,000 jobs, many of which were centered in two sub-industries: computer/electronic products and apparel.

The Apparel Manufacturing Story

Apparel manufacturing is a particularly interesting case study for L.A. manufacturing as a whole. Nearly 10% of all manufacturing jobs in the Los Angeles metro — a little over 52,000 —  are in this subsector. And 40% of workers in apparel manufacturing are sewing machine operators whose overall median earnings in L.A. are $9.48 per hour.

ApparelMfg

Jobs in apparel manufacturing have declined 43% in Los Angeles since 2001, a reduction of some 40,000 jobs. But nationally, the industry has fared worse; it’s lost 63% of its workforce since 2001. This explains why the concentration of apparel manufacturing jobs in L.A., as measured by location quotient, is actually increasing, despite the heavy local cutbacks.

ApparelMfg2L.A. has 7.8 times the national average of these jobs, after having 4.9 times the national average in 2001. Looking at it another way, a third of all apparel manufacturing jobs in America are in the Los Angeles metro (and 89% of these jobs in California are in L.A.).

Why has L.A.’s concentration increased so much? Because location quotient compares the industry’s share of regional employment with its share of national employment. In this case, apparel manufacturing is dwindling as a share of all jobs nationally and in L.A. But the rate of decline hasn’t been as sharp in Los Angeles as it has been in the nation.

In many cases, a high concentration like apparel manufacturing’s in L.A. signals that it’s a key local industry. And to be sure, apparel manufacturing still has a large presence and helps bring money into the region. Further, there are sub-industries inside apparel manufacturing that are adding jobs. But this is an example of why increasing concentration isn’t always a positive.

Many firms have moved apparel manufacturing operations overseas, and the jobs that have remained in the U.S. are mostly unappealing: low-wage, low-skill, with little career potential. In L.A., the average earnings per job in apparel manufacturing is $44,859 — a figure that includes workers at all levels, from management to the production floor. That annual salary is only slightly higher than the national average ($43,947).

Compare the above numbers to industries with increasing employment and increasingconcentration. The following are some of the real emerging industries in L.A., and most pay well, too:

  • Other scientific and technical consulting services, a professional services industry that has doubled in concentration since 2001 and added the third-most jobs of any detailed industry in L.A. over that time. This industry pays $60,828 per job and has gone from 6,900 jobs in 2001 to over 42,000 in 2013.
  • Port and harbor operations. This industry is 14 times more concentrated in L.A. than the nation, and it’s grown 27% since 2001. (Plus, average earnings are $111,650.)
  • Surgical and medical instrument manufacturing, which has more than doubled in employment and concentration in L.A. And it requires a diverse and mostly high-skilled workforce that is paid well.

And while it’s hard to label entertainment industries in L.A. as “emerging,” there are a stream of related industries that fit the criteria of high growth and increasing specialization. Most notably, teleproduction and other postproduction services (11.5 times more concentrated than nation; 19% growth), motion picture and video production (10.3 times more concentrated; 31% growth, though it’s declined 2008), and agents and managers for artists, athletes, entertainers, and other public figures (7 times more concentrated; 59% growth) fit that mold.

Other Manufacturing Sectors in L.A.

We’ve focused on apparel manufacturing, and briefly touched on surgical and medical instrument manufacturing. The performance of other detailed manufacturing industries is also worth noting. In all, 352 of the 472 manufacturing subsectors classified by the U.S. Census Bureau have lost jobs since 2001 in Los Angeles. The two most notable declines have come aircraft manufacturing (-16,502 jobs, a 50% loss) and search, detection, navigation, guidance, aeronautical, and nautical system and instrument manufacturing (-15,664 jobs, a 42% loss). Both used to be major industries in L.A., and both have bled high-paying jobs.

But there are growth areas in L.A.’s manufacturing scene. The following table shows 17 detailed industries that have added at least 500 jobs since 2001 in L.A., topped by surgical and medical instrument manufacturing:

NAICS CodeDescription2001 Jobs2013 JobsChange% Change2001 National Location Quotient2013 National Location Quotient2013 Avg. Earnings Per Job2012 Establishments
Source: QCEW Employees, Non-QCEW Employees & Self-Employed - EMSI 2013.2 Class of Worker
339112Surgical and Medical Instrument Manufacturing4,86111,2686,407132%1.052.15$128,685 82
315232Women's and Girls' Cut and Sew Blouse and Shirt Manufacturing2,1517,0464,895228%6.4321.26$49,550 165
336414Guided Missile and Space Vehicle Manufacturing8,13111,5943,46343%3.545.11$157,273 29
312111Soft Drink Manufacturing3,0895,3982,30975%0.811.71$86,690 29
339116Dental Laboratories3,7496,0262,27761%1.632.8$56,424 345
311991Perishable Prepared Food Manufacturing1,5813,6662,085132%1.622.35$39,344 50
311941Mayonnaise, Dressing, and Other Prepared Sauce Manufacturing4761,429953200%0.862.46$68,096 19
334419Other Electronic Component Manufacturing4,6475,56391620%1.192.18$80,262 90
311811Retail Bakeries6,3397,15681713%1.82.08$26,520 488
336112Light Truck and Utility Vehicle Manufacturing138057926092%00.45$73,522 5
333996Fluid Power Pump and Motor Manufacturing1,2472,02277562%1.262.52$108,005 13
332722Bolt, Nut, Screw, Rivet, and Washer Manufacturing6,9067,67777111%3.194.83$78,025 65
332912Fluid Power Valve and Hose Fitting Manufacturing3,0423,65961720%1.562.41$96,089 46
336415Guided Missile and Space Vehicle Propulsion Unit and Propulsion Unit Parts Manufacturing425957532125%0.822.2$125,893 6
335129Other Lighting Equipment Manufacturing7801,30552567%1.373.39$68,257 31
331111Iron and Steel Mills5031,020517103%0.10.27$55,782 37
334510Electromedical and Electrotherapeutic Apparatus Manufacturing4,6235,13551211%22.15$99,271 70


Notice the second industry on the list — women’s and girls’ cut and sew blouse and shirt manufacturing. It’s part of the declining apparel manufacturing sector, but it’s one of the rare growth subsectors that we mentioned above. And also of note is guided missile and space vehicle manufacturing, which has made an 86% jump in jobs since 2010 and pays big wages. This industry would no doubt also fall in the emerging category, given it’s increasing concentration and employment.

Joshua Wright is an editor at EMSI, an Idaho-based economics firm that provides data and analysis to workforce boards, economic development agencies, higher education institutions, and the private sector. He manages the EMSI blog and is a freelance journalist. Contact him here.

America's Emerging Housing Crisis

$
0
0

The current housing recovery may be like manna to homeowners, but it may do little to ease a growing shortage of affordable residences, and could even make it worse. After a recession-generated drought, household formation is on the rise, notes a recent study by the Harvard Joint Center on Housing Studies, and in many markets there isn’t an adequate supply of housing for the working and middle classes.

Given problems with regulations in some states, particularly restrictions on new single-family home development, the uptick in housing prices threatens both prospective owners and renters, forcing people who would otherwise buy into the rental market. Ownership levels continue to drop, most notably for minorities, particularly African Americans. Last year, according to the Harvard study, the number of renters in the U.S. rose by a million, accompanied by a net loss of 161,000 homeowners.

This is bad news not only for middle-income Americans but even more so for the poor and renters. The number of renters now paying upward of 50% of their income for housing has risen by 2.5 million since the recession and 6.7 million over the decade. Roughly one in four renters, notes Harvard, are now in this perilous situation. The number of poor renters is growing, but the supply of new affordable housing has dropped over the past year.

So while the housing recovery — and the prospect of higher prices — does offer some relief to existing homeowners, it’s having a negative impact further down the economic ladder. For the poorest Americans, nearly eight decades of extensive public subsidies have failed to solve their housing crisis. Given the financial straits of most American cities — particularly those like Detroit that need it the most — it’s unlikely the government can rescue households stressed by the cost of shelter.

As one might suspect, the problem is greatest in New York, New Jersey and California, say the Harvard researchers .In those three states 22% of households are paying more than 50% of pre-tax income for housing, while median home values and rents in these states are among the highest in the country. According to the Center for Housing Policy and National Housing Conference, 39% of working households in the Los Angeles metropolitan area spend more than half their income on housing, 35% in the San Francisco metro area and 31% in the New York area. All of these figures are much higher than the national rate of 24%, which itself is far from tolerable.

Other, poorer cities also suffer high rates of housing poverty not because they are so expensive but because their economies are bad. In the most distressed neighborhoods of Baltimore, Chicago, Cleveland and Detroit, where vacancy rates top 20%, about 60% of vacant units are held off market, indicating they are in poor condition and likely a source of blight.

America’s emerging housing crisis is creating widespread hardship. This can be seen in the rise of families doubling up. Moving to flee high costs has emerged as a major trend, particularly among working-class families. For those who remain behind, it’s also a return to the kind of overcrowding we associate with early 20th century tenement living.

As was the case then, overcrowded conditions create poor outcomes for neighborhoods and, most particularly, for children. Overcrowding has been associated with negative consequences in multiple studies, including greater health problems. The lack of safe outside play areas is one contributing factor. Academic achievement was found to suffer in overcrowded conditions in studies by American and French researchers. Another study found a higher rate of psychological problems among children living in overcrowded housing.

This is occurring as a generation of middle-class people — weighed down by a poor economy, inflated housing prices and often high student debt — are being pushed to the margins of the ownership market. There will be some 8 million people entering their 30s in the next decade. Those struggling to move up face rising rents and dismal job prospects. It’s not surprising that a growing number of Americans now believe life will be worse for their children.

How do we meet this problem? How about with a sense of urgency? Not that government can solve the problem, but we should consider trying to encourage the kind of entrepreneurs who in the past created affordable “start up” middle- and working-class housing in places like Levittown (Long Island), Lakewood (Los Angeles) and the Woodlands (Houston). Government policy should look at opportunities to create housing attractive to young families, which includes some intelligent planning around open space, parks and schools.

There’s certainly much that government can stop doing. The drive for “smart growth” is increasingly hostile to the very idea of single-family housing. Instead the emphasis, for example in the newly adopted Bay Area plan, is on high-density housing around transit links and virtual prohibition on single-family housing on the urban fringe, without which much higher housing prices — owned and rental — are inevitable. This may appeal to some — especially those in what historian Robert Bruegmann calls “the incumbent’s club: who are already comfortably housed and benefit financially from policy-induced housing shortages. But for the majority of Americans, including immigrants, who would prefer a single-family home, this is bad news indeed.

The situation is worst in high-regulation states with out-of-whack rent and housing cost inflation. Until the 1970s, housing costs were only a little higher relative to income in metropolitan areas like San Francisco and New York compared to elsewhere in the country, staying within the same ratio of roughly 3 to 1. Then came the anti-growth regulatory regime that has doubled house prices relative to incomes, and even more so in San Francisco and San Jose.

But this is not just a California issue. Other states — Oregon, Washington, Maryland — have adopted similar policies. According to Brookings Institution economist Anthony Downs, the housing affordability problem is rooted in the failure to maintain a “competitive land supply.” Downs notes that more urban growth boundaries can convey monopolistic pricing power on sellers of land if sufficient supply is not available, which, all things being equal, is likely to raise the price of land and housing that is built on it.

Generally speaking, as prices rise, single-family homes become scarcer and rents also rise. The people at the bottom, of course, suffer the most, since the lack of new construction, and the inflated prices for houses, also impacts the rental market. Since 1980, the average house price as reported by the National Association of Realtors has moved in near-lockstep with rents, as reported in the Consumer Price Index, except for the worst years of the housing bubble.

To be sure, this does not mean we should build more of the classic suburbs of the 1980s. There needs to be thought as to how to provide housing for people who live near work, or encourage more peopleto work at least part-time at home. It is also imperative that policy provides greater opportunity for people to purchase the housing they prefer and that is also affordable. Technology allows for most jobs to disperse, for tremendous opportunity for overall savings for households. Long linear parks — and even some smaller farms — could provide the critical link to nature and recreation that many households seek.

More than anything we need to recognize that we are not building a reasonable future for the next generation by forcing them to work to pay someone else’s mortgage, that of the landlord. This is the opposite of the American dream and certainly doesn’t reflect the future our parents sought, nor is it one we should bequeath to our children.

Joel Kotkin is executive editor of NewGeography.com and Distinguished Presidential Fellow in Urban Futures at Chapman University, and a member of the editorial board of the Orange County Register. He is author of The City: A Global History and The Next Hundred Million: America in 2050. His most recent study, The Rise of Postfamilialism, has been widely discussed and distributed internationally. He lives in Los Angeles, CA.

This piece originally appeared at Forbes.

Creative Commons photo "Signs of the Times" by Flickr user coffeego

Bruce Springsteen: The Wrecking Ball Strikes Europe

$
0
0

It makes sense that the European continent would enthusiastically welcome Bruce Springsteen this summer on his Wrecking Ball Tour. Europe is in its second year of a prolonged recession, and its economic union looks like a failed savings and loan association. As he has in the past, the Boss is making The Grand Tour. Instead of gracing luxury hotel suites, though, he’s filling up the kinds of cost-overrun stadiums in Barcelona, Paris, Düsseldorf, and Cork that are one reason the European Union is starting to look like Youngstown.

I caught the Wrecking Ball in the Geneva soccer stadium, known locally as La Praille, that was built at the cost of millions for the UEFA European championships in 2006. It has since stood largely empty, a symbol that local politicians are better at spending bread than putting on circuses.

According to the stadium’s promoters, La Praille was to have played host to the local soccer team, FC Servette, which was “shackled and drawn” with bad debts just when the stadium was finished. Now the organizers are filling in with the odd rock concert, rugby friendlies, and the peripatetic longtime French rock and roller, movie star, and all around heartthrob Johnny Halliday, whose concert industry is the only thing standing between the EU and collapse.

Not even the Boss and the E Street Band could fill La Praille, although they arrived with a multiplex cinema in tow and started the concert at the distinctly suburban hour of 7:30 p.m., mindful that Switzerland is intolerant of rockers making noise after 10:00 p.m. (the hour in some Zurich apartment buildings when “upright urinating” is shut down).

The Boss’s handlers evidently taught him enough French (clearly not a subject pushed at Freehold Regional High School) so that when he came on stage he could say “bon soir” and “merci beaucoup” to a crowd so carefully dressed and well behaved that it could have been the summer jamboree of an international actuarial association.

Those toward the front held aloft carefully lettered signs welcoming the Springsteen to Geneva. These placards were not of the heavy-metal variety, suggesting after-party wastage or death to American droners, but rather mild exhortations to the Boss for song requests, or slow dances in the dark.

The Boss’s stage presence is much more upbeat than his lyrics. I am not sure anyone cared whether or not this town is “a death trap, it’s a suicide rap,” when he was cavorting with the crowd and mussing the hair of small children—Uncle Bruce from the Jersey Shore on his way around Europe.

As you would expect, he was dressed for the concert in the apparel of a hardware store assistant—tight shirt and jeans—although, in a concession to his age (63), he had two large wrist bands and what looked like sensible shoes (I'm guessing maybe Rockports?). During the performance he was in perpetual motion around the stage, with that uptempo air of '80s exercise guru Richard Simmons, and the same hypnotic effect on what in French are called “women of a certain age.”

From where I was standing, the E Street Band was a thin black line on a stage of Nuremberg proportions. Fortunately, the Boss had his own multi-screen video feeds, and all around the stadium there were cameras and roadies, beaming the concert live to the Megatron screens that surrounded the stage.

When I went on my toes to see Bruce or the band live, the E Streeters looked like porcelain miniatures in some Franklin Mint rocker collection (“...collect them all”).

On the nearby silver screens, however, the Boss and his cohorts were the size of floats in the Macy’s Thanksgiving Day parade. At times I felt like I was squeezed into the world’s largest electronics store with all the televisions tuned to the E Street network.

I confess that my middle-aged ears, even with the plugs they passed out at the main gate, could not pull down all the lyrics from the pulsing sound system. So I took it on faith that his girlfriend was pregnant, the plant was closing, and the Vietnam War wasn’t working out.

Because English is not as widely understood in Switzerland as you might think, I suspect that some of the lyrics were lost in translation. For example, in Geneva, “working on the highway” is practically a white collar job. I can imagine local puzzlement at the thought that anyone holding “a red flag” and watching “the traffic pass me by” would lead to the contemplation that there is “a better life than this.” Around here traffic wavers get early retirement and full European social benefits.

Nor are the American depressions that the Boss evokes equivalent to recent European hard times. Industrial America downsized and shipped the jobs to Asia ('death to my hometown') while the recession in Europe is the result of an overvalued currency and social costs for its aging population. Nobody is thinking 'we gotta get out while we’re young,' if the goal is to hang on until the state pension starts 'treating us good.'

I have no idea what the Boss is like at home. In person he sounds a little like Rocky Balboa saying “Yo, Adrian.” But his stage presence is magnetic, warm and empathetic. Because his wife, E Street band member Patty Scialfa, was tending home fires ('Got a wife and kids in Baltimore, jack'), the Boss danced with a number of women from the front rows—did their signs have phone numbers?—and he let numerous fans share his mic.

I was on my feet for four hours in what felt like a crowded elevator, waiting for the TV in the corner to play Born in the U.S.A. So, during the concert, I had time to reflect on the E Street corporate culture and came to the conclusion that Springsteen is an inclusive manager, something often missing in rigid, hierarchical European companies.

The band looks happy, and Springsteen Inc. is very good at retaining key employees, even though on stage Stevie van Zandt looked like a jet-lagged pirate and Nils Lofgren hopped around like a chimney sweep.

The irony of the concert is that it was held the night before the 4th of July, normally a moment, even overseas, when the United States can bask in its refracted glory. Before insurance premiums closed down the carousels, even Geneva had one of the largest July 4th parties abroad. Now, however, Swiss and American relations are at a low ebb.

Like the rest of Europe, the Swiss “celebrated” the 4th with the news that the National Security Agency has tapped European Union phones, much the way the U.S. has used local airports for rendition flights and beaten up on local bankers and the euro.

Nevertheless, the two flags of the so-called sister republics flew over the stage, 'waitin’ on a sunny day,' and the Boss closed with Thunder Road. When he belted out, 'It’s a town full of losers/ And I’m pulling out of here to win,' there was no hint as to whether he was eulogizing the American dream or European decline.

Matthew Stevenson, a contributing editor of Harper's Magazine, is the author of Remembering the Twentieth Century Limited, a collection of historical travel essays. His next book is Whistle-Stopping America.

Flickr photo by Maripuchi: The Wrecking Ball Tour in Gijón, Spain, a few days before it arrived in Switzerland.

Should Uncle Sam Chase a Scandinavian Model?

$
0
0

When American progressives dream their future vision of America, no place entices them more than the sparsely populated countries of Scandinavia. After all, here are countries that remain strongly democratic and successfully capitalist, yet appear to have done so despite enormously pervasive welfare systems.

Paul Krugman, the current high priest of progressive economics, approves of Sweden's high level of spending on benefits as an unadulterated economic plus. He says that Sweden, unlike other European states like France, thrives despite its high tax rate and notes that, while half of all children are born out of wedlock, those children have far less poverty than American children. Progressive pundit Richard Florida, for his part, claims that Sweden is the most creative place on Earth, just ahead of the U.S.

Some even suggest America should adopt wholesale the Scandinavian system as a policy imperative. The Washington Post praises Sweden as the "rock star" of the financial crisis and lists five ways the U.S. could learn from Sweden. ThinkProgress lauds Sweden's ability to achieve the world's highest rate of "social progress" despite a lower per capita income than the U.S. Writer David Dietz, contributor to PolicyMic, sees countries such as Sweden, Norway and Denmark as models that can guarantee both future economic growth and a way for America "to regain its global edge and cement its economic dominance."

But before we all go out drinking aquavit, shouting "skol" and dyeing our hair blonde, it makes sense to recognize that not only is relatively small, historically homogenous Scandinavia an ill-suited role mode for a megapower like the U.S., but that, in many ways, the Nordic system may be far more limited than its admirers here might acknowledge.

Of course, it's not that there's not something to learn from these or other countries. Certainly Europe's chilly corner seems in much better shape than the rest of the continental mess. Given today's circumstances, recent books extolling the EU as a model such as Stephen Hill's "Europe's Promise" or Jeremy Rifkin's "The European Dream" seem just slightly absurd.

In truth, Scandinavian countries have performed better than the dismal continental norm in large part because, with the exception of recession-wracked Finland, they have stayed out of Euro currency.

But even those outside the Euro-destruct zone are not doing as well as widely asserted. Overall unemployment in Sweden, at 8.4 percent, is also higher than that of the U.S.

Even Norway is underperforming. The last quarter its GDP grew .3 percent, down from an expected .8 percent. As long as mainland Europe is gripped by negative growth and record unemployment, export-oriented Scandinavian countries will continue to struggle.

In addition, not all the reasons for Scandinavia's relative health are those that would warm the heart of U.S. progressives. These countries, led by Sweden, have reformed many aspects of their welfare state, including such things as labor laws, and reduced taxes in ways that make them more competitive – and far less egalitarian than in the past.

Another positive factor for Scandinavia lies in their exploitation of resources, something many progressives, notably green policy aficionados, tend to view with disdain. Sweden exports loads of iron ore to drive its economy and employs massive dams to drive hydropower, which accounts for 42.8 percent of their energy. Norway benefits from a gusher of oil and gas that, producing nearly 2 million barrels of oil per day, making it the 14th largest oil producer in the world despite having a population of 5 million. If anything, Norway can be a model socialist economy because its economic base resembles the Nordic enclave of North Dakota. Overall, the tiny country produces nearly 15 times as much oil per person than the U.S.

There's also the matter of scale. Demographically, Scandinavia's population is microscopic compared to our far vast multi-ethnic Republic. Taken together the four Scandinavian countries – Finland, Denmark, Sweden and Norway – are home to barely 26 million people, far fewer than California and about the same as Texas. These hardy souls are widely dispersed. The population density of Norway and Finland is roughly half that of the U.S., while that of Sweden is one-third less.

Sweden, to put things in perspective, has fewer people than Los Angeles County. Norway and Finland are less populous than Minnesota, which is about the closest thing we have to Scandinavia. The Minneapolis-Saint Paul region, with 3.6 million residents, would be by far the biggest urban area in the region. Overall American Nordics, including those of mixed ancestry, total 11 million, more than the population of Sweden, by far the region's largest country.

Scandinavia's greatest strength may lie in its least political correct asset: its Nordic culture. Scandinavians' traditional interest in education, hard work and good governance serves them well both at home and abroad. It's not socialism that is primarily responsible.

After all, America's Scandinavians, although largely the descendents of poor immigrants also are pretty successful, earning more on average than their counterparts back home.

A Scandinavian economist, for example, once stated to Milton Friedman: "In Scandinavia, we have no poverty." To which the caustic Nobel Prize winner replied: "That's interesting, because in America among Scandinavians, we have no poverty, either." Indeed, the poverty rate for Americans with Swedish ancestry is only 6.7 percent, half the U.S. average which is on par with the poverty rate at home.

Yet these cultural attributes, notes Swedish based commentator Nima Sanandaji, now appear to be eroding in part because of rising immigration. Long highly homogeneous, the Nordic countries – notwithstanding their liberal kumbaya rhetoric – are facing huge problems absorbing immigrants. Despite populations that are more than 90 percent native, there is growing unease about concentrations of largely Muslim immigrants around large cities like Copenhagen, Malmo and Stockholm.

These immigrants are not doing remotely as well as those counterparts in the U.S. or Canada. Unemployment rates can reach as high as 80 percent among African and Middle Eastern immigrants in Scandinavia.

In May, there was a major riot in Stockholm's heavily Muslim, dense and highly planned inner suburbs. Many immigrants do not seem to embrace the Scandinavian ethos that having strong welfare system available does not mean people should take undue advantage of it.

More troubling still, notes Sanandaji, who is of Swedish-Kurdish ancestry, many young Scandinavians also seem to be rejecting the old Nordic social compact. Increasing numbers of people under 40 are retiring early, citing disabilities and sickness.

These trends point to serious problems for countries whose birthrates, despite widely praised natalist policies, are dropping and generally are below ours. With immigration growing ever more unpopular, further demographic decline in the Nordic countries seems inevitable.

As a result, the Scandinavian welfare state faces challenges arguably far worse than those here at home. The Bank of Finland, for example, warns that an aging population and large public debt would cause a "risk that Finland will drift onto a path of fading economic growth, persistently high unemployment and deteriorating public finance."

To be sure, America faces many of these same problems, but it seems silly to look for solutions in a region of the world that is not only fundamentally different but also faces equal, or even greater challenges. Rather than adopt solutions forged in the Nordic cold, American progressives would do better to hone their prescriptions to meet the illnesses of the very different patient here at home.

Joel Kotkin is executive editor of NewGeography.com and Distinguished Presidential Fellow in Urban Futures at Chapman University, and a member of the editorial board of the Orange County Register. He is author of The City: A Global History and The Next Hundred Million: America in 2050. His most recent study, The Rise of Postfamilialism, has been widely discussed and distributed internationally. He lives in Los Angeles, CA.

This piece originally appeared at The Orange County Register.

Humiliating Detroit

$
0
0

As I’ve noted before, Detroit is all too frequently just a blank screen onto which people project their own personal bogeymen. So liberals see in Detroit racism gone wild, America’s comeuppance for its love affair with the automobile, and corporate greed. Conservatives see the ultimate end result of unions and where liberalism will take the US as a whole if it isn’t stopped.

There’s a bit of truth in all of these. The left would have us believe that having Democrats in charge of the city for so long had nothing to do with where it is today. But they reality is, they’ve got to own their piece of blame. Detroit certainly hasn’t been a bastion of conservative policy, that’s for sure.

On the other hand, Republicans should be aware that Detroit’s decline has been ongoing for quite a while, and there were definitely some mayors with R’s by their name who were in on the game. And economic forces shaped Detroit far more than they’d like to admit.

But ultimately what we see today is the left furiously spinning about Detroit (for example, see the book “Detroit: A Biography”) and the right trying to use it as a poster child for everything they hate. Yet on the right I can’t help but observe a particularly mean streak in the commentary, one that’s positively gleeful about Detroit’s demise. It’s as if, not content with letting the results speak for themselves about what happened under Democratic rule, the right seems determined to humiliate Detroit, reveling in its pain. It’s schadenfreude on steroids.

Let me highlight this. First Kurt Schlichter says that “Conservatives Should Point and Laugh As Detroit Dies.”

The agonizing death of Detroit is cause for celebration. It’s the first of the liberal-run big cities and states to fall, and we should welcome its collapse with glee.

Yeah, liberals, eventually you do run out of other people’s money.

The blue state model is a terminal disease, and Detroit is its poster child. Only this is one telethon where we should pledge that we won’t pay a single dime to keep the progressive party going a single minute longer.

Detroit represents the epitome of the blue state, Democrat machine liberalism that Barack Obama represents. Well, not one damn cent for Barry’s Kids.

Don’t hold back, tell us how you really feel. John Fund at the National Review is nowhere near vicious, but he does paint a target on Detroit’s art, basically arguing that the city should be forced to sell off its assets to satisfy creditors:

What no one wants to do, apparently, is sell the city’s assets. The city has largely unused parks and waterfront property that could be opened to economic development. The Detroit Historical Museum has a collection of 62 vehicles, including an 1870 Phaeton carriage and John Dodge’s 1919 coupe, that is worth millions. But the biggest sacred cow is the Detroit Institute of Art (DIA), one of the nation’s oldest and most valuable art museums. It has pieces by Vincent van Gogh, Henri Matisse, Andy Warhol, and Rembrandt. The Institute also owns William Randolph Hearst’s armor collection and the original puppet from the children’s TV show Howdy Doody.

The Detroit Free Press asked New York and Michigan art dealers to evaluate just a few of the 60,000 items in the Institute’s collection. The experts said the 38 pieces they looked over would fetch a minimum of $2.5 billion on the market, with each of several pieces worth $100 million or more. That would go a long way toward relieving the city’s long-term debt burden of $17 billion.

Let me get this straight. Instead of Detroit being $17 billion in debt, let’s sell off everything left that makes Detroit viable and end up still $14.5 billion in debt and still bankrupt. (Though only a few items were evaluated, they were clearly the handful of most valuable ones. Howdy Doody ain’t Van Gogh). Oh, yeah, that will help – if your definition of help is bailing out banks who loaned money to a city everyone has known is a basket case for many, many years. If those banks expected the art to be sold, they should have made the city pledge it as collateral.

Fund is right that Detroit does need to make tough choices about assets. I’ve made that argument myself. But the goal should be to create at a minimum a sustainably functional government and ensure the bankruptcy of the city of Detroit doesn’t undermine the broader region and state. Selling off secondary assets (and yes, Howdy Doody may be a good candidate) is worth pursuing if there’s cost/benefit. But saying that Detroit should sell off its regional cultural crown jewels is little more than an attempt to inflict counter-productive penance, to force humiliation upon the city. And it would also be completely unlike say a corporate Chapter 11 restructuring, which is designed to produce a viable firm on the other end and thus the most valuable assets are often retained.

Of course, Detroit’s own residents make it easy to act this way. A group of protestors referred to the bankruptcy filing as a “declaration of war,” saying that outsiders aren’t entitled to any say or even get the money back they loaned the the city, saying instead “the banks owe us.”

Still, have some compassion. It’s understandable Detroit’s residents are in pain and lashing out. Clearly they have tough medicine they haven’t reconciled themselves to taking. But there are better ways to respond to it. Andrew Biggs at the American Enterprise Institute took a more moderate path, suggesting that while a plain reading of Michigan’s constitution suggests it wouldn’t protect pensions in bankruptcy, there’s still reason to give pensioners some preferential treatment (thought not being made 100% whole, saying:

Does this mean that retired city workers should take the same haircut as municipal bond holders? I really don’t think so. Anyone loaning money to the city of Detroit was knowingly taking the risk that the city might not repay; that’s why bonds issued by Detroit paid a higher yield than Treasury securities, which are assumed to be riskless. As with any risk investment, sometimes it pays off, sometimes it doesn’t.

City employees, on the other hand, exchanged services today — along with employee contributions to their pension plan — for benefits to be delivered in the future. Sure, employees should consider the financial stability of their employer in its ability to deliver what is promised, but city employees seem to be a qualitatively different group than municipal bond holders.

This seems more rational type analysis and isn’t rooted in mean-spiritedness.

Though eager to point out how Democratic policies and corrupt Democratic politicians helped propel Detroit headlong in bankruptcy (which is certainly a valid political claim to make), having a vengeful streak only shows Republicans behaving in a ways that’s as hard hearted as Democrats say they are.

Aaron M. Renn is an independent writer on urban affairs and the founder of Telestrian, a data analysis and mapping tool. He writes at The Urbanophile.

Viewing all 3794 articles
Browse latest View live


Latest Images