Quantcast
Channel: Newgeography.com - Economic, demographic, and political commentary about places
Viewing all 3788 articles
Browse latest View live

Fracking Offers Jerry Brown a Watershed Moment

$
0
0

The recent announcement that Jerry Brown is studying "fracking" in California, suggests that our governor may be waking up to the long-term reality facing our state. It demonstrates that, despite the almost embarrassing praise from East Coast media about his energy and green policies, Brown likely knows full well that the state's current course, to use the most overused term, is simply not politically and economically sustainable.

Although largely a prisoner of basic green dogma, Brown also is a former Jesuit, with that order's sense of rationality, order and, well, philosophical flexibility. Unlike many of his progressive idolaters and legislative allies, Brown may well be intelligent enough to look past the rhetoric of the environmental movement and consider its often unexpected ill-effects.

Brown needs to balance "California comeback" stories – including one that gushingly describes "California beaming"– with the actual realities. Good times, and the current technology bubble, may be blessing Silicon Valley, but as Walter Russell Mead points out, this comeback is being pushed "over the heads of the poor and the jobless." This, he adds, "is not how progressives used to think."

The chasm between the effects of "noble" green politics and the interests of most Californians is becoming evident, if not widely recognized in the mainstream media. Editorial writers at the New York Times may believe we are losing our need for oil and gas, but this transition should be more difficult than they suggest and, if achieved through often-thoughtless Draconian measures, could have profound impacts on the overall economy.

Let's start with the supposed "up" side of the purist renewable policies hitherto embraced by Brown. The governor's 2010 election promise about creating 500,000 "green jobs"– his economic rationale for his energy and other environmental policies – increasingly looks far-fetched. With electric car maker Fisker, backed by well-connected Democratic venture capitalists and Al Gore, now perhaps ready to follow solar-panel maker Solyndra into bankruptcy, the pitch about a green economy seems unlikely, even bizarre.

The state-driven "green" policies have also created huge losses for the giant state-employee retirement fund CalPERS, one of whose managers at a recent conference confided that renewable–energy investments have negative returns approaching 10 percent.

Certainly, neither green energy nor even the current Silicon Valley bubble are creating enough jobs to make up for the enormous shortfall in employment since the recession. This is particularly evident in urban areas like Los Angeles and Oakland – where Brown was mayor from 1999-2006 – as well as most of the state's interior. Overall, the state vies for last-place honors with the likes of Rhode Island, Nevada and Mississippi for the nation's highest unemployment rate. The damage is greatest in the state's more blue-collar interior. Working-class Stockton just was allowed to enter bankruptcy and other municipalities seem likely to join the queue.

Progressive journalists, eager to pronounce the state's comeback to justify their ideology, seem utterly unaware of the seriousness of the overall situation in the state. One wonders what they would say if Pete Wilson or Meg Whitman were governor. Compare Texas, which is 550,000 jobs ahead of its 2007 number, to California, which, despite recent gains, remains down 560,000 jobs from its peak. Perhaps unemployment is not a big issue in the progressive reserve of Palo Alto, where the jobless rate is about the same as in North Dakota, but it is a constant in much of Los Angeles, San Jose and Santa Ana, as well as the Central Valley. If this suggests a "comeback" to New York Times columnist Paul Krugman, perhaps we need a new definition for that word.

These comparisons seem particularly relevant to the discussion of fracking – oil and gas extraction using a technique called hydraulic fracturing. In the environmental scheme of things, oil and even natural gas, once widely favored by progressives, now constitute an utter evil. This is true even though gas has been the primary reason for the country's reduced carbon emissions by replacing coal as a source for generating electricity. Some of the state's well-heeled greens would like to ban the process entirely.

Brown must be aware he is not just governor of the public sector or of his admirers among the coastal rich. He has to consider the unimaginable: removing mandates that force the state to rely on expensive, often-unreliable renewables, notably, solar. These have helped push California electricity prices well above the national average, and much higher than in prime economic competitors such as Washington state, Utah, Texas, Arizona and Nevada. Economist John Husing suggests this is one reason why California not only completely missed the recent national revival in manufacturing jobs – 500,000 the past two years – but actually lost 10,000 more such jobs.

We are clearly missing the party here. California's energy policies reflect what is already happening in Europe, where anti-fracking ideology, sometimes supported by the no-doubt-disinterested Russians, have largely won the day. But the costs of green policies have already convinced hard-pressed Spain to abandon its widely praised renewable program.

Far more economically healthy Germany also is rethinking its renewables mandates. One reason: German companies like Bayer and BASF consider moving to cheaper locales, such as along the U.S. Gulf Coast, where electricity is one-third the price. Texas, Utah and Arizona are to California's hard-pressed manufacturers what the Gulf Coast is to Germany's.

And, then, there are the effects of the budget. Unlike his East Coast admirers, Brown must know that the budget situation is hardly rosy over the longer term. The state auditor recently released a report showing the state's net worth to be negative by some $127 billion, in large part due to often out-of-control pension costs. There are already indications that the return from last year's hike in income taxes may not be as large as expected and that what was, during the election, promised to schools will likely end up, as widely predicted, covering rising pension obligations.

Companies and individuals may not leave California in droves, as some have suggested, but investors certainly can put their money someplace more fiscally responsible. A longer-term problem may be that the higher-income earners, who generate the vast majority of income-tax revenue, are also those most likely to change behavior or find effective income-hiding strategies; remember, Facebook paid no income taxes last year.

Given these prospects, reviving California's fossil-fuel industry could prove a critical boost to the budget. A deal to raise some energy taxes while allowing more exploration and development would go a long way to filling the state's coffers.

Energy taxes play a big role in financing higher education in many states, including North Dakota, Louisiana and Texas. Oil money, ironically, has allowed Texas to fund universities, particularly the main University of Texas campus in Austin, as a competitor to the perennially hard-pressed University of California system. An energy boom in California, whose energy resources may exceed those of all these states, might offend most academics, but, my hunch is, they might take the money.

Perhaps more important, a pragmatic shift on energy would also help, as columnist Tim Rutten puts it, "jump start" the state's economy, particularly in central California. In the past decade, Texas has created almost 200,000 energy-related jobs, while California has generated barely 20,000. These jobs provide good wages to many blue-collar workers, the very people losing out the most in our progressive-minded state.

There are other signs of pragmatism from the governor. Brown has announced support for a peripheral canal that would provide more-reliable water supplies to the state's huge agribusiness industry. Although some state regulators threaten farmers with ever-tougher regulations, some observers, such as three-term Salinas Mayor Dennis Donahue, now a full-time farmer, say the governor is trying to "walk the line between labor, greens and agriculture."

Many Republicans and conservatives find the notion of Brown getting on the road to reality itself fundamentally unrealistic. But the past could be prologue. Brown also started off his first term, in 1975, as something of a dreamer, proclaiming a "small is beautiful" agenda. This was, in many ways, ahead of its time, and skeptical of government spending, but Brown's environmental views, particularly, also offended some business interests. Far worse, he signed off on legislation freeing up public-sector unions, which has turned into something of a disaster.

But by the time he started running for a second term, Brown readjusted to a new reality. He could claim that, as someone opposed to the growth of institutionalized government, he could live with Proposition 13. Brown had opposed the measure, but, once it passed, in 1978, he chose, unlike many progressives, to embrace it.

Brown then ran as a centrist, pro-growth governor. He particularly embraced the then-ascendant technology industry, gaining new donors and allies, although the shift toward realpolitick horrified some of his green backers. But the politics worked brilliantly.

Today's circumstances, of course, are different. For one thing, Brown faces little pressure from the right, as the Republican Party, at least for now, has deteriorated into near irrelevancy. The once-potent California business community also has lost much influence, with every lobby, basically, trying to make its own deal with the overweening state apparat.

So, if Brown is to move to the center, he will have to do it largely on his own, and put up with the incessant hectoring of his allies. Yet, Brown's occasional genius has demonstrated a Machiavellian quality, knowing when to embrace opponents in order to divide or weaken them, or to allow allies to stew. He also, at this stage of life – today, April 7, is his 75th birthday – must wonder if he wants to leave a legacy of fiscal weakness, a fading competitive edge and an ever-expanding class chasm. In the long run, whether on fracking or a host of other issues, Brown's success will not derive from pleasing progressive writers, but by promoting a better future for the vast majority who live in, and love, this state.

Joel Kotkin is executive editor of NewGeography.com and a distinguished presidential fellow in urban futures at Chapman University, and a member of the editorial board of the Orange County Register. He is author of The City: A Global History and The Next Hundred Million: America in 2050. His most recent study, The Rise of Postfamilialism, has been widely discussed and distributed internationally. He lives in Los Angeles, CA.

This piece originally appeared in the Orange County Register.

Photo: Troy Holden

The 2012 Metro Year in Jobs

$
0
0

Last month the BLS put out the first official release of annual job data for metropolitan areas, so I wanted to take a brief look at this for large metro areas (more than one million in population, based on old metro area definitions that the BLS still uses). Here are the top 10 cities for percentage job growth. Nashville takes the crown. I’m also personally glad to see Indy bounce back after a couple tough years.

Rank (Best)Metropolitan Area20112012Pct Change
1Nashville-Davidson–Murfreesboro–Franklin, TN756.7786.23.90%
2Houston-Sugar Land-Baytown, TX2592.12691.43.83%
3Austin-Round Rock-San Marcos, TX795.0823.23.55%
4Salt Lake City, UT620.0641.03.39%
5San Jose-Sunnyvale-Santa Clara, CA876.4905.23.29%
6San Francisco-Oakland-Fremont, CA1917.21977.83.16%
7Charlotte-Gastonia-Rock Hill, NC-SC825.1850.33.05%
8Raleigh-Cary, NC506.9521.92.96%
9Dallas-Fort Worth-Arlington, TX2932.23016.02.86%
10Indianapolis-Carmel, IN888.6913.82.84%

Here are the bottom ten performers. The federal slowdown already appears to be hitting DC:

Rank (Worst)Geography20112012Pct Change
1St. Louis, MO-IL1298.71298.80.01%
2Rochester, NY510.1513.20.61%
3Providence-Fall River-Warwick, RI-MA – Metro544.8548.30.64%
4Buffalo-Niagara Falls, NY543.5547.00.64%
5Philadelphia-Camden-Wilmington, PA-NJ-DE-MD2707.42725.20.66%
6Milwaukee-Waukesha-West Allis, WI815.5821.40.72%
7Virginia Beach-Norfolk-Newport News, VA-NC737.7743.80.83%
8Hartford-West Hartford-East Hartford, CT – Metro538.2542.70.84%
9New Orleans-Metairie-Kenner, LA525.1529.70.88%
10Washington-Arlington-Alexandria, DC-VA-MD-WV3007.63039.81.07%

And here is the complete list:

RowMetropolitan Areas20112012Total ChangePct Change
1Atlanta-Sandy Springs-Marietta, GA2306.02349.943.91.90%
2Austin-Round Rock-San Marcos, TX795.0823.228.23.55%
3Baltimore-Towson, MD1292.61317.825.21.95%
4Birmingham-Hoover, AL493.6501.47.81.58%
5Boston-Cambridge-Quincy, MA-NH – Metro2459.52499.239.71.61%
6Buffalo-Niagara Falls, NY543.5547.03.50.64%
7Charlotte-Gastonia-Rock Hill, NC-SC825.1850.325.23.05%
8Chicago-Joliet-Naperville, IL-IN-WI4305.14369.264.11.49%
9Cincinnati-Middletown, OH-KY-IN990.11002.412.31.24%
10Cleveland-Elyria-Mentor, OH1001.21016.615.41.54%
11Columbus, OH926.0950.424.42.63%
12Dallas-Fort Worth-Arlington, TX2932.23016.083.82.86%
13Denver-Aurora-Broomfield, CO1213.61246.132.52.68%
14Detroit-Warren-Livonia, MI1785.71826.841.12.30%
15Hartford-West Hartford-East Hartford, CT – Metro538.2542.74.50.84%
16Houston-Sugar Land-Baytown, TX2592.12691.499.33.83%
17Indianapolis-Carmel, IN888.6913.825.22.84%
18Jacksonville, FL586.8595.68.81.50%
19Kansas City, MO-KS980.6996.816.21.65%
20Las Vegas-Paradise, NV808.2823.615.41.91%
21Los Angeles-Long Beach-Santa Ana, CA5165.85264.698.81.91%
22Louisville/Jefferson County, KY-IN598.0610.912.92.16%
23Memphis, TN-MS-AR593.8600.97.11.20%
24Miami-Fort Lauderdale-Pompano Beach, FL2228.62278.249.62.23%
25Milwaukee-Waukesha-West Allis, WI815.5821.45.90.72%
26Minneapolis-St. Paul-Bloomington, MN-WI1735.01766.431.41.81%
27Nashville-Davidson–Murfreesboro–Franklin, TN756.7786.229.53.90%
28New Orleans-Metairie-Kenner, LA525.1529.74.60.88%
29New York-Northern New Jersey-Long Island, NY-NJ-PA8418.28554.3136.11.62%
30Oklahoma City, OK580.1593.413.32.29%
31Orlando-Kissimmee-Sanford, FL1014.91040.325.42.50%
32Philadelphia-Camden-Wilmington, PA-NJ-DE-MD2707.42725.217.80.66%
33Phoenix-Mesa-Glendale, AZ1715.61757.141.52.42%
34Pittsburgh, PA1144.91158.613.71.20%
35Portland-Vancouver-Hillsboro, OR-WA987.81006.618.81.90%
36Providence-Fall River-Warwick, RI-MA – Metro544.8548.33.50.64%
37Raleigh-Cary, NC506.9521.915.02.96%
38Richmond, VA610.9623.412.52.05%
39Riverside-San Bernardino-Ontario, CA1128.81151.622.82.02%
40Rochester, NY510.1513.23.10.61%
41Sacramento–Arden-Arcade–Roseville, CA808.6822.513.91.72%
42Salt Lake City, UT620.0641.021.03.39%
43San Antonio-New Braunfels, TX858.4877.919.52.27%
44San Diego-Carlsbad-San Marcos, CA1233.41258.825.42.06%
45San Francisco-Oakland-Fremont, CA1917.21977.860.63.16%
46San Jose-Sunnyvale-Santa Clara, CA876.4905.228.83.29%
47Seattle-Tacoma-Bellevue, WA1671.31711.540.22.41%
48St. Louis, MO-IL1298.71298.80.10.01%
49Tampa-St. Petersburg-Clearwater, FL1129.71155.726.02.30%
50Virginia Beach-Norfolk-Newport News, VA-NC737.7743.86.10.83%
51Washington-Arlington-Alexandria, DC-VA-MD-WV3007.63039.832.21.07%


Aaron M. Renn is an independent writer on urban affairs and the founder of Telestrian, a data analysis and mapping tool. He writes at The Urbanophile, where this piece originally appeared.

Get a job photo by Bigstock.

Genealogy Of Rust Belt Chic

$
0
0

Some people don't like the term "Rust Belt". Others absolutely hate the word "chic". Please don't call the shifting mesofacts of dying Great Lakes cities "Rust Belt Chic". Given the reaction, a lot of it negative, I decided to blog about how I came up with Rust Belt Chic. Way back in 2006, Shittsburgh was associated with a kind of urban chic. The South Side Slopes celebrated in the New York Times:

"If Pittsburgh's market were on steroids like New York's, this would've happened a long time ago," said one developer, Ernie Sota, referring to the recent spark of interest here. "But Pittsburgh's kind of like an eddy. Things move slowly here."

Mr. Sota, 56, is a prolific local developer who is constructing a series of nine 'green' town houses, called Windom Hill Place, into a lush hillside here. He was drawn to the Slopes by the views and villagelike feel, which, for him, conjure memories of visits to Prague and Budapest.

"It's just kind of quirky, funky and real, more organic, built by Europeans and other immigrants," he explained. "The only other American cities that I find as geographically interesting are maybe San Francisco and Asheville, N.C."
Emphasis added. At the time, I thought of Sota's sense of Pittsburgh place as unique to the city. I'm not from Pittsburgh. I don't live in Pittsburgh. I didn't go to school there. I'm a geographer. Pittsburgh appeals to my sensibilities. Pittsburgh is my Paris.

The geographic scope of Pittsburgh urban chic became Rust Belt Chic upon meeting Phil Kidd and John Slanina in Erie, PA for a Rust Belt Bloggers summit. They introduced me to Youngstown. I was hooked.

Rust Belt Chic always will be ironic. People are attracted to shrinking city hellholes. However, the hellhole part is misunderstood. What I mean is seeing opportunity hiding in a community struggling with survival. There's just something about Youngstown that stirs passion in me. I'm not gawking at ruin porn or glossing over everything that is wrong. I love Rust Belt cities. I love Rust Belt culture. I'm proud to be from the Rust Belt. That's what Rust Belt Chic now means to me. It's personal. It's who I am.

For Pittsburgh, I could sense the tide turning. I see the same transformation taking place in other Rust Belt cities. A pejorative, Rust Belt-ness is an asset. It's a starting point for moving forward, not a finish line or a civic booster campaign. Rust Belt Chic is in the same vein as rasquache:


Rasquache sensibility that has become an important component of Chicana and Chicano art. The word, rasquache can be used in several senses. Its most common use is negative and relates to an attitude that is lower class, impoverished, slapdash and shallow. For this reason Tomás Ybarra Frausto who has written the cogent essay "Rasquachismo: A Chicano Sensibility" begins by stating, "One is never rasquache, it is always someone else, someone of a lower status, who is judged to be outside the demarcators of approved taste and decorum (in Richard Griswold del Castillo and others, Chicano Art: Resistance and Affirmation, 1965-1985. Los Angeles: Wight Gallery, UCLA, 1991, p. 155)

However, as the case of several other terms and concepts (most notably the term and concept Chicano itself, which traditionally had a negative sense), the Chicano movement has turned the traditional notion of rasquache on its head. This important Chicano cultural sensibility has been particularly used to address, by means of a stance of resistance that is humorous and ironic rather than confrontational or hard-edged, the harrassments of external authorities such as the police, the immigration service, government officials, social services bureaucrats, and others. Chicano art that is rasquache usually expresses an underdog, have-not sensibility that is also resourceful and adaptable and makes use of simple materials including found ones, such as Luján's cardboard, glue, and loose sand. 

Rust Belt Chic turns the traditional notion of Rust Belt on its head. The Rust Belt is lower class, impoverished, slapdash, and shallow. At least, that's how it looks from the coast, in New York City. Rust Belt Chic as a place to be is a form of resistance. It's also a hot new trend and a threat to those neighborhoods that make my heart beat faster. From San Antonio:

“I see a lot of progressiveness happening lightning quick now. When I came from Los Angeles as a visitor in 1992, I saw all these magic spaces you could rent for 300 or 400 a month. But I would laugh because there was little or nothing going on. I could get together some event with a friend or two and everybody thought it was so cool and innovative – I was just copping what I had seen in LA.

San Antonio has gotten a lot more popular with Austin and California types discovering what a jewel this town is. Eclectic little restaurants and coffee places and shops growing up along Broadway and throughout Southtown. We’re being seen by a lot more cutting edge people by being open to contemporary signage and logos and creative design. With that, unfortunately, comes more expensive retail spaces and taxes are going up.

There is a charm and real-ness to San Antonio I hope we don’t lose in the process. San Antonio is a non-materialistic town; people aren’t looking at your shoes or what kind of car you drive. When I leave San Antonio, it’s that real-ness that brings me back, every time. I left LA, and I left Austin because I got so tired of the trendy-ness. We’re growing fast, we’re drawing an eclectic market that will support artists. However, there will be a compromise. I don’t want to see it get too uptight.”

–Robert Tatum

Pittsburgh is Rust Belt Chic Paris. San Antonio is Rasquache Paris. When Richey Piiparinen and I were in San Antonio to do fieldwork, we were both struck by the Rust Belt Chic qualities of the city. At the time, we weren't familiar with rasquache. We are now. I see a lot of similarities between Pittsburgh and San Antonio, particularly the way both places are under-appreciated. They enjoy a cult following. Hopefully, neither one will become the next Austin or Portland.

Rasquache is further along, much further, than Rust Belt Chic. In fact, Rust Belt Chic is rasquache:

This called to mind a passage I’d read in Have You Seen Marie? It’s an unusual book for a writer whose work has been at turns bawdy, avant-garde, and politically trenchant. Entirely autobiographical, Marie is a short, illustrated story with a childlike tone about Cisneros searching the streets of King William for a friend’s lost cat while mourning the loss of her mother, who died in 2010. I read Cisneros the passage I’d thought of: “ ‘King William has the off-beat beauty of a rasquache, and this is what’s uniquely gorgeous about San Antonio as a whole.’ ”

She smiled. “Rasquache is when you make or repair things with whatever you have at hand. You don’t go to Home Depot. If you have a hole in your roof, you put a hubcap on there. Or you fix your fence with some rope. That’s rasquache. And then there’s ‘high rasquache,’ which is a term the art critic Tomás Ybarra-Frausto coined. He lives here. Danny Lozano knew high rasquache. He’d serve you Church’s fried chicken on beautiful porcelain and use Lalique crystal for flowers he’d cut from an empty lot.”

“And that was one of the qualities that drew you to King William?”

“Not just King William but San Antonio. A kind of elegance of found things. San Antonio has that soul. It’s not, ‘We gotta copy what we saw in New York.’ No! It’s going to come out of our own idea of what we think is beautiful.” She stared at me as if to make sure I understood. “But that’s also what’s getting lost. People feel like the city’s got to look like someplace else. Our mayor needs a stylist. He thinks he has to dress like a Republican. Pues, he’s Chicano! He’s got this gorgeous indigenous look, and he would look so cool if Agosto Cuellar, one of our local designers, dressed him, or someone like Franco, or Danny, or John Phillip Santos—he dresses totally San Antonio cool. He should do a style column for Texas Monthly.”

I allowed that Santos, who is a regular contributor to this magazine, does have singular style (the last time I saw him, in December, he was wearing a horsehair charro tie and ringneck python boots) but joked that there might be a preponderance of leather pants in his fashion advice. Cisneros waved the joke aside.

“Our problem is that we can’t recognize or celebrate what we have. We have this inferiority complex in Texas that we have to look elsewhere. Well, who knows more about inferiority than Chicanos? We grew up being ashamed because the history that is taught to us makes us ashamed. The whole colonial experience surrounding the Alamo is meant to make you feel ashamed.”

In writer Sandra Cisneros, I sense a kindred spirit. As a Rust Belt native, Erie no less, I felt ashamed. I come from failure. I have no culture worth celebrating. Anywhere else must be better. That's why we leave. Brain drain.

I, too, was drawn to King William while in San Antonio. It is New Orleans (creole) and Pittsburgh (parochial). It's like nothing I've experienced before. I get that boom town vibe of a place that is cool before anyone knows it is cool:

Russell has seen what’s coming before. “When the buzz starts – when San Antonio embraces the brain gain, goes in the right direction on the talent economy and hipsters start to get wise to the neighborhood assets that are here – once the hipsters get wind of it – you’ll have to beat them away with a stick,” he said.

I think that's the concern of Robert Tatum. About a year ago, such a notion was unfathomable to Cleveland. What will the compromise with gentrification look like in Ohio City? Will somebody utter the words, "He dresses totally Cleveland cool"?

Danny Lozano knew high rasquache. He’d serve you Church’s fried chicken on beautiful porcelain and use Lalique crystal for flowers he’d cut from an empty lot.

Rust Belt Chic is served.

Jim Russell is a talent geographer with particular interest in the Rust Belt. Read his blog at Burgh Diaspora, where this piece originally appeared.

The Sound and the Fury In Chicago

$
0
0

The Second City syndrome is alive and well. An anti-Chicago essay masquerading as a book review in the New York Times provides the latest example of the truth of that.  Rachel Shteir, a former New Yorker now living in Chicago, notes the various ills in the Windy City that should come as a surprise to no one, least of all residents:

“Poor Chicago,” a friend of mine recently said. Given the number of urban apocalypses here, I couldn’t tell which problem she was referring to. Was it the Cubs never winning? The abominable weather? Meter parking costing more than anywhere else in America — up to $6.50 an hour — with the money flowing to a private company, thanks to the ex-mayor Richard M. Daley’s shortsighted 2008 deal? Or was it the fact that in 2012, of the largest American cities, Chicago had the second-highest murder rate and the ­second-highest combined sales tax, as well as the ninth-highest metro foreclosure rate in the country? That it’s the third-most racially segregated city and is located in the state with the most underfunded public-employee pension debt? Was my friend talking about how a real estate investor bought The Chicago Tribune and drove it into bankruptcy? Or how 15-year-old Hadiya Pendleton, who performed at Barack Obama’s inauguration, was shot dead near the president’s Kenwood home?"

Illustrating the rule that criticizing Chicago is something that is Simply Not Done, this piece sent locals into collective apoplexy. Huffington Post Chicago provides a roundup of the “epic backlash.”  The Atlantic Cities chimes in with its own roundup of “Everything You Need to Know About Why Chicago Is Furious With Rachel Shteir and The New York Times,” noting that “We don't have to wait for the angry letters to be printed in the next Book Review. The counter-manifestos are already here! In the past few days, it seems, everyone from Gary to Milwaukee has read Shteir's ‘Chicago Manuals’ piece, resulting in a groundswell of angry rebuttals.” An army of angry tweeters spoke out.  And even the mayor addressed the issue. Not a bad day’s work for a theater professor at Depaul (Shteir’s day job).

In a sense Shteir is right. I’ve long noticed that Chicago is basically an echo chamber of boosterism in which everyone is terrorized about deviating from the party line lest they be excommunicated from polite company, a fate that may well indeed await Shteir. And Chicago clearly has manifest problems as a city, many of which she notes, though many of her list such as the perennial disappointment of Cubs fans are clearly more snark than substance.

However, what Shteir and Chicago both miss is the real value proposition of the city. Taken on its own terms, Chicago is a simply fantastic place to live. It has a magnificent lakefront setting, a stunning skyline, fantastic cultural institutions, incredible opportunities to consume (from designer clothing to world class dining), and much more. It may be true that these great things largely benefit those from more affluent precincts with vast tracts of the city left behind in segregated, entrenched poverty, but it’s tough to name a place where that isn’t likewise true. Much of Brooklyn, for example, remains mired in poverty, but no one in New York seems to care and criticisms of it as such are simply shrugged off.

Chicago also has perhaps – at least in my view – the best blend of the best of the elite urban center with much of the best of cities further down the food chain. You can have genuinely walkable neighborhoods, take transit to work, and eat food that would be impressive in any city in the world while simultaneously having a spacious and affordable condo with parking that allows you to drive to a conveniently located Target or Costco to stock up when you need to. It’s car oriented when you need it and walkable when you need it, all at a reasonable price. Now that’s certainly something that many cities lower down in the hierarchy will also claim – big city amenities with a high quality of life. But Chicago is the most elite city in America that can plausibly make that claim.

What Chicago is not, despite its pretensions, a truly global tier one city like New York, London, or Paris. That is what the booster culture can’t abide. It is an article of faith that every Chicagoan must believe, or at least pretend to believe, that Chicago is worthy of being spoken of in the same breath as any city in the world. Even a critic like Shteir seems to evaluate it on that basis.

But the reality is that Chicago is a “1B” city like Frankfurt or Toronto not a “1A” city. There’s nothing wrong with that. In fact, I happen to believe Chicago’s value proposition is arguably better than most of the 1A cities for everyone who isn’t in the 0.1%. But both local boosters and critics can’t look at Chicago for what it is, but rather what it isn’t and never will be. Chicago will never be New York. But neither will New York ever match the best of Chicago on the Windy City’s own terms with a comparable quality/price/ease mix.

In this sense, Chicago might be seen as the leader of a wave of other emerging would be 1A cities – Houston, Dallas, San Diego – that are making the cut from a second tier city. Being the leader and something of a role model for a wave of rising cities may not be bad positioning at all.

Aaron M. Renn is an independent writer on urban affairs and the founder of Telestrian, a data analysis and mapping tool. He writes at The Urbanophile.

Photo by Doug Siefken.

Job Dispersion in Major US Metropolitan Areas: 1960-2010

$
0
0

The continuing dispersion of employment in the nation's major metropolitan areas has received attention in two recent reports. The Brookings Institution has published research showing that employment dispersion continued between 2000 and 2010, finding job growth was greater outside a three mile radius from central business districts between 2000 and 2010 in 100 metropolitan areas Note 1). This assessment probably underestimates the extent of job dispersion, since it includes some suburban centers as central business districts (such as West Palm Beach, FL and Palo Alto, CA).

Recently I showed that employment dispersion has reached a point that there is a virtual balance of jobs and housing in suburban areas, which contrasts with the continuing excess of jobs in core municipalities relative to resident workers. After that article was published, Richard L. Forstall forwarded me research he presented to the Southern Demographic Association in the 1990s that examined employment trends in core municipalities and suburban areas between 1960 and 2010. At the time, Forstall was at the United States Bureau of the Census. He also spent years supervising Rand McNally international metropolitan area population estimates (Note 2).

Major Metropolitan Job Dispersion: 1950 to 2010 and

Forstall provides detailed information for the 35 major metropolitan areas as of 1990 (over 1,000,000 population). This article augments the Forstall research with data from the 2010 census (Note 3).

Consistent with both national and international trends, the half century between 1960 and 2010 indicated significant dispersion in metropolitan areas. This, of course, was a continuation of a trend that accelerated from the first quarter of the 19th century, when early mass transit systems allowed people to live in larger spaces, farther away from their work.

The movement of residents from the urban core to the suburbs followed the even greater exodus from small towns and rural areas. But it was not long before residents of the homogeneous bedroom suburbs of the 1950s began to find more nearby employment opportunities.

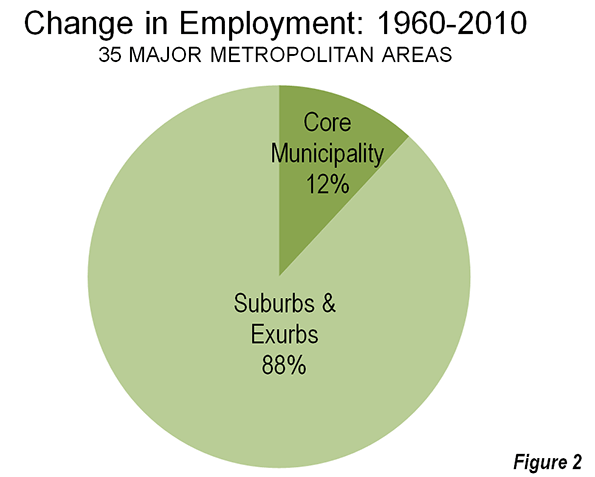
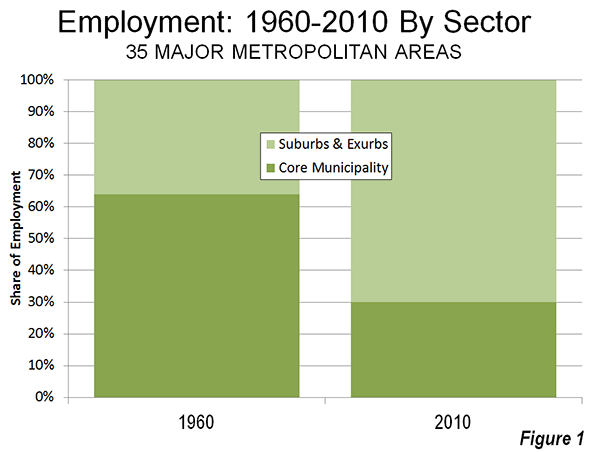
In 1960, 54% of the employment in the 35 major metropolitan areas was in the historical core municipalities, with the balance of 46% of the jobs in suburban and exurban areas. By 2010, the corner municipality share had dropped to 30%, while suburban and exurban areas contained 70% of the employment (Figure 1). Between 1960 and 2010, 88% of the new jobs were in the suburbs and exurbs, leaving only 12% of the growth in the core municipalities (Figure 2).

Dispersion Greater in Metropolitan Areas with Pre-War Non-Suburban Cores

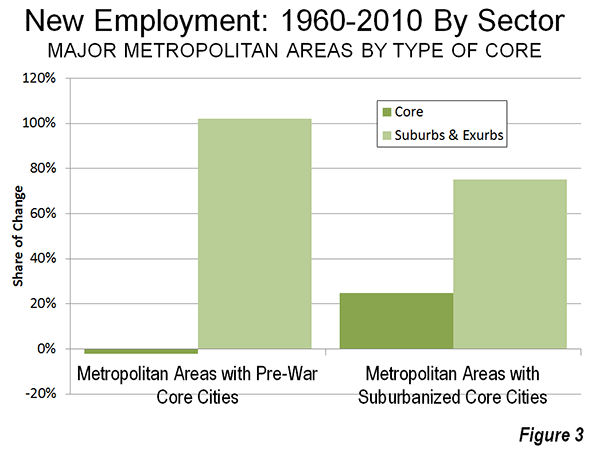
However, even this distribution appears to mask an even greater dispersion. Among the metropolitan areas with "Pre-war non-suburban core municipalities," (such as San Francisco, Baltimore, Providence, New York, etc.) a full 102% of job growth was in suburban and exurban areas. Core city employment accounted for a minus two percent of employment growth (in other words, it declined). These are metropolitan areas with core cities that were virtually fully developed before World War II and which have added little to their land areas by annexation.

The other metropolitan areas have core cities with large swaths of suburbanization and some, like Phoenix and Sacramento are virtually all suburban. In these metropolitan areas, approximately 25% of the job growth since 1960 has been in the core cities (Figure 3).

Pre-War Non-Suburban Core Municipalities Losses and Gains

Among the 18 metropolitan areas with "Prewar non-suburban" core municipalities, two thirds experienced losses in their core cities. The Rust Belt "ground zero" core cities of Detroit, Cleveland, and Buffalo all lost 40 percent or more of their employment, and were joined by second tier Rust Belter St. Louis. The core city of Pittsburgh, typically one of the Rust Belt's big four, did much better, losing only five percent of its employment. Across the state, however, the core city of Philadelphia did much worse, dropping 23 percent of its employment. The core city of Chicago lost 20 percent of its employment.

Perhaps most notable was the core city of Hartford, which lost 9 percent of its employment between 1960 and 2010. According to data in the Brookings Institution Global Metro Monitor, Hartford has emerged as the world's most affluent major metropolitan area (measured by gross domestic product per capita) over the same period. All of Hartford's job growth was in the suburbs and exurbs.

The core city of New York did the best among the metropolitan areas with "Pre-War non-suburban" cores, attracting 16 percent of the employment growth over the half-century. Washington (DC) also did well, with a 12 percent share of new employment.

Urban Dispersion and the Quality of Life

The dispersed metropolitan area, along with its comprehensive roadway networks, has served the US well, especially in two important measures of the quality of life --- housing affordability and mobility. Major metropolitan areas in the United States have some of the most affordable housing in the high-income world. The US has shorter work trip travel times than Canada or Western Europe and much shorter than the major metropolitan areas of Japan (with the most comprehensive rail systems in the world) and East Asia.

This advantage was reiterated with the recent release of the Tom Tom Congestion Index, which showed traffic congestion in the metropolitan areas of Australia and New Zealand to be far worse than in US metropolitan areas of similar size. For example, Sydney is as congested as Los Angeles, despite having only one-third the population. Auckland (New Zealand) has worse traffic congestion than any US metropolitan area of similar size.

Peter Gordon and Harry W. Richardson spotted this advantage nearly two decades ago (See Are Compact Cities a Desirable Planning Goal?), before there was international traffic congestion comparison data. Based upon their review of national travel surveys, they concluded:

Suburbanization has been the dominant and successful mechanism for reducing congestion. It has shifted road and highway demand to less congested routes and away from core areas.

Wendell Cox is a Visiting Professor, Conservatoire National des Arts et Metiers, Paris and the author of “War on the Dream: How Anti-Sprawl Policy Threatens the Quality of Life.

-------

Note 1: The Brookings Institution report indicates that employment within a 3 mile radius of downtown (the central business district) increased in number and share only in the Washington, DC metropolitan area. However, this may not indicate an increase in central business district (downtown) employment. The large, nearby, but suburban employment centers of Rosslyn, Crystal City and downtown Alexandria may be located within the three mile radius (the report does not indicate the point from which the radius is drawn). The three mile radius used in the report is useful and represents the best reported data. However, it may not be representative of central business district employment encloses a huge area (28 square miles), which is more than 25 times the typical central business district geographical size and larger than the land areas of the core cities of Providence and Hartford and nearly two-thirds the size of the core city of San Francisco. Transit commuting to such nearby employment centers is routinely far lower than the share that ride transit to downtown.

Note 2: Forstall is co-author (with Richard P. Greene and James B. Pick of seminal research that estimated the population densities of the largest metropolitan areas in the world (Which Are the Largest: Why Lists of Metropolitan Areas Vary So Greatly). Normally, metropolitan area densities cannot be validly compared because of widely varying criteria between nations. Further, in the United States, metropolitan area densities are nonsensical, because their building blocks vary in size too much. With its County-based definitions, US metropolitan areas include building blocks ranging from half the size of Orlando's Walt Disney World (New York County, or Manhattan borough) to the size of the nation of Costa Rica (San Bernardino County). The use of such a crude building block results in the inclusion of huge amounts of rural territory that is outside the labor market or the commuting shed (metropolitan areas are typically defined as labor markets). Forstall and his coauthors applied criteria that was both consistent and rational. This exhaustive process limited the number of metropolitan areas for which they were able to make estimates to 28.

Note 3: This analysis differs from Forstall's approach in defining core cities using the historical core municipality classification. It should be noted that there have been changes in metropolitan definitions over the 50 years.

Photo: Suburban employment in Chicago (by author)

Visions of the Rust Belt Future (Part 1)

$
0
0

“Men often applaud an imitation and hiss the real thing”--Aesop

There are interesting developments being played out in the Rust Belt. Some cities, like Detroit, seem to be embarking whole hog down the creative class path. Others, like Pittsburgh, have their own thing going on, a thing Economic Geographer Jim Russell has delineated as the “Rust Belt Chic” model of economic development, with no modest amount of success. How a given Rust Belt city reinvests will have a large say in its future.

Part 1 of this series, below, examines the nascent creative classification of Detroit. Part 2 analyzes whether or not there is a new way forward for post-industrial cities, using the lessons from Pittsburgh and Cleveland as the building blocks to developing an alternative set of strategies for struggling cities.

Detroit Rock (Ventures) City

In Detroit, the scene is playing out as such: rampant disinvestment in the core and extreme poverty around it. To help fix this, ties between Rock Ventures head and real estate billionaire Dan Gilbert, urbanist Richard Florida, and the non-profit Project for Public Spaces have been initiated. The goal, laudable enough, is to reinvest in downtown. And while the renewal formula planned is not new, the extent that the milieu is a controlled environment for an urban experiment is perhaps ahistorical, if only because Detroit’s level of disinvestment has created a vacuum that, naturally, power abhors.

To wit, a recent New York Time’s article entitled “A Missionary’s Quest to Remake Motor City” hints at the level Dan Gilbert—who  has bought $1 billion in downtown property in what has been called a “skyscraper sale”—and his advisors have been handed the keys:

“My job,” said Dave Bing, the Detroit mayor and former National Basketball Association star, “is to knock down as many barriers as possible and get out of the way.”

And:

“Mr. Gilbert met in a conference room for his twice-a-month Detroit real estate meeting, with about a dozen people who work for him, plus a lawyer and leasing agent. If Detroit 2.0, as this group often calls the effort, has a planning committee, this is it.”

And:

“[H]e and his staff will apparently have a largely free hand.”

Now, the plan, and how the plan for Detroit’s future came about.

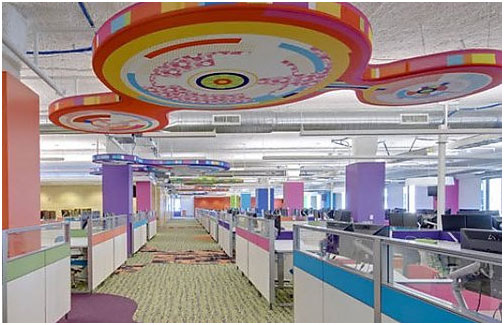
A wealthy investor, Dan Gilbert, buys downtown properties. That investor goes on the record as to the importance of reinvesting into the urban core. That investor moves his mortgage company’s employees from suburban office parks into his own downtown real estate. Then, the investor, taking cues from his consultants, throws in something about innovation, which, at its lowest common denominator, means designing your way to a “culture of innovation”. Thus, the investor encourages that Romper Room-style office setting complete with what some would say is tacky décor wholly out of line with the soul of “the D”, but yet which is said to fun-birth inspiration—i.e., “[A] karaoke machine sat in an aisle. Guys threw footballs to one another; one employee shot at colleagues with a Nerf gun”; and “A Quicken promotional video solidifies the company's attempts at over-the-top marketing, prominently featuring the space's inexplicable Pac-Man theme”—despite the fact that your primary product line, i.e., mortgages,  needs far less innovation than it does a modicum of conventionality and ethics. Nonetheless, the sentiment of creative destruction is there.


This basic process, then, is multiplied out from the office setting into strategic urban space, particularly around Gilbert’s real estate. The idea here is to design space so as to create vibrancy so as to galvanize commerce so as to ignite broad economic growth.

Enter the partnership with the Project for Public Spaces, who is working with Gilbert’s group to do a set of “Lighter, Quicker, Cheaper” placemaking interventions, including pop-up shops. The conceptual girth behind the plan, according to a recent article“Detroit Leads the Way on Place-Centered Revitalization”, is described as such:

“We proposed developing a Placemaking vision for the major public spaces, and refining the plan through the Power of 10 concept,” says Meg Walker, a Vice President at PPS who worked on the project. “…A lot of developers aren’t as enlightened as Dan Gilbert…they wouldn’t necessarily think about the glue that’s holding this all together.”

“The Power of 10 framework suggests that a great city needs at least ten great districts, each with at least ten great places, which in turn each have at least ten things to do. Great public spaces produce an energy and enthusiasm that spills over into surrounding areas…

With the conceptual description as a guide, this is a classic case of the urbanists’ version of trickled-down economics, in which an influx of capital into finite corridors is meant to attract wealth that “spills over” into surrounding areas. Unfortunately, there is little by way of evidence that this works, as was recently admitted by Richard Florida himself. What it may do, however, is fill real estate supply by pursuing a select target market, as placemaking can act as a grease to create pockets of creative class demand to support condos or retail and office space. And while one can certainly argue it beats rampant core disinvestment, it’s not the path of a bold new way that will measurably change the trajectory of Detroit, so says U of M Professor Michael Gordon. In effect, it’s simply shifting people from one set of real estate to another, with nothing undertaken on a systemic level to tackle Detroit’s real problem: poverty and disenfranchisement in its neighborhoods. Worse, re-urbanization as such is likely to exacerbate class and race divides that have plagued Detroit for decades, thus worsening Detroit’s real problem: poverty and disenfranchisement in its neighborhoods.

Besides, we have been here before. Michigan via its Cool Cities campaign had a plan based off the same Detroit 2.0 premise, switch out the window dressing. Design place, accrue vibrancy, growth wealth. Obviously, the multi-million dollar economic development initiative didn’t work. Neither have similar initiatives across the whole of the Rust Belt.

So, where’s the beef? What makes Detroit 2.0 different?  

Naturally, this is where the economic development buzzwords “start-up” and “tech district enter into the Detroit 2.0 lexicon; that is, creating dense city areas will nurture spontaneous interactions that will foster Detroit’s innovation community, putting it firmly on the path to be the “Silicon Valley of the Midwest”. But every city wants this (or at least they are informed they do)—e.g., “Miami Wants to Be the Next Big Start-Up City”—and so the effort ultimately comes off as anything but visionary, rather visionless, trying.

Cue the Onion. From an article entitled “St. Louis Mayor Has Sad Little Plan For Turning City Into High-Tech Hub”:

In what appears to be a completely earnest attempt to revitalize a sluggish local economy, St. Louis mayor Francis G. Slay unveiled Thursday a detailed, ambitious, and truly depressing plan to turn his city into a major technology hub. “We’re going to show America, and the rest of world, just how innovative and cutting-edge St. Louis can be,” said the mayor, who displayed genuine optimism as he outlined a desperate strategy to woo major players in the high-tech sector with a sad little series of subsidies and tax incentives his city cannot afford… The mayor ended his presentation by pleading with reporters to dub the hopelessly untenable project “St. Louis 2.0.”

In all, the current Detroit economic development approach is copycat urbanism at its finest, as there is nothing inherently “Detroit” about it. Nothing that intrinsically builds off its only true competitive advantage: itself.

For instance, Motor City is Motor City for a reason: it builds things. It designs things. Like, for instance, cars, which, by last count, are still being used, with over 254 million registered passenger vehicles in the US in 2009 alone. And while technology-based automation is increasing manufacturing output at the expense of jobs, production is still huge business in the Rust Belt, with automotive-related STEM jobs (i.e., science, technology, engineering and mathematics-related employment)—i.e., the creative class before the “creative class” became the “creative class”)—aiding Detroit’s regional resurgence, with its 10.5% STEM job growth leading the country from 2010 to 2012. And no, this is not to say Detroit will recoup manufacturing jobs lost from its heyday. But it’s absurd for Detroit to neglect training and flexing its muscle—or its legacy of concept, design, and production—for a future with no middle between start-ups and baristas. I mean, advanced manufacturing isn’t nostalgia. It exists.


So, why this path? Why pretty Detroit? Why make it culturally less distinct? Why embark on a plan of hyper-modern ephemerality when your distinction is resilience, making things, and hard work? Why? Where is the evidence that this even works? What in the hell is even going on here?

To get to the bottom of this you need to be aware of parallel events in Cleveland. There, Dan Gilbert has hands in that city’s Downtown redevelopment as well. But it is not what you think. And therein lies the problem.

You see, if the Detroit Dan Gilbert is the urbanists’ Dr. Jekyll than in Cleveland he becomes the anti-urban Mr. Hyde. In fact, the Cleveland Dan literally embarks on nearly all the urbanists’ seven deadly sins, including owning and running a casino placed right beside the city’s iconic Public Square, demolishing historic buildings for the creation of a VIP valet center, planning to ruin the iconic Terminal Tower by connecting an enclosed pedestrian tunnel from a parking garage into its face—the Plain Dealer architecture critic stated it was akin to “poking a straw in Mona Lisa’s nose”—and, more generally, pissing off Millennials.

From a recent Atlantic Cities piece entitled “If Other Cities Are Demolishing Skywalks, Why Does Cleveland Want a New One?”, the author, who omits Dan Gilbert’s name, writes:

“In the last decades of the 20th century, many American cities built skywalks in a desperate attempt to seem modern, hoping to create a sanitized urban experience that would compete with the sanitized suburban experience of indoor malls.

For the most part, it didn’t work, and now cities…are tearing down the skywalks…in an effort to return pedestrian life and vitality to the street.

Meanwhile, in Cleveland, the owners of the year-old Horseshoe Casino downtown are planning to build a brand-new skywalk…For many of the young people moving to Cleveland in search of a 21st-century urban experience – pedestrian-friendly, with lots of people out and about – it seems like a step backward in time.”


Why is Gilbert going all anti-urban in Cleveland, then? In a word: money, as Moody’s just issued a report saying a walkway would help the casino reach predicted income streams, as it has been underperforming. Obviously casino ownership is a no frills money-making operation, as is real estate. With each: immediate financial return trumps the nurturing of human and community capital to support a vision of long-term economic growth.

But Detroit Dan is different, right? He is a walkability guru’s guru. One of the “enlightened developers” as was stated above.

Well, you be the judge. Here’s a blog post excerpt covering the recent Placemaking Leadership Council hosted in Detroit, with Detroit 2.0 taking center stage.

Dan Gilbert, head of Rock Ventures and Quicken Loans, genuinely seemed to defer to Kent [the Project for Public Spaces head] when it came to his part of the presentation Thursday. Gilbert, who has millions of hours of public-speaking practice behind him, often turned to Kent to fill in the details on the upcoming renovations to Campus Martius, Cadillac Square, Capitol Park, Grand Circus Park and Paradise Valley.

“Genuinely seemed to defer” is right. Or just bored as hell.

And then there is this. This. Courtesy of a Curbed Detroit blog post called “Development In Downtown Detroit Is Playing Out Like A Huff Po Blog Post From 2009”. The referenced Huffington Post piece is by Detroiter Toby Barlow that is called “How a Billionaire Can Make a Billion Dollars”. The strategy? Buy Detroit, not “metaphorically” but “literally”, yet do it “very quietly, so as not to inflate any prices”. Then, according to Barlow, since a billionaire owns thing, he moves his employees to his buildings and gives them “incentives to live down near their work so that they'll buy your residential property”. Barlow concludes:

So, I don't have to spell out the rest, do I? Real estate values will quickly soar as other companies, encouraged by your brazen move, make similar leaps into what will still be an incredibly affordable market. The momentum will build as the ever-frenzied media piles on.

Yes, Detroit’s plan for the future pre-dated by a Huff Po blog entry from 2009.

The big revelation here?

Look, in the end, the Dan Gilbert’s of the world are in their line of work for one reason and one reason only: to make money. They will don whatever mask they need to play the part, be it the urban-loving Jekyll or the anti-urban Hyde. That’s the problem with creative class urbanism. It is dependent on developers who could care less. It is a means to an end for those who implement it.

Too bad this end is not the beginning of a true path forward for a real Rust Belt recovery.

Detroiters, like most Rust Belters, have been through enough. They deserve better.

Richey Piiparinen is a writer and policy researcher based in Cleveland. He is co-editor of Rust Belt Chic: The Cleveland Anthology. Read more from him at his blog and at Rust Belt Chic.

Class Warfare for Republicans

$
0
0

As a Truman-style Democrat left politically homeless, I am often asked about the future of the Republican Party. Some Republicans want to push racial buttons on issues like immigration, or try to stop their political slide on gay marriage, which will steepen as younger people replace older people in the voting booth. Others think pure market-oriented principles will, somehow, win the day. Ron Paul did best among younger Republican voters in the primaries.

Yes, ideas do matter, but a simple defense of free markets is not likely to have broad-enough appeal. What Republicans need is a transformative issue that can attract a mass base – and that issue is class.

Of course, the whole idea of appealing to class may be repellant to most libertarian-conservative or country-club remnants of the Republican Party. Yet, it's the issue of the day, as President Obama recognized when he went after patrician Mitt Romney. It also may be the issue Obama now most wants to avoid, which explains his current focus on secondary issues like gun control and gay marriage.

For their part, Republicans need to make Obama own the class issue since his record is fairly indefensible. The fortunes of the middle quintiles of Americans have been eroding pretty much since Obama took office in 2009.

There's nothing fundamentally unRepublican about class warfare. After all, the party – led by what was then called Radical Republicans – waged a very successful war against the old slave-holding aristocracy; there's nothing to be ashamed of in that conquest. Republicans under Abraham Lincoln also pushed for greater landownership through such things as the Homestead Act, which supplied 160 acres of federal land to aspiring settlers.

No one expects the Republicans to turn socialist, but they can reap benefits from anger over the crony capitalism that has become emblematic of the Obama era. Wall Street and its more popular West Coast counterparts, the venture capital "community," consistently game the political system and, usually, succeed. They win, but everyone else pretty much has to content themselves with keeping up with the IRS.

This is where the opportunity lies. Republican opposition to Wall Street is already evident in the rise of Texas Republican Rep. Jeb Hensarling to the chairmanship of the House Banking Committee. He and Iowa GOP Sen. Charles Grassley's attack on "too big to fail" banks are a stark contrast to the likes of New York Democratic Sen. Charles Schumer, the Capitol consigliere of the Wall Street oligarchs, or the prince of gentry liberals and defender of billionaires everywhere, New York City Mayor Michael "luxury city" Bloomberg.

Who's angry and ready to raise their raise their pitchforks? Try the self-employed, who are now, according to Gallup, the large constituency most alienated from the present regime. Even the hapless Romney picked up their support against Obama.

The new core constituency of the GOP can best be identified as the enterprise base. They include small property owners, mainly in the suburbs, those who are married or aspiring to be so. They are more suburban than urban, and likely to work for someone else or themselves as opposed to working for the state. Combine the top half of private employees, over 50 million people, add some 10 million self-employed and you get to a serious economic, and political, base.

This group also includes many immigrants, particularly Asians, a constituency that should be tilting GOP but still isn't. They, too, increasingly live in the suburbs, own homes as well as business. And rarely do they benefit from the prevailing crony capitalism.

The enterprise base is by nature not ideologically rigid. Most, if you talk to them, would generally support sensible infrastructure improvement as well as repairs; they also tilt towards restrained taxation and a lighter regulatory hold. It's a movement for "Let's get this fixed and get on with our lives."

This new orientation would define the Republicans where they are strongest and the administration weakest – on the economy. The new wedge issues must be for a "level playing field" for entrepreneurs and the middle class and definitely not social issues, like opposition to gay rights, or support for old and new unwise wars.

An enterprise approach, and a focus on restarting real growth, could put the Democrats on their heels and worrying about their own base. Minorities, for example, have done far worse under this administration than virtually any in recent history, including that of George W. Bush. For many, this has been what the Fiscal Times has called "a food stamp recovery."

Among Obama's loyalist core, African Americans, unemployment now stands at the highest level in decades; blacks, while 12 percent of the nation's population, account for 21 percent of the nation's jobless. The picture is particularly dire in Los Angeles and Las Vegas, where black unemployment is nearly 20 percent, and Detroit, where's it's over 25 percent.

Of course, Republicans have their work cut out for them among African-Americans. But remember that Barack Obama will not be on any future ballots. A return to what Ishmael Reed has called "neo-classical" Republicanism – the same spirit that freed the slaves and fought for equal rights – could make some inroads.

Latinos, the other major part of the party's "downstairs" coalition, also have fared badly under Obama and could be even more amenable to a smarter GOP message. They have seen their incomes drop 4 percent over the past three years, and suffer unemployment two full points above the national average. Overall, the gap in net worth of minority households compared with whites is greater today than in 2005. White households lost 16 percent in recent years, but African-Americans dropped 53 percent and Latinos a staggering 66 percent of their precrash wealth.

But the most critical potential constituency may prove the millennial generation, who hitherto have been a strong constituency for both the president and his party. They continue to suffer the most of any age cohort in this persistently weak economy. Already, the first wave of millennials are hitting their thirties and may be getting restless about being permanent members of "Generation Rent."

Let's say, in two or four years, they are still finding opportunity lagging? Cliff Zukin at Rutgers John J. Heidrich Center for Workforce Development, predicts that many will "be permanently depressed and will be on a lower path of income for probably all their [lives]." One has to wonder if even the college-educated may want to see an economy where their educations count for more than a job at Starbucks. Remember: Baby boomers, too, once tilted to the left, but moved to the center-right starting with Ronald Reagan and have remained that way.

Yet, despite these threats, Democrats may still be rescued by perennially misfiring Republicans. There's no Stu Spencer, Michael Deaver or Peter Hannaford on the blue team to plot strategy. Missteps remain endemic: A group of North Carolina Republicans recently proposed a measure to establish Christianity as the state religion, only to blocked by the state's leadership.

Others think opposing gay marriage is the ticket to revival, even though public opinion, particularly among the young, is swinging in the other direction. Some 70 percent of millennials – people in their early thirties and younger – support gay marriage, twice the rate of those over 50. Social conservatives are also gearing up on the abortion issue even though three in five Americans, according to the latest Pew survey, oppose overturning Roe v. Wade. North Dakota could be showing that America can work, literally and figuratively, but instead the state passes abortion laws that are among the strictest in the country.

Yet, there's still hope that some Republicans will recognize this opportunity. I would like to see this, in part, because I have seen one-party politics in action here in California, and it doesn't work. Even more so, I'd like to see Republicans wage class warfare on behalf of the "enterprise" constituency because Democrats then would have to offer something in response, which could only have good consequences for the rest of us.

Joel Kotkin is executive editor of NewGeography.com and a distinguished presidential fellow in urban futures at Chapman University, and a member of the editorial board of the Orange County Register. He is author of The City: A Global History and The Next Hundred Million: America in 2050. His most recent study, The Rise of Postfamilialism, has been widely discussed and distributed internationally. He lives in Los Angeles, CA.

This piece originally appeared in the Orange County Register.

Lincoln Memorial photo by Bigstock.

The Triumph of Suburbia

$
0
0

The “silver lining” in our five-years-and-running Great Recession, we’re told, is that Americans have finally taken heed of their betters and are finally rejecting the empty allure of suburban space and returning to the urban core.

“We’ve reached the limits of suburban development,” HUD Secretary Shaun Donovan declared in 2010. “People are beginning to vote with their feet and come back to the central cities.” Ed Glaeser’s Triumph of the City and Alan Ehrenhalt’s The Great Inversion—widely praised and accepted by the highest echelons of academia, press, business, and government—have advanced much the same claim, and just last week a report on jobs during the downturn garnered headlines like “City Centers in U.S. Gain Share of Jobs as Suburbs Lose.”

There’s just one problem with this narrative: none of it is true. A funny thing happened on the way to the long-trumpeted triumph of the city: the suburbs not only survived but have begun to regain their allure as Americans have continued aspiring to single-family homes.

Read the actual Brookings report that led to the “Suburbs Lose” headline: it shows that in 91 of America’s 100 biggest metro areas, the share of jobs located within three miles of downtown declined over the 2000s. Only Washington, D.C., saw significant growth.

To be sure, our ongoing Great Recession slowed the rate of outward expansion but it didn’t stop it—and it certainly didn’t lead to a jobs boom in the urban core.

“Absent policy changes as the economy starts to gain steam,” report author and urban booster Elizabeth Kneebone warned Bloomberg, “there’s every reason to believe that trend [of what she calls “jobs sprawl”] will continue.”

The Hate Affair With Suburbia

Suburbs have never been popular with the chattering classes, whose members tend to cluster in a handful of denser, urban communities—and who tend to assume that place shapes behavior, so that if others are pushed to live in these communities they will also behave in a more enlightened fashion, like the chatterers. This is a fallacy with a long pedigree in planning circles, going back to the housing projects of the 1940s, which were built in no small part on the evidently absurd, and eventually discredited, assumption that if the poor had the same sort of housing stock as the rich, they would behave in the same ways.

Today’s planning class has adopted what I call a retro-urbanist position, essentially identifying city life with the dense, highly centralized and transit-dependent form that emerged with the industrial revolution. When the city—a protean form that is always changing, and usually expands as it grows—takes a different form, they simply can’t see it as urban growth.

In his masterwork A Planet of Cities, NYU economist Solly Angel explains that virtually all major cities in the U.S. and the world grow outward and become less dense in the process. Suburbs are expanding relative to urban cores in every one of the world’s 28 megacities, including New York and Los Angeles.  Far from a perversion of urbanism, Angel suggests, this is the process by which cities have grown since men first established them.

In the U.S., the hate affair with suburbs and single-family housing, even in the city, dates to their rapid growth in the American boom after the first World War. In 1921 historian and literary criticic Lewis Mumford described the expansion of New York’s outer boroughs as a “dissolute landscape,” “a no-man’s land which was neither town or country.” Decades later, Robert Caro described the new rows of small, mostly attached houses—still the heart of the city’s housing stock—built in the post-war years as “blossoming hideously” as New Yorkers fled venerable, and congested, parts of Brooklyn and Manhattan for more spacious, tree-lined streets farther east, south, and north.

In the 1950s, the rise of mass-produced suburbs like Levittown, New York, and Lakewood, California, sparked even more extreme criticism. Not everyone benefited from the innovation that allowed the Levitts to pioneer homes costing on average just $8,000—African-Americans were excluded from the original development—but for many middle- and working-class American whites, the housing and suburban booms represented an enormous step forward. The new low-cost suburbia, wrote Robert Bruegmann in his compact history of sprawl, “provided the surest way to obtain some of the privacy, mobility and choice that once were available only to the wealthiest and most powerful members of society.”

The urban gentry and intelligentsia, though, disdained this voluntary migration. Perhaps the most bitter critic was the great urbanist Jane Jacobs. An aficionado of the old, highly diverse urban districts of Manhattan, Jacobs not only hated trendsetter Los Angeles but dismissed the bedroom communities of Queens and Staten Island with the memorable phrase, “The Great Blight of Dullness.” The 1960s social critic William Whyte, who, unlike Jacobs, at least bothered to study suburbs close up, denounced them as hopelessly conformist and stultifying. Like many later critics, he predicted in Fortune that people and companies would tire of them and return to the city core.

More recent critiques of suburbia have focused as well on their alleged vulnerability in an energy-constrained era. “The American way of life—which is now virtually synonymous with suburbia—can only run on reliable supplies of cheap oil and gas,” declares James Howard Kunstler in his 2005 peak oil jeremiad, The Long Emergency.“Even mild to moderate deviations in either price or supply will crush our economy and make the logistics of daily life impossible.”

Too often, the anti-surbanites seem to take a certain perverse comfort in any development, no matter how grim, that “helps” protect Americans from the “wrong choice” of aspiring to space of their own. The housing crash of 2007 was cheered on in some circles as the death knell of the suburban dream, as when theorist Chris Leinberger declared in the Atlantic that soon, poor families would be crowding into dilapidated McMansions in the “suburban wastelands.

For retro-urbanists such as Richard Florida the reports, however premature, of the death of the suburbs, confirmed deeply held notions about the superiority of dense, urban living.  He summarily declared the single-family house archaic, and the quest for homeownership one of the “countless forms of over-consumption that have a horribly distorting affect on the economy."

The Real Geography of America

But the simple fact remains that the single-family home has remained the American dream, with sales outpacing those of condominiums  and co-ops despite the downturn.

Florida has suggested that simply stating the numbers makes me a sprawl lover While he and other urban nostalgists see the city only in its dense urban core, and the city’s role as intimately tied with the amenities that are supposed to attract the relatively wealthy members of the so-called “creative class,” I see the urban form as ever changing, and consider a city’s primary mission not aesthetic or simply economic but to serve the interests and aspirations of all of its residents.

Clearly the data supports a long-term preference for suburbs. Even as some core cities rebounded from the nadir of the 1970s, the suburban share of overall share of growth in America’s 51 major metropolitan areas (those with populations  of at least one million) has accelerated—rising from 85 percent in the ’90s to 91 percent in the ’00s. There’s more than a tinge of elitism animating the urban theorists who think that urban destiny rides mostly with the remaining nine percent matters. Overall, over 70 percent of residents in the major metropolitan areas now live in suburbs.

Surveys, including those sponsored by the National Association of Realtors, suggest roughly 80 percent of Americans prefer a single family house to an apartment or a townhouse. Only 8 percent would prefer to live in an apartment. Yet just 70 percent of households live in a single-family house, while 17 percent live in apartments—suggesting the demand for single-family houses is still not being met. Such housing may be unaffordable, particularly in high-cost urban cores, but there is a fundamental market demand for it.

To be sure, the Great Recession did slow the growth of suburbs and particularly exurbs—but recent indicators suggest a resurgence. An analysis last October by Jed Kolko, chief economist at the real estate website Trulia, reports that between 2011 and 2012 less-dense-than-average ZIP codes grew at double the rate of more-dense-than-average ZIP codes in the 50 largest metropolitan areas. Americans, he wrote, “still love the suburbs.”

The Future Demographics of Suburbia

Ultimately the question of growth revolves around the preferences of consumers. Despite predictions that the rise of singles, an aging population and the changing preferences of millennials will create a glut of 22 million unwanted large-lot homes by 2025, it seems more likely that three critical groups will fuel demand for more suburban housing.

Between 2000 and 2011, there has been a net increase of 9.3 million in the foreign born population, largely from Asia and Latin America, with these newcomers accounting for about two out of every five new residents of the nation’s 51 largest metropolitan areas. And these immigrants show a growing preference for more “suburbanized” cities such as Nashville, Charlotte, Houston and Dallas-Fort Worth. An analysis of census data shows only New York—with nearly four times the population—drew (barely) more foreign-born arrivals over the past decade than sprawling Houston. Overwhelmingly suburban Riverside–San Bernardino expanded its immigrant population by nearly three times as many people as the much larger and denser Los Angeles–Orange County metropolitan area.

Clearly, immigrants aren’t looking for the density and crowding of Mexico City, Seoul, Shanghai, or Mumbai. Since 2000, about two-thirds of Hispanic household growth was in detached housing. The share of Asian arrivals in detached housing is up 20 percent over the same span. Nearly half of all Hispanics and Asians now live in single-family homes, even in traditionally urban places like New York City, according to the census’s American Community Survey.

Nowhere are these changes more marked than among Asians, who now make up the nation’s largest wave of new immigrants. Over the last decade, the Asian population in suburbs grew by about 2.8 million, or 53 percent, while that of core cities grew by 770,000, or 28 percent.

Aging boomers, too, continue to show a preference for space, despite the persistent urban legend that they will migrate back to the core city. Again, the numbers tell a very different story.

A National Association of Realtors survey last year of buyers over 65 found that the vast majority looked for suburban homes. Of the remaining seniors, only one in 10 looked for a place in the city—less than the share that wanted a rural home. When demographer Wendell Cox examined the cohort that was 54 to 65 in 2000 to see where they were a decade later, the share that lived in the suburbs was stable, while many had left the city—the real growth was people moving to the countryside. Within metropolitan areas, more than 99 percent of the increase in population among people aged 65 and over between 2000 and 2010 was in low-density counties with less than 2,500 people per square mile.

With the over-65 population expected to double by 2050, making it by far America’s fastest-growing age group, they appear poised to be a significant source of demand for suburban housing.

But arguably the most critical element to future housing demand is the rising millennial generation. It has been widely asserted by retro-urbanists that young people prefer urban living. Urban theorists such as Peter Katz have maintained that millennials (the generation born after 1983) have little interest in “returning to the cul-de-sacs of their teenage years.” 

To bolster their assertions, retro-urbanist point to stated-preference research showing that more than three quarters of millennials say they“want to live in urban cores.” But looking at where millenials actually live now—and where they see themselves living in the future—shows a very different story. In the nation's major metropolitan areas, only 8 percent of residents aged 20 to 24 (the only millennial adult age group for which census data is available) live in the highest-density counties—and that share has declined from a decade earlier. What’s more, 43 percent of millenials describe the suburbs as their “ideal place to live”—a greater share than their older peers—and 82 percent of adult millenials say it’s “important” to them to have an opportunity to own their home.

And, of course, as people get older and take on commitments and start families, they tend to look for more settled, and less dense, environments. A 2009 Pew study found that 45 percent of Americans 18 to 34 would like to live in New York City, compared with just 14 percent of those over 35. As about 7 million more millenials—a group the Pew surveys show desire children and place a premium on being good parents—hit their 30s by 2020, expect their remaining attachment to the city to wane.

This family connection has always eluded the retro-urbanists. “Suburbs,” Jane Jacobs once wrote, “must be difficult places to raise children.” Yet suburbs have served for three generation now as the nation’s nurseries. Jacobs’s treatment of the old core city—particularly her Greenwich Village in the early 1960s—lovingly portrayed these places as they once were, characterized by class, age, and some ethnic diversity along with strong parental networks, often based on ethnic solidarity.

To say the least, this is not what characterizes Greenwich Village or in Manhattan today. In fact, many of the most vibrant, and high-priced urban cores—including Manhattan, San Francisco, Chicago, and Seattle—have remarkably few children living there. Certainly, the the 300-square-foot “micro-units” now all the rage among the retro-urbanist set seem unlikely to attract more families, or even married couples.

The Persistence of the Suburban Economy

As Americans have voted with their feet for the suburbs, employers have followed.

Despite the attention heaped on a handful of companies like United Airlines and Quicken Loans that have moved “back to the city,” the suburbanization of the overall American economy has continued apace. Historically, suburbs served largely as residential areas, so-called bedroom communities, but their share of steadily.

Job dispersion is now a reality in virtually every metropolitan area, with twice as many jobs located 10 miles from city centers as in those centers. Between 1998 and 2006, as 95 out of 98 metro areas saw a decrease in the share of jobs located within three miles of downtown, according to a Brookings report. The outermost parts of these metro areas saw employment increase by 17 percent, compared to a gain of less than 1 percent in the urban core. Overall, the report found, only 21 percent of employees in the top 98 metros in America live within three miles of the center of their city.

This decentralization of jobs was slowed somewhat by the Great Recession, which hit more dispersed industries like construction, manufacturing and retail particularly hard. Yet an analysis of jobs in 2010 by the Rudin Center for Transport Policy and Management found that dispersion had continued. Between 2002 and 2010 only two of the top 10 metropolitan regions (New York and San Francisco) saw a significant increase in employment in their urban core.

Some observers claim that job growth is coming to the urban core in response to the changing preferences of younger workers, particularly in high-tech fields and as much media attention has been given to a few prominent social media start ups in New York and San Francisco. Similar pronouncements were  made during the great dot-com boom of the late 1990s, and burst along with the bubble. In fact, the number of urban core country tech jobs actually shrank over the past decade, according to an analysis of Science, Technology, Engineering and Management (STEM) jobs by Praxis Strategy Group.

While companies in walking distance of big-city reporters make news out of all proportion to their importance, virtually all the major tech concentrations in the country—including Silicon Valley—are suburban. San Jose is a postwar suburban core municipality, having experienced the vast bulk of its growth since 1940. Virtually all the nation’s top tech companies—Apple, Google, Hewlett-Packard, Intel, Oracle and even Facebook—are located in suburban settings 45 minutes or more from San Francisco. Apple’s recent plans to construct its new corporate campus in bucolic Cupertino elicited anger from the Environment Defense Fund and other smart-growth advocates, but reflects the fact that the vast majority of the tech industry is located, along with the bulk of its workforce, in the suburbs.

Apple employs many experienced engineers, many of whom have families and prefer to live in suburbs. In 2012 San Francisco had a significantly lower share of STEM jobs per capita than Santa Clara County. And the new rising stars of the tech world—Austin and Raleigh-Cary—are even more dispersed and car-dependent than San Jose. 

What Really Matters

While they’ve weaved a compelling narrative, the numbers make it clear that the retro-urbanists only chance of prevailing is a disaster, say if the dynamics associated with the Great Recession—a rise in renting, declining home ownership and plunging birthrates—become our new, ongoing normal. Left to their own devices, Americans will continue to make the “wrong” choices about how to live.

And in the end, it boils down to where people choose to live. Despite the dystopian portrays of suburbs, suburbanites seem to win the argument over place and geography, with far higher percentages rating their communities as “excellent” compared to urban core dwellers.

Today’s suburban families, it should be stressed, are hardly replicas of 1950s normality; as Stephanie Coontz has noted, that period was itself an anomaly. But however they are constituted—as blended families, ones headed up by single parents or gay couples—they still tend to congregate in these kinds of dispersed cities, or in the suburban hinterlands of traditional cities. Ultimately life style, affordability and preference seem to trump social views when people decide where they would like to live.

We already see these preferences establishing themselves, again, among   Generation X and even millennials as some move, according to The New York Times,toward “hipsturbia,” with former Brooklynites migrating to places along the Hudson River. The Times, as could be expected, drew a picture of hipsters “re-creating urban core life” in the suburbs. While it may be seems incomprehensible to the paper’s Manhattan-centric world view by moving out, these new suburbanites are opting not to re-create the high-density city but to leave it for single-family homes, lawns, good schools, and spacious environments—things rarely available in places such as Brooklyn except to the very wealthiest. Like the original settlers of places like Levittown, they migrated to suburbia from the urban core as they get married, start families and otherwise find themselves staked in life. In an insightful critique, the New York Observerskewered the pretensions of these new suburbanites, pointing out that “despite their tattoos and gluten-free baked goods and their farm-to-table restaurants, they are following in the exact same footsteps as their forebears.”

So, rather than the “back to the cities” movement that’s been heralded for decades but never arrived, we’ve gone “back to the future,” as people age and arrive in America and opt for updated versions of the same lifestyle that have drawn previous generations to the much detested yet still-thriving peripheries of the metropolis.

Joel Kotkin is executive editor of NewGeography.com and a distinguished presidential fellow in urban futures at Chapman University, and a member of the editorial board of the Orange County Register. He is author of The City: A Global History and The Next Hundred Million: America in 2050. His most recent study, The Rise of Postfamilialism, has been widely discussed and distributed internationally. He lives in Los Angeles, CA.

This piece originally appeared in the The Daily Beast.

Suburbs photo by BigStock.


Enterprising States 2013: Getting Down to Small Business

$
0
0

The following is an exerpt form a new report, Enterprising States, released this week by the U.S. Chamber of Commerce Foundation and written by Praxis Strategy Group and Joel Kotkin. Visit this site to download the full pdf version of the report, or check the interactive dashboard to see how your state ranks in economic performance and in the five policy areas studied in the report.

Nothing better expresses America’s aspirational ideal than the notion of small enterprise as the primary creator of jobs and innovation. Small businesses, defined as companies with fewer than 500 employees, have traditionally driven our economy, particularly after recessions. Yet today, in a manner not seen since the 1950s, the very relevance and vitality of our startup culture is under assault. For the country and the states, this is a matter of the utmost urgency.

The central motor of the job engine clearly is not firing on all cylinders. Historically, small business has accounted for almost two-thirds of all net new job creation, but recent research shows that the rates of new business startups are at record lows. The “gazelle companies”—fast-growing firms, mostly younger ones—have traditionally made outsized contributions to new job creation. After previous recessions, these businesses drove job growth and, perhaps more important, created innovations that often spread to larger, older, more established firms, which sometimes later acquired them.

Weak job growth has touched the entire economy. Gross domestic product growth is weak, unemployment remains at nearly 8%, and business sentiment is far from optimal. Despite high stock prices and consistently strong corporate profits, the rate of employment growth remains lower than the rate of the expansion of the workforce. Given the understandable focus of larger firms on boosting productivity and on investing capital into technology, it’s highly unlikely these companies will create enough jobs to dent our huge and growing employment deficit.

Policymakers ignore small business at their own peril and that of the economy.

The Changing Nature of Small Business

Small business may be down, but it is far from out. There have been some small, subtle upward shifts in employment in three of the industries—construction, manufacturing, and retail—that bore the brunt of the recession-driven job losses. Any sustained uptick in growth will further widen the opportunities for small business to expand and perhaps recover something of its past vigor.

It is critical that states and communities that embrace a pro-enterprise vision address a rapidly changing small business environment. Small business today reflects a host of ethnic, social, and generational changes. Successful programs will need to adapt to these new realities that reflect a far more diverse, and profoundly different, set of players.

Immigrants constitute a growing and important part of the entrepreneurial landscape. Even in the midst of the recession, newcomers continued to form businesses at a record rate. The number of women-owned firms has grown at one and a half times the rate of other small enterprises over the past 15 years. These companies now account for almost 30% of all enterprises. Finally, there is the issue of generational change. Baby boomers were, on the whole, a profoundly entrepreneurial generation, and by many measurements their Generation X successors have proven even more so. The millennial generation, based on recent assessments, may be somewhat less entrepreneurial than their predecessors.

We are also witnessing the rise of a new kind of enterprise that often employs no more than the proprietors but frequently provides quite sophisticated high-level products or services. In many cases, these “jobless entrepreneurs” include corporate executives, technicians, and marketing professionals who, by either choice or necessity, have chosen to strike out in their own micro-enterprises. A large portion of this growing “1099 economy” comes from the growing ranks of boomers who are no longer willing or able to work for a larger enterprise. According to the Census Bureau, small business without payroll makes up more than 70% of America’s 27 million companies, with annual sales of $887 billion.

The States Get Down to Small Business

Every state has policies and programs that are intended to encourage entrepreneurship and support small business development and expansion. Many states have introduced legislation or established programs to focus on startup companies, and many states have bolstered policies targeted at helping existing businesses grow and expand their markets. State funding of programs for entrepreneurial development is estimated to have increased by 30% between 2012 and 2013.  

States vary considerably in the policies, regulations, and taxes that affect small business. Most states have an array of loosely integrated small business programs, although some have a more comprehensive, integrated small business policy and program framework. No state has the “best” tax policy for all entrepreneurs. Instead, different states have tax policies that suit certain types of companies better than others. Consequently, the states that are best for new businesses are not always the most favorable for existing small businesses; the states that are best for one business sector may not be best for another.

States and cities should consider small business development not as a separate cause, but as a basic building block for economic growth. Even if state governments can do little to promote enterprise and small business development directly, there are things they can do to increase the chances that entrepreneurs will thrive. Smart, pragmatic economic policymaking at the state level can play an instrumental role in fostering startups and growing companies, particularly when programs are effectively deployed right where the businesses are located.

The following are some new and innovative policy and program approaches that states are employing and/or supporting to create and expand small businesses, often in cooperation with local and regional development organizations:

  • Accelerator initiatives that focus on starting high-growth firms by turning startups into enduring companies.
  • Economic gardening initiatives that focus on expanding existing firms with strong growth potential.
  • Business plan competitions to identify companies with exciting ideas and high potential.
  • Business ecosystem initiatives, often with a regional focus, that take a comprehensive approach to creating an environment that is highly conducive to startups.
  • Workforce development initiatives that help small businesses find and train the talent they need to operate and compete.
  • Seed and venture funds that focus on startups and expanding firms.
  • Networking and collaboration initiatives that bring small businesses and self-employed entrepreneurs together with large companies and universities.
  • International trade programs that help small businesses reach out to new global export markets.
  • Streamlined state administrative processes and regulatory procedures for small business by cleaning up the DURT (delays, uncertainty, regulations, taxes) that impede small business success.
  • Broadband investments that provide small businesses of all types with the online access necessary in the 21st century.

Governors of states recognize the importance of small businesses and often take the lead in reforming state policy and service delivery to make growth and commerce easier for small business. Governors can offer fast-track access to financial resources and a full slate of state services that help small businesses connect with technical expertise, customers, suppliers, and state agencies that interact with small business as regulators or partners in development.

State and local chambers of commerce are on the front lines of promoting a pro-business free enterprise agenda and thwarting anti-business legislation, regulations, and rules. Across the country, chambers of commerce lead the way in advocating on behalf of their members for lower costs of doing business, fairer taxes, fairer regulations, and less regulatory paperwork. They work with the U.S. Chamber of Commerce, governors, industry, and professional associations to pursue outcomes that are beneficial to all businesses and, thereby, advance America’s free enterprise economy.

Visit this site to download the full pdf version of the report, or check the interactive dashboard to see how your state ranks in economic performance and in the five policy areas studied in the report.

Praxis Strategy Group is an economic research, analysis, and strategic planning firm. Joel Kotkin is executive editor of NewGeography.com and author of The Next Hundred Million: America in 2050.

Bank Collapse in Cyprus: Which Way Now?

$
0
0

Having run out of options to solve its bigger problems, European Union commissioners, in the spirit of famed bank robber Willy Sutton, have decided to go after depositors’ money on Cyprus for a simple reason: “That’s where the money is.” Will the current shake down of bank depositors on Cyprus save or sink the Euro? It stretches the imagination to fathom how putting bank depositors in play will comfort European Union bondholders or other EU banks.

In exchange for $13 billion in bailout money for the Cyprus government, the EU has demanded that the local banking system, bloated with offshore deposits including many from Russia and Eastern Europe, pony up in the interests of Euro harmony.

An island divided into Greek and Turkish spheres of influence, Cyprus was allowed into the EU, and later the Euro, as an early attempt to gloss over European ethnic fault lines and pump hot money into the sovereign debts of Greece and East European countries. Greek Cyprus is the tax haven of choice for Russian companies and oligarchs, many of whom register their worldwide assets under Cypriot holding companies and maintain huge deposits in the local banking system.

Before the recent crisis, the Cypriot banking system held assets in its banks and fiduciary companies that amounted to more than five times the country’s gross domestic product.

Business as usual in Cyprus meant that, with few questions asked locally, an overseas investor — including many from Serbia, Romania, and the Ukraine, as well as Russia—could set up a front company, open a bank account, and run his or her financial empire away from the long arm of any government accountants.

The problem for the Cypriot banks wasn’t attracting deposits, it was finding a place to put them once they arrived by SWIFT (the international transfer system), the Fed Wire, or suitcases.

Confusing their swelling balance sheets with the genius of J.P. Morgan, local bankers made several fatal mistakes. They lent their newfound money to the Greek government by buying its bonds, they invested in now-failing real estate deals, and they funded these long-term bets with deposits that could be withdrawn in less than ninety days.

In justifying these strategies to clients, the Cyprus banks claimed that their long positions in Greek government bonds, denominated in Euros, came with an implicit EU guarantee, which also served as a reason to pay minimum rates on short-term deposits, and to bet the ranch on long-term Euro bonds. The Euro gave Cyprus cover for punting.

In the era of the Greek drachma, German leader Angela Merkel would not have delayed a hair appointment to keep Greece solvent, let alone to save its lovechild in Nicosia, a Balkan money-changing city hard up against the border of the Turkish mercenary state in northern Cyprus. Still, even today, the Cypriot pyramid might have withstood the lazy stress test of a buoyant market.

The first Cyprus rescue plan called for the island’s bank depositors (whose deposits totaled $82 billion at the peak) to cough up 10% of their wealth into the stabilization fund. That financial haircut, however, called also for a 7% trim from local clients, not just a shave for Russian oligarchs. Local Cypriots voted with their middle fingers.

Although the inspiration to drain local bank accounts to offset subsidies from Brussels was attributed to EU bureaucrats, if not Merkel and French President François Hollande, the impulse for an open season on passbook savings comes from the worldwide assault on tax havens, led by the United States.

In its search for money to balance it own mismatched accounts, the US has taken the position that the dollar, instead of an international commodity or method of exchange, is a national loyalty oath, and is imposing tax obligations on those that have some in their wallets. Even though the EU is more a tariff union than a functioning government, Brussels has warmed to the idea that bank depositors within its fragile borders are fair game for a fleecing.

The revised Cyprus plan walked back from skimming all bank deposits, and shook down the depositors only of the two largest banks, the Bank of Cyprus and Laiki (Cyprus Popular) Bank. It demanded the sale of $500 million in the central bank's gold, unsettling financial markets.

While the heist was in the planning stage, all Cypriot banks were closed, to keep the hot money from turning into flight capital, once removed.

The Bank of Cyprus will survive, barely, although Laiki is going belly up, which through the magic of bankruptcy laws will put its €24 billion in deposits at the disposal not just of local liquidators but also of EU “structural reformists,” who have more in common with Butch Cassidy and the Sundance Kid than with International Monetary Fund economists.

The biggest losers are the Cyprus banks’ shareholders, bondholders, and depositors, who are being bled dry so that the Euro might live. Think of these write-downs as a pan-European tax, assessed mostly on shady front companies that don’t vote in German regional elections. Russian President Vladimir Putin isn’t thrilled that his offshore economy was chosen to make the world safe for par-value Spanish bonds.

As a consequence, bank depositors will flee not just failing Mediterranean banks, but those in Milan, London, and Frankfurt. They will seek safety in gold, real estate, art, stock markets, and hedge funds, leaving money-center banks down the road to scramble for their liabilities (in the accounting world, deposits are something you owe).

The bigger problem with the Cypriot financial collapse of 2013, though, is that it threatens to turn the EU into a divided nation — not unlike Cyprus itself — that may need to balance its books with offshore money and lax accounting.

More than the crises of Italian elections or French unemployment, the Cyprus bank run threatens to pull apart the rickety architecture of a union that can no longer roll over its Eurobonds on what Willy Loman used: “a smile and a shoeshine.” Because of bad balance sheets in Cyprus, as well as in Spain, Italy, Ireland, and Greece, bondholders are no longer “smiling back” at the EU.

German Chancellor Otto von Bismarck said in the late nineteenth century that “some damn thing in the Balkans” might drag Russia into war with Austria-Hungary, or with his Prussian confederation. In that instance, the murder of an Austrian archduke in Sarajevo shattered Europe into fragments that lasted for most of the twentieth century, a division that the EU and its Euro were designed to glue together.

When the dust settles on Cyprus, the losers will be the local economy — headed for a double-digit recession — and Europe’s bank depositors, who in theory should be the backbone of a successful economic union.

Matthew Stevenson, a contributing editor of Harper's Magazine, is the author of Remembering the Twentieth Century Limited, a collection of historical travel essays. His next book is Whistle-Stopping America.
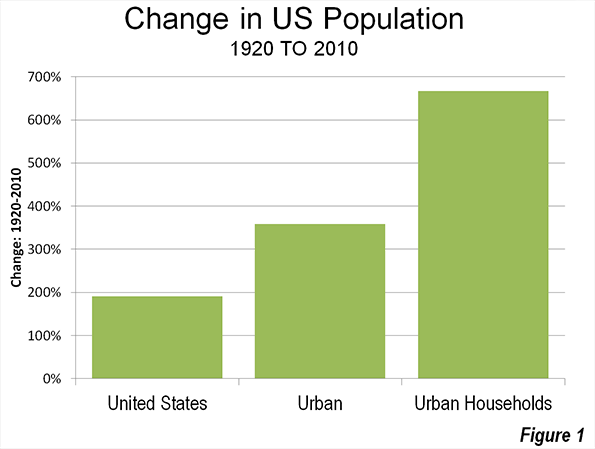
Flickr photo by Leonid Mamchenkov taken in Limassol, Cyprus.

Observations on Urbanization: 1920-2010

$
0
0

Ninety years have made a world of difference in the United States. Between 1920 and 2010, the nation's population nearly tripled. But that was not the most important development. Two other trends played a huge role in shaping the United States we know today. The first trend was increasing urbanization, a virtually universal trend, but one which occurred earlier in the high income countries, while the other was a rapidly falling average household size. 

National Trends

In 1920, the United States had just crossed the same 50 percent urbanization threshold that China recently crossed. By 2000, the United States was 81 percent urban. 

The second trend was even more significant. Average household size has fallen from 4.6 in 1920 to 2.6 by 2000, where it remained in the 2010 census. The result is that there are now 7.7 times as many households (Note 1) in urban areas as there were in 1920 (Figure 1).

Urban Area Trends

In the 1960s, the Urban Land Institute sponsored research by Jerome P. Pickard (Note 2) to replicate urban area population and density data going back to 1920, using the generalized criteria that had been developed by the Census Bureau for the 1950 and 1960 censuses.

According to Pickard's work, there were five urban areas in the United States with more than 1 million population in 1920. Unfortunately, the publication did not include Detroit, which undoubtedly had an urban area population of more than 1 million in 1920 (Note 3). In addition, Pickard found nine urban areas with populations between 500,000 and 1 million.

By contrast, today there are 42 urban areas with more than 1 million population and 38 with between 500,000 and 1 million population.

In 1920, the five major urban areas for which there is data had an overall population density of 8,400 per square mile (3,700 per square kilometer). This figure dropped continually, except for between 1940 and 1950 as to its present level (Figure 2) of approximately 3,100 per square mile (1,200 per square kilometer).

However, caution is required, because before 2000, urban areas generally contained only complete municipalities. Two of the nation's major urban areas had substantial rural (greenfield) expenses inside their core cities in 1920. This was most pronounced in the core city of New York, where most of Queens and most of Staten Island were undeveloped. Between 1920 and 2010, these two boroughs added more than 1.8 million population, most of which was on greenfield land, rather than the densification of the existing urban neighborhoods. This was in effect, suburban expansion within the city of New York. The same dynamics occurred, to a lesser degree in core cities such as Philadelphia and Los Angeles.


Pickard finds a population density of 10,600 per square mile (4,100 per square kilometer) for the New York urban area in 1920. It had fallen by half to 5,300 per square mile (2,050 per square kilometer) by 2010.

Core City and Suburban Growth

Over the period, the bulk of the population growth (92 percent) was in the suburbs (Figure 3). Even that figure, however, understates the extent of suburban growth. As was above, the inclusion of rural areas as urban in municipalities appears to have been a major driver of the population increase in the city of New York, which added 2.4 million people between 1920 and 2010. Among the other five major urban areas, which includes an estimate for Detroit (Note 2), the core municipalities lost population in each case over the 90 years, though they all continued to grow at least until 1950.

All of the six major urban areas in 1920 were in the Northeast or the Midwest. The fastest growing urban area from 1920 to 2010 among the six was Detroit, despite the huge losses of its core municipality (Figure 4). No municipality in the world of Detroit's 1950 size (1.85 million) has lost so much of its population (1.1 million) in all of history. Yet, the Detroit urban area is estimated to have added approximately 2.6 million people to its urban area population since 1920, for an approximately 240 percent increase in population. The Detroit urban area peaked in 2000 at 160,000 higher than in 2010. The second fastest growing larger urban area was Chicago, at approximately 175 percent, while Philadelphia gained 146 percent and Boston 142 percent.

Urban Areas with 500,000 to 1,000,000 Population in 1920

The nine urban areas with 500,000 to 1,000,000 population in 1920 had a much lower population density, at 7,200 per square mile (2,800 per square kilometer). This figure, however, is artificially low because of the Los Angeles urban area's extremely small 1920 density (1,700 per square mile or 650 per square kilometer). Just a few years before the 1920 census, Los Angeles had annexed the San Fernando Valley and other largely rural areas. As a result the city quadrupled in land area. Again, the inclusion of rural areas in the core city rendered Pickard's urban area (and that of the Census Bureau to at least in 1950) unreflective of actual urban densities in Los Angeles.

Milwaukee: More Dense than New York

The Milwaukee urban area, with a population of 504,000 had the highest density in the nation, at 10,900 per square mile (4,200 per square kilometer), which was the last time before 1990 that the New York urban area was not the most dense major urban area. In 1990, the Los Angeles area became more dense than  the New York urban area. By 2000, both the San Francisco and the all-suburban San Jose urban area had also passed New York,

Falling Densities and Causes

The population density declines were substantial over the period, at from 63 percent to 70 percent. At the same time, falling household sizes created the requirement for more houses and household densities fell at a slower rate, 37 percent in the largest areas and 50 percent in the smaller metropolitan areas. There were other factors as well, such as more efficient manufacturing and commercial operations, that took more space, urban planning requirements in some metropolitan areas (such as Boston and Atlanta) that required larger than market  building lots (large lot zoning)and the general preference for more land and space on the part of consumers. The US has not been alone in this. The trend toward lower densities has been virtually universal, from Mumbai and Manila to Moscow and Milan.


Wendell Cox is a Visiting Professor, Conservatoire National des Arts et Metiers, Paris and the author of “War on the Dream: How Anti-Sprawl Policy Threatens the Quality of Life.

----

Note 1: Assumes the same average household size for urban and rural areas.

Note 2: Jerome P. Pickard, Dimensions of Metropolitanism, Urban Land Institute, 1967.

Note 3: In 1920, the municipality of Detroit had a population of 993,000 and a population density of 12,700 per square mile (4,900 per square kilometer). Wayne County, which includes Detroit, had a population of 1,170,000. The land area of the county was approximately nine times that of the municipality, nearly all of it rural. On that basis it is estimated that the urban area would have had no more than 1,100,000 residents.

Photo: New York in the 1920s (Singer Building in foreground, Woolworth Building in the background). Photograph by the U.S. Census Bureau, Public Information Office (PIO).

The Myth of Green Australia

$
0
0

Having collected the Nobel peace prize in 2007, Al Gore’s fortunes as a climate crusader slid into the doldrums.  But 8th November 2011 arrived as a ray of sunshine. On that day Australia’s parliament passed into law the world’s first economy-wide carbon tax. Rushing to his blog, Gore posted a short but rapturous statement, cross-posted in The Huffington Post. His fervent language echoed in progressive circles across the globe. Australians have been held-up as pioneering environmentalists ever since, putting Americans to shame.

“This is a historic moment”, thundered Gore. “With this vote”, he blogged, “the world … turned a pivotal corner in the collective effort to solve the climate crisis”. He proclaimed it “the result of tireless work of an unprecedented coalition that came together to support the legislation”; he praised the “leadership of Prime Minister [Julia] Gillard and the courage of legislators”; and he declared “the voice of the people of Australia has rung loud and clear”.

But maybe Gore’s enthusiasm was a bit misplaced. In September, less than two years later,   Australians seem likely, according to the polls, to hand the Gillard Labor government a stinging landslide defeat.     

“A pivotal corner in the collective effort”

As it turns out, and not for the first time, Gore’s analysis was wrong. For one thing, calling the carbon tax “pivotal” is pure hyperbole. Although a relatively large land mass, Australia is populated by just 23 million people who collectively emit a minuscule 1.5 per cent of the world’s greenhouse gases. Nor is the country influential in a broader political union or association beyond its borders.  Since climate change alarmists suggest that global emissions must fall by 25 to 40 per cent in 2020 compared to 1990 levels, Australia’s efforts must be seen as more symbolic than effective.    Currently, the tax and its post-2015 form as an emissions trading scheme (ETS) are adjusted for a trivial 5 per cent cut from 2000 levels in 2020; 5 percent of 1.5 percent of the world’s emissions barely registers against a few days increase in countries like China.   

Environmentalists maintain that the important thing is not results, but setting a moral example of climate action. They argue Australia’s emissions may be tiny in absolute terms, but amongst the highest in per capita terms. Major emitters like the US, China, India and the EU, they argue, can be shamed into action by Australia’s noble sacrifice. Unfortunately for them, this argument, not very strong to being with, deflated like a punctured balloon since the shambles at Copenhagen.

We’ve been here before. In December 2009 Australia’s newly minted Labor Prime Minister, Kevin Rudd, with a bulging entourage of 114 officials, descended on the Copenhagen conference to negotiate a successor to the Kyoto Protocol. He was awarded the task of preparing a draft negotiating text. Rudd played an active role in the lead up, having signed Kyoto and undertaken to legislate for an ETS in his first term, a serious step given Australia’s status as the world’s leading coal exporter. Before flying out to Denmark, he introduced the necessary bills into parliament for a second time.

Copenhagen was a test of the ‘noble sacrifice’ argument driving Rudd’s activism but resulted in an epic fail. Rudd’s draft text was tossed aside and the conference collapsed into bickering between delegations from the developed and developing worlds. There was no successor to Kyoto, just a flimsy, non-binding accord the delegates “took note of” but didn’t adopt. Greenpeace called Copenhagen “a crime scene”.    

The UN’s Framework Convention on Climate Change has stayed off the rails ever since. Later Conferences of the Parties (COPs) at Cancun and Durban did little more than kick the can down the road. Durban opened twenty days after the “historic moment” of Australia’s carbon tax, but delegates deferred all talk of a binding agreement to 2015, anticipating a possible start in 2020. Canada pulled the plug on Kyoto altogether, later followed by Japan and Russia. “This empty shell of a plan leaves the planet hurtling towards catastrophic climate change”, huffed Friends of the Earth.

Under the non-binding Copenhagen Accord, parties were invited to submit emission reduction “pledges”, and most have done so. Even if achieved, though, they get the world nowhere near 25 to 40 per cent reductions on 1990 levels in 2020. Writing in Nature, analysts from the Potsdam Institute of Climate Impacts dismiss them as “paltry”. Amid rising emissions, Australia’s “pivotal” carbon tax is but a straw in the wind.

“An unprecedented coalition that came together”

At the end of 2009, Rudd’s ETS was rejected by parliament a second time, due in part from rising doubts about the climate agenda. As 2010 progressed, his popularity waned, battered by his inept handling of the contentious mining tax. Labor colleagues bristled at his secretive and high-handed manner, while powerful union bosses resented his indifference to their concerns. Taking advantage of drooping opinion polls, Rudd was sacked and replaced with Deputy Prime Minister Julia Gillard.

This sent shockwaves through the country, which had never seen a sitting prime minister dumped in his first term. Fearing a backlash, Gillard hastily called an election for 21st August, hoping to exploit positive feelings around serving as Australia’s first female leader. She proved a poor campaigner, however, and a series of damaging leaks scuttled her efforts. Labor’s support faded and on election night Gillard was left with 72 seats, four short of a majority in the 150 seat House of Representatives. The Liberal-National opposition ended up with 73 seats, also short of a majority. The balance of power was in the hands of one Greens Party member and four independents.

After weeks of negotiations, the Greens and three of the independents pledged support for a Labor Government under Gillard, the first minority government since the 1940s.  But it became increasingly clear that a fresh election would produce a solid Liberal-National Party majority. Returning to the people for a new mandate was never in Gillard’s interests. As for the Greens and independents, fortune delivered them more power than they ever had or would ever have again. Making the most of their time in the sun, they opted for Gillard, who wasn’t about to call another election. Gillard’s coalition may be “unprecedented”, in Al Gore’s words, but it’s untrue that they “came together to support” high principle. They were thrown together by electoral chance and stuck together out of grim self-interest.

“Leadership of Prime Minister Gillard and the courage of legislators”

After the second rejection of his ETS, Rudd shelved the policy indefinitely, to the dismay of the world’s environmentalists. The inner circle which advised him to take this course, according to later revelations, included Julia Gillard. On becoming prime minister she showed little enthusiasm for the climate cause, ruling out a price on carbon unless there was “a deep and abiding community consensus”. Her tokenistic policy at the 2010 election was “citizen’s assembly” to canvass options. The opposition also ruled out a price on carbon. Twice in the lead up to polling day, Gillard explicitly denied rumours of a hidden agenda, uttering the now infamous words “there will be no carbon tax under the government I lead”.

Gillard entered the post-election negotiations desperately hoping to save her prime ministership.  The radical Greens would never have backed the conservative opposition. But when they demanded a carbon tax as the price of their support, she caved in a fit of panic, displaying little of the courage praised by Gore. The independents signed on to keep the minority government in business.

Labor’s Clean Energy Future package includes a carbon tax, but also billions of dollars of compensation and credits to cushion the blow. In a massive money churn, around $5 billion of the revenue is disbursed to households in higher benefits and tax breaks, and $9.2 billion goes to industry assistance, including free permits for high emitting industries, $300 million to the steel industry, $1.26 billion to the coal sector, and $1.2 billion to manufacturing. Unhappy about these handouts, the Greens were bought off with a $10 billion Clean Energy Finance Corporation. Australians are left wondering how all of this encourages shifts to “cleaner” energy sources. The handouts muffle some damaging impacts of the tax, but they are hardly “courageous” from the perspective of Al Gore.

“The voice of the people of Australia has rung loud and clear”

Gillard made her plans for a carbon tax public on 25th February 2011. Her residual popularity sank like a stone. The Newspoll of 18-20 February 2011 recorded 50 per cent satisfied and 39 per cent dissatisfied with her performance. In the next survey of 4-6 March 2011, those figures were reversed: 39 per cent satisfied, 51 per cent dissatisfied. Labor’s support (first preference) plunged to 30 per cent in the March survey, from 38 per cent at the election. These results were consistent with a general fall in support for climate action. From a high of 68 per cent in 2006, reported the Lowy Institute Poll, it dropped to 41 per cent in 2011. Only 32 per cent of Australians supported the carbon tax when Gore wrote his rapturous blog post.    

Gillard’s frantic attempts to recover have come to nothing, and calling an election for 14th September hasn’t helped. The latest Newspoll of 5-7 April 2013 had her satisfaction rating at a dismal 28 per cent, with 62 per cent dissatisfied. Labor’s support is still in the basement at 32 per cent, with the Liberal-Nationals at 48 per cent. Likely, the government faces a devastating loss of around 20 seats.  

The opposition’s implacable campaign against the carbon tax has rocked Gillard’s time in office. They promise to repeal it, dismantle much of the Clean Energy Future package and even abolish the Department of Climate Change. Since the 2010 election Labor has suffered a succession of defeats at the state level, losing power in New South Wales, Victoria, Queensland and the Northern Territory, while the Liberal-National Coalition improved their majority in Western Australia. These elections were fought on state issues, but in every case the conservatives echoed Opposition Leader Tony Abbott’s anti-carbon tax message. Closer to home, Gillard was forced to stare down moves against her by colleagues to restore Kevin Rudd, once in February 2012 and again in March this year. Four senior cabinet ministers were sacked or resigned after the second episode. Labor limps forward in the worst possible shape.

A Liberal-National victory would probably mean the end of climate change as a major political priority in Australian politics. Al Gore was mistaken. He didn’t hear “the voice of the people of Australia” on 8th November 2011; but if he’s listening he’ll hear it “loud and clear” on 14th September 2013.

John Muscat is a co-editor of The New City Journal.

Millennial Lifestyles Will Remake American Homes

$
0
0

As Millennials, America’s largest generation, enter their thirties in ever greater numbers, their beliefs about how and where to raise a family will have as much impact on the nation’s housing market. This follows as their media and political preferences have helped shape how we entertain ourselves and who is the president of the United States.   A 2012 survey indicated that seventy percent of Millennials would prefer to own a home in the suburbs if they can “afford it and maintain their lifestyle.” Now a new survey of 1000 18-35 year olds conducted for Better Homes and Garden Real Estate (BHGRE) by Wakefield Research provides a much more detailed picture of the type of home Millennials believe best fits their needs and desires.  


Reflecting their overall attitudes about spending their hard-to-come-by money, Millennials look more for value than “pizzazz” in a new home. Seventy-seven percent told BHGRE they preferred an “essential” home over a “luxury” model. And more than half (56%) believe the technological capabilities of a house are more important than its “curb appeal.”            

Millennials are known for their fascination with technology.  The BHGRE survey demonstrates that tendency in reference to their home buying decisions. Almost two-thirds (64%) would not want to live in a home that wasn’t “tech-friendly.” Not surprisingly, almost half (44%) focus on the technological sophistication of the family room rather than other rooms in the house in making that determination. In fact, almost as many (43%) would rather turn their living room into a home theater with a big screen TV than use it in more traditional ways. Even in the kitchen, a solid majority (59%) would rather have a television screen than a second oven (41%).

Another constant concern of Millennials, security, is also reflected in their technology preferences. Almost half (48%) named a security system as one of the technological essentials in a home and about a quarter (28%) would like to be able to control such a system from their smart phone.

In addition, befitting the generation that first popularized social media sites such as MySpace and Facebook, most Millennials want a house that can be customized to their individual preferences. Forty-three percent want their home to be less a “cookie cutter” offering and more capable of allowing them to put their own finishing touches on it. Almost one-third (30%) would prefer a “fixer upper” to a “move-in-ready” home, and seventy-two percent of those surveyed thought they were at least as capable of making those repairs as their parents. Almost all (82%) of this supposedly “entitled” generation say they would find a way to handle the cost of these repairs themselves rather than borrowing the money from Mom or Dad.

Millennials also take their concern for the environment into account when choosing a home. Almost half (45%) don’t want a home that wastes energy. Reflecting this, an energy efficient washer and dryer topped their essential technology wish list (57%). A smart thermostat was important to 44% of those surveyed, placing it third on the list of Millennial housing essentials.

These preferences aren’t the only reason that Millennial homes will reduce the nation’s carbon footprint in coming years. Millennials see their home as a place to “do work,” not just a place to return to “after work.” Already one in five Millennials say that “home office” is the best way to describe how they use their dining room. The generation’s blurring of gender roles as well as its facility in using digital technologies means that Millennials will likely work as much from home as “at work,” as they share child rearing responsibilities based upon whose work responsibilities require which partner to be away from the house during the day.

The cumulative impact on America’s energy consumption from this shift could be dramatic. A study by Global Workplace Analytics suggested that, if half of American worked from home, it would reduce carbon emissions by over 51 million metric tons a year—the equivalent of taking all of greater New York’s commuters off the road. Eliminating traffic jams would save almost 3 billion gallons of gas a year and cut greenhouse gas emissions by another 26 million tons. Additional carbon footprint savings would come from reduced office energy consumption, roadway repairs, urban heating, office construction, and business travel.

By the end of this decade the Millennial generation will comprise more than one out of every three adult Americans (36%). Just as the Baby Boomers influenced the housing market when they started buying homes and raising families, the Millennial generation’s overwhelming size will place an indelible stamp on the nation’s housing market. Its numbers will produce a boom in demand for housing that will help heal this critical sector of the nation’s economy. 

This may effect boomers and other old generations. Every seller of houses will have to adjust their offerings to accommodate Millennial preferences for the type of home in which they want to raise a family. The end result will be more family friendly neighborhoods where homes serve as the hub for their owner’s economic activity, simultaneously lowering the nation’s  carbon footprint and improving  the civic health of its communities.

Morley Winograd and Michael D. Hais areco-authors of the newly published Millennial Momentum: How a New Generation is Remaking America and Millennial Makeover: MySpace, YouTube, and the Future of American Politics and fellows of NDN and the New Policy Institute.

New home photo by BigStockPhoto.com.

Best Cities for Job Growth 2013 Map

$
0
0

For the 2013 Job Growth Rankings, Needle Analytics has mapped out every city sampled in the survey and visualized their positions on the list of rankings. While a list of data can impart interesting revelations to the reader, visualizing the data can highlight differences by region or across regions.

Needle Analytics is a Data Visualization firm located in Iowa City, IA. Their work stems from a passion for storytelling. See more of their work at www.NeedleAnalytics.net.

The 2013 Best Cities For Job Growth

$
0
0

The 2013 edition of our list shows many things, but perhaps the most important is which cities have momentum in the job creation sweepstakes. Right now the biggest winners are the metro areas that are adding higher-wage jobs thanks to America’s two big boom sectors: technology and energy.

Our rankings are based on short, medium and long-term employment performance, and take into account both growth and momentum — whether growth is slowing or accelerating. (For a detailed description of our methodology, click here.) Consequently, areas that have made the strongest recoveries from deep setbacks often do well. Nowhere is this clearer than in the case of the San Francisco-San Mateo-Redwood City metropolitan division, our top-ranked large metro area (urban regions with more than 450,000 jobs). Over the last year, employment in the San Francisco area expanded a remarkable 4.1%, and is up 3.3% since 2008.

A decade ago, the San Francisco area was reeling from the collapse of the last dot-com bubble; the damage was so deep that today it has only 0.6% more jobs than in 2001. Its sharp recent growth is primarily in the information sector, which has expanded a torrid 21.3% since 2009.

Much the same can be said about San Jose-Sunnyvale-Santa Clara, better known as Silicon Valley, which is No. 7 on our large metro area list due to 3.4% job growth last year, and 2.3% growth since 2008; it is also propelled by 25% growth in information jobs since 2007. Yet looking at the longer term, the Valley, like San Francisco, is still rebounding from a deep downturn connected to the dot-com disaster of a decade ago. In fact, the Valley is still down almost 40,000 jobs from 2001.

Is California Pulling Ahead Of Texas?

Some East Coast boosters of the Golden State are making this claim, but we don’t see it in this year’s numbers. Besides the tech-rich Bay Area, home to two of our top 10 large metro areas, there are no other major California cities near the top. Most of the state’s big metros are in the poor to middling range over the long term; only Riverside-San Bernardino (45th place on our big cities list) has 10% more jobs than a decade ago. Los Angeles, the state’s dominant urban region, has lost some 120,000 jobs since 2001.

In contrast, the Texas juggernaut rolls on. Growth there has not only been steady, it’s been widely spread across the state. Texas boasts a remarkable four major metros in our top 10, led by Ft. Worth-Arlington (No. 4), Houston-Sugarland-Baytown (No. 5), Dallas-Plano-Irving (No. 6 ) and Austin-Round Rock, which slips from first place last year to 10th. The state’s other big city, San Antonio, comes in at a very healthy No. 12.

All these metro areas have more jobs than they did a decade ago — often a lot more. Since 2001, employment in Houston has expanded 20%; in Ft. Worth, it’s up roughly 16%; Dallas; 11%; Austin, a remarkable 26.5%; and San Antonio, 18.4%.

The Energy Boomtowns

The unconventional oil and gas boom has helped turn Texas into an economic juggernaut, particularly world energy capital Houston, but growth has also been strong in tech, manufacturing and business services. You see this same kind of blending of energy and other sectors in other strong growth economies elsewhere in the U.S., such as No. 3 Salt Lake City, No. 9 Denver and No. 15 Oklahoma City.

But the real evidence of energy’s power can be seen in smaller metro areas. Oil-rich Midland, Texas, places first on our list of smaller metro areas (those with less than 150,000 jobs) and also first overall among the country’s 398 metropolitan areas. Nipping at its heels in second place in both categories is Odessa, Texas. On our medium-size cities list, energy towns with strong growth include No. 4 Corpus Christi, Texas; No. 5 Bakersfield, Calif.; and No. 6 Lafayette, La.

Affordability + Quality of Life = Success

But you don’t have to be a huge tech hub or energy capital to generate new jobs. The No. 2-ranked place in our big metro ranking, Nashville-Davidson-Murfreesboro-Franklin, Tenn., reflects the power of economic diversity coupled with ample cultural amenities, pro-business policies and a mild climate. Nashville’s 3.8% expansion in employment last year, and 7% growth since 2008, has been propelled by business services, education and health. There’s also been a recent recovery in manufacturing, up over 9% last year, as well as retail and wholesale trade. Like the Texas cities, Nashville has registered long-term growth as well, with 112,000 jobs added since 2001, a nice 16.6% increase.

Much the same can be said about Charlotte-Gastonia-Rock Hill, N.C., No. 8 on our big city list, whose job base grew 3.3% last year. Virtually every business sector has been on the rebound since 2009, including financial services, despite Bank of America’s continuing troubles. Overall the local economy has added 100,000 jobs since 2001, up almost 13%.

Steady, diverse growth can be seen in other low-cost and business-friendly towns such as our No. 11 big metro area, Raleigh Cary, N.C.; No. 13 Columbus, Ohio; and No. 15 Indianapolis. The shift towards stronger growth in areas away from the coasts has continued, at least in the more attractive metro areas.

Who Doesn’t Have It?

Of course, any list has its share of losers as well as winners. Sadly this includes long-suffering old industrial cities such as our last-placed big metro area, Newark-Union, N.J., which is followed, in order, by Saint Louis, MO-IL; Cleveland-Elyria- Mentor, Ohio; and Providence-Fall River-Warwick RI-MA. All but Providence, which stayed about even, slipped from last year’s rankings.

But not all factory towns are headed in the wrong direction. No.  51 Detroit-Livonia-Dearborn advanced an impressive 11 places from last year’s list. The key here has not been the much talked about attempt to turn downtown Detroit into a cool place, but the resurgence of the auto industry. Manufacturing employment, concentrated in the region’s suburbs, is up over 18% since 2009 after decades of tumultuous losses.

Also flailing a bit have been many of our largest, and most often celebrated, metros. Believe it or not, Detroit comes in one place ahead of Chicago-Joliet-Naperville ,Ill., which continues to promote itself as one of the nation’s great comeback stories, but in reality has continued to lose ground. You can tell the same tale about No. 46 Philadelphia, Pa., No. 41 Portland-Hillsboro-Vancouver OR-WA, and No. 37 Miami, which dropped a staggering 16 places despite the much celebrated recovery of its condo market. Selling to South America flight capital (legal or otherwise) and sun-deprived Europeans does not seem to be doing enough to revive the region’s overall economic vigor.

There are also some signs that the big beneficiaries of the Bernanke-Obama-Bush economic policy may be losing some momentum. New York City, the major winner from the “too big to fail” banking bailout, fell seven places from last year to No. 18. Even Washington-Arlington-Alexandria, D.C., the nation’s prime beneficiary of crony capitalism and fiscal bloat, has lost steam, falling 10 places to No. 26 — a big decline from its No. 6 rankings in 2010 and 2011. We are usually loath to celebrate declines, but Washington’s loss, reflecting a slowdown in government growth, may be evidence that some equilibrium between the public and private sectors is slowly being restored.

Joel Kotkin is executive editor of NewGeography.com and a distinguished presidential fellow in urban futures at Chapman University, and a member of the editorial board of the Orange County Register. He is author of The City: A Global History and The Next Hundred Million: America in 2050. His most recent study, The Rise of Postfamilialism, has been widely discussed and distributed internationally. He lives in Los Angeles, CA.

Michael Shires, Ph.D. is a professor at Pepperdine University School of Public Policy.

This piece originally appeared at Forbes.com.


Can Public Banks Help Fix Local Finance?

$
0
0

Are public banks the answer for the recession-induced decline in municipal revenue and other ills that plague our cities? It’s a solution being discussed in more than one American city.  

Mike Krauss, a founder of the Public Banking Institute and a chairmen of the Pennsylvania Pubic Bank Project, both non-profits that promote public banking, said this month an ad hoc committee made up of Philadelphia City Council members and civic groups started working on the adoption of language for a public bank in the city. He also said the measure is being adopted out of a need for “affordable and sustainable credit.” The PPBP is leading the effort for public banking in the city.

The recession’s impact on municipal taxes and anger at Wall Street were factors in the push for a public bank. Krauss described the losses to Philadelphia’s school district, street, police and fire departments as “phenomenal.”  

Krauss mentioned North Dakota’s public bank, founded in 1919 to promote agriculture, commerce and industry in the state, as a role model for cities. The North Dakota bank arose in reaction to farmers’ anger over the predatory practices of East Coast and Minneapolis banks. The bank’s revenues come from the state’s general revenue fund. Krauss cites the Bank of North Dakota’s 2.9 billion portfolio in a state with a population of roughly 600,000 as an example of its success. Philadelphia has a population of approximately 1.5 million. Krauss also said a public bank would be a job creator for cities and again used the BND as an example, as it produced a job for every 100,000 dollars it loaned.

Like North Dakota’s bank, the proposed public bank in Philadelphia wouldn’t be a commercial bank that offers checking and savings accounts. It would lend money for city projects and also partner with local commercial banks on loans. There are also efforts underway for public banks in San Francisco and Boston, according to Krauss. 

Public Banking Institute Chairmen Marc Armstrong said that over a trillion dollars in revenue from states and municipalities are deposited in big Wall Street banks every year. Armstrong also said many of the deposits are used to provide loans for transnational corporations that don’t invest in their states and cities. Public banks can provide loans as low as one percent interest, and Wall Street banks consider their existence as a threat, said Armstrong.  When it comes to taxation and other issues that confront cities, a public bank could be used as a weapon against the rent-seeking – meaning using social and political circumstances to extract more money out of the public – activities by financiers. The public bank would instead invest in higher education, automotive and banking industries and as a tool for productive economic enterprises and individuals. This weapon could in turn create more vibrant activities in urban economies.  

Krauss admitted the possibilities for the use of revenue generated by a public bank are endless, and he said investment in the school district, infrastructure and public safety would be positives. However, other job creating services and projects could be a reality – free wi-fi, the construction of affordable rental housing for retired people and low income residents, rent-to-own home ownership (or condo) programs, research and development to support public science, scientific innovation and high technology industries, childcare facilities, higher education for city residents, public media, new parks, free or reduced utilities for businesses and individuals, and also investments in energy efficiency, recycling, renewable energy and car sharing.  

The positive impacts of the above mentioned investments go beyond public banking, as it is the starting point for a more vibrant urban economy, education system and ecology. With a new source of revenue, business taxes could be slashed to promote business formation in public banking inclined cities, and more businesses within city limits would mean even more revenue.    

Similar to slashing taxes for business, free or reduced costs on wi-fi and utilities would also help local businesses and individuals by reducing their overhead costs and in turn create more jobs, as more money could be spent in the form of investment by businesses themselves and in increased individual purchasing power that works its way back into local businesses.  

Recycling would have a similar effect, as it’s cheaper for a city to recycle, if the program is a well-run, than to pay for waste collection, land filling and incineration. By reducing the costs of waste, cities could again reduce business taxes and once again create more business formation, and at the same time reduce greenhouse gas emissions. Recycling reduces pollution not only by reducing the waste sent to landfills, but it also reduces the need for cutting down more trees and the inputs needed to manufacture a product.

Urban and non-urban citizens all create waste and for that reason recycling is a bigger job creator than renewable energy which cannot produce all of our energy due to intermittency and also the cost, as it’s still more expensive than traditional forms. Despite these drawbacks, new revenue could be used to create jobs in solar energy by installing solar panels on public buildings – school district offices, schools, and city hall. Also worth thinking about is the possibility of constructing biogas plants that break down organic waste – which can come from the vast amount of sewage a city creates – to create another, perhaps more reliable form of renewable energy.       

The additional revenue produced by the use of public banking and increased business formation could also be used to lift the burden of rent-seeking higher education institutions by offering lower interest loans to help young people attain a higher education, affordable rent and affordable home or condo ownership without acquiring crushing debt. Cities could offer a few years of free vocational, art, culinary and business education. The media is full of stories of urban residents burdened with student loan debt which benefits universities, colleges and the government and decreases the amount of money circulating into local businesses. Also, cities would benefit from this investment by creating a new generation of productive workers, chefs and artists and the businesses that are created along with them.

Low interest loans could also be offered to local real estate interest for rent-to-own condo and house programs and affordable apartments could be constructed with low-interest loan portfolios. Of course, landlords would have to abide by low-rent policies if they are to take advantage of the policies, blunting the rent raising effects of gentrification while maintaining its’ positive side.

Cities could also put public dollars behind a new innovation in transportation – car sharing - which has been pioneered by Zipcar. Cities could help expand the company’s business by offering it low tax rates and subsides to locate within their borders; those arguing they would wasteful should take a second look at what’s spent on sports stadiums. Or maybe cities could building their own car sharing industry with local business leaders. The expansion of car sharing would mean less impact on the infrastructure and reduce the amount spent on infrastructure. It would also reduce traffic congestion and make it possible for residents of surrounding suburbs to enjoy the city’s attractions.      

Cities can and should be hubs for creative people and immigrants, as they see life in almost-dead neighborhoods and create gentrifying enterprises such as restaurants, cafes, music venues, art galleries, artisan manufacturing, coffee roasting, small boutique retailers and all sorts of internet and technology businesses. However, cities can’t and shouldn’t lose focus on what sustains critical functions such as public safety, infrastructure and education – revenue. The public bank offers an opportunity for cities to invest in themselves, not the profit portfolios of Wall Street.

Jason Sibert is a freelance writer who has lived in the St. Louis Metro Area since the late 90's. He worked for the Suburban Journals for a decade and his work has appeared in various publications over the last four years.

Photo by David Shankbone.

The Cleveland Miracle That Should Never Have Been

$
0
0

“[T]he most obvious, ubiquitous, important realities are often the ones that are the hardest to see and talk about.” Writer David Foster Wallace

The story of the three Cleveland women kidnapped over 10 years ago and recently found alive in a house on the city’s Near West Side has captivated the national imagination. There is the miracle aspect from the fact that such situations rarely end this way. There is the hero aspect that is Charles Ramsey, the raw dog, uber-Cleveland man that tells it like it is (e.g., “Bro, I knew something was wrong when a little, pretty white girl ran into a black man's arms.”) But that is not what this essay is about. Rather, it is about our failure as a city, particularly a failure of priority.

On Monday, May 6th, the feeling in the air as one of the girls-turned-women emerged into her freedom was torn. There was elation at the miracle that the supposed dead were alive, yet there was also a collective unease that comes with the reality that Cleveland can be a violent city, and that there was a need for a miracle in the first place.

Worse, the fact that the decades-long captivity occurred in the shadows of Cleveland’s revitalization success story, Ohio City—the city’s artisan district and home of the West Side Market—well, let’s just say it was enough to give many in this city pause. Including myself.

Specifically, the week’s events left me acutely aware that Cleveland is still comprised of remnants of a post-industrial community. For it is a city still reeling. Still struggling. Still failing the most vulnerable. And it is a city still culpable, if only through fostering a continued failure in leadership that refuses to build the city the right way.

Yes, like many cities, there are pockets of reinvestment, such as the gentrifying neighborhoods of Detroit Shoreway, Downtown, University Circle, Ohio City, and Tremont. And reinvestment in inner-city neighborhoods is needed, as concentrated poverty and segregation is no path forward. But Cleveland is not going to consume and play its way out of this. Re-treading the entertainment district into whatever urban revitalization fad appears to be going on in any given decade will only lead to what we always got: a perpetual state of “revitalization”. What will work is a real reconstitution of Cleveland’s neighborhoods; that is, a reconstitution of people, and not simply of place. To that end, think of the city as a net. No amount of investment will stick until we rethread our community fabric, which involves growing the people that comprise a community in the first place.

Maslow's Hierarchy of Needs.svg

How does a city do this? Well, the first step is to not get too cute, and to do the obvious realities right.. No amount of beautification projects will save a post-industrial city. A city needs to focus on the basics, as you develop a city like you grow a child. Here, the psychologist Albert Maslow’s hierarchy of needs can help.

To wit, city leaders must prioritize physiological needs: eradicate food deserts, curb environmental threats, etc. Then, focus on safety. Not just manning safety force slots, but making sure those protecting us respect their duty. There are big questions about this in Cleveland. Also, shelter. Real local housing policies are needed, as are innovative educational and workforce development strategies. If you want to get creative, you can even leverage and strategize various needs together, like utilizing a glut of vacant storefronts into small business/entrepreneurial initiatives. Next, encourage social and cultural attachment so the benefits of community capital can be had. Don’t worry. If persons can breathe, eat, work, feel safe, and go home, they are likely to do this on their own. In fact that is the beauty of a hierarchy approach, as investment at the bottom turns into a self-fulfilling process up top. And then the icing on the cake: actualizing individuals, perhaps through fostering creative capital programs. That said, creatively classifying a city is doing it backwards if you haven’t built your city from the foundation up. Said Maslow: “A first-rate soup is more creative than a second-rate painting.”

And while this makes intuitive sense to regular Clevelanders, it is confusing for the local leaders, if only through the advice of revitalization experts. For instance, in an article addressing concerns over whether or not Detroit’s investment should go to a bike path initiative, the author references an expert as to why the answer is “yes”:

As Peter Kageyama argues in his book For the Love of Cities, “In the city making ‘hierarchy of needs’ we see most communities focused on bottom-line, core issues of making cities functional and safe. There still are many communities that struggle to even deliver functional and safe but that is not the problem. The problem is when communities only focus on the functional and safe and never raise their aspirations.”…Ultimately, places that do not engage us emotionally do not feel worth caring about.

Clicking on the link above to Kageyama’s page, the expert details his thoughts and his audience:

I focus primarily on American cities though the ideas are relevant to any place. I pay particular attention to some of our most challenged places such as Detroit, Cleveland and New Orleans as they have become hot beds of social innovation as government and the “official” city-makers have struggled to reconcile shrinking budgets and diminished capabilities. Into this vacuum has flowed a new breed of city-maker – usually young, independent, unofficial, creative, rule breaking and entrepreneurial. These are the new “frontiersmen” and “frontierswomen” who are rebuilding these cities from the ground up.

There are a few problems here. First, while attachment to place is important, the logic is a bit flawed. A person insecure in various aspects of livability, like food and shelter, is not going to have their concerns addressed via an emotional connection to a given place. I am not saying developing place is bad. I am only saying such an approach is akin investing in nice drapes as your house is on fire. Put the fire out. Protect your people. Grow your people. After all, according to economic developer Jim Russell, people develop, not places.

Second, local leaders are elected for a reason. To lead. And to serve and protect. “Frontiersmen” or Frontierswomen” are not going to protect the preyed upon—notwithstanding Charles Ramsey, though I doubt that is what Kageyama had in mind.

No doubt, the events in Cleveland have shaken the city—yet another tear in an already torn city. And while the local and national news media is branding the escape of three women and one child as the “Miracle in Cleveland”, it wasn’t. At least not for us. We failed these young women. We failed the women before them. I hope this serves as our wake-up call. We will not play our way out of this. And if we continue to try, there will always be shame in the shadows of our revitalization.

Richey Piiparinen is a writer and policy researcher based in Cleveland. He is co-editor of Rust Belt Chic: The Cleveland Anthology. Read more from him at his blog and at Rust Belt Chic.

Top photo Courtesy of WOIO/AP

The Average Manufacturing Establishment Is Smaller Than You Think, and Getting Smaller

$
0
0

The common image of American manufacturing, as Harold L. Sirkin wrote in Bloomberg Businessweek, is of huge plants with waves of assembly-line workers producing cars and refrigerators. But there’s a whole other world of niche manufacturers in the U.S., and these small firms are more typical — and should be more of a priority, Sirkin argued — than you might think.

Some 250,000 manufacturers in the U.S. have fewer than 500 employees. Studies show these smaller businesses produce more innovations per employee than large manufacturers. And truth be told, it is generally from these small companies that the jobs of the future will spring. Indeed, as David Rocks and Nick Leiber observed last summer, smaller manufacturers have been leading the “reshoring” wave that my colleagues and I have been writing about.

The average manufacturing establishment was home to 35.3 jobs in 2012, according to EMSI’s 2013.2 dataset. That’s larger than retail trade (14.4 jobs per establishment), finance and insurance (11.9), and the average size across all industries (15.7 jobs, as the following chart from the BLS shows).

But like all establishments, manufacturing work sites are getting smaller — dramatically smaller, in fact, over the last 12 years.

Note: An establishment is a single physical location of some type of economic activity — in other words, a business. A single company may have multiple establishments.

In 2001, the average manufacturing establishment had 41.8 jobs. By 2007, it was 38.3. And in 2012, as we mentioned, it was 35.3.

Part of the substantial drop in the last five years is likely the result of the recession — a period in which many employers go through a “cleansing,” as mentioned in a 2012 paper by the Eleanor Choi and James Spletzer of the BLS. The two economists also concluded, when looking across the board, that “establishments are starting smaller and staying smaller. The average size of establishment births (new startups, excluding seasonal businesses) in the 1990s was around 7.6 employees, whereas the average size of births fell from 6.8 employees in 2001 to 4.7 employees in 2011.”

Another notable trend: Since 2010, job growth in manufacturing has predominantly been in sub-sectors with larger-than-average establishment sizes. Consider this table:

NAICS CodeDescription2012 Jobs2010-12 % Job Change2012 EstablishmentsJobs Per Establishments (2012)
Source: QCEW Employees - EMSI 2013.2 Class of Worker BETA
331Primary Metal Manufacturing 399,767 11%5,65870.7
333Machinery Manufacturing 1,090,723 10%29,01537.6
336Transportation Equipment Manufacturing 1,445,062 9%14,282101.2
332Fabricated Metal Product Manufacturing 1,391,954 9%58,06724.0
316Leather and Allied Product Manufacturing 29,436 5%1,25523.5
335 Electrical Equipment, Appliance, and Component Manufacturing 370,810 4%7,34150.5
326Plastics and Rubber Products Manufacturing 641,042 3%13,09049.0
312Beverage and Tobacco Product Manufacturing 189,476 3%5,91832.0
339Miscellaneous Manufacturing 575,852 2%30,93618.6
311Food Manufacturing 1,457,721 1%29,33449.7
334Computer and Electronic Product Manufacturing 1,096,643 0%18,79558.3
325Chemical Manufacturing 784,101 0%16,18048.5
324Petroleum and Coal Products Manufacturing 111,472 0%2,38746.7
313Textile Mills 118,205 -1%3,06538.6
321Wood Product Manufacturing 334,995 -1%14,59423.0
327Nonmetallic Mineral Product Manufacturing 365,302 -1%16,57522.0
337Furniture and Related Product Manufacturing 351,304 -1%18,74318.7
322Paper Manufacturing 380,900 -3%5,71466.7
314Textile Product Mills 115,898 -3%7,19816.1
315Apparel Manufacturing 149,036 -5%7,27920.5
323Printing and Related Support Activities 461,503 -5%30,49915.1
Total11,861,2033%335,92435.3

Primary metal manufacturing, which includes foundries and steel mills, grew the most from 2010 to 2012 — 11%, which equates to nearly 39,000 new jobs. It has the second-most jobs per establishment (70.7) among all manufacturing sub-sectors. Transportation equipment manufacturing had the third-fastest growth rate, at 9%, and it has the most jobs per establishment (101.2).

At the bottom of the table are printing and related support activities, apparel manufacturing, and textile product mills. All three have jobs-per-establishments ratios of 20.5 or fewer, far below the 35.3 average.

This isn’t to say that there’s a clear relationship between establishment size and employment growth; the results are too varied to make that declaration (see fabricated metal product manufacturing), and statistical analysis doesn’t bear that out. But at a time when establishments are shrinking, most of the best-performing manufacturing industries are ones that still have sizable establishments.

Joshua Wright is an editor at EMSI, an Idaho-based economics firm that provides data and analysis to workforce boards, economic development agencies, higher education institutions, and the private sector. He manages the EMSI blog and is a freelance journalist. Contact him here.

Slow the Presses!

$
0
0

It has been a difficult time for newspapers. The industry has experienced serious challenges due to multiple factors going back at least to the early 1960s when the three major television networks began their extensive and widely popular evening news programs, with the likes of Walter Cronkite, Chet Huntley and David Brinkley.

Recent Setbacks

The rise of the Internet over the last two decades has posed a much larger challenge. More people were able to access more interactive news sources, including the Internet editions of major newspapers, nearly all of which were free in the beginning. Then there was Apple, with its ground-breaking iPad which made accessing news sources more user-friendly. Newspapers competed hard to design their own applications, which often required paid subscriptions. Of course, Ipad has competitors now and many newspapers have implemented paid firewalls for their Internet sites.

However, the Great Recession may have dealt the most important blow to the print edition. The collapse of the housing market brought a catastrophic decline in real estate and help wanted classified advertisements, a key source of revenues. Added to this was a drop in overall business, which also reduced advertising revenues.

Some large newspapers such as The Wall Street Journal,and The New York Times claim they have gained circulation. However, looking beneath the gross numbers provided by the Alliance for Audited Media, it is clear that virtually all of the gains are in on line editions, while print editions continue to decline. Even the online gains may be overstated, because a print edition subscriber who is also an online edition subscriber gets counted twice for the same newspaper.

Smaller Press Runs

A review of the change in circulation in the nation's 20 largest newspapers since 1998 indicates the depth of the losses. The year 1998 is chosen because newspaper circulations remained at high levels and the losses to Internet editions and other media sources has not yet occurred.

From 1998 to 2013, the 20 largest newspapers lost more than 5 million of their 13.4 million weekday print subscribers, a loss of nearly four out of ten subscribers (39 percent). At the same time, there were substantial differences among the top 20 papers in their losses (Table).


Top 15 Newspapers in 1998: 1998-2013 Print Circulation
Newspaper19982013% Change
The Wall Street Journal     1,740      1,481 -14.9%
USA Today     1,653      1,424 -13.8%
The New York Times     1,067         731 -31.5%
Los Angeles Times     1,068         433 -59.5%
The Washington Post        759         431 -43.2%
New York Post        438         409 -6.6%
Chicago Tribune        673         368 -45.3%
New York Daily News        723         360 -50.1%
Arizona Republic        435         286 -34.3%
Newsday (Long Island)        572         266 -53.5%
Houston Chronicle        551         231 -58.0%
Minneapolis Star Tribune        335         228 -32.0%
The (Cleveland) Plain Dealer B.        382         216 -43.4%
The Denver Post        342         214 -37.5%
San Diego Union-Tribune        378         194 -48.7%
The Dallas Morning News        480         191 -60.3%
The Philadelphia Inquirer        429         185 -56.9%
Chicago Sun-Times        486         185 -62.0%
Newark Star-Ledger        407         180 -55.7%
The Boston Globe        471         172 -63.5%
Total   13,389      8,185 -38.9%
In millions
Source: Alliance for Audited Media & predecessor


Losers and Catastrophic Losers

All of the newspapers lost subscribers, but some lost many more than others. The New York Post, a tabloid owned by Rupert Murdoch, posted the smallest loss, less than 30,000 of its 1998 subscriber base of 438,000.

USA Today, Gannett’s unique national general-interest newspaper, experienced the second smallest loss, at 13.8 percent. USA Today, also the newest newspaper on the list (1982), is the nation's second-largest newspaper and fell from a circulation of 1.65 million in 1990 to 1.42 million in 2013.

Another Murdoch title, The Wall Street Journal, purchased in 2007, did a third-best in holding onto its print readership. The Journal retained its position as the largest daily newspaper in the nation, with circulation dropping from 1.74 million in 1998 to 1.48 million in 2013. This amounted to a small loss compared to other newspapers (14.9 percent). The 260,000 loss in actual subscribers was larger than the total current daily circulation of 10 of the top 20 US newspapers (such as the Houston Chronicleand The Boston Globe).

The nation's third largest newspaper, The New York Times, lost nearly one-third of its print circulation between 1998 and 2013. Even so, this was less than the loss rate of all but three newspapers (The New York Post, The Wall Street Journal and USA Today).

The largest relative circulation loss was atThe Boston Globe, which saw a departure of nearly two-thirds (63.5 percent) of its subscribers. This was more than double the losses by its owner, The New York Times.

Two other newspapers lost 60 percent or more of their readers between 1998 and 2013. The Chicago Sun-Times experienced a loss of 38 percent while The Dallas Morning News saw 40 percent of its subscribers flee. This huge loss is particularly notable, given that the Dallas-Fort Worth metropolitan area is one of the fastest growing regions in the world. For example, in Phoenix, which has also grown very rapidly, theArizona Republic lost only one third of its readership, having taken advantage of the rapidly expanding market.  

Perhaps most disastrous has been the decline at the Los Angeles Times. For more than two decades, the LA Times had been the nation's third or fourth largest newspaper, following The Wall Street Journal, USA Today and sometimes The New York Times. This ranking was not much changed in 2013, as the LA Times was the fourth largest newspaper.

However, over 15 years, the LA Times lost nearly 6 out of every 10 of its subscribers. In 1998, the LA Times had 1,000 more subscribers than The New York Times, at 1,088,000. By 2013, print subscriptions at LA Times had fallen to 433,000. Over the period, The New York Times managed to secure a stranglehold on third position, opening a nearly 300,000 subscriber lead over the LA Times. Should the losses at the LA Times continue at this rate, it could be passed by both The Washington Post and the New York Post within a couple of years (Figure).

In raw subscriber numbers, the LA Times losses were the most precipitous by far at 635,000, compared to second largest loss at the New York Daily News at 363,000. The Daily News continues a long slide,   having been the nation’s largest newspaper for decades to the 1970s. It is now the third-largest paper in the three paper New York City market, having been passed by the New York Post some time ago. The Daily News, however, still leads the suburban Newsdayand Newark Star-Ledger.

Even Bigger Losses

Some of the larger declines in newspaper circulation are not evident in the latest data. For example, The San Francisco Chronicle experienced a drop of 65 percent in its circulation from 1998 to 2012 (2013 data not available). The spectacular decline of Detroit’s two metropolitan dailies has outstripped all of the others over a longer period of time. In the middle 1980s, the Detroit Free Press and the Detroit News each had circulations of approximately 650,000. By 2012, the Free Press had fallen to approximately 135,000 and the News to under 80,000. These drops were much larger than the city of Detroit’s population loss. Now, the two papers offer home delivery only three days of the week (Thursday, Friday and Sunday), while subscribers are encouraged to use internet editions on other days.

Of course, over the last 15 years, a number of familiar titles have been closed, such as the Rocky Mountain News (Denver), the separate Atlanta Journal and Constitution (now combined as the Atlanta Journal-Constitution) and the Cincinnati Post. The Seattle Post-Intelligencer took the intermediate step of shutting down its print edition, but retaining an Internet edition, which has remained a strong presence online.

Where from Here?

There have been other changes as well. Virtually all of the US broadsheets (the wide, familiar print format) are now printed in more compact editions, having been reduced from approximately 15 inches wide to 12 or even 11 inches wide (28, 30.5 and 38 centimeters). There are international format changes, as well. The Times of London (weekday edition) converted from broadsheet to tabloid in 2004, while The Sydney Morning Herald and Melbourne’s uniquely named The Age switched to tabloid format in March.

The communications business has changed   over the past two decades. Newspapers have been trying to cope, but it   seems unlikely that print editions will experience any resurgence. The open question is whether the newer online strategies will save them from oblivion, but that’s hard to predict.

Wendell Cox is a Visiting Professor, Conservatoire National des Arts et Metiers, Paris and the author of “War on the Dream: How Anti-Sprawl Policy Threatens the Quality of Life.

Photo: Los Angeles Times headquarters courtesy of WikiCommons

Housing Market Fringe Movement

$
0
0

A year or two ago, pundits and planners, in California and elsewhere, proclaimed – and largely celebrated – the demise of suburbia. They were particularly heartened by a report, financed by portions of the real estate industry, that predicted the market for single-family homes in the state was hopelessly flooded, with a supply overhang of up to 25 years. The "new California dream" would supplant the ranch house with a high-density apartment, built along a transit or bus line.

So much for the grand theory. As the economy has begun to recover from its nadir, single-family home sales have taken off, both in California and across the country. In 2012, prices rose by 6 percent nationwide, and pent-up demand has spurred interest among investors and buyers.

In California, the new dream imagined by planners, pundits and their real estate backers is being supplanted by, well, a more traditional aspiration. In our state, hard hit by the most-recent housing bubble, single-family home prices surged 24 percent over the past year as inventories dropped precipitously. In some particularly desirable areas, such as Irvine, the supply constraints are at levels lower than experienced even in boom times.

We are beginning to see a resurgence – which we were told never to expect – in new projects. The government reported recently that housing permits, still well below their peak, surged in February to their highest level since June 2008, an increase of nearly 34 percent from a year earlier.

In Southern California, prospects for new single-family home construction are beginning to gear up. Toll Brothers, for example, recently bought into a new 2,000-home development in Lake Forest. Developers are turning over land across a vast portion of the state, particularly in places like Riverside-San Bernardino, which were at the epicenter of the housing bust but are now showing signs of recovery.

The media's surprise at these developments reflects the disconnect between the perceptions of planners, academics and some developers and reality on the ground. In the past decade or two, a huge industry has arisen, proclaiming the end of the single-family home and heralding the rise of densely populated urban cores. Yet, an analysis of the 2010 Census shows that growth in the suburbs, as opposed to core cities, actually rose from 85 percent to 91 percent from the previous decade.

So, too, did the proportion of detached single-family homes, which grabbed 80 percent of the market during 2000-10, leaving 20 percent for multifamily buildings and townhouses. And now, with the market recovering, single-family homes in 2012 accounted for nearly two of three homes sold. Overall, sales of single-family homes in the past year were roughly seven times those for co-ops and condos nationwide.

What's behind this? It may have something to do with a little thing called consumer preference. Overall surveys tend to show that roughly 80 percent of adults prefer single-family houses, usually in either suburbs or exurbs.

Of course, many insist that, in the aftermath of the 2007 housing bust, Americans now are finally unlearning their bad habits. In 2010, U.S. Housing and Urban Development Secretary Shaun Donovan, pointing to the flood of foreclosures in suburban reaches of Phoenix, claimed that the die, indeed, was already cast. "We've reached the limits of suburban development," Donovan claimed. "People are beginning to vote with their feet and come back to the central cities."

Yet, although the Great Recession certainly slowed overall migration to suburbs, numbers for 2011, the most recent available, showed domestic migrants continued to head away from core counties and toward those in the suburbs and exurbs. Now that the economy is improving, this trend seems likely to continue, or even accelerate.

Core cities may be reviving, but this is still a suburban nation; conservative estimates indicate than more than 70 percent of residents in major metropolitan areas live in suburbs. To be sure, areas within three miles of an urban core grew 4.7 percent in the past decade, or 206,000, a nice reversal from previous declines. Yet this represented less than one-half the metropolitan growth rate of 10.6 percent. Further, this growth was more than negated by a 272,000 loss of people living from two miles to five miles from the urban core.

Contrast this with fringe growth. Over the past decade, for example, areas five to 10 miles further from the core expanded their populations by 1.1 million. Areas further out, 10 to 20 miles, added 6.5 million residents. Areas beyond 20 miles from the urban core saw the largest growth, 8.6 million – 40 times the growth in the urban core and nearly four times the percentage growth (18.0 percent).

It does not appear that the Great Recession reversed these trends. An analysis of population growth in 2011-2012 by Jed Kolko, chief economist for the real estate website Trulia, found that the old patterns reinforced themselves, with strong, but numerically small, growth in the core, but the most robust expansion at the fringes. "The suburbanization of America," Kolko suggests, "marches on."

In Southern California, this also is the pattern. From 2000-10, the Riverside-San Bernardino metropolitan area added twice as many people as did Los Angeles and three times that of San Diego. Overall growth in Los Angeles has been strongest toward its urban fringe. Although media coverage has focused on the growing residential population of Los Angeles' downtown, which expanded from 35,884 to 51,329 over the decade, this population is actually smaller than that of the San Fernando Valley neighborhood of Sherman Oaks. It is also more than 5,000 fewer people that in the Riverside County community of Eastvale, once primarily an area of dairy farms that incorporated only in 2010 and whose population has increased eight-fold since 2000.

The geography of the post-crash economy, despite the strong losses in suburban industries like manufacturing and construction, also has remained much as it was before the recession, and may begin to assert itself more in the future. A new report from the urban-core-oriented Brookings Institution found that the percentage of jobs within three miles of the urban core dropped in all but nine of the nation's 100-largest metropolitan areas; only Washington, D.C., saw strong relative growth in its core.

Overall, the periphery is now the dominant job center in metropolitan America, with more than 65 percent of all jobs in the largest metropolitan areas and with twice as many jobs 10 miles from the urban core as in the core itself. This undercuts the assertions by planners and retro-urbanists that we can cut commutes by coercing people to live closer to the core. The real trend is that many historically bedroom communities are nearing parity between jobs and resident employees. The jobs/housing balance, which measures the number of jobs per resident employee in a geographical area, has reached 0.89 (jobs per resident workers) in the suburbs of the country's 51 major metropolitan areas, according to American Community Survey 2011 data.

This proportion is greater in Southern California, where numerous job centers compete with downtown Los Angeles, which holds barely 3 percent of the region's employment. Instead, many of the region's strongest job centers – Ontario, Burbank, West Los Angeles, Valencia – are themselves suburban in nature. Overall, the strongest office markets remain in places like around John Wayne Airport and West Los Angeles, which have recovered much more than downtown Los Angeles, despite that area's much ballyhooed "vibrancy."

If the goal is to reduce both commute times and energy use, perhaps these dispersed centers may offer the best hope. In Irvine, for example, by 2000 there were three jobs for every resident; roughly two in five residents worked in the city. Commutes for Irvine residents are among the shortest in the Los Angeles basin, notes Ali Modarres, chairman of the Geography Department at Cal State Los Angeles.

There's also a danger that policies seeking to restrict construction of single-family homes could further inflate housing prices and thus also create a potential oversupply of the multifamily product that the planners and many developers want to push. This is particularly true here in sunny Southern California, where the single-family house represents, in historian Sam Bass Warner's phrase, "the glory of Los Angeles and an expression of its design for living."

Given these deep-seated preferences, perhaps it would make more sense if our planners, and some developers, would awake from their dogmatic slumbers. Their job should be to facilitate the quality of life that people seek, not to tell them how to live. That means admitting that the future of both America and, particularly, Southern California, is likely to remain largely suburban for years to come.

Joel Kotkin is executive editor of NewGeography.com and a distinguished presidential fellow in urban futures at Chapman University, and a member of the editorial board of the Orange County Register. He is author of The City: A Global History and The Next Hundred Million: America in 2050. His most recent study, The Rise of Postfamilialism, has been widely discussed and distributed internationally. He lives in Los Angeles, CA.

This piece originally appeared in the Orange County Register.

Suburbs photo courtesy of BigStockPhoto.com.

Viewing all 3788 articles
Browse latest View live


Latest Images