Quantcast
Channel: Newgeography.com - Economic, demographic, and political commentary about places
Viewing all 3794 articles
Browse latest View live

Time to Acknowledge Falling Private Car Use

$
0
0

The prospect of falling car use now needs to be firmly factored into planning for western cities. 

That may come as a bit of a surprise in light of the preoccupation with city plans that aim to get people out of their cars, but it is already happening.  And it is highly likely to continue regardless of whether or not we promote urban consolidation and expensive transit systems. 

But not necessarily lower resource consumption
Of course, as day-to-day travel savings are made by households these can simply result in other forms of consumption, offsetting any resource savings.  This should not be surprising.   Final demand embodies resources consumed right across the production and distribution chain.  Savings from lower transport spending (including commuting) – an intermediate input in the chain – that lead to lower prices translate into increases in discretionary spending (assuming constant or rising incomes). 

Hence, the reduction in resource use and pollution sought by subsidising public transport and promoting higher density living may simply be spent on resource-intensive appliances, recreation, entertainment, and inter-city and international travel.

Look to the fringe to look to the future
Putting that inconvenient equation aside, long-term plans for cities should avoid simply projecting past behaviours into the future. Instead, we might look to changes at the margin that signal the issues, discoveries, and events that might determine the long-term outcomes we are interested in. 

So let’s look at what’s happening at the margins of car use, focusing for the purpose of illustration on Auckland.

First, travel demand
The New Zealand Travel Survey has been conducted since 2003.  The results are published on a two-yearly rolling basis.  Using Statistics New Zealand population estimates I have calculated annual “per person” measures for Auckland from 2003 to 2011.  There are some sampling issues and qualifications regarding the survey that mean motor cycle and bicycle use statistics for Auckland are not considered reliable enough to use. Even given sampling error, the balance point to some significant and consistent shifts.

For example, total travel (measured as annual kilometres per resident) appears to have peaked around 2007 (Figure 1). In fact, recorded travel declined by 15% over the period.  Public transport has done better, down 12% overall but actually increasing 13% between 2007 and 2011.

Figure 1: Aucklanders' Travel by Mode, 2003-2011


More telling, though, has been declining car use.  The first column in Table 1 shows changes over the whole period.  The second column shows changes between the 2007 travel peak and 2011.

The fall in car dependence since 2007 has been marked among passengers (-23%).  Perhaps that means fewer discretionary trips are being taken. This and a 14% decline in driver kilometres and 17% fewer trip legs confirms what the vehicle counts say – cars are being driven significantly less in Auckland  (particularly inner Auckland) now than they were five or ten years ago.

 
Period
2003-11
Peak
2007-11
Driver
Km
-4%
-14%
Hours
3%
-12%
Trip Legs
1%
-17%
Passenger
Km
-33%
-23%
Hours
-18%
-17%
Trip Legs
-8%
-22%
All Car Users
Km
-16%
-17%
Hours
-5%
-13%
Trip Legs
-3%
-19%


Possible reasons:

1.      We know already that an ageing population reduces car use.

2.      Public transport is playing a growing but so far minor role (up from 3.7% to 3.9% share of all kilometres travelled).  An average 76km per person growth in public transport use since 2007 hardly offsets the 1,810km average contraction in distance travelled by car.

3.      Lower real incomes and higher fuel prices play a part.  A sharp contraction since 2007 suggests that economic conditions have an impact on motoring far more immediate and influential than trying to reshape the shape the city and how people live in it might.   

4.      The decentralisation of jobs, recreation and entertainment, professional services, and consumer services – including retailing– mean that people can get more done closer to where they live.  Trying to turn this clock back by pushing commercial activity back into the central city and then providing subsidised public transport to access it seems somewhat obtuse in the light of this development.

Second, car purchases

The Ministry of Transport publishes new car registrations (which include imported used cars).  It also provides data on the total  vehicle fleet since 2000.  

Long-term registration statistics are interesting when related to national population data (Figure 2). Apart from a hiccup in 1991 growth in registrations was more or less continuous from 1950 until 2003.  Since then there has been a sharp decline.  Time will tell whether this is cyclical or signals a long-term shift.  It is noteable, though, that 2009, 2010, and 2011 figures fall well below trend.

Figure 2: Trends in New Car Registrations


This slowdown in new car registrations is reflected in two ways.  First, it is reflected in total fleet size, for which data are available from 2000 (Figure 3). This shows that  2007 was a turning point in total numbers, consistent with evidence that driving in Auckland peaked in that year.  That’s presumably good for the environment.

Figure 3: New Car Registrations, New Zealand 2000-2011,


Second, with the slow-down in imports, the fleet has begun to age (Figure 4).  That’s presumably bad for the environment, as older cars are less efficient and generate more emissions.

Figure 4: New Zealand's Ageing Car Fleet


Third, fleet changes
Fleet composition is changing as growth slows. The average CC rating of newly registered vehicles in 2000 was 2,127.  This climbed to 2,191 in 2005, but fell to 2,033 in 2011, an 8% fall in six years. 

If this is a sign of things to come an increase in the turnover of vehicles would boost fleet efficiency over the medium term even without taking account of the greater engine efficiencies being delivered and gains among electric and hybrid vehicles

Add to that the prospect supported by these numbers of increasing differentiation among vehicle styles (Figure 5).  At one end sits the large weekend recreational vehicle, perhaps falling as a share of new vehicles – or at least being down-sized.  At the other is the increasingly popular city runabout or smart car, and in the middle  the family sedan, the work horse with an engine size now likely to be well under 2,000cc.  

Figure 5: Changes in Engine Size of Newly Registered Vehicles, 2000-2011


So what does this all mean?
There is evidence accumulating to suggest that significant changes are taking place at the margin of transport demand and car dependence.  If this is a sign of things to come it raises questions about long-term road expenditure, about dire predictions of road congestion, and about the benefits of adopting expensive land use and transport measures designed to force people out of their cars.

Already, within a more constrained economy, people seem to be making their own decisions to reduce car dependence.

In terms of city planning, it suggests that decentralisation may be more sustainable than the compact city protagonists make out.  In this respect, is interesting that motorway traffic counts show that significant reductions in inner city vehicle flows are offset by gains (albeit much smaller) in outer parts of the city – even as measured distance travelled falls. 

And Auckland definitely needs to rethink assumptions behind spending plans for major road and rail infrastructure – and confront the risks and costs of getting them wrong. 

And, incidentally, it’s about time New Zealand's Ministry for the Environment updated its report card on trends in the environmental impact of vehicle travel– which only goes up to 2007, a year which may prove to be a turning point in long-term travel behaviour.

Phil McDermott is a Director of CityScope Consultants in Auckland, New Zealand, and Adjunct Professor of Regional and Urban Development at Auckland University of Technology.  He works in urban, economic and transport development throughout New Zealand and in Australia, Asia, and the Pacific.  He was formerly Head of the School of Resource and Environmental Planning at Massey University and General Manager of the Centre for Asia Pacific Aviation in Sydney. This piece originally appeared at is blog: Cities Matter.

Aukland harbour photo by Bigstockphoto.com.


California Becoming Less Family-Friendly

$
0
0

For all of human history, family has underpinned the rise, and decline, of nations. This may also prove true for the United States, as demographics, economics and policies divide the nation into what may be seen as child-friendly and increasingly child-free zones.

Where California falls in this division also may tell us much about our state's future. Indeed, in his semi-triumphalist budget statement, our 74-year-old governor acknowledged California's rapid aging as one of the more looming threats for our still fiscally challenged state.

Gov. Jerry Brown, unsurprisingly, did not acknowledge or address the many factors driving the aging trend that include his own favored policy prescriptions. Whatever their intent, the usual "progressive" basket of policies have had regressive results: a tougher time for both the poor and middle class, and a set of density-oriented policies that are likely to drive up housing prices, particularly for the single-family houses largely preferred by people with children.

These policies have helped turn California into a state that looks less Sunbelt and more like the long-aging centers of the Northeast and the Midwest. It also mirrors declines in fertility and marriage rates in the most-rapidly aging parts of Europe and east Asia. These regions are shifting toward what Chapman University's recent report, in cooperation with the Civil Service College of Singapore, characterized as post-familialism. Released this past fall in Singapore, the report will be presented in Orange County this week.

We believe that the rapid decline of marriage and fertility rates in many advanced countries inevitably leads to economic decline, reduced workforces and, likely, an inevitable fiscal disaster. This may be becoming now more true in the United States, a country which once boasted the most vibrant demographics in the high-income world but since the 2007-09 recession has seen a rapid drop in both its marriage rate and fertility rates to well below 2.1 children per female, what is generally referred to as "the replacement rate."

Just as it differs by country, the degree of post-familialism varies among countries, but it also does among states and regions. Some states, notes a recent Packard Foundation study, such as Texas, Utah and North Carolina, have seen double-digit gains in their child populations over the past decade while California's has dropped by over 3 percent. Some urban regions like Raleigh, Austin, Houston, Charlotte, Dallas-Fort Worth and Atlanta have also seen rises in their number of children, with population between ages 5 and 17 growing by 20 percent or more over the past decade.

Historically, California and its regions stood among these family magnets, but no more. Like the states of the Northeast and upper Midwest, the Golden State is becoming rapidly geriatric, as families opt out, and immigration, the primary source of our growth in younger people, declines in an economy ill-suited to migrants with aspirations for a better life.

Southern California, where immigration has dropped by roughly a third over the past decade, has shared in this decline.

All three major regions of greater Los Angeles – the San Bernardino-Riverside area, Orange and Los Angeles counties – have seen a sharp drop in their percentages of children. Only the Inland Empire remains still relatively youthful overall, with some 26 percent of its population under 15, well above the national average. In contrast, Los Angeles and Orange counties experienced a 15.6 decline in under-15 population, highest among the nation's metropolitan areas. Meanwhile, the over 60 population grew by 21 percent.

One clear indicator can be seen in our declining school populations. Despite massive expenditures for new construction, over the past decade the Los Angeles Unified School District has seen enrollment drop by 7.5 percent. In that period, the student count fell by over 50,000, the largest numerical drop in the nation.

What is leading to this exodus of families? Sacramento politicians and their media enablers blame insufficient investment in education or simply national aging trends as the root causes. But then, why are other states, including our key competitors, gaining families and children?

Sacramento lawmakers of both parties share some responsibility. The dominant progressives' regulatory and tax agenda continues to reduce economic prospects for younger Californians, leading many young families to exit the state. In contrast, older Anglos, the bulwark of the now largely irrelevant GOP, are committed to massive property tax breaks because of Proposition 13. Add good weather and the general inertia of age, and it's not surprising that families might flee as seniors stay.

Other factors work against parents, prospective or otherwise. The knee-jerk progressive response to our demographic problems usually entails more money be sent to the schools.

But they rarely include the student-oriented reform measures such as those enacted in New Orleans (where I am working as a consultant). The poor performance of public education, clear from miserable test results and dropout rates, makes raising children in California either highly problematic or, factoring the cost of private education, extremely expensive.

If you think Proposition 30's higher sales and income taxes will change anything, think again.

Much of that money will end up, almost inevitably, going toward pensions of teachers and other state workers. The hegemonic teacher unions have as their primary goal protecting the system at all costs and resisting change.

Equally critical, the state's "enlightened" planning policies also work to discourage families. California's new climate-change-mandated housing regime – preferring apartments over houses – does not specifically target families, but the case for greater density is often predicated on an ever-declining number of families and an undemonstrated growing preference for density. "Singles and childless couples are the emerging household type of the future," suggests developer and smart growth guru Chris Leinberger.

These post-familial trends have been incorporated into the influential report, "The New California Dream," widely accepted as gospel by many in our state's development community.

The author, the University of Utah's Chris Nelson, interpreted early 2000s public opinion surveys to suggest a growing preference for smaller lot sizes and apartments, though the data indicate no change over the past 10 years. Developers assume that as singles, empty-nesters and childless couples become as the state's primary market, this likely misperceived preference will gain even greater strength

So what would a post-familial future mean for California? You don't need a crystal ball to figure this one out. Just look at what is happening in other rapidly aging economies, especially Japan, but also much of Europe.

Dense housing, high taxes and lack of space (such as back yards) tend to discourage family formation. Slower population and labor-force growth then slows the economic engine, which, in turn, creates a greater imbalance between workers and pensioners. The result, ultimately, could be a kind of fiscal Armageddon.

Fortunately, none of this is inevitable. States such as Utah, Texas and North Carolina continue to attract families, bringing with them new workers, companies and customers. As their economies grow, they can generate broadly based revenue, unlike California, which is increasingly reliant on housing or stock-price bubbles that benefit the already affluent and older populations.

It is not our karma, Gov. Brown, to submit to a Japanese-like demographic demise. But revitalizing California will require a radical reevaluation of priorities and reconsideration of policy impacts on families.

Joel Kotkin is executive editor of NewGeography.com and a distinguished presidential fellow in urban futures at Chapman University, and a member of the editorial board of the Orange County Register. He is author of The City: A Global History and The Next Hundred Million: America in 2050. His most recent study, The Rise of Postfamilialism, has been widely discussed and distributed internationally. He lives in Los Angeles, CA.

This piece originally appeared in the Orange County Register.

Childhood kids photo by BigStockPhoto.com.

This is Your Government on Crack

$
0
0

Forget about a fiscal cliff or the threat of sequestrations. Bernanke’s use of the term “cliff” in 2012 is based on the erroneous analogy that fiscal policy had been moving along some level road for a period of time and was just now approaching an “end” or “falling-off” point. The reality is that federal spending has been rising rapidly since the federal government 1) absorbed the cost of repairing the damage done by the terrorist attacks of 2001, 2) decided to support wars on multiple fronts in the Middle East, 3) bailed out the Wall Street Banks, and 4) failed to pass a budget but 5) decided to continue spending as if nothing had happened. So called “sequestration” – which in this case basically means reducing spending and increasing revenue – would simply be a return to reality, coming down to earth, getting our feet back under us. Unfortunately, we the people appear co-dependents in this addiction.

This year started with Congress succeeding at its favorite athletic event: kicking the can down the road. The January inauguration of the President and installation of their new members provided the excuse. The fact remains that Congress has not passed a real federal budget since 1997 (“the first balanced budget in a generation”.) An “omnibus spending bill” was passed in April of 2009 but that is not technically a budget.

Congressional inaction has left the federal government running on extensions (“Continuing Resolutions”) of a budget that was passed when Bill Gates was still CEO of Microsoft, NASA landed the first spacecraft on Mars, and Google was working out of a garage. The last federal budget is from the time before iPods and iPads, before SPAM e-mail exceeded legitimate email, before Facebook, YouTube and Twitter – and before the global financial crisis that sent the world into recession and US federal spending into the stratosphere.

In lieu of doing anything meaningful, three senators – Kelly Ayotte (R-NH), Ron Johnson (R-WI) and Marco Rubio (R-FL), all in office since 2011 – took the time to write and introduce an amendment to the 1974 Budget Act that would require a macroeconomic analysis of the impact of new legislation. This monumental act of denial was such a complete waste of time that GovTrack.us gave it only a 9% chance of getting out of committee and a 1% chance of being enacted. In fact, from 2011 to 2013, while we were paying these three senators and hundreds more people in Congress, only 12% of the bills introduced in the Senate made it out of committee (11% in the House) and only 14% of those were enacted (24% in the House)! Having passed just a few more than 200 bills, the 112th Congress will go down in history as even less productive than President Harry Truman’s "Do-Nothing Congress" (the 80th, 1947-1948) which nevertheless managed to get 906 bills enacted.

In the 2012 election, openings were available for 1 new president, 33 new senators and 435 new representatives. Instead, Americans re-elected the same President, 19 of the same senators (58%) and 351 of the same representatives (81%). As a result, the 113th congress looks a lot like the 112th.

Recently, President Obama signed an executive order to lift the 2009 freeze on federal employee salaries – including the salaries for all members of Congress. When Congress voted to rescind the executive order – they have to vote to prevent an automatic annual pay increase – they did it not just for themselves but for all federal employees. Then they kicked the can (of the “sequestration” spending cuts) down the road two more months.

Their final act in January was suspending the debt limit “at least until May 19”. H.R. 325 may turn out to be the bright spot in this whole mess despite the fact that it gives Geithner’s, now Lew’s, Treasury carte blanche for financing profligate spending. The “No Budget, No Pay Act” was written on Thursday January 3, 2013; introduced in the House on January 21st by Rep. Dave Camp (R-MI since 1991) and cosponsor Rep. Candice S. Miller (R-MI since 2003); passed in the House on January 23rd by a vote of 285-144; passed in the Senate on January 31st by a vote of 64 to 34.

According to the bill, if Congress does not pass a real budget by April 15, the salaries of the members of the chamber unable to agree to the budget will be held in escrow until either they pass a budget or the last day of the 113th Congress. All the new Democrat senators voted “aye”; all the new Republican senators voted “nay”. The new House members were mixed. The bill goes to President Obama this week for signature.

Assuming he signs it, H.R. 325 allows the federal government to borrow money beyond the record $16.4 trillion debt we already owe. That debt is 104.5% of 2012’s $15.7 trillion GDP. The budget deficit – which has to be covered by borrowing – is running over $1 trillion each year or about 7% of GDP. The deficit alone is 44% of federal receipts. In other words, the government is spending over 40% more than it earns! That’s your government on crack.

It is like living with a drug addict:

“Waiting for the problem to resolve itself will get you nowhere. What you are seeing now, if it isn’t already completely out of control, will get completely out of control.”

The difference is that we, the taxpayers and our children and our children’s children, have to shoulder the burden – something the families of addicts are advised not to do. In a democracy, the majority rules and the majority decided to continue to live with these fiscal crack addicts. For the rest of us, our choice has to be to try to remain optimistic – take the good news where you can find it. There are no “fiscal therapists” or “family support groups” for disgruntled voters. We must seek out the venues where we can talk about the problem openly, don’t be fooled when the fourth estate hides the crack vials to gain favor with the Washington and Wall Street elites and take care of ourselves.

Susanne Trimbath, Ph.D. is CEO and Chief Economist of STP Advisory Services. Dr. Trimbath’s credits include appearances on national television and radio programs and the Emmy® Award nominated Bloomberg report Phantom Shares. She appears in four documentaries on the financial crisis, including Stock Shock: the Rise of Sirius XM and Collapse of Wall Street Ethics and the newly released Wall Street Conspiracy. Dr. Trimbath was formerly Senior Research Economist at the Milken Institute. She served as Senior Advisor on United States Agency for International Development capital markets projects in Russia, Romania and Ukraine. Dr. Trimbath teaches graduate and undergraduate finance and economics.

Lead photo: Marion Barry smoking crack, screenshot from FBI surveillance video footage in 1990 via Wikipedia Commons.

Blue States Double Down On Suicide Strategy

$
0
0

Whatever President Obama proposes in his State of the Union for the economy, it is likely to fall victim to the predictable Washington gridlock. But a far more significant economic policy debate in America is taking place among the states, and the likely outcome may determine the country’s course in the post-Obama era.

On one side are the blue states, who believe that higher taxes are not only just, but also the road to stronger economic growth. This is somewhat ironic, since, as we pointed out earlier, higher taxes on the “rich” would seem to hurt their economies more, given their high concentration of high-income earners. However, showing themselves to be gluttons for punishment, many of these states have decided to double down on high taxes, raising their rates to unprecedented levels.

This cascade of higher income taxes started in 2011 when Illinois, arguably the big state with the weakest economy, and the lowest bond ratings, raised income taxes by 66% and business taxes by 46%. Over the past year several other Democratic state governments have pushed through income tax increases, notably California, which raised the tax rate on people with annual income over $1 million to 13.3%, the highest in the nation. And now it appears that Massachusetts and Minnesota are about to raise their taxes as well.

This is happening at the same time that some red states — notably Kansas and Louisiana — are looking at lowering income tax rates by shifting to rely more on consumption or sales tax revenues. Some red states don’t have income taxes — notably Florida, Texas and Tennessee — and most of those who do are holding the line. Red state leaders, most notably Louisiana’s Bobby Jindal, are placing their bets on  expanding their economies, which would create new taxpayers, boost consumer spending and expand collections of sales taxes.

The contrast with the blue states — not so much those who voted for Obama, but those controlled totally by Democrats — could not be clearer. They appear to have chosen an economic path that essentially penalizes their own middle and upper-middle class residents, believing that keeping up public spending, including on public employee pensions, represents the best way to boost their economy.

Yet the gambit of raising state income taxes could not be coming at a worse time. The president’s adopted tax reforms have eliminated write-offs for state taxes for those individuals with incomes over $250,000 and families earning over $300,000. As a result, the affluent residents of these states — California, New York, New Jersey and Illinois alone count for 40% of these deductions nationally — now can expect to get whacked coming and going.

So which strategy is likely to work best? Most conservatives would assert that the red state approach will prove more effective. But in the short run at least, the free-money policies of the Federal Reserve are supporting many blue-state economies. Plastering institutional investors with low-interest greenbacks raises the price of assets — notably stocks and real estate — creating high incomes for wealthy taxpayers that can then fill the coffers of these states.

This particularly benefits New York, which depends heavily on Wall Street earnings. (Residents of New York City, which has a city-level income tax on top of high state rates, have the highest overall tax burden in the country.) States such as Massachusetts, Minnesota and even Illinois also have larger than average pockets of wealthy investors; if they do well, higher income taxes could, in the short run at least, bring substantial returns to their state coffers.

Perhaps the most obvious short-term beneficiary of the new high-tax policy may be my adopted home state of California. Given the higher share of the tax burden borne by the wealthy, a rising stock market tends to send gushers of funds into state coffers, particularly when Silicon Valley is enjoying one of its periodic bubbles. Equally important, increases in real estate prices— up some 25% in Orange County alone — also drives up capital gains and income taxes. This growth is driven not by higher salaries for Californians but is largely investor driven. A remarkable one in three California home purchasers paid with cash in 2012, up from 27% from the previous year. Home prices are climbing rapidly in the Bay Area, where the economy is performing better, and could reach 2007 pre-crash levels within the next year or two, if the current tech bubble continues.

In the short run, asset inflation combined with higher levels of taxation could solve California’s perennial budget problems, at least temporarily. The state is expected to move into surplus over the coming year. Gov. Jerry Brown sees this convergence as justification for his current “victory lap” in the state and national media. Brown, argues progressive analysts such as Harold Meyerson, has become very much the model of a modern blue state leader.

Yet, in the longer run, it’s dubious that higher income taxes will make states like California any more competitive or stable fiscally. During the property bubble in the mid-2000s, California also balanced the budget; in 2007 Gov. Arnold Schwarzenegger started comparing the Golden State to ancient Athens and blithely initiated draconian laws on climate change as well as expansion of the social safety net. All things seemed possible until the bubble burst, and with it the windfall from a relative handful of taxpayers. As revenues fell, the state went through five years of huge deficits, a major loss of jobs and growing impoverishment.

This is likely to happen again, once there’s a downturn in the housing or stock markets. In a sense  higher income taxes serve as an equivalent to what economist Suzanne Trimbath calls “fiscal crack.” For a short period there’s euphoria, as tax revenues flow in and the economy seems to recover. Yet the real problems, such as inadequate private-sector job growth, are never addressed, and as the high fades, the state again faces a loss of jobs and people.

Perhaps most troubling, states with high income taxes tend to lose people, particularly in the middle class. Over the past 20 years the four biggest net losers of population were high tax states: California, New York, New Jersey and Illinois. Between them they lost roughly a net 8 million out-migrants. The two big net winners, Texas and Florida, had no such taxes, and most of the other big gainers were relatively low-tax states.

Of course, not everyone is so concerned with income taxes. The ultra-wealthy like David Geffen seem gleeful to pay higher taxes, perhaps because this class, as Mitt Romney showed, have lots of ways to reduce their tax burdens, and after all, don’t have to worry about personal cash flow to keep the business going.

But enthusiasm for higher taxes historically has been less marked among the much larger group who, although affluent, are far from billionaires. Between 2006 and 2009, California lost a net 45,000 taxpayers earning between $5 million and $300,000 a year, according to the State Department of Finance.

To be sure, the outward movement slowed during the recession, but more recently the pattern has reasserted itself. Last year, all ten of the leading states gaining domestic migrants were low-tax states including five with no income tax: Texas, Florida, Tennessee, Washington and Nevada. In contrast high-tax New Jersey, New York, Illinois and California suffered the highest rates of out-migration.

Given these realities, raising already high income taxes has to qualify as somewhat self-destructive over the long run. But so great are the pressures in the blue states to fund expansive welfare programs and public employee pensions that there’s little chance the rising tax tide will soon abate. Sadly, there’s no hotline that seems capable of persuading them to rethink their latest suicidal lurch.

Joel Kotkin is executive editor of NewGeography.com and a distinguished presidential fellow in urban futures at Chapman University, and a member of the editorial board of the Orange County Register . He is author of The City: A Global History and The Next Hundred Million: America in 2050. His most recent study, The Rise of Postfamilialism, has been widely discussed and distributed internationally. He lives in Los Angeles, CA.

This piece originally appeared at Forbes.com.

Income tax photo by Bigstock.

America's Oldest Cities

$
0
0

One of the most important turning points in the social history of the United States occurred at the beginning of the 1940s. This is not about Pearl Harbor or the Second World War, but  rather about the economic, housing and transportation advances that have produced more affluence for more people than ever before in the world.

After being delayed by World War II, people began moving from the overcrowded cities to spacious (for that time) houses in the suburbs. They increasingly traveled to work and other destinations by car. These trends were at least two decades old at the time, but had been put on hold by the Great Depression. The prewar city (metropolitan area) was considerably denser, more oriented to mass transit and largely monocentric. By 2010, all major metropolitan areas had developed an urban form that was overwhelmingly suburban and polycentric, with the rise of edge cities and the even greater dispersion of edgeless cities. On average, areas outside the traditional downtowns (central business districts) accounted for 90 percent of metropolitan employment in 2000, ranging from a high of more than 95 percent in metropolitan areas like Phoenix, San Jose and Tampa-St. Petersburg to a low of 80 percent in New York.

Rating Metropolitan Areas by Pre-War Residential Development

Although dense urban cores persist in most metropolitan areas, their size and significance varies greatly. This can be illustrated by data from the 2007- 2011 American Community Survey, which makes it possible to rank metropolitan areas by their shares of pre-World War II residential development.

This article uses the percentage of dwelling units, both owner and renter occupied constructed before 1940 to rate the ages of the nation's 51 major metropolitan areas (those with more than 1 million population in 2010).  Overall, America’s major metropolitan areas are overwhelmingly postwar in their urban development, with approximately 14% of residences built before 1940. By comparison the 1940 populations of today's major metropolitan counties were just 35 percent of their 2010 populations.

Oldest Metropolitan Areas

The nation's oldest metropolitan areas, not surprisingly, are concentrated in the Northeast and the upper Midwest. Overall population growth has been modest in these regions compared especially to the South and the West.

  • Boston is the oldest with 35.7% of its residences built before 1940. This varies from 55.6% in the historical core city of Boston to roughly 32 percent in the suburbs, which are the oldest themselves in the country.   
  • Nearby Providence is the second oldest metropolitan area, with 33.1% of its dwellings built before 1940. The city of Providence is also the second oldest among historical core municipalities, at 58.8%. Providence overall share of pre-1940 housing stands at 30.2%. It is notable that the Office of Management and Budget now considers Boston and Providence to be in the same combined statistical area (consolidated metropolitan area).
  • Buffalo is the nation's third oldest metropolitan area with 30.5% of its residences preceding 1940. The core city of Buffalo is the oldest historical core municipality, with 62.8% of its housing predating 1940. Buffalo suburbs, however, are considerably newer, with only 20.1% older than 1940.
  • New York is the nation's fourth oldest metropolitan area, with 28.9% of its dwellings having been built before 1940. The city of New York has a much lower prewar housing percentage than the top four, largely because of the substantial amount of green field housing built in the more distant sections of Queens and especially in Staten Island during the 1950s and 1960s. New York's suburbs, which have accounted for nearly all of the growth in the metropolitan area have a pre-1940 housing share of 18.9%.
  • Rochester is the nation's fifth-oldest metropolitan area, with 28.8% of its housing prewar. The historical core municipality of Rochester has a high 58.1% of its housing in prewar stock, while the suburbs have a 21.1% share.

The next five oldest metropolitan areas are Pittsburgh, at 27.2%, Milwaukee and 23.3%, Cleveland 22.7% Chicago and 21.3% and Philadelphia at 21.2%. Among these, the oldest historical core municipalities are Cleveland, at 51.9% and Pittsburgh at 50.3%. Pittsburgh has the highest suburban pre-1940 housing stock, at 23.5%, the third highest in the nation after Boston and Providence (Figure 1).

Youngest Metropolitan Areas

The nation's youngest major metropolitan areas are concentrated in the South and West, comprising 28 of the 51.

  • Las Vegas is the youngest major metropolitan area.  "Sin City" has had the greatest percentage population growth since 1940, and is now approaching a population of 2 million, compared to less than 20,000 in 1940. Only 0.3% of the housing stock in Las Vegas was built pre-war.
  • Phoenix, which is grown from little more than 200,000 people in 1940 to more than 4 million people today, has a pre-1940 housing stock of only 1.0%. The city of Phoenix has a miniscule pre-1940 housing stock of 1.9%.
  • The third youngest major metropolitan area is Orlando with 1.7% of its housing stock having been built before 1940.
  • Perhaps surprisingly, Miami is the fourth youngest major metropolitan area with only 2.2% predating 1940. The historical core municipality of Miami, however, has one of the highest densities in the United States and a comparatively strong 10.6% of its housing is prewar.
  • Austin is the fifth youngest major metropolitan area, with 2.5% of its housing predating the war.


Tampa St. Petersburg, Houston, Riverside-San Bernardino, Raleigh and Dallas-Fort Worth round out the 10 youngest major metropolitan areas. Each of these has a pre-1940 housing stock between 2.7% and 3.1% (Figure 2).

Data for all metropolitan areas is provided in the table.


Table
Share of Housing Units Constructed Before 1940
US Metropolitan Areas Over 1,000,000 Population in 2010
RankMetropolitan AreaMetropolitan AreaHistorical Core Municipality(s)RankSuburbsRankHCM
1Boston, MA-NH35.7%55.6%432.4%11
2Providence, RI-MA33.1%58.8%230.2%21
3Buffalo, NY30.5%62.8%120.1%51
4New York, NY-NJ-PA28.9%41.3%1218.9%61
5Rochester, NY28.8%58.1%321.1%41
6Pittsburgh, PA27.2%50.3%723.5%31
7Milwaukee,WI23.3%38.9%1614.0%101
8Cleveland, OH22.7%51.9%615.4%81
9Chicago, IL-IN-WI21.3%43.8%1011.6%131
10Philadelphia, PA-NJ-DE-MD21.2%39.1%1414.9%91
11San Francisco-Oakland, CA20.4%45.5%99.2%151
12Hartford, CT19.3%43.1%1116.7%71
13Cincinnati, OH-KY-IN17.2%41.3%1312.6%111
14St. Louis,, MO-IL15.8%54.4%510.3%141
15Minneapolis-St. Paul, MN-WI15.0%46.7%86.1%241
16Baltimore, MD14.4%39.0%156.8%221
17Portland, OR-WA13.1%31.8%195.5%252
18Columbus, OH12.5%12.6%3112.4%122
19Louisville, KY-IN12.3%16.9%278.1%202
20Indianapolis. IN12.1%15.6%288.8%162
21Los Angeles, CA12.0%20.2%268.3%182
22Detroit,  MI12.0%31.7%228.2%191
23Kansas City, MO-KS11.9%21.5%248.8%172
24New Orleans. LA11.7%31.7%213.0%351
25Seattle, WA11.1%29.9%236.1%232
26Richmond, VA9.0%32.0%184.1%312
27Salt Lake City, UT8.9%31.8%203.1%342
28Washington, DC-VA-MD-WV8.6%36.1%174.6%291
29Denver, CO7.1%21.4%252.1%432
30Birmingham, AL6.8%15.6%294.5%302
31Oklahoma City, OK6.7%8.8%344.9%272
32Memphis, TN-MS-AR5.6%8.8%352.3%412
33Virginia Beach-Norfolk, VA-NC5.4%1.1%507.0%212
34San Jose, CA5.3%5.5%425.1%263
35Nashville, TN5.1%6.9%393.9%332
36San Antonio, TX5.1%5.7%404.1%322
37Sacramento, CA4.6%11.5%322.7%363
38San Diego, CA4.3%7.0%382.1%422
39Charlotte, NC-SC4.0%3.3%464.6%282
40Jacksonville, FL3.8%4.7%432.3%402
41Atlanta, GA3.2%14.5%302.0%452
42Dallas-Fort Worth, TX3.1%5.7%412.5%382
43Raleigh, NC2.8%3.1%472.6%373
44Riverside-San Bernardino, CA2.7%7.9%372.5%393
45Houston, TX2.7%4.6%451.6%472
46Tampa-St. Petersburg, FL2.7%8.4%361.9%462
47Austin, TX2.5%3.0%482.0%443
48Miami, FL2.2%10.6%331.5%482
49Orlando, FL1.7%4.7%441.3%493
50Phoenix, AZ1.0%1.9%490.6%503
51Las Vegas, NV0.3%0.3%510.3%513
Total13.6%25.5%9.0%

Notes:
Calculated from American Community Survey 2007-2011
HCM: Historical core municipality category: (1) Pre-War & Non-Suburban, (2) Pre-War & Suburban, (3) Post-War Suburban. There is one HCM per metropolitan area, except in in San Francisco-Oakland (San Francisco and Oakland) and Minneapolis-St. Paul (Minneapolis & St. Paul). Otherwise, the HCM is the first named municipality in the metropolitan area name, except in Virginia Beach-Norfolk, where it is Norfolk and Riverside-San Bernardino, where it is San Bernardino.

Not All Core Cities are the Same

This analysis indicates the substantial differences between not only the nation's metropolitan areas, but even more the differences between the core municipalities. For example, the core cities of Phoenix and Philadelphia have approximately the same population. Yet they could not be more different. Philadelphia has a long history, including a time as the nation's largest city around the period of the Revolutionary War. Phoenix, in contrast, is a product of the post-World War II boom. By 2010, Phoenix had become the nation's 6th largest municipality. Its 65,000 population in 1940 would rank it around 600th today. Figure 3 shows the average, maximum and minimum pre-war housing stock percentages by metropolitan area, historical core municipality and suburbs.

Categorizing Core Municipalities

In Suburbanized Core Cities, we classified the nation's core municipalities into three categories, based upon the extent of their pre-automobile development (This was described further in a paper co-authored with Peter Gordon of the University of California, Cities in Western Europe and America: Do Policy Differences Matter?).

The categories included "Pre-War Non-Suburban," which are core municipalities that were of high density in 1940 and have expanded their boundaries little since that time. Philadelphia, Baltimore and Providence are examples of these. The second category was "Post-War and Suburban," which includes municipalities that had a dense core of more than 100,000 residents in 1940, but contain large swaths of post-War suburban development (such as Los Angeles, Milwaukee and Atlanta). The third category was Post-War Suburban, which includes core cities that had little or no dense urban core in 1940 (such as Phoenix, Austin and San Jose).

Figure 4 illustrates the huge differentials in the pre-1940 housing stock between the metropolitan areas as classified by their historical core municipalities.

Commonalities

Even so, metropolitan areas are much more similar than their historical core municipalities. The bottom line is one different than one tends to hear in the urban-core-oriented press. In most of America the detached house predominates and virtually all development since 1940 has been suburban, both inside and outside the historical core municipalities.

Wendell Cox is a Visiting Professor, Conservatoire National des Arts et Metiers, Paris and the author of “War on the Dream: How Anti-Sprawl Policy Threatens the Quality of Life.”

----

Photograph: Boston (by author)

That Sucking Sound You Hear…Solutions to America’s Housing Crisis Are Needed

$
0
0

There is a crisis in America that’s not being attended to. It is the housing crisis, and its tentacles reach deep into the decline of the American middle class. Particularly, the interlocking dynamics of foreclosure, abandonment, and blight are draining the net worth of millions of Americans. The solutions to date have been piecemeal and ineffective. One possible initiative on the radar—which will be explained further below—entails a federal investment in the strategic demolishing of thousands of “zombie properties” that are eroding equity and quality of life.

This erosion is real. Writes Howie Kahn of his recent tour with a City of Detroit demolition crew:

Old roofs half-collapse under the weight of snow, forcing the walls to bulge outward. Moisture eats away the insides. Mold spoils the walls, softens the floors. In the summer, the sun bakes it all to a high stink and turns it crisp as tinder. Nature takes over. Trees sprout through the dormers. Animals get comfortable. We see this everywhere we go…So many innocent onetime starter homes, built on credit and striving, now in foreclosure. The holding company writes it off as a loss. And unless some crusading neighborhood association acts as a sentry, no one’s watching the house anymore. In essence, it belongs to nobody—or to everybody. Because once a house becomes worthless and unwanted…it’s everybody’s problem. Everybody’s crime scene.

As both a policy researcher and a Clevelander, I know these realities first hand. The city was home to over 40,000 vacant housing units in 2010, or nearly 20% of its stock. Several of these units were across a street from me, the result of a foreclosure on a rental investment purchased during housing inflation heights. Tenants were kicked out around 2009. The place sat empty, but I soon noticed people constantly disappearing into the back of the building. Drug activity I thought. Then one day I found a pile of hypodermic needles on my front lawn while cutting the grass. I have a child. The very real effect of blight acted as a drain on my property value, not to mention my quality of life.

And while I stayed in the City of Cleveland, many don’t. Cleveland lost 17% of its population from 2000 to 2010. The population decline (which is a long-term trend)—combined with the subprime mortgage crisis—created for unprecedented amounts of oversupply. Often, with both banks and homeowners walking away, the vacant structure devolves into blight until it becomes “a disamentiy effect”, which in plain-speak simply means living near something nobody would want to, with the unappealing prospect monetized in the devaluation of the house’s market value.

This disamentiy effect has been quantified. For instance, my colleague Nigel Griswold found that in Flint, MI each abandoned structure within 500 ft. reduced a home’s sales price by 2.27%. A study by Thomas Fitzpatrick of the Federal Reserve Bank of Cleveland showed an additional property within 500 ft. that is either delinquent or vacant reduces prices by 1.3%. In low-poverty areas the effect is greater: 4.6%.

Of course the larger problem is the broader economic effect, as depreciation goes beyond a lower return on investment and gets at household net worth. Specifically, according to the Census Bureau, household net worth declined 20% from 2005 to 2010 (40% since 2007). Of this decline, 76% was attributed to a loss of home equity. Minorities were hardest hit, with average Black household equity falling from $70,000 to $50,000 and average Hispanic household equity falling $90,000 to $40,000.

Such declines in net worth have swelled the number of Americans stuck in precarious economic conditions. A recent report called “Living on the Edge: Financial Insecurity and Policies to Rebuild Prosperity in America” found that nearly half of Americans are “liquid asset poor”, meaning “they lack the savings to cover basic expenses for three months if unemployment, a medical emergency or other crisis leads to a loss of stable income.”

Vacant house in Detroit. Courtesy of Streetsblog

Such economic figures are alarming, and they call for intensive solutions aimed at reconstituting the American middle class, if only to achieve a broader economic recovery outside of the investor class. One such solution could entail a large-scale strategic demolition of “zombie properties” in America’s hardest hit areas, such as the Rust Belt.

Why demolition?

It is simple, really: by removing the disamentiy effect you are giving the value of the surrounding houses a chance, and there is initial empirical proof that this does in fact occur. Specifically, in his examination of Flint, MI, Griswold found that Genesee County’s demolition investment was paying off, with $3.5 million of demolition activity producing $112 million in improved surrounding property values. Not a bad ROI, and it’s a return that positively affects homeowners, investors, and government alike.

The question remains: why isn’t there a concerted effort to once and for all excise the hundreds of thousands “zombie properties” that are draining value from the American economy?

The reasons are varied, but one in particular relates to a lack of empirical proof that demolition has a definitive monetary impact. One current study, spearheaded by Jim Rokakis of the Thriving Communities Institute, aims to fill the gap. The study, headed by Nigel Griswold, myself, and the Center on Urban Poverty and Community Development at Case Western Reserve University, was partly conceived out of a September 2012 interagency meeting on Residential Property Vacancy, Abandonment and Demolition in which—after hearing pleas from a largely Midwestern contingent—officials from Federal Treasury issued a challenge: show through robust empirical means that demolition (1) retains value on nearby properties, and (2) decreases the likelihood of future foreclosures. If the results prove definitive, Treasury suggested they could make a federal strategic demolition initiative a reality.

Vacant houses in Buffalo. Courtesy of the NY Times.

Of course the operative word here is “strategic”, as bulldozing for the sake of bulldozing does not a solution to a crisis make. As such, the intent of this research is also to help those on the ground ascertain where an investment in demolitions could pay off most. For example, there are properties—particularly architecturally-rich properties with high intrinsic value—that should be preserved and shuttled down another path. As well, there are areas in cities in which population decline is shifting ever so slightly. The area I had lived was one of them. And the house that was once vacant across from me has been renovated and is now home to a number of tenants. Thus, the authors of the study are cognizant of the contextualization that exists in various hardest hit cities, and so recommendations will be matched with an understanding as such.

That said, the study is currently ongoing, and while the results are as yet unclear—and in fact may not be robust enough to convince D.C. to act—the effect of “zombie properties” on the financial and mental well-being of regular Americans is anything but uncertain.

As a Clevelander, I know this all too well.

Richey Piiparinen is a writer and policy researcher based in Cleveland. He is co-editor of Rust Belt Chic: The Cleveland Anthology. Read more from him at his blog and at Rust Belt Chic.

Vacant Cleveland house photo by Flickr user edkohler.

Natural Gas Boom: The “Janus” Effect

$
0
0

The last five years have seen a revolution in terms of the amount of inexpensive U.S. natural gas made available for consumption in power plants, road fuels, and as a feedstock for new and expanded petrochemical plants. We are now even debating the advisability of large volume natural gas exports in the form of liquid natural gas (LNG).  

This bonanza has created euphoria in the fossil energy and industrial communities, but has also created something of a “Janus effect” within the Environmental community.  To the Romans, Janus (the two faced god) provided a cohesive view of the present as well as an uncertain view of the future. In Rome, the temple to Janus was opened only when Rome was at war. During peace time, presumably because the future was more certain, the doors of the temple remained closed. They were last opened in AD 531 immediately prior to an invasion by the Goths. We all know how well that turned out.

Environmentalists are reacting to the natural gas bonanza in three ways. The first group, which we may define as “pragmatists”, see a hopeful face based on solid evidence that natural gas helps with achieving multiple environmental goals by reducing particulate emissions, sulfur emissions, NOX levels and CO2 emissions.  They acknowledge natural gas fueled generators emit approximately 40% less CO2 per kilowatt hour than the older coal-fired units they are largely replacing. Although the aftermath of the recession has reduced the use of most other fuels, natural gas now rivals coal as the major fuel source for power generation in the US.

A second group, the “environmental fatalists” are less impressed with the displacement effects on coal but appreciate that natural gas plants provide crucial support when mandated, for intermittent renewable power options, such as solar and wind. Once renewables represent approximately 10% of aggregate capacity, negative side effects of these “intermittent” sources become problematic; too much dependence on them can cause grid “instability” or, in a worse case, cascading power failures and massive blackouts. 

Then there’s the third group, we’ll call the “ideologues.” Often the loudest, this group views natural gas as an implacable enemy for undermining the economic viability of renewable energy projects. They oppose the use of natural gas on principle and call for ever more restrictive regulations and production constraints on natural gas fueled power production. In their view, increasing the costs of generating electric power from natural gas will allow renewable generation finally to achieve cost parity. This “logic” explains at least some of the objections to fracking, an essential requirement for shale gas production, which, if restricted, would seriously undermine production and consumption of additional natural gas in the U.S.  

The ideologues believe in “leveling the playing field” so that renewables such as solar and wind can be made economically viable. They see themselves fostering a new economy based on renewable energy. The rest of society’s role is to “shut up” and allow them unimpeded access to scarce and valuable assets (e.g. subsidized prices and preferential access to the grid) in order to wipe fossil fuels off the grid. 

Natural gas based power generation represents the ideologue’s worst nightmare.  They know that increasing the use of natural gas for a generation undermines the economic value of renewable-based generating companies. It’s not hard to imagine that for those individuals and businesses profiting from renewable subsidies and mandates, natural gas represents a great threat. The argument therefore does make a certain amount of sense if you accept the initial premise.    

Renewable mandates generally represent a commandment that “Thou shalt generate e.g. 10% of a given utility’s power output using approved renewable resources”, regardless of the costs to ultimate consumers.  Requiring utilities to purchase high priced renewable power under so called feed in tariffs results in those higher prices simply being “rolled in” to the aggregate cost of power delivered to all consumers and duly covered by an aggregate rate requirement.

Such initiatives to support an artificial market for renewable power generation are politically vulnerable, since the public tends to reject mandates forcing investors in renewable energy projects to face bankruptcy as a distinctly possible outcome. Government-guaranteed loans supporting construction of the plants manufacturing new PV solar cells or wind turbines have already outraged a public forced to pay for their bankruptcies.  

What is the future of America if the renewable mandate regime expands under state or federal programs? That future is now on display in Germany, a trailblazer in applying subsidies and preferential access to the grid to support the adoption of solar and wind power. The country has not only restricted the construction of new coal and nuclear power units, but also limited the operations of natural gas fueled generation by providing preferential prices and access to the grid for renewables. To be fair, the Germans are also groaning under the cost of imported natural gas supplies, primarily from Russia.

Unfortunately, as a result Germany does not have adequate load following capacity to absorb the ups and downs of renewable power generation. The result is grid instability. These policies are creating potential dangers for an economy heavily dependent on power intensive manufactured exports.  Already German petrochemical manufacturers, such as BASF and Bayer, have warned that the country faces grave threats to its manufacturing base due to lower cost competition in the natural gas-rich US. Volkswagen has been equally blunt about their need to manufacture car parts outside of Germany. Remember that Germany’s job pool has roughly 24% of the work force engaged in export focused activity.

The Germans avoid discussing their lack of enthusiasm for searching out low cost coal gas and shale gas deposits in the fatherland. The country now endures an aggregate price of 32 cents/kilowatt hour vs. a US price of about 10 cents/kwh. The bad news is that this already elevated German rate is slated to increase further in the next year, by another 50%, to a level of 48 cents/kwh.  

To make it through Germany presumes the good will of neighboring countries which face their own energy challenges. Germany’s current power generation profile has approximately 20% of its power being provided by renewable sources, primarily wind and solar. Germany’s neighbors complain that the country is exporting the grid instability associated with its “green” policies. It’s gotten so bad that the country, which loathes nuclear power, is actually expanding the use of coal fired generation. In essence, coal fired generation is growing in Germany at the expense of higher cost natural gas generation. (The silver lining is that the U.S. is supplying the extra low cost coal required). Naturally, Germany’s CO2 and particulate targets are not being met, while the equivalent US targets are being met ahead of schedule.   

Not surprisingly, the German government is now back tracking because their economy cannot support, from a technical or economic perspective, the current level of installed renewables. Angela Merkel has recently called for a more balanced approach to power generation. That will probably mean a policy of diverting subsidies and preferential treatment from solar and wind to natural gas and hydro.

The Current Status in the US

Back here in the US, we’ve managed to spend $97 billion or so on government funded wind and solar projects that certainly will not survive without operating subsidies, feed in tariffs, preferential access to the grid and production mandates.

Fortunately, the US is upgrading our power generation fleet by building new, unsubsidized, gas-fired generation plants throughout the country. We are also seeing new pipeline and grid infrastructure coming to market along with significant expansions of our refining and petrochemical manufacturing facilities, exploiting nonconventional hydrocarbon resources. The bulk of this expenditure is being managed with minimal federal financial support.

However, adverse government regulation of fracking could bring the shale gas band wagon to a sudden halt. (Beyond that, a measurable, multi-year slowdown in permits for new gas pipelines is also having a deleterious effect.)

Recognizing the risks, shale gas proponents are taking another approach. Having apparently convinced the pragmatists and the fatalists of the benefits of natural gas, they are now beginning to spend significant sums in an effort to educate the general electorate and thereby isolate the diehard   ideologues.  

Fortunately, the majority of the environmental community is not made up of latter day luddites bent on destroying western civilization, just as the majority of the oil and gas industry is not made up of barbarians seeking to plunder the environment. The majority of the population consistently supports measured progress on both the environmental and economic fronts.

The challenge now is to grow support for  environmental compromises that produce favorable results for everyone. We still live in a democracy where everyone gets to vote and to have his or her say. However, we do not live in an “Alice and Wonderland” world where everyone can create his own reality. Germany is already facing the downside of listening to their ideological enthusiasts. Let’s take the German lesson to heart, and embrace a more pragmatic approach. It is after all, the American way.

Eric Smith is a Professor of Practice at the A.B. Freeman School of Business at Tulane University. He serves as the Associate Director of the Tulane Energy Institute. He is a Chemical Engineer and has an MBA from the A. B. Freeman School at Tulane University. 

U.S. Late to the Party on Latin America, Africa

$
0
0

President Barack Obama's proposed tilt of U.S. priorities toward the Pacific – and away from the historical link to Europe – represents one of the most encouraging aspects of his foreign policy. Although welcome, we should recognize that this shift comes about three decades too late and that it may miss the rising geopolitical centrality of sub-Saharan Africa and Latin America. The emergence of these longtime historically impoverished backwaters has been largely missed as American policy-makers and businesses now obsessed with the challenges and opportunities posed by the emergence of China and, to a lesser extent, India. Sub-Saharan Africa, for example, over the past decade has produced six of the world's 10 fastest-growing economies. From 2011-15, according to the International Monetary Fund, seven of the fastest-growing countries will be African, and Africa as a whole will surpass the slowing growth rates in Asia, particularly China.

This growth has caused the region's poverty rates, still unacceptably high, to fall from 56.5 percent in 1990 to 47 percent today. Further growth will likely push poverty levels down further.

Outgrowing U.S.

With 600 million people, including a middle class of some 400 million, Latin America represents one of the world's great growth markets. Over the past two years the growth rate in Latin America has been twice – and more in some countries – that in the United States, Europe and Japan. Latin America's unemployment rate is reaching historic lows. A decade ago, it was 11 percent. Today it is 6.5 percent, well below levels in the U.S. or Europe.

As in Africa, growth has worked to reduce Latin America's historic high rate of poverty by 17 percent since 1990. Overall, Latin America's combined gross domestic product is already larger than that of Russia and India combined – larger, in fact, than any nation or region besides the U.S., the E.U. and China.

Demographic trends are likely to accelerate this process. Rapidly aging populations in Europe, Japan and East Asia threaten both workforce growth and fiscal stability. Today, people at least age 60 account for 13 percent of the population in China, 15 percent in east Asia, 32 percent in Japan and 22 percent in Europe, but barely one in 10 residents in Latin America; only 6 percent of Africa's population is made up of seniors. By 2050, one-third of people in east Asia, Europe and China will be over 60, while Japan will pass 40 percent. In contrast, Latin America's over-60 population will be 20 percent, and Africa's half that.

Indeed, over the next decade, Africa is slated to add more people than all of Asia, while Latin America's growth will far exceed that of Europe, East Asia or North America. A surprising percentage of the residents in these regions will be middle class. From 2000-14, according to a McKinsey survey, the number of African households with annual incomes of at least $5,000 will grow from roughly 59 million to well over 106 million. Africa already has more middle-class households (defined as those with incomes of at least $20,000) than India.

This demographic vibrancy is helping spark industrial growth, both for export and domestic consumption. Latin American countries, led by Brazil, have emerged as industrial centers while Mexico is rapidly replacing China as the preferred foreign manufacturing platform for American firms hailing from California to Texas. Manufacturing growth – particularly in textile and garments – has also begun to grow in parts of sub-Saharan Africa, following in many ways the patterns earlier seen in Japan, China, Southeast Asia and Bangladesh.

Hunt for Resources

But much of the importance of these regions lies with their enormous natural resources.

Conventional wisdom in our chattering classes holds that, in the "information age," raw materials no longer represent an advantage for economic growth. Yet as the world's population grows, and its middle class expands, there seems to be a cascading demand for raw materials, either for direct consumption or for use in manufactured goods. Energy consumption itself, according to the International Energy Agency, could rise as much as 50 percent by 2030, with more than 84 percent of that increase coming from fossil fuels.

Increasingly the competition over Latin America and Africa reflects something of a reprise of what was once seen as "the great game," where European colonial powers struggled for control of resources and land masses in regions as diverse as Central Asia, Africa, South America and the Middle East. Today, this struggle includes many more protagonists, including Japan, Korea and, most powerfully, China, all of whom are targeting investments in the continent.

One result has been growing interest in Africa where foreign direct-investment projects grew by 27 percent in 2011 alone. American companies like Wal-mart and Google are expanding there, but much of the big investment comes from China. China's former vice-minister of commerce, Wei Jianguo, recently told China Daily that Africa eventually will surpass the U.S. and the E.U. to become China's largest trading partner. Last year, Latin America reaped a record $145 billion in FDI, an increasing share from China.

Resource-hungry China has reason to focus on Africa and Latin America, which hold much of the world's diminishing supply of not-yet-developed farmland, as well as tremendous reserves of precious minerals and energy. Africa, by current accounts, possesses 10 percent of the world's reserves of oil, 40 percent of its gold, and 80 percent to 90 percent of the chromium and the platinum metal group.

These supplies, notes a recent McKinsey report, may be grossly undercounted, since much of the continent has not been thoroughly explored. But, to date, Africa has a proven stock of $13 trillion to $14.5 trillion worth of energy resources (oil, coal, gas, uranium); South Africa alone is estimated to have $2.5 trillion in mineral wealth.

Latin America, too, enjoys ample natural resources, to go with its rapidly developing industrial sector. Brazil is the world's third-leading food exporter, and other Latin countries, such as Chile and Mexico, have been emerging as major producers of commodities.

Latin America also seems well-positioned to benefit from the shift of world energy production from the Middle East and Russia to the Americas. Brazil has already made large strides in offshore oil development; possible future offshore oil finds in Mexico and Cuba create an energy boom through the entire Caribbean Basin.

U.S. Needs to Shift

Clearly, the rise of these two regions signals that we need to adjust our foreign policy priorities. American business is already becoming more engaged with these two continents; over the past decade trade, growth there has more than tripled, compared with a doubling of trade with Asia and Europe. We need to move not only beyond our old strategic ties with Europe, and embroilment with the volatile Middle East, and look to engage in the places where our primary rivals, notably China, already see the future of the world economy.

Will America, finally awakening from its European slumbers and no-win Middle Eastern involvements, get with the new program? It took three decades for the foreign policy establishment to acknowledge the reality of the Pacific era. Hopefully it won't take nearly as long to acknowledge the growing influence of both our southern neighbors and emergent powerhouse that is Africa.

Joel Kotkin is executive editor of NewGeography.com and a distinguished presidential fellow in urban futures at Chapman University, and a member of the editorial board of the Orange County Register. He is author of The City: A Global History and The Next Hundred Million: America in 2050. His most recent study, The Rise of Postfamilialism, has been widely discussed and distributed internationally. He lives in Los Angeles, CA.

This piece originally appeared in the Orange County Register.

World image by BigStockPhoto.com.


How We Should Navigate the Florida Archipelago

$
0
0

Leafy, timeless rural routes and monotonous, flat highways have characterized Florida’s network of state roads since the early 20th century. Vacationers in the Sunshine State either stick to the interstates – often a hot, frustrating parking lot – or consign themselves to the stop-and-go, confusing local roads. Future Corridors, the state’s vision of a future, integrated road network, is set to finish its conceptual phase this year, and promises to radically revamp the state’s road system. Since this vision will quickly harden, it deserves a close look by a broad portion of the state’s population to see if it truly addresses the state’s needs or, like so many Florida initiatives (the state’s notorious voting system comes to mind), becomes an ignominious reminder of provincial politics at its worst.

Begun in 2006, Future Corridors contains some progressive, sophisticated thinking. Taking existing corridors and redesigning them to segregate shorter trips, trucks, and transit makes sense and should have happened a long time ago. Such managed use lanes are already popular in California, Texas, and elsewhere. The study also looks at enhancing rail systems for both freight and passenger service.

Florida is already a maze of country roads, rail lines, commercial strips, turnpikes, and interstate highways, with little remote wilderness left. So enhancing, multiplexing, and otherwise modernizing the existing corridors is practical and efficient, and will conserve the state’s inner beauty.

Smoothing out the lumpy traffic flow will also improve the state’s economy. Florida consumes more than twice the goods that it exports in terms of freight, and its tourist-business throughput is more than that of many nations. Its boom/bust economic oscillations, however, mean that road-building comes in fits and spurts, and is not necessarily tied to real-time needs. To get from Gainesville to Jacksonville, for example, you still have to journey upon twisty, peculiar roads built in the 1930s.

Florida’s home-grown turnpike, built in the 1970s to funnel tourism, is impossibly congested in some areas today. As population has swelled, it has changed into a local alternative to traffic-choked arteries for short trips and commutes, as well.

Future Corridors isn’t just about highways, however. Besides its beaches, Florida’s signature characteristic seems to be the ubiquitous, homogenous, low-grade commercial strips that have overtaken our once-quirky roadside culture. Along these main drags, the American narrative can be read in all of its glory: they are the great equalizers, where all institutions are reduced to blue or red logos 300 yards before the turn lane. Decried as the aesthetic horror that they certainly are, these highway markets remain, nonetheless, emblems of the American dream. Anyone with a car can access everything; emporiums are born, flourish, and die. They are transformed quickly and without sentimentality into newer offerings. These strips have transformed much of the state’s coastline into a continuous, multi-stranded conduit of consumption for the masses. The Future Corridors proposal calls for more rural highways in Florida and opens up more land for this kind of development.

Florida’s future, regardless of its new road plan, inevitably will include more of these strips, not fewer; more traffic and highways, not less. Nevertheless, the state’s environmentalists and urban intelligentsia are already forming positions against much of the vision. As the first regions — Tampa-Orlando and Tampa-Jacksonville — are rolled out, 2013 will prove to be a dynamic year of controversy. As state government battles environmental and urbanist boosters, it seems like a California-like trajectory is already set, with some critical concerns sadly cast aside.

Florida currently suffers from “hourglass” transportation planning. On the bottom of the curve, short, regional toll highways and roads are built to enhance local connectivity, but connect only feebly to the rest of the state. On the top, the federal interstate highway system dumps huge quantities of people into the state from the Midwest, the east coast, and the South. In the middle a statewide, home-grown transportation system built to handle this volume has been notably missing.

Competing regions have little incentive to link up with each other. Tampa and St. Petersburg, for example, continue to squabble for small economic advantages, instead of looking at the bigger picture. Meanwhile, the nation’s Department Of Transportation is only mildly interested in state connectivity issues. The gaping hole in statewide transportation planning has never been adequately filled, as any tourist sitting on I-75 in the springtime can attest.

Future Corridors is the latest incarnation of Florida’s long, mostly inept growth management strategy. The Department of Community Affairs, a state-level regulatory bureaucracy, replaced the previous laissez-faire ethos. It survived until 2011. The regulators represented an impediment in a state that is developed largely by outside economic interests, so they were done away with. With a new bubble growing, these interests salivate over future developable land that will be made available by road-building activity. Thus, growth management continues in a sort of feudalistic twilight, where political connectedness replaces the public process with the tacit support of the citizens.

Politicians come and go, so the new process may not continue past the next election. In the meantime, public advocates for the state’s future would do well to advance their own vision of the future, which should include several key ideas.

For starters, the state would benefit from a twenty-first century transportation network that is digitally connected. Planning a trip in Florida is a bit like planning a sailing trip without a weather report. Traffic jams, road construction, and other obstacles seem to crop up without warning, causing trip or meeting delays or even postponements. Delivering real-time digital information to travelers might be out of the cost and logistical range of individual regions, but the state could feasibly invest in a system that updates a driver’s handheld device to help reroute traffic flow and forecast problems ahead.

And no argument about wilderness preservation or road construction carries any weight until the state’s notorious safety issues have been addressed. Whether it is traffic accidents, pedestrian fatalities, or gruesome bicycle clashes, Florida’s roads consistently make the list of the most dangerous roads in the nation. Buried deep in DOT PowerPoints are meek statements about safety, but little has been done. While Florida beckons the world to its door for vacation, its reputation is marred far worse by poor roads than it is by junky, bland, retail, and it must be fixed.

More strategically, however, a road system should reflect the new notion that Florida’s urban clusters constitute a single large megapolis, unified in demography, economics, and culture: the so-called “Florida Archipelago”. Geography is responsible for the weblike settlement pattern, and this geography should be enhanced by a safe and effective transportation system, rather than be treated as an obstacle to be ignored or plowed over with ruthless technology. Corridors should be planned to take advantage of this spread-out nature. Intensifying urban activity where it makes sense, and intelligently intertwining agriculture and wilderness into the planning process, could create a vibrant, robust tropical megapolis.

Finally, the state’s transportation system should help reconcile the growing affordability gap in housing, which is glaring in Florida. A thin line of very high-priced vacation homes hug the coastline, subsidized by people living in less risky locations. This arrangement exacerbates the affordability gap in housing. Meanwhile, rural road networks are often disconnected and poorly maintained. Public transit is ineffective and perennially used as a political plaything, rather than a serious attempt to reduce car dependence for those who would most benefit from it – the low income and the elderly.

Paving over Florida’s interior will close rural areas that remain within the cost of living of the state’s retirees, and it points to a future that will increasingly resemble overpriced, highly regulated California. And with more and more dependence upon toll roads, the state’s transportation system will, if it continues on this trajectory, further separate the haves and the have-nots.

Urban feudalism is the top-down, urban-centric, affluent-class authoritarianism that seems to be overtaking the future of Florida and of America. Historically the state has been able to escape this fate, partly because it has a diversified lower middle class, along with service and construction workers. In the past, the rich came to the state mostly when on vacation. This era appears to be waning, however.

Florida’s working-class population will be squeezed tighter if policies create rising costs that move people further from their jobs. As Florida's new growth strategy, Future Corridors, moves from concept into planning stages, the broadest conversation among citizens and the planners will do the most good in the long run.

Richard Reep is an architect and artist who lives in Winter Park, Florida. His practice has centered around hospitality-driven mixed use, and he has contributed in various capacities to urban mixed-use projects, both nationally and internationally, for the last 25 years.

Photo by Adam Fagen: Roadside Gator in Monroe County, Florida, along the park road to Flamingo, Everglades National Park.

Transit Legacy Cities

$
0
0

Transit's greatest potential to attract drivers from cars is the work trip. But an analysis of US transit work trip destinations indicates that this applies in large part to   just a few destinations around the nation. This is much more obvious in looking at destinations than the more typical method of analysis, which looks at the residential locations of commuters. This column is adapted from my new Heritage Foundation Backgrounder "Transit Policy in an Era of the Shrinking Federal Dollar."

Transit Legacy Cities

Transit commuting is heavily concentrated to destinations in just the six core cities (historical core municipalities) of New York, Chicago, Philadelphia, San Francisco, Boston and Washington (Backgrounder Chart 9). I call them the "transit legacy cities," because their high transit market shares relate to their development before the automobile became dominant. Because there is such a lack of clarity in the use of terms that apply to cities, it is important to emphasize that the transit legacy cities are municipalities, not the surrounding metropolitan areas or urban areas, where the majority of residents live (Note 1). 


The transit legacy cities account for nearly 55 percent of the nation's transit commuters, by work trip destinations, according to the American Community Survey (2008-2010). By contrast, the transit legacy cities have an overall national employment market share barely one-tenth their national transit share (6 percent). Moreover, combined, the transit legacy cities cover a land area little larger than the core city (municipality) of Jacksonville, Florida.

At the same time, the "other side of the coin" is that commuting to other destinations is dominated by the automobile, from the suburbs in metropolitan areas with transit legacy cities, and even more so in the other 45 major metropolitan areas (with more than 1,000,000 population) and the balance of the nation.

Legacy Cities: Transit's Strength

The extent of the concentration in the six transit legacy cities is illustrated in Backgrounder Table 1. In some ways, transit is, first and foremost,  really a New York story. More than one-third of all transit work-trip commuting is to destinations in the core city of New York. The dominance is even greater for high-capacity subways/elevated services, a mode in which where New York represents two-thirds of national commuting.

The Key: Large, Concentrated, Well Served Downtowns: The concentration of transit commuting in the six transit legacy cities reflects the factor that is probably more responsible than any other for attracting people from cars to transit. This is a highly concentrated downtown area (central business district, or "CBD") from which a dense network of rapid transit services radiates.

The six transit legacy cities are also home to the six largest CBDs in the nation, where transit's share of commuting is far higher than compared to the rest of the nation. Approximately three quarters of commuters to the sprawling Manhattan CBD in New York (south of 59th Street) commuted by transit in 2000. Less well known is that New York also contains the CBD with the second largest transit work trip destination, downtown Brooklyn (58 percent), which is followed by downtown Chicago (55 percent).

In addition, between nearly 40 percent and more than 50 percent of commuters used transit to the CBDs of Boston, San Francisco, Philadelphia and Washington. While covering a land area less than one-half the size of Orlando's Walt Disney World, these downtowns accounted for 35 percent of national transit commuting.

Outside the Transit Legacy Cities: Automobile and Work at Home Country

So what about the 94 percent of US commuters who work outside the transit legacy cities? The answer is that the automobile dominates, and transit has been overtaken by working at home. In the suburban areas of metropolitan areas with transit legacy cities, the car carries 18 times as many people to work locations as transit. In the core municipalities of the 45 major metropolitan areas without legacy cities, cars carry 29 times as many commuters as transit, and 51 times as many in the suburbs. Outside the nation's major metropolitan areas, cars carry 82 times as many commuters as transit (Backgrounder Table 1)

Further, outside the transit legacy cities, working at home (including telecommuting) provides access to twenty percent more jobs than transit (Backgrounder Table 3).

An American Love Affair with the Automobile?

The enduring myth of the American love affair with automobile is countered by the huge transit market shares to city downtowns . For example, commuters to Manhattan are five times as likely to use transit as cars. On the other hand, commuters to the edge city of Parsippany, on the I-287 corridor in suburban New Jersey are 50 times as likely to use their cars as transit. Yet both employment centers serve the same labor market. The issue is not preferences, it is rather rational choice. It would be irrational for most people to commute to Manhattan by car, principally because of the traffic congestion and cost, particularly for parking. It would similarly be irrational for most people to commute to Parsippany by transit, because it either could not be done at all, or it would take too long.

Transit's work trip destination market share is an effective measure of its relevance to the market.

And lest anyone should counter that the answer is more money, consider this.

A Cost Not A Revenue Problem

Portland (with a core city that is not a legacy city) has long been held out as a model for improving transit. Yet, after billions of dollars in federal and local tax subsidies, more than 50 times as many people travel to work to suburban locations by car as by transit. More than five times as many work at home as use transit, and working at home costs taxpayers virtually nothing. Yet, despite all these billions, Portland's transit system is in crisis. Tri-Met's  Executive Director Neil McFarlane has warned of 70 percent service cuts over 12 years without substantial changes to union contracts.

Transit’s fundamental problem is not insufficient revenue but insufficient cost control. Since 1983, national transit expenditures have risen at an inflation-adjusted rate nine times that of its increase in commuters (Note 2). Even if costs were under control, it would be financially impossible to provide automobile-competitive transit throughout the modern urban area, as Professor Jean-Claude Ziv and I showed in our WCTRS paper (Megacities and Affluence: Transport and Land Use Considerations).

Celebrating Transit

Yet, beyond its inability to convert generous taxpayer subsidies into corresponding ridership increases, transit deserves credit for the large number of people it moves to jobs in the legacy cities. This success should be celebrated although it remains an impossible, prohibitively expensive, dream elsewhere.

Wendell Cox is a Visiting Professor, Conservatoire National des Arts et Metiers, Paris and the author of “War on the Dream: How Anti-Sprawl Policy Threatens the Quality of Life.”

----

Note 1: Each of the transit legacy cities has a lower population than the surrounding suburbs. This ranges from nearly 45 percent of the population in the suburbs of the New York metropolitan area to little more than 10 percent in Washington.

Note 2: Within the first 30 days of my time on the Los Angeles County Transportation Commission, I became convinced that transit's principal problem was cost control (see Toward More Prosperous Cities). This was then and today remains clear from the above-inflationary escalation of unit costs. Regrettably that trend continues today and has seriously impeded transit's ability to increase ridership.

-----

Photo: Downtown Philadelphia (by author)

Is the Family Finished?

$
0
0

Sitting around a table at a hookah bar in New York’s East Village with three women and a gay man, all of them in their 20s and 30s and all resolved to remain childless, a few things quickly became clear: First, for many younger Americans and especially those in cities, having children is no longer an obvious or inevitable choice. Second, many of those opting for childlessness have legitimate, if perhaps selfish, reasons for their decision.

“I like seeing people with their children, because they have their special bond, and that’s really sweet, but it’s not something I look at for myself,” says Tiffany Jordan, a lively 30-year-old freelance wardrobe stylist who lives in Queens in a rent-stabilized apartment and dates a man who “practically lives there.”

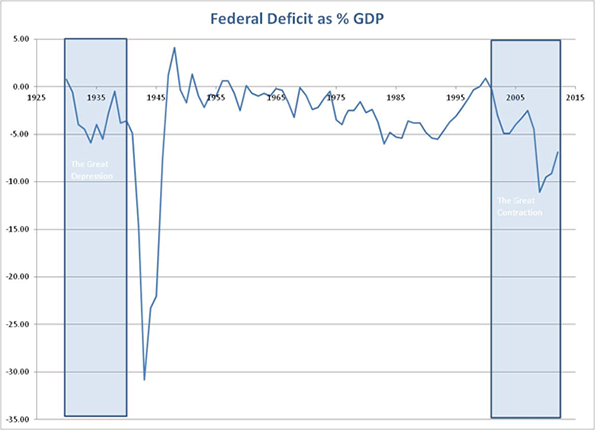
Jordan and her friends are part of a rising tide. Postfamilial America is in ascendancy as the fertility rate among women has plummeted, since the 2008 economic crisis and the Great Recession that followed, to its lowest level since reliable numbers were first kept in 1920. That downturn has put the U.S. fertility rate increasingly in line with those in other developed economies—suggesting that even if the economy rebounds, the birthrate may not. For many individual women considering their own lives and careers, children have become a choice, rather than an inevitable milestone—and one that comes with more costs than benefits.

“I don’t know if that’s selfish,” says Jordan, the daughter of an Ecuadoran and an Ohioan who grew up in the South Bronx, explaining her reasons for a decision increasingly common among women across the developed world, where more than half of the world’s population is now reproducing at below the replacement rate. “I feel like my life is not stable enough, and I don’t think I necessarily want it to be ... Kids, they change your entire life. That’s the name of the game. And that’s not something I’m interested in doing.”

The global causes of postfamilialism are diverse, and many, on their own, are socially favorable or at least benign. The rush of people worldwide into cities, for example, has ushered in prosperity for hundreds of millions, allowing families to be both smaller and more prosperous. Improvements in contraception and increased access to it have given women far greater control of their reproductive options, which has coincided with a decline in religion in most advanced countries. With women’s rights largely secured in the First World and their seats in the classroom, the statehouse, and the boardroom no longer tokens or novelties, children have ceased being an economic or cultural necessity for many or an eventual outcome of sex.

But those changes happened quickly enough—within a lifetime—that they’ve created rapidly graying national populations in developed, and even some developing, countries worldwide, as boomers hold on to life and on to the pension and health benefits promised by the state while relatively few new children arrive to balance their numbers and to pay for those promises.

Until recently that decrepitude has seemed oceans away, as America’s open spaces, sprawling suburbs, openness to immigrants, and relatively religious culture helped keep our population young and growing. But attitudes are changing here as well. A plurality of Americans—46 percent—told Pew in 2009 that the rising number of women without children “makes no difference one way or the other” for our society.

These changes are not theoretical or inconsequential. Europe and East Asia, trailblazers in population decline, have spent decades trying to push up their birthrates and revitalize aging populations while confronting the political, economic, and social consequences of them. It’s time for us to consider what an aging, increasingly child-free population, growing more slowly, would mean here. As younger Americans individually eschew families of their own, they are contributing to the ever-growing imbalance between older retirees—basically their parents—and working-age Americans, potentially propelling both into a spiral of soaring entitlement costs and diminished economic vigor and creating a culture marked by hyperindividualism and dependence on the state as the family unit erodes.

Crudely put, the lack of productive screwing could further be screwing the screwed generation.

Consider contemporary Japan, which after decades of economic stagnation has become the most aged big country on the planet. Since 1990 the world’s third-largest economy has had more people over 65 than under 15; by 2050 it’s projected there will be more people over 80 than under 15. More than one in three Japanese women, predicts sociologist Mika Toyota, will never marry or have children (childbearing outside of marriage is still relatively rare in Japan and other wealthy Asian countries).

The results haven’t been pretty. In some places in Japan, particularly in the countryside, there are already too few working adults remaining to take care of the elderly, and kodokushi, or “lonely death,” among the aged, the unmarried, and the childless, is on the rise. Long a model of frugality, the demographically declining nation now has by far the high-income world’s highest rate of public indebtedness as spending on the elderly has shot past what the state can extract from its remaining productive workers. Last month, the nation’s new finance minister, Taro Aso, outright said that the elderly should be given grace to “hurry up and die.” This situation will not be made better by a desexualized younger Japanese generation: one in three young men ages 16 to 19 express “no interest” in sex—and that may be a good thing, given that 60 percent of young women of the same age share their indifference.

Europe may lag in sexual indifference, but its fertility rate—or births per woman—is around 1.5, also well below the replacement rate of 2.1. In Germany, the fertility rate has stagnated at around 1.4 for 40 years, despite vastly expensive attempts by the state to bribe potential mothers and reverse the problem of schrumpfnation Deutschland, or “shrinking” Germany. Thirty percent of German women say they do not intend to have children, and 48 percent of German middle-aged men now contend that they could have a happy life without children—three times as many as among their fathers.

While postfamilialism isn’t nearly as far along in the U.S., American marriage is faltering—and the baby is being thrown out with the bath water. Forty-four percent of millennials agree that marriage is becoming “obsolete.” And even among those who support tying the knot (including many of those who say it’s obsolete), just 41 percent say children are important for a marriage—down from 65 percent in 1990. It was the only factor to show a significant decline. (Others, such as sharing chores, sexual relationship, and sharing politics, either held steady or were seen as increasingly important.) On the flip side of the coin, the percentage of adults who disagreed with the contention that people without children “lead empty lives” has shot up, to 59 percent in 2002 from 39 percent in 1988.

Even before the 2008 crash, childlessness among American women ages 40 to 44 of all races and ethnicities had steadily increased for a decade, with the proportion of childless women doubling from 10 percent in 1980 to 20 percent today. But the negative trend has accelerated since the Great Recession began. In 2007 the fertility rate in America was 2.12 and had been holding nearly steady for decades at about replacement rate—the highest level of any advanced country. In just half a decade since, the rate has dropped to 1.9, the lowest since 1920 (when reliable records began being kept) and just half of the peak rate in 1957, in the midst of the baby boom, according to the Pew Research Center. Now projections of future U.S. population growth are diving, with the census estimate for 2050 down almost 10 percent from the mark predicted in 2008.

Making the trend even more worrisome, the sharpest drop in fertility and birthrates came from immigrants, particularly Hispanics, who hitherto have been responsible for much of our continued population growth. But that unique advantage seems to have ended, with net migration from Mexico to the U.S. having stopped or possibly even reversed since 2008, according to Pew. Mexico’s own fertility rate has plunged, from 7.3 in 1960 to 2.4 today; among immigrants, the rate drops to the American norm in just a generation.

In the short run, the falling birthrate has coincided with the emergence, for the first time, of the single and childless as a self-aware, powerful, and left-leaning political constituency. Yet what’s proven good for the Democratic Party may not be so good for the country in the long term. Even using the more optimistic 2008 projections, the proportion of retirees to working Americans—sometimes called the “dependency ratio”—is likely to rise to 35 retirees for every 100 workers in 2050, twice today’s ratio. That sets the stage for a fight over debt, austerity, benefits, and government spending that will make the vicious battles of the last four years seem more like, well, a tea party.

Of course, the women making reasonable decisions about their own lives aren’t spending much time considering the age breakdown of voters in future elections or the nation’s fiscal health in 2050. “I kind of like to have my own time,” Elizabeth Deegan, a 33-year-old living in Jersey City, told Newsweek in a phone interview. Even as a child, she says with a laugh, baby dolls “were not appealing. I always wanted the Barbies with the boyfriend and the job, not these helpless things.”

Deegan—who clerked years ago with Jordan at the Enchanted Forest, a toy store in Manhattan, and now works as a part-time delivery person for FedEx, a pet-sitter, and the founder of a community-based arts program called Project Greenville—said that for herself and other women, having a child had become an affirmative decision rather than a passive or accidental one. She was the only woman Newsweek spoke with who said she had ever been pregnant. She was 18—she can’t remember if it was just before or after graduating high school—and had an abortion.

Deegan and Jordan both stressed that they always tell prospective beaus very early on that they don’t intend to have children and cut off any budding relationships with men who feel otherwise. “You can’t be that interested in the beginning,” says Jordan, explaining why she won’t date the natally inclined. “Like what, you’re really hot or you’re really cool? There’s tons of those people out there—this is New York City.” (The man with them, on the other hand, asked after the interview that his name not be used, after realizing that his desire not to have children might not be appreciated by his partner of five years; they’d never directly discussed the topic.)

At the hookah bar, Jordan and Emily Wernet, a 25-year-old freelance illustrator of comics and tattoos, joked about the grotesqueness of a hand appearing inside a belly and about “parasites,” “popping one out,” and “horrible little grubs” in the midst of more serious conversation about their fears of relinquishing sole ownership of one’s own body.

While they bemoaned the expense and the physical and emotional effects of their birth-control regimens, they agreed it was a price worth paying to control their own fertility. “There’s a feeling like we’re basically like wombs on legs,” said another of Jordan’s former toy-store colleagues, Janet Rivera, a soft-spoken 30-year-old office manager from Brooklyn. “I feel like as a teen part of my reaction to having kids was definitely ... just wanting to be seen as more than a baby factory. And then as I got older, I feel like the responsibility of having a child is a really huge deal and the expense is out of control.”

Along with kids, the group also recoiled at the domestic, often suburban lifestyle that comes with them.“Certain groups of friends have all gotten married and gone ahead and had kids and moved to Long Island because that seems to be the benchmark of success in Queens—the schools, and the pool and things that I like for weekends,” says Deegan. “It’s very orderly, like if you put them in different clothes, it could be the 1950s.”

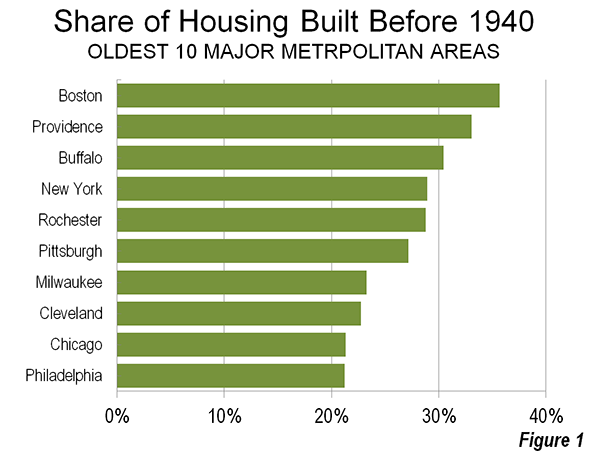
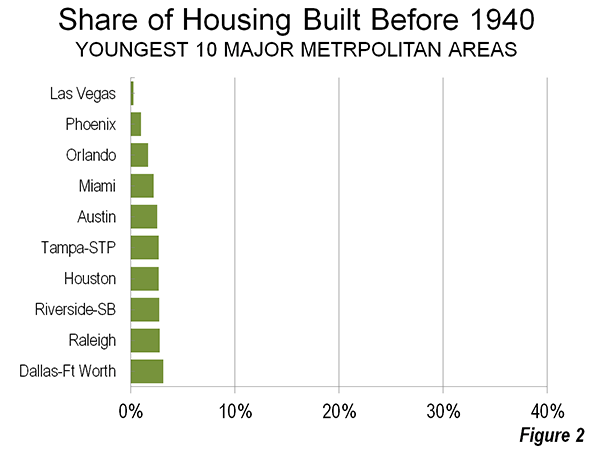
The strong correlation between childlessness and high-density city living has created essentially two Americas: child-oriented and affordable areas, and urban centers that have become increasingly expensive and child-free over the last 30 years—not coincidentally the same span over which middle-class incomes have stagnated. In Manhattan now, nearly half of all households are singletons. Over the past decade, the San Francisco, Boston, New York, Los Angeles, and Philadelphia metropolitan areas all lost children, even as lower-density and more affordable metropolitan areas such as Raleigh, North Carolina; Austin, Texas; Houston; Atlanta; Dallas–Fort Worth; and Salt Lake City registered significant gains. Seattle, once known as a strong family town, is now home to significantly more dogs than children.

Amid this shift, the childless and even the partnerless life has gained something of a cultural cachet, with some suggesting they represent not just a legitimate choice but a superior one. It’s a burgeoning movement that’s joined cultural tastemakers, academics, neo-Malthusians, greens, feminists, Democratic politicians, urban planners, and big developers. Unlike families, whose members, after all, are often stuck with one another, University of Santa Barbara psychology professor Bella De Paulo praises singles as enjoying “intentional communities” and being more likely “to think about human connectedness in a way that is far-reaching and less predictable.”

In his provocative 2012 book Going Solo: The Extraordinary Rise and Surprising Appeal of Living Alone, Eric Klinenberg writes that for the hip urban professionals who make up the so-called creative class, living alone represents a “more desirable state,” even “a sign of success and a mark of distinction, a way to gain freedom and experience the anonymity that can make city life so exhilarating.” Certainly, the number of singletons has skyrocketed: more than half of all adults today are single (a group that includes divorcées and widows and widowers), up from about one in five in 1950.

Many urban developers are placing big bets on this postfamilial demographic, while governments put money into bikeways, transit systems, art palaces, and cool residential developments that cost considerably less than schools and roads. “Singles and childless couples are the emerging household type of the future,” notes developer and urban booster Chris Leinberger. This has led to calls for creating ever-smaller apartments intended for single professionals, notes demographer Wendell Cox, an impulse that has gained the support of mayors including New York’s Michael Bloomberg.

Seeking support for their plans to build taller and smaller, urbanists like Peter Calthorpe also link their density agenda with environmentalism; he’s deemed dense urbanism “a climate-change antibiotic.” Decades after dire predictions of mass starvation and rising population growth lost credibility, the environmental mantra against children remains reflexive. Now greens are pushing for fewer high-income children, since they generate more carbon than offspring in poorer countries. Jonathon Porritt, an adviser to Prince Charles, has called for Britain to halve its population, arguing that having even two children is “irresponsible.” The influential Center for Biological Diversity has called for planetary age standards for getting married or having children, while Lisa Hymas, senior editor at Grist, has signed up for what she calls a “fledgling child-free movement” to stand up against the “pro-natal bias that runs deep.” Her self-designation: “GINK, green inclinations, no kids.”

This trend is likely to reshape American politics in the coming decades. As the number of single women swelled by 18 percent in the last decade, they have emerged as a core constituency of the Democratic Party, a group pollster Stan Greenberg has identified as “the largest progressive voting bloc in the country” and a key part of demographer Ruy Teixeira’s “emerging Democratic majority.” That majority emerged with a vengeance in the 2012 presidential contest, as married women narrowly favored Mitt Romney, according to exit polls, while two out of three single women backed Barack Obama—and their overwhelming support accounted for the president’s margin of victory in the popular vote.

That helps explain the Obama’s campaign’s much-discussed “The Life of Julia,” a flash animation of a woman’s life over the years as marked solely by what government benefits and services she would receive from an Obama administration or be deprived of by a Romney one. This was a none-too-subtle suggestion that government can fill many of the roles, from child care to old-age care, traditionally covered by family. Conservatives assailed the pocketbook appeal (and sometimes the women who found it appealing), noting that no husband or life partner appears and that Julia’s child is referenced only twice in the span of her life, when she’s pregnant and receives free health services under health-care reform and when he later goes to a public kindergarten. After that, the child disappears.

But if singletons are swelling as a voting bloc and interest group now, the demographics of childlessness mean that they’re likely to lose out in the long term. Already, retirees have bent government to their will, with people 65 and older receiving $3 in total government spending for every dollar spent on children younger than 18 as of 2004. At the federal level (which excluded most education spending) the gap widens to 7 to 1. With an aging population, that spread will continue to expand, placing an ever-greater burden on the remaining workers and creating a disincentive for the young to have children.

In the long run, notes Eric Kaufmann, the author of Shall the Religious Inherit the Earth?, high birthrates among such conservative, religious populations as Mormons and evangelical Christians will slant our politics against the secular young, childless voting bloc as well. Even among generally liberal groups like Jews, the most religious are vastly out-birthing their secular counterparts; by some estimates roughly two in five New York Jews are Orthodox—as are three in four of the city’s Jewish children. If these trends continue, and if these children share their parents’ politics—two big ifs, to be sure—even the Democratic stronghold of Gotham will be pulled rightward.

This prospect would pose dangers to our society as a whole, and singletons in particular, including a potential reversion to a more rigidly traditionalist worldview. But perhaps most damaging would be declining markets and a hobbled economy in which governments are forced to tax the shrinking workforce to pay for the soaring retirement and health expenses of an increasingly doddering population; this is already occurring in Germany and Japan. Almost 14 million Americans are projected to have Alzheimer’s disease by 2050, according to the journal Neurology, with a cost of care that experts say could exceed $1 trillion. Less tangible may be the cultural and innovative torpidity of a country dominated by the elderly.

Of course neither outcome—the breeders multiplying their way into political power or a shrinking population, with all that would imply economically and culturally—is inevitable. There are several steps our government could take that might mitigate postfamilialism without aspiring to return to some imagined “golden age” of traditional marriage and family. These include such things as reforming the tax code to encourage marriage and children; allowing continued single-family home construction on the urban periphery and renovation of more child-friendly and moderate-density urban neighborhoods; creating extended-leave policies that encourage fathers to take more time with family, as has been modestly successfully in Scandinavia; and other actions to make having children as economically viable, and pleasant, as possible. Men, in particular, will also have to embrace a greater role in sharing child-related chores with women who, increasingly, have careers and interests of their own.

But as things stand now, the group at the hookah bar suggests where we’re going if we don’t collectively change course. “I was talking to my dad about how I don’t want to have kids,” says Jordan. “At this point, he’s resigned himself to the fact that I don’t. He’s like, ‘Tiffany, people don’t plan to have children, they just have them.’ Which is funny, because now people do plan and decide.”

We should listen carefully. In the coming decades, success will accrue to those cultures that preserve the family’s place, not as the exclusive social unit but as one that is truly indispensable. It’s a case we need to make as a society, rather than counting on nature to take its course.

This piece first appeared in The Daily Beast.

Joel Kotkin is executive editor of NewGeography.com and a distinguished presidential fellow in urban futures at Chapman University, and a member of the editorial board of the Orange County Register. He is author of The City: A Global History and The Next Hundred Million: America in 2050. His most recent study, The Rise of Postfamilialism, has been widely discussed and distributed internationally. He lives in Los Angeles, CA.

Harry Siegel is a senior politics editor for Newsweek and The Daily Beast. A former editor for The New York Sun, New York Press, and Politico and a 2010–11 Knight-Wallace Fellow at the University of Michigan, his journalism has been published in outlets including The New Republic, The New York Daily News, The New York Observer, The New York Post, The Public Interest, The Village Voice and the Weekly Standard. Email: harrysiegel@gmail.com.

Baby photo by Bigstock.

Failing Economies Shorten Lives

$
0
0

A recent study has come up with some shocking news: life expectancy of the least educated white Americans, both men and women, is going down. White women without a high school diploma now live five years less on the average than they did 20 years ago: for white male dropouts, the decline is three years.

This is a calamity matched only by the six-year decline in longevity among Russian men in the waning years of Communism there. But that decline, blamed on rampant alcoholism, has been mostly reversed.

What's going on here? No one really knows, but my bet is that the cause is economic -- the collapse of the industrial, steady, low-wage jobs that once supported even the least-educated Americans. These people once were lower middle-class. Now they're just poor, the losers in the global economy, increasingly cut off from jobs, a steady income and, not incidentally, decent health care.

In a sense, we've been here before. What's happening to this new white underclass is a repeat of what happened to the black American underclass in the wake of the collapse of urban industry. That destroyed economy hit inner-city blacks 30 years ago, with results that echo today. Now, it's hitting whites, with results that mostly are yet to come.

So far as I can see, blacks never experienced the severe dip in longevity afflicting low-income whites today. According to the Center for Disease Control, average life expectancy for black men dipped by a year or two between 1984 and 1989, largely due to HIV and homicides. But black life expectancy is still shockingly low -- an average of 67.6 years for black men, as opposed to nearly 75 years for white men, according to a UCLA study. Black women live nearly 75 years on the average, but this is still five years less than the 80-year average for white women.  

I wrote about this in my book, Caught in the Middle, on the impact of globalization on the Midwest. In a chapter entitled "Left Behind," I described the plight of urban blacks, the descendants of Southerners who came north in the Great Migration between 1915 and 1970, to escape Jim Crow laws down south and to find jobs in the booming factories of Chicago, Detroit and other cities. Since the '60s, the departure of this industry destroyed jobs, mostly held by men, and stranded families in a familiar cycle of unemployment, bad schools, crime, drugs, single-parent households and, increasingly low life expectancy.

More recently, this industrial collapse swept through the Midwest, hitting white workers and their communities as hard as black workers and towns. Most of all, the Midwesterners now being "left behind" are rural whites, a clan about as far from urban blacks as one can imagine but now sharing the same pathology  -- poverty, bad health, reliance on government handouts, high dropout rates, drugs, down-home religions, broken families, empty futures.

Charles Murray and other writers have remarked on this growing gap between rich and poor white Americans. Murray called them virtually separate nations, with radically different patterns of marriage, work habits, education, religion, politics, even diet and TV watching. Some of Murray's past work is suspect -- he once found whites genetically superior to blacks. But his latest book, Coming Apart,  argues that "our nation is coming apart at the seams -- not ethnic seams, but the seams of class." My own reporting in the left-behind stretches of the industrial Midwest supports much of this.

Murray doesn't think economic distress has much to do with this. He's wrong. The economic disasters that struck inner-city African Americans 30 years ago is happening again to whites, in both cause and effect. There's no reason to think these effects will stop with the decline in longevity among the first-hit and the worst-hit.

The latest longevity findings were in a study led by S. Jay Olshansky, a public health professor at the University of Illinois at Chicago. They showed that white female high school dropouts lived only 73.5 years on the average in 2008, down exactly five years from the 78.5 years they could expect in 1990. For white male dropouts, the drop was three years, from 70.5 years in 1990 to 67.5 years in 2008.

In the same period, both black and Latino life expectancy rose at all levels of education.

Other studies have shown vast differences in life expectancy between education levels, incomes, race and other factors. If the average white male dropout can expect to live only 67.5 years, white men with a college degree have an expectancy of 80.4 years, a 13-year gap. Those white women dropouts, with an expectancy of 73.5 years, are ten years behind white women with a college degree.

It gets worse. A National Institutes of Health study reported that black men live on the average eighteen years less than Asian females. Some geographical differences take this to even greater extremes: Native American men in one impoverished area of South Dakota live only 58 years on the average, fully 33 years less than the 91 years expected by Asian females in Bergen County, N.J., a high-rent district just across the Hudson River from Manhattan.

Genetics may have something to do with it. But not as much as economics and the fallout from economic differences. Poor people get less schooling, which leads to worse jobs, which leads to poorer lifestyles, which leads to stress, which leads to more smoking and drinking, which increases the chances of joblessness, which means no health insurance, all of which adds up to the kind of debilitating despair that never lengthened anyone's life.

Will life expectancy figures for whites begin to dip toward those of blacks? Possibly. The relatively short life expectancy for black men, for instance, is the result of two centuries of reduced life chances, in which the average man moved from slavery to sharecropping to a hard but relatively secure life on assembly lines, to unemployment when those lines closed, followed by several decades now of insecure employment, no health insurance, a vanishing role as the family breadwinner, bad diet and, increasingly, heavy drug use. White men in the Midwestern industrial belt enjoyed decades of economic stability, but for many of them, that's gone now. The least educated were hit first, and the longevity statistics illustrate the result.

Richard Longworth is a Senior Fellow at The Chicago Council on Global Affairs. He is the author of Caught in the Middle: America’s Heartland in the Age of Globalism, now out in paperback (Bloomsbury USA). He writes at The Midwesterner: Blogging the Global Midwest, where this piece originally appeared.

Why The Red States Will Profit Most From More U.S. Immigration

$
0
0

In recent years, the debate over immigration has been portrayed in large part as a battle between immigrant-tolerant blue states and regions and their less welcoming red counterparts. Yet increasingly, it appears that red states in the interior and the south may actually have more to gain from liberalized immigration than many blue state bastions.

Indeed an analysis of foreign born population by demographer Wendell Cox reveals that the fastest growth in the numbers of newcomers are actually in cities (metropolitan areas) not usually seen as immigrant hubs. The fastest growth in population of foreign born residents–more than doubling over the decade was #1 Nashville, a place more traditionally linked to country music than ethnic diversity. Today besides the Grand Old Opry, the city also boasts the nation’s largest Kurdish population, and a thriving “Little Kurdistan,” as well as growing Mexican, Somali and other immigrant enclaves.

Other cities are equally surprising, including #2 Birmingham, AL; #3 Indianapolis, IN; #4 Louisville, KY and#5 Charlotte, NC, all of which doubled their foreign born population between 2000 and 2011. Right behind them are #6 Richmond,VA, #7 Raleigh,NC , #8 Orlando, Fl, #9 Jacksonville,Fl and #10 Columbus, OH. All these states either voted for Mitt Romney last year or have state governments under Republican control. None easily fit the impression of liberally minded immigrant attracting bastions from only a decade ago.

Although the New York metropolitan area still has the greatest numeric growth in immigrants since 2000, a net gain of more than 600,000, there’s no question that the momentum lies with these fast growing immigrant hubs.The reasons are not too difficult to fathom. In the modern global economy, migrants represent the veritable “canaries in the coalmine”. They go to economic opportunities are often the greatest, which often means thriving places like Nashville, Raleigh, Charlotte, Columbus or #11 Austin, TX. Housing prices and business climate also seem to be a factor here; all these areas have lower home prices relative to income than many traditional immigrant hubs.

As a result, many immigrants are moving from their traditional “comfort zone” cities with historical larger immigrant populations — New York, Los Angeles, San Francisco and Chicago — to generally faster growing, more affordable cities.

This is drastically reshaping the demographic future of the country. Over the past decade the increase in foreign born residents accounted for 44% of the nation’s overall population growth rate. With the U.S. birthrate heading downwards, at least for now, immigration represents perhaps the one way regions can boost their populations and energize their economies. It may be America’s biggest hope as well in keeping Social Security and Medicare from collapse.

Ironically, even as they migrate elsewhere, immigrants also may prove particularly critical in some of our older cities. Newcomers have been vital to maintaining population growth or at least fending off stagnation. Los Angeles, Miami, New York, Chicago and San Francisco metros have maintained enough growth among the foreign born to keep going negative due to significant losses in net domestic migration. Yet even among biggest metros the biggest growth has been among lower-cost, until fairly recently largely native-born, regions such as Houston, Dallas-Fort Worth and Atlanta.

The impact on these areas is likely to be profound over time. Urbanists like to speak about the “great inversion” of upper-class professionals to cities, but it’s really the immigrants who provide the demographic and economic momentum for our largest metros. This point may be missed because many times immigrants — unlike the much cherished (and much publicized) hip, cool, largely white professionals — often do not choose to live in the overpriced, crowded urban core (although some may have businesses there).

Instead immigrants tend to cluster in the less dense, more affordable and spacious periphery, where their “American dream” of a single family house is often far more achievable. In Southern California, for example, decidedly exurban #25 San Bernardino Riverside added three times as many foreign born than long-time immigrant hub Los Angeles, despite having only one-third the total popoulation. Los Angeles actually recorded the smallest percentage growth in foreign born of any major U.S. metro.

Over time, the immigrant impact may prove greatest in terms of economics. Immigrants, in a word, tend to be resilient, and opportunistic by nature. Although many immigrants and their offspring still lag behind economically, over time they appear to be integrating. Overall their rate of home ownership still lags that of native born Americans, but appears to have held up better since the recession.

Nowhere is the impact greater than in the entrepreneurial sector. Between 1982 and 2007, the number of businesses owned by the primary immigrant groups, Asian Americans and Hispanics grew by 545% and 696% respectfully. In contrast businesses owned by whites grew by only 81%.

Perhaps more important still, even in the midst of the recession, newcomers continued to form businesses at a record rate, even as those by native-born entrepreneurs declined. The immigrant share of all new businesses, notes Kauffman, more than doubled from from 13.4% in 1996 to 29.5% in 2010.

Some emerging tech centers are particularly dependent on foreign born migration as evidenced by rapid growth in Raleigh, Austin and Columbus. Established tech centers like San Jose, San Francisco and Seattle also all have large foreign born populations. Overall immigrants are responsible for roughly a quarter of all high-tech start ups .

Much of this can be attributed to Asians, who constitute over 40%of all newcomers andnow stand as the fastest growing immigrant group. They now account for roughly twenty percent of all tech workers, four times their percentage of the population.

Yet these impacts will be felt well beyond the tech community. Professionals of all kinds are moving in record numbers from the riskier political environment and pollution of China, seeking places where they can use their skills most effectively. Immigrants also play an increasingly important role in such less tech oriented industries, from the garment, carpet and furniture industries as well as small scale retail enterprise.

Newcomers also are playing a major role in the reviving housing market, particularly in places such as New York, Los Angeles, Miami, Phoenix and the Bay Area. A house that might seem outrageously overpriced to the average American family might seem rather a bargain if you are coming from Hong Kong, Beijing or Shanghai.

It is likely that, if sensible reform is passed, these impacts will begin to extend to other parts of country — such as Cleveland, Milwaukee and Memphis — that still get very little new foreign immigration. Like Houston in the 1990s, these areas have affordable housing to attract newcomers and, with any resurgence of economic growth, could provide opportunities for up and coming immigrants. A decade ago, after all, who would have seen Nashville, the ultimate symbol of our country heritage, as a rising immigrant hub?

Joel Kotkin is executive editor of NewGeography.com and a distinguished presidential fellow in urban futures at Chapman University, and a member of the editorial board of the Orange County Register. He is author of The City: A Global History and The Next Hundred Million: America in 2050. His most recent study, The Rise of Postfamilialism, has been widely discussed and distributed internationally. He lives in Los Angeles, CA.

This piece originally appeared in Forbes.

Photo by telwink

In California, Don't Bash the 'Burbs

$
0
0

For the past century, California, particularly Southern California, nurtured and invented the suburban dream. The sun-drenched single-family house, often with a pool, on a tree-lined street was an image lovingly projected by television and the movies. Places like the San Fernando Valley – actual home to the "Brady Bunch" and scores of other TV family sitcoms – became, in author Kevin Roderick's phrase, "America's suburb."

This dream, even a modernized, multicultural version of it, now is passé to California's governing class. Even in his first administration, 1975-83, Gov. Jerry Brown disdained suburbs, promoting a city-first, pro-density policy. His feelings hardened during eight years (1999-2007) as mayor of Oakland, a city that, since he left, has fallen on hard times, although it has been treated with some love recently in the blue media.

As state attorney general (2007-11) Brown took advantage of the state's 2006 climate change legislation to move against suburban growth everywhere from Pleasanton to San Bernardino. Now back as governor, he can give full rein to his determination to limit access to the old California dream, curbing suburbia and forcing more of us and, even more so our successors, into small apartments nearby bus and rail stops. His successor as attorney general, former San Francisco D.A. Kamala Harris, is, if anything, more theologically committed to curbing suburban growth.

Sadly, much of the state's development "community" has enlisted itself into the densification jihad. An influential recent report from the Urban Land Institute, for example, sees a "new California dream," which predicts huge growth in high-density development based on underlying demographic trends – like shifts in housing tastes among millennials or empty-nesters rushing to downtown condos.

Yet it's not enough for the planners, and their developer allies, to watch the market shift and take advantage of it. That would be both logical and justified. But the planning clerisy are not content to leave suburbia die; it must, instead, be cauterized and prevented, like some plague, from spreading.

Ironically, it turns out that the "new California dream" is more widely shared by planners and rent-seeking developers than by the consuming public. During the past decade, when pro-density sentiment has supposedly building, some 80 percent of the new construction in the state was single-family, a rate slightly above the national average. Over time, Californians continue to buy single-family houses, mostly in the suburban and exurban periphery. They do it because they are like most Americans, roughly four of five of whom prefer single-family houses, preferably closer to work but, if that proves unaffordable, further out.

This includes both working-class and upper middle-class markets. The more-affluent, including many largely Asian immigrants, have been willing to buy high-priced homes closer to employment centers in places like Irvine or Cupertino, near San Jose. Meanwhile, the less-affluent of all ethnicities continue to move further out, to places like the Inland Empire or the further reaches of the Bay Area. These peripheral areas have continued to represent the vast majority of growth in both greater Los Angeles and around the Bay Area.

Meanwhile, some of the urban-centric residential construction now being put up will, as occurred in the housing bust, may be fashionable but, in some cases, not so profitable over time. Construction is being driven mostly by tax breaks, Uncle Ben's essentially ultralow-interest money for wealthy investors and, in some cases, subsidies. Overall, the Wall Street Journal notes, the rental market is beginning to "lose steam," as people again start looking into buying homes. This may suggest that new speculative building in places like downtown Los Angeles – where there's good evidence that rents and occupancy levels are, if anything, getting weaker – may end up in tears.

To date, the anti-suburb jihad has been somewhat constrained by the recession and the collapse of the housing bubble about five years ago. But now that there's an incipient housing recovery in parts of the state, including Orange County, the constraints could be problematical, particularly for younger buyers about to start a family or for people migrating into the state.

The impact may be felt first in Silicon Valley and its environs. The planners now dominating the Bay Area want only highly dense bus-stop- or train-oriented development in the valley. Yet, notes real estate consultant John Burns, this does not reflect market realities marked by what they describe "as a resilient and ongoing preference for single-family homes."

Even more fanciful, they are promoting high density in areas, far distant from current employment centers, in dreary locales like Newark, south of Oakland, claiming workers there will take public transit to jobs in the Valley. The belief among planners and some gullible developers that aging millennials will choose to live in high density, far from costly San Francisco or Palo Alto, and commute to work by transit is somewhat north of absurd; today, a bare 3 percent of workers in Silicon Valley get to work by car, and downtown San Jose, the logical terminus of any transit strategy, is home to barely 26,000 of the region's 860,000 workers.

Some tech workers may put up with a few years of high rents and shared apartments in San Francisco or Palo Alto, but not many will want to live in expensive towers far from both Silicon Valley's primary employers and the amenities of the big city. Apple's plans for a new headquarters in Cupertino has drawn criticism from green-minded urbanists precisely because they rest on the sensible presumption that Apple's workforce will remain largely suburban and car-oriented. One can also wonder the effect on the start-up culture when workers have been forced to live in places lacking the proverbial garage or extra bedroom that historically have nurtured new firms.

More important still, forced densification, by denying single-family alternatives, is likely, and in some places, already is, spiking prices, which are up $85,000 in Silicon Valley in a year. This, over time, will force millennials, as they age, to look for other locales to meet their longtime aspirations. Generational chroniclers Morley Winograd and Mike Hais, in their surveys, have found more than twice as many millennials prefer suburbs over dense cities as their "ideal place to live." The vast majority of 18-to-34-year-olds do not want to spend their lives as apartment renters; a study by TD Bank found that 84 percent of them hope to own a home.

Much the same can be said of Asian immigrants, who are now driving much of the new-home sales, particularly in desirable places like Orange County or Silicon Valley. Nationwide, over the past decade, the Asian population in suburbs grew by almost 2.8 million, or 53 percent, while the Asian population of core cities grew 770,000, 28 percent. In greater Los Angeles, there are now three times as many Asian suburbanites as their inner-city counterparts.

If California is not willing to meet the needs of its own emerging middle class, there's no doubt that other states, from Arizona and Texas to Tennessee – although not as fundamentally alluring – will be, and are already, more than happy to oblige.

Rather than seeking to destroy our suburbs, California leaders should expend their energy figuring out how to make them better. Rather than some retro-1900s urbanist vision, they need to embrace the multipolarity of our urban agglomerations. They could look to preserve open space nearby, when possible, or cultivate natural areas, parks, walking and biking trails that would appeal to families as well as to singles.

Instead of attempting to force employment into the center city, it would make more sense to expand home-based and dispersed work in order to cut down or eliminate commuting times. These moves would create both healthier suburbs and reduce carbon emissions without devastating the natural aspirations of most California families.

Joel Kotkin is executive editor of NewGeography.com and a distinguished presidential fellow in urban futures at Chapman University, and a member of the editorial board of the Orange County Register. He is author of The City: A Global History and The Next Hundred Million: America in 2050. His most recent study, The Rise of Postfamilialism, has been widely discussed and distributed internationally. He lives in Los Angeles, CA.

This piece originally appeared in the Orange County Register.

Suburb photo by BigStockPhoto.com.

America's Growth Corridors: The Key to a National Revival - A New Report

$
0
0

In the wake of the 2012 presidential election, some political commentators have written political obituaries of the "red" or conservative-leaning states, envisioning a brave new world dominated by fashionably blue bastions in the Northeast or California. But political fortunes are notoriously fickle, while economic trends tend to be more enduring.

These trends point to a U.S. economic future dominated by four growth corridors that are generally less dense, more affordable, and markedly more conservative and pro-business: the Great Plains, the Intermountain West, the Third Coast (spanning the Gulf states from Texas to Florida), and the Southeastern industrial belt.

Read or download the full report from the Manhattan Institute.

Overall, these corridors account for 45% of the nation's land mass and 30% of its population. Between 2001 and 2011, job growth in the Great Plains, the Intermountain West and the Third Coast was between 7% and 8%—nearly 10 times the job growth rate for the rest of the country. Only the Southeastern industrial belt tracked close to the national average.

Historically, these regions were little more than resource colonies or low-wage labor sites for richer, more technically advanced areas. By promoting policies that encourage enterprise and spark economic growth, they're catching up.

Such policies have been pursued not only by Republicans but also by Democrats who don't share their national party's notion that business should serve as a cash cow to fund ever more expensive social-welfare, cultural or environmental programs. While California, Illinois, New York, Massachusetts and Minnesota have either enacted or pursued higher income taxes, many corridor states have no income taxes or are planning, like Kansas and Louisiana, to lower or even eliminate them.

The result is that corridor states took 11 of the top 15 spots in Chief Executive magazine's 2012 review of best state business climates. California, New York, Illinois and Massachusetts were at the bottom. The states of the old Confederacy boast 10 of the top 12 places for locating new plants, according to a recent 2012 study by Site Selection magazine.

Energy, manufacturing and agriculture are playing a major role in the corridor states' revival. The resurgence of fossil fuel–based energy, notably shale oil and natural gas, is especially important. Over the past decade, Texas alone has added 180,000 mostly high-paying energy-related jobs, Oklahoma another 40,000, and the Intermountain West well over 30,000. Energy-rich California, despite the nation's third-highest unemployment rate, has created a mere 20,000 such jobs. In New York, meanwhile, Gov. Andrew Cuomo is still delaying a decision on hydraulic fracturing.

Cheap U.S. natural gas has some envisioning the Mississippi River between New Orleans and Baton Rouge as an "American Ruhr." Much of this growth, notes Eric Smith, associate director of the Tulane Energy Institute, will be financed by German and other European firms that are reeling from electricity costs now three times higher than in places like Louisiana.

Korean and Japanese firms are already swarming into South Carolina, Alabama and Tennessee. What the Boston Consulting Group calls a "reallocation of global manufacturing" is shifting production away from expensive East Asia and Europe and toward these lower-cost locales. The arrival of auto, steel and petrochemical plants—and, increasingly, the aerospace industry—reflects a critical shift for the Southeast, which historically depended on lower-wage industries such as textiles and furniture.

Since 2000, the Intermountain West's population has grown by 20%, the Third Coast's by 14%, the long-depopulating Great Plains by over 14%, and the Southeast by 13%. Population in the rest of the U.S. has grown barely 7%. Last year, the largest net recipients of domestic migrants were Texas and Florida, which between them gained 150,000. The biggest losers? New York, New Jersey, Illinois and California.

As a result, the corridors are home to most of America's fastest-growing big cities, including Charlotte, Raleigh, Atlanta, Houston, Dallas, Salt Lake City, Oklahoma City and Denver. Critically for the economic and political future, the growth corridor seems particularly appealing to young families with children.

Cities such as Raleigh, Charlotte, Austin, Dallas and Houston enjoy among the country's fastest growth rates in the under-15 population. That demographic is on the wane in New York, Los Angeles, Chicago and San Francisco. Immigrants, too, flock to once-unfamiliar places like Nashville, Charlotte and Oklahoma City. Houston and Dallas already have more new immigrants per capita than Boston, Philadelphia, Seattle and Chicago.

Coastal-city boosters suggest that what they lose in numbers they make up for in "quality" migration. "The Feet are moving south and west while the Brains are moving toward coastal cities," Derek Thompson wrote a few years ago in The Atlantic. Yet over the past decade, the number of people with bachelor's degrees grew by a remarkable 50% in Austin and Charlotte and by over 30% in Tampa, Houston, Dallas and Atlanta—a far greater percentage growth rate than in San Francisco, Los Angeles, Chicago or New York.

Raleigh, Austin, Denver and Salt Lake City have all become high-tech hubs. Charlotte is now the country's second-largest financial center. Houston isn't only the world's energy capital but also boasts the world's largest medical center and, along with Dallas, has become a major corporate and global transportation hub.

The corridors' growing success is a testament to the resiliency and adaptability of the American economy. It also challenges the established coastal states and cities to reconsider their current high-tax, high-regulation climates if they would like to join the growth party.

Read or download the full report from the Manhattan Institute.

Joel Kotkin is executive editor of NewGeography.com and a distinguished presidential fellow in urban futures at Chapman University, and a member of the editorial board of the Orange County Register. He is author of The City: A Global History and The Next Hundred Million: America in 2050. His most recent study, The Rise of Postfamilialism, has been widely discussed and distributed internationally. He lives in Los Angeles, CA.

This piece first appeared in the Wall Street Journal.


Gentrification and its Discontents: Cleveland Needs to Go Beyond Being Creatively Classed

$
0
0

“Indeed, we have the know-how, but we do not have the know-why, nor the know-what-for”—Erich Fromm, social psychologist.

The question of how you “become” as a city has been weighing on me lately. Is it enough to get people back into the emptiness? Is it enough to pretty the derelict? I mean, is the trajectory of Cleveland’s success simply a collection of micro-everythings, start-ups, and occupancy rates? That is, is Cleveland’s reward simply the benefit of being creatively classed?

I hope not. It won’t work. Here is why.

The problem with most city revitalization these days relates to its playbook: there are the investors who have the capital, and then the political power from which finance flows. Here, money not only talks, it builds, with investors’ wishes transcribed in how a city looks, feels, and functions. That said, the main interest of the investors is to make money, and so people are seen as consumers as opposed to citizens. Consumers that fill up real estate space. Consumers that salivate over tastes. Consumers of art and design, with the attraction to beauty meant to establish a “vibrancy for profit” mindset as opposed to experiencing beauty for the value of beauty’s sake. Come to think of it, the creative class is really just the consumer class, just like the rest of us. Yet they are anointed in status by city makers because they are thought to have more spending power than their working- and service-class counterparts.

“Follow the creative community, and property values will rise,” states one recent article in a real estate publication. “You have given real estate developers the playbook”, echoes Albert Ratner, head of Cleveland-based Forest City, on his reading of “The Rise of the Creative Class”. The motivations, as such, are quite blatant.

Now, why is this a problem?

Because developers have extraordinary amounts of pull in directing where finances goes (this is particularly true in Cleveland), which means investment can get skewed to a select demographic. As such, the gap between the haves and have not’s grows and the geographic disparities begin to cement social inequities into the city’s fabric. Cracks then show: drug use, murders, alienation and disenfranchisement, growing pockets of continued disinvestment, and it won’t stop because research has consistently shown that inequity is an endless source of social ills. The only thing left to do is to compartmentalize our shadows, with “bad” kept in places away from the spots of our “hope”. This is not unique to Cleveland or to this era. It is just the way things have been, which leads me to wonder if Cleveland’s recent comeback is just a carousel in which progress is simply rearranging the broken deckchairs.

But while the future is uncertain, failure need not be inevitable. Yet what can be done in Cleveland and other Rust Belt cities to ensure we don’t waste our opportunity? Unfortunately, little outside of a radical shift in how cities think about themselves, particularly as it relates to the notion of “revitalization”.

This is where the concept of “Rust Belt Chic” comes in, which—when it is boiled down—is really just a process of collectively“knowing thyself” (an in depth description of Rust Belt Chic economic development will be delineated in a subsequent post). Specifically, by becoming aware of who we are as “Cleveland” we know who we are not, or more exactly: what we don’t need to be. This is important as it relieves the temptation of Cleveland trying to copy some other city’s so-called success which, in the end, is counterproductive, as such efforts—like the historic Columbia Building demolition for a Vegas-style “look”—ultimately eliminates those things like history and architecture which ties us together.

columbia building

The historic Columbia Building being demolished. Courtesy of the Cleveland Kid.

This is all to say that Cleveland need not be “brochured” for the so-called creative class. That is simply objectifying your city as a product as opposed to a people, which is crude, and such posturing and posing is hardly Cleveland, besides.

Instead, a hammering down of who we are in our process of becoming is needed. We are Clevelanders. We care and fight for this city, endlessly. We swear, shake hands, bleed, heal, work, fight, and pray—all in an environment molded more so by the reality of Mickey Rourke than the donning of Ashton Kutcher. And so while repopulating the core is needed, we also must engage in building the productive capacity of people as opposed to simply relying on a capacity to spend. Specifically, squeezing out price per sq. feet at the expense of community fabric is not true economic growth. It is mountains turned to coal.

I cannot emphasize enough how important community development is to Cleveland’s future. For as creative classification goes main stream, more and more cities will begin looking and feeling the same, and more and more cities will be turned to products to be gobbled up by those with stars in their eyes. But this kind of thing is not for everyone, or even for most. It is for a slice, a finicky slice. And so I gather creative classification will go the way of the fad, like all styles do. Some cities will be stuck left to look at the cartoon tattoos that dot their body, while the people left longing will decompress to find something a little more real.

Then—if we do it right—people will turn to Cleveland not because we faked the place as attractive, but because Cleveland made an effort to turn to its people.

This post originally appeared at Cool Cleveland.

Richey Piiparinen is a writer and policy researcher based in Cleveland. He is co-editor of Rust Belt Chic: The Cleveland Anthology. Read more from him at his blog and at Rust Belt Chic.

Lead photo: Don’t call him creative classed. A Cleveland artist, Mac, and his rooster, Morty.

Gentrification and its Discontents: Notes from New Orleans

$
0
0

Readers of this forum have probably heard rumors of gentrification in post-Katrina New Orleans. Residential shifts playing out in the Crescent City share many commonalities with those elsewhere, but also bear some distinctions and paradoxes. I offer these observations from the so-called Williamsburg of the South, a neighborhood called Bywater.

Gentrification arrived rather early to New Orleans, a generation before the term was coined. Writers and artists settled in the French Quarter in the 1920s and 1930s, drawn by the appeal of its expatriated Mediterranean atmosphere, not to mention its cheap rent, good food, and abundant alcohol despite Prohibition. Initial restorations of historic structures ensued, although it was not until after World War II that wealthier, educated newcomers began steadily supplanting working-class Sicilian and black Creole natives.

By the 1970s, the French Quarter was largely gentrified, and the process continued downriver into the adjacent Faubourg Marigny (a historical moniker revived by Francophile preservationists and savvy real estate agents) and upriver into the Lower Garden District (also a new toponym: gentrification has a vocabulary as well as a geography). It progressed through the 1980s-2000s but only modestly, slowed by the city’s abundant social problems and limited economic opportunity. New Orleans in this era ranked as the Sun Belt’s premier shrinking city, losing 170,000 residents between 1960 and 2005. The relatively few newcomers tended to be gentrifiers, and gentrifiers today are overwhelmingly transplants. I, for example, am both, and I use the terms interchangeably in this piece.

One Storm, Two Waves

Everything changed after August-September 2005, when the Hurricane Katrina deluge, amid all the tragedy, unexpectedly positioned New Orleans as a cause célèbre for a generation of idealistic millennials. A few thousand urbanists, environmentalists, and social workers—we called them “the brain gain;” they called themselves YURPS, or Young Urban Rebuilding Professionals—took leave from their graduate studies and nascent careers and headed South to be a part of something important.

Many landed positions in planning and recovery efforts, or in an alphabet soup of new nonprofits; some parlayed their experiences into Ph.D. dissertations, many of which are coming out now in book form. This cohort, which I estimate in the low- to mid-four digits, largely moved on around 2008-2009, as recovery moneys petered out. Then a second wave began arriving, enticed by the relatively robust regional economy compared to the rest of the nation. These newcomers were greater in number (I estimate 15,000-20,000 and continuing), more specially skilled, and serious about planting domestic and economic roots here. Some today are new-media entrepreneurs; others work with Teach for America or within the highly charter-ized public school system (infused recently with a billion federal dollars), or in the booming tax-incentivized Louisiana film industry and other cultural-economy niches.

Brushing shoulders with them are a fair number of newly arrived artists, musicians, and creative types who turned their backs on the Great Recession woes and resettled in what they perceived to be an undiscovered bohemia in the lower faubourgs of New Orleans—just as their predecessors did in the French Quarter 80 years prior. It is primarily these second-wave transplants who have accelerated gentrification patterns.

Spatial and Social Structure of New Orleans Gentrification

Gentrification in New Orleans is spatially regularized and predictable. Two underlying geographies must be in place before better-educated, more-moneyed transplants start to move into neighborhoods of working-class natives. First, the area must be historic. Most people who opt to move to New Orleans envision living in Creole quaintness or Classical splendor amidst nineteen-century cityscapes; they are not seeking mundane ranch houses or split-levels in subdivisions. That distinctive housing stock exists only in about half of New Orleans proper and one-quarter of the conurbation, mostly upon the higher terrain closer to the Mississippi River. The second factor is physical proximity to a neighborhood that has already gentrified, or that never economically declined in the first place, like the Garden District.

Gentrification hot-spots today may be found along the fringes of what I have (somewhat jokingly) dubbed the “white teapot,” a relatively wealthy and well-educated majority-white area shaped like a kettle (see Figure 1) in uptown New Orleans, around Audubon Park and Tulane and Loyola universities, with a curving spout along the St. Charles Avenue/Magazine Street corridor through the French Quarter and into the Faubourg Marigny and Bywater. Comparing 2000 to 2010 census data, the teapot has broadened and internally whitened, and the changes mostly involve gentrification. The process has also progressed into the Faubourg Tremé (not coincidentally the subject of the HBO drama Tremé) and up Esplanade Avenue into Mid-City, which ranks just behind Bywater as a favored spot for post-Katrina transplants. All these areas were originally urbanized on higher terrain before 1900, all have historic housing stock, and all are coterminous to some degree.


Figure 1. Hot spots (marked with red stars) of post-Katrina gentrification in New Orleans, shown with circa-2000 demographic data and a delineation of the “white teapot.” Bywater appears at right. Map and analysis by Richard Campanella.

The frontiers of gentrification are “pioneered” by certain social cohorts who settle sequentially, usually over a period of five to twenty years. The four-phase cycle often begins with—forgive my tongue-in-cheek use of vernacular stereotypes: (1) “gutter punks” (their term), young transients with troubled backgrounds who bitterly reject societal norms and settle, squatter-like, in the roughest neighborhoods bordering bohemian or tourist districts, where they busk or beg in tattered attire.

On their unshod heels come (2) hipsters, who, also fixated upon dissing the mainstream but better educated and obsessively self-aware, see these punk-infused neighborhoods as bastions of coolness.

Their presence generates a certain funky vibe that appeals to the third phase of the gentrification sequence: (3) “bourgeois bohemians,” to use David Brooks’ term. Free-spirited but well-educated and willing to strike a bargain with middle-class normalcy, this group is skillfully employed, buys old houses and lovingly restores them, engages tirelessly in civic affairs, and can reliably be found at the Saturday morning farmers’ market. Usually childless, they often convert doubles to singles, which removes rentable housing stock from the neighborhood even as property values rise and lower-class renters find themselves priced out their own neighborhoods. (Gentrification in New Orleans tends to be more house-based than in northeastern cities, where renovated industrial or commercial buildings dominate the transformation).

After the area attains full-blown “revived” status, the final cohort arrives: (4) bona fide gentry, including lawyers, doctors, moneyed retirees, and alpha-professionals from places like Manhattan or San Francisco. Real estate agents and developers are involved at every phase transition, sometimes leading, sometimes following, always profiting.

Native tenants fare the worst in the process, often finding themselves unable to afford the rising rent and facing eviction. Those who own, however, might experience a windfall, their abodes now worth ten to fifty times more than their grandparents paid. Of the four-phase process, a neighborhood like St. Roch is currently between phases 1 and 2; the Irish Channel is 3-to-4 in the blocks closer to Magazine and 2-to-3 closer to Tchoupitoulas; Bywater is swiftly moving from 2 to 3 to 4; Marigny is nearing 4; and the French Quarter is post-4.

Locavores in a Kiddie Wilderness

Tensions abound among the four cohorts. The phase-1 and -2 folks openly regret their role in paving the way for phases 3 and 4, and see themselves as sharing the victimhood of their mostly black working-class renter neighbors. Skeptical of proposed amenities such as riverfront parks or the removal of an elevated expressway, they fear such “improvements” may foretell further rent hikes and threaten their claim to edgy urban authenticity. They decry phase-3 and -4 folks through “Die Yuppie Scum” graffiti, or via pasted denunciations of Pres Kabacoff (see Figure 2), a local developer specializing in historic restoration and mixed-income public housing.

Phase-3 and -4 folks, meanwhile, look askance at the hipsters and the gutter punks, but otherwise wax ambivalent about gentrification and its effect on deep-rooted mostly African-American natives. They lament their role in ousting the very vessels of localism they came to savor, but also take pride in their spirited civic engagement and rescue of architectural treasures.

Gentrifiers seem to stew in irreconcilable philosophical disequilibrium. Fortunately, they’ve created plenty of nice spaces to stew in. Bywater in the past few years has seen the opening of nearly ten retro-chic foodie/locavore-type restaurants, two new art-loft colonies, guerrilla galleries and performance spaces on grungy St. Claude Avenue, a “healing center” affiliated with Kabacoff and his Maine-born voodoo-priestess partner, yoga studios, a vinyl records store, and a smattering of coffee shops where one can overhear conversations about bioswales, tactical urbanism, the klezmer music scene, and every conceivable permutation of “sustainability” and “resilience.”

It’s increasingly like living in a city of graduate students. Nothing wrong with that—except, what happens when they, well, graduate? Will a subsequent wave take their place? Or will the neighborhood be too pricey by then?

Bywater’s elders, families, and inter-generational households, meanwhile, have gone from the norm to the exception. Racially, the black population, which tended to be highly family-based, declined by 64 percent between 2000 and 2010, while the white population increased by 22 percent, regaining the majority status it had prior to the white flight of the 1960s-1970s. It was the Katrina disruption and the accompanying closure of schools that initially drove out the mostly black households with children, more so than gentrification per se.1 Bywater ever since has become a kiddie wilderness; the 968 youngsters who lived here in 2000 numbered only 285 in 2010. When our son was born in 2012, he was the very first post-Katrina birth on our street, the sole child on a block that had eleven when we first arrived (as category-3 types, I suppose, sans the “bohemian”) from Mississippi in 2000.2

Impact on New Orleans Culture

Many predicted that the 2005 deluge would wash away New Orleans’ sui generis character. Paradoxically, post-Katrina gentrifiers are simultaneously distinguishing and homogenizing local culture vis-à-vis American norms, depending on how one defines culture. By the humanist’s notion, the newcomers are actually breathing new life into local customs and traditions. Transplants arrive endeavoring to be a part of the epic adventure of living here; thus, through the process of self-selection, they tend to be Orleaneophilic “super-natives.” They embrace Mardi Gras enthusiastically, going so far as to form their own krewes and walking clubs (though always with irony, winking in gentle mockery at old-line uptown krewes). They celebrate the city’s culinary legacy, though their tastes generally run away from fried okra and toward “house-made beet ravioli w/ goat cheese ricotta mint stuffing” (I’m citing a chalkboard menu at a new Bywater restaurant, revealingly named Suis Generis, “Fine Dining for the People;” see Figure 2). And they are universally enamored with local music and public festivity, to the point of enrolling in second-line dancing classes and taking it upon themselves to organize jazz funerals whenever a local icon dies.

By the anthropologist’s notion, however, transplants are definitely changing New Orleans culture. They are much more secular, less fertile, more liberal, and less parochial than native-born New Orleanians. They see local conservatism as a problem calling for enlightenment rather than an opinion to be respected, and view the importation of national and global values as imperative to a sustainable and equitable recovery. Indeed, the entire scene in the new Bywater eateries—from the artisanal food on the menus to the statement art on the walls to the progressive worldview of the patrons—can be picked up and dropped seamlessly into Austin, Burlington, Portland, or Brooklyn.


Figure 2. “Fine Dining for the People:” streetscapes of gentrification in Bywater. Montage by Richard Campanella.

A Precedent and a Hobgoblin

How will this all play out? History offers a precedent. After the Louisiana Purchase in 1803, better-educated English-speaking Anglos moved in large numbers into the parochial, mostly Catholic and Francophone Creole society of New Orleans. “The Americans [are] swarming in from the northern states,” lamented one departing French official, “invading Louisiana as the holy tribes invaded the land of Canaan, [each turning] over in his mind a little plan of speculation”—sentiments that might echo those of displaced natives today.3 What resulted from the Creole/Anglo intermingling was not gentrification—the two groups lived separately—but rather a complex, gradual cultural hybridization. Native Creoles and Anglo transplants intermarried, blended their legal systems, their architectural tastes and surveying methods, their civic traditions and foodways, and to some degree their languages. What resulted was the fascinating mélange that is modern-day Louisiana.

Gentrifier culture is already hybridizing with native ways; post-Katrina transplants are opening restaurants, writing books, starting businesses and hiring natives, organizing festivals, and even running for public office, all the while introducing external ideas into local canon. What differs in the analogy is the fact that the nineteenth-century newcomers planted familial roots here and spawned multiple subsequent generations, each bringing new vitality to the city. Gentrifiers, on the other hand, usually have very low birth rates, and those few that do become parents oftentimes find themselves reluctantly departing the very inner-city neighborhoods they helped revive, for want of playmates and decent schools. By that time, exorbitant real estate precludes the next wave of dynamic twenty-somethings from moving in, and the same neighborhood that once flourished gradually grows gray, empty, and frozen in historically renovated time. Unless gentrified neighborhoods make themselves into affordable and agreeable places to raise and educate the next generation, they will morph into dour historical theme parks with price tags only aging one-percenters can afford.

Lack of age diversity and a paucity of “kiddie capital”—good local schools, playmates next door, child-friendly services—are the hobgoblins of gentrification in a historically familial city like New Orleans. Yet their impacts seem to be lost on many gentrifiers. Some earthy contingents even expresses mock disgust at the sight of baby carriages—the height of uncool—not realizing that the infant inside might represent the neighborhood’s best hope of remaining down-to-earth.

Need evidence of those impacts? Take a walk on a sunny Saturday through the lower French Quarter, the residential section of New Orleans’ original gentrified neighborhood. You will see spectacular architecture, dazzling cast-iron filigree, flowering gardens—and hardly a resident in sight, much less the next generation playing in the streets. Many of the antebellum townhouses have been subdivided into pied-à-terre condominiums vacant most of the year; others are home to peripatetic professionals or aging couples living in guarded privacy behind bolted-shut French doors. The historic streetscapes bear a museum-like stillness that would be eerie if they weren’t so beautiful.

Richard Campanella, a geographer with the Tulane School of Architecture, is the author of Bienville’s Dilemma, Geographies of New Orleans, Delta Urbanism, Lincoln in New Orleans, and other books. He may be reached through richcampanella.com, rcampane@tulane.edu, and nolacampanella on Twitter.

--------

1 The years-long displacement opened up time and space for the ensuing racial and socio-economic transformations to gain momentum, which thence increased housing prices and impeded working-class households with families from resettling, or settling anew.

2 These Census Bureau race and age figures are drawn from what most residents perceive to be the main section of Bywater, from St. Claude Avenue to the Mississippi River, and from Press Street to the Industrial Canal. Other definitions of neighborhood boundaries exist, and needless to say, each would yield differing statistics.

3 Pierre Clément de Laussat, Memoirs of My Life (Louisiana State University Press: Baton Rouge and New Orleans, 1978 translation of 1831 memoir), 103.

The Beauty of Urban Planning from the Ground

$
0
0

In a piece called The Beauty of Urban Planning from Space, the Sustainable Cities Collective highlights views from space of uniquely designed street pattern designs in various cities around the world. There are ten examples that illustrate the zenith of urban planning.

As attractive as the street patterns are, they highlight the inevitable inability of designers, or anyone else for that matter, to influence much more than small changes in the overall urban form.

The Incomplete Street Patterns

This point is evident in eight of the 10 urban areas illustrated, where the unique street pattern comprise only part of a much bigger city. The eight are Belo Horizonte, Brazil; Brasilia, Brazil, Washington, DC; New Haven, CT; La Plata, Argentina; Jaipur, India; Adelaide, Australia; and Canberra, Australia.

The best known example may be Washington, DC, where L'Enfant's street pattern served most of the city for more than a century, which is probably a world record for a growing urban area. Yet, today, L'Enfant's design covers less than five percent of the urban area that today has more people than the nation at the time L'Enfant received his position.

In La Plata (See end note on La Plata) the street design comes the closest to covering the whole urban area (Figure 1, from Google Maps). Taking design a bit further, every street is numbered in this city that was planned to be the capital of Argentina's largest province (Buenos Aires, which is separate from the provincial equivalent city of Buenos Aires). Three other of the examples were also new cities planned as capitals, including Brasilia, Canberra and, of course, Washington.

Stagnant Cities

The other two examples are a dying mining town (El Salvador, Chile), which has lost more than two thirds of its population and an Italian medieval fortress town, Palmanova. The latter is more a museum than a dynamic urban area. It is confined to its original area and its population could fit into London's Royal Albert Hall (approximately 5,000).

Belo Horizonte, Brazil

The Belo Horizonte Centro (Note on Belo Horizonte) street pattern is unique. It was part of the inspiration for my Urban Tours by Rental Car website (rentalcartours.net) and a map of Centro was incorporated into the logo (Figure 2).


Figure 2

In Centro, diagonals are superimposed on a conventional north-south/east-west street pattern (Figure 3, from Google Earth). However Centro's street pattern covers less than one percent of the Belo Horizonte urban area, three square miles out of more than 400 (five square kilometers out of 650). Figure 4 shows Centro in red, engulfed by the much larger urban area, outlined in yellow.

The first rental car tour described the Belo Horizonte Centro street pattern:

Belo Horizonte represents both the best and worst in urban planning. The core has, at least from map inspection, a pleasing street layout. In a flair that outdid L’Enfant’s Washington diagonals, Belo Horizonte Centro has a grid of streets on which is superimposed a grid of diagonals. Of course, the resulting eight street intersections make traffic more of a difficulty than with the four that are usual or the grade separations of Brasilia. Centro has a number of wide boulevards, many with green, treed medians and, in the Brazilian style, some with four roadways --- center express lanes and outside local lanes. These “three median” streets, give a pleasing feeling. The overall result is an impression similar to that of Barcelona, and a particularly attractive core that would do most European cities proud. 

But, not far from Centro the randomness begins. To the north is the river, and clearly no attempt
was made to continue the pattern beyond that. To the south are hills that would have precluded expansionof the plan. Nor does the pattern extend far to the less challenging east or west

Unscrambling Means and Ends

Street patterns from space provide no indication of urban planning's effectiveness, nor of urban policy of which planning is a part. Planning is a means, not the end of cities.

Over the past two centuries, billions of people have moved to cities. They did not move for the fountains, architecture, or museums (otherwise they would all live in the ville de Paris or Manhattan). In short, urban planning principles of any era have had little impact in the growth of cities.

Urban planning's current "top-down" genre is rather new. Until the British Town and Country Planning Act of 1947 and similar measures, planners contented themselves to design street networks (which the Sustainable Cities Coalition highlights so well) and other necessary infrastructure, such as water and sewer networks. Their handiwork is obvious in the 19th century designed street grid of Manhattan, the straight streets of Phoenix and the modified grid of the Toronto metropolitan area. These are the broad functions emphasized by New York University Professor Shlomo Angel in his Planet of Cities.

Now, urban planning can work against the very justification of cities, the prosperity of its residents.

Successful Cities

The success of urban policy (and urban planning) can be judged by how well the purpose of the city is served – the reason people moved there in the first place. The purpose of the city was well articulated by former World Bank principal planner Alain Bertaud:  Large labor markets are the only raison d’être of large cities. Cities are much more about economics than aesthetics. (See end note on Sustainability).

The successful city will facilitate greater affluence – higher discretionary incomes – among its residents.

Regrettably, there are notable failures in this regard. For example, the urban containment policies of smart growth, which ration land and raise the price of housing relative to incomes, have been adopted in cities from Sydney to Toronto and Portland. As a result, residents have less money to spend after taxes and paying for necessities and are less affluent than they would be without such policies. In his introduction to the 9th Annual Demographia Housing Affordability Survey, New Zealand's Deputy Prime Minister Bill English pointed out that higher house prices that occur when land is "made artificially scarce by regulation that locks up land for development."

Another problem is evident in excessive traffic congestion and slower travel times. Getting around town quickly contributes to greater economic growth and discretionary incomes. Public policy must facilitate mobility throughout the urban area. The mode --- the means --- is not important, the access is. Transit services are appropriate where time competitive with the automobile, such as to the largest downtowns (See Transit Legacy Cities). However, because of its unparalleled ability to provide rapid mobility throughout the urban area, public policy must also ensure a minimum of traffic congestion and effective access by cars and commercial trucks. The evidence is clear that the higher densities preferred by modern urban planning impede rapid mobility throughout the urban area (see Urban Travel and Urban Population Density).

Finally, by facilitating housing affordability and more free-flowing traffic, the important objective of alleviating poverty is served (an objective that cannot sustainably be served without economic growth)

The Beauty of Urban Planning from the Ground

The "beauty of urban planning" is reliably appreciated from the ground, not from space. The test is how well people live, not what the city looks like. The subject is people, not architecture or urban form (see Toward More Prosperous Cities: A Framing Essay on Urban Policy, Planning, Transport and the Dimensions of Sustainability).

Wendell Cox is a Visiting Professor, Conservatoire National des Arts et Metiers, Paris and the author of “War on the Dream: How Anti-Sprawl Policy Threatens the Quality of Life.

-----

Note on La Plata: La Plata is in the Buenos Aires metropolitan area, approximately 35 miles (60 kilometers) south of Centro in Buenos Aires. However, it is a separate urban area because of a comparatively break in the continuous urbanization between La Plata and Buenos Aires. Buenos Aires province is by far the nation's largest provincial level jurisdiction, with a population five times as great as the city of Buenos Aires. Much of the population is concentrated near the city of Buenos Aires, with which it forms one of the world's megacities. The Buenos Aires also has the largest land area and would rank 6th if it were in the United States (nearly as large as New Mexico).

Note on Belo Horizonte: Belo Horizonte is capital of the state of Minas Gerais. Belo Horizonte is Brazil's third largest urban area, after Sao Paulo and Rio de Janeiro, with a population of more than 5 million --- approximately the population of the Miami urban area (which stretches from southern Dade County to northern Palm Beach County)

Note on Sustainability: Urban policies that would artificially constrain urban expansion (such as with urban growth boundaries) and discourage automobile travel have often been cited as principal strategies for reducing greenhouse gas emissions. However, important reports indicate little potential for greenhouse gas reductions from these policies, with the overwhelming share resulting from improved fuel economy. Moreover, recent research in England suggested that such policies should not "automatically be associated with the preferred growth strategy" (see Questioning the Messianic Conception of Smart Growth).

Photo: Belo Horizonte Centro from Nova Lima (by author)

Disney Stops Thinking About Tomorrow

$
0
0

Walt Disney's first version of Tomorrowland came to life in 1955. The attractions were geared towards the space age, and towards the future of transportation that Disney believed scientists of his time were about to create. The imaginary world was intended to “give you an opportunity to participate in adventures that are a living blueprint of our future.” When Tomorrowland opened, its showpiece was the TWA Moonliner exhibit, which contained the Rocket to The Moon; later, its Flight to the Moon gave another perspective. Once Neil Armstrong walked on the moon, these Disney attractions were no longer science fiction.

Accommodating the reality of moon flights, the Flight to the Moon was updated to Mission to Mars. Only 14 years after the park opened, the space age that Walt Disney had imagined was becoming a reality. Before President Eisenhower had signed the Interstate Highway legislation, Autopia allowed riders to experience Disney’s interpretation of what the system would one day be like. Autopia accurately envisioned the future of America's soon to be multilane limited-access highways.

Another addition to Tomorrowland was the Monsanto House of the Future, added in 1957. Items such as picture phones, television remote controls and a microwave oven familiarized many visitors with these ideas for the first time. Tomorrowland continued to prove itself as an innovative predictor of the near future.

Downfall of the Futuristic Tomorrowland - Unlike its predecessor, Mission to Mars wasn't replaced after becoming a reality. Instead, Red Rockett’s Pizza Port, a space themed pizza parlor, took its spot in the 1998 refurbishment. Disney didn’t have enough confidence in a real mission to Mars to update or revamp the ride. Instead of updating it, Disney was essentially saying that a successful human mission to mars was not a fathomable idea.

At the same time, Disneyland was cutting back on refurbishment in the Carousel of Progress. This attraction took viewers on a journey through the eyes of a “typical” American family exploring life through the dawn of electricity and other technological advancements. Periodic updates were necessary to keep up with the times of its audience. The first version lasted three years, the second six years, and then two years, ten years, and nine years respectively. The attraction has been periodically closed, but hasn’t been significantly modified in 18 years. This increased changeless period waves another flag of concern, as it demonstrates Disney's view that there has been no noteworthy progress in almost two decades.

Rather than foreshadowing, like the early Tomorrowland did, current Tomorrowland is opening attractions like Buzz Lightyear Astro Blasters, where passengers shoot targets modeled from Toy Story or a submarine voyage where passengers go “under the sea” to spend time with characters from Finding Nemo. Concentrating on movies expresses that Disneyland has no expectations to focus on the future. The most recent display of this is the sequel of the Star Wars themed motion simulator, Star Tours: The Adventures Continue. Instead of replacing the out of date ride with a new, innovative idea, the same idea from 1987 with newer graphics sufficed. While in the past a bright vision of the future both inspired and guided Disney’s early Tomorrowland, today’s innovative standstill forces the Disney company to draw the focus off the future’s possibilities and gear the theme park towards animations.

Disney Movies - Select movies demonstrate Disney’s continual hope in the space era. The first Zenon movie was set in the year 2049 and took place in the orbiting space station where Zenon’s family resided. Even though this movie was released in 1999, much after Walt Disney’s death, his visions of a space era are directly displayed. Since Zenon, Disney has released another movie with humans residing in an orbiting space station. In 2008’s Wall-E, the humans were forced to evacuate to space in 2105 when the earth became unsafe for human life.

While Disney is keeping their space era predictions, they are continuously projecting them further into the future. Originally, 1955’s Tomorrowland envisioned space development for 30 years in the future. 1999’s Zenon gave the orbiting space home 50 years to become reality, and 2008’s Wall-E gave nearly 100 years until humans began to live in space. This growing gap shows that although the idea of space development stays near to Disney’s heart, the company's pessimism about the technological advancements of society certainly exists.

Justified Pessimism? - Disney’s pessimistic attitude towards the rate of current advancement comes from a place of truth. New, revolutionary ideas were coming out on a consistent basis in the mid 1900s during Walt Disney’s generation, but near the late 1900s progress as a whole slowed down. Rather than innovating new and fresh ideas, the current generation fine-tunes the revolutionary ideas of their predecessors.

A kitchen today won’t differ too grandly from one in 1980. Although most appliances may be higher quality, they were still there in both eras. Comparing kitchens from 1980 and 1940 shows vast differences. Not only did appliances get sleeker, but you will also not find a microwave, a food processor nor Tupperware anywhere. These are only a few of the many kitchen changes that came to life in that time period. The kitchen only represents a small sector of technology and advancement, but the trend it represents stands.

The oldest members of today’s world lived through the invention or development of the airplane, skyscraper, suspension bridge, radio, television, antibiotics, atomic bombs, and interstate highways. The mid-life individuals went through the first moon landing, the popularization of personal computers and invention of search engines, biotechnology, and cellphones. Participants of the younger generation have seen much up- tuning of these devices, but are greatly lacking in brand new revolutionary inventions.

Facebook and the iPhone may be classified as the monumental inventions of the past decade. While they improved the social networking and convenience of society, can they really be compared the monumentality of the first airplane or personal computer? Previous milestones are being expanded and fine-tuned. Rather than thinking of new revolutionary discoveries, the current generation attempts to fix the old ones. Technology seems to be hitting a very worrisome plateau.

Walt Disney was justified in the optimism he displayed with 1955’s version of Tomorrowland. He belonged to the generation of innovation ,and naturally expected society to continue flourishing. He didn’t foresee the technological plateau blocking Tomorrowland from becoming reality. Currently, Disneyland is trying to divert notice from the lack of change by adding more animated features to Tomorrowland. The new rides help visitors feel as if Tomorrowland is still continually changing, and that progression hasn’t slowed down.

However, it’s only a matter of time until the whole sector becomes a Disney themed montage. If technological development continues at this rate, Tomorrowland may as well combine with Fantasyland as a childish delusion from the past. As displayed by the modern developments of both Disney movies and Disneyland, the once flourishing future that Disney envisioned for the world is coming to a rapid halt.

Flickr photo by jnocca93:
Entrance to Tomorrowland
at Disneyland, California.

Zohar Liebermensch is a sophomore studying business administration emphasizing in economics with minors in computational sciences and the university honors program at Chapman University. Born in Israel, she moved to northern California when she was a toddler and has been enjoying Orange county for the past two years. She is vice president of the Chapman chapter of the National Society of Leadership and Success as well as a member of the university's soccer team.

The Age of Bernanke

$
0
0

To many presidential idolaters, this era will be known as the Age of Obama. But, in reality, we live in what may best be called the Age of Bernanke. Essentially, Obamaism increasingly serves as a front for the big-money interests who benefit from the Federal Reserve's largesse and interest rate policies; progressive rhetoric serves as the beard for royalist results.

Overall, the impacts of ultralow interest rate, cash-machine policies of Fed Chairman Ben Bernanke trump everything else. The presidential stimulus was, at best, modestly effectively, and certainly did little to turn around the fortunes of most Americans or spark much economic growth. Unemployment remains stuck at around 8 percent and 8.5 million workers have exited the labor force.

But the Bernanke policies have succeeded in reshaping the economic landscape in ways that, while good for the plutocracy and Wall Street, are not particularly positive for the vast majority of Americans.

Economic Losers

Many of the biggest losers in the Bernanke era are key Democratic constituencies, such as minorities and the young, who have seen their opportunities dim under the Bernanke regime. The cruelest cuts have been to the poor, whose numbers have surged by more than 2.6 million under a president who has promised relentlessly to reduce poverty.

Things, of course, have not too great for the middle-age and middle-class – more of them now supporting both aging parents and underemployed children. Median income in America is down 8 percent from 2007, and dropping. Things, in reality, are not getting better for anyone but the most affluent.

A particular loser has been small business. As we enter the sixth year since the onset of the Great Recession, and nearly four years after the "recovery" officially began, small business remains in a largely defensive mode. Critically, start-up rates are well below those than following previous downturns in 1976 and 1983. The number of startup jobs per 1000 – a key source of job growth in the past – over the past four years is down a full 30 percent from the Bush and Clinton eras. New firms – those five years or younger – now account for less than 8 percent of all companies, down from 12 percent to 13 percent in the early 1980s, another period following a deep recession.

With demand and growth still weak, small business enters the new year with among the lowest expectations of any large economic sector. As Gallup points out, one in five small companies expects to lower its employee count, one in three expect to decrease capital spending and almost as many expect to be in more severe cash-flow troubles by the end of the year.

This decline of small-business sentiment constitutes arguably the biggest reason for our poor job-creation numbers. If small business had come out of the recession maintaining just the rate of start-ups generated in 2007, notes McKinsey, the U.S. economy would today have almost 2.5 million more jobs than it does.

Smaller Banks

One source for this decline lies in the difficulties faced by smaller community banks, which tend to be those most likely to lend to entrepreneurial firms. Jeff Ball, chairman-elect of the California Bankers Association and founder of Whittier-based Friendly Hills Bank, suggests the Fed's policies – as well as growing regulatory policies – has led to an unprecedented concentration of financial assets in the hands of a few large "too big to fail banks" while the number of smaller community banks has been shrinking.

"Everywhere you turn there's a 'gotcha' from the regulators," Ball notes. "The big banks can deal with the regulations far more easily than the community banks. And because some banks are perceived as 'too big to fail,' there's easier access to credit, and they are perceived to be better to invest in."

So, who have been the big winners in the Age of Bernanke? The very people who were supposed to be the bête noires of the age of Obama: the large financial institutions. In 2013, the top four banks controlled more than 40 percent of the credit markets in the top 10 states, up by 10 percent from 2009 and roughly twice their share in 2000. At the same time, since the passage of the Dodd-Frank financial regulations, there are some 330 fewer small banks. Under the current regime, the oligopolization of the credit markets will continue apace, as much, or even more, than if Mitt Romney had won the presidency.

Higher Profits

Under these circumstances, it's not surprising that large financial institutions and hedge fund have enjoyed close-to-record profits under Obama. This fall, for example, Wells Fargo and JP Morgan announced record profit. And despite widespread condemnation their executives have continued to enjoy outsized compensation, often greater than under George W. President Bush.

Unlike smaller firms, or the middle class, the big financial institutions have feasted like pigs at the trough, with the six largest banks borrowing almost a half-trillion dollars from Uncle Ben Bernanke's printing press. While millions of Americans have lost homes and much of their net worth, there has been not a single high-level prosecution by the Obama administration of the grandees of the very financial giants at the heart of the mass misery.

Even the nascent housing recovery – which could create wealth for the middle class – appears largely to be creating opportunities for wealthy investors. In California, as well as other hard-hit real estate markets, such as in Florida, Arizona and Nevada, private investors constitute a large portion of buyers. The big private-equity firm Blackstone recently announced plans to buy $100 million in homes every week.

These wildly divergent results between the hoi polloi and the financial elites do not seem to bother our "organizer in chief," particularly with re-election behind him. Instead, the Bernanke regime seems to be cementing a strong alliance of convenience between the government sector – which needs low interest rates to keep funding itself – and those with the easiest access to cheap money.

Some observers, such as former Clinton Administration advisor Bill Galston, suggest we could see the emergence of a closer political alliance between big business and the public sector interests. Democrats, he suggests, have a natural alliance with larger firms, not only in the financial industry, while small-business lobbies remain "a building-block of the Republican base."

New Corporatism

This new corporatism that is becoming an integral part of the supposedly middle-class oriented Democratic Party. Close Obama advisers, like disgraced investment banker and political fixer Steven Rattner, Obama's czar for the auto bailout, justify collusional capitalism, both in China and in America's "too big to fail" regime.

The reality remains that, rhetoric aside, corporate cronyism remains at the core of this administration and, sadly, the once-proudly populist Democratic Party. After his confirmation, we can expect former Citigroup profiteer Jacob Lew to follow Treasury Secretary Timothy Geithner, working along with Bernanke, to make sure the big Wall Street firms continue to thrive – even if the rest of us don't.

All this is reminiscent of something out of the declining days of the Roman Empire. The masses get bread (food stamps) and circuses, with virtually all of Hollywood and much of the media ready to perform on cue. The majority, losers in the Bernanke economy, lack the will and, maybe, the attention span to realize what is happening to them.

"The Roman people are dying and laughing," the fifth-century Christian writer Salvian wrote. Like America today, entertainment-mad Rome suffered from a declining middle class, mass poverty and domination by a few wealthy patricians, propped up by a compliant government. Unless Americans of both left and right wake up to reality, our civilization could suffer a similar inexorable decline in the Age or Bernanke.

Joel Kotkin is executive editor of NewGeography.com and a distinguished presidential fellow in urban futures at Chapman University, and a member of the editorial board of the Orange County Register. He is author of The City: A Global History and The Next Hundred Million: America in 2050. His most recent study, The Rise of Postfamilialism, has been widely discussed and distributed internationally. He lives in Los Angeles, CA.

This piece originally appeared in the Orange County Register.

Viewing all 3794 articles
Browse latest View live


Latest Images