It is important that traffic congestion be controlled sufficiently to facilitate a more competitive metropolitan economy. Each year, three organizations produce traffic congestion reports, Tom Tom, INRIX and the Texas Transportation Institute of Texas A&M University (TTI). These reports use different methods to estimate the excess time lost in traffic congestion during peak travel periods (morning and evening week day "rush hours").
The excess travel time is estimated relative to the travel time that would be expected if there were no congestion (if all traffic were free flowing). Economists caution that achieving free flow conditions at all times would require excessive investment. Yet, the standard metric used by the three indexes are useful for comparing the intensity of traffic congestion between metropolitan areas even without knowing the level at which economic efficiency is optimized.
There is generally strong correlation between the three indexes, though there are important differences. For example, the TTI report uses data from INRIX, yet agrees with INRIX on only six of the most congested 11 US major metropolitan areas (over 1 million population). The most substantial difference is in San Francisco, which INRIX (and Tom Tom) ranked as the second most congested major metropolitan area, far worse than the TTI ranking of 20th.
The findings from the three traffic congestion indexes are synthesized into a composite congestion index in this article. Because the TTI's latest index is 2011, composite index covers 2011 through 2013 (for methodology, see Note 1).
Worst Traffic Congestion in 2011-2013
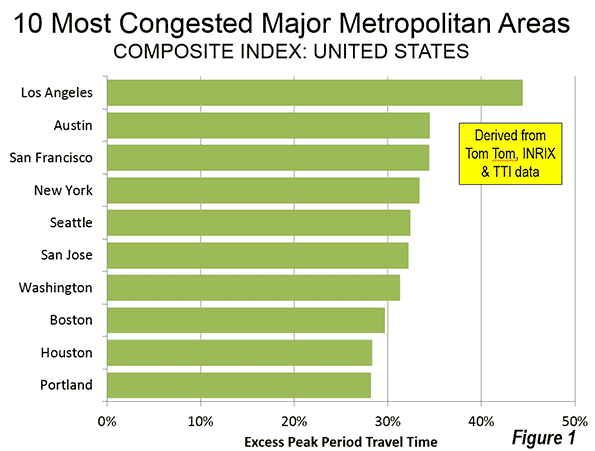
The "10 worst traffic congestion" list includes some of the largest metropolitan areas, those with the highest urban population densities and a few smaller metropolitan areas with special traffic congestion inducing conditions (Figure 1).
Los Angeles has the worst traffic congestion in each of the three indexes (44.4% excess travel time). This is consistent with the now 30 year history of TTI, which has typically shown Los Angeles to have the worst traffic congestion. This is not surprising, since Los Angeles is the densest urban area in the nation, ahead of second place San Francisco by 10 percent and New York by 30 percent. Traffic congestion has been made worse by cancellation of planned freeways and freeway segments in the Los Angeles area, such as the Beverly Hills Freeway, the Slauson Freeway, the Reseda Freeway, the La Cienega Route 170 freeway, the South Pasadena "missing link" and others (Note 2).
Austin ranked second in traffic congestion (34.5%). This may be surprising, since Austin is not among the largest major metropolitan areas, though it is among the fastest growing. In the middle 1950s, when the final plans for the interstate freeway system were completed, Austin was much smaller and only a single interstate route was justified. Later, opposition to freeway development led to increased congestion. In more recent years the Austin freeway system has been augmented by new toll roads, though roadway improvements have not been sufficient to deal with the rapidly rising demand.
Not surprisingly, San Francisco (34.4%), with the second highest urban density among major metropolitan areas, ranked third in traffic congestion. New York (33.4%), with its higher than average density and dense core area ranked fourth in traffic congestion. Seattle ranked fifth (32.4%), despite its somewhat lower urban density. Seattle's long and relatively narrow north-south urban form and modest north-south freeway capacity is an important contributor to its intense traffic congestion. As in the case of Los Angeles, some planned freeways were canceled, which has also exacerbated traffic congestion.
San Jose is a smaller major metropolitan area, yet has the sixth worst traffic congestion in the nation (32.2%). There are two principal contributing factors, its proximity to much larger San Francisco and the third highest urban density of the major metropolitan areas, 10 percent above New York.
Washington (31.3%) and Boston (29.7%) have the seventh and eighth worst traffic congestion respectively. In each case, core areas have little freeway capacity (in part because of freeway cancellations in both cities).
Houston, which had the worst traffic congestion the nation during the middle 1980s, now ranks much better, at ninth (28.3%). Houston's improvement has occurred because of the roadway expansions opened concurrent with some of the fastest population growth in the high income world over the past three decades.
Portland, like San Jose and Austin is not among the larger major metropolitan areas. Yet Portland ranked 10th in traffic congestion (28.2%). Portland's policies, such as densification, have contributed to this; these include a cancelled freeway and a preference for light rail over highway capacity expansion. According to the TTI index, Portland has seen its peak period congestion ranking rise from 47th worst (out of 100) in the middle 1980s to 6th worst in 2011.
Least Traffic Congestion in 2011-2013
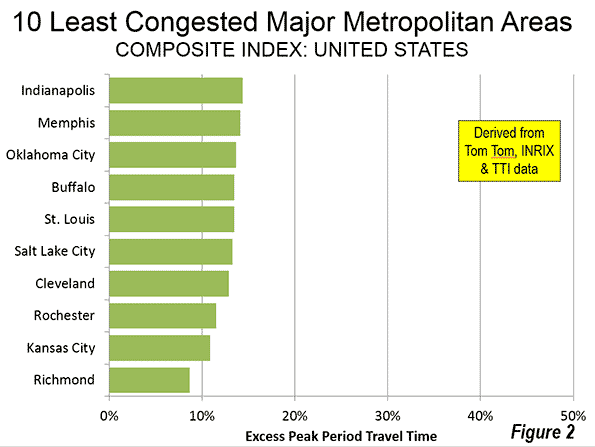
The major metropolitan areas with lower levels of congestion tend generally to be smaller and to have lower urban population densities (Figure 2).
Richmond is the least congested major metropolitan area in the nation (8.7%), and has experience growth since 2000 that is greater than average. Kansas City had the second least traffic congestion (10.9%), while nearly stagnant growth Rochester (11.5%) and Cleveland (12.9%) ranked third and fourth. Faster growing Salt Lake City ranked fifth (13.3%). Population losing Buffalo ranked sixth (13.5%) edged out seventh ranked and slow growing St. Louis (13.5%). Faster growing Oklahoma City ranked eighth (13.7%), while slower growing Memphis ranked ninth (14.1%). Indianapolis (14.4%), one of the few Midwestern metropolitan areas growing faster than average, has the 10th lowest traffic congestion level.
Traffic Congestion and Density
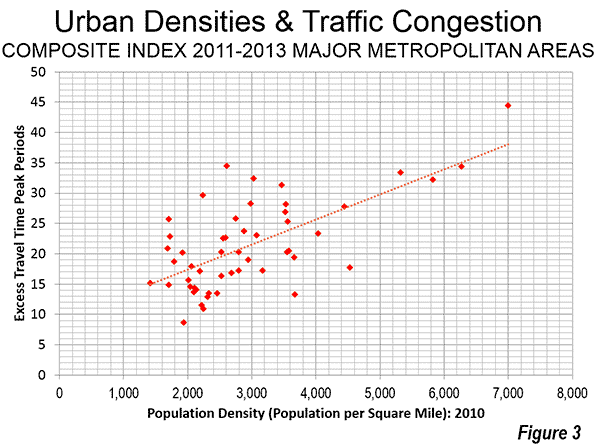
The connection between higher levels of traffic congestion and higher urban population densities has been documented in various analyses (also here). The traffic congestion index confirms that metropolitan areas with higher urban densities generally have more intense traffic congestion (Figure 3). Obviously, there are other factors that contribute to traffic congestion, not least the sufficient provision of highway capacity. This is evidenced by growing Dallas-Fort Worth and Phoenix, where state and local officials have provided substantial increases in highway capacity. Traffic congestion index shows Dallas-Fort Worth to have only the 16th worst traffic congestion and Phoenix to have the 33rd worst traffic congestion (out of the 52 major metropolitan areas). Greater employment dispersioncan also be an important factor. The data for each of the major metropolitan areas is in the Table.
| Composite Traffic Congestion Index: 2011-2013 | ||
| Excess Travel Time: Peak Periods | ||
| Rank | ||
| 1 | Los Angeles | 44.4 |
| 2 | Austin | 34.5 |
| 3 | San Francisco | 34.4 |
| 4 | New York | 33.4 |
| 5 | Seattle | 32.4 |
| 6 | San Jose | 32.2 |
| 7 | Washington | 31.3 |
| 8 | Boston | 29.7 |
| 9 | Houston | 28.3 |
| 10 | Portland | 28.2 |
| 11 | Miami | 27.8 |
| 12 | Chicago | 26.9 |
| 13 | Philadelphia | 25.8 |
| 14 | Atlanta | 25.7 |
| 15 | Denver | 25.3 |
| 16 | Dallas-Fort Worth | 23.7 |
| 17 | San Diego | 23.3 |
| 18 | Baltimore | 23.1 |
| 19 | Nashville | 22.9 |
| 20 | Minneapolis & St. Paul | 22.7 |
| 21 | Tampa-St. Petersburg | 22.6 |
| 22 | Charlotte | 20.9 |
| 23 | New Orleans | 20.5 |
| 24 | Orlando | 20.3 |
| 24 | Virginia Beach | 20.3 |
| 24 | Riverside-San Bernardino | 20.3 |
| 27 | Pittsburgh | 20.2 |
| 28 | Sacramento | 19.4 |
| 29 | Sacramento | 19.0 |
| 30 | Hartford | 18.7 |
| 31 | Cincinnati | 17.9 |
| 32 | Las Vegas | 17.7 |
| 33 | Phoenix | 17.2 |
| 33 | Detroit | 17.2 |
| 35 | Providence | 17.1 |
| 36 | Columbus | 16.8 |
| 37 | Milwaukee | 16.3 |
| 38 | Jacksonville | 15.7 |
| 39 | Birmingham | 15.2 |
| 40 | Raleigh | 14.9 |
| 41 | Louisville | 14.6 |
| 42 | Indianapolis | 14.4 |
| 43 | Memphis | 14.1 |
| 44 | Oklahoma City | 13.7 |
| 45 | St. Louis | 13.5 |
| 45 | Buffalo | 13.5 |
| 47 | Salt Lake City | 13.3 |
| 48 | Cleveland | 12.9 |
| 49 | Rochester | 11.5 |
| 50 | Kansas City | 10.9 |
| 51 | Richmond | 8.7 |
| Derived from Tom Tom, INRIX and Texas Transportation Institute data | ||
Traffic Congestion and Economic Growth
While there are different interpretations of the appropriate standard for traffic congestion, there is no question but that less traffic congestion benefits a metropolitan area's competitiveness. Because traffic congestion increases travel times, it necessarily reduces the share of a metropolitan area's (labor market) jobs that can be reached by the average employee. A considerable body of research associates greater access (measured in time) with improved economic performance and job creation.
-----
Note 1: The 2011 – 2013 index represents the average excess travel time estimate of the three sources. For each source, each metropolitan area's excess travel time is converted to a percentage of the metropolitan area with the worst excess travel time. These percentages are then averaged and the final excess travel time estimate is calculated by applying this percentage to the average worst excess travel time for the three sources. But these estimates are based on the TTI travel time index, and the peak hour excess travel time percentages from INRIX and Tom Tom (the Tom Tom figure is obtained by averaging data from the morning and evening peak period).
Note 2: I have a personal attachment to the Long Beach Freeway "missing link" in South Pasadena. In the early 1960s my great aunt and her husband were forced to sell their home taken to the California Highway Department for the imminent construction of the roadway. This was the beginning of a decades-long fight to keep the freeway from splitting the city of South Pasadena. In the early 1980s, as a member of the Los Angeles County Transportation Commission I was appointed to a special committee chaired by County Supervisor Peter F. Schabarum to make a final route selection between the Caltrans "Meridian" route and the South Pasadena preferred "Westerly Route." Our decision, the result of submittals and hearings, confirmed the Caltrans route, but did nothing to alleviate the South Pasadena opposition. Now, there is the possibility of building a tunnel, which would minimize surface disruption.
----
Wendell Cox is principal of Demographia, an international public policy and demographics firm. He is co-author of the "Demographia International Housing Affordability Survey" and author of "Demographia World Urban Areas" and "War on the Dream: How Anti-Sprawl Policy Threatens the Quality of Life." He was appointed to three terms on the Los Angeles County Transportation Commission, where he served with the leading city and county leadership as the only non-elected member. He was appointed to the Amtrak Reform Council to fill the unexpired term of Governor Christine Todd Whitman and has served as a visiting professor at the Conservatoire National des Arts et Metiers, a national university in Paris.
Photo: Richmond (major metropolitan area with the least traffic congestion) by CoredestayChiKai