The US Census Bureau has released preliminary data for residential building permits by metropolitan area (housing market). This article provides data for all of the 384 metropolitan areas, with emphasis on the 113 with populations exceeding 500,000 residents (Note).
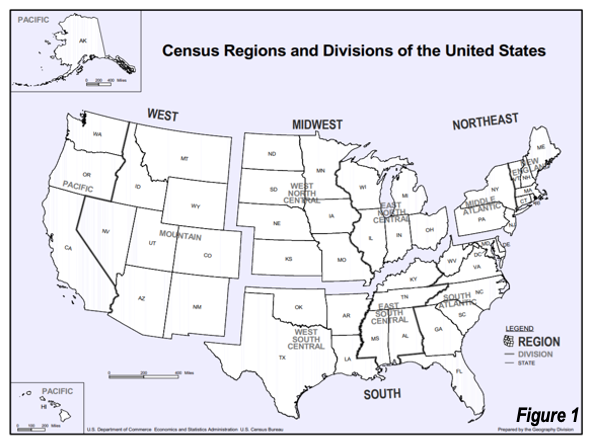
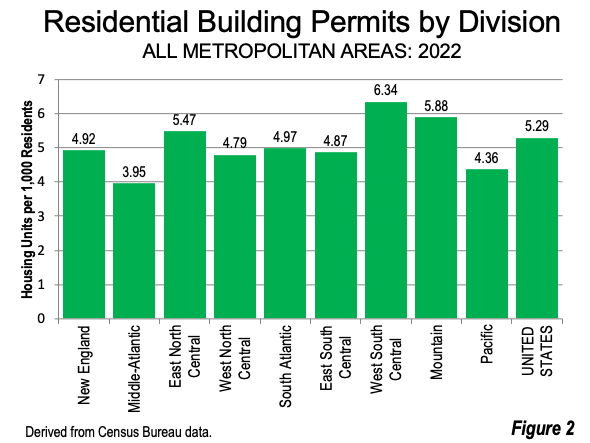
Overall, there were 5.29 residential building permits per 1,000 population in the United States. Among the nations nine Census Bureau divisions (Figure 1) the strongest performance was in the metropolitan areas of the West Southwest (which includes Texas), with a rate of 6.34 units per thousand population (Figure 2). The Mountain division was second at 5.83, while the East North Central division (The western half of the Midwest) was at 5.47 per thousand, a surprisingly high rate given its slow population growth. All other divisions are below the average; The Middle-Atlantic division (which includes New York, Pennsylvania and New Jersey ranked the lowest at 3.96, while the Pacific division was second lowest, at 4.36 per thousand. These divisions include the states with the highest urban population densities, number 1 California and number 2 New York.
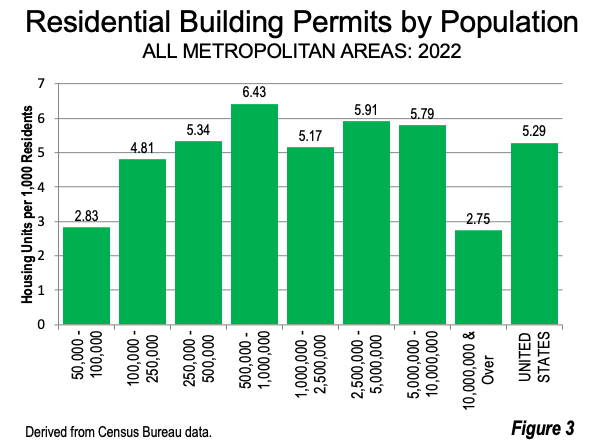
Generally the strongest performance by metropolitan area size was in the metropolitan areas with from 500,000 to 1,000,000 population, at 6.43 housing units per thousand population (Figure 3). The metropolitan areas with from 1,000,000 to 2.5 million population had 5.91 units per thousand and those from 5,000,000 to 10,000,000 had 5.79 per thousand. There was also a strong performance among the metropolitan areas of from 250,000 to 500,000, at 5.34. The weakest performance was among the metropolitan areas with more than 10,000,000 residents (this includes the nation’s two megacities, New York (NY-NJ-PA) and Los Angeles, at a 2.75 per thousand rate (Figure 4). The smallest metropolitan areas, under 100,000 population, were nearly as low at 2.83 rate.
Metropolitan Areas over 500,000 Population
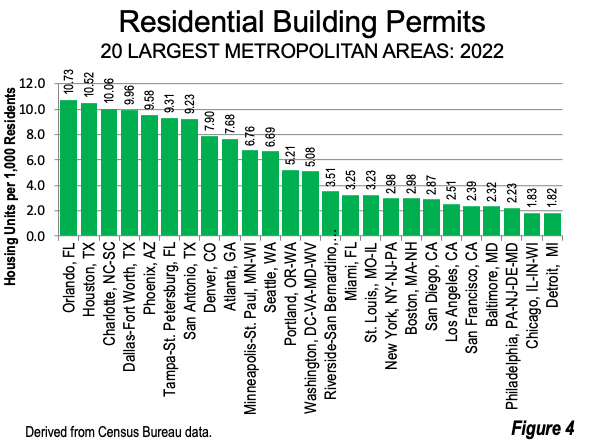
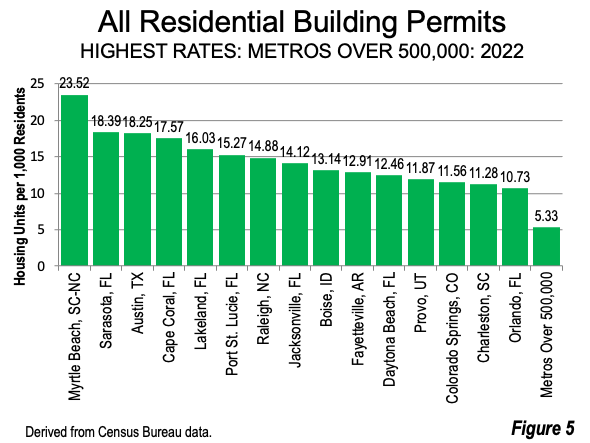
Among the metropolitan areas over 500,000 (Figure 5 and Table), Myrtle Beach, SC-NC (22.52) had the strongest performance followed by Sarasota, Austin, Coral Gables and Lakeland. All 15 strongest markets were in the South, except for Boise and Provo. Seven of the top 15 markets were in Florida. There were only three major markets (over 1,000,000 population) in the top 15 (Austin, Raleigh and Orlando).
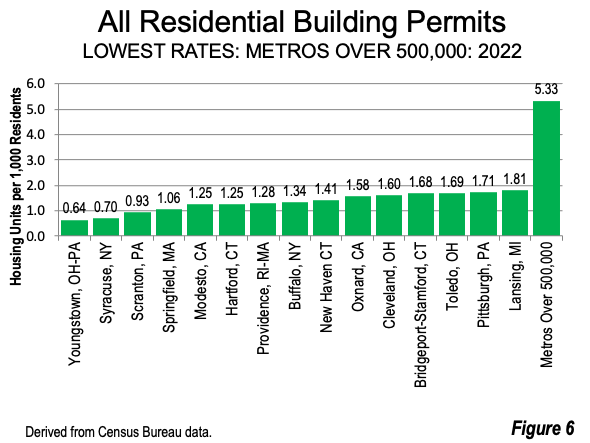
All of the lowest rates in this population category were in the East, Midwest or California (Figure 6). The lowest rate was in Youngstown, OH-PA, followed by Syracuse, NY, Scranton, PA, Bridgeport-Stamford, CT and Modesto, CA.
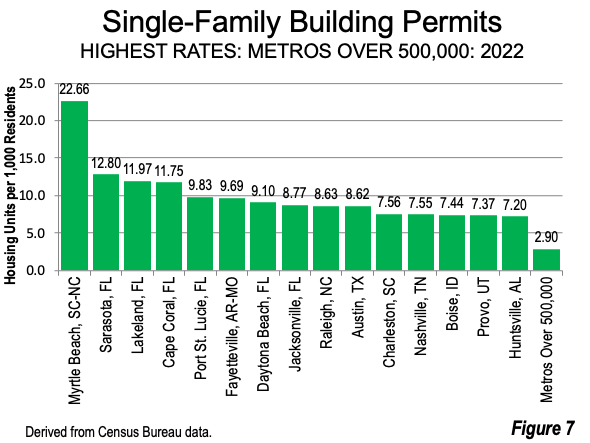
Among single-family permits (Figure 7), 13 of the top 15 markets were in the South, with two in the Mountain division. Myrtle Beach, again, had the highest rate, followed by four Florida markets (Sarasota, Lakeland, Cape Coral and Port St. Lucie). Fayetteville, AR ranked sixth, with two more Florida markets following (Daytona Beach and Jacksonville). Only four of the top 15 were major markets, Jacksonville, Raleigh, Austin and Nashville. Each of these 15 markets has been experiencing positive net domestic migration.
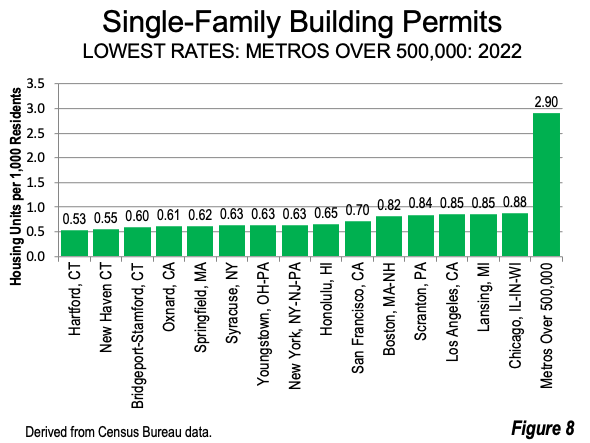
The lowest rates in single-family permits (Figure 8) were in Connecticut, with Hartford (0.53), New Haven (0.55) and Bridgeport-Stamford (0.58). Oxnard, California ranks fourth weakest. Four of the weakest 15 are governed by market level land use policies that discourage single-family housing development (Oxnard, Honolulu, San Francisco [which includes four counties] and Los Angeles).
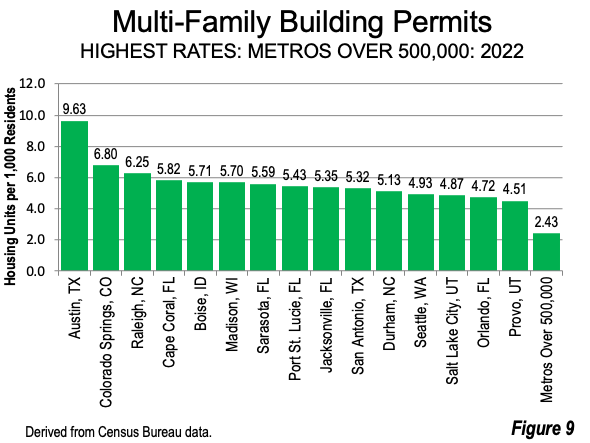
The highest multi-family rates (Figure 9) were in Austin (9.53), Colorado Springs (6.80), Raleigh (6.25), Cape Coral (5.82) and Boise (5.71). Interestingly, only Seattle, among the markets with strong policies favoring multi-family development, is among the top 15. In this regard, notably absent are the six major metropolitan areas of California, all with strong densification policy delivering well below average multi-family performance.
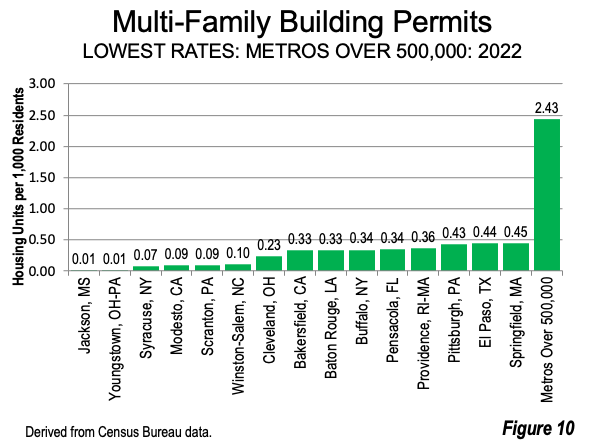
The lowest multi-family building permit rates (Figure 10) were in Jackson, MS, Youngstown, Syracuse, Modesto and Scranton.
The strongest building permit performance has been, not surprisingly, in markets that have been receiving strong net domestic migration, and especially those in the South Census region and the Mountain division. These trends could shift in the future, but the pattern of building permits indicates much not only about present growth, but what areas are likely to grow in the future.
Note: The Santa Rosa, California metropolitan area is excluded from this list, with its population falling from over 502,000 in 2017 to 485,000 in 2021.
Wendell Cox is principal of Demographia, an international public policy firm located in the St. Louis metropolitan area. He is a founding senior fellow at the Urban Reform Institute, Houston, a Senior Fellow with the Frontier Centre for Public Policy in Winnipeg and a member of the Advisory Board of the Center for Demographics and Policy at Chapman University in Orange, California. He has served as a visiting professor at the Conservatoire National des Arts et Metiers in Paris. His principal interests are economics, poverty alleviation, demographics, urban policy and transport. He is co-author of the annual Demographia International Housing Affordability Survey and author of Demographia World Urban Areas.
Mayor Tom Bradley appointed him to three terms on the Los Angeles County Transportation Commission (1977-1985) and Speaker of the House Newt Gingrich appointed him to the Amtrak Reform Council, to complete the unexpired term of New Jersey Governor Christine Todd Whitman (1999-2002). He is author of War on the Dream: How Anti-Sprawl Policy Threatens the Quality of Life and Toward More Prosperous Cities: A Framing Essay on Urban Areas, Transport, Planning and the Dimensions of Sustainability.
Photo: Myrtle Beach, SC-NC via Wikimedia in Public Domain.
| 2022 Building Permits: US Markets (MSAs) Over 500,000 Residents | |||||||
| Per 1,000 Population | |||||||
| Metropolitan Area (Housing Market) | All Housing Units | Rank | Single Family | Rank | Multi-Family | Rank | Population in 000s |
| Akron, OH | 4.36 | 62 | 1.15 | 88 | 3.22 | 31 | 700 |
| Albany, NY | 2.78 | 82 | 1.38 | 82 | 1.43 | 63 | 899 |
| Albuquerque, NM | 3.33 | 72 | 2.18 | 71 | 1.15 | 72 | 918 |
| Allentown, PA-NJ | 2.59 | 86 | 1.68 | 78 | 0.90 | 84 | 865 |
| Atlanta, GA | 7.68 | 32 | 4.29 | 33 | 3.39 | 28 | 6,144 |
| Augusta, GA-SC | 6.76 | 37 | 5.53 | 24 | 1.24 | 69 | 616 |
| Austin, TX | 18.25 | 3 | 8.62 | 10 | 9.63 | 1 | 2,352 |
| Bakersfield, CA | 3.04 | 78 | 2.71 | 56 | 0.33 | 106 | 918 |
| Baltimore, MD | 2.32 | 90 | 1.00 | 97 | 1.32 | 65 | 2,838 |
| Baton Rouge, LA | 4.38 | 59 | 4.05 | 38 | 0.33 | 105 | 872 |
| Birmingham, AL | 3.74 | 66 | 2.76 | 55 | 0.99 | 79 | 1,114 |
| Boise, ID | 13.14 | 9 | 7.44 | 13 | 5.71 | 5 | 795 |
| Boston, MA-NH | 2.98 | 80 | 0.82 | 103 | 2.17 | 43 | 4,900 |
| Bridgeport-Stamford, CT | 1.68 | 102 | 0.60 | 111 | 1.08 | 74 | 960 |
| Buffalo, NY | 1.34 | 106 | 1.00 | 96 | 0.34 | 104 | 1,162 |
| Cape Coral, FL | 17.57 | 4 | 11.75 | 4 | 5.82 | 4 | 788 |
| Charleston, SC | 11.28 | 14 | 7.56 | 11 | 3.72 | 24 | 813 |
| Charlotte, NC-SC | 10.06 | 17 | 7.03 | 16 | 3.03 | 34 | 2,701 |
| Chattanooga, TN-GA | 5.39 | 49 | 3.69 | 43 | 1.70 | 53 | 568 |
| Chicago, IL-IN-WI | 1.83 | 97 | 0.88 | 99 | 0.95 | 83 | 9,510 |
| Cincinnati, OH-KY-IN | 2.77 | 83 | 1.82 | 76 | 0.95 | 82 | 2,260 |
| Cleveland, OH | 1.60 | 103 | 1.37 | 83 | 0.23 | 107 | 2,076 |
| Colorado Springs, CO | 11.56 | 13 | 4.76 | 30 | 6.80 | 2 | 763 |
| Columbia, SC | 6.92 | 34 | 4.89 | 27 | 2.03 | 45 | 838 |
| Columbus, OH | 5.71 | 44 | 2.61 | 60 | 3.10 | 33 | 2,151 |
| Dallas-Fort Worth, TX | 9.96 | 19 | 5.59 | 22 | 4.37 | 19 | 7,760 |
| Dayton, OH | 2.77 | 84 | 1.54 | 80 | 1.23 | 70 | 814 |
| Daytona Beach, FL | 12.46 | 11 | 9.10 | 7 | 3.36 | 29 | 685 |
| Denver, CO | 7.90 | 29 | 3.40 | 48 | 4.50 | 16 | 2,973 |
| Des Moines, IA | 8.53 | 25 | 5.12 | 26 | 3.41 | 27 | 719 |
| Detroit, MI | 1.82 | 98 | 1.07 | 92 | 0.75 | 94 | 4,365 |
| Durham, NC | 9.98 | 18 | 4.85 | 29 | 5.13 | 11 | 654 |
| El Paso, TX | 3.25 | 75 | 2.81 | 54 | 0.44 | 100 | 871 |
| Fayetteville, AR-MO | 12.91 | 10 | 9.69 | 6 | 3.22 | 32 | 561 |
| Fresno, CA | 3.63 | 67 | 2.86 | 52 | 0.77 | 93 | 1,014 |
| Grand Rapids, MI | 3.60 | 68 | 2.31 | 69 | 1.29 | 66 | 1,092 |
| Greensboro, NC | 4.03 | 64 | 2.95 | 51 | 1.07 | 75 | 779 |
| Greenville, SC | 8.74 | 24 | 6.87 | 18 | 1.87 | 50 | 941 |
| Harrisburg, PA | 3.75 | 65 | 2.42 | 64 | 1.32 | 64 | 596 |
| Hartford, CT | 1.25 | 108 | 0.53 | 113 | 0.72 | 95 | 1,212 |
| Honolulu, HI | 2.58 | 87 | 0.65 | 105 | 1.92 | 48 | 1,001 |
| Houston, TX | 10.52 | 16 | 6.61 | 19 | 3.91 | 23 | 7,207 |
| Indianapolis. IN | 6.49 | 42 | 4.10 | 36 | 2.39 | 40 | 2,127 |
| Jackson, MS | 2.08 | 95 | 2.07 | 72 | 0.01 | 113 | 587 |
| Jacksonville, FL | 14.12 | 8 | 8.77 | 8 | 5.35 | 9 | 1,638 |
| Kansas City, MO-KS | 5.08 | 53 | 2.41 | 66 | 2.67 | 38 | 2,199 |
| Knoxville, TN | 5.65 | 47 | 4.48 | 31 | 1.17 | 71 | 893 |
| Lakeland, FL | 16.03 | 5 | 11.97 | 3 | 4.05 | 22 | 754 |
| Lancaster, PA | 2.32 | 91 | 1.46 | 81 | 0.86 | 88 | 554 |
| Lansing, MI | 1.81 | 99 | 0.85 | 100 | 0.95 | 81 | 540 |
| Las Vegas, NV | 5.70 | 45 | 4.02 | 39 | 1.69 | 55 | 2,292 |
| Little Rock, AR | 4.37 | 60 | 2.41 | 67 | 1.96 | 46 | 751 |
| Los Angeles, CA | 2.51 | 88 | 0.85 | 101 | 1.66 | 56 | 12,997 |
| Louisville, KY-IN | 4.05 | 63 | 2.60 | 61 | 1.45 | 62 | 1,285 |
| Madison, WI | 7.93 | 28 | 2.22 | 70 | 5.70 | 6 | 683 |
| McAllen, TX | 6.63 | 40 | 4.39 | 32 | 2.23 | 42 | 880 |
| Melbourne, FL | 8.51 | 26 | 6.91 | 17 | 1.60 | 57 | 617 |
| Memphis, TN-MS-AR | 3.23 | 77 | 2.62 | 59 | 0.62 | 97 | 1,336 |
| Miami, FL | 3.25 | 74 | 1.10 | 90 | 2.15 | 44 | 6,092 |
| Milwaukee,WI | 1.96 | 96 | 1.00 | 94 | 0.96 | 80 | 1,566 |
| Minneapolis-St. Paul, MN-WI | 6.76 | 38 | 2.47 | 63 | 4.29 | 20 | 3,691 |
| Modesto, CA | 1.25 | 109 | 1.16 | 87 | 0.09 | 110 | 553 |
| Nashville, TN | 9.30 | 22 | 7.55 | 12 | 1.75 | 52 | 2,012 |
| New Haven CT | 1.41 | 105 | 0.55 | 112 | 0.87 | 86 | 864 |
| New Orleans. LA | 3.32 | 73 | 2.48 | 62 | 0.84 | 89 | 1,262 |
| New York, NY-NJ-PA | 2.98 | 79 | 0.63 | 106 | 2.35 | 41 | 19,768 |
| Ogden, UT | 7.09 | 33 | 4.18 | 34 | 2.91 | 36 | 707 |
| Oklahoma City, OK | 4.75 | 57 | 4.15 | 35 | 0.60 | 98 | 1,442 |
| Omaha, NE-IA | 6.25 | 43 | 2.68 | 57 | 3.57 | 25 | 972 |
| Orlando, FL | 10.73 | 15 | 6.02 | 21 | 4.72 | 14 | 2,692 |
| Oxnard, CA | 1.58 | 104 | 0.61 | 110 | 0.99 | 78 | 840 |
| Philadelphia, PA-NJ-DE-MD | 2.23 | 94 | 1.22 | 85 | 1.01 | 77 | 6,229 |
| Phoenix, AZ | 9.58 | 20 | 5.42 | 25 | 4.15 | 21 | 4,946 |
| Pittsburgh, PA | 1.71 | 100 | 1.28 | 84 | 0.43 | 101 | 2,354 |
| Portland, ME | 6.61 | 41 | 3.61 | 44 | 2.99 | 35 | 557 |
| Portland, OR-WA | 5.21 | 51 | 2.38 | 68 | 2.83 | 37 | 2,512 |
| Poughkeepsie, NY | 2.28 | 93 | 1.17 | 86 | 1.12 | 73 | 702 |
| Providence, RI-MA | 1.28 | 107 | 0.92 | 98 | 0.36 | 102 | 1,676 |
| Provo, UT | 11.87 | 12 | 7.37 | 14 | 4.51 | 15 | 697 |
| Raleigh, NC | 14.88 | 7 | 8.63 | 9 | 6.25 | 3 | 1,448 |
| Richmond, VA | 7.86 | 30 | 3.40 | 47 | 4.46 | 17 | 1,324 |
| Riverside-San Bernardino, CA | 3.51 | 69 | 2.62 | 58 | 0.89 | 85 | 4,653 |
| Rochester, NY | 2.30 | 92 | 1.04 | 93 | 1.26 | 68 | 1,085 |
| Sacramento, CA | 4.44 | 58 | 3.37 | 49 | 1.07 | 76 | 2,411 |
| Salt Lake City, UT | 7.85 | 31 | 2.98 | 50 | 4.87 | 13 | 1,263 |
| San Antonio, TX | 9.23 | 23 | 3.91 | 41 | 5.32 | 10 | 2,602 |
| San Diego, CA | 2.87 | 81 | 1.07 | 91 | 1.80 | 51 | 3,286 |
| San Francisco, CA | 2.39 | 89 | 0.70 | 104 | 1.69 | 54 | 4,623 |
| San Jose, CA | 3.47 | 71 | 1.89 | 74 | 1.58 | 59 | 1,952 |
| Sarasota, FL | 18.39 | 2 | 12.80 | 2 | 5.59 | 7 | 860 |
| Scranton, PA | 0.93 | 111 | 0.84 | 102 | 0.09 | 109 | 568 |
| Seattle, WA | 6.69 | 39 | 1.75 | 77 | 4.93 | 12 | 4,012 |
| Spokane, WA | 6.87 | 35 | 3.40 | 46 | 3.47 | 26 | 593 |
| Springfield, MA | 1.06 | 110 | 0.62 | 109 | 0.45 | 99 | 695 |
| St. Louis,, MO-IL | 3.23 | 76 | 1.64 | 79 | 1.59 | 58 | 2,809 |
| Stockton, CA | 4.82 | 56 | 3.98 | 40 | 0.84 | 90 | 789 |
| Syracuse, NY | 0.70 | 112 | 0.63 | 108 | 0.07 | 111 | 658 |
| Tampa-St. Petersburg, FL | 9.31 | 21 | 4.87 | 28 | 4.44 | 18 | 3,220 |
| Toledo, OH | 1.69 | 101 | 1.00 | 95 | 0.69 | 96 | 644 |
| Tucson, AZ | 5.45 | 48 | 3.57 | 45 | 1.88 | 49 | 1,052 |
| Tulsa, OK | 5.01 | 54 | 3.74 | 42 | 1.27 | 67 | 1,024 |
| Virginia Beach-Norfolk, VA-NC | 3.48 | 70 | 2.03 | 73 | 1.45 | 61 | 1,803 |
| Washington, DC-VA-MD-WV | 5.08 | 52 | 1.83 | 75 | 3.25 | 30 | 6,356 |
| Wichita, KS | 4.37 | 61 | 2.42 | 65 | 1.95 | 47 | 648 |
| Winston-Salem, NC | 5.69 | 46 | 5.59 | 23 | 0.10 | 108 | 681 |
| Worcester, MA-CT | 2.64 | 85 | 1.12 | 89 | 1.52 | 60 | 978 |
| Youngstown, OH-PA | 0.64 | 113 | 0.63 | 107 | 0.01 | 112 | 538 |
| Fayetteville, NC | 4.89 | 55 | 4.09 | 37 | 0.80 | 92 | 525 |
| Lexington-Fayette, KY | 5.24 | 50 | 2.83 | 53 | 2.41 | 39 | 518 |
| Pensacola, FL | 6.81 | 36 | 6.47 | 20 | 0.34 | 103 | 516 |
| Myrtle Beach, SC-NC | 23.52 | 1 | 22.66 | 1 | 0.87 | 87 | 510 |
| Port St. Lucie, FL | 15.27 | 6 | 9.83 | 5 | 5.43 | 8 | 504 |
| Huntsville, AL | 8.03 | 27 | 7.20 | 15 | 0.83 | 91 | 503 |
| AVERAGE: 113 Markets | 5.33 | 2.90 | 2.43 | ||||
| Derived from Census Bureau data | |||||||