Recently the Census Bureau released 2011 county and metro area population estimates that showed overall slowing population growth and particularly showing slow to halting growth in exurban counties.
Someone once said to me about Chicago’s Mayor Daley that if he did something you liked, he was a visionary genius leader, but if he did something you hated, he was a corrupt machine dictator.
That seems to be how too many urbanists view the Census Bureau.
I’ll come back to the exurbs in a minute, but first a look at a map of metro area growth last year:
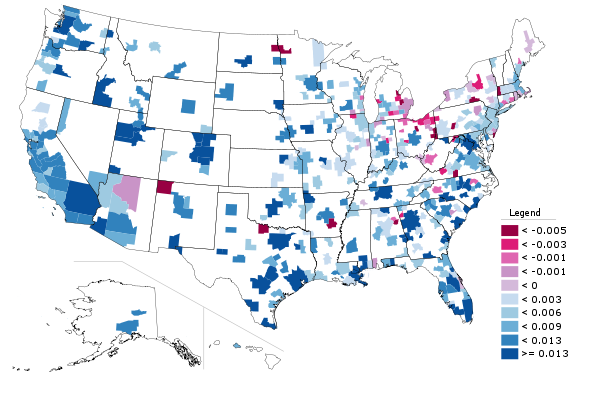
Metro area percent change in population, July 1, 2010 to July 1, 2011. Source: Census Estimates via Telestrian
Here’s the county map:
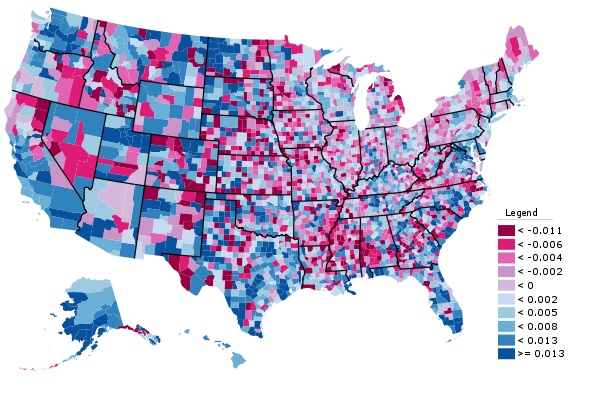
County percent change in population, July 1, 2010 to July 1, 2011. Source: Census Estimates via Telestrian
Someone once said to me about Chicago’s Mayor Daley that if he did something you liked, he was a visionary genius leader, but if he did something you hated, he was a corrupt machine dictator.
That seems to be how too many urbanists view the Census Bureau.
Back in the 90s when the Census estimates showed cities growing more slowly than boosters believed, they pressured the Census Bureau into adjusting the estimates to provide higher values. As it turned out, in most cases even the original estimates for cities proved inflated. In fact, the 90s were actually better for a lot of major cities than the 2000s were (e.g, New York, Los Angeles, and Chicago). This led to a new narrative that the Census had undercounted cities somehow.
Now this new data shows slowing exurban growth. All of a sudden, the Census Bureau has become once more a source of Gospel Truth, and I’ve seen many articles suggesting that the exurbs are dead, killed by rising gas prices and new Millennial preferences.
Let’s not get ahead of ourselves here.
Yes, exurban growth slowed recently. While cities on the whole fared more poorly than expected in the last census, we did see strong growth in downtowns and adjacent areas. I myself wrote about improving migration trends for core cities. That’s good news worth celebrating for cities. But don’t overstate the case.
I have a different though admittedly speculative take on the exurbs. I think a chunk of the fringe migration was from very low end home builders skipping out beyond established jurisdictions into unincorporated territory with few buildings restrictions. They threw up dirt cheap homes there and often sold them to people with marginal credit and income who had no business buying homes, using a variety of gimmicks to do so. (I know someone who sold homes for one of these builders, so I heard about some of these). Loose credit policies and government guarantees fueled this. The housing crash killed this market. Now that subsidies for this type of growth aren’t available, so that market is probably never coming back.
But when the economy improves and the market normalizes, I’d expect some level of suburbanization to resume. Part of the logic is simple math. If you add up the population of the municipalities of New York City, Los Angeles, Chicago, Philadelphia, San Francisco, Boston, Seattle, Washington, Portland, and Miami you only get 20 million people. That’s only about 20% of what the Census Bureau is projecting for just population growth by 2050. With the difficulties of building in urban areas, there’s no way to accommodate just the new growth even if everybody wanted into the city. In other words, there’s just no way there is going to be some massive back to the city movement. I hate to break it to you, but that’s reality.
Here’s the full list of large metros, sorted by population growth percentage:
| Row | Metro Area | 2010 | 2011 | Total Change | Pct Change |
| 1 | Austin-Round Rock-San Marcos, TX |
1,728,247
|
1,783,519
|
55,272
|
3.20%
|
| 2 | Raleigh-Cary, NC |
1,137,297
|
1,163,515
|
26,218
|
2.31%
|
| 3 | Dallas-Fort Worth-Arlington, TX |
6,400,511
|
6,526,548
|
126,037
|
1.97%
|
| 4 | San Antonio-New Braunfels, TX |
2,153,891
|
2,194,927
|
41,036
|
1.91%
|
| 5 | Houston-Sugar Land-Baytown, TX |
5,976,470
|
6,086,538
|
110,068
|
1.84%
|
| 6 | Charlotte-Gastonia-Rock Hill, NC-SC |
1,763,969
|
1,795,472
|
31,503
|
1.79%
|
| 7 | Denver-Aurora-Broomfield, CO |
2,554,569
|
2,599,504
|
44,935
|
1.76%
|
| 8 | Washington-Arlington-Alexandria, DC-VA-MD-WV |
5,609,150
|
5,703,948
|
94,798
|
1.69%
|
| 9 | Miami-Fort Lauderdale-Pompano Beach, FL |
5,578,080
|
5,670,125
|
92,045
|
1.65%
|
| 10 | Oklahoma City, OK |
1,258,111
|
1,278,053
|
19,942
|
1.59%
|
| 11 | Salt Lake City, UT |
1,128,269
|
1,145,905
|
17,636
|
1.56%
|
| 12 | Seattle-Tacoma-Bellevue, WA |
3,447,886
|
3,500,026
|
52,140
|
1.51%
|
| 13 | New Orleans-Metairie-Kenner, LA |
1,173,572
|
1,191,089
|
17,517
|
1.49%
|
| 14 | Orlando-Kissimmee-Sanford, FL |
2,139,615
|
2,171,360
|
31,745
|
1.48%
|
| 15 | Riverside-San Bernardino-Ontario, CA |
4,245,005
|
4,304,997
|
59,992
|
1.41%
|
| 16 | Nashville-Davidson–Murfreesboro–Franklin, TN |
1,594,885
|
1,617,142
|
22,257
|
1.40%
|
| 17 | Atlanta-Sandy Springs-Marietta, GA |
5,286,296
|
5,359,205
|
72,909
|
1.38%
|
| 18 | Portland-Vancouver-Hillsboro, OR-WA |
2,232,896
|
2,262,605
|
29,709
|
1.33%
|
| 19 | Tampa-St. Petersburg-Clearwater, FL |
2,788,151
|
2,824,724
|
36,573
|
1.31%
|
| 20 | Phoenix-Mesa-Glendale, AZ |
4,209,070
|
4,263,236
|
54,166
|
1.29%
|
| 21 | San Jose-Sunnyvale-Santa Clara, CA |
1,841,787
|
1,865,450
|
23,663
|
1.28%
|
| 22 | San Diego-Carlsbad-San Marcos, CA |
3,105,115
|
3,140,069
|
34,954
|
1.13%
|
| 23 | San Francisco-Oakland-Fremont, CA |
4,343,381
|
4,391,037
|
47,656
|
1.10%
|
| 24 | Indianapolis-Carmel, IN |
1,760,826
|
1,778,568
|
17,742
|
1.01%
|
| 25 | Sacramento–Arden-Arcade–Roseville, CA |
2,154,583
|
2,176,235
|
21,652
|
1.00%
|
| 26 | Minneapolis-St. Paul-Bloomington, MN-WI |
3,285,913
|
3,318,486
|
32,573
|
0.99%
|
| 27 | Columbus, OH |
1,840,584
|
1,858,464
|
17,880
|
0.97%
|
| 28 | Jacksonville, FL |
1,348,702
|
1,360,251
|
11,549
|
0.86%
|
| 29 | Las Vegas-Paradise, NV |
1,953,927
|
1,969,975
|
16,048
|
0.82%
|
| 30 | Los Angeles-Long Beach-Santa Ana, CA |
12,844,371
|
12,944,801
|
100,430
|
0.78%
|
| 31 | Richmond, VA |
1,260,396
|
1,269,380
|
8,984
|
0.71%
|
| 32 | Louisville/Jefferson County, KY-IN |
1,285,891
|
1,294,849
|
8,958
|
0.70%
|
| 33 | Boston-Cambridge-Quincy, MA-NH |
4,559,372
|
4,591,112
|
31,740
|
0.70%
|
| 34 | Kansas City, MO-KS |
2,039,766
|
2,052,676
|
12,910
|
0.63%
|
| 35 | Memphis, TN-MS-AR |
1,318,089
|
1,325,605
|
7,516
|
0.57%
|
| 36 | Baltimore-Towson, MD |
2,714,546
|
2,729,110
|
14,564
|
0.54%
|
| 37 | New York-Northern New Jersey-Long Island, NY-NJ-PA |
18,919,649
|
19,015,900
|
96,251
|
0.51%
|
| 38 | Philadelphia-Camden-Wilmington, PA-NJ-DE-MD |
5,971,589
|
5,992,414
|
20,825
|
0.35%
|
| 39 | Chicago-Joliet-Naperville, IL-IN-WI |
9,472,584
|
9,504,753
|
32,169
|
0.34%
|
| 40 | Milwaukee-Waukesha-West Allis, WI |
1,556,953
|
1,562,216
|
5,263
|
0.34%
|
| 41 | Virginia Beach-Norfolk-Newport News, VA-NC |
1,674,502
|
1,679,894
|
5,392
|
0.32%
|
| 42 | Birmingham-Hoover, AL |
1,129,068
|
1,132,264
|
3,196
|
0.28%
|
| 43 | Cincinnati-Middletown, OH-KY-IN |
2,132,415
|
2,138,038
|
5,623
|
0.26%
|
| 44 | St. Louis, MO-IL |
2,814,722
|
2,817,355
|
2,633
|
0.09%
|
| 45 | Pittsburgh, PA |
2,357,951
|
2,359,746
|
1,795
|
0.08%
|
| 46 | Hartford-West Hartford-East Hartford, CT |
1,212,491
|
1,213,255
|
764
|
0.06%
|
| 47 | Rochester, NY |
1,054,723
|
1,055,278
|
555
|
0.05%
|
| 48 | Providence-New Bedford-Fall River, RI-MA |
1,601,065
|
1,600,224
|
-841
|
-0.05%
|
| 49 | Buffalo-Niagara Falls, NY |
1,135,293
|
1,134,039
|
-1,254
|
-0.11%
|
| 50 | Detroit-Warren-Livonia, MI |
4,290,722
|
4,285,832
|
-4,890
|
-0.11%
|
| 51 | Cleveland-Elyria-Mentor, OH |
2,075,540
|
2,068,283
|
-7,257
|
-0.35%
|
Aaron M. Renn is an independent writer on urban affairs based in the Midwest. His writings appear at The Urbanophile, where this piece originally appeared. Renn is the founder of Telestrian, a data analysis and mapping tool used to create the maps seen here.