Housing affordability has been a tenacious and intractable urban problem for as long as stats have been kept. Several cities recently declared it a crisis. But what kind of problem is it? Opinions vary widely. An economic problem, or a social one? A land resource issue? Or, as traded wisdom would have it, the result of reliance on the wrong urban form? Proposed solutions vary accordingly. Now, new evidence rules out one potential source of unaffordable housing: clearly, it is not an urban form problem. The widely-believed theory that a city's lack of affordable housing can be fixed with increased compactness — when combined with public transit — is apparently wrong.
In a recent article we questioned a publicized correlation between a compactness index level (i.e., urban form) and housing affordability. The argument supporting compactness is that it enables the use of public transit and active mobility modes, which reduce transport expenses sufficiently to eclipse the higher cost of housing prevalent in compact districts. We challenged that assumption, and found that data from eighteen US regional metro regions showed no such effect. Even if it were at all present, it would not be sufficiently pronounced to be an effective solution. Those conclusions were based on a regional look at the problem.
While the aggregate regional data undermined the urban form theory of affordability, what do sub-regional level data show? At this finer level, could the housing-plus-transportation burden work to the advantage of households? To answer this question, we used data from 18 districts of the Metro Vancouver (BC) region. In this case, the official data exclude certain types of households — a critical limitation. But, given that such disaggregated data are rare, an effort at deciphering their meaning is warranted.
The two subject groups were Working Homeowners and Working Renters. First, we looked at whether or not the working homeowners could find accommodation that suited their income without stretching themselves thin.
Chart #1 shows the progression of housing costs in each sub-regional district, and the corresponding household median income. The in-step slopes of the two data sets suggest that working home-owning households have housing costs in tune with their earnings. This implication is further confirmed by the strong correlation (R2= 0.8598) between their income and their housing expenses.
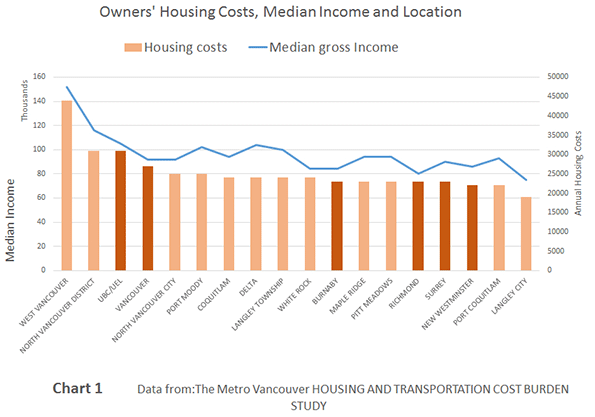
Housing costs that are proportional with income are a positive sign, but can these homeowners actually make their mortgage payments without financial stress? The data says yes, they can. This group's average ratio of housing payments to income is 26%. It never exceeds 30%, the accepted threshold of financial strain.
Instructively, from an urban form perspective, the highest ratios occur in the central, compact district; a confirmatory finding. Equally expected are that the lowest cost-to-income ratios occur in districts furthest from the center; these districts are either suburban or exurban.
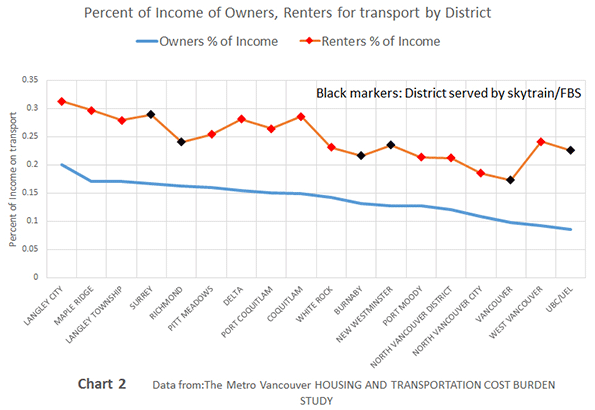
But are any of these home-owning households disadvantaged by excessive transportation costs due to their location? The data show a normal, average transportation expense of 14% of income and a range from about 8% to 20%. The ratios do increase with distance, but bear no significant correlation with income (R2= 0.0178).
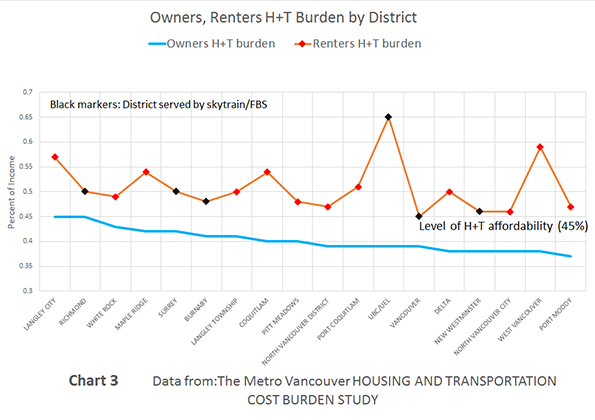
When choosing the place of residence, do homeowners consider housing costs, but disregard transportation costs? If so, could this lead to an affordability problem as measured by the combined costs? Apparently not. Chart #3 graphs (blue line) this group’s cost burden for combined housing and transportation (H+T) expenses, which never exceed the recognized affordability threshold: 45% of income.
Conclusion? Metro Vancouver's 305,000 households of working homeowners with mortgages aren't experiencing financial strain due to their housing costs, no matter what their preferred housing form, location or transportation arrangements. The urban and suburban locations of the city structure fully satisfy their housing and transport needs. Neither compactness nor its absence has a negative impact on their finances.
The data paints an entirely different picture for the 224,000 working households that rent their accommodations. Their average H+T burden (Chart #3; orange line) is 51% of their median income, and it ranges from the 45% threshold of affordability to an extreme of 65%.
This picture, however, is not the result of high housing costs; rents register in the affordable range in all locations but two. The average working renter's housing cost is 26%, which mimics that of a homeowner, and the range is below the stress level of 30%, with only two outliers (out of 18 districts) at 35% and 45% of income. For renters, as is the case for homeowners, the highest housing costs occur in the more compact districts. The outliers are found in elite social cluster districts — highly desirable neighborhoods — entirely unrelated to urban form.
Given that rent costs are within the affordable range in all but two locations, we may infer that the Metro Region provides a sufficient range of housing costs for this group in its current urban/suburban structure.
These findings are reinforced by the proportionality of incomes and housing expenses for both homeowners and renters. The incomes of renter households range from 45% to 63% of homeowners by location, and their rent costs are from 45% to 65%, an almost identical range.
It would seem, then, that the excessive H+T burden renters face can be attributed partially to the transportation costs of this group. However, contrary to expectations, of the six districts that have rapid rail service (sky-train; black markers on Chart #3), not one manages to have a total burden below the affordability threshold. That even goes for the two suburban districts that offer the lowest rents.
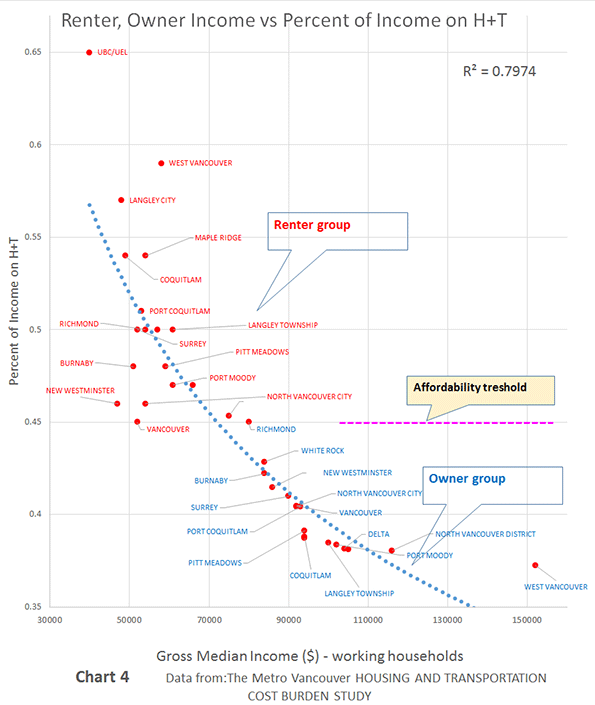
Chart #4 clearly shows the division between the earnings of owners and renters, and the affordability threshold that separates them. The belief that a compact urban form provides a path to solving housing affordability problems appears untenable.
Overall, the data shows that for working homeowners there are no locations in the Metro Vancouver Region, whether urban, suburban or exurban, that push housing costs or the combined costs of housing and transportation above the affordability threshold. Urban form is not affecting budgets in these households.
For working renters, rents are affordable in 16 of the 18 districts, whether urban, suburban or exurban. However, when transportation costs are added to their housing costs, the new sum puts them in financial stress, even in districts served by rapid rail transit.
This sub-regional, limited analysis confirms the findings of our earlier regional look: compactness and access to transit do not produce the affordability benefits that have been claimed. The compact urban form does not equal more affordable living, particularly for the less affluent.
Fanis Grammenos heads Urban Pattern Associates (UPA), a planning consultancy. UPA researches and promotes sustainable planning practices including the implementation of the Fused Grid, a new urban network model. He is a regular columnist for the Canadian Home Builder magazine, and author of Remaking the City Street Grid: A model for urban and suburban development. Reach him at fanis.grammenos at gmail.com.
Flickr photo by Nick Kenrick: The Neighbourhood of East Van