Quantcast
Channel: Newgeography.com - Economic, demographic, and political commentary about places
Viewing all 4176 articles
Browse latest View live

Affordable Housing in Suburbia

$
0
0

Like many older suburbs in high priced regions, Long Island faces two great crises: a loss of younger residents and a lack of affordable housing for the local workforce, including those employed as nurses, teachers and other professionals.

Often, proposed developments on Long Island are tailored to be geared towards “luxury” or are age-restricted for residents 55 or older. These proposals serve to almost completely ignore the middle class or the region’s young professionals. While the depth of the "Brain Drain", or flight of the young from Nassau and Suffolk Counties is debatable, the fact remains that housing stock for the area’s younger families is woefully deficient. Thanks to limited job opportunities and affordable housing, Long Island isn’t the attractive bedroom to Manhattan that it once was.  

Long Island’s housing woes have been in the public eye for the last few months and it’s critical for residents and policymakers alike to understand the issues. The Town of Huntington recently issued a press release announcing that applications are being accepted for 43 affordable rental apartments that are part of the 379-unit Avalon at Huntington Station development. The rents range from $932 a month for a one-bedroom to $1,148 for a two-bedroom to $1,646 for a three-bedroom.

“Affordable” vs. “Attainable”

For once, the rents being billed as “affordable” seem aligned with the term. Hypothetically, a Young Islander making $45,000 and renting the single-bedroom option would pay roughly 24.8 percent of his or her salary toward housing, far less than the 35 percent threshold that is considered by the Long Island Index as a “high housing cost burden.”

Compare these rents to the “attainable” 300- to 400-square-foot micro-unit options that were presented by a group recently, which, when rented at $1,400 a month, would account for about 37 percent of someone’s $45,000 salary (both examples are calculated without utilities, Internet, cable, etc.).

The Avalon project contains a total of 303 rentals and 76 for-sale townhouses. Forty-three apartments and 11 townhouses will be affordable, while the remaining 260 apartments and 65 townhouses will be market-rate. The project site is a 26.6-acre parcel roughly half a mile from the Huntington Long Island Rail Road station.

A drop in the bucket

The Avalon Huntington Station project has rents that seem affordable, but the total amount of units are a drop in the larger bucket when it comes to addressing the Long Island’s greater affordable housing need of 41,429 units. After Avalon is constructed, there will be 41,375 units to go. Is that progress?

Compare both projects: The microunit approach is “attainable” at $1,400 a month, while Avalon is “affordable” at $932-$1,646 a month. Both terms lack the standardization and definite boundaries necessary to legitimize them in the minds of the public. Is attainable really worth $500 more than the term affordable? Where does “workforce” fall into this ever-sliding scale?

Our patchwork approach to affordable housing needs to change. For every press release issued touting two affordable units here or 11 workforce homes shoehorned there, the elephant in the room is tackling the monumental demand in the face of our paltry, undefined supply.

Some big questions

The issue of overall demand is a very big question that our region has faced for the last 50 years and will continue to face in the immediate future. What Long Islanders must move toward is first quantifying the issue. How many truly affordable units do we have? How many can we reasonably build? What is the true market demand for housing in Nassau and Suffolk counties? Are municipalities able to successfully increase density while preserving land elsewhere?

Countless times, important planning terms like “sustainable,” “smart growth,” “walkable,” “green” and now “affordable” and “attainable” are cheapened by misuse. These terms once represented important and innovative planning techniques that were once progressive tools in crafting a better community. When the terms are misused by stakeholders and industry insiders the result is a volatile cocktail of higher density suburban sprawl and poor urban design that further leads to suburban blight, and the public’s broken faith in the system.

A democracy gets the policy it deserves. Currently, Long Islanders are disengaged with the land-use process, and have allowed it to become dominated by biased stakeholders who have much to gain by allowing those important terms to become shallow. It’s easy to sell a project as “green” or “smart” when few, if any, people know what the term means.

The beauty of it all is that a democracy also can create the policy it needs. This is why it’s so important to take the time to give these critical issues the attention they deserve, and work towards a better Long Island.

Why do we issue press releases celebrating the creation of 54 affordable units, or 0.13 percent of our regional need? It is because, at this point, not much else is or can be done to tackle this massive problem until we fully understand it.

Richard Murdocco is a digital marketing analyst for Teachers Federal Credit Union, although the views expressed in this post are Murdocco’s alone and not shared by TFCU. Follow him on Twitter @TheFoggiestIdea, visit thefoggiestidea.org or email him at Rich@TheFoggiestIdea.org.

Photo from Avalon Communities

Manufacturing, Exports, and the R&D X-Factor

$
0
0

A recent visit by President Obama to an Ohio steel mill underscored his promise to create 1 million manufacturing jobs. On the same day, Commerce Secretary Penny Pritzker announced her department’s commitment to exports, saying “Trade must become a bigger part of the DNA of our economy.”

These two impulses — to reinvigorate manufacturing and to emphasize exports — are, or should be, joined at the hip. The U.S. needs an export strategy led by research and development, and it needs it now. A serious federal commitment to R&D would help arrest the long-term decline in manufacturing, and return America to its preeminent and competitive positions in high tech. At the same time, increasing sales of these once-key exports abroad would improve our also-declining balance of trade.

It’s the best shot the U.S. has to energize its weak economic recovery. R&D investment in products sold in foreign markets would yield a greater contribution to economic growth than any other feasible approach today. It would raise GDP, lower unemployment, and rehabilitate production operations in ways that would reverberate worldwide.

The Obama administration is proud of the 2012 increase of 4.4 percent in overall exports over 2011. But that rise hasn’t provided a major jolt to employment and growth rates, because our net exports — that is, exports minus imports — are languishing. Significantly, the U.S. is losing ground in the job-rich arena of exported manufactured goods with high-technology content. Once the world leader, we’ve now been surpassed by Germany.

America’s economic health won’t be strong while its trade deficit stands close to a problematically high 3 percent of GDP (and widening). Up until the Reagan administration, we ran trade surpluses. Then, manufacturing and net exports began to shrink almost in tandem.

Our past performance proves that we have plenty of room to grow crucial manufacturing exports, and even eliminate the trade gap. The rehabilitation should begin with a national commitment to basic research, which in turn boosts private sector technology investment. The resulting rise in GDP would be an important counterbalance to a slightly higher federal deficit.

Just-completed Levy Economics Institute simulations measured how a change in the target of government spending could influence its effectiveness. The best outcomes came about when funds were used to stoke innovation specifically in those export-oriented industries that might yield new products or cost-saving production techniques. When a relatively small stimulus was directed towards, for example, R&D at high tech manufacturing exporters, its effects multiplied. The gains were even better than the projections for a lift to badly needed infrastructure, which was also considered.

Economists haven’t yet pinpointed a percentage figure that reflects the added value of R&D, but there’s a strong consensus that it is significant. Despite the riskiness of each research-inspired experiment, R&D overall has proven to be a safe bet. Government-supported research tends to be pure rather than applied, but, even so, when aimed to complement manufacturing advances, small doses have a good track record.

Recognition that R&D outlays bring quantifiable returns partly explains why the federal National Income and Product Accounts have recently been altered to conform with international standards. NIPA will now treat R&D spending as a form of fixed investment. This will be a powerful tool to help reliably gauge its aftermath.

Private sector-based innovation has also proved to be far more likely to occur when it is catalyzed by a high level of public finance. (For amazing examples, check out this just-released Science Coalition report.) Contractors spend more once government has kicked in; productivity rises and prices drop.

The prospect of a worldwide positive-sum game is far more realistic than the “currency wars” dynamic so often raised by the media. Overseas buyers experience lower prices and the advantages of novel products. Domestic consumers, meanwhile, enjoy higher incomes and more employment, with some of the earnings spent on imports.

An export-oriented approach faces multiple barriers. Anemic economies across the globe could spell insufficient demand. Another challenge lies in the small absolute size of the America's export sector.

But the range of strategic policy options for the U.S. is limited. A rapid increase in research-based exports is the only way we see to simultaneously comply with today’s politically imposed budget restrictions and still promote strong job and GDP growth.

Instead of stimulating tech-dependent producers, though, we’ve been allowing manufacturing to stagnate and competitiveness to erode. Public R&D spending as a percentage of GDP has dropped, and is scheduled for drastic cuts under the sequester.

Sticking with the current plan means being caught up in weak growth and low employment for years. Jobs are being created at a snail’s pace, with falling unemployment rates largely a reflection of a shrinking workforce.

For our R&D/export model, we posited a modest infusion of $160 billion per year — about 1 percent of GDP — until 2016. We saw unemployment fall to less than 5 percent by 2016, compared with CBO forecasts that unemployment will remain over 7 percent. Real GDP growth — instead of hovering around 3.5 percent, by CBO estimates, on the current path — gradually rose to near 5.5 percent by the end of the period.

We need this boost. It’s urgent that we bring down joblessness and grow the economy. A change in fiscal policy biased towards R&D shows real promise as a viable way to help rescue the recovery.

Dimitri Papadimitriou is president of the Levy Economics Institute of Bard College, a professor at Bard, and a widely published economist. His policy positions include a past vice-chairmanship of the Trade Deficit Review Commission of the U.S. Congress. This article originally appeared under the title "The U.S. Economy Needs an Exports-Led Boost," at Reuters.Com.

Photo by Lawrence Jackson: President Obama at the ArcelorMittal Steel factory in Cleveland, Ohio; November 2013.

China Failing its Families

$
0
0

China's recent decision to reverse – at least in part – its policy limiting most couples to one child marks a watershed in thinking about demographics. Yet, this reversal of the 30-year policy may prove unavailing due to reasons – notably dense urbanization and high property prices – that work against people having more children.

China already faces a demographic crisis unprecedented for a still-poor country. By 2050, China will have 60 million fewer people under 15 years of age, while the over-65 population grows by 190 million, approximately the population of Pakistan, the world's sixth-most populous country. The U.S. Census Bureau estimates that China's population will peak in 2026, and then will age faster than any country besides Japan; most of the world's decline in children and workers ages 15-19 over the next two decades will take place in China.

The shift in family-size policy acknowledges these looming demographic changes but may not be sufficient to address them. After all, similar problems have cropped up in other Asian countries, including such successful nations as Japan, Singapore, Taiwan and South Korea. All face tremendous fiscal crises from the prospect of a diminishing workforce insufficient to support swelling numbers of seniors. This “burden of support” crisis applies even in rich, thrifty countries like Singapore or Japan, but is potentially far more destabilizing in much poorer China.

Perhaps the biggest force undermining both marriage and family – the core institutions of all Confucian societies – can be traced, at least in part, to changes in attitudes associated with urban life. Gavin Jones, a demographer at the National University of Singapore, estimates that up to a quarter of all East Asian women, following the example of women in Japan, will remain single by age 50, and up to a third will remain childless.

“People's lifestyles are more important, and their personal networks mean more than family,” notes Japanese sociologist Mika Toyota. “It's now a choice. You can be single, self-satisfied and well. So why have kids? It's better to go on great holidays, eat good food and have your hobbies. A family is no longer the key to the city life.”

Urbanization threat

Nowhere are these effects more profound, or important, as in China, where 270 million migrants, mostly from the countryside, have moved to the cities – nearly as many people as lived in the United States a decade ago. But once they arrive, many newcomers often live in poor, crowded conditions, that, along with lacking access to schooling, discourage child-rearing.

The detrimental impact of dense urbanization on family formation is not limited to China, but is especially prevalent in East Asia, where Gavin Jones, Paulin Tay Straughan and Angelique Chan of the National University of Singapore report that “a housing and urban environment unfriendly to children” was a chief reason for women's reluctance to have children (or more children).

As China has urbanized, its fertility rate – the average number of births for each woman of childbearing age – has fallen to 1.55, considerably below the 2.1 “replacement rate” required to maintain the population level. But in the rest of East Asia, fertility rates are even lower. For example, Singapore's fertility rate is 0.79, Taiwan's is 1.11, and South Korea's is 1.24 – even without one-child policies. Moreover, China's fertility rate is elevated because of its higher share of rural population and can be expected to fall as rapid urbanization continues. The depressed urban fertility rates are epitomized by Beijing, at less than 1, and Shanghai, 0.70.

Reforming the one-child policy alone won't much change this reality. A host of pro-natalist policies in countries, including Japan and Singapore, have failed to boost birthrates. China-controlled Hong Kong, which now suffers one of the lowest fertility rates on the planet, was never subject to the one-child policy and has tried to encourage procreation, raising tax breaks to $100,000 per child. Yet these steps hardly off-set the high costs of raising childrenin this dense, bustling and expensive city. A recent Hang Seng Bank study estimates the cost of raising a child in Hong Kong at $515,000 U.S. dollars.

Most damaging, East Asian cities have adopted an urban form almost guaranteed to suppress fertility. Most are usually dominated by skyscraping tower residential blocks and lower-rise residential buildings in which most units have no direct ground access. A 20th-floor balcony is not a substitute for a private yard to play in. Even in Western countries, where cities are usually less-dense, fertility rates are far lower in the urban cores than in the suburbs. Similarly, the birthrates in the urban core of Tokyo are well below those in the suburbs, where yards, though small by Western standards, often are available.

Then there is the problem of affordability. Housing units in the tall residential blocks cost much more to build than ground-oriented dwellings. High costs, particularly for housing, are one reason nearly two in five Chinese, according to Weibo Sina, the country's top social media site, feel the law change will not encourage them to consider having more children.

Child-friendly zones?

The Chinese government could take steps making it easier for people to have children. One would be to drive growth to less-expensive areas in the country's vast interior. New government policy reforms have reinforced the commitment for development outside the East Coast, to the center, West and Northeast. Already, interior cities have been made more competitive for manufacturing by connection to the world's longest interstate-type highway system, as well as the highest-volume trucking and freight rail systems.

Spreading out development may help, but only if the form of the new housing shifts to a more family-friendly pattern. Building high-density areas, even in second-tier cities – a major source of wealth for local governments as well as developers – essentially exports Shanghai's child-unfriendly environment to the interior. Instead, a new housing policy that stresses lower densities, more space and greater affordability is a prerequisite for encouraging new families.

The solution could draw on some of China's own marked policy successes. Under Deng Xiaoping, China established special economic zones, such as Shenzhen, to test liberal economic policies. Shenzhen's reforms spread around China and have, literally, transformed the country . More recently, China embarked on a similar program to test financial liberalization, with the establishment of its first financial-services trade zone in Shanghai, and a recent announcement indicates that there will be more.

These innovative policies could be adapted to address China's demographic crisis. It could take the form of a few “special child-friendly zones,” established around midsize and large cities. These zones would allow for development of ground-oriented dwellings with yards and could include housing from single-family detached to multistory townhomes. New residents and existing residents could move to these dwellings, attracted by the improved environment for raising the second child.

For its pilot program, the government could designate suburbs of Chongqing, an interior municipality directly governed from Beijing, as special child-friendly zones. Other interior cities such as Zhengzhou (Henan), Changsha (Hunan), or Xi'an (Shaanxi) could also accommodate similarly designated areas. In the West, including the United States and Northern Europe, birth rates are considerably higher – sometimes by as much as 50 percent – in the suburban periphery than in the city core.

Some in the West may denounce this as a plan for sprawl, but these more humane, ground-oriented residences would not require substantial additional land. Well-designed neighborhoods of single-family houses on small lots and townhouses can be built at high densities. Further, these residential units are usually less-costly. In the United States, high-rise residential construction can cost more than double per square foot as ground-oriented housing.

After initial success, child-friendly zones could be extended to other cities, just as the successful Shenzhen economic reforms gradually swept the nation. Of course, such an approach violates current Western doctrine on urban planning, which is obsessively focused on encouraging people to live in ever-higher densities. Yet these doctrines turn out to be expensive and unwise, and undermine the prospects for families. Reforming the one-child policy is a good first step, but China's best chance to solve its demographic problem lies in developing policies that put families and children first.

This story originally appeared at The Orange County Register.

Joel Kotkin is executive editor of NewGeography.com and Distinguished Presidential Fellow in Urban Futures at Chapman University, and a member of the editorial board of the Orange County Register. He is author of The City: A Global History and The Next Hundred Million: America in 2050. His most recent study, The Rise of Postfamilialism, has been widely discussed and distributed internationally. He lives in Los Angeles, CA.

Wendell Cox is a Visiting Professor, Conservatoire National des Arts et Metiers, Paris and the author of “War on the Dream: How Anti-Sprawl Policy Threatens the Quality of Life.

Photo: Steve Webel

The Geography Of Aging: Why Millennials Are Headed To The Suburbs

$
0
0

One supposed trend, much celebrated in the media, is that younger people are moving back to the city, and plan to stay there for the rest of their lives. Retirees are reportedly following suit.

Urban theorists such as Peter Katz have maintained that millennials (the generation born after 1983) show little interest in “returning to the cul-de-sacs of their teenage years.” Manhattanite Leigh Gallagher, author of the dismally predictable book The Death of Suburbs, asserts with certitude that “millennials hate the suburbs” and prefer more eco-friendly, singleton-dominated urban environments.

Green activists hope this parting of the ways between the new generation and the preferences of their parents will prove permanent. The environmental magazine Grist even envisions “a hero generation” that will escape the material trap of suburban living and work that engulfed their parents.

Less idealistic types, notably on Wall Street, see profit in this new order, hoping to capitalize on what Morgan Stanley’s Oliver Chang dubs a “rentership society”; in this scenario millennials remain serfs paying rent permanently to the investor class.

But a close look at migration data reveals that the reality is much more complex. The millennial “flight” from suburbia has not only been vastly overexaggerated, it fails to deal with what may best be seen as differences in preferences correlated with life stages.

We can tell this because we can follow the first group of millennials who are now entering their 30s, and it turns out that they are beginning, like preceding generations, to move to the suburbs.

We asked demographer Wendell Cox to crunch the latest demographic data for us to determine where people have moved by age cohort from 2007 to 2012. The data reveals the obvious: People do not maintain the same preferences all their lives; their needs change as they get older, have children and, finally, retire. Each stage leads them toward somewhat different geographies.

As it turns out, the vast majority of young people in their late teens and 20s – over 80 percent — live outside core cities. Roughly 38 percent of young Americans live in suburban areas, while another 45 percent live outside the largest metropolitan areas, mostly in smaller metro areas.

To be sure, core urban areas do attract the young more than other age cohorts. Among people aged 15 to 29 in 2007, there is a clear movement to the core cities five years later in 2012 — roughly a net gain of 2 million. However, that’s only 3 percent of the more than 60 million people in this age group.

Surprisingly, most of this movement to the urban centers comes not from suburbs, but from outside the largest metro areas, reflecting the movement of people from areas with perhaps lower economic opportunity. It also is likely reflective of the intrinsic appeal of metro areas to younger, single people, as well as the presence of many major universities and colleges in older “legacy cities.”

Here’s how the geography of aging works. People are most likely to move to the core cities in their early 20s, but this migration peters out as people enter the end of that often tumultuous decade. By their 30s, they move increasingly to the suburbs, as well as outside the major metropolitan areas (the 52 metropolitan areas with a population over 1,000,000 in 2010).

This pattern breaks with the conventional wisdom but dovetails with research conducted by Frank Magid and Associates that finds that millennials prefer suburbs long-term as “their ideal place to live” by a margin of 2 to 1 over cities.

Based on past patterns, by the time people enter their 50s, the entire gain to the core cities that builds up in the 20s all but dissipates, as more people move to suburbs and to outside the largest metropolitan areas.

Similarly millennials have not, as some hope, given up on home ownership, something closely associated with suburbia. Magid’s surveys of older, married millennials found their desire to own a home was actually stronger than in previous generations. Another survey by the online banking company TD Bank found that 84 percent of renters aged 18 to 34 intend to purchase a home in the future, while another, by Better Homes and Gardens, found that three in four identified homeownership as “a key indicator of success.”

These attitudes, particularly among the older edge of the millennials, is particularly critical, as these are the first of this largest generation in American history to enter full adulthood. Indeed the peak of the millennial generation is already in their mid-20s, and by the end of the decade, the vast majority of the roughly 42 million millennials will be entering their 30s, with some approaching their 40s. This group of mature millennials (adding in the 20-24 cohort) is expected to expand by 22.5 million in the next 10 years. They are likely to prove wrong the argument that, with boomers entering their sunset years, there will be no one to buy their houses.

In contrast, the next wave of young people — now under 10 — will be about 1.7 million less numerous. These “plurals” are likely to stay in the suburbs for the next five to 10 years, and some wil start moving into core cities as they enter their 20s, but in decidedly fewer numbers.

Perhaps the most salient fact driving these migratory patterns is family formation. Our analyses of cities around the world have shown definitively that people with children tend to avoid urban cores, even in the most gentrified environments. Manhattan, Washington, D.C., San Francisco and Seattle tend to have the lowest numbers of children per capita.

These trends can be seen on a nationwide basis. Among the cohort of children under 10 in 2007, the number who lived in core cities as of 2012, when they were 5 to 14 years of age, was down by 550,000. Families are the group most likely to move either to the suburbs or smaller towns. This movement, plus the high degree of childlessness in large urban cores, suggests that many of those who are leaving the core cities in their early 30s are parents with young children.

And what about the older cohorts, notably the baby boomers, who, along with millennials, dominate the nation’s demography? The shift out to the suburbs and to outside the larger metropolitan areas does not stop with the child-bearing years but gains more traction with age, peaking in the early 60s. At this stage, only half as many seniors, on a percentage basis, live in core cities compared to people in their early 20s. Overall, the core cities are home to approximately 15% of the U.S. population, but that falls to under 12% of the population in the 64- to 79-year-old demographic.

This is not to say that most older people leave the suburbs. Almost 40 percent of seniors remain in suburban areas. Nevertheless there is some movement among the senior population, and among aging boomers, not “back to the city” as common alleged but actually towards the non-metropolitan areas, where costs are often lower and the pace of life slower. Among those now in their 60s, nearly half live outside the major metropolitan areas, four times as many as live in the urban core.

What do these finding suggest about the geography of aging? First, it makes clear that many people’s preferences change as they age: In aggregate there is a slight tendency toward core cities in the late teens and 20s, and then, to suburbs and outside the major metropolitan after that. Second, it seems clear that older Americans leave core cities all the way to their 70s rather than cluster there, as is often maintained in the media.

The demographic picture that emerges is complex, but suggests the best way for metropolitan areas to “lure” people — and companies — may be to encourage a wide range of housing lifestyles, ranging from inner city to suburban and exurban/rural. The urban pundit class may never change their preferences or abandon their claims of a secular “back to the city” trend, but in aggregate, people, it appears, do tend to change preferences as they age, something rarely acknowledged but certain to shape our geography for decades to come.

This story originally appeared at The Orange County Register.

Joel Kotkin is executive editor of NewGeography.com and Distinguished Presidential Fellow in Urban Futures at Chapman University, and a member of the editorial board of the Orange County Register. He is author of The City: A Global History and The Next Hundred Million: America in 2050. His most recent study, The Rise of Postfamilialism, has been widely discussed and distributed internationally. He lives in Los Angeles, CA.

The Private Business of Public Art

$
0
0

Like many cities coming out of the downturn, Orlando is jonesing for a recovery. To promote a sense of new prosperity, City Hall leaders recently added eight works of art to its downtown core, amidst much fanfare. Before we start whistling “Happy Days Are Here Again,” however, we would do well to examine the circumstances of this renewed interest in public art. Its surprising return was trumpeted as a new way to enrich the city and benefit its residents; many, including this author, applauded the effort. This has certainly happened. But has the result been a barrier, as much as a connection, to its citizenry?

Public art, always controversial, became a battleground in the sixties and seventies, with cries of “waste of taxpayer money” heard in cities across the land. Artists, always exploring new frontiers, were victims of decency committees and moralizing mayors when their visions strayed much beyond a famous figure astride a horse. Public art placed politicians in yet one more hot seat they didn’t especially need. Yet these programs brought us great beauty, as well. Anish Kapoor’s Cloud Gate in Chicago’s Millennium Park, and Maya Lin’s Vietnam War Memorial in Washington, DC, for example, have proved to be enduring. In the right hands, art creates wondrous public space. Battlegrounds, yes; but many battles are worth fighting.

Private sponsorship, too, has had a place in the city: corporations, and sometimes even individuals, have commissioned works for their prominent institutions. While the state usually plays it safe with taxpayer money, the private commission was a place where an artist could dare. Good cities have a combination of both. Here in Orlando, the combination was alive and well, until spending on art ceased sometime early in the downturn.

Public investment in art is suddenly in vogue, and while City Hall takes the kudos for the $1.5 million that has been spent in Orlando, a careful reading of the script shows that no taxpayer money was actually used. Private donors commissioned the art; City Hall merely placed it, mostly on public property. The public/ private partnership seems to have resulted in a collaboration, and a sense of unity between the corporate world, high net worth individuals, and the state, with the public getting the spillover effect of some new art to view.

All seems to be great, suddenly, in our newfound prosperous era. The state and its richest citizens so often are adversaries who struggle over tax policy, and find little common ground over something as uneconomical as art. But out of nowhere, a collegial atmosphere has sprung forth, with participants rallying around ethereal values such as aesthetics and an inspiring sidewalk. Private interests and public officials are now holding hands round their new treasures, exhorting the public to share in this festival of new art. We seem to be awash in original works of great creative import, thanks to our visionary politicians and our benevolent corporate chieftains.

And now, a closer look. Of the eight pieces chosen by a jury that reviewed many entries, nearly all are modifications of public art pieces installed elsewhere. Kentucky-based artist Meg White’s “Muse of Discovery” is very similar to her “Awaking Muse” in Schaumburg, Illinois, for example, and others follow suit. There is nothing wrong with this, and the works are all quite good. Yet taken together, the multiple pieces speak of safety and security. Sure-fire crowd pleasers similar to those that already adorn malls and parks in other cities were chosen here. Orlando, where the current t-shirt slogan sadly seems to be Orlando Doesn’t Suck, did not merit much originality , judging by the artworks chosen by a volunteer jury.

Public art programs were born in an era when public works brought us bland, uninspiring buildings and infrastructure, and the intent was to force cities to inject some originality and creativity into government projects. Today, the municipal art budget has been turned over to private donors, and City Hall has successfully escaped its obligation to pay its percent – a parsimonious proportion to begin with – and zeroed out its budget for creativity and originality. Other people’s art and other people’s money are cleverly passed off as an enhancement to the city’s public realm, with politicians taking credit for this coup.

Orlando's current public art situation is emblematic of our new era of the blurred lines between public and private interests. Pre-recession, a few individuals and a few corporations placed art of their own choosing in the public realm as an expression of taste. Today, they are reticent to do so, except through a complicated nonprofit agency. Are our high net worth individuals and our corporate citizens so afraid of their capitalist peers that they can no longer put public art on their own property at their own discretion, without being accused of soft-hearted sentimentality and a lack of interest in profit?

And are politicians so battle-scarred that they no longer wish to suggest that the taxpayer deserves to have his or her money spent on art? The original motive to elevate the public realm and visibly set a level of taste and sophistication is no longer sufficient for state-sponsored art. Neither does this new private sponsorship seem to rely much on site-specific commissions, preferring to adapt art that has been focus-group tested elsewhere, like any good consumer product.

Studies that correlate a rich public realm with cities that are chosen for corporate relocations seem to justify the move into art by Orlando, a city desperate for more jobs. So, in the end, it is about money after all. In Florida, home to Art Basel Miami, we may be experiencing an arms race of sorts, as cities compete for the hip and the cool on an absurd stage to win over the creative class. This should be no surprise to anyone who is involved in the arts, a group that has become increasingly cynical about diminished funding from public and private donors alike. Artists, of course, lose out; as craftsmen who labor for the sake of attracting more jobs to the region, they have less and less impact on the city’s public face.

The result is a public/private partnership that is carefully orchestrated to eliminate controversy, squelch accusations of taxpayer waste, and to provide a safe and secure support group for those rare capitalists who are still soft-hearted enough to care about arts funding. These motives insulate the city from its people, damping down all but a sure-fire applause reaction. In this twilight of public art, the face of the city is painted in a perfunctory way to please everyone yet no one, leaving a hollow and unsatisfying result. Of the new pieces selected by a committee, only Jacob Harmeling of Orlando created an original work, “The Cedar of Lebanon". Artists who come anywhere from Zurich to Oregon have installed other magnificent pieces, and even if they reference other art, these beautiful works can be considered in a new context. Central Florida, home to the great pool of creative talent, including many who service world-class theme parks, will appreciate the gesture regardless of the mechanics behind it.

This new era, like other times, will ultimately be judged by the quality of the stuff that it leaves behind. Timeless art that says something specific and intense will ultimately contribute to Orlando’s place in the future of the city as a global entity. Let’s hope the new artwork is respected and honored, that it takes on its own sense of place, and that it revives a conversation about what our cities mean to us.

Richard Reep is an architect and artist who lives in Winter Park, Florida. His practice has centered around hospitality-driven mixed use, and he has contributed in various capacities to urban mixed-use projects, both nationally and internationally, for the last 25 years.

Photo by Richard Reep: "Cedar of Lebanon" by Jacob Harmeling

Rural Character in America’s Metropolitan Areas

$
0
0

Looking at a map of the metropolitan areas of the United States, it would be easy to get the impression that “urban sprawl” had consumed most of the nation. Indeed, as Figure 1 indicates, one could drive from Santa Rosa, north of San Francisco to the Arizona-New Mexico border without ever leaving a metropolitan area. This more than 1,000 mile trip (1,600 kilometers) would take nearly 15 hours, according to Google Maps. New Jersey is shown as all-metropolitan, as well as Delaware. But looks can be deceiving. According to US Census data from 2010, the land area of New Jersey is 60 percent rural, while Delaware is 80 percent rural.

Given the multiple terms used to describe urban and rural geography, confusion is not uncommon. It begins with the fundamental matter of terms. For starters, “metropolitan” is not the same thing as “urban,” and “rural” does not mean non-metropolitan. In fact, most rural residents in the United States live in metropolitan areas. 

Urban Areas

All land within the United States is either urban or rural, without respect to whether it is in metropolitan areas. The Census Bureau defines urban areas using “census blocks” to which minimum population density criteria are applied. Census blocks are very small neighborhood units, which are far smaller than virtually all municipalities. This approach produces an urban area defined by land use characteristics, without regard to jurisdictional (city or county) boundaries. Urban areas contain no rural land.

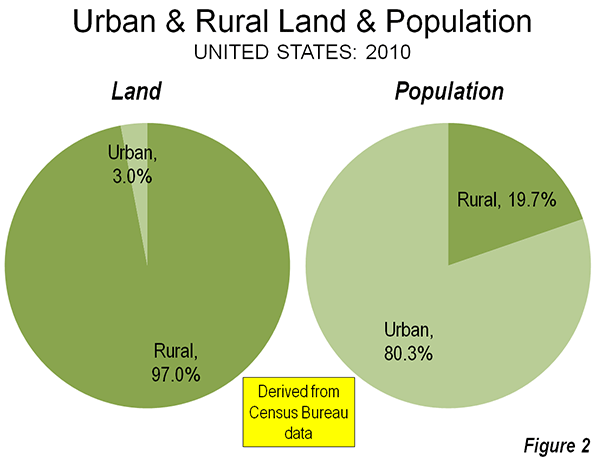
In 2010, 19.3 percent of the US population was in rural areas, which covered 97.0 percent of all land. The other 80.7 percent of the population was urban and lived in only 3.0 percent of land area (Figure 2)

Rural Population of Metropolitan Areas

Metropolitan areas always have large areas of rural land. This is due to the very nature of metropolitan areas, which are designated by the US Office of Management and Budget (OMB). Metropolitan areas are labor markets, defined by commuting patterns. People commute to jobs in metropolitan areas both from within the core urban area (such as the New York urban area) and from areas outside the core urban area that remain in the metropolitan area, such as the non-urban parts of the New York metropolitan area (examples are much of Orange and Dutchess counties in New York as well as Sussex and Hunterdon counties in New Jersey).  

Each metropolitan area is organized around “central counties” that include a core urban area (area of continuous urban development). The core urban area must have at least 50,000 residents for an area to qualify as metropolitan. “Outlying counties” are also included in metropolitan areas if 25 percent or more of their resident workers commute to the central counties. This central counties and core urban area approach reflects the evolution of US metropolitan areas to the more dispersed employment and residential patters that have materially reduced the influence of the historical core municipalities (sometimes called “central cities”). On average, only about 10 percent of employment in the 50 largest urban areas was in the formerly more dominant downtowns in 2000 (central business districts).

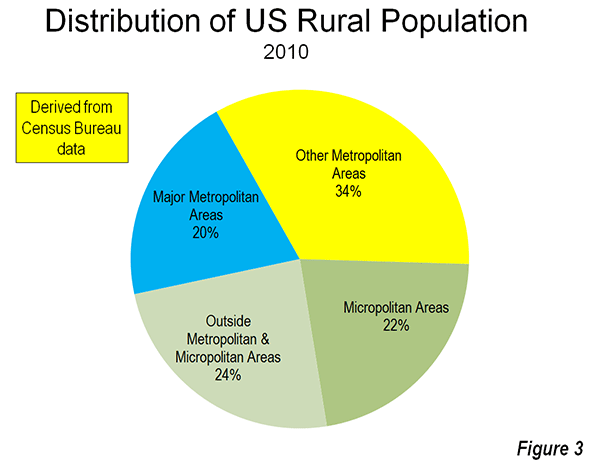
The land area in America’s metropolitan areas is much more rural than urban. More than 90 percent of metropolitan area land is rural. In 2010, 28 percent of the nation’s land area was metropolitan, but the urbanization in metropolitan areas accounted for only 2.6 percent of US land area. In 2010, 32 million of the nation’s 60 million rural residents lived in metropolitan areas (Figure 3).

Major Metropolitan Areas

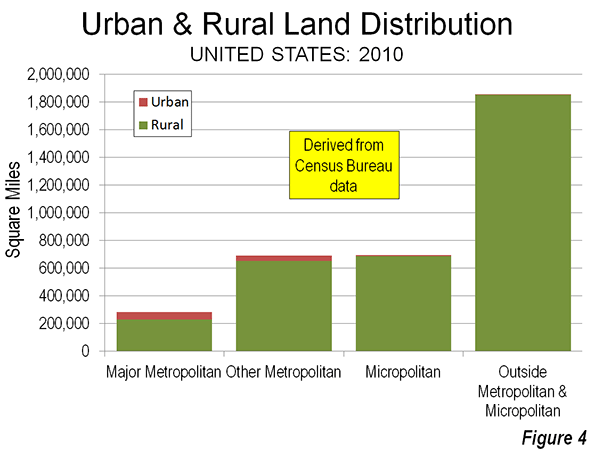
On average, 81 percent of the land area in major metropolitan areas (0ver 1,000,000 population) is rural, not urban (Figure 4). There is a wide variation among the major metropolitan areas. All but one of the major metropolitan areas has more rural land than urban land. Boston has smallest rural land area share at 43 percent. The New York metropolitan area clocks in at 52 percent rural, Philadelphia at 54 percent rural and Tampa-St. Petersburg stands at 55 percent rural. At the other end of the scale, the Salt Lake City metropolitan area is 96 percent rural, followed by Riverside-San Bernardino at 95 percent, Las Vegas 94 percent and Denver 92 percent (Table).


Table
Rural Population & Land Area in Metropolitan Areas
 2010 Rural Population2010 Rural Land Area# of Counties
Atlanta, GA11.1%67.4%29
Austin, TX12.8%85.6%5
Baltimore, MD9.0%64.8%7
Birmingham, AL28.8%88.7%7
Boston, MA-NH5.5%42.6%7
Buffalo, NY11.9%73.0%2
Charlotte, NC-SC18.5%75.8%10
Chicago, IL-IN-WI2.6%61.9%14
Cincinnati, OH-KY-IN14.1%78.2%15
Cleveland, OH8.1%58.7%5
Columbus, OH16.5%86.9%10
Dallas-Fort Worth, TX7.4%76.1%13
Denver, CO5.7%91.8%10
Detroit,  MI6.8%60.0%6
Grand Rapids, MI25.0%85.4%4
Hartford, CT12.2%56.8%3
Houston, TX6.5%75.5%9
Indianapolis. IN12.4%81.2%11
Jacksonville, FL11.2%80.1%5
Kansas City, MO-KS12.3%88.9%14
Las Vegas, NV1.3%94.4%1
Los Angeles, CA0.5%59.8%2
Louisville, KY-IN17.1%85.8%12
Memphis, TN-MS-AR15.3%89.0%9
Miami, FL0.4%75.2%3
Milwaukee,WI6.6%59.2%4
Minneapolis-St. Paul, MN-WI12.4%84.4%16
Nashville, TN24.1%87.6%14
New Orleans. LA7.2%87.3%8
New York, NY-NJ-PA2.7%52.4%25
Oklahoma City, OK18.3%91.0%7
Orlando, FL5.4%74.4%4
Philadelphia, PA-NJ-DE-MD5.1%53.7%11
Phoenix, AZ4.1%91.0%2
Pittsburgh, PA17.8%80.1%7
Portland, OR-WA9.9%91.1%7
Providence, RI-MA9.5%56.9%6
Raleigh, NC17.2%73.1%3
Richmond, VA20.3%89.1%17
Riverside-San Bernardino, CA4.7%95.1%2
Rochester, NY21.9%87.8%6
Sacramento, CA7.2%88.3%4
St. Louis,, MO-IL13.2%86.0%15
Salt Lake City, UT1.8%96.1%2
San Antonio, TX13.8%91.0%8
San Diego, CA3.3%81.9%1
San Francisco-Oakland, CA1.0%65.8%5
San Jose, CA1.8%87.2%2
Seattle, WA5.6%81.0%3
Tampa-St. Petersburg, FL4.4%55.5%4
Virginia Beach-Norfolk, VA-NC8.7%78.2%16
Washington, DC-VA-MD-WV7.8%73.1%24
Major Metropolitan Areas7.1%81.0%436


The most important reason for the difference in rural area size within the major metropolitan areas is the differing sizes of counties. In the East, Midwest and South, counties tend to be much smaller than in the West. For example, the New York metropolitan area has nearly 20 million residents, distributed among 25 counties. In contrast, the Los Angeles metropolitan area, with 13 million residents, is composed of only two counties.

The metropolitan areas with the most rural area are largely desert and mountains (see top illustration of the Riverside-San Bernardino metropolitan area). Large counties in Utah extend the Salt Lake City metropolitan area 100 miles westward to the Nevada border. Riverside-San Bernardino’s two large counties include a land area nearly equal to that of Ireland, stretching more than 200 miles to the Nevada and Arizona borders and including part of Death Valley National Park. In both cases (and a number of others), large counties require metropolitan areas to be far larger than any reasonable commuting shed. This size variation renders population density figures for metropolitan areas nonsensical (building blocks would need to be small, such as the census blocks used by the Census Bureau to define urban areas).

The major metropolitan areas of over 1 million contain nearly 12 million rural residents, or 20 percent of the nation’s rural population. While this is a large number, their urban populations are much greater, at 158 million, or 63 percent of the US urban population of nearly 250 million. These urban residents live in a smaller proportional area, constituting of only one-half of all urban land area (and 1.5 percent of all US land area).

Other Metropolitan Areas

The rural portions of metropolitan areas with fewer than 1,000,000 residents cover 94 percent of their land areas. These areas include approximately 20 million residents, or 34 percent of the nation’s rural population. Only six percent of the land area in these metropolitan areas is urban.

Outside Metropolitan Areas

This leaves a minority of 27.5 million rural residents living outside the metropolitan areas.

Micropolitan areas are defined by OMB as labor markets with core urban areas between 10,000 and 50,000, and are not considered metropolitan. Approximately 98.5 percent of the land in micropolitan areas is rural. The rural population of micropolitan areas is 13 million.

The other 14 million rural residents live outside the micropolitan areas. However, there are still 4.7 million urban residents outside both metropolitan and micropolitan areas, with each of these urban areas having fewer than 10,000 residents.

Rural Land in Metropolitan America

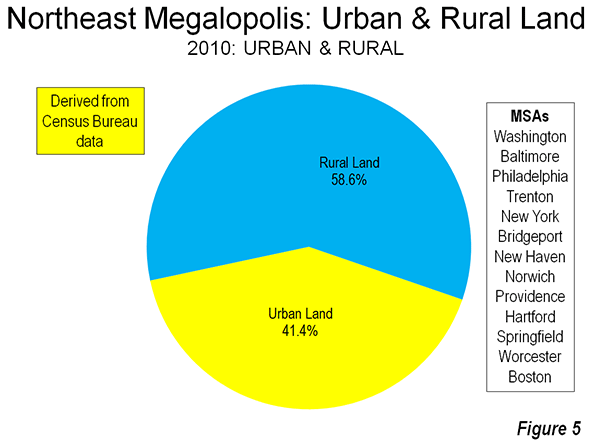
Even where America is most urban, a strong rural element remains. This is illustrated in the Northeast Corridor, the “megalopolis” defined by Jean Gottman more than a half-century ago. The urbanization he identified is still short of continuous along the corridor. Rural areas interfere with urbanization in parts of Maryland, New Jersey, Connecticut and Massachusetts. Nearly 60 percent of the land area in these adjacent metropolitan areas remains rural (Figure 5). The numbers are even smaller elsewhere. Between Dallas-Fort Worth and Houston, 80 percent of the corridor is rural. Between Seattle and Portland nearly 90 percent of the corridor is rural. These are among the busiest corridors in the United States, and many more are far more rural. Up close and in context, the spatial urbanization of America, including its metropolitan areas is not pervasive.

Wendell Cox is a Visiting Professor, Conservatoire National des Arts et Metiers, Paris and the author of “War on the Dream: How Anti-Sprawl Policy Threatens the Quality of Life.

Illustration: San Bernardino Mountains and Mojave Desert in the Riverside-San Bernardino metropolitan area (by author)

Suburban End Games

$
0
0

Are America’s suburbs facing end times? That’s what a host of recent authors would have you believe.  The declaration comes in variety of guises, from Alan Ehrenhalt’s The Great Inversion (2012), to “the peaking of sprawl” pronounced by urban planner  Christopher Leinberger to, most recently, to Leigh Gallagher’s The End of Suburbs(2013).  Suburbs and sprawl have joined the ranks of “history” and “nature” as fixtures of our lives that teeter on the verge of demise—if we’re to lend credence to this latest clamor from journalists, planners, and academics. 

When you declare the “ending” of a place where you acknowledge over half of Americans now live, just what does that mean?  One sure bet is that their demise won’t prove nearly as definitive or thorough-going as advertised. Looking around the Long Island neighborhood and town where I’ve lived for the last twenty years, I don’t see them vanishing any time soon. Moreover, from my own perspective as a long-time resident as well as historian of such places, the particulars grounding this narrative point to something very different: the rise of conditions, as yet only starting to be realized, for a new suburban progressivism. 

This media wave of talk about suburbs or sprawl “ending” mirrors an earlier one in the decades after World War II, which fleshed out a rise of “mass suburbia.” That earlier wave turned out to be well-nigh mythological in its selectivity, its choice of emphases and its silences.  Embellishing the idea of suburbs as more than just a place, as an entire, distinctive way of life, it built upon age-old notions of suburbs as simply the edges of cities, also a change commencing over two hundred years ago among cities in the industrial West.  Cities began to grow less through the spread of a discrete and distinct rim than via a widening transition zone between city and countryside.  But only after World War II did the idea of “suburbia” congeal into a solid stereotype: those subdivisions of lawns and single family homes occupied by a white middle class.    

Among the earliest discoverers was 1950s Fortune correspondent William Whyte, who found in the suburbs an entire generation of upwardly mobile, affluent, younger families, in search of the American dream.  Journalists concentrated mainly on places that fit this story line, the very largest and newest housing developments around the very largest of cities.   Early coverage celebrating these suburbs classless-ness was quickly followed by more critical accounts.  Commentators such as Whyte and Frederick L. Allen distinguished this “new suburbia” from an older one they preferred, quieter and smaller and more securely elitist.  Sociologists taking a more even-handed approach, such as Herbert Gans and Bennett Berger, also questioned the “myth” of these places’ classlessness, by highlighting more working class homeowners and communities.  The great majority of those moving into such places had also been white, and as the racial imagery of a white “donut” surrounding a black core consolidated with the urban and busing crises over the 1960s and 70s, an ambivalent imagery of postwar “suburbia” stuck.  At once affluent, middle class, and white, but also vaguely declassé, suburbs were self-satisfied and reactionary places that deserved the progressive city-dweller’s disdain. 

As current-day Fortune correspondent and professed “city girl” Leigh Gallagher, makes clear, such attitudes are alive and well, for instance, at cocktail parties where those hearing her book title offer “high fives and hurrahs.”   Today’s literature on suburbia’s end has the distinct ring of wish fulfillment for a long tradition of city-bound suburb-bashers, of a piece with their eagerness finally to declare downtowns “resurgent [as] centers of wealth and culture.”  But just as most characterizations of “suburbia” in the 1950s ignored the pockets of poverty and minority enclaves in its midst, so even the most balanced of today’s expositors of suburbs’ end can be quite selective.  For instance, even though the Charlotte metro area’s 42% growth between 2000 and 2013 came through a momentous build-out of subdivisions and malls, even though the city itself has eagerly annexed nearly 25% more suburban land since 2000, Ehrenhalt dwells solely upon its reconstruction of the downtown.  We hear nothing about how, even with its expanded limits, this city still contains only 31% of the population of this urban region.

While these authors do leaven their arguments with a lot more demographic yeast than their 1950s predecessors, they still leap to generalizations that, in an era of soaring income inequality, bear more scrutiny than they get.   When Gallagher refers to how “we rebuild once or twice a century in this country,” just who is this “we” she means? It is not hard to draw some unsettling answers. As an editor at Fortune, as avowed resident of Greenwich Village, whose one-bedroom rentals are the most expensive in Manhattan, she seems heavily identified with affluent, especially the movers and shakers in the development community.  Whether singling out recent failures of building projects in outer suburbs or exurbs, concentrating on suburban malls that have been abandoned or are being retrofitted, or homing in on downtown reconstructions, “end of suburbs” authors often tacitly adopt a financial standard for future promise: where the most real-estate money is to be made. 

By the same token, this literature of suburbia’s end offers astonishing little reflection on the implications of its favored trends for the ways in which our cities divide the wealthy from the rest.   Today’s declarations of an “end of suburbs” come just as rents in places like Manhattan are hiking out of reach of the merely middle class, generating anxieties tilled, most recently, by Bill de Blasio’s successful campaign for mayor. Yet when Gallagher sweepingly contends that “millenials hate the suburbs,” she doesn’t even ask how many young people are actually going to be able to afford living in cities. And at this point, as well, her definition of “suburbs” itself suddenly narrows: just the subdivisions and malls, not the new “planned community” or the “urbanized small town or suburb” that may lie nearby.

The trend of urbanizing suburbs offers the most compelling angle of this reputed “end” for us actual suburbanites. For a good while in suburbs like my own Long Island, proponents of smart growth and the New Urbanism have pushed for multiuse, for bringing apartments into old town centers, for recreating walkability there.  Having watched and participated in the political rows stirred by such projects, like Avalon Bay’s plan to build an apartment complex near the Huntington train station, I can say this: those people most likely to see these projects as an “end of suburbs” are their opponents.  For the rest of us, their supporters, they look more like diversifying: taking us away from the old “suburbia” stereotypes, but not by leaving subdivisions behind.  All those stores, restaurants, and events available in walkable downtowns have the virtue of enhancing the suburban experience for those of us who remain homeowners, even as they furnish living quarters for renters who might otherwise leave: twenty-somethings, singles, and the elderly.  

That suburbs are also becoming societal repositories for newly arriving immigrants, blacks and other minorities, as well as poverty, does undermine that old “suburbia” imagery, but in ways that stir hopes for suburbs’ future. Largely because of these trends, indexes measuring metropolitan segregation have been gradually declining—and that’s a good thing.  Of course, suburbanites’ reputation for racial animosity is still plenty justified:  just look at Atlanta’s Gwinnett County as depicted by Ehrenhalt, or the hostility found on Long Island to undocumented immigrants. But there’s an as yet little-told story of how suburban opposition to these attitudes has also emerged. When a homeless camp of mostly immigrant workers was discovered in Huntington Station in the early 2000s, a remarkable coalition of social service agencies and churches cobbled together a program for housing and feeding them over the winter that involved over a thousand volunteers. This outpouring crossed lines of class and race, drawing many from the suburban church I attend, which itself is pretty evenly split between blacks and whites.  I don’t think my fellow travelers there, or in pro-immigrant groups like Long Island Wins, would surmise as Gallagher does that ours is some “suburban experiment” that has “failed.”

“The end of suburbs”—it’s a dramatic claim, and as mythological as that old “myth of suburbia,” especially for those of us living in the places that are supposed to be ending. I prefer another narrative, with a more positive spin. The demographic and other changes underway in our suburbs may well wind up breaking the old stereotype in another way, by building the basis for a newly inclusive and forward-looking politics in the suburbs. 

Christopher Sellers is a Professor of History at Stony Brook University and author of Crabgrass Crucible; Suburban Nature and the Rise of Environmentalism in Twentieth-Century America (2012), He is now writing on, among other things, the historical relationship between suburbanizing, race, and environmentalism around Atlanta. 

Home illustration by Bigstock.

Derailing Europe's Bike Trains

$
0
0

In a fit of what now appears to have been madness, over the last ten days I attempted to live the life of a small plastic figure in an architect’s model community. I wheeled my bike through railroad stations, and took eco-friendly cycle lanes. The goal was to use only a combination of trains and my bicycle to attend a series of meetings in France, Belgium, and the Netherlands. I hoped that the harmonious state of the European Union, not to mention the environmental friendliness of both trains and bikes, would allow me to whiz between Bordeaux, Paris, Brussels, and Amsterdam and then pedal the last kilometers to my hotels. Is this not the dream of European planners who have banned cars from many historic downtowns, and annually vote some €40 billion a year in railroad subsidies?

Like many utopian schemes, my model week of travels worked better on paper than in practice. I made a large loop from Geneva to Bordeaux, Paris, and Amsterdam, and stopped long enough in many other cities to ride around the “centreville”. When it was over, I came to the conclusions that European rail transport, and perhaps even the larger European Union, remain Balkanized, and that taking a bicycle on a business trip involves the same logistical planning as departing on a Crusade.

While getting on and off thirty trains (on the weekends I made detours to historic sites), I learned that many European railroad companies hate bicycles, especially on crack express trains, and that bikes are largely exiled to insignificant “milk” trains that go nowhere at slow speeds.

More distressing, national borders — largely in disuse on auto routes across Europe — are alive and well whenever you attempt to bring a bicycle across state lines on a train, as that opens up the possibilities of more fees for rail companies, or at least the chance for conductors to deliver nationalistic rants.

Between Amsterdam, Brussels, Lille and Geneva, for example, I paid out more than $60 just to bring along a bike, although on many trains I had to stand with it in the vestibule. The EU’s motto, “Unity in Diversity,” might as well read, “What makes you think you can put your bike there?”

Herewith is a not-at-all comprehensive guide to bike-training around Europe. Be particularly mindful if you believe the Community is a happy jamboree of continentals singing hymns to Brussels:

France: Bikes are allowed on some high speed TGV trains (Train à Grande Vitesse), but only after a passenger has physically gone to a station and paid for a reservation. Online bike reservations are not possible (that would make it too easy).

Local TER trains (Transport Express Régional) welcome bikes aboard at no extra charge and have convenient hooks and bike carriages. Except for a few long distance “Intercités” trains, TER is local, which is why it took twelve hours and numerous train changes to travel with a bike from Geneva to Bordeaux, the first leg of my journey.

I changed in Bellegarde, Lyon, and Saint-Pierre-des-Corps before heading to Bordeaux. Later, I made whistle stops in La Rochelle, Poitiers and Tours. Nearly all the cities on my route were a delight to see on a bike, as, of course, was Paris, which is as bike-friendly as any large city, although Parisian cyclists ride as though they inhabit some wild Expressionist painting.

Belgium: I went from Paris to Lille and then across Belgium on several trains, all of which took my bike, but few of which had any place to store it.

Nor is the French fee paid to transport a bike recognized in Belgium. So much for the common market. Belgium imposes its own set of arcane rules for passengers trying to sneak a bicycle across the border.

Even though I had passes for the trains and my bike, there was always some reason I ran afoul of the Belgian conductors, who in torrents of Flemish, French, or English would berate me for the temerity of traveling in their country.

Mao would have called these encounters “struggle sessions,” and I grew to dread being asked for “self-criticism” every time I boarded a Belgian train. A few of the conductors were kindly, but some in Flanders were so bitter over what appeared to be nothing that I wondered if their rage wasn’t part of a larger crackup, maybe one involving the entire country?

I did love my rides around Brussels, Antwerp and Ypres, but was shocked at the contrast between wealthy (Germanic) Flanders and depressed (French-speaking) Wallonia.

Flanders has wealthy farms, an industrial base, global trade via the Rhine, inflowing tourist dollars from Bruges and Ghent, and the European Union in Brussels.

Wallonia is the dowager of a forgotten Belgian empire (maybe lost in the Congo?) — with abandoned coal mines, lots of subsidies from the north, lazy union work rules, and a sense that the future isn’t what it used to be. It does not even have Brussels, which floats along the uneasy divide: linguistically part of Wallonia; legally attached to Flanders.

If the Flemish politicians are anything like their train conductors, I can easily imagine them throwing the Walloons off at the next station, with a long lecture about their failures as an economic entity or their lack of sufficient documentation.

The Netherlands: The Low Countries are celebrated for their bicycle culture; bikes in Amsterdam careen like split atoms. That affection ends at the doors of the train, on which bikes are a regulated industry.

I loved biking across the bridges over Amsterdam canals, especially at night when the Christmas lights were lit and the city had the feel of a Venetian carnival. Nevertheless, on the rails, a bike became an albatross, subject to myriad rules about the difference between a “national” and “international” bike pass, and regulations that prohibit bikes on certain trains during rush hours.

Because of a tunnel fire, my bike and I were waylaid in the Hague’s damp air for more than an hour. When finally rerouted to Gouda and Rotterdam, I was told in a scolding manner that I would have to get off the trains for another two hours during peak travel times, even though the cars were empty. So much for those newspaper articles about modest Dutch royalty tooling around the country on their bikes.

It took almost eight hours to travel with the bike from Amsterdam to Lille, France. These cities are three hours apart on high-speed trains, although none of those trains allow bicycles.

***

The answer to these frustrations, of course, is for me to buy a folding bicycle — although a good one costs more than $1500 — if I wish to persist in the dream of getting around Europe by train with a bike.

A “folder” may be worth it, however, because European cities are best seen over handlebars. Sadly, while a folding bike can be snuck aboard fast trains as “normal luggage,” the other, perhaps larger problem of the European bike-train dream is that international train journeys have become the travel choice largely of the expense-account crowd.

For example, one-way train fare from Geneva to London is $350, but don’t even think about taking along a bicycle. Or, you might get it from Geneva to Paris on a TGV (add $15 more to the ticket), but Eurostar’s bike policies (add another $35) are more arcane than the Treaty of Westphalia: Bikes over a certain size go as registered luggage, but sometimes travel on different trains, making connections convoluted.

So fly, rent a car, sit in traffic, and sleep in motels near auto route interchanges. In other words, so long as you don’t try to see the continent with a bike and by train on the same trip, or on a budget, the state of the European empire is fine.

Matthew Stevenson, a contributing editor of Harper's Magazine, is the author of Remembering the Twentieth Century Limited, a collection of historical travel essays. His new book, Whistle-Stopping America, was recently published.
Flickr photo by K Paulinka: Bike Storage at Leiden train station parking lot, Netherlands.


Downsizing the American Dream

$
0
0

At this time of year, with Thanksgiving, Hanukkah and Christmas, there's a tendency to look back at our lives and those of our families. We should be thankful for the blessings of living in an America where small dreams could be fulfilled.

For many, this promise has been epitomized by owning a house, with a touch of green in the back and a taste of private paradise. Those most grateful for this opportunity were my mother's generation, which grew up in the Great Depression. In her life, she was able to make the move from the tenements of Brownsville, Brooklyn, first to the garden apartments of Coney Island and Sheepshead Bay, and, eventually, to a mass-produced suburban house on Long Island.

This basic American dream of upward mobility may not, according to the pundit class, planners and many developers, be readily available for my children. Indeed, in the years since the 2007 housing bust, there's been a steady stream of commentary suggesting a future that resembles the past, where most people were renters and, in urban centers, lived chock-a-block in crowded apartment buildings.

The advocates for a return to this not-so-great past are a diverse lot, spanning the ideological spectrum from the free-market Right to the green, regulation-loving Left. Many on the right, such as economist Tyler Cowen, suggest that the era of the “average” American is now past, and that most of us will have to dial down our expectations about how we live, particularly in costly places such as California. The blessed 15 percent might aspire to live high on the hog, and even in luxury, but for the rest of us it's eating rice and beans, and living small. Goodbye, Levittown, and back to Brownsville.

Some in the financial community also salivate at the possibilities contained in downgrading the American dream. The very people who rode the mortgage boom and left millions of homeowners to deal with the consequences, now hail the ushering of what Morgan Stanley's Oliver Chang has dubbed a “rentership society.” Rather than purchasing a home, the middle class is now being downgraded into either renting a foreclosed home snatched by the Wall Street sharpies or being stuffed into small, multifamily housing.

In either case, the financial hegemons win, since they, essentially, get to have someone else to pay their mortgages. As for society, it's a losing proposition. Rather than the yeoman with his own place, and the social commitment that comes with it, we now have the prospect of a vast lower class permanently forced to tip its hat to – and empty its wallet for – its economic betters. This is the fate ardently hoped for by many urbanists, who see a generation of permanent renters as part of their dream of a denser America.

One would expect that this diminution of the middle class would offend liberals, who historically supported both the expansion of ownership and the creation of a better life for the middle class. But today's liberals – or progressives – share Wall Street's enthusiasm, albeit for different reasons, for renting and ever-greater densities.

This reverses the policies of the New Deal and its successors. Half of postwar suburban housing, notes historian Alan Wolfe, depended on some form of federal financing. In fact, the progressive position increasingly is worse than that of free-market conservatives and their Wall Street allies. The Right sees profit in densification and renting, but would likely support other options if they seemed advantageous. In contrast, the progressive Left increasingly sees the single-family home and ownership – what made middle-class people like my mother lifelong Democrats – as outdated, even destructive.

This can be seen in the writings of progressive thinkers like Richard Florida, who, in the midst of the mortgage crisis, proclaimed homeownership as “overrated” and urged Americans to give up the dream of owning their own digs, particularly in the much-disrespected suburbs. In Florida's “creative age,” the proper aspiration is to live in a dense, expensive city, such as San Francisco or Manhattan, where only a fraction of the population can conceivably own their residence.

To accommodate this vision, we inevitably get back to a world that looks similar to that of the tenement era. Already, in part due to regulatory policies making new construction prohibitively expensive, there is severe overcrowding in New York, the Bay Area and throughout Southern California. According to the Center for Housing Policy and National Housing Conference, 39 percent of working households in the Los Angeles metropolitan area spend more than half their incomes on housing, along with 35 percent in the San Francisco metro area and 31 percent in the New York City area. The national rate is 24 percent, itself far from tolerable.

What we are witnessing today is oddly reminiscent of the Brooklyn of my mother's childhood. She and her four siblings generally lived in three or fewer rooms, sharing her bed with her sisters until she got married. Yet, over time my mother's generation did well, and all my relatives were able to ascend into the middle class, or even better, by the late 1950s. Most bought homes on Long Island, although one purchased a co-op in Brooklyn.

Today, our cognitive betters embrace a more déclassé vision, with fewer families, more singles and less focus on upward mobility. Indeed, some, particularly among the environmental community, actually embrace downward mobility. Millennials, by not buying homes and cars, and perhaps also not growing into family life, are portrayed by the green magazine Grist as “a hero generation” – one that will march willingly, even enthusiastically, to a downscale future.

How will we live in this brave new America? It won't be exactly a return to the tenements that housed Depression era families, but will involve much smaller, less-communal arrangements. To serve the hip and cool youthful urban crowd, planners embrace microunits of 200-300 square feet. These are either being built or planned in such cities as Seattle, New York, San Francisco, Santa Monica and Portland. Soon, they will become something every second-tier wannabe burg will want to duplicate in their often madcap drive to ape cool cities' hip urbanism.

Such units may make developers' mouths water with anticipation of ever more profitable cramming. But in the process, they will be further encouraging the shift away from housing for married couples, not to mention, children. Families do not make up the prime market for dense housing; married couples with children constitute barely 10 percent of apartment residents, less than half the percentage for the overall population.

And what if you can't afford a trendy “pad” in a hip downtown? The urban advocates embrace another dismal back-to-the-future solution: the boarding house. It's time, argues the Atlantic recently, to jettison our “middle-class norms of decency” governing housing and bring back the boarding house of the 19th and early 20th centuries.

All said, this is a dismal future being dialed up for the next generation, largely by boomer ideologues and their developer allies. It's not clear, fortunately, that the millennials will willingly go along. This gives us hope that, when families celebrate the holidays decades from now, they still will have as much to be thankful for as did my mother's generation, or for that matter, my own.

This story originally appeared at The Orange County Register.

Joel Kotkin is executive editor of NewGeography.com and Distinguished Presidential Fellow in Urban Futures at Chapman University, and a member of the editorial board of the Orange County Register. He is author of The City: A Global History and The Next Hundred Million: America in 2050. His most recent study, The Rise of Postfamilialism, has been widely discussed and distributed internationally. He lives in Los Angeles, CA.

Suburban Corporate Wasteland

$
0
0

I was a guest on the show “Where We Live” on WNPR radio in Connecticut this week. The theme was “Suburban Corporate Wasteland” – the increasing numbers of white elephant office campuses in suburbs. Apparently Connecticut has several of these and some buildings are actually being demolished because there’s no demand for them.

The entire program is worth a listen, particularly if you are someone trying to figure out how to redevelop one of these things. Several local officials join to talk about efforts to do that in their towns. If you want to just hear Yours Truly, I’m on for about 10 minutes starting at 38:30. Follow this link to listen to the show.

There are a number of challenges converging to put pressure on suburban office campuses in some places:

1. Decentralization has run its course. There was a massive wave of suburbanization in the post-War era that has finished. That’s not to say things are going to be re-centralizing. Rather, the massive move from the core to the periphery is largely complete. The development pattern of the United States will continue to be decentralized, but it will largely be driven by organic growth rather than relocations. I think something similar happened with driving. The factors driving VMT growth above the rate of inflation – more cars per household, women entering the workforce, and such – are pretty much played out in terms of driving huge additional travel miles.

2. Corporate M&A and industry restructurings have dampened demand in some areas. In Connecticut specifically, a number of the complexes in question were from pharmaceutical and insurance companies. There has been a lot of consolidation in the pharma industry, for example. And with a challenging environment for new drug development, pharma companies are now really focusing on cost cutting and reducing overhead, not building massive new office parks.

3. The nature of work is changing. There was a popular trend for a while towards massive suburban office HQ campuses. For example, Sears moved from its namesake tower in downtown Chicago to a big campus in Hoffman Estates. These campuses had tons of free parking and lots of onsite amenities like gyms, dry cleaners, cafeterias, day care, etc. They also offered an idyllic, almost pastoral setting in some respects. Workers could spend their days cocooned inside the campus. Today’s firms are less vertical integrated and more networked. They are heavily globalized and collaborative. They’ve also figured out that people who don’t get out and engage with the world around them end up cut off from information flows, leaving them a step behind. Workers are also demanding more flexible working conditions. And of course there’s cost cutting pressures. This leads to things like hoteling, co-working, and telecommuting – no massive suburban office park needed.

4. In select industries and cities, there has been a resurgence in the fortunes of downtown offices. This has particularly been the case in high tech. Google’s second largest office is in Manhattan. Salesforce.com’s Exact Target unit employs a thousand people in downtown Indianapolis. Amazon is building a large urban campus is Seattle. Many companies in Chicago have relocated downtown from the suburbs. I’ve probably seen more announcement of these types of moves in Chicago than anywhere else. I’d caution that in most downtowns the trends in private sector employment have remained negative. But in select locales and industries, things have been looking up. In industries where there’s a need for proximity to high end business services or where there are unique clustering or labor force issues, downtowns will retain an appeal.

Put it all together and it’s clear office space demand is weaker than it used to be. Joel Kotkin recently surveyed the same trends and suggests that the US may have hit “peak office”. The idea is not that office space will actually decline, rather that it won’t be growing at the same rates as in the past. This will affect both urban and suburban markets.

It’s easy to see how these trends combined to pound a place like Connecticut. It’s next to NYC, the premier central business district zone in America. But it is also far enough to make commuting to most of it a pain (even the express train to Stamford takes about an hour). And it’s an expensive and business hostile environment to boot. Large scale employers who want a suburban footprint can find many better places.

We are in fact seeing this happen in finance. Goldman Sachs is booming in Manhattan, but has what I believe is their second largest US office in Salt Lake City, presumably housing back office functions. Deutsche Bank is building a big facility in Jacksonville. JP Morgan Chase has a huge presence in Columbus, Ohio, where its former Bank One unit was based. A place like Connecticut is the odd man out. Suburban Chicago is probably set to be another loser. But in smaller cities the suburbs will do much better.

Also, don’t be too quick to write the eulogy for the suburban office campus, even in the tech industry. A recent article in Der Spiegel featured Silicon Valley’s new “monuments to digital domination” – including Apple’s $5 billion Norman Foster designed campus, Frank Gehry’s campus for Facebook, and others for Google, NVidia, and Samsung. In Houston, Exxon Mobil is putting the finishing touches on a three million square foot campus that will employ 10,000 people. But unlike Google moving 2,500 people to downtown Chicago, projects like that don’t make national headlines.

I don’t think there will be a massive back to downtown wave, and the suburban office park is not dead. But there are headwinds facing suburban office space, particularly in expensive, mature markets.

Aaron M. Renn is an independent writer on urban affairs and the founder of Telestrian, a data analysis and mapping tool. He writes at The Urbanophile, where this piece originally appeared.

The Evolving Urban Form: Greater New York Expands

$
0
0

The term “Greater New York” was applied, unofficially, to the 1898 consolidation that produced the present city of New York, which brought together the present five boroughs (counties). The term “Greater” did not stick, at least for the city. When consolidated, much of the city of New York was agricultural. As time went on, the term "Greater" came to apply to virtually any large city and its environs, not just New York and implied a metropolitan area or an urban area extending beyond city limits. By 2010, Greater New York had expanded to somewhere between 19 million and 23 million residents, depending on the definition.

Greater New York’s population growth has been impressive. Just after consolidation, in 1900, the city and its environs had 4.2 million residents, according to Census historian Tertius Chandler. Well before all of the city’s farmland had been developed, New York, including its environs, had become the world’s largest urban area by the 1920s, displacing London from its 100 year predominance. Yet, even when Tokyo displaced New York in the early 1960s, there was still farmland on Staten Island. 

New York became even larger in two dimensions, as a result of geographic redefinitions arising from the 2010 census.

The Expanding New York Metropolitan Area

The New York metropolitan area grew by enough land area to add more than 700,000 residents between 2000 and 2010, even after the decentralization reported upon in the metropolitan area as defined in 2000. The expansion of the metropolitan area occurred because the employment interchange between the central counties and counties outside the metropolitan area in 2000 became sufficient to expand the boundaries by more than 1,000 square miles (2,500 square kilometers).

Summarized, metropolitan areas are developed by identifying the largest urban area (area of continuous urban development with 50,000 or more population) and then designating the counties that contain this urban area as “central counties.” Additional (“outlying”) counties are included in a metropolitan area if 25 percent or more of their resident workers have jobs in the central counties, or if 25 percent or more of the employees in the outlying county live in the central counties (There are additional criteria, which can be reviewed at 2010 Office of Management and Budget metropolitan area standards). In addition, adjacent metropolitan areas can be merged into a combined statistical area at a lower level of employment interchange (see below).

For example, one of the counties added to the New York metropolitan area in the 2010 redefinition was Dutchess (home of the Franklin Delano Roosevelt Presidential Library). A resident of Dutchess County who works across the county line in Putnam County (a central county) would count toward the 25 percent employment interchange with the central counties of the New York metropolitan area. Contrary to some perceptions, metropolitan areas do not denote an employment interchange between suburban areas and a central city, even as major an employment destination as the city of New York.

The OMB concept of “central” counties is in contrast to the more popular view that would consider the central counties to be Manhattan (New York County) or the five boroughs of New York City. In fact, out of the New York metropolitan area’s 25 counties, all but three (Dutchess and Orange in New York and Pike in Pennsylvania) are central counties. Sufficient parts of the urban area are in the other 22 counties, which makes them central.

The Expanding New York Combined Statistical Area

OMB has a larger metropolitan concept called the "combined statistical area." The combined statistical area is composed of metropolitan and micropolitan areas that have a high degree of economic integration with the larger metropolitan area. Essentially, adjacent areas are merged into a combined statistical area if there is an employment interchange of 15 percent. This occurs where the sum of the following two factors is 15 percent or more: (1) The percentage of resident workers in the smaller area employed in the larger area (not just central counties) and (2) The percentage of workers employed in the smaller area who reside in the larger area.

On this measure, New York became greater by more 1 million residents as a result of the changes in commuting patterns. The addition of Allentown (Pennsylvania – New Jersey) and the East Stroudsburg, Pennsylvania metropolitan areas expanded the New York combined statistical area by another 2,700 square miles (7,000 square miles), bringing the population to 23.1 million. Altogether, the metropolitan area and combined area land area increases added up to 3,700 square miles (9,700 square kilometers). The 35 county New York combined statistical area is illustrated in the map (Figure 1).

Organized Around the World's Largest Urban Area (in Land Area)

The New York combined statistical area is the largest in the world. It covers approximately 14,500 square miles (37,600 square kilometers). From north to south, it measures 235 miles (375 kilometers) from the Massachusetts border of Litchfield County, Connecticut to Beach Haven, in Ocean County, New Jersey. It is an even further east to west, at more than 250 miles (400 kilometers) from Montauk State Park in Suffolk County, New York to the western border of Carbon County in Pennsylvania (Note 2). Despite containing the largest urban area  in the world, at 4,500 square miles (11,600 square kilometers), more than 60 percent of the combined statistical area is rural (see Rural Character in America’s Metropolitan Areas).

Dispersion of Jobs and Residences

The dispersion characteristic of modern metropolitan regions is illustrated by the extent to which jobs have followed the population in the New York combined statistical area. In all “rings” outside the city of New York, there is near parity between resident workers and jobs. The greatest employment to worker parity (0.97) is in the metropolitan and micropolitan areas outside the New York metropolitan area (Allentown, PA-NY; Bridgeport, CT; East Stroudsburg, PA; New Haven, CT; Torrington, CT; and Trenton, NJ). There is 0.94 parity in the inner ring suburban counties, which include Nassau and Westchester in New York as well as Bergen, Essex, Hudson, Middlesex, Passaic and Union in New Jersey. The outer balance of the New York metropolitan area has slightly lower employment to worker parity, at 0.87 (Figure 2).

The lowest employment to worker parity in the New York combined statistical area is in the four boroughs of New York City outside Manhattan, at 0.70. The greatest disparity is in Manhattan, where there are 2.80 jobs for every resident worker. Combining all of New York’s five boroughs yields a much more balanced 1.17 jobs per resident worker.

Example: Commuting from Hunterdon County

Hunterdon County, New Jersey provides an example of the dispersion of employment in the New York area. Hunterdon County is located at the edge of the New York metropolitan area. It is well served by the commuter rail services of New Jersey Transit. With a line that reaches Penn Station in New York City, approximately 55 miles (35 kilometers) away. Yet, the world’s second largest employment center (after Tokyo’s Yamanote Loop), Manhattan south of 59th Street, draws relatively few from Hunterdon County to fill its jobs.

Among resident workers, 45 percent have jobs in Hunterdon County. Another 36 percent work in other outer counties of the combined statistical area. This leaves only 19 percent of workers who commute to the rest of the combined statistical area. The New Jersey inner suburban counties attract 16 percent of Hunterdon’s commuters and Manhattan employs just three percent of Hunterdon’s resident workers (Figure 3). Fewer than 0.5 percent of Hunterdon’s commuters work in the balance of the CSA, including the outer boroughs of New York, the other New York counties and Connecticut). The detailed area definitions are included in the Table.


DISTRIBUTION OF COMMUTING FROM HUNTERDON COUNTY, NEW JERSEY
To Locations in the New York Combined Statistical Area (2006-2010)
NY CSA SectorCommuting from Hunterdon CountyAreas Included
Hunterdon County45.0%Hunterdon County, NJ
Outer Combined Statistical Area35.6%Monmouth County, NJ
Morris County, NJ
Ocean County, NJ
Pike County, PA
Somerset County, NJ
Sussex County, NJ
Allentown metropolitan area, PA-NJ
East Stroundsburg metropolitan area, PA
Trenton metropolitan area, NJ
Inner Ring (New Jersey only)16.1%Bergen County, NJ
Essex County, NJ
Hudson County, NJ
Middlesex County, NJ
Passaic County, NJ
Union County, NJ
Manhattan2.8%New York County, NY
Elsewhere0.4%Bronx
Brooklyn
Queens
Staten Island
Dutchess County, NY
Nassua County, NY
Orange County, NY
Putnam County, NY
Rockland County, NY
Suffolk County, NY
Westchester County, NY
Bridgeport metropolitan area, CT
Kingston metropolitan area, NY
New Haven metropolitan area, CT
Torrington metropolitan area, CT


From Commuter Belts and Concentricity to Dispersion

Metropolitan areas are labor markets, as OMB reminds in its 2010 metropolitan standards, which refer to metropolitan areas, micropolitan areas, and combined statistical areas as geographic entities associated with at least one core plus “adjacent territory that has a high degree of social and economic integration with the core as measured by commuting ties. ”

Yet metropolitan areas have changed a great deal. Through the middle of the last century, metropolitan areas were perceived as monocentric with core cities and a surrounding “commuter belt” from which the city drew workers to fill its jobs. However, metropolitan areas have become more polycentric, as Joel Garreau showed in his book Edge City: Life on the New Frontier. In more recent years, metropolitan areas have become even more dispersed, with most employment located in areas that are hardly centers at all. Of course, some people still commute to downtown and edge cities. Others work even further away, but most find their employment much closer to home. That is the story of New York and, which has just become greater, and other metropolitan areas as well.

------

Note 1: OMB revised its metropolitan terms in 2000. The term “core based statistical area” (CBSA) is used to denote metropolitan areas (organized about urban areas of 50,000 population or more) and micropolitan areas (organized around urban areas of 10,000 to 50,000 population). The former “consolidated metropolitan statistical area,” was replaced by the combined statistical area, which is a combination of core based statistical areas. OMB also notes that the term “urban area” includes “urbanized areas” (50,000 population or more) and “urban clusters (10,000 to 50,000 population).

Note 2: Part of the reason for this large geographic expanse is the use of counties as building blocks of core based statistical areas. If the smaller geographic units were used (such as census blocks, as in the delineation of urban areas), the geographies would be smaller, though populations would be similar.

-------

Wendell Cox is a Visiting Professor, Conservatoire National des Arts et Metiers, Paris and the author of “War on the Dream: How Anti-Sprawl Policy Threatens the Quality of Life.

Photograph: 59th Street, Manhattan (by author).

Where Working-Age Americans Are Moving

$
0
0

Barrels of ink and money have been devoted to predictions of where Americans will migrate, particularly younger ones. If you listen to big developer front groups such as the Urban Land Institute or pundits like Richard Florida, you would believe that smart companies that want to improve their chances of cadging skilled workers should head to such places as downtown Chicago, Manhattan and San Francisco, leaving their suburban office parks deserted like relics of a bygone era.

A close look at recent migration data shows that a significant number of younger people do indeed prefer urban life and can endure, temporarily at least, the high housing costs that go with it. However, the data also show that as they age, Americans continue, in general, to shift to suburbs, and later smaller communities, looking to buy homes and start families. Last week we explored an expert analysis of these trends by demographer Wendell Cox that showed distinctly different migration patterns from 2007 to 2012 among different age groups. (See: “The Geography Of Aging: Why Millennials Are Headed To The Suburbs“) In this article we will look at the metro areas that they went to.

Our analysis is based on 15-year age cohorts of the working-age population: people who in 2007 were 15-29, 30-44 and 45-59. We looked at the changes in the population numbers of these cohorts five years later in 2012 in the 51 U.S. metropolitan statistical areas with a population over 1 million.

Youth Magnet Cities

Most attention tends to go to the youngest of these cohorts, which aged from 15-29 in 2007 to 20-34 in 2012. It includes students, the unmarried and childless — people in the earliest stages of their careers. This is historically the age group most likely to move from one region to another. Although the vast majority of this cohort live in suburbs or smaller towns, our research does show sizable increases in their numbers in many of the larger, expensive cities, particularly those with strong economies.

From 2007 to 2012, tech-heavy cities generally saw the biggest growth in numbers in this age group. The San Francisco metro area placed first among the largest U.S. metro areas with a 20.7% increase in its population in this age group. Young people, it should be expected, tend to be less sensitive to ultra-high rents (particularly if they work for a successful company or their parents subsidize them). It was followed by Seattle (20.3% growth), Washington, D.C. (18.1%), and Austin, Texas (18.1%).

But tech centers were not the only gainers. Some up-and-coming metro areas, notably Orlando, Las Vegas and New Orleans, also registered high levels of youth migration.

In contrast many of the country’s large “hip and cool” cities did not fare nearly as well. Despite its endless self-promotion as a youth magnet, New York placed 19th (8.6% growth, though in absolute numbers in gained the most in this demographic, 323,000), while Los Angeles was 31st and Boston 22nd. Chicago, the much hyped (and hoped for) magnet for the young promoted by the Urban Land Institute in a recent Wall Street Journal article, places 41st – its population in this demographic actually dropped 0.6%. The lowest rungs are dominated by the traditional Rust Belt hard-luck cases: Cleveland (47th), Buffalo (48th), Rochester (49th), Detroit (50th) and last-place Riverside-San Bernardino, which lost 9.4% of its population in this age cohort from 2007 to 2012.

View Full List Gallery at Forbes: The Cities Where Working-Age Americans Are Moving

But Where Do They Go After 35?

As we explained in the last article, perhaps the most important group to watch is the one that aged from 30-44 in 2007 to 35-49 in 2012. This is the group just ahead of the millennials, and the one most likely to provide hints of where the millennials will move as 20 million enter their 30s over the next decade: the dreaded (at least for some) age of marriage, settling down and, in most cases, starting families. This group has shown remarkably different proclivities than the younger cohort. For one thing, they are not going to San Francisco, which drops to 30th place in this cohort – the city lost a net 0.7% of the age group from 2007 to 2012. Other high-cost urban areas also did very poorly with this demographic, including Boston (40th, -2.3%), New York (45th, losing a net 3.9%, or 161,000 people), San Jose (46th), Los Angeles (47th) and Chicago (49th, -5.2%).

Who wins this group may be critical, since these are people entering their prime who earn more than younger cohorts, particularly in this economy. Census Bureau data indicates that average household incomes are 28% higher where heads of households are 35-45 years old than those in the 25-34 cohort. The gap grows to 34% against householders who are 45 to 54. This group seems very sensitive to both job markets and housing prices. With the exception of the Washington, D.C., area (No. 6), whose government-driven economy continues to flourish, virtually all the top 10 cities enjoy strengthening private-sector economies and relatively low housing prices. At the top of the list is the New Orleans area, whose population in this age group rose 19.3% from 2007 to 2012. The Big Easy’s gains are related, at least in part, to the return of people who fled after Katrina, but it also reflects a newfound demographic vitality backed by substantial economic improvements. It is followed by Miami, San Antonio and Raleigh. Houston and Oklahoma City also did well.

These are the cities that will appeal most to aging millennials, suggests generational chronicler Morley Winograd. Older millennials, he notes, tend to be very interested in home ownership, family and being good parents. The tough economic times they face, plus often crushing college debt, will force many of them to move not to “luxury cities” where they could never afford a home suitable for child-raising, but to places that are, as he puts it, “less expensive and certainly downscale from the places where they grew up.”

Mature Adult Markets

The migration patterns are similar, although not uniformly so, in the next cohort, aged between 50 and 64 in 2012. Mostly still working, and earning close to peak wages, this generation tended to move to less expensive cities as well. New Orleans also ranks first, with a 7.9% gain in this cohort from 2007 to 2012. Low housing costs are another factor in New Orleans’ rebound. You can say much the same for other Sun Belt metro areas, such as San Antonio (third in this demographic with a 7.3% gain), No. 4 Tampa-St. Petersburg (5.0%), No. 5 Austin and No. 7 Oklahoma City.

Interestingly, the California rankings in this cohort are almost the mirror image of the youth brigade. Riverside-San Bernardino, last in the youth list, for example, ranked second, while Sacramento, 43rd on the youth list, seems to get more appealing as people age. In the 30something group, the area rises to 32nd, and boasts a strong ninth place ranking in growth in the 50-64 cohort (+2.0%).

Editorialists at local papers, such as the Sacramento Bee, are obsessed with increasing density and luring hipsters. Yet the California capital region, while not drawing many younger people, does very well in luring adult migrants from the far more expensive, and denser, Bay Area and Los Angeles-Orange County. In contrast, in this cohort, San Francisco ranks 40th with a 4.4% decline in population, Los Angeles-Orange County 44th (-5.6%), and San Jose 49th (-7.3%).

The Upshot For Investors And Companies

A look at these three working-age cohorts suggests a far more complex, and possibly perplexing, challenge to both companies and regions. our demographic analysis suggests the movement of the youngest workers to “hip, cool”cities that is so celebrated by ULI and other professional urban boosters faces some serious time constraints, particularly as workers age.

High-profile companies such as Google (itself located in very suburban Mountain View) seek outposts in places like downtown Chicago or New York, where youthful labor, often less expensive, is readily available. But most companies in technology — particularly those with an engineering focus as opposed to social media — depend heavily on older, skilled workers, most of whom live in suburbs. Much the same can be said of professional services, and finance and industrial companies.

This may explain in part why, despite the claims made by urban boosters, office space construction and absorption is currently considerably stronger in suburbs than in the core cities. A recent Costar report says suburban San Jose, Sacramento, San Jose, Austin, Kansas City and Charlotte are enjoying particularly strong net office absorption. This trend, largely ignored in the media, may accelerate in the future.

The key again is millennials as they enter their 30s. Like previous generations, many will end up either living in suburbs, or moving to less expensive cities as they get ready to buy homes and start families. The notion that “everyone” wants to move, and more importantly stay, in expensive core cities no doubt appeals to journalists based in places like Washington, D.C., San Francisco or Manhattan. But the actual reality is far more complex and more favorable to the continued dispersion of the workforce. Banking on the shifting tastes of 20somethings only works for so long; in the end, only a minority of workers remain Peter Pans, living their youthful urban dreams well into their 40s and 50s.

View Full List Gallery at Forbes: The Cities Where Working-Age Americans Are Moving

This story originally appeared at Forbes.

Joel Kotkin is executive editor of NewGeography.com and Distinguished Presidential Fellow in Urban Futures at Chapman University, and a member of the editorial board of the Orange County Register. He is author of The City: A Global History and The Next Hundred Million: America in 2050. His most recent study, The Rise of Postfamilialism, has been widely discussed and distributed internationally. He lives in Los Angeles, CA.

Unemployed woman photo by BigStockPhoto.com.

What is a City For?

$
0
0

The attached report is derived from a speech given last spring in Singapore at the Singapore University of Science and Technology. The notion here is to lay out a new, more humanistic urban future, not one shaped primarily by large developers, speculators and transient global workers. Singapore was a particularly difficult case to look at since it has no room to spread out, something we still have in much of the rest of the world. Yet the city has been very innovative in the development of open space, and its public housing agency, the Housing Development Board, has worked hard to accommodate the needs of families. I have been struck by how people in different countries want the same things: safety, space, privacy, convenience, and affordable housing. The speech is a call to reconsider our urban priorities and make the city responsive to its denizens.

Download the full .pdf document.

Introduction

What is a city for? In this urban age, it’s a question of crucial importance but one not often asked. Long ago, Aristotle reminded us that the city was a place where people came to live, and they remained there in order to live better, “a city comes into being for the sake of life, but exists for the sake of living well” (Mawr, 2013).

However, what does “living well” mean? Is it about working 24/7? Is it about consuming amenities and collecting the most unique experiences? Is the city a way to reduce the impact of human beings on the environment? Is it to position the polis — the city — as an engine in the world economy, even if at the expense of the quality of life, most particularly for families?

I start at a different place. I view “living well” as addressing the needs of future generations, as sustainability advocates rightfully state. This starts with focusing on those areas where new generations are likely to be raised rather than the current almost exclusive fixation on the individual. We must not forget that without families, children, and the neighbourhoods that sustain them, it would be impossible to imagine how we, as a society, would “live well.” This is the essence of what my colleague, Ali Modarres and I call the ‘Human City’.

Living well should not be about where one lives, but how one lives, and for whom. Families can thrive in many places, but these bearers of the next generation are not the primary focus of much of the urbanist community. I am referring here to urban neighbourhoods like in Singapore or in the great American cities, as well as the country’s vast suburbs. These are not necessarily the abodes of the glittering rich, or the transitory urban nomadic class, who dominate our urban dialogue, but a vast swath of aspiring middle- and working- class people. They are not necessarily the places that hipsters gravitate to, or lure people thinking of a second or third house.

Download the full .pdf document.

Published by the Lee Kuan Yew Centre For Innovative Cities

Joel Kotkin is executive editor of NewGeography.com and Distinguished Presidential Fellow in Urban Futures at Chapman University, and a member of the editorial board of the Orange County Register. He is author of The City: A Global History and The Next Hundred Million: America in 2050. His most recent study, The Rise of Postfamilialism, has been widely discussed and distributed internationally. He lives in Los Angeles, CA.

The Blue-Collar Heroes of the Inland Empire

$
0
0

The late comedian Rodney Dangerfield (nee Jacob Cohen), whose signature complaint was that he “can't get no respect,” would have fit right in, in the Inland Empire. The vast expanse east of greater Los Angeles has long been castigated as a sprawling, environmental trash heap by planners and pundits, and its largely blue-collar denizens denigrated by some coast-dwellers, including in Orange County, who fret about “909s” – a reference to the IE's area code – crowding their beaches.

The Urban Dictionary typically defines the region as “a great place to live between Los Angeles and Las Vegas if you don't mind the meth labs, cows and dirt people.” Or, as another entry put it, a collection of “worthless idiots, pure and simple.” Nice.

In reality, the people who live along the coast should appreciate the “909ers” since they constitute the future – if there is much of one – for Southern California's middle class. The region has suffered considerably since the Great Recession, in part because of a high concentration of subprime loans taken out on new houses. Yet, for all its problems, the Inland Empire has remained the one place in Southern California where working-class and middle-class people can afford to own a home. With a median multiple (median house price divided by household income) of roughly 3.7, the area is at least 40 percent less expensive than Los Angeles and Orange County, making it the region's last redoubt for the American dream.

Without the 909ers, Southern California would be demographically stagnant. From 2000-10, according to the census, San Bernardino and Riverside counties added more than 1 million people, compared with barely 200,000 combined for Los Angeles and Orange counties. And, despite the downturn that impacted the Inland Empire severely and slowed its growth, the area since 2010 has continued to grow more quickly, according to census estimates, than the coastal counties.

Families & foreign-born

Perhaps nothing illustrates the appeal of the region better than the influx of the foreign-born. In the past decade, Riverside and San Bernardino counties grew their foreign-born population by more than 300,000. In contrast, Los Angeles and Orange added barely one third as many. The rate of foreign-born growth in the Inland Empire, notes demographer Wendell Cox, was roughly 50 percent, while Los Angeles and Orange counties managed 2.6 percent growth. The region, once largely white, now has a population that's 40 percent Latino, the single largest ethnic group.

And then there's families. As demographer Ali Modarres has pointed out, the populations of Los Angeles, as well as Orange County, are aging rapidly while the numbers of children have dropped. In contrast, families continue to move into the Inland Empire, one reason for its relatively vibrant demography. Over the past decade, while Orange County and Los Angeles experienced a combined loss of 215,000 people under age 14 – among the highest rates in the U.S. of a shrinking population of children – the Inland Empire gained more than 20,000 under-14s.

For these basic demographic reasons, the Inland Empire remains critical to Southern California's success. And there are some signs of progress. Unemployment has plummeted from more than 13 percent to 9.6 percent, higher than in Orange County but considerably better than Los Angeles' 10.2 percent. There are also some signs of growth, as signaled by some new residential development, and interest in the area from overseas investors.

Coastals call shots

The long-term outlook, however, remains clouded, in large part, because of state and regional economic policies that undermine the very nature of the predominately blue-collar 909 economy. This reflects in part the domination of the state by the coastal political class, concentrated in the Bay Area but with strong support in many Southern California coastal communities. The Inland Empire, where almost half the population has earned a high school degree or less, compared with a third of residents in Orange County, is particularly dependent on the blue-collar employment undermined by the gentry-oriented direction of state regulatory policy.

Losses of jobs in these blue-collar fields, notes economist John Husing, have helped swell the ranks of poor people in the area, from roughly 12 percent of the population to 18 percent over the past 20 years. Part of the problem lies in a determination by the state to discourage precisely the kind of single-family-oriented suburban development that has attracted so many to the region. The decline of construction jobs – some 54,000 during the recession – hit the region hard, particularly its heavily immigrant, blue-collar workforce. This sector has made only a slight recovery in recent months. Ironically, the nascent housing recovery could short-circuit further gains by boosting housing prices and squashing any potential longer-term recovery.

Other state policies – such as cascading electricity prices – also hit the Inland Empire's once-promising industrial economy. With California electricity prices as much as two times higher than those in rival states, energy-consuming industries are looking further east, beyond state lines.

Indeed, according to recent economic trends, job growth is now occurring fastest in places like Arizona, Texas, even Nevada, all of which compete directly with the Inland Empire. As the nation has gained a half-million manufacturing jobs since 2010, such jobs have continued to leave the region. Had the regulatory environment been more favorable, notes economist John Husing, the Inland Empire, with industrial space half as expensive that in Los Angeles and Orange, would have been a major beneficiary.

Finally, there is a major threat to the logistics industry, which has grown rapidly over 20 years, adding 71,900 jobs from 1990-2012, a yearly average of 3,268. The potential threat is posed by the expansion of the Panama Canal, and the resulting expansion of Gulf Coast ports, all of which could reduce these positions dramatically in coming decades. Husing suggests that attempts by the regional Air Quality Management District to slow this industry's expansion is a “a fundamental attack on the area's economic health.”

Keys to rebound

Can the Inland Empire still make another turnaround, as it did after the previous deep regional recession 20 years ago? Some, such as the Los Angeles Times, see the key to a rebound in boosting transit, something that, despite huge investment, accounts for barely 1.5 percent of the IE's work trips, even less than the 7 percent in Los Angeles or 3 percent in Orange County.

This “smart growth” solution remains oddly detached from economic or geographic reality; more transit usage may be preferable in some ways but can only constitute a marginal factor in the near or midterm future. What the Inland Empire needs, more than anything, is an economic environment that spurs middle-class jobs, notably in logistics, manufacturing and construction.

Equally important, the area needs to focus more on quality-of-life issues that may attract younger, educated workers, increasingly priced out of the coastal areas. This means a commitment to better parks and schools, attractive particularly to families. This approach has helped a few communities, such as Eastvale, near Ontario, become new bastions of the middle class.

Without a resurgence in the Inland Empire, all of Southern California can expect, at best, to see the area age and lose its last claim to vitality. This should matter to everyone in Southern California whether they live there or not. Without the 909ers, we are not only without the butt of jokes from self-styled sophisticates, we will have lost touch with the very aspirational dynamic that has forged this region throughout its history. It's time maybe to give them some respect.

This story originally appeared at The Orange County Register.

Joel Kotkin is executive editor of NewGeography.com and Distinguished Presidential Fellow in Urban Futures at Chapman University, and a member of the editorial board of the Orange County Register. He is author of The City: A Global History and The Next Hundred Million: America in 2050. His most recent study, The Rise of Postfamilialism, has been widely discussed and distributed internationally. He lives in Los Angeles, CA.

The Law's No Ass: Rejecting Hollywood Densification

$
0
0

The city of Los Angeles received a stunning rebuke, when California Superior Court Judge Alan J. Goodman invalidated the Hollywood Community Plan. The Hollywood district, well known for its entertainment focus, contains approximately 5% of the city of Los Angeles’ population. The Hollywood Plan was the basis of the city's vision for a far more dense Hollywood, with substantial high rise development in "transit oriented developments" adjacent to transit rail stations (Note 1).

The Hollywood Plan had been challenged by three community groups (Savehollywood.org, La Mirada Avenue Neighborhood Association of Hollywood, and Fix the City), which argued that the approval process had violated provisions of California law, and most particularly had relied on population projections that were both obsolete and inaccurate.

Judge Goodman called the Hollywood Plan "fatally flawed," and noted that it relied on errors of both "fact and law." He ordered the City to:

(1) Rescind, set aside and vacate all actions approving the Hollywood Plan and prepare a replacement that is lawful and consistent with the City's general plan.

(2) Grant no permits or entitlements from the Hollywood Plan until it has been replaced with a lawful substitute.

An "Entirely Discredited" Population Baseline

The principal issue in the case revolved around out-of-date and erroneous population estimates (Note 2). The city based its densification plan on an assumption that the population of Hollywood would had risen from 200,000 in 2000 to 224,000 in 2005. This estimate was produced by the Southern California Association of Governments (SCAG), which is the metropolitan planning organization for all of Southern California outside San Diego County. SCAG had further projected that Hollywood's population would rise to 250,000 by 2030.

To house these additional residents, the city reasoned that higher density development was necessary. In a related matter, the Los Angeles City Council approved Millennium Hollywood, a pair of 35 and 39 story mixed use towers. This was in spite of warnings from the State Geologist that the property was bisected by a dangerous earthquake "rupture" fault (Note 3). Litigation is pending.

But there’s a fly in this planning ointment, rather than gaining population, Hollywood is losing people.   Before the Hollywood Plan was finally approved, 2010 United States Census data was released that indicated the population had dropped to 198,000. This revealed both the SCAG estimate of the actual population and its 2030 projection to be highly inaccurate. Judge Goodman referred to the SCAG 2005 estimate as "entirely discredited."

Elementary Questions Raised

Nonetheless, the city proceeded based upon the incorrect population data. This led the Judge to raise elementary questions about the process (paraphrased below).

(1) Why was the SCAG population estimate used as a baseline by the city of Los Angeles if the US Census count, readily available before the environmental process was completed, had shown a significantly smaller population?

(2) Why was the 2030 projection (from SCAG) not adjusted in the Plan based on the new, lower 2010 US Census population count?

The City defended using the stale and erroneous population data. Judge Goodman commented: "That clearly is a post-hoc rationalization of City's failure to recognize that the HCPU (Hollywood Plan) was unsupported by anything other than wishful thinking" (parentheses and emphasis by author). The Judge continued that this resulted in a "manifest failure to comply with statutory requirements."

The Judge set out the burden faced by the City to achieve a legal (and rational outcome):

...if the population estimate for 2030 were to be adjusted based on what the 2010 Census data had shown, then all of the several  analyses which are based on population would need to be adjusted, such as housing, commercial building, traffic, water demand, waste produced -as well as all other factors analyzed in these key planning documents.

To its discredit, the city incredibly argued that "it was entitled by law to rely on the SCAG 2005 population estimate." The Judge disagreed. Any other conclusion would have proven "the law to be an ass" (Note 4).

Abuse of Discretion

The La Mirada Avenue Neighborhood Association argued that the city of Los Angeles had failed to exercise "good faith effort at full disclosure," contrary to the requirements of California environmental law. Judge Goodman appeared to agree, finding that the city of Los Angeles had abused its discretion, noting "A prejudicial abuse of discretion occurs if the failure to include relevant information precludes informed decision-making and informed public participation, thereby thwarting the goals of" the environmental process.

Inaccurate Population Estimates and Projections

This is not the first time that Southern California population projections have been so wrong. With more than a century of explosive population growth, more recent trends may have eluded some of the planning agencies. In 1993, SCAG projected that the city of Los Angeles would reach a population of 4.3 million by 2010. SCAG's predicted increase of more than 800,000 materialized into little more than 300,000. This is not to suggest that projecting population is an exact science, nor that SCAG has been alone in its inaccuracy.

In 2007, the state's official population projection agency, the Department of Finance projected that Los Angeles County would reach 10.5 million residents in just three years. But the 2010 US Census counted only 9.8 million residents (See 60 Million Californians? Don't Bet on It). In contrast with the previously accustomed growth from other parts of the country, Los Angeles County lost a net 1.2 million residents to other parts of the nation while the rate of immigration fell.  

Not a Unique Problem

This instance of overinflated and inaccurate projections is not unique to Los Angeles. The use of out-of-date or erroneous information is increasingly being used in regional planning. Recently, the Association of Bay Area Governments and the Metropolitan Transportation Commission approved the San Francisco Plan Area Plan, which used population projections substantially higher even than those of the Department of Finance (despite that agency's previous over-optimism).

As in Los Angeles, Plan Bay Area also used outdated data for automobile greenhouse gas emission factors that have long since been rendered obsolete by technological advancements. Other planning agencies around the nation have engaged in similar practices.

Planners in the Bay Area, SCAG and elsewhere in California are using similarly flawed projections that presume a substantial change in housing preferences toward multifamily and smaller lots. Yet, years later, the projected trends have not emerged in any significant way (See: A Housing Preference Sea-Change: Not in California).

Wishful Thinking: No Basis for Action

Judge Goodman's decision could have relevance well beyond Los Angeles and the state of California. Regional plans must be based upon current and reliable data, no matter how late received.  To proceed based on faulty data is no different than not changing course when an iceberg appears in the navigation path. Wishful thinking has no place in rational planning.

--------

Note 1: The Hollywood rail stations are on the Red Line subway, which was projected to carry 300,000 daily riders by 2000. The Red Line is carrying approximately 170,000 daily riders and would three-quarters more to reach the projection for more than a decade ago (see: Report on Funding Levels and Allocations of Funds, Urban Mass Transportation Administration, 1991, page B-49)

Note 2: The plaintiffs also argued that the Hollywood Plan's densification would result in additional traffic congestion. This is a serious concern, given Hollywood's central location in the second most congested metropolitan area in North America (following Vancouver, which recently ended the decades long reign of Los Angeles). Greater traffic congestion is associated with higher population densities.

Note 3: LA Weekly said that the fault might be capable "of opening the Earth, splitting buildings in half" (See: How the Hollywood Fault Made Millennium's Future Uncertain, and L.A. a Laughingstock).

Note 4:  "The law is an ass" (as in a donkey) refers to cases in which the law is at odds with common sense. This phrase was used by Charles Dickens, but appears to have first been used in a play as early as 1620.

Wendell Cox is a Visiting Professor, Conservatoire National des Arts et Metiers, Paris and the author of “War on the Dream: How Anti-Sprawl Policy Threatens the Quality of Life.

Photograph: Los Angeles City Hall (by author)


Public Engagement Miracle on 24th Street

$
0
0

Confrontation and conflict are the favorite dispute resolution tools of Baby Boomers, who were born in the aftermath of WWII and grew up in the rebellious ‘60s. In stark contrast, members of the Millennial generation, born 1982-2003, bring a spirit of collaboration and consensus to solving any problem they encounter. A great example of the difference this generational distinction can be seen in the parents at the LA Unified School District’s 24th Street school, most of whom are Millennials in their twenties or early thirties, in how they resolved  the dispute over the school’s future.

Located near the 10 freeway and Western Avenue in a predominantly Hispanic, hardscrabble neighborhood, the school appeared regularly on the District’s list of academic underperformers. Beyond poor learning outcomes, the parents at the school were upset by LAUSD’s apparent unwillingness to address their complaints about cleanliness and health issues in the schools including non-functioning bathrooms and dead animals on the premises.  They also felt the principal had a tendency  to use suspensions and a police presence as the way to enforce discipline. Before California’s Parent Trigger law gave parents the legal status to challenge incumbent administrators, the parents had organized a protest designed to remove the principal, but LAUSD failed to respond to their request.  

So when organizers for the Parent Revolution non-profit that originally conceived of the Parent Trigger law contacted the school’s parents in May  2012, they found a group that was  prepared to spend long hours in the grinding work of organizing their peers into a cohesive and unified force that LAUSD would have to deal with. The parents knocked on doors and handed out flyers at the school inviting mothers to come to a nearby park where they met every Thursday after dropping off their kids at school. The “parent union” leaders surveyed all the other parents to determine what they liked or didn’t like about the school and encouraged those interested to attend the Public School Choice programs LAUSD ran to learn more about school reform options. Dissatisfied with what the District’s processes, the parents who came to the park elected a steering committee that met every Monday morning to organize the Thursday discussions.

The discussions led to an emerging consensus on the changes the parents wanted to see at the school site.  They wanted to make sure that children with special needs had the right level of support services and the restoration of the preschool Early Education Center the district had eliminated due to budget cuts.  They demanded that dead animals, including gogs and rats, and other health hazards be addressed immediately. But the demand that brought about a real transformation of the conflict at the school and changed its culture in the most fundamental way was their insistence that everyone “play nice” together. They wanted LAUSD’s K-5 24th St. school and the Crown Prep charter school that ran a somewhat competing 5-8 charter school at the same site to embrace a spirit of collaboration addressing  the needs of the children, not necessarily their individual institutional interests.

On January 17, 2013, about nine months after they were first contacted by Parent Revolution, the parents submitted a “parent trigger” petition to LAUSD, asking that the school be reconstituted under the federal No School Left Behind law’s guidelines for underperforming schools. Unlike other instances in California when such a petition has been presented to a school district’s board, LAUSD, under the guidance of its reform minded superintendent, John Deasy, responded positively to their request.  Eight Letters of Intent were presented to the parents from entities that wanted to take over its operations, including ones from Crown Prep and LAUSD.

The parents formed a committee, which met every day from 8:30 AM until 2:30 PM, to review these proposals. They presented all the ideas to the parents at the weekly Thursday meetings and asked each bidder to come to the park and talk to them. On the day of LAUSD’s presentation it rained continuously, but Superintendent John Deasy stayed to talk to the parents about how to find common ground.

Finally, the parents reached a consensus on how to restructure the school. They wanted to retain the college prep focus of the existing charter school, but they didn’t want an organization with little expertise in elementary education taking over K-4. So they asked LAUSD and Crown Prep to establish a collaboration on behalf of their children. If both entities would agree, a brand new LAUSD school with a new principal and new teachers would have responsibility for kindergarten through fourth grade on the campus and Crown Prep would have uncontested responsibility for grades 5-8.  Parents wanted both organizations to agree in writing that children would be on a college readiness track when they went to high school and that both organizations would share professional development of the 24th St. School teachers to ensure a seamless environment on the two school campus, including coordination of schedules. 

Then a miracle happened. The two competing bidders found a way to agree with the parent’s unprecedented request. They signed an addendum to their bids acceding to the parents’ wishes. The parents voted their approval on April 10, 2013, just about one year after their organizing activities had begun.  A newly responsive LAUSD school board approved this innovative new concept one week later and parents became part of the committees that interviewed prospective principals and teachers for their school. The newly reconstituted school opened in the fall of 2013, with a new principal and a new set of teachers who, in the words of one of the parents, “have lots of new ideas and a strong desire to work on behalf of los niños.”   The early education center is scheduled to reopen in January, 2015.  

When it came time for LAUSD to decide whether to retain the services of Superintendent Deasy, one of the most eloquent speeches on his behalf was delivered by a parent from the 24th St. School who recalled that day in the rain in the park as evidence of Deasy’s commitment to the children of Los Angeles. A school board riven by differences in personality and policy was taught a lesson about how to work in a more collaborative way by the Millennial parents who had embodied this new spirit in everything they did. As Boomers age and fade from their current leadership roles, perhaps more institutions will find a way to embrace Millennial values and behaviors that have already brought “a smile instead of tears” to the faces of the children of the 24th St. school in the City of Angels.


Morley Winograd and Michael D. Hais are co-authors of the newly published Millennial Momentum: How a New Generation is Remaking America and Millennial Makeover: MySpace, YouTube, and the Future of American Politics and fellows of NDN and the New Policy Institute.

The Metro Areas With The Most Economic Momentum Going Into 2014

$
0
0

America’s economy may be picking up steam, but it remains a story of parts, with the various regions of the country performing in often radically divergent ways.

To identify the regions with the most momentum coming out of the recession, we turned to Mark Schill, research director for the Praxis Strategy Group, who crunched a range of indicative data from 2007 to today for the nation’s 52 largest metropolitan statistical areas. To gauge economic vitality, we used four metrics: GDP growth, job growth, real median household income growth and current unemployment. To measure demographic strength we looked at population growth, birth rate, domestic migration and the change in educational attainment. All factors were weighted equally.

Our assumption is that strong local economies attract the most people and create the best conditions for family formation, which in turn generates new demand. Strong productive industries drive demand for such things as heath care, business services and retail, as well as single-family houses, a critical component of local growth and still the aspirational goal of the vast majority of Americans. This, of course, depends on economic factors, which drive perceptions of better times and provide the income necessary to qualify for a mortgage.

Our results are based on metrics often overlooked in assessments that are focused primarily on either asset inflation — stocks or out-of-control housing prices — or are built around anecdotal, cherry-picked data from, for example, just one part of a metropolitan region. Despite all the attention lavished on places like Manhattan or Chicago’s central core, virtually all the fastest-emerging economies coming out of the recession are either in the Southeast, Texas, the Great Plains or the Intermountain West. Of our top 10 metro areas, only one is on the east or west coast: 10th-ranked San Jose/Silicon Valley.

Most of the strongest local economies combine the positive characteristics associated with blue states — educated people, tech-oriented industries, racial diversity — with largely red, pro-business administrations. This is epitomized by our top-ranked metro area, Austin, Texas, which has enjoyed double-digit growth in GDP, jobs, population and birthrate since 2007. The Texas capital has a very strong hipster reputation, attracting many of the same people who might otherwise end up in Silicon Valley or San Francisco, but it also boasts the low taxes, light regulation and reasonable housing prices that keep migrants there well past their 30s.

As has been the case for most of the past five years, Texas cities are clearly the place to be in terms of job creation, wealth formation and overall growth. All the other major Lone Star cities place highly on our list, including second-place San Antonio and Houston (fourth). Clearly many parts of the Sun Belt have not died off, as many Eastern pundits gleefully predicted during the recession. The migration of Americans southward, thought by the Eastern press to have petered out, has resumed, particularly to Texas and Sun Belt cities with strong economies.

One critical factor propelling growth has been the energy revolution, which is rapidly transforming big swathes of middle America into a production hub for fossil fuels and the best place to secure cheap electric power. Besides the Texas cities, other energy capitals doing well including Salt Lake City (No. 3) and Denver (No. 7) — both of which also boast burgeoning tech sectors — as well as Oklahoma City (No. 8).

One canary in the coalmine suggesting future dynamism is a rising share of highly educated people in the population. Places like Nashville, Denver and Salt Lake are all getting smarter faster, increasing their numbers of educated people faster than “brain” regions such as Seattle (14th), San Francisco (22nd), Boston (26th), New York (31st), Chicago (40th) and Los Angeles (44th). Another survey looking at areas that have gained the most young college graduates since 2006 found similar trends, with Nashville, New Orleans, Dallas, Austin, San Antonio and Houston among the leaders. More important still, in these high- growth cities, educated labor is not tethered to the current social media bubble, but to more diverse industries such as medical services, energy, manufacturing and business services.

Other evidence of these areas’ dynamism includes high rates of birth and family formation. After several years of declines, the nation’s fertility rate now appears to be rebounding somewhat, with some demographers predicting we may on the cusp of a “birth bounce,” in part as millennials start entering their 30s. Certainly this welcome trend will accelerate if the economy continues to gain strength.

So where will these new families likely settle? With the exception of  Washington D.C. (12th), virtually all the areas with the fastest projected rates of household formation are in the Sun Belt, led by Houston, which is expected to add 140,000 new households by 2017, the largest increase in the nation, nearly twice as many as much larger New York. Indeed despite some of the most active homebuilding in the nation, the energy capital clearly needs more homes; sales have been so strong that it has now reached the lowest inventory in recent history.

Critically, most of these cities embrace growth, whether in their urban cores or suburban peripheries. In contrast, some strong economies, such as San Jose and San Francisco, are also among the most restrictive in terms of new construction, leading to ever escalating prices that tends to force 30-somethings and families out of the region. High housing costs also play a depressing role in always hyped New York, as well as Los Angeles and Chicago; all suffer high rates of domestic out-migration and depressed household formation. Chicago is now projected to have virtually no job growth next year, not a good sign in an economy that remains well below its 2007 employment level.

What other regions are likely to lag, even amid a strengthening recovery? The list includes Sun Belt metro areas where the housing bubble hit hardest and job growth has not revived, such as Las Vegas (51st) and Riverside-San Bernardino, Calif. (49th). In these cities real per capita household income remains almost 20% below 2007 levels. With fewer people able to afford new homes, these areas have roughly 8% fewer jobs than five years ago.

Other bottom-dwellers include several industrial cities where even a resurgence in manufacturing has failed to erase the catastrophic losses suffered in the recession. Detroit ranks dead last at 52nd; Providence, R.I., 50th; and Cleveland 48th. All three have fewer people than in 2007 and at least 5% fewer jobs than.

These differentials between regions could widen further in the future, as the impact of the energy revolution deepens and the current social media craze begins to die down. This happened after the first dot-com bust at the beginning of the last decade, sending roughly half of California’s tech workers out of the industry or out of the state.

Sky-high housing costs, coupled with stricter mortgage restrictions, could accelerate the development of new, less pricey tech centers, including Seattle, New Orleans (16th) and Pittsburgh (19th). Once the venture capital punch bowl is removed, it is likely the surviving social media firms will need to find more affordable places to locate, if not their leading researchers, at least much of their marketing and administration.

Looking across the board, it seems likely that the best places to look for work, or invest, will be those that have diversified their economies, kept costs down and attracted a broad cross-section of migrants from other parts of the country. These may not all be the favored cities of the media, or the pundit class, but they are the places offering a variety of positives to residents at every stage of life. These balanced regions are the places employers and families are most likely to flock to. Such places have not only transcended the worst effects of the recession, but seem primed to take advantage of a nascent expansion that could redraw the map of the country.


2014 Regions to Watch Index
RankRegion (MSA)ScoreGDP Growth, 2007-2012Job Growth, Aug-Oct 07-13Population Change, 07-12Unemplymt Rate 2013Median Real Hshld Inc Growth, 07-12Dommestic Mig Rate 10-12Birth rate, 10-12Pt Change in Educ. Attain Rate, 07-12
1Austin82.821.7%11.8%16.3%5.4%-5.4%17.014.22.2%
2San Antonio69.711.2%6.2%11.1%6.2%0.4%9.214.22.2%
3Salt Lake City69.410.7%3.7%8.3%4.4%-5.3%0.817.03.0%
4Houston67.712.3%9.2%11.5%6.3%-4.7%5.215.31.9%
5Nashville64.411.5%6.5%8.4%6.7%-8.4%7.013.34.0%
6Dallas62.99.3%6.4%10.2%6.2%-6.0%6.914.71.7%
7Denver62.16.6%3.4%9.4%6.6%-5.7%8.213.43.4%
8Oklahoma City61.49.2%5.3%8.1%5.1%-3.1%7.114.30.7%
9Raleigh58.88.9%2.9%14.9%6.8%-6.3%10.913.20.6%
10San Jose58.215.3%2.6%7.3%6.7%-2.2%-1.313.42.7%
11Portland55.923.6%-0.7%7.1%7.1%-7.1%4.812.22.5%
12Washington55.38.0%2.9%9.1%5.6%-4.2%2.313.80.9%
13Minneapolis54.06.1%1.2%4.7%4.7%-6.3%0.013.02.6%
14Seattle52.39.0%0.8%7.5%5.8%-7.2%3.912.61.6%
15Columbus49.62.2%2.5%5.6%6.2%-6.2%1.413.51.7%
16New Orleans49.28.6%3.7%11.9%7.1%-16.7%6.113.21.1%
17Baltimore49.28.2%1.9%3.2%7.2%-5.1%0.112.23.0%
18Louisville48.45.6%0.7%4.0%7.9%-3.4%0.212.72.9%
19Pittsburgh46.74.6%2.6%0.1%6.7%-0.1%1.410.02.9%
20Richmond46.74.8%-0.2%4.9%6.0%-9.7%2.412.02.4%
21San Francisco46.33.7%-1.0%6.5%6.4%-8.1%2.311.92.2%
22Indianapolis45.93.3%1.5%5.6%7.1%-11.9%1.114.21.9%
23Charlotte45.64.5%1.9%10.1%8.5%-11.0%7.813.00.9%
24Grand Rapids45.0-2.4%3.6%2.4%6.6%-6.7%0.913.31.9%
25Kansas City44.93.9%-1.1%4.3%6.5%-8.0%-1.113.61.9%
26Boston44.97.6%3.0%4.3%6.4%-4.9%-0.111.21.1%
27Virginia Beach42.02.2%-1.5%2.2%6.0%-7.8%-3.413.41.8%
28Phoenix41.7-4.8%-6.3%7.8%7.0%-14.5%4.813.72.6%
29Birmingham41.40.7%-6.5%2.7%5.8%-10.5%-1.713.72.6%
30Buffalo41.42.0%1.0%-0.3%7.3%1.2%-2.510.52.5%
31San Diego40.6-1.0%-1.9%6.8%7.3%-11.8%0.214.31.3%
32Philadelphia39.11.9%-1.9%2.3%8.1%-6.9%-2.412.32.8%
33Atlanta38.9-0.5%-1.5%7.7%8.1%-13.7%3.213.61.2%
34New York38.91.9%1.6%3.1%7.9%-6.1%-5.812.71.9%
35Milwaukee37.60.3%-3.8%2.4%7.1%-8.6%-2.913.12.0%
36Jacksonville37.6-5.4%-3.3%5.4%6.6%-16.2%3.512.82.1%
37St. Louis35.80.2%-3.6%1.5%7.2%-10.1%-3.712.32.6%
38Cincinnati35.61.3%-3.4%2.1%7.0%-9.0%-3.012.91.4%
39Tampa33.5-3.4%-2.4%4.3%6.9%-14.0%5.910.91.0%
40Chicago33.00.2%-2.5%2.0%9.1%-9.7%-5.913.22.5%
41Orlando32.9-5.7%-2.0%8.1%6.6%-18.3%7.412.0-0.2%
42Rochester32.8-2.2%0.2%1.0%6.9%-9.3%-3.211.01.6%
43Miami32.3-4.3%-3.9%6.3%7.4%-14.4%3.811.60.9%
44Memphis31.2-4.0%-5.8%3.0%9.6%-9.8%-1.714.51.7%
45Los Angeles31.1-2.5%-4.6%3.3%8.9%-10.9%-3.213.51.8%
46Hartford29.1-6.9%-1.0%1.3%8.0%-6.4%-5.010.02.2%
47Sacramento26.4-6.0%-7.9%5.5%8.3%-14.1%0.812.90.5%
48Cleveland25.1-1.9%-5.5%-1.3%7.0%-12.1%-5.811.01.7%
49Riverside23.6-9.0%-8.1%7.0%10.1%-18.5%2.314.90.4%
50Providence23.4-0.4%-4.2%-0.1%9.1%-9.4%-4.310.51.4%
51Las Vegas21.6-10.4%-8.6%7.1%9.6%-20.1%1.513.80.7%
52Detroit18.3-6.0%-5.6%-1.9%9.7%-13.5%-4.711.51.8%

Analysis by Mark Schill, Praxis Strategy Group, mark@praxissg.com

Data Sources: Bureau of Economic Analysis, Bureau of Labor Statistics, U.S. Census Population Estimates Program, U.S. Census American Community Survey

This story originally appeared at Forbes.

Joel Kotkin is executive editor of NewGeography.com and Distinguished Presidential Fellow in Urban Futures at Chapman University, and a member of the editorial board of the Orange County Register. He is author of The City: A Global History and The Next Hundred Million: America in 2050. His most recent study, The Rise of Postfamilialism, has been widely discussed and distributed internationally. He lives in Los Angeles, CA.

Street Furniture for 'Sitable' Cities

$
0
0

How can street furniture improve not only the walkability, but the sustainability of a city?

The completely self-sustaining city may seem like a pipe-dream to some, but as with all outwardly impossible tasks, it all starts with the first step. Urban planners have focused on making communities more walkable by improving public spaces and sidewalks. Large, pedestrian-only areas inspire people to shop, interact with others, and simply enjoy spending time in their community. Wider, safer sidewalks encourage pedestrians to walk, rather than drive from place to place.

The walkability of city can be largely impacted by street furniture. If you’ve just envisioned a living room set sitting haphazardly in the middle of a sidewalk, you’re actually not that far off. Street furniture is a broad term that encompasses everything from benches to traffic signals, and you’ve likely encountered many examples without even realizing it.

Seating placed in prime locations – where people work, shop, and eat – encourages pedestrians to linger, benefitting both the economics and the feeling of community. “Sitting, in order to rest, converse, beg and sell is what people have always done, and captures a major part of urban life. Sitting with style, grace, safety and reflection is a major element of “place capital”—an increasing buzzword for urban success,” points out Chuck Wolfe, who has written about "sit-able" cities.

Building benches and other public seating out of green resources such as rapidly renewable plant material (bamboo and straw), recycled materials, and other reusable products adds to sustainability goals.

Both walkability and 'sitability' are dependent on a safe atmosphere. If a sidewalk isn’t safe, pedestrians aren’t going to use it. Proper maintenance and lighting are incredibly important. Sidewalk safety features include curb extensions, striped crosswalks, and pedestrian rails.

Also helpful: planting strips, areas of grass or vegetation between the street and the sidewalk that make pedestrians feel less exposed. Besides being a sustainable safety feature, planting strips benefit the environment by absorbing carbon dioxide from automobile emissions. They also assist with water drainage, helping both overtaxed storm drains and the natural aquifer.

Bollards direct foot traffic and maintain a barrier between pedestrians and motorized vehicles. Sustainable metal bollards — like the ones we create at Reliance Foundry— are designed using an environmentally safe powder-coating that reduces peeling and chipping. Sustainable bollards can also be made from wood or recycled plastics. Bollards are commonly used in community areas to create pedestrian only zones, limiting vehicle use and carbon emissions.

Streets that foster relaxation also benefit from recycling. Many large cities have implemented curbside recycling services, making it easier for householders to reduce their ecological footprint. The same progress that led to curbside recycling is now leading to recycling bins in public areas. The purpose is to reduce street and sidewalk litter, and to help people recycle when they’re out on the town.

Street furniture is a funny thing; sometimes you only notice it by its absence.

Robert Dalton is a writer and green-freak from Portland, Oregon (go Ducks!). He writes on behalf of Reliance Foundry, a supplier of innovative bollards and other site furnishings.

Flickr photo by Diane Duane: Longhorn Bench, Freiburg-in-Breisgau, Germany

Neither Party Dealing with More-Rigid Class Structure

$
0
0

President Obama’s most-recent pivot toward the issue of “inequality” and saving the middle class might be seen as something of an attempt to change the subject after the health care reform disaster. As the Washington Post’s reliably liberal Greg Sargent explains, this latest bit of foot work back to the “old standby” issues provides “a template for the upcoming elections, one that allows Dems to shift from the grinding war of attrition over Obamacare that Republicans want to the bigger economic themes Dems believe give them the upper hand.”

True, there’s something mildly risible about appeals to populism offered by a president whose economic record looks more like Herbert Hoover than Franklin Roosevelt. Some 95 percent of the income gains during President Obama’s first term flowed to barely 1 percent of the population, while incomes have declined for 93 percent of Americans. As one writer at the left-leaning Huffington Post put it, “[T]he rising tide has lifted fewer boats during the Obama years – and the ones it's lifted have been mostly yachts.”

Diminished prospects – what some describe as the “new normal” – now confront a vast proportion of the population, with wages falling not only for noncollege graduates but also for those with four-year degrees. Overall, median incomes for Americans fell 7 percent in the decade following 2000 and are not expected to recover, according to some economic models, until 2021.

This decline has infected the national mood. Today, more middle- and working-class Americans predict that their children will not do better than they have done.Overall, almost one-third of the public, according to Pew, consider themselves “lower” class, as opposed the middle class, up from barely one-quarter who thought so in 2008.

It’s not surprising, then, that the vast majority of Americans believe the president’s economic policy has been a dismal failure, at least for the middle and working classes. Federal Reserve monetary policy, in particular, appeared to favor the interests of the wealthy over those of the middle, yeoman class. “Quantitative easing,” notes one former high-level official, essentially constituted a “too big to fail” windfall for the largest Wall Street firms, and did little for anyone else. Faith in the economy, despite the soaring stock market and increased price of assets, has remained weak. Americans by a 2-1 margin rate the economy negatively.

These realities helped spark both the Tea Party and the Occupy movements and underpin the support for such disparate figures as Sarah Palin and Elizabeth Warren. At the same time, outrage at our current economy has undermined public esteem for almost every institution of power – from government and large corporations to banks and Wall Street – to the lowest point ever recorded.

Money goes to money

This repudiation reflects the fact that neither major political party seems ready to address the emergence, over time, of a class structure more rigid, and arguably less-penetrable, than in the past. Increasingly, wealth adheres to those who are best-positioned, by hereditary wealth and education, to take advantage in the evolving economy. In contrast, those born with fewer resources, even if they work hard, find moving up in society increasingly difficult.

To be fair, this problem well predates Barack Obama or the current Congress. Middle-class incomes have been declining, particularly compared with those of the wealthy, since the 1970s, with the decline persisting even in the relatively prosperous 1990s, with young workers starting out at incomes one-fourth lower than those of their parents.

Yet, solutions proposed to date by Obama and his fellow Democrats have done little to reverse this trend, in fact, worsening it. Whatever suffering they ameliorate, a growing reliance on food stamps and extended unemployment insurance, as Walter Mead points out, often ends up creating an unhealthy dependence on the state and fails to address the cultural issues associated with long-term poverty.

Some Obama proposals, like increasingly affirmative action, seem more like a nod to favored party constituencies than an elixir for the economy. Others, such as an increased minimum wage, promise benefits for some, but could also dry up sources of employment, particularly for part-time and new market entrants, particularly young workers.

Overall, “blue” policies, as currently constituted, have not been notably effective in reducing poverty or increasing upward mobility. Locales with the nation’s greatest levels of inequality, and the most rapid decline of the middle classes, are generally found in progressive bastions,such as New York and California.

Capitalism undercut

But let’s be clear: There is not much here that the Right should be giddy about. The inability of market capitalism to provide more people with a higher standard of living, and increased opportunity, undermines the fundamental promise of free markets. The spread of prosperity from 1950-2000, bolstered conservative, even libertarian, perspectives as the middle class and property ownership expanded. Now, with homeownership in decline and middle-class incomes stagnating, the appeal of “democratic capitalism” marketed by the Right has been somewhat diminished.

To address this challenge, conservatives need to acknowledge that economic inequality and rising class divisions stand as our nation’s existential political issue. Yet for the most part, their response has been largely to cut benefits to the poor amid hard times. Perhaps since they do not acknowledge the emerging credibility crisis facing capitalism, they feel little reason to address it.

This story originally appeared at The Orange County Register.

Joel Kotkin is executive editor of NewGeography.com and Distinguished Presidential Fellow in Urban Futures at Chapman University, and a member of the editorial board of the Orange County Register. He is author of The City: A Global History and The Next Hundred Million: America in 2050. His most recent study, The Rise of Postfamilialism, has been widely discussed and distributed internationally. He lives in Los Angeles, CA.

NewGeography's Top Stories of 2013

$
0
0

A new year is upon us, here’s a look back at a handful of the most popular pieces on NewGeography from 2013. Thanks for reading, and happy New Year.

12. Gentrification as an End Game, and the Rise of “Sub-Urbanity” In January Richey Piiparinen points out that gentrification driven by affluent young people moving back to the city might be creating “a ‘sub-urbanity’ that is emerging when the generalization of gentrification meets the gentrification of the mind.”

11. The Cities Winning the Battle for the Biggest Growth Sector in the U.S. Joel and I put this index together to measure growth and concentration of the professional, technical, and scientific services sector among the nation’s largest metropolitan areas. As high-end services become easier to export, this sector is becoming a critical region-sustaining sector in many parts of the country. This piece also ran at Forbes.com.

10. A Map of America’s Future: Where Growth will be Over the Next Decade Working with Forbes Magazine in September, Joel and I laid out seven regions and three city-states across the nation. Regional economic diversity is one of America’s most critical attributes.

9.  The Dutch Rethink the Welfare State Nima Sanandaji outlines the trajectory of the social services culture in the Netherlands.

8.  Suburb Hating is Anti-Child In this provocative, widely-discussed piece, Mike Lanza takes it to politicians and commentators who advocate against suburbs, pointing out that “we need to fix suburbs and the way families utilize them,” but “what we shouldn’t do is try to force families to live in dense city centers.”

7.  Fixing California: The Green Gentry’s Class Warfare Joel Kotkin points out that many green policies are pro-gentry and anti-middle class, particularly in California. This piece originally appeared at U-T San Diego.

6.  How Can We Be So Dense? Anti-Sprawl Policies Threaten America’s Future In this piece from Forbes, Joel Kotkin argues that high-density housing advocates should be open to a broader range of housing options because policies pushing high density often favor real estate investors over the middle class and the concept of upward mobility.

5.  Class Warfare for Republicans Joel takes the Republican Party to task for ignoring the issue of class and small business growth in favor of rhetoric about social conservatism, gun control, and free market idealism. This piece originally ran in the Orange County Register.

4.  Houston Rising: Why the Next Great American Cities Aren’t What you Think In this piece from The Daily Beast, Joel argues that a city’s most important quality is its ability to foster upward mobility and to sustain a middle class, not its urban form.

3.  The New Power Class Who Will Profit from Obama’s Second Term Who stands to benefit most from the second Obama administration? Joel argues that it’s the plutocrats of Silicon Valley and new media industries and the clerisy of academia. This piece originally appeared at Forbes.com.

2.  Why are there so Many Murders in Chicago? Aaron Renn lays out seven possible reasons contributing to violent crime in Chicago and calls for an adjustment in strategy to fight it.

1.  Gentrification and its Discontents: Notes from New Orleans The most read piece of the year is this excellent expose of gentrification and its impact on the culture and age demographics of New Orleans by local geographer Richard Campanella.

Mark Schill is a community strategist and analyst with Praxis Strategy Group and New Geography's Managing Editor.

Viewing all 4176 articles
Browse latest View live