Quantcast
Channel: Newgeography.com - Economic, demographic, and political commentary about places
Viewing all 3793 articles
Browse latest View live

Where the World’s Tallest Buildings are Concentrated

$
0
0

Over the past two decades, an unprecedented number of tall buildings have been constructed around the world. The world of skyscrapers began to change rapidly in 1998, with the completion of the Petronas Towers, twin towers in Kuala Lumpur (Malaysia). These 482 meter (1,483 foot) structures ended the quarter century reign of the Willis Tower (Sears Tower---442 meters, 1,451 feet) in Chicago.

In the past, the United States had been exercised something of a near monopoly in skyscrapers. As late as 1962, nine of the world’s tallest buildings were south of 59th Street in Manhattan. The world had changed little by 1981, when Manhattan still had five, Chicago three and the US nine of the top 10. Toronto had joined the top ten, in ninth place (see: 125 Years of Skyscrapers). Now, only one of the tallest 10 is in the United States, One World Trade Center in lower Manhattan.

This article provides a summary of the 10 world municipalities with the greatest concentration of the tallest buildings (150 meters or 492 feet and more). The information is from the The Skyscraper Center, the database (accessed 24 January 2018) of the Council on Tall Buildings and Urban Habitat which provides a information on all 150 meter (492 feet) and higher buildings, by city. East Asia is dominant, with seven of the top 10 municipalities with the tallest buildings. Of the top ten, seven are in East Asia which also accounts for 18 of the top 25 (Graphic 1).

Hong Kong: Hong Kong has taken the title of the most 150 meter (492 feet) buildings away from New York, with The Skyscraper Center indicating its count at 317 to New York’s 257. However, this dominance includes only one building among the world’s Top 10 tallest, the International Commerce Center (Graphic 2).

Hong Kong may be the ultimate in the dispersion of tall buildings, as Graphics 2 and 3 indicate. Beyond the sectors in the two graphics, there are a number of other communities with very tall residential buildings.

Graphic 2 shows Hong Kong, with the commercial core of Central, a part of Hong Kong Island, at the bottom, Hong Kong Harbor in the middle (actually it is more of a strait than a harbor) and Kowloon across the harbor. The tallest buildings, and most of the tallest commercial buildings are located on Hong Kong Island. Across the harbor, Hong Kong’s tallest building is now located in Kowloon (completed in 2010), the International Commerce Centre. Kowloon has very tall residential buildings, but most are much farther to the north or east, nearer to the mountains.

Graphic 3 shows northern Kowloon from the air, with many tall residential buildings. Across the mountains, more tall residential buildings are evident in Sha Tin, which is in the New Territories. The New Territories how holds the majority of Hong Kong’s population. Also visible in the upper right corner is Ma On Shan, with more tall residential towers. Tai Po, again with tall residential towers, can be partially seen over the mountains from Sha Tin.

The other Pearl River Delta cities have almost as many 150 meter buildings as Hong Kong (Shenzhen, Guangzhou, Dongguan, Macao and Zhuhai). With a total of 593 150 meter buildings, the Pearl River Delta has nearly 15 percent of the 150 meter buildings out of the top 200 cities ranked by The Skyscraper Center (this includes all cities with more than one such building).

New York: For at least 100 years from the completion of the New York World (newspaper) building in 1890, New York dominated the world in skyscrapers. With virtually all of those buildings concentrated on Manhattan, south of Central Park, New York boasted indisputably the most impressive skyline in the world. But, New York has now relinquished the crown to Hong Kong.

New York ranks second to Hong Kong. Graphic 4 is a northeasterly view of Midtown Manhattan and includes the Chrysler Building, first to reach 300 meters and briefly the tallest in the world. The photograph is taken from the Empire State Building, which was the tallest in the world for four decades, the longest reign of any building in more than 125 years of skyscraper history. There are also a number of more than 150 meter buildings in the rest of Midtown, as well as in Lower Manhattan, where the country’s tallest building, One World Trade Center, is located. One World Trade Center is now the 6th tallest building in the world, but will be bumped out of the top ten by the early 2020s with the taller buildings currently under construction. For the first time in skyscraper history none of the tallest 10 buildings will be in the United States.

Dubai: Third, where virtually all of its tallest buildings have been built in the 2000s, ranks third, with 177. The tall buildings of Dubai are widely dispersed, many along the 12-lane Sheikh Zayed Road. Graphic 5 shows the world’s tallest building, the Burj Khalifa is located to the right of the freeway. Dubai has by far the largest number of buildings of 300 meters or more. Guangzhou, with 9, is the closest to Dubai in 300 meter buildings. Just to the north of Dubai, is another municipality, Sharja, which ranks among the top 100 in 150 meter buildings.

Tokyo: Tokyo has the fourth largest number of 150 meter buildings, at 145. Graphic 6 shows the skyscrapers that have developed over the past two decades near Shinjuku Station, well to the west of the traditional central business district near Tokyo Station.

Shanghai: Shanghai ranks fifth in tallest buildings, with 141. Graphic 7 is a view of Pudong (Lujiauzi) across the Huang Pu from the Bund (see A Tour of the Bund in Shanghai). The world’s second tallest building is shown (Shanghai Tower). Shanghai’s traditional central business district is located in Puxi (west of the Pu), which has fewer tall buildings, but includes the popular tourist destination, East Nanjing Road.

Shenzhen: Shenzhen is tied with Chicago in tallest buildings, with 119. Graphic 8 is a view of Shenzhen. Shenzhen is now home to the world’s fourth tallest building (Ping An Finance Centre). Like many Chinese cities, Shenzhen’s tall buildings are widely dispersed. Shenzhen is particularly impressive, because the current city was largely rural (virtually no urbanization), as late as 1980. Today, its population is more than 10 million.

Chicago: Chicago is tied with Shenzhen in tallest buildings, with 119. Graphic 9 is the Chicago Loop from the Kennedy Expressway, including the Willis Tower, the world’s tallest until 1998. Chicago is considered the “birthplace” of the skyscraper.

Chongqing: Eight ranked Chongqing has 112 of the tallest buildings. Graphic 10 is of Chongqing’s central business district, which has one of the most dominant central business districts in China, somewhat similar to North American central business districts (See: Downtown China).

Guangzhou: Ninth ranked Guangzhou has 103 of the tallest buildings. Guangzhou has 9 buildings over 300 meters, second in the world only to Dubai. Graphic 11 shows the two tallest, across the street from one another, in the Tianhe district, the Guangzhou CTF Finance Center, 7th tallest in the world, and the Guangzhou International Finance Centre, 16th tallest in the world.

Singapore: Tenth ranked Singapore has 84 of the tallest buildings. Graphic 12 shows part of the central business district of Singapore from the Marina Bay Sands Hotel.

The Asian Concentration to Continue

Among the 25 tallest buildings currently under construction 18 are in East Asia and a total of 21 are in Asia, which includes two more in the Middle East and one in India. The Jeddah Tower, in Jeddah, Saudi Arabia will be the tallest in the world, at 1,000 meters, 170 meters higher than the Burj Khalifa in Dubai. Two of the 25 will be in New York, and two in Russia (St. Petersburg and unlikely Grozny in Chechnya). But the biggest of the big seem destined to concentrate in Asia for the foreseeable future.

Wendell Cox is principal of Demographia, an international public policy and demographics firm. He is a Senior Fellow of the Center for Opportunity Urbanism (US), Senior Fellow for Housing Affordability and Municipal Policy for the Frontier Centre for Public Policy (Canada), and a member of the Board of Advisors of the Center for Demographics and Policy at Chapman University (California). He is co-author of the "Demographia International Housing Affordability Survey" and author of "Demographia World Urban Areas" and "War on the Dream: How Anti-Sprawl Policy Threatens the Quality of Life." He was appointed to three terms on the Los Angeles County Transportation Commission, where he served with the leading city and county leadership as the only non-elected member. He served as a visiting professor at the Conservatoire National des Arts et Metiers, a national university in Paris.

Photograph: Petronas Towers, Kuala Lumpur. First skyscraper(s) outside the United States to be the tallest in the world (1998). By Ramil Sagum from tokyo, japan (Petronas Towers) [CC BY 2.0], via Wikimedia Commons


The Screwed Millennial Generation Gets Smart

$
0
0

It’s been seven years since I wrote about “the screwed generation.” The story told has since become familiar: Millennials, then largely in their twenties, faced a future of limited economic opportunity, lower incomes, and too few permanent, high-paying jobs; of soaring college debt and structural insecurity (PDF). The Census Bureau estimates that, even when working full-time, they earn $2000 less than the same age group made in 1980 (PDF). More than 20 percent of people 18 to 34 live in poverty, up from 14 percent in 1980 (PDF).

Incredibly, many pundits applauded these conditions and credited millennials, forced by economic circumstances into difficult choices, for fulfilling the old boomer dreams that the boomers themselves had long since abandoned of a less materialistic, greener future in dense and heavily planned urban environments.

The environmental magazine Grist envisioned“a hero generation” that will escape the material trap of suburban living and work that engulfed their parents. “We know the financial odds are stacked against us, and instead of trying to beat them, we’d rather give the finger to the whole rigged system,” the millennial author concludes. An editor at the same magazine declared herself a part of the GINK generation (as in “green inclinations, no kids”) that she said meant not only a relatively care-free and low-cost adult life, but also “a lot of green good that comes from bringing fewer beings onto a polluted and crowded planet.”

It has been often asserted that millennials (defined as the generation born between 1982 and 2002) do not want to buy homes or live in suburbia; Fast Company, saw this as “an evolution of consciousness.” The Guardian declares that millennials are refusing to accept “the economic status quo” while Wall Street looked forward to profiting from the idea that millennials will be satisfied to live within a “rentership society” (PDF).

But millennials, as noted in a new paper from Anne Snyder and Alicia Kurimska, aren’t embracing downward mobility but rather are increasingly creating their own aspirational strategies (PDF). Some are doing this consciously by ignoring the wise planners and establishing homes for themselves in suburban and Sun Belt locales once considered insufficiently hip.

Despite the hype from the press and urban planners, millennials are following in the footsteps of previous generations by locating on the periphery major metropolitan areas and Sun Belt cities, most of which are simply agglomerations of suburbs.

This pattern seems certain to accelerate as millennials enter their thirties, the age when contemporary populations tend to marry, settle down, and have children. To be sure, notes Pew, more 18- to 34-year-olds now live with their parents than with spouses or significant others for the first time since the question was first asked in the 1880s. But when they do leave the nest, albeit later than in previous generations, they are becoming adults whose collective decisions are not so different from those of their parents.

Their searches for homeownership and procreation reflect this trend. It turns out that millennials did not reject homeownership because of their enhanced social consciousness, but because of high prices and low incomes. In survey after survey, the clear majority of millennials—roughly 80 percent, including the vast majority of renters—express interest in acquiring a home of their own. A Fannie Mae survey of people under 40 found that the vast majority thought owning made more financial sense, a sentiment shared by an even larger share of owners (PDF). They cited such things as asset appreciation, control over the living environment, and a hedge against rent increases.

As generational researchers Morley Winograd and Mike Hais have long pointed out, millennial attitudes about family and their preferred future remained fundamentally mammalian and surprisingly conventional, albeit with a greater emphasis on gender equality. The vast majority of millennials, according to Gallup and others, want to get married and have children. Their top priority, according to Pew, is to be “good parents.”

The average millennial is now in their late twenties, and will be well into their thirties by the end of the decade. Already, 16 million millennials have had children, up from barely 6 million a decade ago, a number that is likely to soar in coming years, particularly if this group continues the recent trend of more women, and especially better educated ones, having children in their forties.

Despite endless talk about millennials as the group triggering a “back to the city” movement, census data shows that their populations in many core cities are stagnating or declining. In April 2016, the real estate website Trulia found that millennials were rushing out of expensive cities, with the group making up roughly a quarter of the population in New York and Washington, D.C., but accounting for half of all departures from them.

Its report concludes: “To summarize, those who earn very little income, those who work in unstable, less urban-based, and low-paying industries, and younger generation households that have not yet established a stable career have moved away from these pricey cities at much greater rates than the rest of the population."

Between 2013 and 2014, only 2,662 people between the ages of 25 and 34 migrated to D.C., according to census data, roughly a quarter of the 10,430 people in that age bracket who arrived between 2010 and 2011.

Since 2010, the 20 to 29 populations have declined in the core areas of much celebrated youth magnets including Chicago (-0.6 percent) and Portland (-2.5 percent). Other areas, like Los Angeles and Boston, have lost millennials since 2015.

Costs appear to be key here. According to Zillow, for workers between the ages of 22 and 34, rent costs claim upwards of 45 percent of income in Los Angeles, San Francisco, New York, and Miami, compared to closer to 30 percent of income in metropolitan areas like Dallas-Fort Worth and Houston. The costs of purchasing a house are even more lopsided. In Los Angeles and the Bay Area, a monthly mortgage takes, on average, close to 40 percent of income, compared to 15 percent nationally. In many cities millennials seem destined to live as renters, without gaining any equity in property. In San Francisco, 18- to 24-year-olds now make up one of the fastest-growing homeless populations.

A recent survey by the UCLA Luskin School suggests that 18- to 29-year-olds were the age group least satisfied with life in Los Angeles (PDF), perhaps something reflected in the overbuilt and increasingly vacant downtown market. Similarly a recent USC study found that high prices made attracting talent increasingly difficult. In the Bay Area, according to ULI, 74 percent of millennials are considering an exit, largely due to high housing prices.

In New York, incomes for people aged 18 to 29 have dropped in real terms since 2000, despite considerably higher education levels among millennials (PDF). At the same time, rents have shot up by 75 percent.

Meanwhile, the much mocked suburbs have continued to dominate population trends, including among millennials. As people age, they tend, economist Jed Kolko notes, to move out of core cities to suburban locations. Although younger millennials have tended toward core cities more than previous generations had, the website FiveThirtyEight notes that as they age they actually move to suburban locations at a still higher clip than those their age have in the past. We have already passed, in the words of USC demographer Dowell Myers, “peak millennial,” and are seeing the birth of a new suburban wave (PDF).

To some extent, the meme about millennials and cities never quite fit reality outside of that observed by journalists in media centers like New York, D.C., and San Francisco. More than 80 percent of 25- to 34-year-olds in major metropolitan areas already live in suburbs and exurbs, according to the latest data—a share that is little changed from 2010 or 2000.

Suburban tastes remain predominant with 4 in 5 people under 45 preferring the single-family detached houses most often in suburban locales (PDF). Surveys such as those from the Conference Board and Neilson consistently find that most millennials see suburbs as the ideal place to live in the long run (PDF). According to a recent National Homebuilders Association report, more than 2 in 3 millennials, including most of those living in cities, would prefer a house in the suburbs.

As millennials grow up, they are moving to the ’burbs at an even faster pace than previous generations did at the same age.

In the process, note authors Snyder and Kurimska, their generation is also changing suburbia. “These transplants value high social cohesion and want neighborhoods with walking trails and other community features like fitness centers, local shops and manmade lakes,” they observe. They may also initially at least choose smaller homes, according to Zillow, and often in places closer to work and with more things close by to do. The good news for them: The majority of new jobs continue to be created in suburbs, along with most theaters, ethnic restaurants, and music venues.

At the same time, millennials are shifting to different regions. Much of this has to do with housing costs. The income required to buy a home in Silicon Valley ($216,000), San Francisco ($171,000), Los Angeles ($115,000), or New York City ($100,000) dwarfs what is required in places like Orlando ($54,000), San Antonio ($54,000), or Nashville ($47,000).

Not coincidentally, those more affordable places are growing their millennial populations far more quickly. The Millennial homeownership rates is 37 percent in Nashville29 percent in San Antonio and 27 percent in Orlando, compared to under 20 percent in New York, Los Angeles and San Francisco.

To be sure, some millennials are moving into downtowns in these places, at least for a few years, but many more remain in what Grist called“sprawling car dependent cities.” Among the 10 major metropolitan areas whose 25- to 34-year-old populations grew most rapidly between 2010 and 2016, seven have more than 95 percent of their population in suburban or exurban settings.

In fact, most of the places with the biggest growth among millennials are highly suburban, sprawling cities. The top 10 regions with the fastest growth in their 25- to 34-year-old populations since 2000 include nontraditional urban areas such as Austin, Orlando, San Antonio, San Bernardino-Riverside, Las Vegas, Houston, Oklahoma City, and Jacksonville. In contrast, Boston ranks 40th out of 53 metro regions, New York 44th, San Jose 47th, Los Angeles 48th, and Chicago 51st.

So perhaps there is hope, after all, of millennials as a “hero generation.” As more of them follow their parents’ path to homes of their own in the suburbs and the Sun Belt’s sprawling metros, they will surely be changed by their environment and they will surely change it. Parenting, as well as homeownership, tends to make people more conservative.

While the strongest population growth now takes place in what Jed Kolko calls “the suburbiest” suburbs, those on the outer fringes, even there millennials are drawn to locations with town centers—whether restored or created—and prefer things such as bike trails and parks over golf and malls. The millennial suburb, as MIT’s Alan Berger has noted, will be different—more walkable, more environmentally sustainable, and likely more connected eventually by autonomous technologies.

While millennials may push back against the efforts of progressives, evident in California particularly, to limit suburban development that thus closes off their housing options, they will also oppose the culturally conservative agendas that long dominated many suburbs. This will be particularly true in areas attracting young minorities, such as northern Virginia, Ft. Bend County, outside of Houston, and Orange County, California.

In this sense, the millennials may be our best hope for a more reasoned future. They are unlikely—particularly as they raise families—to embrace planners’ fantasies of a high-density future. What they can accomplish is to shift the debate about how we live toward a more reasoned, collaborative, tolerant but also family-friendly direction.

That alone would make them smarter than their parents.

This piece originally appeared on The Daily Beast.

Joel Kotkin is executive editor of NewGeography.com. He is the Roger Hobbs Distinguished Fellow in Urban Studies at Chapman University and executive director of the Houston-based Center for Opportunity Urbanism. His newest book is The Human City: Urbanism for the rest of us. He is also author of The New Class ConflictThe City: A Global History, and The Next Hundred Million: America in 2050. He lives in Orange County, CA.

Photo: Via Financial Resource Center.

A Year Into Trump's Peasant Rebellion

$
0
0

A year into office, Donald Trump remains something of an unlikely figure: a self-promoting and well-heeled demagogue who leads a bedraggled coalition of piratical capitalists, southerners, and people from the has-been or never were towns of Middle America. His fiercest opponents largely come from the apex of our society: the tech oligarchy, a rabidly hostile press and the cultural and academic hegemons.

These sophisticated people see Trump as responding crudely to his sans-culottes base. To them, he threatens everything from the free press to the rule of law and common decency. Yet Trump as peasant leader matters more than his ego-driven persona. He and other wannabe populists in Europe represents a modern version of the kind of peasant rebellions that rocked the Europe of the Middle Ages and China, highlighted by the 1850 Taiping rebellion.

Autocrats against autocracy

Such bottom up uprisings, usually elicit strong opposition from the established institutions. Today they span the gap from corporate liberals to establishment conservatives. For all their surface differences, these groups tend to share similar class experiences and perspectives; they both see Trump and his supporters as inveterate racists and fascist shock troops. Retiring GOP Arizona Sen. Jeff Flake even has denounced him as a new Stalin.

To be sure much of Trump’s media commentary is intemperate but its significance, to paraphrase Shakespeare, is often “a tale of an idiot, full of sound and fury signifying nothing.” In contrast many believers in a free press had little problem when President Obama threw journalists in jail and abused the surveillance instruments of the state. Real Stalinism may be less of a threat today — despite Trump’s authoritarian posturing — than under his more polished predecessor.

Read the entire piece at The Orange County Register.

Joel Kotkin is executive editor of NewGeography.com. He is the Roger Hobbs Distinguished Fellow in Urban Studies at Chapman University and executive director of the Houston-based Center for Opportunity Urbanism. His newest book is The Human City: Urbanism for the rest of us. He is also author of The New Class ConflictThe City: A Global History, and The Next Hundred Million: America in 2050. He lives in Orange County, CA.

Photo: Matt Johnson, via Flickr, using CC License.

Indianapolis Gets Another Amazon HQ2 Win

$
0
0

After just writing about how cities like Indianapolis, Columbus, and Raleigh had already won the HQ2 competition just by making the first cut, the New York Times adds further evidence in the form of a lengthy profile on Indianapolis.

[Salesforce Indianapolis CEO] Mr. Stutz lived in Austin, Tex. (another Amazon finalist), before moving to Seattle, and watched its evolution from sleepy state capital to technology hub and hip cultural magnet. “Austin was never a cool place,” he said. “Now it’s a hotbed of cool. Indianapolis isn’t quite there yet, but I see a lot of similarities.”

Last year Bon Appétit magazine devoted a feature to the “Brooklynization of Indy” that focused on the city’s explosion of craft breweries, artisanal bakeries and farm-to-table restaurants.

Transportation facilities are also prominent on Amazon’s wish list. The city’s light-filled new international airport has been voted the best in North America for five years running by Airports Council International and the best airport in the United States for four years by readers of Condé Nast Traveler.

The airport offers multiple direct flights to Seattle, San Francisco, New York, Boston and Washington, and is about to start nonstop service to Paris.

Indianapolis’s central location and network of interstate highways earned the city its nickname, the Crossroads of America. Amazon is among the large companies with distribution centers there.

While Indianapolis lacks subways, light rail or a sophisticated urban transport network, the city is crisscrossed with bike and walking trails. Mr. Stutz said many Salesforce employees biked or walked to work (something Amazon’s Seattle employees value).

It’s hard to ask for better press than that. The fact that the article notes some of the city’s warts actually makes the piece more credible than a typical travel section style feature (e.g., 36 Hours in X). This is a home run for Indy in terms of earned media.

The NYT mentions that Salesforce has been a booster of Indy’s Amazon bid. That’s smart for them. If Indy did get HQ2, it would make it much more competitive for Salesforce to recruit to say the least. So Salesforce probably doesn’t think Indy stands a realistic shot. But they do realize that anything that raises the brand profile of Indianapolis is a big boost for their own recruiting efforts there. Smart thinking.

Of course it is possible that Indy or another city could get some Amazon presence even without the HQ2. Joe Cortright makes this very argument, in which he says Amazon will likely pick three or four cities for various HQ2 functions, so that it can continue to play them off against each other. I did not go this far in my thinking, but I do think it’s possible that a city (or multiple cities) that’s a loser in the HQ2 battle might conceivably end up with some kind of smaller Amazon office.

While there are real benefits like this NYT profile to making the Amazon cut, I don’t think cities that didn’t make it should beat themselves up too much. We really don’t know the factors that went into deciding who was in and who was out. Some of the people who are in may have been put there for pure misdirection for all we know. Maybe even Indianapolis. And being left off the list may not be reflective of the city as a whole. Cleveland, for example, has many problems, but is also one of the few place with an actual HQ2 scale entity locally in the Cleveland Clinic. In that health care space, Cleveland has proven it can attract the best talent in the world at scale. That’s just not relevant to Amazon. So while those who did make the list should feel good about it, I don’t think those who didn’t should wallow in undue negativity. As the New York Times notes, even the “losers” are potentially in line for future Amazon investments.

This piece originally appeared on Urbanophile.

Aaron M. Renn is a senior fellow at the Manhattan Institute, a contributing editor of City Journal, and an economic development columnist for Governing magazine. He focuses on ways to help America’s cities thrive in an ever more complex, competitive, globalized, and diverse twenty-first century. During Renn’s 15-year career in management and technology consulting, he was a partner at Accenture and held several technology strategy roles and directed multimillion-dollar global technology implementations. He has contributed to The Guardian, Forbes.com, and numerous other publications. Renn holds a B.S. from Indiana University, where he coauthored an early social-networking platform in 1991.

Photo Credit: Miyin2 CC BY-SA 4.0

Handicapping Amazon’s Search for a Second Headquarters

$
0
0

Amazon is choosing a city for their second headquarters. The retail behemoth released its “short list” of the 20 cities on January 18.

With tongue planted firmly in cheek, well-known tweeter Iowahawk (@iowahawkblog aka Austin’s David Burge) has enumerated the pros and cons of each location. He swagged the odds for each city.

Atlanta and Austin top his list with 4-1 odds on each. (Austin? Hometown bias?) Way down at the bottom are Miami (100-1), Newark, NJ (200-1), and Montgomery County, MD (250-1). All the data is available via here. A much longer analysis is available at here.

Three of the 20 finalists are located right next to each other. Do you think maybe Jeff Bezos wants another reason to visit the DC area? Remember, he already owns the Washington Post. The Washington, DC area is the sum of the probabilities for Washington, D.C., Northern Virginia, and Montgomery County, MD. (From this point forward, Mr. Burge will be “Dave” and Mr. Bezos will be “Jeff.”)

Many, including me, believe that Jeff has already made his decision. The true objective of having 20 finalist cities is to encourage competition among them for the HQ. This competition includes various tax breaks, tax incentives, and outright payments from the city’s coffers. One important point: Jeff owns houses in both New York and Washington.


Google Maps. Regional annotation by author

Dave’s analysis focuses on quality of life for employees. I’ll add comments on three other considerations:

1. Jeff’s personal life goals
2. Strategies for the long-run growth of Amazon
3. Jeff may believe that transplanting a large number of Amazon employees to a state could flip the state from red to blue (Republican to Democrat).

Here’s a graph of the results. Probabilities are on the vertical axis and the odds are above each bar.

The Pros and Cons

The real fun is Dave’s snarky comments on the pros and cons of each city. The table presentation is what he said. My perceptive rejoinders follow.

1. Atlanta

In 1996 Atlanta hosted the summer Olympics. During the opening ceremony, a bunch of doves were released. The day before one wag noted that this was a bad idea. “You just know there will be a dozen or so rednecks with shotguns outside the stadium.” Georgia is pretty much prime second amendment territory. I suspect the sheer number of rednecks will be a negative for Jeff. Georgia is a solid red state. It’s unlikely that putting Amazon in Atlanta will flip the state to blue. Atlanta is ranked too high.

2. Austin

Austin is also ranked too high. This is the city that banned Uber and Lyft. The capital of the Texas is also a small oasis of progressiveness in an expansive hotbed of conservatism. Offsetting this, Jeff is a Texas native. Surprisingly, Dave failed to note the presence of the University of Texas, a college made great by virtue of spending the money of polluters on progressive goals. Among their illustrious faculty is Bob Metcalfe, the inventor of Ethernet. If anything, the presence of U of T should give Austin a boost in the rankings. And it’s unlikely Texas will flip from red to blue unless Jeff moves several hundred thousand workers to his new HQ. Austin should not be in the top five.

3. Boston

Boston is ranked way too high. The city combines hellacious traffic jams with killer winters. Driving is impossible. Boston streets were laid out following the original cow paths to the Boston Common. And the drivers are, well, nuts. If you visit that fair city, take taxis. You want a road warrior behind the wheel. And as for the weather, Boston is located directly along the freeze line. That means during the winter it warms up during the day and melts the snow. At night, the temperature drops and that water freezes. The street layout and drivers are bad enough. Summers can be bummers, too. One summer when I lived there it rained every single weekend. It started raining on Friday and stopped on Monday.

There are many fine universities in Boston. MIT and Harvard are located in Cambridge, across the Charles River.

Finally, Massachusetts is a solid blue state. There’s no point in making an already blue state even deeper blue.

4. Washington, D.C.

Jeff’s personal preferences may well come into play here. For purely business reasons, Washington DC is ranked way too high. Traffic as bad as anywhere in the country combined with a mass transit system that rivals New York City for unreliability should put our nation’s capital further down the list. (The NYC subway floods. The DC metro catches fire.) Also there are terrible public schools in the district and a local government that shuts down when a single snowflake falls.

Finally, I need to remind Dave of this quote from John F. Kennedy.

5. Toronto

Toronto seems ranked just about right.

One overlooked positive is for those who vowed to emigrate to Canada if Mr. Trump was elected president. If Toronto is selected they can fulfill their promise and work for a large U.S. company. It’s a win-win! But Toronto, like every other city and province in Canada, has no votes in U.S. elections. That counts against them using the “flip the state from red to blue” criterion.

6. Pittsburgh

Pittsburgh is ranked a bit too low. The few times I’ve visited I’ve found it to be a pretty nice town. And Carnegie-Mellon is a first class university.

In many respects, Pittsburgh is what Portland (OR) was 30 years ago. Real estate prices are low. The downtown is gradually being taken over by hipsters. And Pennsylvania is always in play politically. The drawback is the state’s large population, 12.8 million. Adding 20,000 Amazon workers won’t make much difference.

7. Dallas

Dallas is ranked about right. Pluses are low housing costs, Texas conservatism, friendly regulation, and a pro-business climate. One negative is, um, the climate. Winters can be very cold, snowy, and windy.

Jeff ain’t gonna turn Texas blue in his lifetime.

8. Chicago

Illinois? Are you kidding me? Chicago should not be in the top 15. High taxes, a state government that regularly sees governors sentenced to prison, a shrinking population, and way too much influence from Chicago in Springfield. Now let me tell you about the murder rate.

Despite having a Republican governor, both Chicago and Illinois are dominated by a Democratic political machine. Like Massachusetts, Jeff shouldn’t try to make a blue state even deeper blue.

9. Nashville

Nashville is the sleeper of this bunch. It should be in the top three. Start with a bonus: the city is a mere 212 miles from Memphis, making weekend visits to Graceland easy. Also, Memphis is also the original hub for FedEx. Company history says that city was chosen because the airport rarely closes due to weather. If Nashville’s airport is closed, fly into Memphis and drive.

I once worked with a guy who travelled a lot. He lived in Los Angeles. A few years later he moved to Nashville. A big plus is a first-rate international airport. Those musicians need to be able to get to and from the Grand Ole Opry.

Nashville is easy to get around and has high quality hotels and restaurants. Plus there’s plenty of convention space. And Tennessee has a low cost of living, business-friendly government, and some nice schools. Vanderbilt, for example, is located in Nashville. I would take Dave’s 20-1 odds and bet on Nashville.

10. Northern Virginia

One criticism of Dave’s odds is that Washington, DC, Northern Virginia, and Montgomery County, MD are basically the same place. Therefore they should have similar odds. About the only thing Maryland and Virginia have in common is proximity to Washington. But it still disturbs me that three of the 20 sites are Washington, DC and its suburbs. Jeff Bezos will not be happy with the taxes and regulations in deep blue Maryland, although it has a Republican Governor. Does Amazon really need a supply of cyanide and/or strangling wire?

On the other hand, Virginia is a swing state that has been trending slightly blue. This has been largely caused by federal government workers living across the Potomac River in Alexandria and other suburbs. Another 20,000 Amazon workers might hasten the trend to blue.

11. Raleigh

Raleigh is just out of the top ten. That seems about right. The Raleigh-Durham area is home to Duke University and the University of North Carolina. College basketball and car racing are huge here. Raleigh is 156 miles from Charlotte, home of the Charlotte Motor Speedway and the NASCAR Hall of Fame. Another plus is very affordable real estate and access to North Carolina wineries, all 131 of them.

But it’s still located in North Carolina. The thin veneer of civilization is especially tenuous once you get out in the country. The state has remained solidly red in presidential elections since 1980 with one exception. In 2008 the voters chose former President Obama.

12. Philadelphia

The real mystery here is why Philadelphia is even on this list. The 12th place ranking is way too high. Philadelphia government is about as corrupt as it gets; Pennsylvania politicians are second only to Illinois in ending up in jail. In 2016 former state Attorney General Kathleen Kane was sentenced to 10 to 23 months in prison for operating a political payback scheme.

Unless Jeff plans to go the bribery and corruption route for his new HQ, he should probably avoid this place. Although it is affordable compared to DC, Boston or New York.

There is, once again, little hope of turning the state blue and no need to turn Philadelphia any more blue. See the earlier discussion of Pittsburgh for details. Remember, fully 59 Philadelphia precincts did not cast one single vote for Mitt Romney in the 2012 presidential race.

13. Denver

This is the correct ranking for Denver. I doubt very much that access to beer and weed are in Amazon’s plus column. Denver is the second-highest state capitol in the U.S. (Win bar bets with this one: highest is Santa Fe, NM.) Unless you correct for weed consumption, in which case Denver is a whole lot higher. But housing is becoming less affordable but there is fine skiing. Also the Eisenhower Tunnel on I-70 is worth a trip unless you’re even slightly claustrophobic.

When it comes to voting, Colorado has been trending blue since 2008. With only nine electoral votes, there would be little point trying to turn the state completely blue.

14. Columbus, OH

I have no idea whether Columbus is ranked correctly or not. If you want to understand Dave’s cryptic comments, read the (much) longer version at GonzoEcon.com.

Columbus has affordable housing, as well as combining the virtues of being the state capital and the home to a pretty good college football team. But there’s no way 20,000 Amazon employees are going to change the voting statewide or in Columbus.

15. New York

Even in 15th place, New York is rated too high. New York City is expensive, crowded, and has a public transportation system that is glaringly flawed. The failure of public transportation has encouraged the rise of Uber and Lyft. That, of course, has increased street congestion. Both the state and the city have business-hostile governments. Mayor Bill de Blasio murdered a groundhog. The New York Post was all over the story.

Mayor Bill de Blasio has groundhog blood on his hands!

However, Mayor de Blasio did not kill Eric Garner (the illegal cigarette vendor presumably referenced by Dave).

16. Indianapolis

Indianapolis is 51 miles northeast of Bloomington, home of Indiana University. If you don’t get the reference to high school basketball, go watch “Hoosiers." And, of course, Memorial Day weekend the city is mobbed with people heading to the Indianapolis 500. Indianapolis is centrally located, livable, and has a reasonable cost of living. It should be ranked higher, at least with Columbus.

17. Los Angeles

I’m a little surprised that Dave ranked L.A. this low. But as a fairly frequent visitor to the City of Angels, he he knows about (but didn’t mention) the exorbitant cost of housing, high state taxes, massive state and local regulations, impossible traffic, and a city government that taxes everything it can think of. But he’s ranked it number 17, probably about right.

18. Miami

Not to be confused with Miami, Ohio. Miami, Florida, is a wannabe Los Angeles but with bugs, bugs, bugs. Really big bugs.

And Florida’s inhabitants are about the weirdest anywhere in the U.S. Go check @_FloridaMan and @_Flor1daWoman. Both accounts have not been active recently. But here’s one example:

If not for Newark, Miami would rank dead last.

19. Newark

Fun fact: there is a Newark, California.

There is no way Newark can be on Jeff’s real short list. About the only positive thing is an international airport. But that’s it. The city’s ranking is spot on.

20. Montgomery County MD

I’m not sure why Dave ranks this lower than Newark. Just another one of the three Washington, DC locations. And it is also heavily populated by DC bureaucrats. Montgomery County should be ranked much higher, at least closer to Northern Virginia and Washington, DC.

Odds and Probabilities

Here’s Dave’s complete list ranked by probability.

Readers who also have too much time on their hands will notice that the probabilities add up to 112.96 percent. The sum should be 100 percent since (presumably) only one city will actually be selected. If you’re interested, click the link in the following section.

DIY Odds and Data

If you’d like to do your own odds, the entire Excel workbook I put together, including instructions and sources, is available here.

Tony Lima is Professor Emeritus of Economics at California State University, East Bay. He is a card-carrying, published wine economist.

Photo: Via Flex Jobs.

Ground Transportation Gaps

$
0
0

A theme de rigour at transportation conferences these days is Americans’ reduced affinity for driving. It is a pervasive premise: that young people and urbanites only want “to get from point A to point B.”

Such claims ring true in numerous dense urban settings where transportation network companies (TNCs) such as Lyft and Uber, as well as bikesharing and carsharing are all flourishing. Car-free living is on the rise.

However, trends on longer distance trips suggests caution in making sweeping claims about how people are getting around. On suburban trips, auto-dependence has barely changed. Furthermore, a study I conducted shows that many intercity travelers can hardly avoid driving or flying on trips between 100 and 400 miles, even if they want to.

The difficulty of avoiding cars on city-to-city trips surprised even us longtime observers, considering that between 2006 and 2013, a bevy of new options such as BoltBus, Go Bus, and Megabus emerged, and Amtrak added significant new service. Nevertheless, the expansion of both bus and rail routes has recently slowed, and driving has gone up sharply over the past few years, partially due to a fall in gasoline prices. Tech-oriented innovations around non-driving alternatives are stuck in slow gear; TNCs are not yet available or affordable on most trips of more than 100 miles.

When “Ground Transportation Gaps” Make Driving Unavoidable

To assess what all this means for travelers, I created the term “Ground Transportation Gaps” to denote corridors in the 100 – 400 mile range, linking metropolitan areas with populations of more than 500,000 that lack both express coach line and rail service. I also dub a corridor a “Gap” when these modes exist but are unacceptably slow (

I differentiate between express coach lines like Megabus and conventional bus lines like Greyhound for the simple reason that many travelers--rightly or wrongly--exclude conventional lines from their “choice set.” Many people are apprehensive about bus depots, while others balk at the uncertainty of the travel experience. For others, it’s about image or status. Conversely, express coach lines have at least partially broken through these barriers by emphasizing curbside pickup, fast service, and guaranteed seating for all ticket holders.

Getting around without a car can be exceedingly difficult in a Ground Transportation Gap. Travelers can often fly, but the “airport hassle factor” persists and carriers charge big bucks for last-minute bookings. For these among other reasons, the number of flyers on short-hop routes has fallen sharply over the past several decades.

The largest Gap is Los Angeles – Phoenix, which, by my estimate, generates 2.5 million trips per year, while Cleveland – Detroit, Chicago – Columbus, OH, Dallas – Oklahoma City and Las Vegas – Phoenix, generate more than a million, as the following interactive map shows. In the Southeast, Cincinnati – Nashville, Miami – Ft. Myers, and Tampa – Sarasota see huge volume. Good luck to a traveling party of two that dislikes driving but doesn’t book in advance: they often must either “Go Greyhound,” or pay at least $1,000 for a pair of roundtrip flights. “We’ll just drive” or “we’ll stay home,” is no doubt a common response.

“Ground Transportation Gaps”
Examples of Heavily Traveled Routes w/o Express Coach Line or Rail Service

To access interactive map, click here.

About 30% of intercity routes linking metro areas with populations of 500,000 or more are full-blown Gaps, while many others have but one or two Amtrak or express coach departures daily, testing the will of those who try to avoid driving. Gaps constitute an overwhelming share of routes to smaller metro areas, including all of those involving Columbus and Dayton, OH, Phoenix, AZ, and Tulsa, OK, which have no Amtrak trains or express coach line service at all.

Technology to the Rescue?

Private innovations will likely help close the gaps. Lyft and Uber are eying longer-distance markets. As fuel costs rise, Megabus and other bus lines have begun expanding again, and the fast-growing German-based Flixbus will reportedly launch U.S. service next year.

Axle Travel, a startup, is testing a door-to-door service in the Northeast that integrates bus services and TNCs onto a single ticket. App-based services like Europe’s blablacar.com, which allows drivers making intercity trips to find others riders for a fee, may eventually gain traction here. In addition, autonomous cars may push everything in a new direction.

But public agencies can speed things along, even with strained budgets. Express carriers need help finding attractive pickup and drop-off locations, which is becoming a major problem. Boston, Denver and Washington, DC have created dedicated terminals for intercity bus lines that are largely financially self-supporting. State governments in California, Michigan and Oregon have filled gaps using private bus lines to feed rail corridors as part of the growing Amtrak “Thruway” program.

So, when someone claims that travel is now only about “getting from Point A to Point B,” remind them that there is a four-hundred-mile-wide gap in their thinking. New alternatives for intercity travel may be coming. What remains to be seen is how many Americans are ready to hop on board.

Joseph Schwieterman, Ph.D., is professor of Public Services and director of the Chaddick Institute for Metropolitan Development at DePaul University in Chicago. He is the author of a widely read annual report on the intercity bus industry.

Photo: Przemek P., via Flickr, using CC License.

Revisiting the "Big Theory" on American Urban Development

$
0
0

I like to think I've come a long way since the start of this blog nearly six years ago. There are some early things I've written that have become the focal point of my work today, things I tried to tackle but were better left alone, and things I initiated and warrant a deeper look. This post certainly fits in that third category.

A little more than four years ago, in an attempt to carve out some pseudo-academic territory of my own, I threw out an idea I called the Big Theory of American Urban Development. My premise was that there have been distinct development periods in American history, producing distinct styles of development shaped by the economics of the time, and with transitional periods that separate larger eras where no development type dominates -- until one does. The premise borrows quite a bit from the generational theory presented in The Fourth Turning, a book published in 1997 by William Strauss and Neil Howe. Their book discusses the cyclical nature of our society, as generations that share certain traits exert their impact on the world as they enter various life stages -- as children, as young adults, in middle age and as the elderly.

You can click the link above to see how I initially organized the different development eras in American history, as I saw it. However, here's a quick summation:

The Early Era (1795-1860)

Revolutionary Period (1795-1815)
Plantation Period (1810-1830)
Mercantile Period (1825-1845)
Frontier Period (1840-1860)

The Industrial Era (1870-1935)

Railroad Period (1870-1890)
Industrial Period (1885-1905)
Streetcar Period (1900-1920)
Recreational/Garden City Period (1915-1935)

The Auto Era (1945-2010)

Levittown Period (1945-1965)
Split-Level Period (1960-1980)
Edge City Period (1975-1995)
McMansion Period (1990-2010)

Each era produced development types that supported the economic foundation of the time. Early Era American development was based on settlement and agriculture; Industrial Era development was supported by the rise of manufacturing and the expansion of the nation's rail network; Auto Era development, obviously, was built on the growth of car use and our road infrastructure. Each era also produced development types that became less dense over time, as transportation improvements expanded our world.

Implied in my earlier piece is that the development patterns of our cities are wedded to the development era from which they emerged, and build on that initial foundation. East Coast cities, for example, clearly emerged as cities in the Early Era and maintain development vestiges from that period (mix of building types, pedestrian-oriented street networks, etc.). Much of the Rust Belt exploded in the Industrial Era and has a built environment that reflects that -- an orientation to rail, strong grid networks, large areas devoted to industrial use, and large areas devoted to residents seeking to avoid industrial area impacts. Much of the Sun Belt, particularly in the Gulf South and the Southwest, developed in the Auto Era and has the characteristic horizontal development pattern and extensive highway network.

You'll also note the interregnum periods, from 1860-1870 and from 1935-1945. Those are the periods when larger economic and social events occur that effectively end one era and kick off another. The Civil War and Reconstruction put an end to agricultural America and ushered in the industrial future; the Great Depression and World War II led to American global economic dominance and policy reforms that supported auto-dominant expansion.

Enter the present day. You've probably realized that I put our current time into another interregnum period, starting in 2010 and presumably lasting a few more years, until 2020. There are those who firmly believe we're in the midst of an urban revival, fueled by globalization and technology, that is vaulting global cities far past their non-global counterparts. That is true. But I'd suggest that the urban revival we celebrate isn't necessarily widespread; it's concentrated among a handful of cities that tend to dominate our thinking on cities. We've certainly witnessed the impact of globalization in our coastal cities, but we're beginning to understand that such expansion hasn't filtered to all American cities, and there are legitimate questions as to whether it can and what the future direction might be. And there are metro areas in America that are still quite dependent on the late-period Auto Era model.

Furthermore, more broadly I'd say that that Great Recession put an end to the dominance of the Auto Era that emerged after World War II -- putting urban revival on roughly equal footing with suburban expansion for the first time since the early 20th century. There is no dominant American development pattern at this time. I'm guessing that by the middle of this century people will view this period as one nearly as tumultuous and transitional as the other two I've noted.

So what's next?

It's hard for me to put a defining title on the next development era, but I think I see the elements of it emerging. Of course, my guess is as good as anyone's, but here's what I see. Our development future will be even more urban. It will be based more on the mobility options and opportunities --autonomous and alternatively fueled vehicles -- that will expand this century. It will be more economically unequal in America, as America's economy becomes more equal with the rest of the world. And our development patterns will be something that will adapt to the demands put on it by climate change.

Here's a possible way to organize the bulk of the 21st century, in the same way I've organized the previous 200+ years of American development history:

Urban Revival Period (2020-2040): The rebirth of cities actually does take hold nationally, as growth filters downward from our superstar coastal cities to other cities. Interior cities will tout their assets and amenities and become cheaper alternatives to the coasts.

Urban Suburbia Period (2035-2055): Suburbs will begin a period of adaptation largely based on their proximity to urban growth areas. Suburbs adjacent to strong urban areas will urbanize (incorporate more mixed use development, a variety of housing types, and more walkable) as a complement to renewed interest in urban areas. My guess is that the older forms of the Auto Era, from the Levittown and Split-Level periods, will lead the way here (after a fairly dark period that they've recently entered into).

Exurban Retrenchment (2050-2070): Not all suburbs will have the benefit of adjacency and proximity to build on. I foresee a period where many revert into a semi-rural form, since we'll discover that their current form is economically unsustainable. They'll become local agriculture producers in the way that market gardens (or truck farms) used to be. These will be the areas that developed during the Edge City and McMansion periods.

Climate Adaptation (2065-2085): Some aspects of climate change adaptation are already underway (indeed, some aspects of everything noted here are already underway), but I'm guessing that by the middle of this century climate adaptation will take center stage. Sea rise, super storms, droughts, fires and excessive heat will make places that were perfectly and enjoyably habitable in the 19th and 20th centuries into places far less habitable in the next few decades. Some cities will adapt to the changing climate. Others will have to adapt to the climate refugees -- domestic and international -- that result.

A simple projection of current development trends into the next six decades? Perhaps. A hubristic attempt to outline future development patterns, when we don't have full knowledge of what economic or technological breakthrough might alter the pattern? Almost certainly. But we should start with some base so we can prepare for whatever happens next.

This piece originally appeared on The Corner Side Yard.

Pete Saunders is a Detroit native who has worked as a public and private sector urban planner in the Chicago area for more than twenty years.  He is also the author of "The Corner Side Yard," an urban planning blog that focuses on the redevelopment and revitalization of Rust Belt cities.

Photo: Farmers, producing food on former suburban landscapes and selling them to nearby urban residents, might become more prevalent in the coming decades. Source: farmersandchefs.com

The Three Faces Of The Democratic Party Are Coming To A Head

$
0
0

In the wake of President Trump’s first official State of the Union speech, and the positive momentum in the economy, the putative “party of the people” now faces a much under addressed internal crisis. United against Trump, the factions which dominate the party increasingly operate at cross purposes.

Ultimately all parties are coalitions of disparate groups and interests. Much attention has been on the divisions within the ruling GOP — libertarians, social conservatives and populist/nationalists. But with the Democrats poised to make a comeback this year, and perhaps gain control of all three branches by 2020, perhaps it’s time to analyze divisions that may determine the extent of their ascendancy.

Three different, and often somewhat hostile, tendencies now define the Democratic Party. These include the corporate oligarchs, causists obsessed with particular hot button issues and arguably the most critical to long-term ascendency, populists, who bear much of the party’s social democratic message and legacy.

The oligarchs

Republicans still retain the allegiance of certain, older industries — pharmaceuticals, energy, home-building, agriculture and manufacturing — but the post-industrial information age moguls are almost entirely Democrats. This trend has been building since the time of Bill Clinton, and remains even more evident in the Trump era.

Much of this has to do with geography and culture. Tech, media and entertainment firms are almost entirely concentrated on either the west or east coast, where being a Republican identifies you as “uncool,” or if you dissent too openly, potentially unemployed. Heavily dependent on imported labor, these firms particularly seek to expand their already large numbers of HIB indentured servants, something Trump, and for his part Bernie Sanders, have opposed.

Under attack for their pervasive abuse of women and ignoring non-Asian minorities, these industries seek redemption by financing the anti-Trump “resistance” even as they cash in on GOP economic policies. Their increasing control of media makes their pretense seem plausible; everything from football and awards shows now come with a blatantly political agenda. Unprecedented wealth — the top five tech giants are worth together more than $3 trillion — allows these “hip” plutocrats to transcend most regulatory excess, as long as it keeps them safe from anti-trust enforcement and Bernie Sanders-style redistribution.

Read the entire piece at The Orange County Register.

Joel Kotkin is executive editor of NewGeography.com. He is the Roger Hobbs Distinguished Fellow in Urban Studies at Chapman University and executive director of the Houston-based Center for Opportunity Urbanism. His newest book is The Human City: Urbanism for the rest of us. He is also author of The New Class ConflictThe City: A Global History, and The Next Hundred Million: America in 2050. He lives in Orange County, CA.

Photo: Senate Democrats (Budget) [CC BY 2.0], via Wikimedia Commons


Dan Gilbert’s Post-Mortem of Detroit’s Amazon HQ2 Loss

$
0
0

Billionaire Dan Gilbert has posted a lengthy post-mortem on Detroit’s first round loss in the Amazon HQ2 sweepstakes.

He pooh-pooh’s the idea that talent was the reason, instead suggesting it was Detroit’s negative reputation. (If you didn’t see it already, Crain’s Detroit ran a lengthy story on how Gilbert and the Detroit team put together their bid).

I would argue Detroit does have something of a talent problem. It has a large existing talent pool because it’s a large metro area. But that talent is mostly already being utilized. So to staff up Amazon in that environment, you’d need to poach the talent from elsewhere and assume that the skills match is there between occupations. The other alternative is hiring new people coming into the region, and this is where Detroit falls short. Detroit only grew its percentage of 25-34yos with a college degree by 5% between 2000 and 2016. It’s done better in recent years than in earlier ones, but that’s anemic performance. Detroit’s brain gain came mostly in the older age cohorts that are not Amazon’s bread and butter. By contrast, Pittsburgh’s headline demographics look bad, but it grew its 25-35yos with college degrees by 52% during the same period – a higher percentage growth rate than any other Midwestern region. (Three of the top four Midwestern cities on this metric, Pittsburgh, Indy, and Columbus, made the Amazon finalist list. Grand Rapids was the other, and at just barely a million people is too small for Amazon most likely).

That’s not to say that Gilbert’s necessarily wrong about Detroit’s negative reputation. Reputation is a lagging indicator. It’s what Jim Russell likes to call a “mesofact”, one that changes in people’s head over a medium scaled period of time.

With regards to the city’s reputation, Gilbert has a very good idea in his memo: bring people to Detroit:

What is the solution to finally overcome the chasm between Detroit’s reputation and reality?

It will take many strategies and tactics to overcome this fundamental challenge.

One highly -effective remedy to the fallout of a half century or more of reputational damage is to bring people physically HERE to see, touch and feel the excitement, opportunity, growth and reality that is the Detroit of 2018 and beyond.

We have witnessed for ourselves, time after time, those who have recently visited the Motor City leave with a completely turned around, positive impression of our city. An impression that is light-years closer to reality than the old narrative.

There are many innovative people already in this region who are capable of developing creative strategies and tactics required to attract people to Detroit and the area.

Once we get them here, we’ve got them.

The guy that Gilbert needs to download the formula from on how to do that effectively is Tony Hsieh, founder of Zappos and the Downtown Project in Las Vegas. Hsieh set out to do nothing less than to completely transform downtown Las Vegas. It was an extraordinarily audacious undertaking – maybe too audacious. But nobody did a better job of selling what they were doing than Tony Hsieh. He critically understood that if he wanted to pull off his project, he needed to create the right brand, and attract people to be part of it.

One of the ways Hsieh did this was by renting out (or buying) 50 apartments in a downtown high rise and turning them into free hotel rooms called “crash pads.” He’d then invite journalist, prospects, anyone who could potentially be part of his project or help get the word out, and invite them to come stay for free in one and check the place out. He also made sure they got the right experience. As I wrote:

Vegas is different. Downtown Project, and Tony personally, are aggressively involved in sales. They leased out 50ish units in a residential high rise called the Ogden (one of only a handful of residential properties downtown). They use these as what they call “crash pads.” They are for people who want to come check out downtown Vegas and the Downtown Project to stay free. They also make sure to showcase what they are doing. And they are going to try to show you how downtown Vegas could be a fit for you or your business. Tony himself is personally involved with this. I was able to take a small group walking tour with him, and part of his agenda was trying to sell a small retailer on setting up shop in a retail development they called Container Park. Here’s this guy who is a multi-mega-millionaire personally recruiting a small business. Hard to imagine there’s a lot of that going on in other places. Think having a tech rock star personally making the ask helps bring small tech outfits to Vegas? You bet it does. Unlike 99% of other cities in America, the downtown Vegas crowd is actually asking for the business.

Gilbert is exactly the kind of guy who could do something similar in Detroit, tailored to what they are trying to accomplish.

You can read Gilbert’s full memo over at Click on Detroit.

This piece originally appeared on Urbanophile.

Aaron M. Renn is a senior fellow at the Manhattan Institute, a contributing editor of City Journal, and an economic development columnist for Governing magazine. He focuses on ways to help America’s cities thrive in an ever more complex, competitive, globalized, and diverse twenty-first century. During Renn’s 15-year career in management and technology consulting, he was a partner at Accenture and held several technology strategy roles and directed multimillion-dollar global technology implementations. He has contributed to The Guardian, Forbes.com, and numerous other publications. Renn holds a B.S. from Indiana University, where he coauthored an early social-networking platform in 1991.

Photo: Sculpture of Joe Louis’ arm in Detroit. Image via Shutterstock.

Millions More Seniors in Suburbs and Exurbs

$
0
0

Senior citizen populations continue to increase faster in the suburbs and exurbs of major US metropolitan areas (over 1,000,000 populations). This is the conclusion of a City Sector Model analysis of the small area (zip code) trend from 2010 to the latest American Community Survey (ACS) 5-year data (2012/2016). The American Community Survey is taken on a rolling basis over a five year period, with the annual “slices” combined to obtain a picture of the national situation. Between decennial censuses (the next due in 2020). small area data is available only from the ACS 5-year surveys.

The City Sector Model classifies small areas based on the nature of their functional urbanization as opposed to by political jurisdictions, which can vary substantially in factors such as population density, employment density, automobile orientation and age of development. The City Sector Model criteria are illustrated in Figure 1 (Note).

The percentage of the population 65 or over is increasing rapidly both in the United States and in other countries, principally due to declining fertility rates and longer lifespans. Census Bureau projections indicate that the share of the population 65 or over will increase more than one quarter from 2010 to 2020. The Census Bureau population pyramid indicates that the age cohorts reaching 65 over the next 15 years are increasingly large (See photograph above).

The distribution of senior population in the major metropolitan areas is similar to that of the overall population, though seniors tend to be more congregated outside the urban core than people of all ages (Figure 2). Overall, 13.0 percent of the senior population lives in the two Urban Core classifications (CBD or Central Business District and Inner Ring), while 87.0 percent lives in the three classifications outside the Urban Core (Earlier Suburban, Later Suburban and Exurban classifications). This is similar to the distribution of the population of all ages, which is 14.5 percent in the urban core and 85.5 percent in the suburbs and exurbs.

The reality is that senior citizens are predominantly staying in their predominantly suburban or exurban communities. In 2000, 15.5 percent of seniors lived in the urban cores of the major metropolitan areas. By 2010, the share of seniors living in urban cores had declined to 13.7 percent. This included 1.4 percent in the Urban Core: CBD (Central Business District) and 12.3 percent in the Urban Core: Inner Ring. By 2012/2016 the share of senior population living in the urban cores dropped to 13.0 percent, 1.3 percent in the CBDs and 11.7 percent in the Inner Rings. Less than 10 percent of the senior growth (9.4 percent) from 2010 was in the Urban Core.

The overwhelming majority of the senior population growth was in the suburbs and exurbs. In 2010, 86.3 percent of the senior population was suburban or exurban. By 2012/2016, this figure had edged up to 87.0 percent. More than 90 percent of the senior population growth was in the suburbs and exurbs (Figure 3).

These results are counter to the periodic anecdote-based press reports of seniors moving to the urban core. (for example, a Business Insider story “Millions of Seniors Are Moving Back to the Big Cities”). However, anecdotes reveal trends only when they add up, and in this case they do not. The reality is that, since 2000, the net increase in the urban core senior population has been nearly 85 percent short of a single million (only 156,000). In contrast, the senior increase in the suburbs and exurbs has been nearly six times a million (5,900,000). Seniors, like other age groups, increasingly live in the suburbs and exurbs (Figure 4).

In numeric terms, the Later Suburbs (generally outer suburbs) gained approximately 1.25 million seniors. The Earlier Suburbs (generally inner suburbs) gained nearly 1.1 million, while the exurbs gained 700,000. These more automobile oriented components of metropolitan areas gained considerably more than the Urban Core components. The Urban Core: Inner Ring added nearly 250,000, while the Urban Core: CBD added 30,000 (Figure 5).

With the increasing share that seniors represent of the overall population, the growth rates are substantial in each of the City Sector Model categories. Senior population has been growing at 3.6 percent annually in the major metropolitan areas. This is approximately five times the recent rate for the total population in the United States (Figure 6).

The fastest senior growth rate has been in the Later Suburbs, at 5.7 percent annually, well above the 3.6 overall senior increase average. The Exurbs have also been growing faster than the overall senior population, at 4.3 percent. The Earlier Suburbs (2.6 percent), Urban Core: Inner Ring (2.2 percent) and the Urban Core: CBD (2.5 percent) have been growing more slowly. However, each of the sectors is growing at a rate considerably above the national average for the entire population, as the share of population over 65 years of age is increasing.

By far the strongest senior growth in an urban core was in New York, where the urban core represented 46.1 percent of the senior population growth. However, the growth share was somewhat below the 2010 senior population share of 48.3 percent. The majority of the New York senior growth was in the suburbs and exurbs (53.9 percent).

The second strongest senior growth share in an urban core was in Boston, at 23 percent. Among the major metropolitan areas, only seven, including more than 10 percent of the senior growth into their urban cores (San Francisco, Chicago, Providence, Philadelphia and Cleveland, New York and Boston). In each of these metropolitan areas, the senior urban core growth rate was considerably less than their senior share in 2010, ranging from a deficit of five percentage points to over 13.

Where seniors choose to live will become more important in the coming decades, not only due to their growing numbers and far greater wealth than younger generations. Their trends, at least for the next decade or so, will be as important, economically maybe more so, than the oft-studied millennials.

------

Note: The City Sector Model classifies all zip codes in the United States based on population and employment density, commuting patterns and house construction dates. The two Urban Core classifications (CBD and Inner Ring) generally replicate the pre-World War II environment, when urban population densities were much higher and there was much less automobile use. In contrast, the other three classifications (Earlier Suburbs, Later Suburbs and Exurbs) reflect the substantially lower urban population densities and much greater automobile use (However, even in the Urban Core, automobile use is dominant, while transit accounts for less than one-third of commutes).

Wendell Cox is principal of Demographia, an international public policy and demographics firm. He is a Senior Fellow of the Center for Opportunity Urbanism (US), Senior Fellow for Housing Affordability and Municipal Policy for the Frontier Centre for Public Policy (Canada), and a member of the Board of Advisors of the Center for Demographics and Policy at Chapman University (California). He is co-author of the "Demographia International Housing Affordability Survey" and author of "Demographia World Urban Areas" and "War on the Dream: How Anti-Sprawl Policy Threatens the Quality of Life." He was appointed to three terms on the Los Angeles County Transportation Commission, where he served with the leading city and county leadership as the only non-elected member. He served as a visiting professor at the Conservatoire National des Arts et Metiers, a national university in Paris.

Photograph: Extract from a US Census Bureau population pyramid.
https://www.census.gov/content/dam/Census/newsroom/blogs/2016/06/america...

Uber, the “Metropocalypse,” and Economic Inequality in D.C.

$
0
0

Public transit infrastructure in Washington, D.C. is crumbling. Metro and bus services have been cut. Fares have gone up. And, safety remains a problem. After 40 years of deferred maintenance, poor management, and the lack of decent, long-term funding, the Metro system needs $1.4 billion worth of repairs, and it must close a $290 million budget gap just to continue basic operations. Some call this the “metropocalypse.”

Private taxi services haven’t been much better. It’s often hard to get a cab, especially for people of color or people who live outside of the wealthy, White areas of the city. Racial prejudice among the mostly immigrant taxi drivers means that Black residents are regularly refused service.

In light of these transit problems, Uber might seem like an obvious win for D.C. Ridesharing services are cheap for riders, require no significant public investment, and limit some of the discrimination that has made getting a taxi so difficult for so many people. Our research shows otherwise. Indeed, Uber could undermine the very thing city officials are working hard to address: economic inequality.

In 2016 we conducted 22 in-person interviews with local policymakers, business leaders, transit planners, lobbyists, and labor advocates as well as 40 in-person interviews with Uber drivers in the D.C. metro area. Our project found a close relationship between Uber and the city government, one that actually decreases economic opportunity.

Uber’s relationship with D.C. city officials is cozy and widespread. Together they have created promotional videos, held ribbon-cutting ceremonies, and collaborated on transit plans. As an Uber lobbyist put it, city officials have “adopted our view of the world.” The city’s regulation of UberX—the low-cost, digital ride-hailing service—is the clearest example. The legislation, according to Uber, is “one of the best models for us” because it “basically allows us to set out the standards.” To make this happen, Uber spent $300,000 lobbying the City Council, its CEO testified at city hall, and it coordinated 5,000 emails to Council Members within a 24-hour period arguing against a legislative edit the company did not like. As one City Council employee explained, in the three months leading up to the passage of the act, he had “either a meeting, at least one phone call, or at least one email probably every day” with Uber representatives.

D.C.’s bare bones regulation of Uber includes background checks, general vehicle requirements, a mandate regarding insurance, and a requirement that the Taxi Commission collect 1% of all gross receipts for Uber rides. In an unusual step, the legislation also prohibits journalists, researchers, and policymakers from using the federal Freedom of Information Act to access basic information about how many vehicles are on the road during a given week or how many registered Uber drivers live in the city. Uber claims 1.9 million riders and 42,000 drivers in the D.C. region, but this policy makes it impossible for us to verify the claim.

Last year, Mayor Muriel Bower expanded the city’s ties to Uber by announcing a formal partnership with Uber Movement, a service that offers access to certain, anonymized data about congestion and travel patterns. Uber describes its data on 2 billion trips worldwide as a treasure trove for cities and frames itself as a key resource for local governments concerned about transit development. However, the data that Uber Movement offers falls well short of what many planners actually need or want. A recent report by the National Association of Transportation City Officials lists seven types of data that cities need in order to improve the transportation process. Uber has only been willing to share one.

The growing relationship between D.C. and Uber raises four concerns. First, Uber does not promote decent jobs. As we have shown, drivers labor under poor working conditions with high risks and no financial stability. Other research suggests that these jobs may even increase inequality.

Second, Uber is not accessible for everyone or everywhere. Our research found that drivers avoid poor neighborhoods, and, if they have to drop off a passenger in one such area, many turn off the Uber app to avoid picking up new passengers there. As one driver explained, “ I don’t pick up in southeast D.C. or [Prince George’s] County because I don’t know the area. It has nothing to do with racism, demographics, or anything like that.” In Arlington, where he lives, or neighborhoods with many bars and restaurants that he knows, he feels more “comfortable with finding people.”

Other drivers explained that they concentrate in wealthier neighborhoods because Uber provides them with opportunities to earn more in those areas of the city. Uber maintains that these surges reflect demand, which may well be the case, but this algorithmic pricing nonetheless makes transportation equity elusive, and poorer residents—including many people of color—have less access to Uber. Disability activists have found similar limitations and argue that Uber does not meet federal standards for disabled riders.

Third, Uber can undermine working-class riders’ access to public transportation. New research shows that Uber shifts riders to private cars and away from public transit systems. This pattern can lead transit companies to reduce services, which are critical to working-class residents. It can also lead to cuts to unionized transit jobs, which provide opportunities for upward mobility.

Finally, the D.C. Uber story is not exceptional. In 2016, Uber and Lyft hired 478 state lobbyists—more than Amazon, Walmart and Microsoft combined—to challenge local government regulations in 41 states.

Last year D.C. had the highest rate of income inequality of all U.S. states. The average income for the top five percent of city households is $531,000, but for the bottom 20 percent, the average is only $9,900. That’s a significant divide of both class and race. D.C. leaders want to create an urban future not defined by inequality. Local policymakers have taken steps to mitigate economic and racial inequalities. They have adopted a $15 minimum wage, passed a paid family leave act, and approved a requirement for workers to have paid sick days. Next step? They should take a close look at how Uber’s problematic jobs, limited service, and emphasis on corporate profits rather than a public good fit into their vision of a just and equitable city.

This piece first appeared on Working-Class Perspectives.

Katie Wells is an incoming Urban Studies Foundation Postdoctoral Fellow at the Kalmanovitz Initiative for Labor and the Working Poor at Georgetown University. Kafui Attoh is an Assistant Professor of Urban Studies in the Murphy Institute for Labor Studies at the City University of New York. Declan Cullen is an Adjunct Professor in the Department of Geography at George Washington University. This research was funded by the Ewing Marion Kauffman Foundation. The contents of this publication are solely the responsibility of the authors. For more information, contact Katie at wells@gwu.edu.

Transportation Energy Costs

$
0
0

The average car on the road consumed 4,700 British thermal units (BTUs) per vehicle mile in 2015, which is almost a 50 percent reduction from 1973, when Americans drove some of the gas-guzzliest cars in history. The average light truck (meaning pick ups, full-sized vans, and SUVs) used about 6,250 BTUs per vehicle mile in 2015, which is also about half what it was in the early 1970s.

Click here to download a 10.2-MB PDF of the report. Use links below to download spreadsheets or individual chapters from the report.

By comparison, the average transit bus used 15 percent more BTUs per vehicle mile in 2015 than transit buses did in 1970. Since bus occupancies have declined, BTUs per passenger mile have risen by 63 percent since 1970. While buses once used only about half as much energy per passenger mile as cars, they now use about a third more.

These numbers are from table 2.15 in the latest Transportation Energy Data Book, which has energy consumption data for various forms of transportation through 2015. Table 2.16 reveals that the energy consumed by airlines per passenger mile has declined by more than 75 percent since 1970, so now it is more energy efficient to fly than to drive (at least, if your car is carrying the average 1.55 occupants).

The same table reports that rail transit uses slightly more energy per passenger mile today than it did in 1970. However, the rail numbers in the table must be read with caution: a footnote warns that “Only end-use energy was counted for electricity. Previous editions included primary energy use for electricity which included generation and distribution losses.” Generation and distribution losses are about 67 percent of electrical energy, so the BTUs in the table must be tripled to get the actual amount of energy consumed to move people by electric transit.

The numbers are also a problem for Amtrak, as about a third of Amtrak passenger miles are carried on electric-powered (as opposed to Diesel-electric) trains. The previous edition of the data book indicated that Amtrak used 2,186 BTUs per passenger mile in 2014, while the latest edition “corrects” this to 1,641. In other words, Amtrak really requires about a third more energy than is shown in the data book. That still makes it slightly more efficient than flying, but not much. I suspect that, if the numbers were broken down by route, a few heavily used routes would be energy-efficient while most of the rest would not.

The authors of the data book offer no explanation for why they changed from counting electrical energy from total to end-use. It would be like saying that the average gasoline engine is only about 35 percent efficient, as the other 65 percent is lost as heat, so therefore we’re only going to count the 35 percent of gasoline used to actually move the vehicles. This is a bewildering and disappointing change as it greatly understates energy consumption required for electric-powered transportation.

Update: In an email, one of the book’s authors explained that they decided it wasn’t appropriate to count the “upstream” costs of electrical energy if they didn’t also count the energy costs of locating and extracting fossil fuels. In other words, the data book is not an attempt at doing a life-cycle analysis. My response is that the electrical grid is a closed system and all the costs within that system need to be counted just as they would be if the vehicles themselves were generating the electricity (such as in a hybrid car).

Another problem with the data book is that table 2.16 combines light and heavy rail in the rail transit numbers, which is sort of like combining minivans with full-sized buses. Fortunately, this edition has supplemental figures 2.07 and 2.08 showing BTUs per passenger mile of individual light- and heavy-rail lines. Remember to triple all of the numbers to get actual energy consumed.

One other important piece of information is missing from the data book. The tables show BTUs per vehicle mile for cars, light trucks, and transit buses, and BTUs per passenger mile for cars, transit, planes, and Amtrak. But no table shows BTUs per passenger mile for light trucks.

To convert vehicle miles to passenger miles, the book’s authors used average passenger car occupancies of 1.55 people per car, which is from the 2009 National Household Travel Survey. Average light truck occupancies are higher, so to convert BTUs per vehicle mile to BTUs per passenger mile, divide the former by 1.72. The result is about 3,600 BTUs, which is 20 percent more than cars but still 10 percent less than transit buses.

This piece first appeared on The Antiplanner.

Randal O’Toole is a senior fellow with the Cato Institute specializing in land use and transportation policy. He has written several books demonstrating the futility of government planning. Prior to working for Cato, he taught environmental economics at Yale, UC Berkeley, and Utah State University.

My Reno Epiphany

$
0
0

I was last in Reno, Nevada twenty years ago and I can’t say I had a strong opinion of the place. It was just another forgettable generic one night stop over on a long drive to somewhere else. But I found myself back there twice in the past month. First, a young friend was leaving California for his home town in Connecticut and he wanted one last western nature adventure. Then a newly retired couple from the Los Angeles area wanted to kick the tires to see if Reno might be a good relocation spot. I enjoyed exploring Reno through these very different eyes.

Reno is a Diane Arbus, Edward Hopper, Jane Jacobs Bermuda Triangle. Whatever wonderful horrible thing you may crave or despise Reno has several excellent examples on offer.

Reno has a downtown core that’s been beaten to death for decades by the same forces that plagued most city centers. Whole blocks of historic buildings were torn down to make way for surface parking lots, giant hermetically sealed compounds, and massive parking decks. The exterior of these bunkers were either left blank or articulated with faux storefronts with inoperable doors and windows. These insular worlds were connected by glass tubes and underground corridors. There was no desire to afflict respectable visitors with street life. In other towns – perhaps yours – these were insurance companies or the headquarters of manufacturing concerns. In Reno they were hotels and casinos.

And lo and behold the small shops died and rough trade lingered in the inky shadows. All the more reason to wall off your prestigious hotel and entertainment complex. I could be describing almost any city in the country. This happened everywhere.

Eventually new hotels were built out on the edge of town where guests would never need to be burdened with a failing downtown core. The Reno-Sparks Convention Center is a particularly poignant example of a suburban roadside tourist facility. The “decorated shed” architecture and signage were lifted directly from Learning From Las Vegas. It’s an urban form that’s best experienced at sixty miles per hour. It simply doesn’t matter what these places look like on the outside so long as there’s ample free parking and air conditioning. This is what most people really want and developers know that.

Drive out a little farther in any direction and the landscape atomizes into isolated pods. Clusters of garden apartment complexes, ribbons of single family homes, corporate light industrial parks, hilltop executive estates, and mini self storage facilities dot the terrain. Is it any different in your town? Probably not. This full spectrum from downtown to the fringe suburbs is what some urban planners call the transect. I always ask, “You mean someone planned this on purpose?” Yes. It’s all very intentional.

Reno leaders have finally figured out that a dead downtown is bad for the entire metro region. And Reno’s core, like so many other cities, is receiving attention from out-of-state developers who understand there’s pent up market demand for urban living. When private profits and public tax revenue are put on the table suddenly all sorts of things are possible. Reno is restoring its surviving traditional buildings, investing in its urban public realm, and celebrating its riverfront, public parks, and civic plazas again for the first time in decades. This isn’t simply part of plan to cultivate more tourist traps, but to create places for locals to inhabit and enjoy.

Much of the land parallel to the main drag is being prepared for new infill development as smaller parcels are cobbled together. I don’t have any illusions of what kinds of structures these will be. Five story parking decks will occupy the center of each city block size complex and the edges will be wrapped in apartments and condos. There will be a couple of street level storefronts here and there. “Texas doughnuts.” Meh. That’s just what works in terms financing and code compliance these days. Anything more subtle is too hard. But it will be infinitely better that vacant lots and elderly motels in this context. Don’t let the perfect be the enemy of the good.

Perhaps what captured the attention of city officials was the rebirth of the Midtown area immediately south of downtown. A new generation of young professionals started moving in to what had been a neglected commercial corridor. The architecture isn’t anything special, but it was small scale enough that individual family businesses could own and operate shops and breath new life in to the mini business district incrementally.

Aside from the many older existing mom and pop shops new establishments are opening up all the time. There are now great places to eat and gather for a $5 lunch or a $200 dinner. That wasn’t true a few years back.

The driver of economic change in Midtown is the existence of modest starter homes near urban amenities that have been rediscovered. There’s strong market demand for smaller homes with a patch of garden in tolerably walkable neighborhoods near a Main Street. The architects have already arrived with their Dwell Magazine aesthetic. I first began to understand this dynamic in Portland, Oregon some years ago. Halfway between the urban core and the fringe sprawl is a particular sweet spot for a lot of people.

Out past Midtown is Dead Mall Land. Here again developers and city officials understand the value of taking old crap and giving it new life. The Park Lane Mall is becoming a mixed use New Urbanist lifestyle center. Again, these will be big boxy Texas doughnuts with as much structured parking as human habitat. Do I want to find my “creative side” on an old parking lot on the side of an eight lane suburban arterial? Shrug. But it’s better than a dead mall…

Off in another direction there’s an older suburban subdivision where I discovered the crunchy hippy quarter. If you’re the type who wants a half acre off grid urban homestead that’s within bicycle distance of the university and downtown – Reno’s got it. This family paid $40,000 cash for their place a few years ago and they love their self selecting population of live-and-let-live neighbors.

So here’s my Reno epiphany. Almost every place in America has the same basic qualities. If you’re in Rockford, Illinois or Columbus, Georgia or Denton, Texas or Missoula, Montana the same buffet of potential options are on offer – give or take a few regional variations. There’s a medical center, a half assed downtown, some kind of college, an interstate to a bigger city not too far away, and maybe a second or third tier airport. The future of America is all about salvaging what we already have piecemeal over the next century.

My young friend is back in the suburbs of Hartford, Connecticut now. It’s not that different from Reno. My retired friends are back home in a remote suburb of Los Angeles where they will be staying for the duration. Their town is nearly identical to Reno, minus the casinos. This is where almost everyone lives: the good enough landscape of moderate means. It may not be Paris, but it gets the job done. We need to stop pretending there’s some perfect place out there and get comfortable with where we are. Your town isn’t a dress rehearsal. This is it folks.

This piece first appeared on Granola Shotgun.

John Sanphillippo lives in San Francisco and blogs about urbanism, adaptation, and resilience at granolashotgun.com. He's a member of the Congress for New Urbanism, films videos for faircompanies.com, and is a regular contributor to Strongtowns.org. He earns his living by buying, renovating, and renting undervalued properties in places that have good long term prospects. He is a graduate of Rutgers University.

Trump’s Infrastructure Plan Is A Rare, And Potentially Bipartisan, Feel Good Moment

$
0
0

President Trump’s proposed trillion dollar plus infrastructure program represents a rare, and potentially united feel good moment. Yet before we jump into a massive re-do of our transportation, water and electrical systems, it’s critical to make sure we get some decent bang for the federal buck.

In principle, improving our physical connectivity should improve the economy, particularly in more rural areas where moving goods is often challenging. Modernizing our dilapidated waterways, protecting coastal cities from floods, preparing better systems to store water as well as fixing the roads and eliminating traffic bottlenecks are genuine priorities.

Yet, as can be seen by examples from Japan, infrastructure development can also create boondoggles that enrich vested interests but not spur economic growth. Like a child in love of shiny things, politicians tend to embrace infrastructure not so much for its efficacy, but to advance their careers and political agendas.

What can go wrong?

To see how bad decisions can be, look at California, a state which once led in economically critical infrastructure but now striving to present the worst possible example. Over the past two decades, California has become among the states least committed to new infrastructure, despite absurdly high tax levels. And when the spigot has been turned on, it’s been largely to socially engineer people from roads, which provide nearly all trips, to transit.

The losers here are Californians, with massive spending on transit rail rejects people cannot use, while the roads they depend on are among the nation’s worst. Less than 2 percent of the state’s motorized travel is on transit and ridership is declining. Worse, transit provides little mobility compared to cars. In the largest California metropolitan areas, the average worker can reach 65 times as many jobs by car as by transit in 30 minutes, even with our traffic congestion. No wonder that poorer people in Los Angeles are increasingly buying their own cars, a development that UCLA researchers acknowledge is valuable, but then express the view that “driving is too cheap” in a state with high gas prices and an excessively high cost of living.

Rather than improve mobility, Gov. Jerry Brown has obsessed on a high-speed train with costs more than twice original projections, yet, with now slower travel times. This vanity project could place enormous strains on the state budget, while doing little, or nothing, to reduce greenhouse gases. Prominent Democrats, like Senate Transportation Chairman Jim Beall, D-San Jose, have turned skeptical while the liberal columnist George Skelton has uncharacteristically suggested Brown’s legacy could well end up as a “boondoggle bullet train to nowhere.”

Read the entire piece at The Orange County Register.

Joel Kotkin is executive editor of NewGeography.com. He is the Roger Hobbs Distinguished Fellow in Urban Studies at Chapman University and executive director of the Houston-based Center for Opportunity Urbanism. His newest book is The Human City: Urbanism for the rest of us. He is also author of The New Class ConflictThe City: A Global History, and The Next Hundred Million: America in 2050. He lives in Orange County, CA.

Wendell Cox is principal of Demographia, an international public policy and demographics firm. He is a Senior Fellow of the Center for Opportunity Urbanism (US), Senior Fellow for Housing Affordability and Municipal Policy for the Frontier Centre for Public Policy (Canada), and a member of the Board of Advisors of the Center for Demographics and Policy at Chapman University (California). He is co-author of the "Demographia International Housing Affordability Survey" and author of "Demographia World Urban Areas" and "War on the Dream: How Anti-Sprawl Policy Threatens the Quality of Life." He was appointed to three terms on the Los Angeles County Transportation Commission, where he served with the leading city and county leadership as the only non-elected member. He served as a visiting professor at the Conservatoire National des Arts et Metiers, a national university in Paris.

Photo: Joe Mabel [GFDL or CC BY-SA 3.0], via Wikimedia Commons

US Senior Population Trends by Size of Market

$
0
0

Around the world, including the United States, senior populations are rising much faster than those of other ages, as fertility rates have plummeted. Since the 2010 Census, the share of US population 65 years of age and older has risen 3.3 percent annually, more than four times the overall average of 0.7 percent and more than ten times the 0.3 percent average growth rate for people under 65 years of age (Figure 1).

This article examines senior growth by labor/housing market. This includes all 933 markets designated by the Office of Management and Budget based upon commuting data (metropolitan areas and micropolitan areas) and includes those not designated (Note).

Markets Where Senior Gains Have Been the Most and Least

The largest senior population percentage gains have been in areas considered prime retirement markets. Senior population is up the most, near 80 percent, in Steamboat Springs, Colorado. The Villages, Florida and Edwards, Colorado also had increases over 70 percent. The 15 fastest growing markets include four in Colorado and two each in Idaho and Utah. Only one of the top 15 is a major metropolitan area (over 1,000,000), Austin (Figure 2), which is in comparatively low tax and cost compared to most coastal metropolitan areas. The areas with the lowest senior growth rates were all smaller, with three areas having declines. The largest decline was in Williston, North Dakota, which has experienced substantial population growth among younger people during the expansion of the oil industry (Figure 3).

While senior domestic migration data is not readily available, trends can be roughly estimated by the extent to which growth has exceeded or fallen short of the national senior population growth rate. Fourteen of the 15 largest gains have occurred in the major metropolitan areas, led by Atlanta, Houston and Dallas-Fort Worth, where overall senior growth exceed by 80,000 the number that would have occurred at the national rate (Figure 4). The largest relative senior population losses have occurred in major metropolitan areas of the East and Midwest, with the greatest loss, by far, in the New York metropolitan area (Figure 5).

Senior Growth by Size of Labor/Housing Market

Senior population growth rates since 2010 have been from 15 to 19 percentage points greater than the overall population increase rate each of the labor/housing market population categories used in this article (Figure 6). The strongest growth rates, for both seniors and overall, have been in metropolitan areas from 1 million to 5 million. The 250,000 to 1,000,000 categories had somewhat slower growth rates. The megacities, over 10 million (New York and Los Angeles) had among the lowest growth rates. The lowest growth rates were in labor/housing markets with under 250,000 population.

Markets over 1,000,000: Among the major metropolitan areas (over 1,000,000 population), all of the fastest growing 15 for seniors were in the South and West, led by Austin, Raleigh, Atlanta, Houston and Las Vegas (Figure 7). All 15 areas are more than 90 percent suburban and exurban, except for Seattle (89 percent) and Washington (83 percent). The slowest growing major metropolitan areas are all in the East and Midwest, except for nearby Baltimore, which is in the South (Figure 8). Ten of the 12 least suburbanized metropolitan areas are included among the 15 with the slowest senior growth rates, and includes four of the six “transit legacy cities,” New York, Chicago, Philadelphia and Boston. So much for the popular media meme of seniors flocking “back to the city.”

Markets 500,000 – 1,000,000: Boise, Charleston (SC) and Durham had the highest senior growth rates in the 500,000 to 1,000,000 category. All of the other top 15 were in the South or West except for Madison, WI and Des Moines (Figure 9). The lowest growth markets were all in the East and Midwest, with Scranton, PA and Youngstown, OH growing the least. All of the other bottom 15 were outside the East and Midwest, with the exceptions of Wichita and Honolulu (Figure 10).

Markets 250,000 – 500,000: By far the highest growth in the 250,000 to 500,000 population markets was Myrtle Beach, SC-NC, growing nearly 60 percent (Figure 11). All of the fastest growth markets were in the South and West, except for Ann Arbor (MI). Utica (NY) and Erie (PA) had the slowest growth rates (Figure 12).

Markets 100,000 – 250,000: The Villages, FL had the largest senior growth rate in the 100,000 to 250,000 category. All in this category were in the South and West except for Lawrence, KS (Figure 13). All of the slowest senior growth rates were in the East and Midwest, except for Midland and Odessa in Texas. The slowest growing markets were Johnstown and Pottstown, PA (Figure 14).

Markets 50,000 – 100,000: All of the highest senior growth rates in the 50,000 to 100,000 category were in the West or South, led by three Colorado markets, Edwards, Glenwood Springs and Durango (Figure 15). By far the slowest growth was in Minot, ND (Figure 16).

Markets Under 50,000: This category includes markets designated by the Office of Management and Budget and all undesignated markets (not defined as metropolitan or micropolitan areas). Among the designated markets, the fastest senior growth was in Steamboat Springs (Figure 17), CO, which had the highest growth rate among the 933 markets (above), followed by Breckenridge, CO. Only three senior population losses occurred among the 933 markets, all in the under 50,000 category, Williston, ND, Pampa, TX and Big Spring, TX (Figure 18).

Toward the South and West

In a previous article, we showed that senior population growth within the major metropolitan areas has been in the suburbs and exurbs. Overall, trends among all labor/housing markets is consistent with that finding, that senior growth is dominated by the South and West, where suburban form and suburban densities are nearly universal.

Note: A common error is the characterization of areas outside metropolitan areas as “rural.” In fact rural and urban definitions are independent of metropolitan areas. All metropolitan areas are both rural and urban. Indeed, labor/housing markets (such as metropolitan areas) are virtually all both urban and rural. Metropolitan areas include an urban area as the core and the rural areas (and smaller urban areas) from which a sufficient percentage of workers commute. Among the major metropolitan areas, more than 80 percent of the land area is rural (see: "Rural Character in America's Metropolitan Areas.")

Wendell Cox is principal of Demographia, an international public policy and demographics firm. He is a Senior Fellow of the Center for Opportunity Urbanism (US), Senior Fellow for Housing Affordability and Municipal Policy for the Frontier Centre for Public Policy (Canada), and a member of the Board of Advisors of the Center for Demographics and Policy at Chapman University (California). He is co-author of the "Demographia International Housing Affordability Survey" and author of "Demographia World Urban Areas" and "War on the Dream: How Anti-Sprawl Policy Threatens the Quality of Life." He was appointed to three terms on the Los Angeles County Transportation Commission, where he served with the leading city and county leadership as the only non-elected member. He served as a visiting professor at the Conservatoire National des Arts et Metiers, a national university in Paris.

Photograph: Steamboat Springs, Colorado: Fastest Growing Senior Population
https://upload.wikimedia.org/wikipedia/commons/3/38/Steamboat_Springs_do...


Rising Car Access Sends LA’s Transit Ridership Falling

$
0
0

Transit ridership is down in a number of markets, but LA’s declines have attracted a lot of attention – and for good reason. LA has invested billions of dollars in rail transit but has failed to grow ridership, which is still below its 1985 levels. And ridership has actually been falling in recent years, even on the existing core rail lines. (New and expanded lines saw some growth).

I don’t see a grand narrative of transit decline at the national level. I think we need to look at local markets to see what’s going on. The Bay Area has seen pretty good performance vs. LA. New York’s ridership is up substantially in the last couple of decades, with recent declines intuitively related to operational reliability problems. It’s probably the same in other legacy cities like DC, whose Metro system has been problem plagued. Chicago’s rail declines have been tagged as resulting from cannibalization of off-peak trips by Uber and Lyft.

What about LA? A new study attributes the transit declines there to sharply higher vehicle access among the transit dependent population.

The study notes that a relatively small number of people and neighborhoods disproportionately fuel transit ridership. The median number of rides in LA is zero. The authors investigate several potential causes of transit decline – falling gas prices, Uber/Lyft, and neighborhood demographic change – but alight on rising access to vehicles as the most likely culprit.

A defining attribute of regular transit riders is their relative lack of private vehicle access. But between 2000 and 2015, households in the SCAG region, and especially lower-income households, dramatically increased their levels of vehicle ownership. Census data show that from 1990 to 2000 the region added 1.8 million people but only 456,000 household vehicles (or 0.25 vehicles per new resident). From 2000 to 2015, the SCAG region added 2.3 million people and 2.1 million household vehicles (or 0.95 vehicles per new resident).

The growth in vehicle access has been especially dramatic among subsets of the population that are among the heaviest users of transit. Between 2000 and 2015, the share of households in the region with no vehicles fell by 30 percent, and the share of households with fewer vehicles than adults fell 14 percent. Among foreign-born residents, zero-vehicle households were down 42 percent, and those with fewer vehicles than adults were down 22 percent. Finally, among foreign-born households from Mexico, the share of households without vehicles declined an astonishing 66 percent, while households with more adults than vehicles dropped 27 percent. Living in a household without a vehicle is perhaps the strongest single predictor of transit use; the decline of these households has powerful implications for transit in Southern California.

Public transportation is unlikely to fare well when Southern California is flooded with additional vehicles, especially when those vehicles are owned disproportionately by transit’s traditional riders. Much of the region’s built environment is designed to accommodate the presence of private vehicles and to punish their absence. Extensive street and freeway networks link free parking spaces at the origin and destination of most trips. Driving is relatively easy, while moving around by means other than driving is not. These circumstances give people strong economic and social incentives to acquire cars, and —once they have cars —to drive more and ride transit less.

The advantages of automobile access, which are particularly large for low-income people with limited mobility, suggest that transit agencies should not respond to falling ridership by trying to win back former riders who now travel by auto. A better approach may be to convince the vast majority of people who rarely or never use transit to begin riding occasionally instead of driving.

Click through to read the entire study.

Note that they don’t completely discount neighborhood change as a factor. They suggest that it needs more study.

What this study suggests to me is that LA’s ridership declines may be more entrenched than those in places like NYC and DC, which I believe could be reversed by improving reliability.

This piece originally appeared on Urbanophile.

Aaron M. Renn is a senior fellow at the Manhattan Institute, a contributing editor of City Journal, and an economic development columnist for Governing magazine. He focuses on ways to help America’s cities thrive in an ever more complex, competitive, globalized, and diverse twenty-first century. During Renn’s 15-year career in management and technology consulting, he was a partner at Accenture and held several technology strategy roles and directed multimillion-dollar global technology implementations. He has contributed to The Guardian, Forbes.com, and numerous other publications. Renn holds a B.S. from Indiana University, where he coauthored an early social-networking platform in 1991.

Photo Credit: Nserrano, CC BY-SA 3.0

2017: Transit’s Disastrous Year

$
0
0

Nationwide transit ridership in December 2017 was nearly 5 percent less than December 2016. Ridership for the calendar year was 2.6 percent less than in 2016 and 6.7 percent less than 2014, transit’s recent peak. These numbers are based on the latest National Transit Database spreadsheet posted by the Federal Transit Administration.

As usual, I’ve supplemented the FTA file by summing the years (2002 through 2017 in columns GU through HJ), transit agencies (rows 2101 through 3098), and the 200 largest urban areas (rows 3101 through 3300). The resulting spreadsheet is about 8 megabytes. While these numbers may be preliminary, they provide a pretty good indication of the health — or lack of it — of the transit industry.

The results show that 2017 ridership was lower than in 2016 in all but two of the fifty largest urban areas: Phoenix and Seattle. As of the posting of November data, it appeared that Houston would be a member of this tiny club, but Houston’s December ridership fell by 1.1 percent from December 2016, leading 2017 as a whole to be 0.1 percent less than 2016. While some of that decline may have been due to Hurricane Harvey, the December drop off does not bode well for 2018.

Phoenix’s positive numbers may be deceptive as 2016 was a considerable drop from numbers posted in 2012 through 2014. As a result, while 2017 ridership was a 3.5 percent increase from 2016, it was still 4.7 percent less than 2013. Ridership will have to grow for a couple of more years before it reaches 2013 levels.

Despite the fact that the Washington Metro system completed its “safetrack” program and was no longer deliberately delaying trains, its ridership continued to fall, with December 2017 numbers being nearly 6 percent less than December 2016. WMATA often bragged that Metro rail was the second-most popular rail system in the country, but as the DC Policy Center noted yesterday, it has been overtaken by the Chicago Transit Authority. This isn’t because CTA numbers grew; just they they declined slower than DC Metro ridership. The tipping point came in July 2016; though Metrorail has sometimes beaten the CTA since then, since August 2017 CTA has remained firmly in the lead.

Of course, Washington and Chicago transit ridership combined are still only a small fraction — less than a quarter — of New York transit ridership. December ridership in the New York urban area, which includes New Jersey Transit, was 4.0 percent less than in 2016, and ridership for the year was 1.0 percent less.

Ridership is falling for all major kinds of transit. Comparing December 2017 with December 2016, commuter rail lost 3.5 percent of its riders; heavy rail 3.9 percent; light rail 4.7 percent; and buses — including rapid buses, commuter buses, and trolley buses — 6.0 percent. When compared with 2014, buses are down by nearly 11 percent.

All in all, 2017 was a disastrous year for the transit industry. Total ridership fell below 9.8 billion rides for the first time since 2006, and the 2.6 percent annual decline was the biggest drop since 1995. At the rate ridership is falling, it will be down to its 1995 low of 7.7 million rides in less than ten years. Transit agency leaders may fool themselves into thinking they can reverse this decline, but as the Antiplanner has explained elsewhere, it is unlikely.

This piece first appeared on The Antiplanner.

Randal O’Toole is a senior fellow with the Cato Institute specializing in land use and transportation policy. He has written several books demonstrating the futility of government planning. Prior to working for Cato, he taught environmental economics at Yale, UC Berkeley, and Utah State University.

Photo: Laurence's Pictures from USA [CC BY 2.0], via Wikimedia Commons

Inclusionary Zoning Flops in Portland

$
0
0

As the price of housing continues to rise in many cities, one popular progressive policy idea to address it is inclusionary zoning. Inclusionary zoning requires that a certain percentage of units in a building be priced at below market, targeted at people who earn some fraction of the area median income. Often this set aside is required in exchange for density bonuses or other things the developer might want.

Portland passed one of these, and according to a report in the Portland Mercury, construction fell off a cliff:

A year ago, Portland City Council enacted “Inclusionary Housing” (IH), a new policy requiring any apartment building of 20 units or more to rent a portion of them below market rates—from 30 to 80 percent of the city’s median family income, depending on the option a developer selects.

When the city implemented the policy, detractors warned the new rules would simply ensure developers stopped building here. City officials argued IH would force the private market to create much-needed affordable units in Portland’s building boom.

A year into the policy, the detractors seem to be winning. Apartment construction in Portland has fallen off a cliff, though there’s still ambiguity as to whether IH or other market forces are the key reason. Meanwhile, Mayor Ted Wheeler is planning to sweeten the deals that the city offers developers to convince them to build.

So far, IH’s results are underwhelming. According to the city’s Bureau of Development Services, 12 qualifying buildings with a total of 682 units have applied for permits since the IH policy went into effect on February 1, 2017. Under IH, those projects could bring in anywhere from 55 to 170 below-market units, depending on the options their owners select (not all developers have decided, so an actual number of affordable units isn’t clear).

Whatever the case, 682 is a huge drop off for a housing market that from 2013 to 2017 typically built between 3,000 and 6,000 new units per year. And the number doesn’t give the complete picture.

..

“We’ve seen the spigot turned off so completely, so fast,” says Kurt Schultz, a principal at SERA Architects, who notes that his clients who’ve worked with similar policies in other cities often blanch when told of Portland’s strict IH rules. “I’ve never seen it turned off so fast before, and I’ve been doing this for 30 years.”

I don’t have any real analysis to give on this, but the reporting is pretty stark. Click through to read the whole thing.

This piece originally appeared on Urbanophile.

Aaron M. Renn is a senior fellow at the Manhattan Institute, a contributing editor of City Journal, and an economic development columnist for Governing magazine. He focuses on ways to help America’s cities thrive in an ever more complex, competitive, globalized, and diverse twenty-first century. During Renn’s 15-year career in management and technology consulting, he was a partner at Accenture and held several technology strategy roles and directed multimillion-dollar global technology implementations. He has contributed to The Guardian, Forbes.com, and numerous other publications. Renn holds a B.S. from Indiana University, where he coauthored an early social-networking platform in 1991.

Photo Credit: Cacophony, GFDL

Confessions of a Rust Belt Orphan (How I Learned to Stop Worrying and Love Northeast Ohio)

$
0
0

Go to sleep, Captain Future, in your lair of art deco
You were our pioneer of progress, but tomorrow’s been postponed
Go to sleep, Captain Future, let corrosion close your eyes
If the board should vote to restore hope, we’ll pass along the lie

-The Secret Sound of the NSA, Captain Future

In the Beginning…

As near as I can tell, the term “Rust Belt” originated sometime in the mid-1980s.  That sounds about right.  

I originated slightly earlier, in 1972, at St. Thomas Hospital in Akron, Ohio, Rubber Capital of the World.  My very earliest memory is of a day, sometime in the Summer of 1975, that my parents, my baby brother, and I went on a camping trip to Lake Milton, just west of Youngstown.  I was three years old.  To this day, I have no idea why, of all of the things that I could remember, but don’t, I happen to remember this one.  But it is a good place to start. 

The memory is so vivid that I can still remember looking at the green overhead freeway signs along the West Expressway in Akron.  Some of the signs were in kilometers, as well as in miles back then, due to an ill-fated attempt to convert Americans to the Metric system in the 1970s.  I remember the overpoweringly pungent smell of rubber wafting from the smokestacks of B.F. Goodrich and Firestone.  I recall asking my mother about it, and her explaining that those were the factories where the tires, and the rubber, and the chemicals were made.  They were made by hard-working, good people - people like my Uncle Jim - but more on that, later.

When I was a little bit older, I would learn that this was the smell of good jobs; of hard, dangerous work; and of the way of life that built the modern version of this quirky and gritty town.  It was the smell that tripled Akron’s population between 1910 and 1920, transforming it from a sleepy former canal-town to the 32nd largest city in America.  It is a smell laced with melancholy, ambivalence, and nostalgia – for it was the smell of an era that was quickly coming to an end (although I was far too young to be aware of this fact at the time).  It was sometimes the smell of tragedy.

We stopped by my grandparents’ house, in Firestone Park, on the way to the campground.  I can still remember my grandmother giving me a box of Barnum’s Animals crackers for the road.  She was always kind and generous like that.

Who were my grandparents?  My grandparents were Akron.  It’s as simple as that.  Their story was Akron’s story.  My grandfather, George Segedy, was born in 1916, in Barnesboro, a small coal-mining town in Western Pennsylvania, somewhere between Johnstown, DuBois, and nowhere.  His father, a coal miner, had emigrated there from Hungary nine years earlier.  My grandmother, Helen Szabo, was born in Barberton, in 1920.  Barberton was reportedly the most-industrialized city in the United States, per-capita, at some point around that time.

They were both factory workers for their entire working lives (I don’t think they called jobs like that “careers” back then).  My grandfather worked at the Firestone Tire & Rubber Company.  My grandmother worked at Saalfield Publishing, a factory that was one of the largest producers of children’s books, games, and puzzles in the world.  Today, both of the plants where they worked form part of a gutted, derelict, post-apocalyptic moonscape in South Akron, located between that same West Expressway and perdition.  The City of Akron has plans for revitalizing this former industrial area.  It needs to happen, but there are ghosts there…

My name is Ozymandias, King of Kings,
Look on my works, ye Mighty, and despair!
Nothing beside remains. Round the decay
Of that colossal wreck, boundless and bare
The lone and level sands stretch far away.

-Percy Bysshe Shelley, Ozymandias

My grandparents’ house exemplified what it was to live in working-class Akron in the late 1970s and early 1980s.  My stream-of-consciousness memories of that house include:  lots of cigarettes and ashtrays; Hee-Haw; The Joker’s Wild; fresh tomatoes and peppers; Fred & Lamont Sanford; Archie & Edith Bunker; Herb Score and Indians baseball on the radio on the front porch; hand-knitted afghans; UHF/VHF; 3, 5, 8, and 43; cold cans of Coca-Cola and Pabst Blue Ribbon (back when the pop-tops still came off of the can); the Ohio Lottery; chicken and galuskas (dumplings); a garage floor that you could eat off of; a meticulously maintained 14-year-old Chrysler with 29,000 miles on it; a refrigerator in the dining room because the kitchen was too small; catching fireflies in jars; and all being right with the world.

I always associate the familiar comfort of that tiny two-bedroom bungalow with the omnipresence of cigarette smoke and television.  I remember sitting there on May 18, 1980.  It was my eighth birthday.  We were sitting in front of the TV, watching coverage of the Mount St. Helens eruption in Washington State.  I remember talking about the fact that it was going to be the year 2000 (the Future!) in just twenty years.  It was an odd conversation for an eight year old to be having with adults (planning for the future already, and for a life without friends, apparently).  I remember thinking about the fact that I would be 28 years old then, and how inconceivably distant it all seemed.  Things seem so permanent when you’re eight, and time moves ever-so-slowly.

More often than not, when we visited my grandparents, my Uncle Jim and Aunt Helen would be there.  Uncle Jim was born in 1936, in West Virginia.  His family, too, had come to Akron to find work that was better-paying, steadier, and (relatively) less dangerous than the work in the coal mines.  Uncle Jim was a rubber worker, first at Mohawk Rubber and then later at B.F. Goodrich.  Uncle Jim also cut hair over at the most-appropriately named West Virginia Barbershop, on South Arlington Street in East Akron.  He was one of the best, most decent, kindest people that I have ever known.

I remember asking my mother once why Uncle Jim never washed his hands.  She scolded me, explaining that he did wash his hands, but that because he built tires, his hands were stained with carbon-black, which wouldn’t come out no matter how hard you scrubbed.  I learned later, that it would take about six months for that stuff to leach out of your pores, once you quit working.

Uncle Jim died in 1983, killed in an industrial accident on the job at B.F. Goodrich.  He was only 47.  The plant would close for good about a year later.

It was an unthinkably tragic event, at a singularly traumatic time for Akron.  It was the end of an era.

Times Change

My friend Della Rucker recently wrote a great post entitled The Elder Children of the Rust Belt over at her blog, Wise Economy.  It dredged up all of these old memories, and it got me thinking about childhood, about this place that I love, and about the experience of growing up just as an economic era (perhaps the most prosperous and anomalous one in modern history) was coming to an end.

That is what the late 1970s and early 1980s was:  the end of one thing, and the beginning of a (still yet-to-be-determined) something else.  I didn’t know it at the time, but that’s because I was just a kid. 

In retrospect it was obvious:  the decay; the deterioration, the decomposition, the slow-at-first, and then faster-than-you-can-see-it unwinding of an industrial machine that had been wound-up far, far, too-tight.  The machine runs until it breaks down; then it is replaced with a new and more efficient one - a perfectly ironic metaphor for an industrial society that killed the goose that laid the golden egg.  It was a machine made up of unions, and management, and capitalized sunk costs, and supply chains, and commodity prices, and globalization.  Except it wasn’t really a machine at all.  It was really just people.  And people aren’t machines.  When they are treated as such, and then discarded as obsolete, there are consequences.

You could hear it in the music:  from the decadent, desperately-seeking-something (escape) pulse of Disco, to the (first) nihilistic and (then) fatalistic sound of Punk and Post-Punk.  It’s not an accident that a band called Devo came from Akron, Ohio.  De-evolution:  the idea that instead of evolving, mankind has actually regressed, as evidenced by the dysfunction and herd mentality of American society.  It sounded a lot like Akron in the late 1970s.  It still sounds a little bit like the Rust Belt today.

As an adult, looking back at the experience of growing up at that time, you realize how much it colors your thinking and outlook on life.  It’s all the more poignant when you realize that the “end-of-an-era” is never really an “end” as such, but is really a transition to something else.  But to what exactly?

The end of that era, which was marked by strikes, layoffs, and unemployment, was followed by its echoes and repercussions: economic dislocation, outmigration, poverty, and abandonment; as well as the more intangible psychological detritus – the pains from the phantom limb long after the amputation; the vertiginous sensation of watching someone (or something) die. 

And it came to me then 
That every plan 
Is a tiny prayer to Father Time

As I stared at my shoes
In the ICU
That reeked of piss and 409

It sung like a violent wind
That our memories depend
On a faulty camera in our minds

‘Cause there’s no comfort in the waiting room
Just nervous paces bracing for bad news

Love is watching someone die…

-Death Cab For Cutie, What Sarah Said

But it is both our tragedy and our glory that life goes on. 

Della raised a lot of these issues in her post:  our generation’s ambivalent relationship with the American Dream (like Della, I feel the same unpleasant taste of rust in my mouth whenever I write or utter that phrase); our distrust of organizations and institutions; and our realization that you have to keep going, fight, and survive, in spite of it all.  She talked about how we came of age at a time of loss:

not loss like a massive destruction, but a loss like something insidious, deep, pervasive.

It is so true, and it is so misunderstood.  One of the people commenting on her blog post said, essentially, that it is dangerous to romanticize about a “golden age”; that all generations struggle; and that life is hard.

Yes, those things are all true.  But they are largely irrelevant to the topic at hand.

There is a very large middle ground between a “golden age” and an “existential struggle”.  The time and place about which we are both writing (the late 1970s through the present, in the Rust Belt) is neither.  But it is undoubtedly a time of extreme transition.  It is a great economic unraveling, and we are collectively and individually still trying to figure out how to navigate through it, survive it, and ultimately build something better out of it.

History is cyclical.  Regardless of how enamored Americans, in general, may be with the idea, it is not linear.  It is neither a long, slow march toward utopia, nor toward oblivion.  When I look at history, I see times of relative (and it’s all relative, this side of paradise) peace, prosperity, and stability; and other times of relative strife, economic upheaval, uncertainty, and instability.  We really did move from one of those times to the other, beginning in the 1970s, and continuing through the present.

The point that is easy to miss when uttering phrases like “life is hard for every generation” is that none of this discussion about the Rust Belt – where it’s been, where it is going - has anything to do with a “golden age”.  But it has everything to do with the fact that this time of transition was an era (like all eras) that meant a lot (good and bad) to the people that lived through it.  It helped make them who they are today, and it helped make where they live what it is today. 

For those that were kids at the time that the great unraveling began (people like me, and people like Della) it is partially about the narrative that we were socialized to believe in at a very young age, and how that narrative went up in a puff of smoke.  In 1977, I could smell rubber in the air, and many of my family members and friends’ parents worked in rubber factories.  In 1982, the last passenger tire was built in Akron.  By 1984, 90% of those jobs were gone, many of those people had moved out of town, and the whole thing was already a fading memory.  Just as when a person dies, many people reacted with a mixture of silence, embarrassment, and denial. 

As a kid, especially, you construct your identity based upon the place in which you live.  The whole identity that I had built, even as a small child, as a proud Akronite:  This is the RUBBER CAPITAL OF THE WORLD; this is where we make lots and lots of Useful Things for people all over the world; this is where Real Americans Do Real Work; this is where people from Europe, the South, and Appalachia come to make a Better Life for themselves; well, that all got yanked away.  I couldn’t believe any of those things anymore, because they were no longer true, and I knew it.  I could see it with my own two eyes.  Maybe some of them were never true to begin with, but kids can’t live a lie the way that adults can.  When the place that you thought you lived in turns out not to be the place that you actually live, it can be jarring and disorienting.  It can even be heartbreaking.

We’re the middle children of history, man. No purpose or place. We have no Great War. No Great Depression. Our great war is a spiritual war. Our great depression is our lives.

-Tyler Durden, Fight Club

I’m fond of the above quote.  I was even fonder of it when I was 28 years old.  Time, and the realization that life is short, and that you ultimately have to participate and do something with it besides analyze it as an outside observer, has lessened its power considerably.  It remains the quintessential Generation X quote, from the quintessential Generation X movie.  It certainly fits in quite well with all of this.  But, then again, maybe it shouldn’t.  

I use the phrase “Rust Belt Orphan” in the title of this post, because that is what the experience of coming of age at the time of the great economic unraveling feels like at the gut-level.  But it’s a dangerous and unproductive combination, when coupled with the whole Gen-X thing. 

In many ways, the Rust Belt is the “Generation X” of regions – the place that just doesn’t seem to fit in; the place that most people would just as soon forget about; the place that would, in fact, just as soon forget about itself; the place that, if it does dare to acknowledge its own existence or needs, barely notices the surprised frowns of displeasure and disdain from those on the outside, because they have already been subsumed by the place’s own self-doubt and self-loathing.

A fake chinese rubber plant
In the fake plastic earth
That she bought from a rubber man
In a town full of rubber plans
To get rid of itself

-Radiohead, Fake Plastic Trees

The whole Gen-X misfit wandering-in-the-Rust Belt-wilderness meme is a palpably prevalent, but seldom acknowledged part of our regional culture.  It is probably just as well.  It’s so easy for the whole smoldering heap of negativity to degenerate into a viscous morass of alienation and anomie.  Little good can come from going any further down that dead-end road.

Whither the Future?

The Greek word for “return” is nostos. Algos means “suffering.” So nostalgia is the suffering caused by an unappeased yearning to return.
-
Milan Kundera, Ignorance

So where does this all leave us? 

First, as a region, I think we have to get serious about making our peace with the past and moving on.  We have begun to do this in Akron, and, if the stories and anecdotal evidence are to be believed, we are probably ahead of the region as a whole. 

But what does “making our peace” and “moving on” really mean?  In many ways, I think that our region has been going through a collective period of mourning for the better part of four decades.  Nostalgia and angst regarding the things that have been lost (some of our identity, prosperity, and national prominence) is all part of the grieving process.  The best way out is always through. 

But we should grieve, not so we can wallow in the experience and refuse to move on, but so we can gain a better understanding of who we are and where we come from.  Coming to grips with and acknowledging those things, ultimately enables us to help make these places that we love better.

We Americans are generally not all that good at, or comfortable with, mourning or grief.  There’s a very American idea that grieving is synonymous with “moving on” and (even worse) that “moving on” is synonymous with “getting over it”. 

We’re very comfortable with that neat and tidy, straight, upwardly-trending line toward the future (and a more prosperous, progressive, and enlightened future it will always be, world without end, Amen.) 

We’re not so comfortable with that messy and confusing historical cycle of boom-and-bust, of evolution and de-evolution, of creation and destruction and reinvention.  But that’s the world as we actually experience it, and it’s the one that we must live in.  It is far from perfect.  I wish that I had another one to offer you.  But there isn’t one on this side of the Great Beyond.  For all of its trials and tribulations, the world that we inhabit has one inestimable advantage:  it is unambiguously real. 

“Moving on” means refusing to become paralyzed by the past; living up to our present responsibilities; and striving every day to become the type of people that are better able to help others.  But “moving on” doesn’t mean that we forget about the past, that we pretend that we didn’t experience what we did, or that we create an alternate reality to avoid playing the hand that we’ve actually been dealt.

Second, I don’t think we can, or should, “get over” the Rust Belt.  The very phrase “get over it” traffics in denial, wishful thinking, and the estrangement of one’s self from one’s roots.  Countless attempts to “get over” the Rust Belt have resulted in the innumerable short-sighted, “get rich quick” economic development projects, and public-private pyramid-schemes that many of us have come to find so distasteful, ineffective, and expensive. 

We don’t have to be (and can’t be, even if we want to) something that we are not.  But we do have to be the best place that we can be.  This might mean that we are a smaller, relatively less-prominent place.  But it also means that we can be a much better-connected, more cohesive, coherent, and equitable place.  The only people that can stop us from becoming that place are we ourselves.

For a place that has been burned so badly by the vicissitudes of the global economy, Big Business, and Big Industry, we always seem to be so quick to put our faith in the Next Big Project, the Next Big Organization, and the Next Big Thing.  I’m not sure whether this is the cause of our current economic malaise, or the effect, or both.  Whatever it is, we need to stop doing it.

Does this mean that we should never do or dream anything big?  No.  Absolutely not.  But it does mean that we should be prudent and wise, and that we should tend to prefer our economic development and public investment to be hyper-nimble, hyper-scalable, hyper-neighborhood-focused, and ultra-diverse.  Fetishizing Daniel Burnham’s famous “Make no little plans…” quote has done us much harm.  Sometimes “little plans” are exactly what we need, because they often involve fundamentals, are easier to pull-off, and more readily establish trust, inspire hope, and build relationships.

Those of us that came of age during the great economic unraveling and (still painful) transition from the Great American Manufacturing Belt to the Rust Belt might just be in a better position to understand our challenges, and to find the creative solutions required to meet them head-on.  Those of us that stuck it out and still live here, know where we came from.  We’re under no illusions about who we are or where we live.  I think Della Rucker was on to something when she listed what we can bring to the table:

  • Determination
  • Long-game focus
  • Understanding the depth of the pit and the long way left to climb out of it
  • Resourcefulness
  • Ability to salvage
  • Expectation that there are no easy answers
  • Disinclination to believe that everything will be all right if only we do this One Big Thing

When I look at this list, I see pragmatism, resilience, self-knowledge, survival skills, and leadership.  It all rings true.  

He wanted to care, and he could not care. For he had gone away and he could never go back any more. The gates were closed, the sun was gone down, and there was no beauty but the gray beauty of steel that withstands all time. Even the grief he could have borne was left behind in the country of illusion, of youth, of the richness of life, where his winter dreams had flourished.

"Long ago,” he said, “long ago, there was something in me, but now that thing is gone. Now that thing is gone, that thing is gone. I cannot cry. I cannot care. That thing will come back no more.” 

-F. Scott Fitzgerald, Winter Dreams

 So, let’s have our final elegy for the Rust Belt.  Then, let’s get to work.

This piece originally appeared on Notes from the Underground.

Jason Segedy is the Director of Planning and Urban Development for the City of Akron, Ohio. Segedy has worked in the urban planning field for the past 22 years, and is an avid writer on urban planning and development issues, blogging at Notes from the Underground. A lifelong resident of Akron’s west side, Jason is committed to the city, its people, and its neighborhoods. His passion is creating great places and spaces where Akronites can live, work, and play.

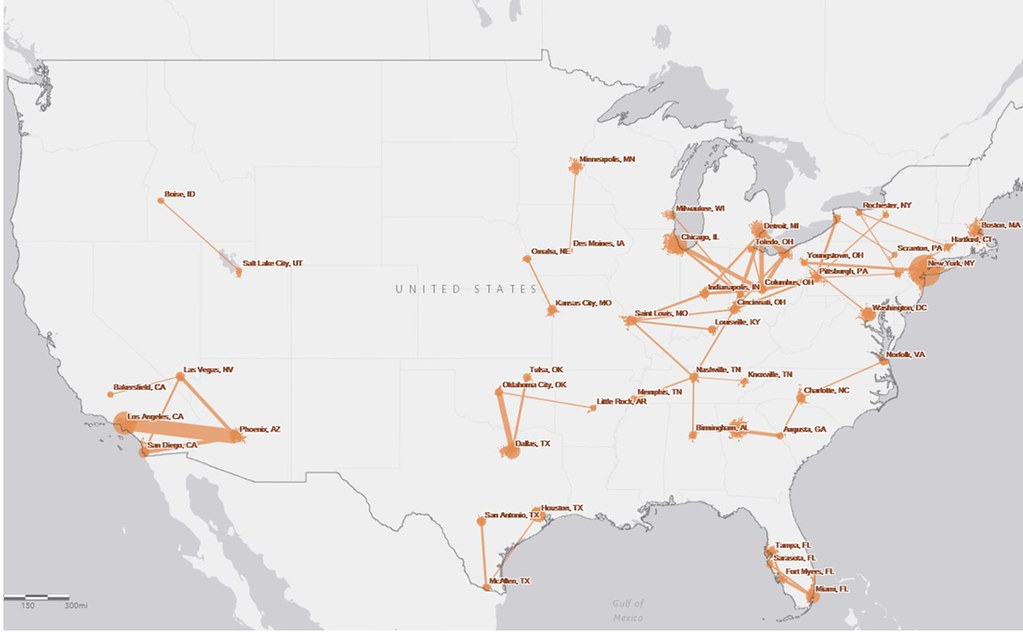
Photo: Change in total number of manufacturing jobs in metropolitan areas, 1954-2002. Dark red represents the largest job losses. Akron is dark red.

Getting On The Road To Republican Resurgence

$
0
0

In his bitter attack on the new budget agreement, Sen. Rand Paul, R-Kentucky, stumbled on the reality of his party’s grim identity crisis. Since the Reagan era, the GOP represented a convergence of corporate interests, social conservatives and free market libertarians. Like Paul and the tea party, all three of these groups have lost power and influence under Trump.

Instead the Republican Party, notes Mike Barone, is morphing into something quite different: a hodgepodge of old economy stalwarts, grassroots populists and nationalists of varied, and sometimes distinctly unpleasant, hues. This alliance is not only unstable, but has failed to expand the resident’s base much beyond 40 percent. In terms of party affiliation barely one in five Americans now identifies with the GOP while one in three favors the Democrats.

To be sure, Republican control of the states is at a historic high-water mark, but the fundamentals nationally seem to be collapsing. Its base constituencies — small towns, white male and high school educated voters — are demographically shrinking, with little chance of a strong turnaround in the short run. To survive, the party must find a way to expand, not further shrink, its political base or end up a pathetic rump, like the Republican Party of California.

Abandon Bannonism

The Trump campaign reflected both nativism and economic distress. It was particularly persuasive in the Midwest, the Southeast and the Intermountain West, where Americans still harvest and build tangible goods. Even the notion of tougher border enforcement, although not mass deportations of those already here, remains popular with a broad spectrum of Americans — including an upward of 40 percent of Hispanics.

But the mean-spirited cast of these policies given by Trump has weakened the party. Former advisor Steve Bannon’s unforgivable, cynical and ultimately counter-productive embrace of alt-right white nationalists has slowed the shift of groups like Jews to the GOP and turned off minority voters en masse. Being “anti-progressive” is not enough to build a strong majority party, as some have suggested.

The base that might cheer Confederate flags or support mass deportations is simply insufficient for an effective national party. The white middle-age voters of today seem all but certain to decrease as minority voter numbers swell. Millennials, ethnically diverse, and now tilting to the Democrats, are about to become the largest voting blog and clearly will determine the future of American politics. A successful party must ultimately appeal to expanding constituencies, not fading ones.

Read the entire piece at The Orange County Register.

Joel Kotkin is executive editor of NewGeography.com. He is the Roger Hobbs Distinguished Fellow in Urban Studies at Chapman University and executive director of the Houston-based Center for Opportunity Urbanism. His newest book is The Human City: Urbanism for the rest of us. He is also author of The New Class ConflictThe City: A Global History, and The Next Hundred Million: America in 2050. He lives in Orange County, CA.

Photo: Gage Skidmore from Peoria, AZ, United States of America (Steve Bannon) [CC BY-SA 2.0], via Wikimedia Commons

Viewing all 3793 articles
Browse latest View live


Latest Images