Quantcast
Channel: Newgeography.com - Economic, demographic, and political commentary about places
Viewing all 3788 articles
Browse latest View live

Will Donald Trump Expose America’s Great Mass Transit Hoax?

$
0
0

Whatever you think of President Trump, his claims about the lousy condition of America’s basic infrastructure are widely accepted—even by resisting Democrats grinding their teeth on a L.A. freeway or waiting for a New York or D.C. train to arrive. His call for a trillion-dollar infrastructure plan may be his last best bet for finding bipartisan support.

The question is if he’s at all serious about the urgent need to fix the failing mass-transit systems we have, or if he’ll repeat what Washington’s done to get us in this mess, and offer funds that encourage cities to build shiny new systems few will actually ride even as the existing ones decay.

As we’ve demonstrated in a new paper for Chapman University (PDF), nowhere is the infrastructure deficit more obvious than in urban transit, which last year lost over 3.1 percent of its ridership, according to the American Public Transit Association (PDF). Despite the vast sums spent by the federal government on light rail, subways, and trolleys since 1970, most mass transit systems fail to meet the needs of commuters.

In many cases, as in New York and Washington, vast expenditures on new lines have occurred even as maintenance has been deferred, with overall service deteriorating. Many billions of dollars more have been spent in other cities on new rail systems that haven’t reduced the number of people driving to work.

How the Feds Failed Legacy Cities

Rail transit works best in what might be considered the “legacy cores.” Approximately 55 percent of America’s transit commuters have destinations in the urban cores (and many of those rides to the central business districts) of six older cities (not metropolitan areas)—New York, Washington, Boston, Philadelphia, Chicago, and San Francisco. New York, by itself, has a remarkable 56 percent of its jobs in its urban core.

Between 2006 and 2015, those six metropolitan areas captured 77 percent of the national increase in transit work trip destinations.

These cities were shaped when public transit held a virtual monopoly on both motorized and horse-drawn passenger transport within U.S. cities. Annual transit ridership peaked in the early 1920s, except for the period around the Second World War, the high-water mark for transit nationally. Between 1960 and 2015, transit’s work trip market share dropped more than 50 percent, from 12.1 percent to 5.2 percent. Until very recently, the demographic recovery of legacy cores, notably New York, drove a slight increase in transit share. But this progress is threatened by growing safety and reliability issues. Part of the problem stems from a decision by New York’s political elite, starting with Michael Bloomberg, to build a new, ultra-expensive line—the Second Avenue subway—while maintenance on other lines deteriorated. This decision reflects political realities including federal incentives for new systems, and the greater political rewards for building shiny new things.

The result is that service delays in New York have skyrocketed as antiquated signals break down, with breakdowns now twice as frequently as they were just five years ago. After decades of increases, ridership has declined while the extensive commuter rail system serving Manhattan from the suburbs (the nation’s largest) is experiencing its own substantial difficulties.

The picture is similar in Washington, D.C., where the U.S. secretary of Transportation went so far as to threaten a shutdown of the system due to fatal accidents, attributed to policies that prioritized system expansion over safety. D.C.’s transit ridership, growing for decades, has now declined as well.

The Real Train Robbery

Yet even as cities that depend on transit, such as New York, suffer from under-investment, Washington has poured billions into new rail system in cities created largely in the auto-dominated era. Among 19 metropolitan areas that have opened substantially new urban rail systems since 1980, the share of riders using mass transit remains below the national average while the share of those driving alone has increased.

Nowhere is the power of ideology and entrenched interests over the common good more evident than in Los Angeles, the pioneer for the multi-polar and highly dispersed post-1950 metropolis.

On the surface, L.A. provides the sunbelt’s best case for transit—it once had a robust transit system, is the densest urban area in the country, has a huge poverty population and ideal weather for waiting outside for the train. L.A. has been widely celebrated as “the next great transit city,” and The New York Timesand others are continually celebrating its imminent conversion from a car culture to a train one. Some believers, like Los Angeles architectural critic Christopher Hawthorne, envision “a third Los Angeles” that will see the eclipse of the freeways, single family homes, and suburban neighborhoods.

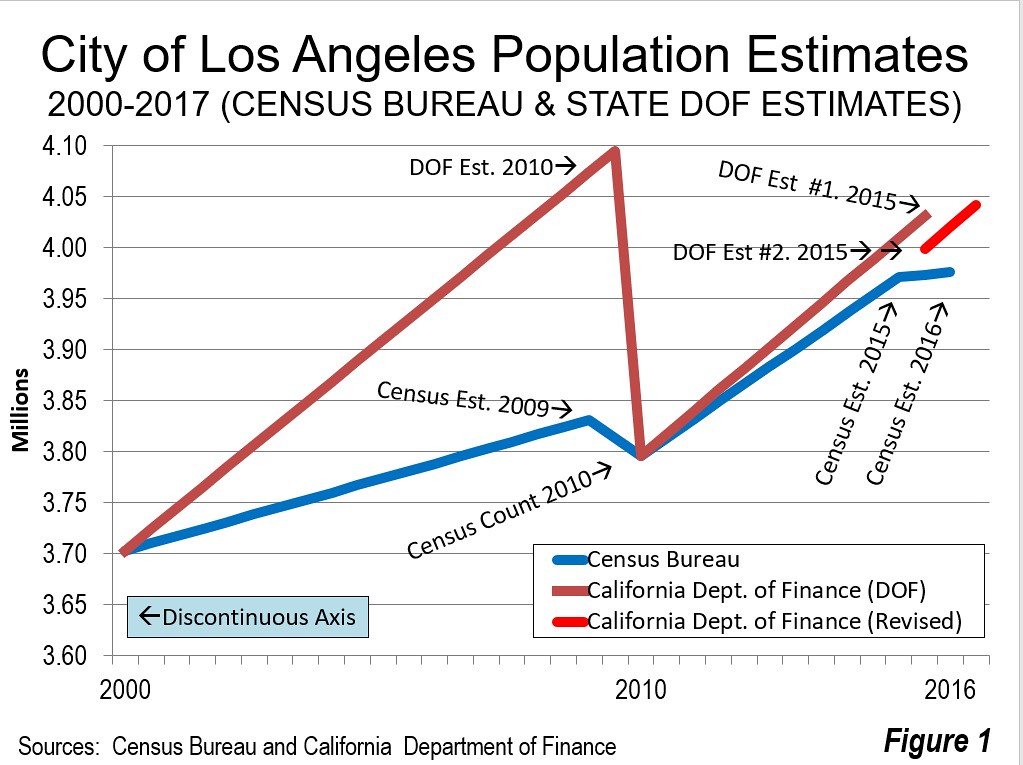
Yet despite this Manhattan envy among its elites, L.A. simply does not follow the “model” of urbanist paragons such as New York, Chicago or San Francisco. Downtown Los Angeles is a relative economic pygmy, accounting for barely 2 percent of regional employment, less than a tenth of lower Manhattan’s share. Transit works best when most commuters are headed to a dominant core destination. The more scattered the destinations, the less likely trains can muster a decent commuter share. The entire Los Angeles MTA system carries fewer riders than New York’s Lexington Avenue line.

Money is not the issue. Since 1990, Los Angeles has opened seven new urban metro and light-rail lines and two exclusive busways at a cost of more than $15 billion. During this period, transit’s work trip market share has dropped from 5.6 percent from 5.1 percent in 2015. Ridership is at least 15 percent below 1985 levels, when there was only bus service and when Los Angeles County had about 20 percent fewer people. No surprise, then, that according to a recent USC study, the new lines have done little or nothing to lessen the area’s infamous congestion.

Rather than hop on the rails, more residents are addressing traffic woes by simply staying home. By 2015, more Los Angeles-area residents were working at home than were taking transit. Since 1990, the number of people working at home increased eight times as rapidly as the number of people using the transit system. The number of people driving increased even more rapidly.

This story is repeated in other sunbelt cities. In Houston, 3.2 of residents commuted to work in 2000, before the city’s $1.5 billion new light-rail system opened. In 2015, the share of commuters had dropped by a third, to 2.2 percent.

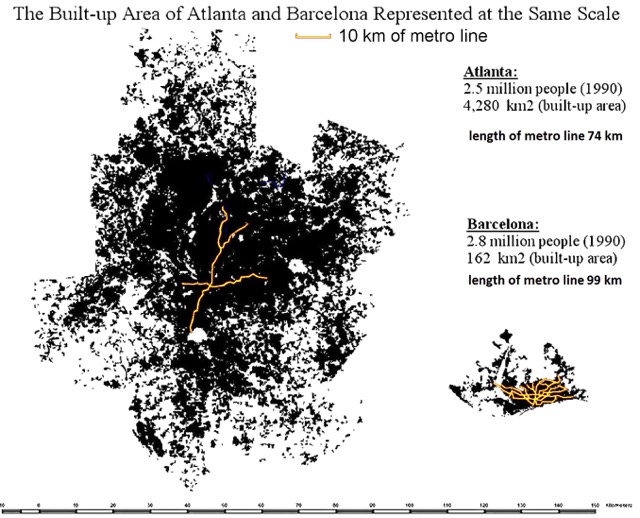
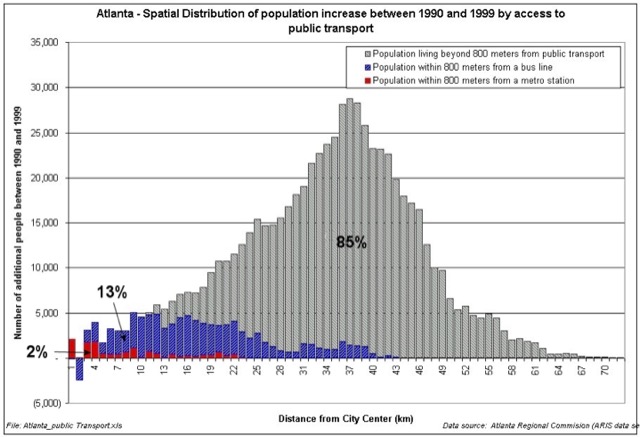
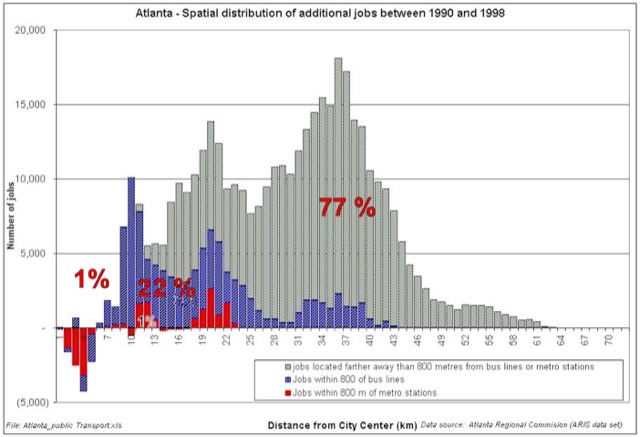
It’s Atlanta, though, that most fully epitomizes the futility of conventional transit spending. With the opening of MARTA in 1979, Atlanta built the third largest new metro system (fully grade separated rail) in the U.S. Since then, transit share has plummeted—from 6.8 percent in 1980 to 3.1 percent in 2015, 40 percent below the average national transit market share. Traffic congestion more than doubled over the same time span.

The most recent addition to Atlanta’s rail system is a central city streetcar line some locals have nicknamed it “a streetcar named undesirable” for its low ridership.

Even urban planning model Portland, which opened its MAX light rail system in 1986, has seen its transit market share drop from 7.9 percent in 1980 to 6.9 percent in 2015, only modestly above the national transit-riding average. The percentage of people working at home rose from 2.3 to 6.4 percent, at virtually no cost to the public treasury, compared to the more than $3 billion to build urban rail.

But the award for the country’s most absurd project should go to the Honolulu elevated rail line. In a metropolitan area of barely a million people, the attempt to build a 20-mile elevated train has increased in cost from $5 billion to an estimated $10 to $13 billion, with the feds chipping in $1.6 billion. The impact on state finances—for an estimated 1 percent drop in road traffic—so disturbed former Governor Ben Cayetano, a Democrat, that he’s publicly called on President Trump to cut future funding. The Honolulu Star-Advertiser recently referred to the elevated lines as an “epic fail on rail.”

The Future of Transit

Before President Trump or Congress tackle infrastructure, they should work to remove federal involvement in control of local transit spending. Some experts like David Levinson of the University of Minnesota, blame federal policy for distorting investment to new project that favor “ribbon-cuttings for politicians” while resulting in neglect for local operations.

In most of the country, simply put, localities would be better off not investing in new rail schemes. Americans seem generally happy with their overwhelmingly suburban lifestyle and their ability to reach places of employment faster than most of those in the high-income world can. Today, over 75 percent of jobs are in the suburbs and exurbs combined. Between 2010 and 2015, 81 percent of job growth was in the suburbs and exurbs. Similarly 85 percent of major metropolitan area residents live outside the urban core, in the suburbs and exurbs, where transit service is sparse.

This is not likely to change much in the near or even medium term. Rather than centralizing, the consulting firm Bain envisions evolution toward a “post-urban economy” that will be more localized and home-based. By 2025, it reports, more people could live “beyond the traditional commuting belt” than inside.

These realities suggest that rather than the “one size fits all” model, metropolitan areas should better customize their transportation spending to local needs. To achieve this, we need to jettison the quasi-religious affection for rail transit and explore in most of the country technologically enabled solutions such as telework, which is growing faster than any form of commuting, as well as rideshare technology. This is particularly true in suburbs, such as Dublin, California, which eliminated their local bus system in exchange for providing vouchers for Uber-like services for those unable to afford or drive cars.

Over the longer term, the autonomous car could make even more revolutionary impacts on both the urban form and transit. Automated car proponents claim that the cost of operations will be considerably below that of today’s cars. If that should be achieved, the autonomous car could be used to provide door-to-door mobility not only for the elderly and disabled, but also for people who currently cannot afford their own cars. Under any circumstances, this innovation seems certain to further weaken conventional transit outside the cities with legacy cores.

Ultimately it will take common sense, even more than just money, to fix our transit problems. In dispersed places like southern California, Dallas-Fort Worth, and Houston, the emphasis may be on using new technologies as well as private express bus service to connect their widely dispersed communities. Monies that go into rail transit, suggest urban analyst Aaron Renn, should be focused on maintaining and improving current service in cities where they make sense. As Renn puts it succinctly: “The priority should be: repairs to existing mission critical rail lines, and helping distressed communities.”

The current trend of wasting billions of dollars to serve a urban theology may be popular among planners, speculators and engineering firms. It hasn’t been particularly helpful to the people who need to get, in appropriate time and without too much stress, from one place to another.

This piece originally appeared on the Daily Beast.

Joel Kotkin is executive editor of NewGeography.com. He is the Roger Hobbs Distinguished Fellow in Urban Studies at Chapman University and executive director of the Houston-based Center for Opportunity Urbanism. His newest book is The Human City: Urbanism for the rest of us. He is also author of The New Class ConflictThe City: A Global History, and The Next Hundred Million: America in 2050. He lives in Orange County, CA.

Wendell Cox is principal of Demographia, an international public policy and demographics firm. He is a Senior Fellow of the Center for Opportunity Urbanism (US), Senior Fellow for Housing Affordability and Municipal Policy for the Frontier Centre for Public Policy (Canada), and a member of the Board of Advisors of the Center for Demographics and Policy at Chapman University (California). He is co-author of the "Demographia International Housing Affordability Survey" and author of "Demographia World Urban Areas" and "War on the Dream: How Anti-Sprawl Policy Threatens the Quality of Life." He was appointed to three terms on the Los Angeles County Transportation Commission, where he served with the leading city and county leadership as the only non-elected member. He served as a visiting professor at the Conservatoire National des Arts et Metiers, a national university in Paris.

Photo by Gage Skidmore, via Flickr, using CC License.


Detroit -- The Movie

$
0
0

I guess there was always going to be a difference between the Detroit film I wanted and the Detroit film that was produced.

"Detroit", the new big-budget exploration by director Kathryn Bigelow that goes into the details of one of Motor City's most defining events, came out this weekend to strong critical acclaim but less than outstanding popular success. As a native Detroiter I was intrigued from the outset about the film's premise and how it would present such a tense and difficult subject -- and if the film could offer any potential for resolving the issues that still plague the city 50 years later. In an attempt to connect 1967 Detroit to present-day concerns over police brutality, the film succeeds in making us feel brutality, but fall just short of explaining how it became a tool of oppression and how it can be undone.

As someone whose absolute earliest memory is of watching National Guardsmen drive down residential streets in fatigues and pointing rifles, while in my mother's arms, I had envisioned a film that would provide context for the uprising. One that would provide meaning. I envisioned an epic, sweeping, panoramic film that would establish the economic and social roots of the riot. Possibly develop the perspectives of people on multiple sides of the uprising -- police, looters, white and black riot resisters, dispassionate suburbanites. Something that would acknowledge that before 1967, there was 1943, there was 1941, there was 1925, and a host of other indignities large and small. The film begins with that potential, but loses it along the way.

The film starts with a well done animated montage that describes, basically, how the cauldron that would eventually explode was built. But it does so in a way that doesn't convey the sense of desperation felt by many blacks, nor is particularly specific to Detroit. Blacks moved up from the South for jobs. They were confined to the worst neighborhoods and the worst jobs. Efforts by blacks to gain better housing and better economic opportunity were met with resistance -- sometimes procedural and administrative, others visceral and violent -- by the white majority. That's the case in hundreds of cities nationwide, but I feel as if Detroit still needs more context.

The film then moves into the event that spurred the riot itself -- the police raid of a Vietnam War veteran's welcome home party at a "blind pig", or unlicensed after-hours club. The montage may seem sanitized, but the raid itself and the start of the riot seems very real.

We then see the first three days of the disturbance played out. Looting, buildings burning, exasperated black residents in conflict with overwhelmed, but quite angry, Detroit police officers, state police, and National Guardsmen. Perhaps as a metaphor for dreams dashed and never realized, we're introduced to a group of young black singers known as the Dramatics (a real group, dramatized) hoping to make it big with a performance to Motown executives at Detroit's Fox Theater, but police tell guests to evacuate the theater just prior to their performance.

Then the film sharply narrows its focus to its depiction of events at the Algiers Motel. In fact, a strong case could be made that the film should have been named "Algiers" instead of "Detroit", because of its focus. But any film that would try to tackle a topic as significant as Detroit's 1967 conflict would have to have the city's name in it. Spoiler alert for those who wish to see the film (but the film is based on actual and easily found events): the Algiers Motel incident was a deeply tragic and brutal injustice in which police officers killed three young black men and severely beat five other men and (white) women. Police respond to a perceived sniper attack coming from the motel by seizing it, gathering its occupants and then engaging in truly evil torture and intimidation. Police were later acquitted on all charges in the murders and beatings, but never served on the Detroit police force again.

The Algiers Motel scenes, making up almost half of the film, extremely violent, claustrophobic, and visceral. It is hard to watch. Without question, if one wants to see what it looks like to be under the control of a deranged sociopath, this is the film. But is this what racism is? Or all that racism is? Did it require hundreds of thousands of similarly deranged people to terrorize Detroit's black community? Not at all. And that's where the film fails. It reduces racism to the violent actions of deranged individuals, who have no regard for the lives of the people they're supposed to protect.

The racism that led to the conflict in 1967 was far more subtle, until it wasn't. Redlining, urban renewal, interstate highway construction, job and educational disparities, and more -- they weren't practices explicitly tailored to diminish black progress, but those who supported them knew they did the trick. And all it took to support them was a nod of agreement.

In an attempt to find a connection between the tragedy of Detroit then and recent police killings, from Ferguson to Baltimore to St. Paul, we lost out on a chance to develop greater meaning and understanding of what happened 50 years ago.

For what it's worth, it seems the film, or the process of completing the film, or the healing powers of time itself, has had a redemptive impact for residents of metro Detroit. The 1967 conflict kicked off a decade of controversy in Detroit -- the Algiers Motel trials, a contentious mayoral race for control of the city, tense fights over metro-level school busing, all while the auto industry slipped into decline and violent crime moved steadily upward. Many white residents fled the city during that time and afterward, believing "one day our city was fine, and the next it was on fire", and never looked back. But more are beginning to acknowledge a sense of pain and loss from their dislocation from the city. If the film has that effect on Detroiters, then it's succeeded despite its flaws.

This piece originally appeared on The Corner Side Yard.

Pete Saunders is a Detroit native who has worked as a public and private sector urban planner in the Chicago area for more than twenty years.  He is also the author of "The Corner Side Yard," an urban planning blog that focuses on the redevelopment and revitalization of Rust Belt cities.

Photo: Actors Will Poulter (left) and Anthony Mackie in a scene from "Detroit". Source: parlemag.com

California’s Coming Youth Deficit

$
0
0

Images of California, particularly the southern coast, are embedded with those associated with youthfulness — surfers, actors, models, glamorous entrepreneurs. Yet, in reality, the state — and the region — are falling well behind in the growth of their youthful population, which carries significant implications for our future economic trajectory and the nature of our society.

The numbers, provided by demographer Wendell Cox, based on U.S. Census Bureau estimates, should concern every business and community, particularly across the high-priced coastal areas. On the other hand, the stronger youthful growth in the interior, notably the Inland Empire, may become the basis for a regional resurgence, given a less draconian state regulatory regime.

What the numbers say

Let’s start with the millennials, the population that was aged between 20 and 34 in 2015. Since 2000, the growth of this segment of the population has been, for the most part, very slow along the coastal regions, well below the 6 percent national average. In Los Angeles and Orange County, the youth population grew by roughly 3 percent, about half the national average. San Francisco-Oakland, did a bit better, at 7 percent, but Silicon Valley-San Jose experienced a barely 1 percent increase.

In comparison, the millennial population of Orlando, Fla., grew by 47 percent, while in Las Vegas it increased by 42 percent. The four big Texas cities — led by San Antonio, with a 43 percent increase — all registered well over 20 percent growth. Rising tech regions, like Raleigh, N.C., saw 30 percent growth — 30 times the rate in Silicon Valley.

Yet, not all of California is losing out in the coming generation. The fastest-growing region for young people among the 53 largest metropolitan regions is right here in Southern California, the Riverside-San Bernardino area, which saw its 20-34 population expand by a remarkable 47 percent. Another inland standout in California, Sacramento, grew by over 30 percent, far ahead of any of the coastal areas.

Read the entire piece in the Orange County Register.

Joel Kotkin is executive editor of NewGeography.com. He is the Roger Hobbs Distinguished Fellow in Urban Studies at Chapman University and executive director of the Houston-based Center for Opportunity Urbanism. His newest book is The Human City: Urbanism for the rest of us. He is also author of The New Class ConflictThe City: A Global History, and The Next Hundred Million: America in 2050. He lives in Orange County, CA.

Wendell Cox is principal of Demographia, an international public policy and demographics firm. He is a Senior Fellow of the Center for Opportunity Urbanism (US), Senior Fellow for Housing Affordability and Municipal Policy for the Frontier Centre for Public Policy (Canada), and a member of the Board of Advisors of the Center for Demographics and Policy at Chapman University (California). He is co-author of the "Demographia International Housing Affordability Survey" and author of "Demographia World Urban Areas" and "War on the Dream: How Anti-Sprawl Policy Threatens the Quality of Life." He was appointed to three terms on the Los Angeles County Transportation Commission, where he served with the leading city and county leadership as the only non-elected member. He served as a visiting professor at the Conservatoire National des Arts et Metiers, a national university in Paris.

Photo by vlasta2 [CC BY 2.0], via Wikimedia Commons

By Chinatown Bus to New York

$
0
0

I have long heard of the “Chinatown” buses that ply between Washington and New York. I recently planned a quick trip from Washington, both to try a Chinatown bus and to visit Manhattan. This would be my first intercity bus trip in decades, duplicating my first trip to New York (from Washington), just before college. That time, Trailways delivered me on an overnight schedule to the Port Authority Bus Terminal, just beyond the end of the Lincoln Tunnel. It was very exciting then, as now, just as any visit to Manhattan must be for anyone who enjoys cities.

From Washington to New York

Arranging the trip was very easy. An internet search quickly produced Chinatown-Bus.org, which provides links to operators (including non-Chinatown bus services). I chose Eastern Coach, which just a few days before departure had a fare of $22 one-way. Credit card booking was simple on the internet (as it has become for most travel).

The bus was to leave at 4:00 pm from a point between 7th and 8th on H Street N.W. in Washington. Not knowing what to expect, I arrived more than an hour early, at the same time fearing that it would be necessary to stand outside on the curb for a long time in Washington’s notorious August heat. However, Eastern Coach had a station, or at least an air conditioned waiting room.

Since I was so early I tried to get on the hour earlier schedule, but was advised that it was already full (I routinely try to get on earlier flights when possible at airports). The personnel were professional and very polite. At about 3:40 pm, we were advised that the bus was waiting for us, approximately 3 blocks away. Eastern Coach personnel directed us to it, where we put our larger luggage under the bus.

One of the attractions of the service was the advertised electric plugs (for laptops with insufficiently powerful batteries) and free wifi internet service. I couldn’t find any plugs, since they were not at every seat. However, the Eastern Coach people quickly located me a seat with a plug.

Getting out of Washington was not easy. There was stop and go traffic until Bladensburg Road, after which the driver continued out New York Avenue and entered U.S. 50 toward Annapolis and then Interstate 97 to the Baltimore area. This, of course, is not the conventional route, which would have been on the Baltimore-Washington Parkway (operated by the National Park Service), however that route had serious construction delays. We rejoined the normal route on Interstates 895 and 95 in Baltimore.

The trip was uneventful, a good thing. The internet worked fine, as I alternated between work and watching the scenery. There are changes along the route that were not evident the last time I drove it. There are the extensive, two-way express toll lanes for a few miles north of Baltimore, which augment the existing free lanes. The Goethals Bridge reconstruction was visible from the New Jersey Turnpike in Elizabeth. In the distance, the deck of the Bayonne Bridge, which is being raised for better ocean port access, could be seen a few miles later. Next comes the historic Pulaski Skyway (photo below), the keystone to “America’s First Superhighway” (page 11), a 13 mile segment from the Holland Tunnel (which leads to Manhattan) opened nearly 90 years ago, reaching to Elizabeth (approximately where it was met by the Goethals Bridge approach).

Even with the delay out of Washington and the Interstate 97 diversion, we reached the New York terminus by 8:15 p.m., 45 minutes ahead of the very conservative (9:00 p.m.) scheduled arrival. This was made possible by the somewhat unusual lack of delay entering the Lincoln Tunnel as we approached Manhattan. Drop off was on 7th Avenue, just south of 34th Street, in the area of Penn Station. The bus continued to its final stop in Chinatown. The bus cost was so low, that as we neared the end of the trip I decided that using a taxi or ride hailing service was likely to cost more for the final 2 miles of the trip than for the first 240. Thus, I dragged my roller bag and walked to my East 50’s hotel quite comfortably.

From New York to Washington

For the return trip, I wanted to use a conventional (non-Chinatown) service to compare the two. In US intercity buses, there is nothing more conventional than Greyhound. I walked to the Port Authority Bus Terminal, which I found to be every bit as uninviting as it was decades ago. The only advantage over flying is that there were no security lines, but the boarding process was similar to that of Southwest Airlines, standing in lines by boarding number. The difference was that the standing was longer, because of the shortage of waiting room seats, apparently designed with an exurban city bus stop in mind rather than the holding area for a bunch of 50-plus seat buses.

Anyway, that was not Greyhound’s fault. I noticed that another non-Chinatown operator, Megabus, serves from its own location outside the Port Authority Bus Terminal, like the Chinatown buses. Seriously, any future trips of mine will involve carriers that do not use the Port Authority Bus Terminal.

But Greyhound did just fine. We left mid-morning for a trip Greyhound indicated would take 4 hours and 20 minutes. Immediately outside the Port Authority Bus Terminal we sat in stuck traffic for about 10 minutes.

Like Eastern Coach, there were not plugs at every seat (row), but it was not hard to find a seat with a plug. The internet, however, was another matter. It was much slower than on Eastern Coach and I stopped using it because it was too painful. I had a good book and there is always the scenery. There are few places more picturesque from a highway than the forests of northern Maryland and the view of the Susquehanna River from the Millard Tydings Bridge.

As in the case of the northbound trip, detours were necessary. The bus driver wisely diverted to the Commodore Perry Bridge and Interstate 95 from New Jersey to Chester, PA due to serious traffic congestion as the New Jersey Turnpike approaches the Delaware Memorial Bridge. Again, the bus used the Interstate 97-U.S. 50 detour at the south end of the trip, to avoid the Parkway congestion.

There was a single 15-minute rest/meal stop, which I would have been happy to skip. The bus reached Union Station in Washington about 30 minutes later than advertised. Anyone, however, who understands the traffic difficulties in the Northeast should not be surprised by a five hour trip. Greyhound’s fare of $23 competes nicely with the Chinatown buses.

Other Alternatives

There are a number of other alternatives for travel between Washington and New York. There is the private car and airlines. Just gasoline for the car is likely to be more than the bus fare. The train is far more expensive (and subsidized by taxpayers). The best fare I could find was four times that of the buses. Amtrak’s Northeast Direct service is scheduled at 3:20, between 1:00 and 1:40 faster than the bus. On-time performance over the past year has been about 75 percent, though dropped to 62 percent in June.

Thus, the time advantage of the train may be illusory in many cases and certainly the bus has a considerable cost advantage (for both riders and taxpayers). Some might find the bus a bit too cramped compared to the train. There is now luxury bus service with three-across seating, rather than four and with plugs at every seat. One such operator is Vamoose, which provides service between New York and Washington (Rosslyn or Bethesda) in five hours. Both stations are near Washington Metro stations and are likely more convenient for people arriving by car than Union Station. The fare is higher, at $60 to $75, but there is no public subsidy.

I look forward to my next New York trip, Chinatown bus one way and luxury bus the other.

Wendell Cox is principal of Demographia, an international public policy and demographics firm. He is a Senior Fellow of the Center for Opportunity Urbanism (US), Senior Fellow for Housing Affordability and Municipal Policy for the Frontier Centre for Public Policy (Canada), and a member of the Board of Advisors of the Center for Demographics and Policy at Chapman University (California). He is co-author of the "Demographia International Housing Affordability Survey" and author of "Demographia World Urban Areas" and "War on the Dream: How Anti-Sprawl Policy Threatens the Quality of Life." He was appointed to three terms on the Los Angeles County Transportation Commission, where he served with the leading city and county leadership as the only non-elected member. He served as a visiting professor at the Conservatoire National des Arts et Metiers, a national university in Paris.

Top photo: Hudson Yards construction (Manhattan), by author

Second photo: Pulaski Skyway, by Jack Boucher [Public domain], via Wikimedia Commons

Why Rail Transit Doesn't Work in Atlanta

$
0
0

One of the more interesting presentations at the 2017 American Dream conference was by Alain Bertaud, a French demographer currently working at New York University. He has compared urban areas all over the world to see how transportation has influenced the layout of those areas.

He started by comparing Atlanta with Barcelona, Spain. Although both have about the same number of people, Barcelona occupies about 63 square miles while Atlanta covers 1,650 square miles. Barcelona has about 62 miles of rail lines, while Atlanta had about 46 when Bertaud was making his comparison (it’s up to 52 today). In order for Atlanta’s rail system to provide the same level of service to its residents as Barcelona’s, the region would need to build another 2,350 miles of rail lines. At current construction prices, that would cost at least $700 billion.

The above charts show population densities within 30 kilometers of urban centers, with the first kilometer on the left and the 30th kilometer on the right. The European cities, including Paris, Warsaw, and Barcelona, shown in the first column, are very dense in the center with densities falling to nothing after 22 miles from the center. Asian cities in the second column–Beijing, Jakarta, and Bangkok–are similar. But American cities in the third column–Atlanta, Los Angeles, and New York–look very different. Densities do taper off but the centers, even of New York, are nowhere near as dense as in Europe and Asia.

Moreover, Atlanta’s population growth in the 1990s was mostly in the outlying areas. Only 2 percent of new Atlanta residents located within a half mile of a rail station and only 13 percent located within a half mile of a bus stop, while 85 percent located more than half mile from either.

New job locations are even worse for transit, with jobs in four of the first five miles from the center actually declining. Only 1 percent of new jobs located within a half mile of a rail station, and 22 percent within a half mile of a bus stop, meaning 77 percent were not reached by transit. (The original chart said 32 percent, but that made the total add up to 110 percent. Dr. Bertaud updated and corrected the chart to read 22 percent.)

Even as American urban planners, particularly on the West Coast, try to make our cities more like European ones, European and Asian cities are becoming more like American ones. In Seoul, for example, most population growth was in the bands between 20 and 40 kilometers from the center, while most job growth was in the bands between 9 and 35 kilometers from the center.

The same is true for European cities. While the second chart shown above makes it appear that Paris and other cities are monocentric, in fact they have large numbers of suburban jobs. As Bertaud noted, “Even in metropolitan area like Paris, with an elaborate transit system, the majority of trips are made by cars from suburb to suburb.” Transit ridership in many European cities is flat or declining, while driving is rapidly growing.

When new technologies like automobiles change the shape of cities, there is no going back. Cities can build rail lines, subsidize dense housing projects, and try to discourage driving, but driving will continue to grow even as transit ridership stagnates, at best, and per capita ridership falls.

This piece first appeared on The Antiplanner.

Randal O’Toole is a senior fellow with the Cato Institute specializing in land use and transportation policy. He has written several books demonstrating the futility of government planning. Prior to working for Cato, he taught environmental economics at Yale, UC Berkeley, and Utah State University.

Photo by Nicolas Henderson, via Flickr, using CC License.

Children and Cities

$
0
0

My wife recently gave birth to our first child. It’s an exciting time – and also one that portends great changes for our future.

Cities are supposedly hostile to children. But living on the Upper West Side of New York, we’ve experienced nothing but oohs and ahhs over our son. The people in our neighborhood love children. And there are plenty of them around. The UWS is one of those places you could probably classify as a “strollerville.”

But it’s hard not to notice that while there are lots of very young children here, there are far fewer school aged ones. I don’t have any desire or plans to leave, but I have to recognize that children have a way of changing your priorities. Realistically, most people with school-aged children still seem to move to the suburbs. Those I see raising older kids in the city are generally well-off enough to afford large apartments or even single family homes (in cities like Chicago). They can also either pay the premium to live in a high quality neighborhood school zone or pay the freight for private schooling.

The number of children in cities, particularly in the dense urban centers were the creative class often congregates, is often low. San Francisco, one of the paradigms of creative class urbanism, has the lowest share of children of any major city at only 13%. The city famously has as many dogs as children.

This has important implications. These global cities are where the culture is made, where the media are, etc. To the extent that they represent a very atypical demographic profile that largely excludes families with school-aged children, this only perpetuates the “bubble” in which America’s leadership class often lives.

The values and priorities of people without children are different from those with children. One example is the value people put on space. In our central cities populated with largely people who have no children, a big obsession is changing zoning regulations to allow smaller units, including so-called “micro-apartments.” These kinds of developments would enable more upscale young adult singles to live in cities. That’s good in itself. Yet it is not paired with equal concern about creating more housing for families. What’s more, urbanists are often hostile to changes in the city that would increase child friendliness. For example, central cities often have smaller apartments. One way to create the space families require is to combine units. But people doing just that in Chicago – converting or deconverting multi-flat buildings into single family homes – are opposed by urbanists, who see this as destroying housing supply and reducing density.

Jane Jacobs saw cities as a superior vehicle for the socialization of children, writing:

In real life, only from the ordinary adults of the city sidewalks do children learn - if they learn at all - the first fundamental of successful city life: People must take a modicum of public responsibility for each other even if they have no ties to each other. This is a lesson nobody learns by being told. It is learned from the experience of having other people without ties of kinship or close friendship for formal responsibility to you take a modicum of public responsibility for you.

Yet today cities are increasingly no longer seen as a locus of family life and child rearing, but rather an "entertainment machine" for adults, as Terry Nichols Clark famously labeled.

There’s nothing wrong with urban centers playing that role as playground for adults and production node in the creative class economy – as long as you recognize the limits that implies. These urban environments are often held up as the model for the future, especially in a world of climate change. But a city without children has no future. To the extent that central cities outsource the rearing of future generations to the suburbs or foreign countries, they cannot plausibly serve as a general-purpose model. The world can have and celebrate its San Franciscos or lower Manhattans, but they will remain a minority of places.

Aaron M. Renn is a senior fellow at the Manhattan Institute, a contributing editor of City Journal, and an economic development columnist for Governing magazine. He focuses on ways to help America’s cities thrive in an ever more complex, competitive, globalized, and diverse twenty-first century. During Renn’s 15-year career in management and technology consulting, he was a partner at Accenture and held several technology strategy roles and directed multimillion-dollar global technology implementations. He has contributed to The Guardian, Forbes.com, and numerous other publications. Renn holds a B.S. from Indiana University, where he coauthored an early social-networking platform in 1991.

Photo by Garry Knight, via Flickr, using CC License.

A Roadmap to Job-Creating Transportation Infrastructure: Doing the Right Things Right

$
0
0

There is broad public concern about the status of transportation infrastructure in the United States. On election night the future President said, "We are going to fix our inner cities and rebuild our highways, bridges, tunnels, airports, schools, hospitals." This report (“A Roadmap to Job-Creating Transportation Infrastructure: Doing the Right Things Right”) examines the condition of the nation’s infrastructure and makes recommendations to improve federal efforts in supporting ground transport.

Infrastructure is important to the accomplishment of such important public goals as increased economic growth, long-term job creation (beyond project employment benefits), a better standard of living, and the reduction of poverty. The United States used to lead the world in infrastructure, but has fallen behind some of its competitors. At the same time, past infrastructure policy in the United States created an inertia that prevented serious prioritization of federal resources.

All of this is made more arduous by the nation’s strained finances. The national debt is now approximately $20 trillion while budget deficits continue and could increase without significant reforms. This means it will be difficult to commit additional resources to the nation's highways and rail systems.

Administration Proposals

The Administration has proposed approaches that go beyond "business as usual”. They would focus federal resources on national and regional priorities, improving both the effectiveness and efficiency of federal programs.

Perhaps the most significant federal program is the Highway Trust Fund, which uses highway user fees to support highway and transit. In recent years, general funds have also been added to the program because revenues have risen more slowly than needs, in part because of improved fuel economy and low gas prices. The Administration proposes no highway user fee increases and proposes to phase out general fund support.

In addition, the Administration proposes to phase out funding for “new starts,” which are usually expensive urban rail transit programs, because these programs are not of sufficient national significance.

The Administration has proposed increasing funding through programs that attract private infrastructure development and has proposed $200 billion over the next 10 years in infrastructure expenditures, including transportation.

Because there are sufficient travel alternatives, the Administration proposes ending support for Amtrak’s long-distance trains.

The Administration has referred to the necessity of regulatory reform and streamlining permitting requirements, both to reduce costs and speed up project delivery.

Analysis and Recommendations

It is expected that the Administration will propose further initiatives, consistent with the directions it has outlined. The proposals are analyzed below and additional recommendations are offered.

Highways and Transit: The Highway Trust Fund provides most of the federal contribution to highways and transit from user fees from drivers and commercial vehicle operators, such as the trucking industry. As expenditures have risen faster than revenues, the Highway Trust Fund has received general fund support as well.

The highway system is the country’s most comprehensive transportation system. Autos (including light trucks) using the highway and roadway system account for the overwhelming majority of ground passenger travel, both for commuting and other trips. These roads allow people to commute to jobs throughout metropolitan areas more quickly than any other mode. The employment opportunities available by auto dwarf those by any other mode. Perhaps surprisingly, autos provide by far the largest share of commuting by low income populations. Highways provide the infrastructure for much of the freight transport and service vehicles. In the long run, improving access to employment and reducing traffic congestion will be best accomplished by improvements that involve highways.

By contrast, transit, which has received funding from the Highway Trust Fund for more than three decades, is intensely concentrated in just a few local areas. Only two percent of motorized trips are on transit. Even in the largest metropolitan areas, transit provides far less access to jobs than autos, while new transit rail projects and additional transit funding has failed to reduce traffic congestion.

By virtually any measure, transit is less effective and efficient than highways for passenger travel. Transit moves no freight or other commercial traffic and does not provide emergency service access. Highway Trust Fund revenues should be used only on highways.

Private Finance: The programs the Administration has proposed for attracting private infrastructure capital include the Transportation Infrastructure Finance and Innovation Act (TIFIA) program and US Department of Transportation authorized private activity bonds. As currently designed and operated, these programs do sufficiently prioritize transportation infrastructure. Process reforms are needed to ensure the limited funding available is used for the highest priority projects. Evaluation criteria should be adopted, with traffic congestion relief, critical bridge replacement and highway system maintenance being the highest priorities. Express toll lanes, added to existing roadways, are among the most promising approaches because of their additional capacity and ability to reduce traffic congestion.

Further, the tax exempt financing and interest subsidies of these programs have a federal budgetary impact that increases deficits and the national debt. The Administration should seek to minimize these impacts by ensuring that only the most productive projects are approved.

Another federal credit instrument, the Railroad Rehabilitation and Investment Financing program, could impose substantial losses on taxpayers. Despite its success to date, there are now indications that privately sponsored high-speed rail projects will seek large taxpayer guaranteed loans from RRIF. Private, at risk investment has not proven profitable in high-speed rail, which suggests a potential for default, such as what occurred with Solyndra. Program reforms are needed.

Amtrak and High-Speed Rail: It will be important to eliminate unnecessary subsidies. For example, as an Administration document puts it: "communities are served by an expansive aviation, interstate highway and interstate bus network." In this environment, Amtrak subsidies are unnecessary. Subsidies to high-speed rail are similarly unnecessary.

Regulatory Reform and Streamlined Permitting: The Administration has also proposed regulatory reform and streamlined permitting. Among the most important opportunities are repeal of the Davis – Bacon labor requirements, prohibition of project labor agreements, and setting up a single point of contact in the federal government for project sponsors.

Conclusion: Improving Efficiency and Effectiveness

It will be important to better focus private funding programs on the highest infrastructure priorities, and to minimize serious risks to taxpayers and bond buyers that could emerge from insufficiently vetted projects. The recommendations suggest doing the right things by limiting federal support to genuine needs for programs for which there is no alternative, and doing them right by spending no more than necessary. The sooner the hard choices are made, the better for future generations.

The above is the Executive Summary to “"A Roadmap to Job-Creating Transportation Infrastructure: Doing the Right Things Right,” published by the Center for Opportunity Urbanism (author, Wendell Cox, Senior Fellow).

Wendell Cox is principal of Demographia, an international public policy and demographics firm. He is a Senior Fellow of the Center for Opportunity Urbanism (US), Senior Fellow for Housing Affordability and Municipal Policy for the Frontier Centre for Public Policy (Canada), and a member of the Board of Advisors of the Center for Demographics and Policy at Chapman University (California). He is co-author of the "Demographia International Housing Affordability Survey" and author of "Demographia World Urban Areas" and "War on the Dream: How Anti-Sprawl Policy Threatens the Quality of Life." He was appointed to three terms on the Los Angeles County Transportation Commission, where he served with the leading city and county leadership as the only non-elected member. He served as a visiting professor at the Conservatoire National des Arts et Metiers, a national university in Paris.

Photograph: Intercounty Connector, Montgomery County Maryland (a TIFIA project). Photograph by Ewillison (Own work) [CC BY-SA 4.0 (http://creativecommons.org/licenses/by-sa/4.0)], via Wikimedia Commons.

A New Way Forward on Trade and Immigration

$
0
0

President Donald Trump’s policy agenda may seem somewhat incoherent, but his underlying approach — developed, in large part, by now-departed chief strategist Steve Bannon — can be best summarized in one word: nationalism. This covers a range of issues from immigration and trade to cultural and ethnic identity, and generally the ones with the most polarizing impact on our political system.

To many progressives, nationalism is, by its very nature, a dirty word, associated with fascist, Nazi or otherwise repressive regimes throughout history, and tied to violent extremists among the “alt-right,” like the small group of truly “deplorables” that recently surfaced in Charlottesville, Va. Liberal globalists detested Trump’s Poland speech defending Western values. To them, progressive theology matters more than affiliation with political tradition. Assaults on free trade also concern tech and other corporate chieftains, whatever their impact on the American working class.

Yet, despite his consistently ill-considered rhetoric, Trump is actually about half-right on nationalism. The postindustrial, globalized economy has not worked for most Americans, as judged by their meager income growth. The West is, indeed, threatened not only by Islamic fundamentalists, but also by China, Russia, North Korea and other authoritarian states. In comparison with today’s progressives, the Roosevelts, Truman, Kennedy and Johnson would be considered rampant nationalists.

Reassessing free trade

Free trade, the fundamental economic dogma of the global corporate class and its neoliberal allies, has proven, in practice, to be far less benign than “global strategists” suggest. What works for Manhattan or San Francisco has had devastating impacts in more industrially oriented places like the Midwest and much of the South. Overall, notes a recent study from the labor-backed Economic Policy Institute, trade with China has cost an estimated 3.4 million jobs so far this century.

Commerce Secretary Wilbur Ross points out — correctly — that many leading trading partners, like the EU and China, impose higher tariffs on incoming U.S. goods than what we impose on their exports. China, in particular, seeks to gain advantage over U.S. producers, embracing what William Galston, former policy adviser to President Bill Clinton, calls “technonationalism,” under which a country seeks to extort the surrender of intellectual property in exchange for market access and cold hard cash.

In this sense, Trump’s hard-line position on trade — and his courting of foreign investors such as Toyota and Mazda — represents a justifiable throwback to the nationalist policies framed by Alexander Hamilton, which persisted until World War II. The problem here, as elsewhere, is that Trump’s pettiness and Twitter inanities allow our trading partners to divert the discussion away from the legitimate issues around international commerce.

Read the entire piece in the Orange County Register.

Joel Kotkin is executive editor of NewGeography.com. He is the Roger Hobbs Distinguished Fellow in Urban Studies at Chapman University and executive director of the Houston-based Center for Opportunity Urbanism. His newest book is The Human City: Urbanism for the rest of us. He is also author of The New Class ConflictThe City: A Global History, and The Next Hundred Million: America in 2050. He lives in Orange County, CA.

Photo by Dirk Dallas, via Flickr, using CC License.


A Different Kind of Border Wall

$
0
0

To slow mass migration, stop the illicit capital flight from poor to rich countries.

An asset manager called ____ Capital recently sent out this email seeking referrals:

The US Investor visa program allows one to invest $500,000 U.S. in a government licensed fund for a period of about five years and in around 18 months, a conditional green card is attained for the investor and their immediate family. The investor and their family can live, work and study anywhere in the United States and there are no educational, age or English language requirements.

Most experts report that on September 30th the investment amount will increase from $500k to $1.3m, a significant jump that will price out many potential investors.

There is still time to file before September 30th if you start your process with ____ Capital now.

Others can comment on the practice of selling green cards (and ultimately US citizenships) to wealthy foreigners while millions of other applicants, some of whom would be greater contributors to the United States, continue to wait in line for years. Our concern is one step removed and has to do with the legality of this money.

Give me your rich, but no huddled masses. (photo: populyst)

It would be unfortunate if foreign money inflows into the US, whether green card-related or not, benefited only a small number of American fund managers and real estate developers while they lowered the standard of living of larger numbers of Americans, for example by crowding them out of some cities because of rising home prices. But it would be doubly unfortunate if some of this money was also illicit, in other words stolen or obtained through dubious maneuvers by corrupt or crony foreign government officials and corporate executives.

Indeed, to use just one example, the fact that the identity of many buyers in New York’s newest condominiums is cloaked by the use of shell companies is unhelpful to anyone claiming that these vast incoming sums are mostly clean money. For more on this, see Manhattan Ultra-Luxury ‘Battling the Serpent of Chaos’.

Why Mass Migration

Before we loop and close this circle, let us examine a very related issue: the mass migration of people from poor countries towards Europe, North America and other wealthy nations.

When considering the migrant crisis, from the Middle East, Asia and Africa into Europe, or from Asia and Latin America into the United States, the question among policy makers has been on whether and on how to allow or to stop the inflow of people: when, where, how and how many?

But an antecedent question should be: what in the first place is causing these people to migrate thousands of miles, often at the risk of their own lives? Clearly the answer resides in the poor economies of their home countries. But then what accounts for this poor state of their economies?

Capital flight must be one of the most important reasons. Modern economics and globalization encourage the free flow of capital. But what if this capital leaving poor countries was ill-obtained? What if it was stolen by corrupt government officials or corrupt corporate executives, or diverted unethically by cronies operating on the margin of legality?

We do know that wealth and opportunity in many of these countries are hoarded by a small, insecure and often corrupt governing elite. Indeed it is the insecurity that accompanies such hoarding that naturally leads to a significant share of this capital being exported towards jurisdictions where the risk of seizure is deemed to be minimal.

Yet rich country economies are already awash in capital due to extremely accommodative central bank monetary policy while at the same time poor countries are in dire need of capital to improve their own infrastructure and economy. Simply put, their economies need this money a lot more than ours do. If anything, our own economies may be suffering from too much capital because of extremely low interest rates.

Closing the Loop

This then is the reality of today. Rich countries have been on the one hand accepting with open arms the capital coming from poor countries and profiting from it handsomely, and on the other hand balking, to put it euphemistically, at accepting the people from these poor countries who are emigrating in part as a result of this large capital flight.

The Honest Accounts report estimates that illicit capital outflows from sub-Saharan Africa alone totaled $67.6 billion in a single recent year and that the continent is a net creditor to the world to the tune of $41.3 billion per year.

One way to think about it then is that migrants are coming to our shores after their country’s money has already come to our shores. As with your typical human being, their search for better living conditions are forcing them to follow the money, some of which happens to be their money. This is not to justify illegal immigration but to explain that it is at least partially a result of our open and undiscriminating stance towards incoming wealth.

If, as Pope Francis recently stated, corruption steals from the poor, then its younger brother, cronyism, steals from the middle class. Of course, most poor countries don’t have a middle class and their elites therefore often don’t even bother to become cronies. With a weak judiciary, they go directly into corruption, usually with impunity until the levers of power change hands, which is not all that often.

Parenthetically, it stands to reason that elites in poor countries would not love democracy at home because it reconfigures the power structure every few years in a way that threatens their standing and prosperity. These same elites however do love the democracy and fair play of rich countries because they are the conditions that allow them to safeguard their assets.

For better or for worse, things are different now due to demographics and technology. For decades, all the power players – government officials, foreign corporations, safe-haven banks – have extracted a large share of wealth because the poor in underdeveloped nations were few, disorganized and largely uninformed. But now they are far more numerous, goaded by smugglers to emigrate, and better informed through the internet. See Working Age Population Around the World to understand the potential magnitude of the migrant issue.

Where the Money Goes

The image of the elite from poor countries living in the lap of luxury, jetting to their homes in New York, Miami and London, visiting their financial advisors in Zurich and Cayman, and educating their children at tony private colleges while the masses of their countries subsist in abject poverty, often without sanitation, water or electricity, is so widespread and so real that it has almost become an accepted cliche to most people.

But to the European and American business and financial elite, the moneyed foreign elite is irresistibly cool, usually not because it is foreign but because it is moneyed and often free-spending. For every American consumer whose appetite for luxury goods is flagging, there may be two or three new wealthy consumers in emerging nations who are eager to collect luxury status symbols. If Louis Vuitton and BMW revenues were to stall in the United States, these firms would merely intensify their focus on new customers in the Middle East, Africa and Asia.

Foreign elites are also big investors in the United States and Europe. The destination of flight capital is usually one of the following:

• Banks or financial institutions that offer some secrecy and safety. Historically, this has been private banks domiciled in Switzerland but more recently, it has become any financial institution in an offshore financial center such as the Cayman Islands, Bermuda, Panama, Cyprus, the Channel Islands or other. The Tax Justice Network estimated in 2016 that $12 trillion from developing countries were parked in offshore havens.
• This capital is then funneled by these banks to asset management firms, be they stock and bond funds, private equity funds or other, to be put to productive use through investments in the public or private markets (see footnotes 1 and 2).
• Real estate projects in New York, Miami, London, Vancouver and many other places. In 2015, a report by the New YorkTimes estimated that in six of Manhattan’s most expensive buildings, shell companies owned between 57 and 77 percent of the condominiums. (see footnote 3).
• Other asset classes such as art where funds can be parked safely.

So, here today, we are faced with this question: is it right to accept into our country another people’s money but to turn away the people themselves? And if we cannot, due to their sheer numbers, accept the people themselves without risking a disruption of our own politics and economics, shouldn’t we then at least turn away the illicit capital that is fleeing their countries? Shouldn’t that capital remain in their countries where it can help them build a better economy and thus remove or reduce their need to emigrate across the sea?

Given that the number of working-age Africans and Asians is about to swell by hundreds of millions of additional job seekers, it would be prudent for us to encourage the capital originating in their countries to stay at home rather than come to rich countries where it is distorting prices in real estate and other markets. We may not be able to enforce a barrier against all such capital but it behooves us to try and limit the migration of illicit wealth, or to face the inevitable blowback, a human wave of tens of millions of migrants banging on the door to enter the rich world.

Cruelty plays its hand artfully. Some large beneficiaries of foreign money inflows are also vociferous proponents of greater limits on immigration. These two positions can coexist harmoniously within the same brain only until the connection between the trillions in capital flight and the millions of migrants is exposed in full relief.

_____________________

1. Most of the returns on this capital underperform the major stock indices but custodians seem indifferent while they extract their own hefty fees. Meanwhile the owners of the capital don’t worry about a few percentage points of underperformance when their main motive is the safety of the principal. This is the real reason why hedge funds continue to thrive despite delivering poor performance. Their investors are more tolerant of subpar returns because the main alternative is to keep their money in their home countries where they could lose some or all of it in an unfriendly crackdown.

2. In theory, the Patriot Act required financial institutions to investigate the sources of funds that they receive from foreign countries. But in practice, depositors with no suspected connection to terrorism are ostensibly granted the all clear. Finance firms are simply not staffed or equipped to differentiate between ill-gotten funds and clean funds.

3. Here too, investors are relatively indifferent to the return they obtain and are merely looking to garage their wealth. Some of New York’s new high-rise condominiums have been called “safety deposit boxes with a view”.

This piece originally appeared on Populyst.net

Sami Karam is the founder and editor of populyst.net and the creator of the populyst index™. populyst is about innovation, demography and society. Before populyst, he was the founder and manager of the Seven Global funds and a fund manager at leading asset managers in Boston and New York. In addition to a finance MBA from the Wharton School, he holds a Master's in Civil Engineering from Cornell and a Bachelor of Architecture from UT Austin.

Photo by Mstyslav Chernov/Unframe (Own work) [CC BY-SA 4.0], via Wikimedia Commons

Changing the Narrative in Cleveland

$
0
0

Cleveland, like many Rust Belt cities, has both an image and a self-image problem. Its residents have simultaneously had passion and loyalty for the city, while also being filled with shame about it and relentlessly negative and fatalistic about its future. Again, this is something that is the case for any number of places.

This is a problem because the economy runs on expectations. Why do you start a business doing X? Because you expect to make a profit at it. Why move to city Y? Because you expect the job you have there will be a good fit or you otherwise expect that you are going to find personal satisfaction there.

If we expect the economy to do poorly, we tighten our belts and help create the weakened demand conditions that bring that economy about. If we have positive expectations about the future we behave differently.

Any number of cities seemed to be created from nothing much out of sheer boosterism, a sort of fake it till you make it approach that generated expectations that ultimately became a self-fulfilling prophecy. Houston may be a good example of this.

So in a sense the real future of a place depends on people’s expectations about it in the future. That’s not to say that any expectation can simply be willed into being. Just because you expect to win the Super Bowl doesn’t mean it will happen. But positive expectations play a critical role in creating positive realities.

Expectations are simply beliefs about the future, and thus can be shaped by sales and marketing techniques. This is part of what the city branding business is all about.

Traditionally, marketing folks in Midwest cities have struggled to definite a positive aspirational identity and sell it to the world. Cleveland falls into this category. But a recent article in Cleveland Magazine talks about how the narrative and expectations about the city have changed in light of recent developments such as the return of LeBron James and the resulting NBA championship.

“It got to the point where we began to believe the negative side of our image, to the point where we ourselves began to reinforce that,” says Mayor Frank Jackson. “When we did that, it became true, not only what the world thought we were, but also what we thought we were.”

Research by Destination Cleveland showed that in 2012, only 34 percent of locals would recommend Cleveland to friends and family. Consider that for a second. Only five years ago, 66 percent of Clevelanders were so down on their town they couldn’t even bear the agony of putting in a good word with their college pals or Uncle Al. Other similar cities would usually have positive numbers in the mid-60s.

Well, we’ve got a problem, thought David Gilbert, Destination Cleveland president and CEO.

Five years later, amid an avalanche of good news, our chests swell with civic pride. LeBron came back. We won an NBA championship and made it to the World Series in the same year. We hosted a major political convention. The renovated Public Square opened. The lakefront is blossoming. Health care technologies and professional services are opening a connection to the globalized economy. We are, proportionately speaking, drawing more than our fair share of millennials to the region.

The article goes on to describe the various ways in which Clevelanders are much more optimistic about the future of their city than they were in the past. That’s great news and a sign of shifting internal expectations.

It’s hard to convince the world your city is great if you don’t even believe it yourself. I myself have had the experience in other cities of having people berating their own town and wondering why people who had moved there had done such a darned fool thing. Changing the internal narrative really helps set the stage for changing the external one.

The article rightly highlights the risk facing Cleveland and other cities in the region. Namely that this expectations turnaround has been based on events like the NBA win, the GOP convention, etc. Previous Cleveland renaissances flamed out when those externals changed.

The challenge for Cleveland is to create something durable that carries them through the difficult challenge of long term change and dealing with some of the challenges they face. But for now the fact that the spirits of residents have been lifted – and not without cause – and that there have been some events that generated positive national press is good news for this long-struggling city. It’s right and proper to celebrate it.

This piece first appeared on Urbanophile.

Aaron M. Renn is a senior fellow at the Manhattan Institute, a contributing editor of City Journal, and an economic development columnist for Governing magazine. He focuses on ways to help America’s cities thrive in an ever more complex, competitive, globalized, and diverse twenty-first century. During Renn’s 15-year career in management and technology consulting, he was a partner at Accenture and held several technology strategy roles and directed multimillion-dollar global technology implementations. He has contributed to The Guardian, Forbes.com, and numerous other publications. Renn holds a B.S. from Indiana University, where he coauthored an early social-networking platform in 1991.

Photo by Aeroplanepics0112 (Own work) [CC BY-SA 3.0], via Wikimedia Commons

California Population Lags Behind Projections

$
0
0

Halfway through the new decade, California, widely seen as an irresistible force for the young and ambitious, is underperforming the state’s own demographic projections. Since 2010 the state’s population grew 5.3 percent from the 2010 census figure, 12 percent below the 6.1 percent increase projected by the California State Department of Finance. The population increased at below projected rates in all of the five metropolitan regions (combined statistical areas, or CSAs and metropolitan statistical areas MSAs, outside the CSAs) with more than 1,000,000 population, except in San Diego.

This article compares the 2016 US Census Bureau population estimates of areas within California to the corresponding projections by the California State Department of Finance (DOF). The Census Bureau estimates are for July 1, 2016 and the Department of Finance projections are for January 1. As a result, the Census Bureau estimates are compared to the average of the California 2016 and 2017 projections. Moreover, the Census Bureau estimates are used because of their more authoritative nature. DOF calibrates its estimates to those of the Census Bureau at each 10 year national census. It is important to recognize that projections are just that --- forecasts that can be significantly off even when demographers take the greatest caution to achieve accuracy.

The Los Angeles CSA

The population gain in the Los Angeles CSA was 4.5 percent between the 2010 census and July 1, 2016, 16.0 Percent below the projected 5.4 percent. The Los Angeles CSA includes Los Angeles, Orange, Riverside, San Bernardino and Ventura counties. Among these, only Riverside County exceeded its projection, by 5.1 percent. Los Angeles County fell 27.5 percent short of its projection and Ventura County was 20.3 percent short. San Bernardino County missed its projection by 14.7 percent, while Orange County was 10.3 percent short.

The San Francisco Bay Area CSA

The San Francisco Bay Area CSA also gained fewer new residents than expected, with its 7.3 percent increase following 7.5 percent short of the 7.9 percent projection. The San Francisco Bay Area CSA includes seven metropolitan areas: San Francisco, San Jose, Stockton, Santa Cruz, Vallejo, Napa and Santa Rosa. The San Francisco metropolitan area grew 4.2 percent less than its projection. This was driven by a shortfall of 27.9 percent in Marin County, 12.7 percent in San Mateo County and 6.4 percent in San Francisco County. Alameda County did slightly better than expected, while Contra Costa County did slightly worse.

Santa Clara County, home of San Jose, grew 13.7 percent less than projected. All of the outlying metropolitan areas fell short of their projections, except for Sonoma County, which grew 15 percent more than projected, probably in part due to its having among the least severely unaffordable housing in the area and having good access to employment centers of western Contra Costa County.

The San Francisco area’s failure to achieve its population projection is significant, given that Plan Bay Area assumed that the Bay Area would grow 54 percent more than the DOF estimates for 2010 to 2040. I raised questions about this assumption in a 2013 report for the Pacific Research Institute, that the failure to use the state projection was likely to exaggerate greenhouse gas emissions in 2040. The suspicion that Plan Bay Area was based on exaggerated population projections appears to be fully justified by the actual population trends.

San Diego MSA

San Diego is the only major metropolitan region in the state that is not a combined statistical area. San Diego is unique in having exceeded its population projection for 2016. The margin was small, at 1.6 percent.

Sacramento CSA

The Sacramento CSA (California portion), fell short by a relatively small margin, gaining 6.3 percent compared to its 6.5 percent projection (a shortfall of 2.3 percent). Sacramento County, the area’s largest, fell only 1.2 percent short of its projection. The Sacramento CSA includes three metropolitan areas: Sacramento, Yuba City and Truckee.

Fresno CSA

Among the larger metropolitan regions, the most dramatic shortfall relative to projections was in Fresno, where the population grew 23.6 percent less than projected, for a gain of 4.9 percent. The Fresno CSA includes Fresno and Madera counties.

Balance of the State

Outside the major metropolitan regions, population growth was even less compared to projections. In the San Joaquin Valley, even without Fresno and the Stockton portion of the San Francisco Bay Area CSA, population growth was 24.9 percent below projections. In the rest of the state that growth was 26.2 percent below projection (Figures 1 and 2)

California’s Slower Growth Persists

All of this continues the comparatively rapid turnaround of California’s population growth since 2000. Between statehood in 1850 and 1990, California’s population grew no less than 18.6 percent (1970s) and up to 300 percent (1850s). After rising back to 25.7 percent in the 1990s, growth dropped to 10.0 percent in the 2000s, an average of one percent per year. During this decade, it seems unlikely that even that rate will be achieved.

Since the 2000 census, California’s growth rate has dropped to only 0.84 percent, only a little above the national rate of 0.73 percent. Now it may be on track to start growing slower than the nation. In 2016 California’s growth rate fell below that of the nation for the first time in the decade coming in at 0.66 percent, compared to the national rate of 0.70 percent. Between 2011 and 2016, California’s average population increase was 18 percent above the national rate (Figure 3). Once a beacon for growth, California’s growth is more stagnant than in the past.

Wendell Cox is principal of Demographia, an international public policy and demographics firm. He is a Senior Fellow of the Center for Opportunity Urbanism (US), Senior Fellow for Housing Affordability and Municipal Policy for the Frontier Centre for Public Policy (Canada), and a member of the Board of Advisors of the Center for Demographics and Policy at Chapman University (California). He is co-author of the "Demographia International Housing Affordability Survey" and author of "Demographia World Urban Areas" and "War on the Dream: How Anti-Sprawl Policy Threatens the Quality of Life." He was appointed to three terms on the Los Angeles County Transportation Commission, where he served with the leading city and county leadership as the only non-elected member. He served as a visiting professor at the Conservatoire National des Arts et Metiers, a national university in Paris.

Photograph: San Diego, only major metropolitan region in California to exceed its state population projection 2010-2016 (by author).

30 Days a Black Man

$
0
0

The following is adapted from Bill Steigerwald’s new book 30 Days a Black Man: The Forgotten Story That Exposed the Jim Crow South. The book traces a forgotten but important 1948 undercover journalism mission into the Jim Crow South by a star Pittsburgh Post-Gazette newsman.

Ray Sprigle, a Pulitzer Prize winner, disguised himself as a black man and spent a month seeing what life was like for the ten million African Americans living under America’s oppressive and humiliating system of apartheid.

Sprigle’s nationally syndicated newspaper series about his experiences – and his passionate outrage at the un-American inequities he saw – shocked the white readers of the North, outraged the segregationist white newspaper editors of the South, pleased millions of black Americans and started the first debate in the national media about the future of legal segregation.

Steigerwald’s book, available on Amazon, includes a snapshot of Pittsburgh’s vibrant Hill District, the integrated urban black working-class neighborhood nicknamed “Little Harlem” and made famous by the plays of August Wilson. Below is an excerpt from the book Kirkus Reviews calls a “rollicking, haunting American history".

Pittsburgh in White and Black

Pittsburgh was feeling pretty good about itself in the fall of 1947. The capital city of what Franklin Roosevelt called “The Great Arsenal of Democracy” was still basking in the glory of supplying most of the steel America needed to win World War II. Its population was about to hit its all-time peak of 676,000. It was the twelfth largest city in the USA and the busy hub of a productive metropolitan area of 2.6 million. It was true that it was noisy, shockingly dirty, ugly, dense with people, clogged with traffic, polluted with industrial wastes, and pocked with hard urban poverty. But it had enormous corporate and private wealth, top-flight universities, and major-league culture and sports.

Pittsburgh’s metropolitan population was 90 percent non-Latino white, predominantly Catholic, and heavily Democratic – and remains virtually the same today. Its huge blue-collar workforce was religiously pro-union. Inside Pittsburgh’s crowded city limits were a dozen middle-class urban neighborhoods, thousands of fine homes, and many mansions. There were also scores of ethnic working-class neighborhoods built on the sides of cliffs, on the top of hills, or stretched out in ravines and hollows or along the rivers. There was no single large black ghetto. But about 112,000 blacks, including many recent migrants from the South, lived within the city or nearby in tight neighborhoods in smaller towns throughout Allegheny County.

With the war over, the “Smokey City” had finally started the long-overdue process of cleaning up its air. The average Pittsburgher had no reason to think their city was headed anywhere but up, and yet beneath the permanent fog of smoke and steam its sprawling four-hundred-acre steel mills were sliding toward obsolescence. Over the next three decades, metropolitan Pittsburgh would be forced to de-industrialize by national and global economic forces beyond its control. Its mighty steel industry would collapse. It would hemorrhage population, become the unofficial capital of the Rust Belt and then slowly recover by diversifying its stagnant economy, so that health care, education, and government became its chief job providers. But in the fall of 1947 it was still a prosperous industrial city living of its glorious past, a place where hourly wages of nearly two dollars and generous benefit packages made the region’s union steelworkers the highest paid blue-collar workers in the world.

To say the city’s largely unskilled black workforce was not sharing equally in the industrial bonanza of Pittsburgh is an understatement…. Job opportunities for blacks in the North were far better than in the Jim Crow South, yet they were far from equal. In both public and private employment, black men and women in Pittsburgh were rarely able to get good blue-collar jobs and seldom able to advance if they got one. They were hired last, red first, and invariably paid less. There was a distinct color line in Pittsburgh’s steel and construction industries. About 40 percent of the area’s employers, including some of the largest, barred black employees outright. The unions that controlled the best industrial jobs were virtually lily-white and intent on staying that way. Meanwhile, white-collar jobs for black men were virtually nonexistent in business, finance, real estate, education, and medicine.

Legal segregation in housing didn’t exist in Pittsburgh, but its urban and suburban neighborhoods were nevertheless segregated. As in other northern cities, real estate agents and private housing developers wrote restrictive covenants into the contracts of white homebuyers that prohibited the resale of their homes to someone of a different race. As Richard Rothstein documents in his best-seller, “The Color of Law: A Forgotten History of how our Government Segregated America,” federal housing policy enforced segregation by requiring builders to include restrictive covenants in their new developments. White landlords kept their apartment buildings segregated. Less subtly, real estate agents simply would never show a black couple a house for sale in a white suburb.

Other common but no less degrading varieties of Jim Crow–like private discrimination existed throughout Pittsburgh. Black shoppers couldn’t try on clothes in downtown department stores. Black baseball fans had to sit in certain sections of Forbes Field, where the Pittsburgh Pirates played. Black kids were expected to swim only in the city’s traditionally all-black public swimming pools, and as late as 1945 blacks had to sit in the balcony at neighborhood movie theaters. The best hotels in the city refused black guests no matter how famous, which is why Jackie Robinson, Paul Robeson, Louis Armstrong, and other notable visitors regularly had to stay in the Hill District, the city’s largest and most important black neighborhood.

The Hill District occupied the high ground in the center of Pittsburgh, but it was the city’s most depressed neighborhood. Nicknamed “Little Harlem” for its nationally famous jazz scene and jumping nightlife, it was a predominately poor but vibrant urban neighborhood of about forty thousand blacks and ten thousand whites. The Hill’s disorderly maze of residential streets, business districts, rundown apartments, and junked-up alleys looked over at the stumpy skyline of downtown from a steep but walkable slope. The area was originally settled by immigrants from Ireland, Germany, and Eastern Europe… By the late 1940s the Hill District contained the largest concentration of blacks in metropolitan Pittsburgh. It was also home to two dozen nationalities, including Italians, Russian Jews, Greeks, Eastern Europeans, and Syrians.

An unregulated, loosely policed city within the city, the Hill’s bustling, self-sustaining, partially subterranean economy provided virtually everything its human melting pot needed. Its schools, shopping districts, nightclubs, gambling dens, and whorehouses were integrated. Blacks owned and operated hotels, bars, movie theaters, restaurants, groceries, drugstores, clothing stores, photography studios, florists, bookstores, funeral homes, and social clubs. There was a black YMCA. A cheap, efficient but illegal system of unlicensed cabs called “jitneys,” which still thrives in the Age of Uber, took care of the transit needs of everyone from grandmothers to bar hoppers. Rising above the dense human commerce and poverty were the spires and pointed roofs of two dozen churches and several synagogues.

The Hill District was home to the Pittsburgh Courier, the country’s largest and most widely distributed black newspaper. But during the 1930s and 40s, it was more famous around the country for two things— baseball and jazz. The Pittsburgh Crawfords and the Homestead Grays, two of the best teams in the history of the professional Negro baseball leagues, were based in the Hill District. Its black community was an incubator of a dozen seminal jazz musicians including Earl “Fatha” Hines, the father of modern jazz piano, and baritone crooner Billy Eckstine, who in 1947 was poised to become white America’s first major black pop singer. Unlike venues downtown or in the suburbs, where blacks were usually excluded or made to use their own dance pavilion, the Hill’s entertainment complex was colorblind. Its integrated clubs and dancehalls were one of the few places in Pittsburgh where blacks and whites constantly socialized.

Despite its energy and glamour, however, by 1947 Little Harlem was in terrible socioeconomic shape. The Lower Hill, where sixty-four hundred black and sixteen hundred white people lived, rented, worked, went to school, and worshipped, was particularly distressed. You could buy everything from refrigerators and Italian ice to marijuana, kosher hot dogs, and live chickens on its teeming streets. Violence was rare. The sidewalks were generally safe for kids, women, old folks, preachers, numbers runners, or a friendly game of craps. Men played checkers outside late into the night and people slept on fire escapes in the summer, but there was nothing romantic about its ratty urban poverty.

The Lower Hill’s rough apartments and tenements were overcrowded, rundown, dirty from years of smoke and soot. Part of it was a classic urban slum. Communal faucets in the hallways and outdoor privies were common and private bathrooms were rare. Decades of malign neglect by city hall had made things worse. Streets—many not paved—were maintained poorly at best. Police and re protection, as well as health and sanitation services, was inadequate. Making matters worse, many of the Hill District’s middle-class blacks and professionals had moved to better black city neighborhoods. Most of the blacks left behind were poor or lower-middle working class. They were maids, garbage men, waitresses, bartenders, musicians, jitney drivers, and small-time criminals.

For most of Pittsburgh’s older, squarer, law-abiding white population, Little Harlem was an unknown and scary place they’d never dare to go. Along with the great jazz scene, it was where poverty, vice, violence, and black people dwelled. The city’s three daily newspapers—the Press, the Post-Gazette, and Sun-Telegraph—rarely mentioned the Hill or its “colored” residents. They The all-white papers didn’t care about the Hill District’s present or its future. In 1947 city hall was quietly making plans to raze and redevelop Pittsburgh’s worst slums, which meant bulldozers and wrecking balls were coming for the unsuspecting people living in the city’s poor and politically defenseless neighborhoods. The Hill was the planners’ first target and the white newspapers were enthusiastic propagandists and cheerleaders in the brutal crusade for civic progress and urban renewal.

To the square white men who made the important decisions in town—the entrenched Democratic Party machine, zillionaire businessman Richard King Mellon, and a handful of lesser Republican corporate honchos, boosters, and newspapermen—the Hill was not hip or culturally exciting. It was not a self-reliant community of hustling people, black and white, who needed to be given a helping hand by government or have their lives improved with new jobs or better housing. It was a cancerous slum that threatened the future growth, health, and beauty of their cosmetically challenged city. Pittsburgh’s powerbrokers had plans for a new cultural center for rich white people like themselves and a dozen identical upscale apartment towers. Within a decade a hundred acres of the Lower Hill would be clear-cut to the sidewalks and thousands of people who called it home, most of them poor and black, would be gone without a trace.

Bill Steigerwald worked for the LA Times in the 1980s, the Pittsburgh Post-Gazette in the 1990s and the Pittsburgh Tribune-Review in the 2000s. He lives south of Pittsburgh and is a part-time Uber driver while he prays for Hollywood to turn 30 Days a Black Man into a movie.

Trump Damaged Democracy, Silicon Valley Will Finish It Off

$
0
0

When Democrats made their post-election populist “Better Deal” pitch, they took a strong stance against pharmaceutical and financial monopolies. But they conspicuously left out the most profound antitrust challenge of our time—the tech oligarchy.

The information sector, notes The Economist, is now the most consolidated sector of the American economy.

The Silicon Valley and its Puget Sound annex dominated by Google, Apple, Facebook, Amazon, and Microsoft increasingly resemble the pre-gas crisis Detroit of the Big Three. Tech’s Big Five all enjoy overwhelming market shares—for example Google controls upwards of 80 percent of global search—and the capital to either acquire or crush any newcomers. They are bringing us a hardly gilded age of prosperity but depressed competition, economic stagnation, and, increasingly, a chilling desire to control the national conversation.

Jeff Bezos harrumphs through his chosen megaphone, The Washington Post, about how “democracy dies in the dark.” But if Bezos—the world’s third richest man, who used the Post first to undermine Bernie Sanders and then to wage ceaseless war on the admittedly heinous Donald Trump—really wants to identify the biggest long-term threat to individual and community autonomy, he should turn on the lights and look in the mirror.

Trump’s election and volatile presidency may pose a more immediate menace, but when he is gone, or neutered by lack of support, the oligarchs’ damage to our democracy and culture will continue to metastasize.

Killing the Old Silicon Valley

Americans justifiably take pride in the creative and entrepreneurial genius of Silicon Valley. The tech sector has been, along with culture, agriculture, and energy, one of our most competitive industries, one defined by risk-taking and intense competition between firms in the Valley, and elsewhere.

This old model is fading. All but shielded from antitrust laws, the new Silicon Valley is losing its entrepreneurial yeastiness—which, ironically enough, was in part spawned by government efforts against old-line monopolists such as ATT and IBM. While the industry still promotes the myth of the stalwart tinkerers in their garages seeking to build the next great company, the model now is to get funding so that their company can be acquired by Facebook or one of the other titans. As one recent paper demonstrates, these “super platforms” depress competition, squeeze suppliers and reduce opportunities for potential rivals, much as the monopolists of the late 19th century did (PDF). The rush toward artificial intelligence, requiring vast reservoirs of both money and talent, may accelerate this consolidation. A few firms may join the oligarchy over time, such as Tesla or Uber, but these are all controlled by the same investors on the current Big Five.

This new hierarchy is narrowing the path to riches, or even the middle class. Rather than expand opportunity, the Valley increasingly creates jobs in the “gig economy” that promises not a way to the middle class, much less riches, but into the rising precariat—part-time, conditional workers. This emerging “gig economy” will likely expand with the digitization of retail, which could cost millions of working-class jobs.

For most Americans, the once promising “New Economy,” has meant a descent, as MIT's Peter Temin recently put it, toward a precarious position usually associated with developing nations. Workers in the “gig economy,” unlike the old middle- and working-class, have little chance, for example, of buying a house—once a sure sign of upward mobility, something that is depressingly evident in the Bay Area, along the California coast, and parts of the Northeast.

Certainly the chances of striking out on one’s own have diminished. Sergei Brin, Google’s co-founder, recently suggested that startups would be better off moving from Silicon Valley to areas that are less expensive and highly regulated, and where the competition for talent is not dominated by a few behemoths who can gobble up potential competitors—Instagram, WhatsApp, Skype, LinkedIn, Oculus—or slowly crush them, as may be happening to Snap, a firm that followed the old model and refused to be swallowed by Facebook but went through with its own public offering. Now the Los Angeles-based company is under assault by the social media giant which is using technologies at its Instagram unit, itself an acquisition, that duplicate Snap’s trademark technologies and features.

Snap’s problems are not an isolated case. The result is that the number of high-tech startups is down by almost half from just two years ago; overall National Venture Capital Association reports that the number of deals is now at the lowest level since 2010. Outsiders, the supposed lifeblood of entrepreneurial development, are increasingly irrelevant in an increasingly closed system.

The New Hierarchy

For all its talk about “disruption,” Silicon Valley is increasingly about three things: money, hierarchy, and conformity. Tech entrepreneurs long have enjoyed financial success, but their dominance in the ranks of the ultra-rich has never been so profound. They now account for three of world’s five richest people—Bill Gates, Jeff Bezos, and Mark Zuckerberg—and dominate the list of billionaires under 40.

Unlike their often ruthless and unpleasant 20th century moguls, the Silicon Valley elite has done relatively little for the country’s lagging productivity or to create broad-based opportunity. The information sector has overall been a poor source of new jobs—roughly 70,000 since 2010—with the gains concentrated in just a few places. This as the number of generally more middle-class jobs tied to producing equipment has fallen by half since 1990 and most new employment opportunities have been in low-wage sectors like hospitality, medical care, and food preparation.

The rich, that is, have gotten richer, in part by taking pains to minimize their tax exposure. Now they are talking grandly about having the government provide all the now “excess” humans with a guaranteed minimum income. The titans who have shared or spread so little of their own wealth are increasingly united in the idea that the government—i.e., middle-class taxpayers—should spread more around.

Not at all coincidentally, the Bay Area itself—once a fertile place of grassroots and middle-class opportunity—now boasts an increasingly bifurcated economy. San Francisco, the Valley’s northern annex, regularly clocks in as among the most unequal cities in the country, with both extraordinary wealth and a vast homeless population.

The more suburban Silicon Valley now suffers a poverty rate of near 20 percent, above the national average. It also has its own large homeless population living in what KQED has described as “modern nomadic villages.” In recent years income gains in the region have flowed overwhelmingly to the top quintile of income-earners, who have seen their wages increase by over 25 percent since 1989, while income levels have declined for low-income households.

Despite endless prattling about diversity, African Americans and Hispanics who make up roughly one-third of the valley’s population, have barely 5 percent of jobs in the top Silicon Valley firms. Between 2009 and 2011, earnings dropped 18 percent for blacks in the Valley and by 5 percent for Latinos, according to a 2013 Joint Venture Silicon Valley report (PDF).

Similarly the share of women in the tech industry is barely half of their 47 percent share in the total workforce, and their ranks may even be shrinking. Stanford researcher Vivek Wadhwa describes the Valley still as “a boys’ club that regarded women as less capable than men and subjected them to negative stereotypes and abuse.”

While the industry hasn’t done much to actually employ women or minorities, it’s both self-righteously and opportunistically fed the outrage industry by booting right-wing voices from various platforms and pushing out people like former Google staffer James Damore, and before that Mozilla founder Brendan Eich after he made a small contribution to a 2014 measure banning gay marriage. Skepticism, once the benchmark of technology development, is now increasingly unwelcome in much of the Valley.

This marks a distinct change from the ’80s and ’90s, when the tech companies—then still involved in the manufacturing of physical products in the United States—tended toward libertarian political views. As late as the 1980s, moderate Republicans frequently won elections in places like San Mateo and Santa Clara. Now the area has evolved into one of the most one-sidedly progressive bastions in the nation. Over 70 percent of Bay Area residents are Democrats up from 55 percent in the 1970s. Today, the Calexit backers, many based in the Valley, even think that the country is too dunderheaded, and suggest they represent “different,” and morally superior, values than the rest of the country.

The Danger to Democracy

If these were policies adopted by an ice-cream chain, or a machine-tool maker, they might be annoying. But in the tech giants, with their vast and growing power to shape opinion, represent an existential threat. Mark Zuckerberg whose Facebook is now the largest source of media for younger people, has emerged, in the words of one European journalist (PDF), as “‘the world’s most powerful editor.” In the past they were the primary carriers of “fake news,” and have done as much as any institution to erode the old values (and economics) of journalism.

Both Facebook and Google now offer news “curated” by algorithms. Bans are increasingly used by Facebook and Twitter to keep out unpopular or incendiary views, and especially in the echo chamber of the Bay Area. This is sometimes directed at conservatives, such as Prager University, whose content may be offensive to some, but hardly subversive or “fake.” The real crime now is simply to question dominant ideology of Silicon Valley gentry progressivism.

Even at their most powerful the industrial age moguls could not control what people knew. They might back a newspaper, or later a radio or television station, but never secured absolute control of media. Competing interests still tussled in a highly regionalized and diverse media market. In contrast the digital universe, dominated by a handful of players located in just a few locales, threaten to make a pluralism of opinions a thing of the past. The former Google design ethicist Tristan Harris suggests that “a handful of tech leaders at Google and Facebook have built the most pervasive, centralized systems for steering human attention that has ever existed.”

Ultimately, particularly after the disasters associated with the Trump regime, the oligarchs seem certain to expand their efforts to control the one institution which could challenge their hegemony: government. Once seen as politically marginal, the oligarchs achieved a dominated role in the Democratic Party, in part by financing President Obama and later support for Hillary Clinton. In the Obama years Google operatives were in fact fairly ubiquitous, leading at least one magazine to label it “the Android Administration.” Since then a stream of Obama people have headed to Silicon Valley, working for firms such as Apple, Uber, and Airbnb. Obama himself has even mused about becoming a venture capitalist himself.

Of course with Trump in power, the oligarchs are mostly on the outs, although the twitterer in chief tried to recruit them. Now many of Silicon Valley power players are supporting the “resistance” and lending their expertise to Democratic campaigns. Unlike undocumented immigrants or other victims of Trumpism, they can count on many GOP politicians to watch their flank until the lunatic storm recedes.

In a future Democratic administration, as is already evident in places like California, the tech titans will use their money, savvy, and new dominance over our communications channels to steer and even dictate America’s political and cultural agendas to wield power in ways that even the likes of J.P. Morgan or John D. Rockefeller would envy.

What started as a brilliant, and profoundly non-political extension of the information revolution, notes early Google and Facebook investor Robert McNamee, now looms as “a menace,” part of a systematic “brain hacking” on a massive scale. We can choose to confront this reality—as the early 20th century progressives did—or stand aside and let the oligarchs chart our future without imposing any curbs on their seemingly inexorable hegemony.

This piece first appeared on The Daily Beast.

Joel Kotkin is executive editor of NewGeography.com. He is the Roger Hobbs Distinguished Fellow in Urban Studies at Chapman University and executive director of the Houston-based Center for Opportunity Urbanism. His newest book is The Human City: Urbanism for the rest of us. He is also author of The New Class ConflictThe City: A Global History, and The Next Hundred Million: America in 2050. He lives in Orange County, CA.

Photo: Maurizio Pesce, via Flickr, using CC License.

How Professionals Choose Where To Live

$
0
0

With the growing bifurcation of incomes in America, most regions would prefer, if given a choice, to attract higher-earning professionals to their areas. These people generate more spending in the community and contribute more taxes to the till.

So, what does it take to get them there?

The Center for Demographics and Policy at Chapman University just completed a national survey, fielded and tabulated by The Cicero Group, of 1,191 professionals: people aged 25-64 with household incomes greater than $80,000, and who work in education, healthcare, information technology, finance or other professional services jobs. We asked respondents to rate which general non-work factors, which educational and social non-work factors, and which work-related factors were most important to them in determining where they would want to move, assuming an attractive job opportunity presented itself. While there were some differences between different industries, the variances were relative small, in most cases.

Overall, the results surprised us by how young and middle aged professionals ---who are almost uniformly said to prefer living in an edgy, dense urban environment--- actually opt for far more traditional, or even banal, alternatives. Professionals are more focused on family lifestyle issues as they consider where they would want to live. While they do not want to live in a cultural wasteland, they prioritize outdoor activities, a lack of crowding and an affordable house over exciting nightlife.

These preferences are reflected in the real life choices professionals made. Research by Chapman’s Erika Orejola, using 2015 ESRI data, shows that 25 of the top 30 counties with the highest concentrations of individuals earning $75,000 or more are largely or entirely suburban.

To understand the professional class’ actual choices ---- as opposed to common media stereotypes --- the survey is very useful. Figure 1 below summarizes general non-work factors. Housing costs were clearly the most important factor they considered. Weather was second. Parks and open spaces, access to culture, outdoor recreation and population size were clustered together as the next most important variables. People employed in the education and healthcare fields did not consider an area’s nightlife to be as important a criterion for relocation as those in other professions.

Housing costs, in addition to being an important factor in why professionals move into an area, are also a reason someone removes an area from consideration, as you can see in Figure 2. 37% of professionals say they would eliminate an area from consideration because of its high housing costs.

Professionals often live in two income households. That may explain why lack of “job opportunities for my spouse” was the second most prevalent reason for why people would eliminate an area from consideration. It was cited about as frequently as “commute times” by respondents.

Looking at other general, non-work variables from Figure 1, we see clearly that many professionals are looking for a more balanced lifestyle in the place they live. People want an area to be of sufficient size to offer interesting cultural alternatives, nightlife and restaurant options. However, they shy away from crowding, places with major traffic problems, and long commute times (which is also addressed in Figure 4.) And they want to be able to relax in what they see as a non-frenetic area with outdoor recreation, parks and open spaces.

Professionals we surveyed are clearly family-oriented. As we see in Figure 2, their rating of “family-friendliness”, proximity to family and friends and their kid’s K-12 educational quality ranks top in importance. Access to university resources were deemed to be important, however, access to a professional’s alumni networks was not as much of a priority, something of a surprise. When looked at from the perspective of eliminating a region for consideration, proximity to family was a very important variable, while proximity to friends was much less of a “deal killer”.

Looking at work-related criteria in Figure 4, we see that commute time and job opportunities for spouses rank as highly important. As with housing costs, these two criteria are both important in deciding to relocate to an area and a “deal killer” if they are not there. Tax levels are also of high importance to professionals. Given their higher incomes that seems logical. Having strong business networks is almost as important as tax levels, and is of greater concern to people in IT, finance and other professional services areas than it is to education and healthcare professionals.

So, given all of these criteria and deal killers, how do the different metro areas stack up against each other as a magnet for professional talent? We gave professionals a choice of 25 metro areas to choose from. These areas were selected by looking at the census data changes in the past decade and seeing where the highest concentrations of professional jobs were located.

Looking at Figure 5, we see that professionals view San Diego as the most attractive metro in the country. That may seem counter-intuitive, given the high actual cost of real estate in Southern California and the high tax levels in California in general. However, professionals do not appear to perceive San Diego as being among the top 10 highest cost places to live. That distinction falls to New York, followed closely by San Francisco.

Denver, Charlotte, Seattle, Austin and Raleigh are next in line in terms of perceived attractiveness overall. Orange County, CA ranks much higher in attractiveness than its northern neighbor, Los Angeles. It is perceived to have the 4th highest cost of living in the country, among places that attract professionals.

Of significance is the fact that no region actually stands out as the “beauty contest winner” of regions. The highest scoring metro, San Diego, received a 4.3 out of 7 score in attractiveness, indicating that there is no “perfect” in the minds of professionals. To them, there are certain factors that are “must haves”, such as affordable housing, jobs for spouses and reasonable commute times. Rather than obsess over trendy hipsterism, regions seeking to lure professionals need, more than anything, to focus on the basics that shape family quality of life.

Marshall Toplansky is Clinical Assistant Professor of Management Science at Chapman University. He is co-principal investigator, with Joel Kotkin on “The Orange County Model”, a demographic and econometric research project to identify growth strategies for that region. He is formerly Managing Director of KPMG’s national center of excellence in data and analytics, and is co-founder of Wise Window, a pioneer in sentiment analysis and the use of big data for predictive models. He lives in Orange, California.

The Great Transit Rip-Off

$
0
0

Over the past decade, there has been a growing fixation among planners and developers alike for a return to the last century’s monocentric cities served by large-scale train systems. And, to be sure, in a handful of older urban regions, mass transit continues to play an important — and even vital — role in getting commuters to downtown jobs. Overall, a remarkable 40 percent of all transit commuting in the United States takes place in the New York metropolitan area — and just six municipalities make up 55 percent of all transit commuting destinations.

But here’s an overlooked fact: Transit now serves about the same number of riders as it did in 1907, when the urban population was barely 15 percent of what it is today. Most urban regions, such as Southern California, are nothing like New York — and they never will be. Downtown Los Angeles may be a better place in which to hang out and eat than in the past, but it sorely lacks the magnetic appeal of a place like Manhattan, or even downtown San Francisco. Manhattan, the world’s second-largest employment center, represents a little more than 20 percent of the New York metropolitan area’s employment. In Los Angeles, by contrast, the downtown area employs just 2 percent.

Transit is failing in Southern California

As we demonstrate in a new report for Chapman University, our urban form does not work well for conventional mass transit. Too many people go to too many locales to work, and, as housing prices have surged, many have moved farther way, which makes trains less practical, given the lack of a dominant job center. But in its desire to emulate places like New York, Los Angeles has spent some $15 billion trying to evolve into what some East Coast enthusiasts call the “next great transit city.”

The rail lines have earned Mayor Eric Garcetti almost endless plaudits from places like the New York Times. Yet, since 1990, transit’s work trip market share has dropped from 5.6 percent to 5.1 percent. MTA system ridership stands at least 15 percent below 1985 levels, when there was only bus service, and the population of Los Angeles County was about 20 percent lower. In some places, like Orange County, the fall has been even more precipitous, down 30 percent since 2008. It is no surprise, then, that, according to a recent USC study, the new lines have done little or nothing to lessen congestion.

This experience is not limited to L.A. Most of the 19 metropolitan areas with new mass transit rail systems — including big cities like Atlanta, Houston, Dallas and even Portland, Ore. — have experienced a decline in transit market share since the systems began operations.

Read the entire piece at The Orange County Register.

Joel Kotkin is executive editor of NewGeography.com. He is the Roger Hobbs Distinguished Fellow in Urban Studies at Chapman University and executive director of the Houston-based Center for Opportunity Urbanism. His newest book is The Human City: Urbanism for the rest of us. He is also author of The New Class ConflictThe City: A Global History, and The Next Hundred Million: America in 2050. He lives in Orange County, CA.

Wendell Cox is principal of Demographia, an international public policy and demographics firm. He is a Senior Fellow of the Center for Opportunity Urbanism (US), Senior Fellow for Housing Affordability and Municipal Policy for the Frontier Centre for Public Policy (Canada), and a member of the Board of Advisors of the Center for Demographics and Policy at Chapman University (California). He is co-author of the "Demographia International Housing Affordability Survey" and author of "Demographia World Urban Areas" and "War on the Dream: How Anti-Sprawl Policy Threatens the Quality of Life." He was appointed to three terms on the Los Angeles County Transportation Commission, where he served with the leading city and county leadership as the only non-elected member. He served as a visiting professor at the Conservatoire National des Arts et Metiers, a national university in Paris.

Photo: Esirgen (Own work) [CC BY-SA 3.0], via Wikimedia Commons


Post-Work Won’t Work

$
0
0

Proposals to institute a basic income are increasingly popular, especially in Silicon Valley. Philippe Van Parijs and Yannick Vanderborght make their case for it in Basic Income: A Radical Proposal for a Free Society and a Sane Economy. A basic income—an annual, unconditional cash grant to every adult, regardless of need, and without a work requirement to obtain it—would be non-taxable and total about 25 percent of GDP. The amount of the grant could vary depending on the age of the recipient, but it would start at birth. It would supplement existing safety-net programs and replace only those whose benefits are less than the basic income amount; thus, the grant would establish a floor, but not a ceiling, on government income transfers. (Publicly financed health care would remain outside the system, for example.)

The overarching goal of the basic-income proposal is to ease economic distress stemming from the structural disappearance of work and declining real incomes for lower-skilled workers. Technology has eliminated countless jobs, and there’s no reason to believe that this process won’t continue. Researchers from MIT and Oxford have estimated that technology already in development, such as driverless cars, could eliminate nearly half of all current jobs in the United States. One does not have to accept this particular analysis to recognize the anxieties that exist—one reason why Silicon Valley supports the idea.

Another goal of the basic income is to redirect the negative incentives created by current welfare systems. When you pay people for being poor or unemployed, unsurprisingly, they’re often motivated to remain poor. Welfare benefits get phased out as income rises; the poor and lower-income workers can face effective marginal tax rates as high as 85 percent, according to the Congressional Budget Office. Working longer hours or seeking out a higher-paying but more difficult job doesn’t make much sense in a system that punishes good behavior and traps people at the bottom of the income ladder.

Unfortunately, the authors’ version of basic income has several critical practical and philosophical flaws. A more controlled, restricted immigration system would be essential if everyone in the United States were entitled to a significant basic income just for being here. To their credit, the authors say that eligibility for basic income “excludes tourists and other travelers, undocumented migrants, and employees of supranational organizations [emphasis added].” While they would prefer a global basic income with open borders, they understand that, “if generous national (or, more generally, subglobal) basic incomes are to be made sustainable in the era of globalization, it will therefore not be possible to dispense with some version of the exclusionary [immigration] strategy.”

This would likely be a showstopper for basic income in the United States. Championing de facto unlimited immigration and the rights of illegal migrants is arguably the highest priority of a significant portion of the American political class. Chicago Mayor Rahm Emanuel closed 50 schools, shuttered half the city’s mental-health clinics, and cut library hours, but still found $1 million to pay for legal aid for illegal migrants. Until America reestablishes control over immigration and limits the number of poor migrants it accepts, basic income will be completely unworkable—as the authors concede.

Some humility from the authors would have been welcome about the risks of the radical restructuring that basic income would entail; Van Parijs and Vanderborght see only upside. To illustrate the downside potential, consider the poor results from annual per-capita payments of casino revenues to American Indian tribes (not discussed in the book). Some tribes enjoy a very high “basic income”—sometimes as high as $100,000 per year— in the form of these payments. But as the Economist reports, “as payment grows more Native Americans have stopped working and fallen into a drug and alcohol abuse lifestyle that has carried them back into poverty.” The magazine contrasts this fate with that of more successful tribes like Washington State’s Jamestown S’Klallam, which eliminated poverty by investing in tribal-owned small businesses instead of handing out cash grants.

Another major problem with the basic-income thesis is that its intrinsic vision of society is morally problematic, even perverse: individuals are entitled to a share of social prosperity but have no obligation to contribute anything to it. In the authors’ vision, it is perfectly acceptable for able-bodied young men to collect a perpetual income while living in mom’s basement or a small apartment and doing nothing but play video games and watch Internet porn. A basic income “differs from conditional minimum-income schemes in having no strings attached,” the authors concede. “It carries no obligation for its beneficiaries to work or be available on the labor market. In this precise sense, we shall say that a basic income is obligation free.” Their attempts to address the problems implicit in their asymmetric view of society are some of the weakest arguments in the book.

As is often the case with social reformers, Van Parijs and Vanderborght are making an argument that is fundamentally moral, not empirical or practical. “An unconditional basic income is what we need, we argued, if what we care about is freedom, not just for a few but for all,” they write. “We thereby appeal to an egalitarian conception of distributive justice that treats freedom not as a constraint on what justice requires but as the very stuff that justice consists in distributing fairly.” Make no mistake about what this means: if justice requires a basic income, then there is no moral right to dissent from it, and thus all disagreement with their position must ultimately be exiled from the realm of politics, democracy, and polite society. If a basic income were ever implemented, any attempt to remove it would be treated by its advocates as not just a bad policy idea, but evil, regardless of public support.

Basic income sounds to many like an attractive idea—but closer examination reveals that it’s also a dangerous one, based on dubious social and moral logic. Though it surely wasn’t their intention in writing this book, Van Parijs and Vanderborght have made the dangers clearer.

This piece first appeared on City Journal.

Aaron M. Renn is a senior fellow at the Manhattan Institute, a contributing editor of City Journal, and an economic development columnist for Governing magazine. He focuses on ways to help America’s cities thrive in an ever more complex, competitive, globalized, and diverse twenty-first century. During Renn’s 15-year career in management and technology consulting, he was a partner at Accenture and held several technology strategy roles and directed multimillion-dollar global technology implementations. He has contributed to The Guardian, Forbes.com, and numerous other publications. Renn holds a B.S. from Indiana University, where he coauthored an early social-networking platform in 1991.

Photo: http://401kcalculator.org, via Flickr, using CC License.

Elusive Population Growth in the City of Los Angeles

$
0
0

How many times can a city reach 4 million population for the first time? I submit that Los Angeles (my birthplace), now near its fourth such celebration, is the undisputed champion, with each of the first three having not actually been reached.

The first time was in 2008, when the California Department of Finance estimated the city’s population to have jumped to 4,046,000 from the 2006 figure of 3,996,000. The reported population growth continued to 2010, when the Department of Finance estimated that the city had reached 4,095,000 residents. But when it came to counting people, the 2010 United States Census found only 3,793,000. Thus, between 2000 and 2010, the city of Los Angeles population rose 98,000, not the four times higher of 400,000 that the state had estimated.

Since only the U.S. Census Bureau actually counts all of the nation’s people, it is the authoritative source for population data. The state Department of Finance appropriately recalibrated its 2010 data to equal the census number for 2010.

The Second and Third First Times

The second cause for celebration came in 2016, as the LA Weekly headline trumpeted, “Thanks, Millennials: L.A.'s Population Tops 4 Million for the First Time,” reporting on the just released 2016 state Department of Finance estimate of 4,031,000 city residents.

The third celebration was held just a year later, when the 2017 state Department of Finance population estimate was released, prompting a Los Angeles Times headline, “Los Angeles hits a milestone: 4 million people and counting.” Reaching this milestone the third time was possible again, because the state Department of Finance had revised its 2016 city population estimate to just shy of 4,000,000 (3,999,237), a reduction of 32,000. When releasing its January 2017 estimate of 4,042,000, the Times did not mention either of the two previous times the “milestone” had been reportedly reached. They don’t do history much in newsrooms these days.

But the U.S. Census Bureau still places the city’s population at below 4,000,000 (3,976,000), as of July 2016. So a fourth first time could be on the horizon (Figure 1).

Revised U.S. Census Bureau Estimates: 2015

The reduction in the state estimated population for the city may have been in response to revised 2015 U.S. Census Bureau estimates for virtually all of the nation’s jurisdictions, issued as its 2016 estimates were released (see The Urban Inversion is Over). The city of Los Angeles did poorly in these revisions. The city of Los Angeles had a 22,700 reduction compared to the original estimate, the second greatest in the nation. The city of New York did worse, with a loss of 33,900, though with more than double the population of Los Angeles, actually performed better proportionally.

Southern California also did poorly in the census recalibrations. Los Angeles County, the nation’s largest, had the greatest reduction, at 58,000. This was more than four times the second largest loss (13,400), which was in Cook County, Illinois (Chicago). The Los Angeles County downward revision was 0.57 percent, while the Cook County reduction was less than one half that, at 0.26 percent. Orange County, the other county in the Los Angeles metropolitan area, had the third greatest reduction out of the more than 3,100 counties, at 13,300, a 0.42 percent loss. The five counties of the larger Los Angeles metropolitan region (the combined statistical area or CSA that includes Los Angeles, Orange, Riverside, San Bernardino and Ventura counties) had a downward reduction of 87,800. Overall, the national reduction was 520,000. Thus, Los Angeles CSA represented 17 percent of the national downward adjustment, nearly three times its six percent share of the population.

The revisions, even in the Los Angeles area, were small. However, they are further evidence of weakness in California’s population growth. So far this decade, California has grown approximately 12.1 percent less than projected, and, remarkably, grew less than the national average over the past year, a rare, if ever, occurrence. The even greater 27.5 percent shortfall in Los Angeles County means that there will be 175,000 fewer people than projected by 2020, if the current population growth rate continues.

For the better part of two decades, Los Angeles County has led the nation in domestic migration losses ---- the number of people moving out compared to those moving in. Just since 2010, the county has lost 350,000 net domestic migrants, equal to the population of Glendale and Pomona combined.

All of this will be unwelcome news to people expecting the population growth explosion necessary to support planning “pack and stack” densification dreamss. There are just not enough people moving to Los Angeles, and the horrendous housing costs encourage more to move away.

The Challenge of Estimating Population

Ultimately, estimating population is not simple and its accuracy can only be fully known by the actual counts taken in the United States every ten years in the census. The experience of the Census Bureau itself indicates the difficulty. In 2009, the Census Bureau estimated the population of the city of Atlanta at 541,000, a full 120,000 above the actual count taken a year later. Its New York City estimate in 2009 was more than 200,000 above the 2010 census count. The city of Chicago estimate was more than 150,000 high. Similar cases could arise once the 2020 census data is in.

The Fourth First Time

Meanwhile, maybe the fourth time will be “for real” and Los Angeles will pass 4,000,000 residents for good. But, even if it actually achieves the milestone a decade after the initial announcement, a good deal less bravado is called for by the trends.

Wendell Cox is principal of Demographia, an international public policy and demographics firm. He is a Senior Fellow of the Center for Opportunity Urbanism (US), Senior Fellow for Housing Affordability and Municipal Policy for the Frontier Centre for Public Policy (Canada), and a member of the Board of Advisors of the Center for Demographics and Policy at Chapman University (California). He is co-author of the "Demographia International Housing Affordability Survey" and author of "Demographia World Urban Areas" and "War on the Dream: How Anti-Sprawl Policy Threatens the Quality of Life." He was appointed to three terms on the Los Angeles County Transportation Commission, where he served with the leading city and county leadership as the only non-elected member. He served as a visiting professor at the Conservatoire National des Arts et Metiers, a national university in Paris.

Photograph: Los Angeles City Hall (by author)
http://www.newgeography.com/files/imagecache/Chart_Story_Inset/lacityhal...

Hurricane Harvey: A View from a Rugged Communitarian

$
0
0

Narratives are not necessarily built on facts; they’re built on stories, pictures, graphics, and videos. Ideally, we want our narratives to be aligned with the facts; but that doesn’t always happen.

Here is a synthesis of some of the predictable narratives being spun in the immediate aftermath of Hurricane Harvey from such places as The Washington Post, Slate, The Guardian, Newsweek and NPR:

Hurricane Harvey was a catastrophe of epic proportions. Floodwater is everywhere; people can only move around the city using boats and helicopters. Local officials failed to order evacuations, so Houstonians have been forced from their homes as flood waters rose, and the death toll is horrific and rising.

But Houston had it coming. It is a miserably hot swamp where no one really wants to live. It embraced a “wild west” approach to growth, paved over wetlands, and refused to implement zoning, which would have lessened the impact of Harvey by requiring developers to mitigate the impacts of new projects. Moreover, it is the global center of the energy business, which is the biggest driver of climate change – one impact of which is the increased frequency and severity of hurricanes like Harvey.

Look at these pictures of flooded streets; families in boats, or shopping carts, or floating on inflatable mattresses; bridges that are totally submerged, and littered with abandoned cars. Check out these graphics showing how Houston has paved over much of the land, destroying wetlands and creating impermeable barriers and exacerbating the impact of major rainstorms. Read these interviews with experts who bemoan Houston’s lack of centralized planning, and who implore the city leaders in Houston to use their power to address the many failures that became evident during Hurricane Harvey.

These narratives, alas, are a combination of ignorance, and arrogance that tells the reader more about the narrative spinners’ flawed view of Houston than about the city itself.

Let’s start with some facts and perspective:

• Harvey is the wettest storm ever to hit the continental US. Over 50 inches of rainfall and 1 trillion gallons of water fell during the event. No one builds a church for Easter, or a gated community for the zombie apocalypse. It’s pretty naive to expect people to expect the unexpected.

• So far, there have been fewer than 50 storm-related deaths. Each of these deaths is tragic, but even if that number creeps higher, it is a stunning low fatality rate for such a major event in such a large city. The Houston region has more than 6.6 million people, and every year more than 40,000 of them die – so Hurricane Harvey increased the annual death tally by about 0.1%. Sad, but not catastrophic.

• An estimated 30,000 people have been forced from their homes. This is approximately 0.5% of the population of the Houston region. In other words, 99.5% of people in the Houston region have been able to stay in their homes. Unfortunate, but not catastrophic.

• The Trump Administration has estimated that 100,000 homes were damaged or destroyed. While it is unclear how that estimate was obtained – if 30,000 people were forced from their home, then probably 70-90% of those homes did not sustain enough damage to force an evacuation – the Houston region has more than 1.6 million housing units, so about 6% of homes sustained damage of some kind. Lamentable, but not catastrophic.

• Economic impact estimates are all over the map at this point; initial estimates were in the $30-40 billion range, but have been rising since then. Let’s say they end up being comparable to Superstorm Sandy, which caused about $70 billions of damage in today’s dollars. The Houston region GDP is about half a trillion dollars a year, so Harvey’s economic cost would be about 14% of our total economic output. Expensive, but not catastrophic.

A dispassionate weighing of these facts would tell you that while stressful events always help identify areas for improvement, by and large our infrastructure and leadership performed admirably well under extraordinary circumstances.

It other words, the facts would tell you that Harvey was not a catastrophe for Houston; it was our finest hour.

But the narrative spinners have an agenda: they want to assert that this event was an utter failure for Houston, and shame our city and county leadership into embracing centralized planning, and ultimately zoning. They believe in a top-down, expert-driven technocracy that rewards current real estate owners by actions that restrict new supply, raise property value (and therefore taxes), stifle opportunity and undermine human agency. As a life-long Houstonian, I would like to politely ask the narrative spinners to please pound sand.

Peter Drucker once said that culture eats strategy for breakfast, and Houston’s culture is one of opportunity. People come to this city to build a better life for themselves, to start and raise a family, and to do so with the support and encouragement of neighbors. This culture of opportunity means that Houstonians welcome newcomers, in a way that older or more status-conscious cities do not. Houston may not be a nice place to visit during the summer, but it is a great place to create a life all year round.

This culture really shines through during events like Hurricane Harvey. Despite what the narrative spinners would have you believe, we are not rugged individualists; we are rugged communitarians. We know that when times are tough, you must rely first on family, then friends, then neighbors, and then – and only if you’re one of the few, unfortunate folks who cannot rely on any of those three – on the government. And if we have family, friends, or neighbors who can help, reaching out for government support is actually taking resources away from those who need them more.

In short, the best governance to rely upon is self- governance.

When the storm hit, I saw these networks in action. People first took care of family – in my case, my five siblings and I were in regular communication, checking in on how each of us was weathering the storm. Good news: everyone came through pretty much unscathed.

Once it was clear that my family was OK, my wife and I began to focus on neighbors and friends. Yesterday, I spent several hours with neighbors clearing away trees that had fallen across streets in our neighborhood, making them unpassable. It was hard work – lots of chain sawing and branch hauling – and we were helped by a crew that was distributing power poles in our area. But folks just driving in the area would also stop and help, doing what they could, or just providing fellowship and encouragement. One lady in the neighborhood brought us some chicken meatballs for lunch – no one asked her to do that, she just wanted to help however she could. (The meatballs were delicious – thanks Costco!)

Also, in our network of friends, there were a couple of families who were forced from their home. We worked together to find them places to stay, and today a group of about 40 men, women, and children went to their house today to box up and move out their valuables, throw away everything else, and tear out the damaged drywall. People brought tools, gloves, and a can-do attitude, and a job that might have taken weeks was finished in about 6 hours. Our friends now have their valuables with them in a rented home (found by another friend in our network), ready for the next step in returning to normalcy.

These stories are real, and not about heroes doing the unusual. They are commonplace and just the way things get done in Houston. If you have friends in Houston, just ask they will tell you similar stories.

Of course, leadership is important, and our regional leadership did great. Mayor Sylvester Turner and Judge Ed Emmett were both calm, deliberate, and stayed on task throughout the crisis. Governor Abbott and President Trump did their parts, but make no mistake about it – this was a local challenge that required top-notch response from local officials. And they did their jobs well.

Houston was able to absorb the wettest storm on record with remarkably little loss of life and property also because of good engineering, informed by the experience of previous storms. A good engineer designs systems that won’t fail when hit with an expected event; a great engineer designs systems that fail gracefully and non-catastrophically when hit with an unexpected event. Hats off to our great engineers.

However, a focus on Houston’s public officials or public infrastructure will lead you away from the more important truth: our response was driven by thousands of Houstonians who voluntarily stepped up to the challenge, and didn’t wait for some central authority to tell us what to do. The truth is that Houston’s culture was its biggest asset, a culture of mutual support that is extraordinary in a city of this size and diversity.

And this culture is not an accident; it the consequence of a system that was designed to be driven from the bottom-up, by regular folks, responding to needs on the ground rather than some kind of theoretical plan put together by experts with no stake in our future, or interest in our family, friends, or neighbors.

Of course, there is always room for improvement. By studying what happened, we will find ways to improve the system for the next storm – and there will always be a next storm. We learned a lot from Ike, Rita, and earlier storms. When I was a child, a couple of inches of rain would flood my neighborhood; today, that same neighborhood absorbed 25 inches of rain and made it through. We have come a long way.

Harvey was a difficult challenge, but not a catastrophe. However, it would be catastrophic for city leaders to accept the narrative spinners’ version of what happened in Houston. It is demonstrably wrong on all counts:

Houston is a miserably hot swamp where no one really wants to live.

It’s hot during the summer, but it is pleasant the rest of the year. As this map shows, Houston actually gets more “pleasant days” than Miami, Raleigh-Durham, Chicago, Portland, or Phoenix. Forget your preconceptions for a moment, and answer a simple question: how could a place get to a population of 6.6 million if no one wanted to live there?

It embraced a “wild west” approach to growth.

Houston’s approach is not the “wild west.” We have land use that is managed from the bottom up, through a system of deed restrictions that often include local homeowners’ associations to police those restrictions. What we don’t have is a top-down, expert-driven, bureaucratic system of centralized planning. As a result, it’s easier to develop real estate than most cities, which keeps real estate prices – especially housing prices – low relative to the rest of the country. It is actually a more sophisticated and economically efficient system than the antiquated politically-driven zoning system that generally favors entrenched interests over new entrants.

Paved over wetlands

Over an 18 year period, Houston lost about 25,000 acres of wetlands. But this amounts to about 4 billion gallons of storm water detention capacity. As stated above, Harvey dumped about 1 trillion gallons; so the lost capacity represents about of 0.4% of Harvey’s deluge. But it’s also important to understand that the streets – a huge portion of the paved area – are used as detention, places to hold storm water temporarily when there is nowhere for it to drain. Houston’s strategy for many years has been to use streets as detention and runoff channels, the idea being that it is better to flood a street than a house. And the city’s performance under Harvey confirms the wisdom of that strategy.

Refused to implement zoning, which would have lessened the impact of Harvey by requiring developers to mitigate the impacts of new projects.

This is the most ridiculous of all the claims made by the narrative spinners. Mayor Turner put it best: “Zoning wouldn't have changed anything. We would have been a city with zoning that flooded.” Proof positive of this fact: one of the harder hit areas was Sugar Land, just south of Houston. Sugar Land has zoning. Alas, Harvey was unaware of that fact and dropped 30+ inches on them anyway (and they handled it well, just like the City of Houston, evidence that zoning was not correlated with impact).

Moreover, it is the global center of the energy business, which is the biggest driver of climate change – one impact of which is the increased frequency and severity of hurricanes like Harvey.

Yes, Houston is the center of the energy business. But Houston’s energy industry is as much about natural gas as crude oil, and the increasing use of gas in power generation has led to a much-improved carbon dioxide picture in the US. If you believe that CO2 is causing climate change, you should be thanking the energy entrepreneurs in Houston for bringing cheap, clean natural gas to the nation. Moreover, the hypothesis that greenhouse gas emissions impact Atlantic hurricane activity is controversial; an official NOAA publication stated that “neither our model…nor our analyses…support the notion that greenhouse gas-induced warming leads to large increases in either tropical storm or overall hurricane numbers in the Atlantic.”

A final point about who pays for all this.

The narrative spinners have made a big deal about how federal funds will be needed to rebuild Houston, and therefore Houston must do what they say.

My take on this is: we are going to rebuild with or without you, so you are not the boss of us.

Most of the money from previous Texas hurricanes has come from private insurance. And, in some ways, this process of rebuilding restores a balance in the economy. For the past couple of decades, almost all homeowners have paid for insurance but few people make a claim. Most of that money sits on the balance sheet of big insurance companies to pay out future claims, and those companies often invest those dollars on Wall Street and real estate. That’s all fine – good, healthy commerce.

Now the time has come for the flow to go the other way. Big insurance companies will be paying out money to settle insurance claims, and most of that will go to working class Americans who will rebuild damaged property. Demand for labor will rise, as will wages, as the money starts to flow. The tilting of the economy away from physical labor toward the financial sector will reverse – maybe only temporarily, but it will still reverse.

Of course, if the federal government decides to give away money, I suppose people will sign up for it. But this madness eventually needs to end. The federal government is broke, and insisting that folks in Kansas or Vermont pay for a hurricane in Houston is silly on the face of it. This is not an invading army we’re talking about here. It’s a really bad storm. The Constitution doesn’t contain the words “storm,” “weather,” or “insurance.” Why are we continuing to twist its meaning to make Congress and the President look like heroes? If they want to help, let them help with their own time, talent, and treasure. Like the rest of us.

But we also don’t want to be suckers. If Washington DC decides not to help Houston, they should end it for everyone in the future. Which they should, in my opinion.

Bottom line: I believe we should celebrate the ability of the nation’s fourth largest city to absorb the wettest storm on record and bounce back with gusto. It is a testament to the culture of my hometown and the leadership that supports and nurtures that culture.

Now, if you will excuse me, I have to get back to work. That wet drywall won’t remove itself.

Leo Linbeck III is a husband, father of 5, CEO of Aquinas Companies, Executive Chairman of Linbeck Group, a Houston-based institutional construction firm, Founder and Chairman of Fannin Innovation Studio, a biomedical startup studio, and Lecturer at Stanford Graduate School of Business. He was also the Founding Chairman, and is currently the Vice Chairman, of the Center for Opportunity Urbanism, a Houston-based think tank.

Top Photo: A Dickinson resident hugs a friend who came to help her remove possessions damaged by flooding brought on by Hurricane Harvey, Sept. 1, 2017 in Dickinson, Texas. Source - http://abcnews.go.com/US/hurricane-harvey-victims/story?id=49451305

Second photo: Volunteers from Performance Contractors help co-worker Cornell Beasley recover from damage to his home after torrential rains caused widespread flooding during Hurricane and Tropical Storm Harvey, Sept. 1, 2017, in Houston, Texas. Source - http://abcnews.go.com/US/hurricane-harvey-victims/story?id=49451305

Third photo: Volunteer rescuer workers help a woman from her home that was inundated with the flooding of Hurricane Harvey, Aug. 30, 2017 in Port Arthur, Texas. Harvey, which made landfall north of Corpus Christi late Friday evening, is expected to dump upwards to 40 inches of rain in Texas over the next couple of days. Source - http://abcnews.go.com/US/hurricane-harvey-victims/story?id=49451305

U.S. Cities Have A Glut Of High-Rises And Still Lack Affordable Housing

$
0
0

Perhaps nothing thrills mayors and urban boosters like the notion of endless towers rising above their city centers. And to be sure, new high-rise residential construction has been among the hottest areas for real estate investors, particularly those from abroad, with high-end products accounting for 8o% of all new construction.

Yet this is not an entirely high-end country, and these products, particularly the luxury high-rises in cities, largely depend on a small segment of the population that can afford such digs.

No surprise, then, that we see reports of declining prices in areas as attractive as New York, Miami and San Francisco, where a weakening tech market is beginning to erode prices, much as occurred in the 2000 tech bust, John Burns Real Estate Consulting notes. There have been big jumps in the number of expired and withdrawn condo listings, particularly at the high end; last year, San Francisco saw a 128% spike in the number of withdrawn or expired listings for condos over $1.5 million.

Several factors suggest the high-rise residential boom is over, including a growing recognition that these structures do little to relieve the housing affordability crisis facing middle-class residents, the inevitable aging of millennials and their shift to suburbs and less expensive cities, and the impending withdrawal of some major foreign investors who have come to dominate the market in many cities.

Cost And Affordability

One common refrain among housing advocates and politicians is that high-rise construction is a solution to the problem of housing affordability. The causes of the problem, however, are principally prohibitions on urban fringe development of starter homes. Critics also note that high-rises in urban neighborhoods often replace older buildings, which are generally more affordable.

One big problem: High-density housing is far more expensive to build. Gerard Mildner, the academic director of the Center for Real Estate at Portland State University, notes that development of a building of more than five stories requires rents approximately two and a half times those from the development of garden apartments. Even higher construction costs are reported in the San Francisco Bay Area, where the cost of townhouse development per square foot can double that of detached houses (excluding land costs) and units in high-rise condominium buildings can cost up to seven and a half times as much.

Almost without exception, then, the most expensive areas are precisely those that have the most high-rise buildings: New York, San Francisco, Seattle and Miami. More to the point, these buildings don’t tend to be occupied by middle-class, much less working-class, families. And in many cases, these units are not people’s actual homes; in New York, as many as 60% of new luxury units are not primary residences, leaving many unoccupied at any given time.

Even worse, a high-density strategy tends to raise the price of surrounding real estate. As Tim Redmond, a veteran San Francisco journalist, points out, luxury apartments often tend to be built in areas with older, more affordable buildings. The notion that simply building more of an expensive product helps keep prices down elsewhere misses the distinction between markets; the high-rises in Washington, DC, are not the affordable units that the vast majority of city residents need.

Other cities favored by luxury developers – like Vancouver, Toronto, Seattle and San Francisco– have also seen deteriorating affordability and, in some cases, a mass exodus of middle- and working-class residents, particularly minorities. San Francisco’s black population, for example, is roughly half of what it was in 1970. In the nation’s whitest major city, Portland, African-Americans are being driven out of the urban core by high-density gentrification, partly supported by city funding. Similar phenomena can be seen in Seattle and Boston, where long-existing black communities are gradually disappearing.

The New Demography Works Against This Trend

It is common in retro-urbanist circles to maintain that more Americans, particularly younger ones, will opt to remain customers for ever-greater density, a preference that could sustain an ever-growing market for high-rises. Yet that notion may be past its sell-by date, with demographic evidence suggesting that most Americans, including younger ones, are looking less for an apartment in the sky than for a house with a little backyard.

Suburbs, consigned to the dustbin of history by many urban boosters, are back. Demographer Jed Kolko, analyzing the most recent Census Bureau numbers, suggests that population growth in most big cities now lags that of their suburbs, which have accounted for more than 80% of metropolitan growth since 2011. Even where the urban core renaissance has been most prominent, there are ominous signs. The population growth rate for Brooklyn and Manhattan fell nearly 90% from 2010-11 to 2015-16.

The real trend in migration is to sprawling, heavily suburbanized areas, particularly in the Sun Belt. To be sure, there are high-rises in most of these markets – quite a gusher of them in Austin, for instance – but the growth in all these regions is overwhelmingly suburban.

The most critical factor over time may be the aging of millennials. Among those under 35 who do buy homes, four-fifths choose single-family detached houses, a form found most often in suburbs. Surveys consistently find that most millennials see suburbs as the ideal place to live in the long run. According to a recent National Homebuilders Association report, more than 66%, including those living in cities, would actually prefer a house in the suburbs.

The largely anecdotal media accounts of millennial lifestyles conflict with reality, Kolko notes. Although younger millennials have tended toward core cities more than previous generations, the website FiveThirtyEight notes that those ages 30-44 are actually moving to suburban locales more than in the past.

The China Syndrome

Given the limits of the domestic market, the luxury high-rise sector depends heavily on foreign investors.

Already, harder times for some traditional investors– Russians and Brazilians, for example – have hurt the Miami market, long attractive to overseas buyers. There is now three years’ worth of inventory of luxury high-rises there, with areas such as Edgewater, Midtown and the A&E District suffering an incredibly high inventory of seven and a half years. Miami Beach is faring a bit better but is still a buyer’s market at a little over two years of inventory.

Still, the greatest threat to the luxury high-rise market may come from the Far East, the region of the world with the most surplus capital and, given the rapidly aging society, often the fewest profitable places to put it. Korea and Japan have lots of money sitting around looking for a home. Japan and its companies, according to World Bank data, are hoarding more than $2 trillion in unused liquid assets.

But as in all things East Asian, China stands apart. Last year, the country had a record $725 billion in capital outflows, according to the Institute of International Finance. China is now the largest foreign investor in US real estate.

But now the Chinese government has placed strong controls on these investments, which could leave some places vulnerable. In Downtown Los Angeles, according to local brokers, many of the new high-rise towers are marketed primarily in China. (LA claims to have the second-highest number of cranes, behind only Seattle.)

These expensive units are far out of reach for the younger people who tend to inhabit the neighborhood, instead serving as what one executive called “vertical safe deposit boxes” for people trying to get their money out of China. If the new crackdown on such investments is strongly enforced, this could leave a lot of expensive units without buyers. Prices have already softened, and with several new luxury buildings coming up, Downtown is likely to experience a glut.

Even in Manhattan, another market long dependent on foreign investment, projects are now stalled, including some once-hot properties in Midtown that are delaying their sales launches. Overall sales of condos over $4 million dropped 18% last year from the high levels of the previous three years. The ultra-premium market for condos over $10 million saw a 5% sales decrease in 2016.

Changes Ahead

The current slowdown, and perhaps longer-term stabilization, could lead to lower rates of migration out of the expensive cores.

Yet this trend is not likely to reverse the movement of younger people to less dense areas. Luxury high-rise units were not built for families, and they are often located in areas with poor schools and limited open space. They may simply become high-priced rentals, attractive no doubt to childless professionals but not to middle- and working-class families.

In the end, the real need is not for more luxury towers. What is needed, particularly in America’s cities, from the urban core to the urban fringe, is the kind of housing middle- and working-class families can afford.

This piece originally appeared at Forbes.com.

Joel Kotkin is executive editor of NewGeography.com. He is the Roger Hobbs Distinguished Fellow in Urban Studies at Chapman University and executive director of the Houston-based Center for Opportunity Urbanism. His newest book is The Human City: Urbanism for the rest of us. He is also author of The New Class ConflictThe City: A Global History, and The Next Hundred Million: America in 2050. He lives in Orange County, CA.

Photo: Sharon Mollerus, via Flickr, using CC License.

The Changing World of Aviation

$
0
0

Perhaps nothing more illustrates the shifts in the global economy than the geography of the largest airports. In 2000, world air passenger statistics were dominated by high income world economies. Among the 25 busiest passenger airports, 14 were in the United States, five in Europe and five in Asia and one in Canada, according to data from the Airports Council International and the Port Authority of New York and New Jersey.

Among the largest airports in 2000, all but Bangkok were in a high income economies. Things have changed significantly. Today, only eight of the largest airports are in the United States, six in Europe, and five in China and six in Asia outside China. Airports in middle income countries --- largely not on the list in 2000 --- come from Beijing, Shanghai, Guangzhou and Chengdu in China, Kuala Lumpur in Malaysia, and Turkey’s Istanbul (Figure 1).

The Largest Airports

Since 1998, Hartsfield-Jackson International Airport has been the busiest passenger airport in the world, after it replaced Chicago’s O’Hare International. In 2016, the airport handled nearly 104.2 million annual passengers. This is quite an accomplishment for an urban area that is only the 81st largest in the world. Since 2000, Atlanta’s passenger count has increased 30 percent.

Yet, Atlanta has been challenged in recent years by Beijing Capital City International Airport, which was substantially remodeled and enlarged for the 2008 Olympics. Beijing handled 94.4 million passengers in 2016. In 2000, Beijing Capital City International was not among the world’s 25 largest airports but has experienced a 335 percent increase in passenger use. Capital City could pass Atlanta in the next few years, but will soon thereafter split air traffic with the Beijing-Daxing International Airport, due to open in 2019, probably making any number one ranking temporary. In the long run, local officials expect Beijing-Daxing to be the busiest in the world.

The new airport will be located south of the city and far better situated for access from the entire Jin-Jing-Ji megacity complex, around which many of the current functions of Beijing are being dispersed. Jin-Jing-Ji includes Beijing, Tianjin and much of the northern part of Hebei province. Construction progress can be viewed at this location on Google Earth: 39°30′52″N 116°24′25″E (copy into the Search box or a “’Google” search will bring up the location on Google maps).

Dubai International Airport, the world’s third largest airport, has seen its passenger traffic growth much faster than even Beijing Capital City International. Dubai saw nearly 600 percent growth from 2000 to 85.7 million passengers. In 2000, Dubai International was not among the world’s 25 largest airports.

Los Angeles International is the world’s fourth busiest airport. LAX handled 80.9 million annual passengers, up 22 percent from 2000.

Tokyo’s centrally located Haneda International Airport ranked fifth, with 79.7 million annual passengers. Haneda has grown strongly, up 42 percent since 2000, when it ranked 6th. During that time, Japan’s regulators have allowed a considerable increase in international flights. Haneda’s overall volume is approximately twice that of far more remote Narita International Airport, which handles most international flights.

Chicago’s O’Hare International Airport was the world’s busiest as late as 1997, but has fallen to sixth most patronized. O’Hare handled 78.3 million passengers in 2016, with its strong United Airlines and American Airlines hubs. However, O’Hare’s growth has been modest, adding only 8 percent to its 2000 volume, when it ranked 2nd to Atlanta (see photo above).

London’s Heathrow Airport ranked 7th in the world, with 75.7 million annual passengers. Growth was also somewhat muted, Heathrow’s volume grew 17 percent from 2000 to 2016.

Hong Kong has experienced considerable growth after having closed its obsolete Kai Tak airport in the late 1990s. Hong Kong International has experienced a 115 percent increase in passengers since 2000 and handled 70.6 million passengers in 2016. In 2000, Hong Kong was the 22nd busiest airport in the world, compared to its 8th ranking in 2016.

Shanghai’s Pudong International Airport experienced the largest handled 66.0 million passengers in 2016 and was not among the top 25 in 2000. The world’s 9th ranked airport opened in 1999 and is served by the world’s fastest train, a Mag-Lev (magnetic levitation) that carries passengers 19 miles (30.4 kilometers) to the Longyang Road station at a top speed of 268 miles per hour (431 kilometers per hour) during weekday peak periods. By comparison, the fastest high speed rail trains in the world will operate at up to 218 miles per hour (350 kilometers per hour) between Shanghai Hongqiao Station and Beijing starting this month. From Longyang Road station travelers can transfer to taxis or Metro Line 2 to complete the final 7 miles (12 kilometers) to People's Park in the central business district, or to other locations in the area.

Charles de Gualle International Airport in Paris ranks 10th, handling slightly fewer passengers than Pudong International (65.95 million). CDG’s volume is up 37 percent since 2000, when it ranked 8th in the world.

The 11th through 16th positions include Dallas-Fort Worth, Amsterdam, Frankfurt, Istanbul and Guangzhou. Istanbul has seen its passenger volume increase more than 300 percent since 2000, while Guangzhou has exceeded 360 percent.

The next five (16th through 20th) include New York’s JFK, Singapore, Denver, Seoul’s new Incheon Airport, and Bangkok, also a relatively new facility. Singapore has had the greatest growth, at 105 percent.

The final five of the top 25 include San Francisco, Kuala Lumpur, Madrid, Las Vegas and Chengdu. Kuala Lumpur’s growth was more than 250 percent, while Chengdu posted the largest gain, at more than 730 percent (Figure 2).

A number of US airports that were among the top 25 in 2000 dropped out over the next 16 years. These include Seattle, Miami, Phoenix, New York La Guardia, Orlando, Houston, Newark, Minneapolis-St. Paul, Boston, Detroit and St. Louis. All of them experienced passenger increases, with the exception of St. Louis, where traffic was down more than 50 percent, with the demise of the American Airlines (former TWA) hub. Toronto’s Pearson International also dropped out of the top 25.

More and More Flying

The world is flying more and more, According to World Bank data, the volume of air passengers increased 120 percent between 2000 and 2016, with a nearly 7 percent increase between 2015 and 2016. As airline use increases, significant airport construction is underway. Istanbul is building an airport intended to have the highest passenger capacity in the world (41°15′39.97″N 28°44′32.54″E), claims mirrored by Beijing-Daxing and expanding Dubai World Central-Al Maktoum International (24°55′06″N 55°10′32″E). Mexico City will replace aging Benito Juarez International (19.5°N 98.9975°W construction not yet evident), while two cities in China are also building new airports. Dalian is constructing an off-shore facility (39°06′32″N 121°36′56″E) while Qingdao (36°21′43″N 120°5′18″E)is building one in the exurbs, which will be reached from the central business districts with a trip over the Jiaozhou Bay Bridge, the world's longest over-water bridge (25 miles or 41 kilometers). Berlin’s notoriously behind schedule Brandenburg (Willy Brandt Airport) continues to struggle toward completion (52°22′00″N 013°30′12″E). Meanwhile, with the exploding volume of passengers in Chengdu, construction is starting on a new airport more than 30 miles (50 kilometers) away (30.319°N 104.445°E).

The rise in air traffic suggests rising affluence, particularly in developing countries, as progress continues to be made in reducing poverty. It seems likely that by 2030, the list of the largest airports will include fewer from today’s most affluent economies and many more from emerging economies.

Wendell Cox is principal of Demographia, an international public policy and demographics firm. He is a Senior Fellow of the Center for Opportunity Urbanism (US), Senior Fellow for Housing Affordability and Municipal Policy for the Frontier Centre for Public Policy (Canada), and a member of the Board of Advisors of the Center for Demographics and Policy at Chapman University (California). He is co-author of the "Demographia International Housing Affordability Survey" and author of "Demographia World Urban Areas" and "War on the Dream: How Anti-Sprawl Policy Threatens the Quality of Life." He was appointed to three terms on the Los Angeles County Transportation Commission, where he served with the leading city and county leadership as the only non-elected member. He served as a visiting professor at the Conservatoire National des Arts et Metiers, a national university in Paris.

Photograph: O'Hare International Airport, by Author

Viewing all 3788 articles
Browse latest View live


Latest Images