Quantcast
Channel: Newgeography.com - Economic, demographic, and political commentary about places
Viewing all 3789 articles
Browse latest View live

A Berning Rift Growing Among Democrats

$
0
0

The mainstream media are having a field day, and rightfully so, chronicling the meltdown of the once-formidable Republican Party. Less focus has been placed on what may be equally, or greater, divisions emerging among Democrats, both in California and around the country.

The largest gap within the party was revealed recently in Orange County, where Bernie Sanders denounced the Walt Disney Co. for paying “starvation wages” to most of its workers while rewarding the CEO with $46 million this year. To Sanders supporters, Disney is a clear “class enemy,” but to Hillary Clinton, the Disney brass represent a source of campaign cash, part of the fairly uniform support for her among establishment Democrats across the board.

Increasingly, the Democratic Party is divided between two elements of its coalition – an oligarchy that supports Clinton and a base of workers, many of them younger, who favor Sanders. To the Clintonites, her positions on gay rights, the environment and feminism make her an acceptable progressive. However, to those who back Bernie, her embrace of, and by, the oligarchs, amid rising economic inequality, represents a glaring contradiction with someone supposedly leading “the party of the people.”

Corporate Liberalism vs. Social Democracy

Clinton’s ascendency reflects the gentrification of the Democratic Party. Since the 1990s, argues historian Michael Lind, the Democrats have evolved from the party of the people to become, increasingly, an instrument of those in media, technology, entertainment and finance who dominate our post-industrial economy. In contrast, Republicans, increasingly isolated from these rising corporate powers, are being forced, often unwillingly, to become the party of populist American nationalism.

Certainly, Clinton, more than any other candidate in modern times, symbolizes the convergence of economic and political power. She enjoys across-the-board support from Hollywood, Silicon Valley, Washington’s K Street lobbyists and Wall Street. Clinton also personally collected a cool $21 million in speaking fees from a host of powerful Wall Street financial and other big corporate interests during 2013-15. She certainly appears like a future president bought and paid for.

Read the entire piece at the Orange County Register.

Joel Kotkin is executive editor of NewGeography.com. He is the Roger Hobbs Distinguished Fellow in Urban Studies at Chapman University and executive director of the Houston-based Center for Opportunity Urbanism. His newest book, The Human City: Urbanism for the rest of us, will be published in April by Agate. He is also author of The New Class ConflictThe City: A Global History, and The Next Hundred Million: America in 2050. He lives in Orange County, CA.

Photo by Michael Vadon (Own work) [CC BY-SA 4.0], via Wikimedia Commons


Cars or Trains: Which Will Win the Commuting Future?

$
0
0

Infrastructure investment is a hot topic and the focus of that discussion tends to lean towards transport infrastructure over other categories (like energy or water for example). When it comes to transport, trains seem to feature prominently on the wish lists of big investment or ‘nation building’ projects. But how far could billions of dollars in new rail infrastructure actually go in improving congestion across our cities?  Will cars inevitably win? If so, why?

‘We need more public transport’ is the silver bullet catch cry often heard in conjunction with debates about congestion in major cities. It has become so common that its validity is rarely tested. Even large scale commuter rail projects like Brisbane’s proposed $5billion (or $8billion – what a few billion amongst friends?) cross river rail can still maintain preferred project status – despite no business case after several years of discussion and now being in the hands of the project’s third state government.

As technology reshapes the nature of work - and with it where we work - and as Australia faces cities policy with renewed national interest – led primarily by our Prime Minister – it is timely to ask how infrastructure priorities might be shaped by evolving metropolitan form and the fast changing habits of urban inhabitants. Will old ways serve new days? Do we need more passenger rail, or will cars find a new purpose in decongesting our cities and serving a new economic model?

Some recent figures through Macroplan serve to highlight the role played by rail in urban life. In 2013–14, there were 178.5 billion passenger kilometres travelled on capital city roads in Australia and 12.6 billion passenger kilometres travelled on urban rail networks. I’ve written before that this share is unlikely to change for the simple fact that only around 10% of metropolitan wide jobs are based in central business districts of our major cities. Agreed, it’s an important 10% for public transport because PT best serves a highly centralized workforce as you find in CBDs. Commuter rail in particular relies on a ‘hub and spoke’ model, mainly designed to ferry people from into and out of CBDs.

For people who work in CBDs, a high proportion will use public transport – rail included. But that’s a high proportion of the 10% minority of people in a metro wide area. Even if every single person who worked in a CBD caught PT, the mode share can never rise very high because around 90% of the workforce work in suburban areas, for which rail is not well suited. There has been a lot of talk about Transit Oriented Development (TODs) particularly around suburban rail nodes but despite decades of discussion, we are yet to see many (any?) genuine examples.

And the reality is that the economy is fast suburbanizing. New employment engines in sectors like personal services or health and caring are not beneficiaries of industry proximity. Being close to others in the same industry might have been good for finance, property and business service industries in traditional CBDs but the fastest growing sector of our economy at present is health care related, where being close to the people being served is important. This is not the CBD. There is even evidence that technology startups in the US have tended to prefer suburban or high street locations, offering high amenity, ample low cost or free parking, and cheap (or free) premises. Steve Jobs and Steve Wozniak of Apple fame started in a suburban garage after all. And Mark Zuckerberg got started at a desk in his college dorm.

As this shift of the economy moves from centralized to increasingly decentralized models – aided by new and fast evolving digital technology which makes connectivity over larger geographic areas so much easier – do the foundations of commuter rail feasibility begin to crumble?

This graph, which shows the dramatic long term decline of the CBD as the dominant employer region in Sydney, could apply equally to other capitals:

Source: The Polycentric Metropolis – Sydney’s Centres Policy in 2051, Bob Meyer, Director of Planning, COX Richardson Architects and Planners

This shift is directly related to how public transport versus private has fared over a similar long term scale, as evidenced by this chart:


Source: Mode share of motorised travel (passenger kms) 1945-2014 for five largest Australian cities, public transport vs private transport (source data: BITRE), taken from Alan Davieswriting in Crikey.

Adding to this shift has been the enabling factor of falling car prices. According to COMMSEC, in 1976 the cost of a new Holden sedan (back then it was Holden or Ford and that was about it) was $4,336 and the average male full time wage was $182 a week – meaning it took 24 weeks income to pay for a new car. Today, the average full time weekly wage is around $1,440 and there are plenty of good quality brand new sedans you can buy for $19,000 on road. In just over three months, you can own one. New cars are fuel efficient, emissions efficient, reliable, technologically enabled and comfortable.

Rubbing salt into the commuter rail wound is that travel by car – even across larger distances – tends to be quicker than rail. Here’s the picture in Melbourne:


Source: Average journey to work trip duration by mode and ring, Melbourne (source data: VISTA 2012-13). Taken from Alan Davies in Crikey.

In Sydney, according to their Household Travel Survey 2013-14, only 13% of car drivers took longer than 45 minutes to get to work, while 79% of train passengers took more than 45 minutes. 

So, given that commuter rail is best designed to serve an increasing minority of the workforce with jobs in traditional CBDs, how will spending extra billions on commuter rail infrastructure expansion solve congestion? How will it translate into more rail passengers, given the way the economy is changing?

Is there an alternative?

For me it’s actually not a case of one or the other. Sensible investment in commuter rail, given the existing investment in rail networks, makes sense provided there’s a valid business case and the alternative options for that investment have been measured.

It also strikes me that we may have a forgotten the massive sunken investment in metropolitan road networks which do most of the transport work in our cities. Some (not all) of these roads are congested for maybe 4 to 6 hours out of every 24. Our cars which move us around our cities spend maybe only 3 or 4 hours a day going anywhere. For more than 20 out of 24 hours, they are parked.

Talk about driverless cars is not just about a fictional scene from ‘Total Recall’ – it’s also about computer aided traffic management on a city wide scale. Squeezing more efficiency from the road network and from motor vehicles seems to make a lot of sense. Ride sharing apps like Uber provide an early insight into how disruptive technologies can impact on traditional, cumbersome and market protected transport thinking. There are also car sharing Apps like Goget and more are on their way. Technology is changing the way we do everything, from entertainment to where we work and how we get around. Would it not make sense for cities to be exploring how this wide scale urban economic shift can best served, rather than stubbornly sticking to mantras about public transport systems designed for traditional urban employment models?

And what about buses? Their great virtue is that they can use the metrowide road networks. It is easy to change a bus route to adapt to demand. You can’t do that with rail. Think how technology might soon morph public transport buses and private transport cars into a hybrid of some sort? Driverless buses are not new. Perth is already about to trial them. This is just a baby step. Think about where this could lead.

There’s no such thing, in my view, as a bad infrastructure investment. But there’s only so much money to go around. The decisions on infrastructure investment, when it comes to issues like urban economic productivity and reducing congestion, should focus on how to get the best bang for the buck. That can mean thinking more about the future and how patterns of work will shape what we need from transit systems, and working back from that to identify the best solutions.

Ross Elliott has more than 20 years experience in property and public policy. His past roles have included stints in urban economics, national and state roles with the Property Council, and in destination marketing. He has written extensively on a range of public policy issues centering around urban issues, and continues to maintain his recreational interest in public policy through ongoing contributions such as this or via his monthly blog The Pulse.

Flickr photo by Curtis Perry: Another perfect day for highway drivers in LA.

The Cruel Information Economy: The U.S. Cities Winning In This Critical Sector

$
0
0

Arguably the most critical industry in the new economy, information is also often the cruelest. It is the ultimate disruptor of jobs and growth, blessing some regional economies but leaving most in the dust. Overall, the sector accounts for almost 3 million jobs, but it has only added a paltry net 70,000 jobs over the last five years. The overall numbers mask a loss of about 200,000 jobs in newspapers, book publishing, broadcasting and telecommunications, while employment in software publishing, data processing and other tech-driven information jobs has expanded by a modest 240,000 jobs (manufacturing, by comparison, has produced three times that amount in the same period).

Our rankings for the best cities for information jobs are perhaps the most skewed of any occupational category. With more traditional industries like business services, hospitality and construction, employment tends to rise across all the country’s metropolitan areas, if not at the same pace everywhere. In the case of the information sector, the vast majority of the metropolitan statistical areas for which we have data have lost information jobs since 2010 (204 out of 336 MSAs).

Yet there are clear winners in the information sweepstakes, with a handful of metro areas that have seized the initiative in the field and run with it.

Information, particularly its media segment, has shown a strong proclivity to concentrate in a handful of places. Whether it’s a matter of where venture funds are concentrated, or that cross-fertilization and creative flair are driving this, it’s hard to say. But in the emerging digital economy, notes a recent Neiman study, clusters industries in the places where creators of content live. For the most part, as of yet, blue collar metro areas need not apply.

Info-Age Winners

Our rankings are based on employment growth in the sector over the short-, medium- and long-term, going back to 2005, and factor in momentum — whether growth is slowing or accelerating. (For a detailed description of our methodology, click here.)

At the top of our list of the largest metropolitan statistical areas, not surprisingly, is San Francisco-Redwood City-South San Francisco. Since 2010, led by the growth of such companies as TwitterFacebook and Salesforce.com, the metro area’s information employment has expanded 62% to 61,000 jobs. The pace of growth is slowing, to 6.85% last year, but still very healthy.

Right behind San Francisco is the larger information-based economy of its neighbor Silicon Valley. The San Jose metro area, home to such information economy titans as Google and Netflix, has 76,000 information jobs, up a none-too-shabby 57.4% since 2010; last year its 9.3% job growth rate outstripped even San Francisco. Together these two areas have emerged as the superstars of the information age, and no other large metro is really close in terms of growth.

Yet the information boom has other epicenters that have emerged over the past decade. Among the large metro areas, Seattle-Bellevue-Everett ranks seventh on our list. It boasts 98,000 information jobs, third most in the country behind much larger New York and Los Angeles. Since 2010 the Puget Sound powerhouse, home to Microsoft, Amazon and a host of start-ups, has seen its information employment expand a healthy 15.3%.

Seattle’s little brother, Portland-Vancouver-Hillsboro, Ore., ranks eighth. Since 2010 Portland’s information employment has grown over 12% to 25,500 workers.

Among the very largest of our metro areas, New York has managed fairly impressive growth in its media-dominated information sector, with employment expanding 12.1% since 2010 to 191,000 workers, second in total numbers, and with no sign of growth flagging.

It’s doing much better than the Big Apple’s two traditional rivals, Chicago and Los Angeles. The Windy City and its environs have expanded information employment by 5% since 2010 to with 73,100 jobs, placing it 19th. Los Angeles follows in 20th place. L.A. is home to the largest information sector in the U.S., with 203,800 workers, but despite its well-established base, much of it in entertainment, it has managed only 3.5% growth since 2010.

Will Information Jobs Head To The Sun Belt?

The growth of information employment in large, dense and expensive urban areas, notably New York and San Francisco, has been widely celebrated by advocates of traditional cities. Yet this same pattern also developed in the last tech bubble in the late 1990s, and then reversed as companies collapsed, and many of the survivors moved operations to less expensive regions.

Could we see a repeat now? High housing costs are putting homeownership out of reach even for fairly affluent families in San Francisco and New York. Already some tech workers are relocating to lower-cost areas. Many more may do so in the future, suggests a recent Beacon Economics study, or resign themselves to being permanent renters.

This year’s list may show some of the places both tech and information jobs may be headed in the next few years. The clear rising star is Phoenix, which ranks third. The desert city’s information workforce has expanded by 39.29% since 2010, the third highest increase of any metropolitan area, just behind the Bay Area twins. In recent years a growing list of Bay Area firms have expanded into the Valley of the Sun, including DoubleDutch, Gainsight, Uber, Prosper Marketplace, Yelp, Weebly, BoomTown and Shutterfly. Silicon Valley Bank set up shop there five years ago as well.

Other lower-cost locales are also doing well on our big metro list, including No. 4 Raleigh, N.C., No. 5 Austin-Round Rock, Texas,  and No. 10 Ft. Lauderdale, Fla. All have enjoyed double-digit information job growth since 2010.

Although information jobs tend to concentrate in bigger metros, there are several smaller metro areas that appear to be on the cusp of becoming key hubs for the industry. The fastest growth over the past five years has been in Provo-Orem, Utah, where information employment has expanded 43.8% to 11,400 jobs. Other fast-rising smaller stars include Flagstaff, Ariz.,  Durham-Chapel Hill, N.C.,  Madison, Wisc., Bend-Redmond, Ore., and Portsmouth, N.H. All these metro areas have enjoyed information job growth of 20% or more since 2010, albeit off small bases.

The Likely Future of Information Growth

Clearly information jobs cluster, although they do so in varied kinds of environments. To be sure, the biggest players likely will continue to be in the largest cities, notably in the Bay Area, New York, Seattle and, as long as Hollywood stays strong, Southern California as well. But the high prices in these areas seem to be leading to growth in a host of second-tier cities spread from Florida to Arizona, where tech workers can enjoy a combination of lower home costs and at least some urban amenities.

Similarly, while most smaller cities may never become information hubs, some clearly will. For the most part these will be either university towns such as Chapel Hill (home to the University of North Carolina), Provo-Orem (Brigham Young) and Madison (University of Wisconsin). Other will be located in amenity-rich, scenic areas like Flagstaff and Bend, Ore., where outdoor-oriented tech workers may find a way to work remotely from the big city hubs.

But under any foreseeable future, it’s unlikely that information job growth will be strong enough to help in a measurable way the fortunes of most communities. Traditional advantages in terms of taxes, location on rivers or the ocean, or access to cheap energy is simply not enough to lure these jobs to a wide array of locales. Information may be a stellar force in some areas, but it has very picky tastes that preclude it from being as transformative in job creation as it is in our daily lives.

This piece first appeared at Forbes.

Joel Kotkin is executive editor of NewGeography.com. He is the Roger Hobbs Distinguished Fellow in Urban Studies at Chapman University and executive director of the Houston-based Center for Opportunity Urbanism. His newest book, The Human City: Urbanism for the rest of us, will be published in April by Agate. He is also author of The New Class ConflictThe City: A Global History, and The Next Hundred Million: America in 2050. He lives in Orange County, CA.

Michael Shires, Ph.D. is a professor at Pepperdine University School of Public Policy.

The Evolving Urban Form: Detroit

$
0
0

Probably no city in the high income world evokes impressions of urban decline more than Detroit --- and for good reason. The core city of Detroit has lost more of its population than any developed world city of more than 500,000 since 1950. The city's population peaked at 1,850,000 residents in 1950 and at its decline rate since 2010 could drop below 650,000 residents by 2020 census.

It was not always this way. During the first half of the 20th century Detroit was one of the fastest-growing core cities in the United States. Among the 20 largest core cities in 1950, only Los Angeles grew faster, percentage wise, than Detroit. The city of Los Angeles grew from 102,000 in 1900 to 1,970,000 in 1950. The city of Detroit almost matched that, growing from 286,000 to 1,850,000.

The city's nearly 1.6 million population increase exceeded that of all other US municipalities except Los Angeles, Chicago and New York, which grew at an unprecedented pace over the period, adding more than 4.5 million residents.

The current defined area of the Detroit metropolitan area grew by 1950 to nearly 6 times its 1900 population, to 3,170,000 from 530,000. The growth of the metropolitan area from 1900 to 1940 closely tracked that of the fast growing Los Angeles metropolitan area, which widened its lead substantially through the end of the century (Figure 1). The Los Angeles area, which was only slightly larger than the Detroit area in 1940 reached a population of more than three times that of Detroit by 2010

The city of Detroit began to lose population after 1950. It lost 180,000 people between 1950 and 1960 and   approximately 155,000 between 1960 and 1970. The 1970s were a particularly bad time for the many large core cities, and Detroit lost more than 300,000 people, or 20% of its population by 1980. But if Detroit was exceptional, it was not alone; virtually all large US core cities that did not annex territory between 1950 and 1980 lost population.

In fact, Detroit's loss was not even the worst. During the 1970s, the city of St. Louis lost 27% of its population, dropping to little more than half its 1950 size, from 857,000 to 452,000. At this point and through 2010, St. Louis had the less than enviable record of the largest population loss for a major high income world municipality. As of 2010, the city of St. Louis had lost 62.8% of its population, more than the city of Detroit's 61.6% (Figure 2).

But things were about to change. Between 2010 and 2015 the decline rate in both cities was moderated. But city of Detroit's loss was large enough to wrest away the title for the largest decline from the city of St. Louis. According to the US Census Bureau's 2015 estimates, Detroit has lost 63.3% of its population since 1950 while St. Louis lost somewhat less, at 63.1%.

Having spent considerable time in both cities, however, one does not get the same sense of urban devastation in St. Louis as in Detroit. The urban decline of city of St. Louis has been far more graceful than the city of Detroit. A long-time Detroit and St. Louis resident and commentator writing in the St. Louis Beaconcalled the differences “quite striking,” noting that Detroit’s devastation was far wider spread and that neighborhoods continue to thrive in large parts of the city of St. Louis.

Obviously, Detroit has faced huge challenges and probably greater challenges than St. Louis or the Rust Belt cities of Pittsburgh, Cleveland and Buffalo. Indeed, one of Pittsburgh's strengths is its strong civic community downtown, with its large banks, its still strong neighborhoods and striking physical location. One of Detroit's banks moved its headquarters to Dallas.

Figure 3 graphically illustrates the population trends in the Detroit metropolitan area since 1950. The city of Detroit's massive loss is indicated by the first bar for each year. But despite the city's losses between 1950 and 1970, totaling more than 340,000 residents, the balance of Wayne county (of which Detroit is the county seat) nearly doubled in population, from 585,000 to 1,150,000. However, since that time, suburban Wayne County (outside the city of Detroit) has stagnated downward to 1,088,000 residents (Figure 3).

The other suburban counties have done far better. The largest of these are Oakland County to the northwest of the city and Macomb County, which is straight north from downtown. Since 1950, Oakland County has grown from 400,000 residents to nearly 1.25 million in 2015. Macomb County, famous for the “Reagan Democrat” blue-collar worker vote, grew from 190,000 in 1950 to 860,000 in 2015. The smaller counties of Lapeer, Livingston and St. Clair also expanded strongly. Overall, the suburbs outside Wayne County grew by 240%, from 735,000 in 1950 to more than 2.5 million in 2015.

Early on, the metropolitan area continued to add people strongly. Between 1950 and 1970, the metropolitan population rose by 40%, to more than 4.3 million. The population dropped in both the 1980 and 1990 censuses. But in 2000, a new peak of 4.45 million was reached. The metropolitan area losses resumed with lower figures indicated for the 2010 census and in the 2015 estimates (4.275 million). The "ups and downs" of the metropolitan population are illustrated in Figure 4.

Given my own experience, the decline of Detroit is particularly surprising. As a consultant to Oakland County Executive Daniel T. Murphy between 1985 and 1990, I had the pleasure of witnessing firsthand cooperative efforts between the suburban leadership and the city of Detroit (under then Mayor Coleman Young) on transportation issues. Murphy and Young had established a regional cooperative process referred to as the "Big Four" along with Wayne County Executive Bill Lucas and then Wayne County Executive Edward H McNamara (and current Detroit mayor Mike Duggan, who was Deputy County Executive), along with the leadership of the Macomb County Commission. It was clear to me that there was a very real commitment on the part of all four to deal with the pressing problems of the area.

The good news is that there are signs of a turnaround in Detroit. I doubt we will ever see Detroit return to a its peak population of 1.85 million or even 1 million. Even the lower figure would require a reversal unprecedented in developed world urban history, made far more unlikely by the slow population growth of the Upper Midwest and laggard fertility rates nationally. (Note). But, for the first time in decades, there are signs of hope out of the city and its leadership. Good luck, city of Detroit and Mayor Duggan.

Note: See Wendell Cox, “International Shrinking Cities, Analysis, Classification and Prospects,” in Harry W. Richardson and Chang Woon Nam, Shrinking Cities: A Global PerspectiveRoutledge, 2014.

Wendell Cox is principal of Demographia, an international pubilc policy and demographics firm. He is a Senior Fellow of the Center for Opportunity Urbanism (US), Senior Fellow for Housing Affordability and Municipal Policy for the Frontier Centre for Public Policy (Canada), and a member of the Board of Advisors of the Center for Demographics and Policy at Chapman University (California). He is co-author of the "Demographia International Housing Affordability Survey" and author of "Demographia World Urban Areas" and "War on the Dream: How Anti-Sprawl Policy Threatens the Quality of Life." He was appointed to three terms on the Los Angeles County Transportation Commission, where he served with the leading city and county leadership as the only non-elected member. He served as a visiting professor at the Conservatoire National des Arts et Metiers, a national university in Paris.

Photo: downtown Detroit

The End of Job Growth

$
0
0

Pew Charitable Trusts recently posted an analysis of population projections that show several states with stagnant to declining workforces.

This means that for nearly 20 states, it’s basically impossible to add jobs in the future. How can you add more jobs with fewer workers?

That doesn’t mean there won’t be cyclical ups or downs or that some slack in the system might be taken up with some growth, but overall, stagnation to decline in jobs is going to follow.

Pew’s article mentions states fighting to retain a high skill labor force, but this doesn’t seem very likely. Most of these places are in the north and northeast and have been stagnant for a long time.

What’s going to change the migration of population to the South and West? While change is always possible, it’s not obvious what might cause it.

Cities and states need to think hard about what this means for them. It seems to me is that one effect will be to fuel intrastate divergence, as success pools into islands in an era of overall shrinkage. You can argue we’re already seeing this.

For most localities who aren’t among the favored winners, the reality is that they need to do what I advocated for Buffalo, and find a new psychology of civic improvement that isn’t rooted in growth – in population, jobs, or building stock. (I should add, Buffalo is in a far better position than most and could enjoy a relatively bright future – but it probably won’t be a big growth story)

This won’t be easy.

One of the great assumptions of the American worldview is the equating growth with success in our communities. Communities that are adding people, adding jobs, building new things, etc. are seen to be succeeding, whereas shrinking or stagnant ones must be failing.

Everybody believes this. Even those who talk about “growth without growth” or tout increasing per capita income as the real measure of economic development invariably tout growth if there’s a figure that shows it.

Lots of urbanists like to pooh-pooh Texas growth, but when 60,000 people move into downtown Chicago, or transit ridership soars in New York, or tech jobs explode in the Bay Area, they immediately tout and trumpet those figures as signs of success.

And good for them. The point is that we all view growth as the measure of success.

What would a new psychology look like?

One example would be the boutique model. Rather than trying to be bigger, you become more exclusive. This isn’t a model that’s applicable to these stagnant places however.

More realistically, these places need to focus on healing from or managing their problems (including managing decline in some places like rural communities).  Some areas of focus:

  • Pension and debt issues
  • Environmental remediation
  • Segregation
  • Raising educational attainment (to high school at least), even if that means the people subsequently leave
  • Infrastructure
  • Restructuring core services to be sustainable

Not easy, and realistically requiring outside financial and technical assistance.

What’s more, this is a to do list, not a psychology of success. How can one begin to articulate a positive, affirmational view of a place’s future that captures some program like this?

Perhaps there are other ways to think about this too. Please share thoughts in the comments if you have them.

The key is that with a shrinking working age population, there’s little prospect of job growth. So any governor in one of these places who has that as a long term economic objective is bound to be frustrated. This is a reality that will have to be faced.

Aaron M. Renn is a senior fellow at the Manhattan Institute, a contributing editor of City Journal, and an economic development columnist for Governing magazine. He focuses on ways to help America’s cities thrive in an ever more complex, competitive, globalized, and diverse twenty-first century. During Renn’s 15-year career in management and technology consulting, he was a partner at Accenture and held several technology strategy roles and directed multimillion-dollar global technology implementations. He has contributed to The Guardian, Forbes.com, and numerous other publications. Renn holds a B.S. from Indiana University, where he coauthored an early social-networking platform in 1991.

Top map image via Pew Stateline

It Could Have Been Huge

$
0
0

With Bernie Sanders now dispatched by Hillary Clinton and the Democratic Party machine, Donald Trump has emerged as the unlikely populist standard-bearer. Not since the patrician Julius Caesar rallied the Roman plebeians, or the aristocratic Franklin Roosevelt spoke for the “forgotten man,” has someone so detached from everyday struggles won over such a large part of the working and middle classes.

Crass, superficial and materialistic to a fault, Trump, sadly, shares little of the virtues of either Caesar or Roosevelt, more resembling another creepy billionaire, the former Italian prime minister Silvio Berlusconi. Yet, like his wealthy political counterparts, Trump has crafted a message, however crude, that has demolished the Republican corporate establishment and turned conservative intellectuals into virtual irrelevancies.

The great tragedy for Trump is that the basis for a grass-roots-led Republican victory lay within his grasp. He could have been, like Ronald Reagan in 1980, the instrument of populist revolt had he shown the same wit, self-control and positive eloquence. Instead, his crudity, his barely disguised racial stereotyping and his obsession with himself has taken from the GOP, at least for this election cycle, the possibility of reaping an enormous windfall from the widespread alienation of the populace from the political and economic ruling class.

Race and Immigration

Racially tinged issues, notably immigration, propelled Trump’s rise. This reflects the sad reality that race relations in this country have been headed in the wrong direction the past several years. His opposition to illegal immigration – including his absurd, shock-jock-style advocacy of a southern border wall – resonates with a large part of the Anglo population, some African Americans and even some Latinos, a group whose mass desertion from the party may now seal its demise.

If negotiated with grace and some sensitivity, illegal immigration could have proven a winning issue this fall, as it was in the spring. The killing of Kate Steinle in San Francisco by an illegal immigrant felon, who was protected by that city’s “sanctuary” status, followed by terrorist massacres in Paris and San Bernardino, all played into this theme. Recent revelations about higher-than-reported criminal recidivism among undocumented felons aid the Trump cause.

Read the entire piece at The Orange County Register.

Joel Kotkin is executive editor of NewGeography.com. He is the Roger Hobbs Distinguished Fellow in Urban Studies at Chapman University and executive director of the Houston-based Center for Opportunity Urbanism. His newest book, The Human City: Urbanism for the rest of us, will be published in April by Agate. He is also author of The New Class ConflictThe City: A Global History, and The Next Hundred Million: America in 2050. He lives in Orange County, CA.

Photo by Gage Skidmore [CC BY-SA 3.0], via Wikimedia Commons

What Happens When There’s Nobody Left to Move to the City?

$
0
0

Following up on the Pew study that found many states will face declining work age populations in the future, I want to highlight a recent Atlantic article called “The Graying of Rural America.” It’s a profile of the small Oregon town of Fossil, which is slowly dying as the young people leave and a rump population of older people – median age 56 – begin to pass on.

Like the Pew study, this one has implications that weren’t fully traced out.

There’s a lot of urban triumphalism these days, as cities crow about Millennials wanting to live downtown and such.

But the dirty little secret is that a lot of these places have been growing their youth populations by hoovering up the children of their hinterlands. To the extent that urban population growth is dependent on intrastate migration in these states with declining working age populations, at some point there are just plain going to be a lot fewer youngster to move to the big city. That will start to crimp urban population dynamics.

Indianapolis is a poster-child for this.  About 95% of the metro area’s net migration has come from elsewhere in the state of Indiana since 2000, according to IRS tax return data.

Looking at the future, about half of the states counties (49 out of 92) are projected to actually lose population by 2050. Here’s the map from the Indiana Business Research Center.


Projected population change in Indiana counties, 2010-2050. Source: Indiana Business Research Center

The entire state is only projected to add 100,000 15-44 year olds by 2050. Even if 100% of them, or even more than 100% of them, are in Indianapolis, this still implies a fairly modest growth rate.

Given the projected demographics of its migration shed, we should expect Indianapolis to start seeing a falloff in migration. In fact, we are already seeing it. Indy was previously the Midwest champ in net domestic in-migration, but recent Census Bureau estimates show a fall-off.

Here’s what the IRS migration data says about net migration into Indy metro from the rest of the state.

Net migration into metro Indianapolis from the rest of the state, 1991-2014. Source: Aaron Renn analysis of IRS county to county migration data

There was a spike up starting around 1997, the dawn of the dotcom era. This more or less corresponded with the rise of the city talk. (Richard Florida’s Rise of the Creative Class came out in 2002).

During the 2000s, Indianapolis was the Midwest growth champ, and killed it on net domestic migration. This graph helps explain why.

But starting around 2010, inbound migration from the rest of the state has fallen off. I don’t want to claim this is entirely demographic related. Migration declined nationally during the Great Recession. And there were some methodology tweaks in this data during that time. But we can see already in the numbers what happens to metro growth if migration from the rest of the state slows down.

At some point, the decline of rural and small manufacturing counties is going to have to show up in the migration numbers to cities like Indy. Other cities that draw primarily from a national base – like Nashville or Dallas – will be less affected.

But cities that are dependent on a regional migration shed need to start doing the math on how the decline of their hinterlands will affect them.

The collapse of rural and small manufacturing economies may have been good for cities in the short term, but those cities might discover down the road that they ended up eating their seed corn.

Aaron M. Renn is a senior fellow at the Manhattan Institute, a contributing editor of City Journal, and an economic development columnist for Governing magazine. He focuses on ways to help America’s cities thrive in an ever more complex, competitive, globalized, and diverse twenty-first century. During Renn’s 15-year career in management and technology consulting, he was a partner at Accenture and held several technology strategy roles and directed multimillion-dollar global technology implementations. He has contributed to The Guardian, Forbes.com, and numerous other publications. Renn holds a B.S. from Indiana University, where he coauthored an early social-networking platform in 1991.

Health and Class

$
0
0

Late last year, economists Anne Case and Angus Deaton published a paper in the Proceedings of the National Academy of Science documenting the rising morbidity and mortality in mid-life white men and women in America, especially for those with a high school degree or less.  They attributed this increase, a reversal of historic trends, to an epidemic of alcoholism, other drug use disorders, and suicide. Their findings are a wake up call for the US. Not only is something seriously wrong — it’s getting worse.

As a community psychiatrist (that is, one who works in the community providing publicly funded care) in Pittsburgh, I was not at all shocked to read the paper and the several others that followed and found essentially the same thing.  Working both in inner city black Pittsburgh and the more racially mixed Mon Valley, the primary site of Pittsburgh’s once vaunted steel mills, I have seen twenty years of increasing psychiatric burden and disability with what seemed to be a marked increase in mortality — all linked to increasingly fragmented, chaotic families, extraordinary work instability, trauma, violence, and alcohol and substance use.  While human services and health care were clearly in the picture in the lives of many (health care increasingly so with the Affordable Care Act), other critical institutions — steady work, solid education, high qualify day care, stable housing, organized communities – seemed to be less present, casualties of deindustrialization and neighborhood decline.  With the economic collapse of 2008 and the rise of the opiate epidemic, conditions have felt like they are in free fall, with tattered individuals and the remnants of families struggling to hang on.

My day-to-day job is to do what I can to help people find ways to overcome their distress and rediscover their capacities and capabilities to find a way forward. Of course, I don’t do this alone. It requires a team effort to help suffering people recover and manage their illnesses and organize the resources they need to put a life together.  We have some resources to do this, such as the ACA’s expansion of Medicaid in Pennsylvania.  But still the observation of Julian Tudor Hart, a renowned British physician working among the miners in Wales, rings true: the people with the greatest need generally have the least access to resources. Hart called this the “Inverse Care Law.”

For a long time and to this day, this has been the American approach to health care, though the ACA does a bit to address it.  Given this, some Americans may assume that the recent increase in mortality among white folks reflects a lack of access to needed care.

The work of two other Brits, Thomas McKeown and Michael Marmot reveals the inadequacy of this belief.  McKeown made the trenchant observation that it wasn’t health care that made people healthy, but rather the conditions in which they lived. Marmot pressed this observation and, in a series of famous studies of civil servants in the British Government, found that health status was tied in a step-wise fashion with class.  Poor working-class people had worse health then their middle-class colleagues who in turn were less healthy than the highly paid executives.  These findings created a fire storm around the world, but some thirty years later, the idea has finally begun to find its way to the US in the form a focus on the “social determinants of health.” Where people live, their income, the resources available to them, the web of social relationships they experience, all come under this rubric. Health isn’t just about people’s lifestyle — whether they smoke or drink — or about their access to health care. It is fundamentally about the kinds of lives people live and how they are socially structured. Health is profoundly ecological– it reflects the social habitat and physical environment people live in.

This new focus permits us to say that what’s happening to the health and well-being of poor white folks is clear evidence that the life worlds and social circumstances of their lives are falling apart.  Their social habitat is strained, and the strain is showing up in a looming body count.

We could do more to make it easier for people to access the resources they need beyond health care and by tapping into their capabilities and capacities to find ways to flourish.  Steps in this direction include concepts like the “medical home”, an expanded version of accessible team- based primary health care that focuses on people’s well-being over the life course, providing preventive and clinical services, promoting health and connecting people to the resources needed for healthy living. In psychiatry, the recognition that people with psychiatric challenges have untapped capacities to recover — to find meaningful ways to live — is reshaping clinical approaches so they connect with and build on those capabilities. These innovations are all good, but they are woefully insufficient given the scale and scope of what the nation faces.

To achieve what we need to achieve, our society needs to move the conversation about health and well-being upstream, away from a focus on health care alone, and link health and health care with general social policy.  The moves towards “the social determinants and processes of health,” “health in all policy,” “population health,” and “health impact assessments,” backed by a politics of social inclusion, are the ways forward to achieve health and social equity.

The country we create determines the patterns of life and death of the people who live here. It’s not a job just for doctors and other health care providers. We are all stewards of the health of the people of this country. Increasing numbers of people won’t thrive and will die young until we fully embrace this responsibility.

This piece first appeared in Working Class Perspectives.

Kenneth S. Thompson MD is a public service community psychiatrist in Pittsburgh whose career has been focused on improving psychiatric care and achieving health equity.

Ambulance photo CC BY-SA 2.5, https://commons.wikimedia.org/w/index.php?curid=678067


Dublin Facing Another Housing Bubble?

$
0
0

In a recent column in the Sunday Independent, Ireland's largest weekend newspaper, one of Ireland's leading economists, Colm McCarthy of University College (Dublin) raised the prospect another housing bubble in Dublin, Ireland's leading weekend newspaper. Dublin is the nation's capital and home to approximately 40% of the population. This is a potentially serious concern, given the economic devastation that the previous Dublin housing bubble contributed to across Ireland during 2006-2010.

The Housing and Economic Bust in Ireland

Ireland suffered one of the worst economic reversals of any nation during the Great Financial Crisis. This had been preceded by Ireland's impressive economic advance, which had the nation registering a higher gross domestic product per capita-purchasing power parity (GDP-PPP) than even its former colonial overlord, the United Kingdom. Anyone who had predicted in 1960 that Ireland would be more prosperous than the United Kingdom would have been summarily dismissed.

But the Great Financial Crisis brought an 11.3 percent reduction in GDP-PPP to Ireland between 2006 and 2010. This was nearly double the reduction in the United Kingdom (6.0 percent). The loss was nearly three times the peak to trough decline in the United States (4.0 percent). Unemployment reached above 15 percent and Ireland required bail-out loans totaling €67.5 billion ($75 billion or C$95 billion) from the European Union and the International Monetary Fund.

Happily, however, Ireland has struggled back and now has nearly reached its peak 2006 GDP-PPP. But as in the United States and elsewhere, restoration of previous levels of prosperity at the national level has not made whole many of the individual victims of the downturn (Figure 1).

Urban Containment Policy and Higher House Prices

In a previous Sunday Independent commentary, McCarthy noted asserted  Ireland's land use regulations had been an important contributor to the housing bubble (see: “Urban Containment and the Housing Bubble in Ireland”).

Ireland's planning regulations have been copied and imported from the British Town and Country Planning Act of 1947, which have been largely responsible for the continuing and worsening housing crisis in the United Kingdom. In Ireland, as in the United Kingdom, these regulations deny planning permission to suburban locations. McCarthy attributes the "dysfunctionality of the housing market" in Dublin to such land use restrictions, which are called "urban containment” as well as other terms (such as growth management, smart growth, livability, compact city policy, etc.).

McCarthy notes that the housing shortage in Dublin is not caused by a lack of housing so much as it is by restrictions imposed by planners (planning permission), which slows the pace of home building. This policy environment drives house prices up, which reduces household discretionary incomes and results in a lower standard of living than would have occurred without urban containment.

Urban Growth Boundaries

As elsewhere, Ireland’s urban containment policies seek to minimize the urban footprint (urban land area) by rationing land for housing development, often by urban growth boundaries. Urban growth boundaries come in various forms, such as lines around cities that forbid new urban residential development on the outside, euphemistic "growth areas," usually small and  inadequate, outside of which building is not permitted. This includes the apparent intention very difficult to build new detached housing on the urban fringes in California metropolitan areas, with a strong policy preference for high density, transit oriented development. Urban growth boundaries may be urban containment's "killer app."

The problem is that restricting the supply of any good or service (such as land for housing) leads to higher prices as demand swamps supply (other things being equal). A similar relationship between supply restrictions and higher prices can be seen in the fluctuating price of oil, based especially on OPEC production decisions, the large increases in banana prices in Australia, when periodic cyclones produce shortates by devastating crops.

Urban growth boundaries and related land rationing strategies are associated with huge price differentials between land that may or may not be developed. In Auckland and Portland, virtual “across the street” land values vary on average by 10 or more times at the urban growth boundary. In the United Kingdom, differences of hundreds of times have been cited in the UK by London School of Economics researchers Paul Cheshire, Max Nathan and Henry Overman. The impact of urban growth boundaries on land within a metropolitan area is illustrated in Figure 2. The theoretical economic relationship is that land prices are forced higher within the urban growth boundary, while declining to the outside, where development is severely restricted (other things being equal, with the assumption that the urban growth boundary is “binding,” or strongly enforced).

Not surprisingly, urban growth boundaries are the most common feature of the severely unaffordable housing markets (where the median multiple exceeds 5,0) in the 12 annual editions of the Demographia International Housing Affordability Survey.

The Next Housing Bubble?

McCarthy details rising land and house prices in the Dublin area that have largely driven first time home buyers out of the Dublin area. Many are being forced to buy housing that is affordable 70 to 80 kilometers (35 to 40 miles) away. This requires “a daily commute of up to two hours through the vacant countryside. “McCarthy refers to the "huge rolling prairies of land that can be found north and west of the ring road” (The M-50 belt route) on which new housing could be built as close as 10 to 12 km from the city center (6 to 7 miles).

The locations McCarthy refers to could easily shelter households in less expensive housing, without the necessity of long commutes, producing, ironically, perhaps  less of the dreaded “sprawl”.

Not surprisingly, rents in Dublin are now reported to be higher than at the peak of the property bubble. Further, the problem is spreading to other parts of the country. In Cork, with its burgeoning information technology growth, with firms like Apple and Pay Pal, there are concerns that the shortage of housing could limit further business expansion.

Needed Reform

A Dublin and an Ireland interested in not repeating the devastating economics of a decade ago would be wise to heed economist McCarthy's advice. He calls for cheaper housing, which requires “the zoning for residential development of the very large volume of derelict and undeveloped land in the Dublin area.” Ireland’s middle-class needs more jobs, but it also needs lower house prices to maintain its affluence.

Photograph: Dublin by Barcex (Own work) [CC BY-SA 3.0], via Wikimedia Commons

Wendell Cox is principal of Demographia, an international pubilc policy and demographics firm. He is a Senior Fellow of the Center for Opportunity Urbanism (US), Senior Fellow for Housing Affordability and Municipal Policy for the Frontier Centre for Public Policy (Canada), and a member of the Board of Advisors of the Center for Demographics and Policy at Chapman University (California). He is co-author of the "Demographia International Housing Affordability Survey" and author of "Demographia World Urban Areas" and "War on the Dream: How Anti-Sprawl Policy Threatens the Quality of Life." He was appointed to three terms on the Los Angeles County Transportation Commission, where he served with the leading city and county leadership as the only non-elected member. He served as a visiting professor at the Conservatoire National des Arts et Metiers, a national university in Paris.

Southern California Still Best place to Get Creative

$
0
0

Over the past decade, Southern California has lagged well behind its chief rivals – New York and the Bay Area, as well as the fast-growing cities of the Sun Belt – in everything from job creation to tech growth. Yet, in what the late economist Jack Kyser dubbed “the creative industries,” this region remains an impressive superpower.

By creative industries, we mean not just Hollywood’s film and television complex, which remains foundational, but those serving a host of other lifestyle-oriented activities, from fashion and product design to engineering theme parks, games and food. We may be lagging Silicon Valley in technology and New York in finance or news media, but when it comes to entertaining people, and defining lifestyle, the Southland remains a powerful, even primal, force.

Overall, according to the Los Angeles County Economic Development Corp., creative industries employ more than 418,000 people in L.A. and Orange counties. This is larger than second-place New York, and more than five times larger than the San Francisco and Seattle regions. Orange County and Los Angeles account for 80 percent of statewide employment in entertainment and fashion. In toys, L.A. and O.C. account for over two-thirds of statewide jobs.

As a whole, visual- and performing-arts providers have done best in percentage terms, growing by 23.8 percent, followed closely by fine arts and performing-arts schools, with 23.2 percent growth. The SoCal creative economy took a big hit during the recession, when overall employment decreased 14.5 percent, compared with 8 percent for all other industries. But recent trends speak to the resiliency of the region’s creative industries. From 2009-14, employment finally began to grow, even as the rest of L.A.’s economy was still shrinking.

As other local industries fade, the creative ones become more important, making up a growing share of the regional economy. New research by Chapman University’s Marshall Toplansky and Nate Kaspi found Orange and Los Angeles counties boast among the highest per capita employment in these creative fields of any major region in the country.

Read the entire piece at The Orange County Register.

Joel Kotkin is executive editor of NewGeography.com. He is the Roger Hobbs Distinguished Fellow in Urban Studies at Chapman University and executive director of the Houston-based Center for Opportunity Urbanism. His newest book, The Human City: Urbanism for the rest of us, will be published in April by Agate. He is also author of The New Class ConflictThe City: A Global History, and The Next Hundred Million: America in 2050. He lives in Orange County, CA.

Charlie Stephens is a researcher and MBA candidate at Chapman University’s Argyros School of Business and Economics; he is founder of substrand.com.

Bye-Bye Big Apple!

$
0
0

Central Park jogs and carriage rides, Broadway shows, world-class museums and restaurants, the allure of Times Square: these are the things that make downtown New York City so appealing… for tourists. But for those who aren’t just visiting — for the millions who live and work in this bustling, densely populated area — the relationship with the core of the Big Apple can be equal parts love and hate.

New York City life isn’t for everyone, and if you’re among the folks who feel like their dreams of thriving have been reduced to hopes of surviving, take a look at these benefits of moving away from central New York City:

Better Weather — New York City has nice weather… on occasion. Take this past winter: In January, Winter Storm Jonas was the heaviest snowstorm on record in New York City with 27.5 inches of snow, according to the National Oceanic Atmospheric Administration. If nothing else, moving out of the city can put you in a better climate. According to How Money Walks, between 2000 and 2010, 600,000 people left NYC for states with better weather, such as Florida, North Carolina and California.

More Transportation Options — Sure, the notion of not needing a car to get around the city seems like a perk. But being subject to the times and route limitations of a mass transit system that is seldom running correctly is no picnic either. Fortune rated Brooklyn, Queens and Manhattan first, second and fourth in their worst places for driving, thanks to massive traffic during all hours of the day and nowhere to park. Transporting stuff around town can also be a nightmare. Grocery shopping is limited to how much you can carry into your apartment, which can lead you to more expensive and seamless ways to get meals, like take-out and delivery. Moving out of the city will allow you to enjoy the benefits of driving a car.

Affordable Housing — It’s no secret that New York City is one of the least affordable places to live, and in the heart of the city, astronomical rents for even the tiniest of apartments are the norm. For many, the only way to afford living in NYC is to have multiple roommates and work more than one job. Moving out of the city will open up a whole new world of affordable housing, where terms like 'plenty of space,' 'quiet neighborhood,' and 'convenient and safe location' add a new dimension of quality to your life. Especially for those that are beginning to raise a family with the dream of buying a house or apartment, it’s something to consider. In addition, all of New York state has a high tax burden compared with other states. NYC is trying to combat those leaving the city with government programs such as START-UP NY, which gives new businesses the opportunity to operate tax-free for ten years through partnerships with universities. But taxes, on top of high rents and living expenses like entertainment, groceries and transportation, add up.

Friendlier People — Put over eight million people in a concrete jungle where they need to work hard every day just to make ends meet and you’ve got a recipe for rudeness. The stereotypically blunt, pushy, stubborn New Yorker portrayed in movies is often exaggerated, but the fact remains that people are too busy fighting the crowds and rushing to and from work to take time for social pleasantries. And in a town that never sleeps, where people work all hours of the day, it can be hard to establish real social connections. Moving out of New York City to a less densely populated area where people live at a slightly slower pace won’t guarantee that you’ll meet friendlier people. But it will definitely increase the odds. Plus, you'll have fewer tourists to deal with.

More Opportunities for Recreation — Getting out of the city by car, train, plane or bus can be exhausting. It takes real planning to find a recreational area that’s not too far away or too crowded. Plus, animal lovers will notice that living with a dog outside of NYC is much more doable. NYC has a lot to offer, but for the typical resident, there’s never enough time or money to enjoy it.

Moving away from New York City to a suburb that offers nearby outdoor recreational activities is great for the mind, body and spirit. And once in your new location, you can visit New York and enjoy it in the best way possible — as a tourist.

Cary Teller is an Oregon native with a flair for fashion and organic gardening. She's passionate about writing, and enjoys hiking, reading, cooking, and playing with her rescue pit bull, Mazie.

Flickr photo by Kevin Case: Sixth Avenue in midtown New York City.

California's State Religion

$
0
0

In a state ruled by a former Jesuit, perhaps we should not be shocked to find ourselves in the grip of an incipient state religion. Of course, this religion is not actually Christianity, or even anything close to the dogma of Catholicism, but something that increasingly resembles the former Soviet Union, or present-day Iran and Saudi Arabia, than the supposed world center of free, untrammeled expression.

Two pieces of legislation introduced in the Legislature last session, but not yet enacted, show the power of the new religion. One is Senate Bill 1146, which seeks to limit the historically broad exemptions the state and federal governments have provided religious schools to, well, be religious.

Under the rubric of official “tolerance,” the bill would only allow religiously focused schools to deviate from the secular orthodoxy required at nonreligious schools, including support for transgender bathrooms or limitations on expressions of faith by students and even Christian university presidents, in a much narrower range of educational activity than ever before. Many schools believe the bill would needlessly risk their mission and funding to “solve” gender and social equity problems on their campuses that currently don’t exist.

The second piece of legislation, thankfully temporarily tabled, Senate Bill 1161, the Orwellian-named “California Climate Science Truth and Accountability Act of 2016,” would have dramatically extended the period of time that state officials could prosecute anyone who dared challenge the climate orthodoxy, including statements made decades ago. It would have sought “redress for unfair competition practices committed by entities that have deceived, confused or misled the public on the risks of climate change or financially supported activities that have deceived, confused or misled the public on those risks.”

Although advocates tended to focus on the hated energy companies, the law could conceivably also extend to skeptics who may either reject the prevailing notions of man-made climate change, or might believe that policies concocted to “arrest” the phenomena may be themselves less than cost-effective or even not effective at all. So, fellow Californians, sign onto Gov. Torquemada’s program or face possible prosecution and the fires of hell.

Read the entire piece at The Orange County Register.

Joel Kotkin is executive editor of NewGeography.com. He is the Roger Hobbs Distinguished Fellow in Urban Studies at Chapman University and executive director of the Houston-based Center for Opportunity Urbanism. His newest book, The Human City: Urbanism for the rest of us, will be published in April by Agate. He is also author of The New Class ConflictThe City: A Global History, and The Next Hundred Million: America in 2050. He lives in Orange County, CA.

Photo: Troy Holden

Brexit: Why the Brits Will Stay... Or Go

$
0
0

On June 23, Britain votes on whether to remain in the European Union or to leave it. Either way, the point has been made and registered around the European continent that the British have more faith in the white rabbits of political fairy tales than they do in the sinkhole of Brussels and its economic policies.

Even though the vote is mostly a creature of English party politics — Prime Minister David Cameron chose to have a showdown with the noisome “Eurosceptics” who make up half of his fox-hunting party — the negative consequences of the vote both for Europe and for Great Britain will exceed any advantages that he wrings from the party’s recalcitrant right wing.

Punters, who in Britain predict outcomes more successfully than pundits do, have been giving a slight advantage at the polls to the so-called Leavers. But with more than thirteen percent of the electorate undecided and unlikely to make up their minds before they vote, the referendum on Britain and Europe could still tilt in favor of the Union. But the senseless killing by a Neo-Nazi of the well-liked Labour Minister of Parliament Jo Cox, who was campaigning in Yorkshire for Britain to stay in Europe, casts a pall on the Leave position.

Who wants Britain out of Europe? The main constituencies for leaving the EU are working class Labourites tired of losing their jobs to Slovenian immigrants and right-wing nativists. Leave supporters include UKIP, the British Independence Party, which sees all good things British (David Beckham’s right foot. . . David Beckham’s left foot. . .) going up in the smoke of endless regulations from Brussels, or being overrun by a long line of immigrants who have 'clogged up' local social services.

That the French city of Calais has become a Syrian refugee waiting room for those on their way to England is another reason some Britons would like to retreat to their “island fortress.” “We want our country back” is the typical refrain of Leavers.

In economic terms, Britain sends the EU about $20 billion a year, and gets back (directly) about $7 billion. Thus the English contribute about $13 billion to the Union, which, depending on how you look at it, buys them either continent-wide peace and prosperity, or welfare payments to Greek civil servants retiring at age 52.

But it would be naïve to assume that Britain gets nothing more from the European Union than some milk subsidies. For starters, even though the country kept the British pound instead of adapting the Euro, the financial center of Europe remains in London. Banks, brokerage firms, and other financial intermediaries trade more Euro-based investments in the city than in any other EU capital.

Compared to London, Paris, where they still take long lunches, has the feel of a prosperous regional market, and Frankfurt has the air of twentieth century Cincinnati, a well-to-do merchant city on a river.

As EU members, British companies — to a degree that is difficult to quantify — also enjoy a huge competitive advantage for their sales into Europe.

Nevertheless, some British workers only see the negative influence of the EU on their job security and paychecks. Large ships are more likely to be built in Gdansk than Glasgow, now, much the way Airbuses are pieced together around the continent rather than in United Kingdom hangars. Officially, Labour is opposing Brexit, but that party itself is fractured on the question.

In voting to leave the European Union, the skeptics believe that Britain can maintain its positive trade relations with Europe and its global financial position, while still booting out Bulgarian émigrés living on the English dole. They also believe they would save $13 billion in subsidies to Italian vintners (et al.) who knock off for lunch not long after the their third morning coffee.

But how forgiving would Europe be with bilateralism if it were trashed by Brexit isolationists?

Politically, the historical arguments are lost on the iPhone generation. For them, the European militarism that has been a fixture since the Thirty Years War in the seventeenth century (if not before), and the Franco-Prussian wars of the nineteenth and twentieth century, are as distant as formal tea service on the job at 4 PM.

If Britain does decide to exit the common market, chances are good that a Doomsday scenario in Europe could unfold as follows:

—With Britain out of the European Union, the Scottish Nationalist Party — the most dominant party in Scotland — would likely call for another referendum on Scottish independence, which this time would pass, just before Scotland applied for membership in the EU.

—Britain’s exit from the EU would also strengthen the far right in France’s next presidential election in spring 2017, as the French would see themselves as the only counterweight in Europe to German dominance, which is never a good idea.

—Brexit would also be a huge victory for Russian President Vladimir Putin, who is no fan of David Cameron, Barack Obama, or NATO policies that have pushed the borders of the European community into the Baltic States and close to Ukraine.

—Putin would be likely to view Britain’s exit from the community as clear evidence that the United States has little influence in Europe. He could use the moment to menace Latvia, Georgia, Ukraine or Moldova.

—Finally, Brexit could hasten debt default not just in Greece, but in other Mediterranean countries that for the moment enjoy the full faith and credit of all major European countries. If the backstop is reduced to Angela Merkel’s Christian Democratic Union party, the chances are good that her government would fall to parties on the right, and her successor would probably be less keen on having Berlin backstop all the questionable loans in southern Europe.

If you want to criticize the EU, do so because it did not spend much time, if any, on the question of dissolution when drafting the articles of incorporation. That's made it easy for one country, in this case Britain, to have a simple yes or no vote on membership, almost sixty years into the experiment on common economic polices.

In retrospect, the EU could have demanded a two-thirds voting majority or a confirmation vote in the European parliament. Or it could have mandated that the exit period take place over ten years or so.

Instead, on June 23rd, Britain votes on the future of Europe, and those holding the keys are, among others, unemployed fisherman on the North Sea coast, where EU membership is a license for Dutch or German trawlers to fish in the local waters.

Ironically, among those most supportive of the EU are London millennials, for whom Europe remains “cool.” The problem with this bloc of voters, according to press reports, is that few of them know when the vote will be held or have registered to cast a ballot (“…whatever. . .”).

In many respects, Leavers are the spiritual heirs of appeasement, the belief by Prime Minister Neville Chamberlain and others that there was no reason for England to become entangled in European affairs. As he put it when Hitler wanted the Czechoslovak Sudetenland in 1938: “How horrible, fantastic, incredible it is that we should be digging trenches and trying on gas-masks here because of a quarrel in a far away country between people of whom we know nothing.”

In response, Winston Churchill (never to be confused with the Leavers) scoffed that the British ruling class liked “…to take its weekends in the country while Hitler takes his countries in the weekends.” Alas, Brexit is this generation’s Munich, and with Europe in the midst of the wettest spring in 100 years, there are umbrellas in the air.

Matthew Stevenson, a contributing editor of Harper’s Magazine, is the author, most recently, of Remembering the Twentieth Century Limited, a collection of historical travel essays, and Whistle-Stopping America. His next book, Reading the Rails, will be published in 2016. He lives in Switzerland.

Flickr photo by Paul Loyd: Brexit

The U.S. Cities Where Manufacturing Is Thriving

$
0
0

Perhaps no sector in the U.S. economy generates more angst than manufacturing. Over the past quarter century, manufacturing has hemorrhaged over 5 million jobs. The devastation of many regional economies, particularly in the Midwest, is testament to this decline. If the information sector has been the golden child of the media, manufacturing has been the offspring that we pity but can’t comfortably embrace.

Yet manufacturing remains critically important. Over the period from 1997 to 2012, labor productivity growth in manufacturing—3.3% per year—was a third higher than the rest of the economy. Clearly manufacturing is no technological laggard, accounting in 2012 for 68.9% of all R&D expenditures by U.S. businesses and employing 36% of the nation’s scientists and engineers, the largest share of any industry.

So even as employment has declined or stagnated, the impact of manufacturing on local economies remains profound. Manufacturing has the highest multiplier effect of any sector of the economy. According to the Commerce Department, a dollar of final demand for manufacturing generates $1.33 in output from other sectors of the economy, considerably higher than the multiplier for information ($0.80) and more than twice as high as such fields as retail trade ($0.66) and business services ($0.61). Other estimates place this impact far higher.

The Midwest Revival

Our list of the fastest-growing manufacturing regions differs considerably from our rankings of the best cities for jobs overall, and of the strongest information economies. To avoid the distortions and wild swings that can occur in economies with few industrial jobs, we focused on the 48 metropolitan statistical areas with at least 50,000 manufacturing positions.

As with our other rankings in this series, the list is based on employment growth in the sector over the short-, medium- and long-term, going back to 2005, and we factor in momentum — whether growth is slowing or accelerating. (For a detailed description of our methodology, click here.)

Manufacturing has enjoyed something of a renaissance since 2009 — after 12 years of declines, it has gained back 828,000 jobs. But like everything in economics, or life, the resurgence has not been equally distributed. In sharp contrast to other areas of the economy, the industrial heartland has some real winners.

Grand Rapids-Wyoming, Mich., has boosted its industrial workforce by 29% since 2010 to 110,800 workers, with 5.4% job growth last year alone, placing it first on our list. This growth has been very diversified, with many specialty firms engaged not only in auto parts, but also food, aerospace and defense. The metro area seems to be breaking all the shibboleths ascribed to the “Rust Belt” — unemployment dropped to 3.3% this year, population growth and the birthrate are now well above the national average. For most of our strongest manufacturing economies, however, the real driver has been the recent resurgence in automobile sales, which are now at record levels. Despite all the talk of “peak car” a few years ago, with oil prices in the dumps and the population now once again headed to lower-density areas, driving hit a new peak in 2015 in terms of total vehicle miles traveled.

The next four fastest-growing industrial areas are all auto-dependent, led by second-ranked Elkhart-Goshen, Ind., where the big business is the highly cyclical recreational vehicle industry. Since 2010, industrial employment has grown 37% in the area to 60,500 jobs.

In No. 3 Louisville/Jefferson County, which abuts the border of Indiana and Kentucky, the industrial workforce has expanded 25.6% since 2010 to 60,500 jobs. Like Grand Rapids, its base is widely diversified. The largest industrial employers include Ford, which makes pickup trucks and SUVs at two plants in the area; GE Appliances, whose sale to China’s Haier was just completed; Publishers Printing and spirits maker Brown-Forman Corp.

But the big story, and the big numbers, are in the greater Detroit area, where there are roughly 240,000 manufacturing jobs. About 149,000 of them are in suburban Warren-Troy-Farmington Hills, also known as “automation alley,” where the area’s industrial workforce has expanded by 30.6% since 2010, helping it to a fifth-place showing on our list. In fourth place is Detroit-Dearborn-Livonia, where industrial employment surged 27% since 2010.

High-Tech Centers Rebound

Although their growth rates are roughly half those of the auto stars that dominate the top of the list, there has been a healthy recovery in manufacturing jobs in traditional high-tech and aerospace-dominated economies, mostly in the west. No. 6 San Diego-Carlsbad, which, like most metro areas, has lost industrial employment over the past decade, has seen a bit of a rebound since 2010, with an 11.5% expansion to 106,700 jobs concentrated mostly in aerospace and nondurable goods.

No. 7 Denver-Aurora-Lakewood’s industrial workforce has grown 12.7% since 2010 and 3.7% last year alone, while No. 10 Portland-Vancouver-Hillsboro, Ore.-Wash., where Intel recently completed an expansion, has posted industrial job growth of 12.4% since 2010. A $3 billion plant in suburban Hillsboro has spurred a migration of suppliers as well.

Despite concerns about the loss of electronics manufacturing to Asia, there has even been a small surge in industrial employment in high-cost, highly regulated Silicon Valley. After losing tens of thousands of manufacturing jobs in the wake of the bursting of the dot.com bubble in 2000, No. 19 San Jose-Sunnyvale-Santa Clara has seen a modest 5.9% upsurge in industrial employment since 2010, helped by the growth of electric vehicle maker Tesla, which now employs about 15,000. The Valley will likely never be the industrial powerhouse it was in decades past (today’s manufacturing employment of 161,900 is still 38% lower than the peak in 2000), but, as firms seek to marry digital technology into the “internet of things,” the area may still continue to produce some real goods, likely before any mass production phase, for the foreseeable future.

The Big Losers: Los Angeles And Chicago

A large number of manufacturing-rich areas are continuing to lose industrial jobs, often at a rapid rate. Nearly a third of the 100 largest manufacturing metro areas registered declines in employment in the last two years. This year’s worst performer is Newark, N.J., where manufacturing employment is off almost 4% since 2013 and more than 6% since 2010.

Perhaps even more disturbing has been the decline of the nation’s two largest agglomerations of industrial jobs, No. 43 Chicago-Naperville-Arlington Heights and No. 27 Los Angeles-Long Beach. Chicago’s decline can be traced, at least in part, to the decline of its traditional industries, such as steel and metal fabrication. For decades, many of these jobs have disappeared, moved south or abroad, and the decline continues,  with  jobs down nearly 1.7% since 2010. Since 1990, the area has lost a remarkable 45% of its industrial jobs.

But if Chicago’s loss can be attributed to the overall decline of the old industrial base, Los Angeles’ steady losses have come from a more modern mix of aerospace, design and specialty manufacturing. Since 2010 — despite the rapid growth in many manufacturing areas — Los Angeles has managed to lose an additional 3.37% of its industrial jobs. Over the past 25 years, the Big Orange has seen its once thriving industrial base fall from 785,400 to 356,100 jobs—a decline of almost 55%. In both Chicago and Los Angeles, the decline of manufacturing has accompanied demographic stagnation, high rates of poverty and mediocre overall job growth.

Does Manufacturing Actually Matter?

In many ways, the answer to that question depends on who you are and the structure of your local economy. To be sure, the San Francisco metro area (San Francisco-Redwood City-South San Francisco), despite a mere 35,500 industrial jobs, too few to even make our list, has transformed its economy so dramatically that the loss of industry seems to have had little impact. New York, once a manufacturing mecca, makes the list at No. 30, but now has barely 78,900 industrial jobs. Yet the city continues to outperform most other large metro areas in terms of overall job growth.

In places where other sectors such as information or business services have picked up the slack, the overall impact has not led to regional decline. The old blue collar workforce may have suffered, but the shift to a post-industrial future has not been disastrous for the overall economy.

But few places are as glamorous or alluring as New York or San Francisco, with their appeal to the highly educated, foreign capital and millennial workers. As we can see in Los Angeles and Chicago, as well as many places in the middle of the country, manufacturing still matters, and its decline, or resurgence, remains an issue of paramount importance.

This piece first appeared at Forbes.

Joel Kotkin is executive editor of NewGeography.com. He is the Roger Hobbs Distinguished Fellow in Urban Studies at Chapman University and executive director of the Houston-based Center for Opportunity Urbanism. His newest book, The Human City: Urbanism for the rest of us, will be published in April by Agate. He is also author of The New Class ConflictThe City: A Global History, and The Next Hundred Million: America in 2050. He lives in Orange County, CA.

Michael Shires, Ph.D. is a professor at Pepperdine University School of Public Policy.

Outer California: Sacramento Sends Jobs (and People) to Nashville

$
0
0

A reader comment on a feature by John Sanphillipo (“Finally! Great New Affordable Bay Area Housing! Caught my eye.”). The comment ("You shouldn't have to go to Nashville") expressed an understandable frustration about the sad reality that firms leaving coastal California often skip right over the Central Valley “where the housing costs are reasonable, there are some lovely old homes on tree lined streets, the humidity is less, the mountains are nearby, and you can drive there in 2-3 hours rather than fly.”

Would that it were true. In fact, as this article will show, housing costs are anything but reasonable, given the median income, in the Central Valley, which along with the rest of the non-coastal portion of the state, will be referred to as Outer California in this article.

California Housing Affordability: Into the Abyss

California's severely unaffordable housing is legendary, having escalated from approximately the average national price to income ratio in 1970. This is most evident in the four largest coastal metropolitan areas, Los Angeles, San Francisco, San Diego and San Jose. Out of the 87 major markets (over 1 million population) in nine nations, these markets ranked fourth, seventh and in a ninth place tie for the least affordable 8n the 12th Annual Demographia International Housing Affordability Survey. Their median multiples (median house price divided by median household income) required from 8.1 to 9.8 years income to purchase the median priced house. This compares to the affordability of these and other California markets which had median multiples of approximately 3.0 or less in 1970 and in prior years (Figure 1).

The housing unaffordability of these markets, with an average median multiple of 8.8 is rivaled by the smaller coastal markets (such as Monterey County, San Luis Obispo, Santa Barbara and Ventura County), with their median multiple of 7.0. Both market categories are rated as severely unaffordable. But housing has become seriously unaffordable even in Outer California, where the average median multiple is 4.7(Figure 2). House prices have been escalating relative to incomes in Outer California since the housing bust, before which their housing affordability was even worse than now (below).

Housing Affordability in Outer California

A few examples will make the point. Riverside-San Bernardino, and exurban metropolitan area adjacent to Los Angeles had a severely unaffordable median multiple of 5.2 in 2015. Sacramento, had a seriously unaffordable median multiple of 4.7. Both of these major metropolitan areas reached far higher median multiples in the run-up to the housing bust, with Riverside San Bernardino reaching 7.6 and Sacramento reaching 6.6.

But the problem is by no means limited to the largest metropolitan areas. Stockton, now officially a part of the larger San Jose-San Francisco combined statistical area as a result of a housing cost driven exodus of commuters from the Bay Area has a severely unaffordable median multiple of 5.3. Things were much worse in the run-up to the bust, at 8.6. Even long depressed Fresno, far from either the Bay Area or Los Angeles, is nearing severe unaffordability, with a median multiple of 5.0 and reached 7.2 during the bubble. More remote Chico, one of the smallest US markets in the Demographia survey also has a median multiple of 5.0 (see Central Valley map at the top).

Modesto, a 2020 candidate for addition to the San Jose – San Francisco combined statistical area due to the overspill of households seeking houses they can afford, also has a seriously unaffordable median multiple of 4.5. Modesto reached 7.6 during the bubble.

Among the 29 markets rated in California, the most affordable was Bakersfield, which in a few years is likely to follow Fresno into the over 1 million category. During the bubble, Bakersfield reached a median multiple of 6.6. Small town Visalia, nestled against the Sierra foothills, tied Bakersfield's most affordable 4.3 median multiple, and reached an astounding 5.8 during the bubble. Hanford also tied for the most affordable.

The comparison to the bubble peaks is particularly important because it illustrates the volatility of housing markets. Even in small markets, house prices are prone to explode when demand exceeds supply, due in large part to land use regulatory and environmental law structure that restricts housing even in more remote areas,   driving prices up (See William A. Fischel, Regulatory Takings). Figure 3 shows that California house prices in each of the three geographic categories were even more unaffordable during the bubble than today.

Even at their current housing affordability levels, the housing markets of Outer California are considerably overpriced. This is indicated by Figure 2, which compares the median multiples in Stockton, Fresno, Bakersfield, Modesto, Redding, Chico, Merced, Madera and the Imperial Valley's El Centro with severely unaffordable and overregulated Portland, Seattle and Denver, as well as Nashville and other major markets that are more affordable than any in California (Figure 4).

Indeed, out of the 231 US markets in the Demographia International Housing Affordability Survey, the 27 California markets represent nearly half of the 58 most expensive.

Meanwhile, a recent report by Zumper indicated among the 50 largest municipalities in the nation, four of the most expensive seven are also in California, with the city of San Francisco ranked number one, followed   San Jose at third, the city of Oakland at fifth and the city of Los Angeles at seventh. Eight of the most expensive municipalities out of the 100 largest are also in California, such as Palo Alto in the Bay Area, Coronado in the San Diego area and Santa Monica in the Los Angeles area.

As if the regulatory and legal structure that combined with the artificially higher demand from loose lending policies were not enough, barely a decade later California is in the process of implementing one of the most radical land-use regulatory structure in a liberal democracy. It will be far more difficult in many areas to build the detached housing that is been the mainstay of the state, which already has the highest urban population density in the nation (see: “California declares war on suburbia"). This suggests that housing affordability is likely to worsen further.

There is good reason for a both companies and middle income households to stay away from or leave California.

More than Housing Affordability

But people and businesses are moving to places like Nashville for reasons other than housing affordability. The state could hardly make it more clear that most business is not welcome. For at least 10 years, CEO Magazine has rated California as having the least favorable business climate. With competition like Illinois, Connecticut and New Jersey, to be ranked 50th with such regularity is a notable underachievement.

Data recently released by the California Manufacturers & Technology Association (CMTA) indicated that California ranked last among the states in per capita attraction of manufacturing investments in 2015. Corporate relocation specialist Joseph Vranich continues to add to a long but for California unfortunate list of companies and jobs that have recently left the state (see: "California companies had for greatness - out of California).

Of course, California is a beautiful place with one of the best climates in the world. But   millions of people and many companies have found greener pastures in Nashville, Austin, Dallas-Fort Worth, Houston, Charlotte, Atlanta and elsewhere. People will continue to visit, but the exodus is likely to continue.

Wendell Cox is principal of Demographia, an international pubilc policy and demographics firm. He is a Senior Fellow of the Center for Opportunity Urbanism (US), Senior Fellow for Housing Affordability and Municipal Policy for the Frontier Centre for Public Policy (Canada), and a member of the Board of Advisors of the Center for Demographics and Policy at Chapman University (California). He is co-author of the "Demographia International Housing Affordability Survey" and author of "Demographia World Urban Areas" and "War on the Dream: How Anti-Sprawl Policy Threatens the Quality of Life." He was appointed to three terms on the Los Angeles County Transportation Commission, where he served with the leading city and county leadership as the only non-elected member. He served as a visiting professor at the Conservatoire National des Arts et Metiers, a national university in Paris.

Photo: Map of Central Valley (Sacramento Valley to the north, San Joaquin Valley to the south) courtesy of the U.S. Geological Survey


Trump's Racial Firebombs Weaken U.S.

$
0
0

The issue of race has scarred the entirety of U.S. history. Although sometimes overshadowed by the arguably more deep-seated issue of class, the racial divide is a festering wound that decent Americans, including politicians, genuinely want to heal.

Decency and politics have a tenuous relationship, but this year, one candidate has exacerbated racial tensions in a way not seen since the days of segregationist George Wallace and Richard Nixon’s polarizing vice president, Spiro Agnew. Donald Trump, through his outbursts and incendiary rhetoric, opened the door to a new period of even greater racial antagonism.

Trump promises to “make America great again,” but his divisive approach leaves us both weaker and even more afflicted with racial identity politics. Just as neo-Nazis and old-style racists have rallied to his cause, Trump’s intemperance also has energized ethnic nationalists, particularly in Hispanic communities. Among America’s growing Muslim population, perhaps no one has served as a better recruiter for Islamists, who agree with him that their religion and culture is anathema to America. The triumph of Brexit -- in part driven by immigration -- may encourage this further.

Not all the blame for America’s racial discord falls to Trump, of course. Well before his rise to political prominence, Americans had grown pessimistic about race relations, which constitutes something of a failure by an administration that once promised greater racial unity. The president and Hillary Clinton, who have used racial politics to motivate minorities against the perceived racism of middle and working class whites, share responsibility for the deterioration. And liberal media, academics and elected officials can’t be particularly proud of their records of promoting tolerance and multiculturalism.

White America Betrayed?

In recent years, large swaths of working whites, like their British counterparts,have seen their jobs disappear and old social orders upended, fueling anger and a general sense of loss, reflected in rapidly rising morbidity and suicide rates. AsPittsburgh psychologist Kenneth Thompson puts it: “Their social habitat is strained, and the strain is showing up in a looming body count.”

Trump has exploited their anger by turning it on immigrants, characterizing Mexicans as rapists and calling for border walls, immigration bans and tougher trade deals. However cruel and misguided, Trump’s racial divisiveness resonates with these blue-collar whites, as well as among some more affluent middle-class whites.

In reality, Trump is not a classic racist, but rather an ugly opportunist willing to use ethnic divides for his own benefit. He’s been compared to Adolph Hitler, a monster whose philosophy revolved around race, but Trump has no real theory that extends beyond self-glorification, resentment, and attracting the fetching female; “The Art of the Deal” is not “Mein Kampf.”

Trump will play the race card as a way to satisfy his narcissistic need for enthusiastic admirers. This does not mean his approach does not echo the racism of the past. His claim of bias by a U.S.-born judge of Mexican descent, as well as his suggestions that Muslim jurists are incapable of ruling independently, recall the worst of the pre-Civil Rights South. His proposals to ban Muslim immigrants in general recall approaches in the late 19th and early 20th centuries which targeted Chinese, Japanese and, ultimately eastern and southern Europeans.

Other Negative Forces

Progressives – including the media claque and academic elites -- have shown little sympathy for the white working class and have been dismissive of its embrace of Trump’s candidacy, as characterized by Salon’s recent description: “White America’s sad last stand.”

Instead of trying to understand the deep frustrations of the white middle class, it’s not unusual for progressives to express solidarity with racial minorities and condemn white privilege.

Clinton takes it a step further, stoking minority fear-mongers to generate badly need enthusiasm. Accused of using “dog whistles” to attract racists against candidate Obama in 2008, Clinton now courts racial nationalists, including some in the Black Lives Matter movement, race-baiter supremo Al Sharpton, and La Raza.

Interestingly, the fury against white “racism” is most fully throated and often mostviolent in white, deep-blue bastions such as Portland, Seattle, San Francisco andBoston. It’s in these cities, ironically, where minorities increasingly are victims of gentrification, forced out of their neighborhoods to make way for affluent whites.

At the same time, liberal cities’ planning, energy and environmental policies do not improve life for the working- and middle-class populations, including many minorities. Yet while more highly paid blue-collar jobs disappear, working-class communities frequently are the ones absorbing large numbers of undocumented immigrants. The affluent, “enlightened” liberals in places like Chicago’s Gold Coast, west Los Angeles and the upper east side of Manhattan may get their servants from these populations, but rarely are they neighbors or competitors in the job market.

These are fruits of America’s failed immigration system, an issue that even Latinos in this country are eager to resolve. Had Trump not crossed so many lines of decency, he might have seized the day and turned immigration policy into a huge plus, earning the support of the solid majority of Americans who agree that the border needs to be tightened.

But by painting Latinos as drug dealers and criminals and suggesting that Muslims, per se, represent a security danger, Trump has made himself the issue and squandered the opportunity.

Trump’s willingness to “tell it like it is” may have won over some segments of the population, but it’s fanciful to believe, as some right-wingers do, that it can carry him to the White House. His assaults on issues such as illegal immigration and the need to closely monitor potential terrorists may resonate, but his stridency, and lack of respect for basic decencies, have alienated much of the population.

Multiculturalism of the Streets

The good news is that while race seems to have paralyzed politics, society is becoming more integrated. Once lily-white suburbs are increasingly multi-racial, even as some core cities become less diverse. What the Mexican journalist Sergio Munoz once called “the multiculturalism of the streets” is thriving, even as politicians promote division.

A key indicator is the rising rate of racial intermarriage. Pew surveys show that mixed-race couples account for 15 percent of marriages, including nearly 10 percent of white marriages, 17 percent of black, 26 percent of Hispanic and 28 percent of Asian marriages. This is sure to blur racial distinctions in the decades ahead. If you live in a diverse region like Southern California, you see this mixed-race reality all the time -- at grade school graduations, Angels games, in restaurants and Fourth of July parades. This is the new America.

This 21st century nation-of-immigrants picture is unlikely to stir the soul of the celebrity billionaire with a taste for 24-karat gold plating on everything from his seat belts to his sinks. Trump is in it only to win, because winning is everything to him. The problem is Trump’s vanity campaign will probably cost Republicans the White House, leaving America bluer, more regulated and less responsive to the needs of white workers. In this sense, Trumpism represents something akin to Marx’s “opium of the masses,” an emotional balm that only provides temporary relief.

Clinton’s embrace of racial nationalists, on the other hand, forces her to lead from a position that is fundamentally partisan and mean-spirited. But it is Trump who threatens racial progress more directly, in a more irresponsible and inflammatory fashion. In this case, at least, the despicable is far preferable to the dangerous.

The best hope here is that, once this awful and dangerous lout is dismissed from the national scene, our racial wounds will be allowed again to heal. The spark for this will not come from the venal political and media class, but through day-to-day interactions in the communities we increasingly share.

This piece first appeared at Real Clear Politics.

Joel Kotkin is executive editor of NewGeography.com. He is the Roger Hobbs Distinguished Fellow in Urban Studies at Chapman University and executive director of the Houston-based Center for Opportunity Urbanism. His newest book, The Human City: Urbanism for the rest of us, will be published in April by Agate. He is also author of The New Class ConflictThe City: A Global History, and The Next Hundred Million: America in 2050. He lives in Orange County, CA.

Trump protest photo by i threw a guitar at him. (https://www.flickr.com/photos/becc/26879649373/) [CC BY 2.0], via Wikimedia Commons

European GDP: What Went Wrong

$
0
0

First the two world wars, then a decline in the birth rate.

Newspapers these days are full of stories on World War I which started 100 years ago. They are also full of stories on today’s anemic European economy, as for example with Italy’s negative growth rate in the second quarter and France’s struggle to reach 1% GDP growth this year. At first blush, these two sets of stories are unrelated. But on closer look, it is apparent that the economy today is a distant echo of the war a century ago. And it all comes down to Europe’s demographics.

In my view, there are essentially three main catalysts of economic growth: innovation, demographics, and a favorable institutional framework. To illustrate this, imagine that a firm develops the best smartphone in the world but that there is only a potential market of 1 million buyers. Clearly, the wealth created by this innovation would be far smaller than if the potential market was 100 million buyers. Thus the importance of demographics.

Now imagine that there is a market of 1 billion people but that there is no innovation of any kind. In this case, wealth creation would be greatly stunted and, with few new assets being created, wealth would become essentially a game of trading existing resources. Thus the importance of innovation. Finally, imagine a country where institutions are weak, where contract law is weak, where access to capital is difficult, where the government is corrupt and political risk is high. Here again there would not be much innovation because there would not be much capital or much incentive to innovate. Thus the importance of a favorable institutional framework.

Too many deaths

So going back to Europe, we could say that it has some innovation and that it has a favorable institutional framework, though in both cases to a lesser extent than the United States. What Europe lacks most is a strong demographic driver. It is enlightening in this regard to look at the sizes of European populations in the year 1900 vs. today:

 Population (millions) 19002014GrowthCAGR TFR 
France386674%0.5% 1.98
Germany568145%0.3% 1.42
Italy326191%0.6% 1.48
Russia8514672%0.5% 1.53
Spain20.746.6125%0.7% 1.50
United Kingdom386468%0.5% 1.88
Brazil172031094%2.2% 1.80
China4151370230%1.1% 1.66
Egypt887988%2.1% 2.79
India*2711653510%1.6% 2.50
Indonesia45.5252454%1.5% 2.35
Japan42127202%1.0% 1.41
Mexico12120900%2.0% 2.20
Nigeria161791019%2.1% 6.00
Philippines81001150%2.2% 3.07
United States76318318%1.3% 1.97

* includes India, Pakistan, Bangladesh and Burma.

Source: Various, United Nations. Data may include errors. Estimates vary due to shifting borders and uneven reporting.

Two important points stand out:

First, in 1900, European countries were not only the world’s economic and military powers. They were also among the most populous countries in the world. By contrast today, Russia is the only country in the top 10 most populous. Then Germany is 16th and France is 20th. More importantly, some of the new demographic powers, India, Nigeria, Egypt, Mexico, the Philippines and Indonesia, are growing at a healthy clip, as can be seen from their Total Fertility Ratios (TFR, see table) whereas European countries are growing very slowly at TFRs that will ensure stagnation or shrinkage in the sizes of their population. A ranking ten or twenty years from now may show no European countries in the top 20 most populous countries.

Second, comparing European population sizes in 2014 vs. 1900 reveals a very slow annual increase in the 114 year period. And this is where the effects of the two World Wars, of the Spanish Influenza and of communism can be seen. Populations have grown with a CAGR of less than 1% per year for the last 114 years.

The United States had fewer casualties in the two World Wars, more immigration and a strong post-war baby boom, resulting in a healthy 1.3% population CAGR and a near quadrupling of the population over the past 114 years. However, as I wrote previously, the US faces slower, sub 1% population growth in the next few decades.

Here is the tally of deaths for some countries in the two World Wars:

 Millions of deaths WW1% of popWW2% of pop
 France   1.74.3%  0.61.4%
 Germany   2.84.3%  8.010.0%
 Italy   1.23.3%  0.51.0%
 Soviet Union   3.11.8%22.014.0%
 UnitedKingdom   1.02.0%  0.50.9%
 United States   0.10.1%  0.40.3%

Source: Various. Estimates vary widely and may include errors.

Estimates of deaths from the Spanish Influenza of 1918-19 vary widely from 20 to 50 million people worldwide. And Stalin’s purges are estimated to have killed over 20 million. Tens of millions of people and a larger number of descendants would have been added to today’s European population had these events not occurred. I made the case last year that Europe’s economies and markets suffer from weak domestic demand and have for a long time been driven by events outside of Europe itself.

Too few births

In general, a large number of countries are facing a more challenging demographic period in the next fifty years compared to the last fifty. Since the 1970s, there had been a steady decline in the dependency ratios (the sum of people under 14 and over 65 divided by the number of people aged 15 to 64) of the US, Western Europe, China and others. This decline is explained by a lower birth rate and was accelerated by large numbers of women joining the work force in several countries. There were fewer dependents and more bread winners than in previous decades.

In future years, dependency ratios are expected to rise due to the aging of the population in most countries and a decline in the number of workers per dependent. In the United States for example, baby boomers are swelling the number of dependents who rely on younger generations to support them in retirement (whether through taxes or through buoyant economy and stock market). But because boomers had fewer children than their parents, the burden on these children will be that much greater than it was on the boomers themselves.

In effect, our demographics have pulled forward prosperity from future years. Had there been more children in the West in the 1970-2000 period, there would have been less overall prosperity during that time, but we would now look forward to stronger domestic demand and a stronger economy going forward.

Note in the table below that the dependency ratio of Japan bottomed around 1990 which is the year when its stock market reached its all-time high; and that the dependency ratios in Europe and the US bottomed a few years ago around the time when stock markets reached their 2007 highs. The fact that several stock indices are now at higher peaks than in 2007 can be largely credited to America’s faster pace of innovation and to near-zero interest rates. Case in point: Apple’s market value has more than tripled since 2007.

DependencyRatios

India will soon be the most populous country in the world but because its dependency ratio is still declining, its growth profile may improve in future years. The same is true of Subsaharan Africa where the fertility rate is still high but declining steadily thanks to improved health care for women and declining infant mortality. As such both India and Subsaharan Africa could see faster economic growth than elsewhere, provided the institutional framework can be improved towards less corruption and more efficiency.

Europe is in a bind in the sense that, even if it had the wherewithal to do so, it cannot now raise its birth rate without making its demographic situation worse in the near term (by raising its dependency ratio faster). For the foreseeable future, its economy will become even more dependent on exports towards the United States and emerging markets. The new frontier for European exports may well be in the old colonies of the Indian subcontinent and of Subsaharan Africa.

Sami Karam is the founder and editor of populyst.net and the creator of the populyst index™. populyst is about innovation, demography and society. Before populyst, he was the founder and manager of the Seven Global funds and a fund manager at leading asset managers in Boston and New York. In addition to a finance MBA from the Wharton School, he holds a Master's in Civil Engineering from Cornell and a Bachelor of Architecture from UT Austin.

Lead photo 4 August 1914 (via Wikipedia)

Homesteading Detroit

$
0
0

I was in Detroit recently for the Congress for New Urbanism, the Strong Towns gathering, and a Small Developers Workshop. I used Airbnb instead of the corporate hotel option while in town.


c5c26459-7aac-4bb9-8551-4f32bbe3ee04

IMG_3272 (1024x683)

3d8901d3-8940-41c7-b3ee-3f1ab363ef85

dc613c34-9a0e-4703-a6b2-f617c096ad49

e295af4c-4a56-4511-8a36-f51d779bff0a

66b0716b-00d9-4a6c-bff8-248ad7e70d50

dff01bb7-2176-4b01-8a4c-60199b81f376

IMG_3340 (1024x683)

This is what $13,000 buys you in Detroit. Well… $13,000 and four years of blood, sweat, and tears. Detroit allows people with the right attitude to substitute personal effort for money. This solid brick century old duplex is within bicycle distance of downtown and it came with the adjacent vacant lots. This young couple paid cash from savings and is homesteading in the city. They live upstairs and rent out the downstairs to visitors like me.

IMG_3251 (1024x683)

IMG_3261 (1024x683)

IMG_3132 (1024x683)

IMG_3188 (1024x683)

When people have a spacious comfortable place to live with no rent or mortgage they have time to pursue their real interests. Gardening, woodworking, metalworking, fashion, painting…

IMG_3087 (1024x683) (2)

87333c7d-b83c-488e-942c-0de9c1ac2d9d

58e21315-c170-4107-b1ac-9a446e914272

IMG_3229 (1024x683)

IMG_3203 (1024x683)

Instead of taking jobs that would chain them to someone else’s schedule and values the couple continuously cultivates small ventures from their home. The internet allows them to reach out to a global customer base with their Frontier Industry.

IMG_4695 (1024x683)

IMG_4702 (1024x683)

IMG_4795 (1024x683)

IMG_4782 (1024x683)

IMG_4709 (1024x683)

I’ve said this before. I’ll say it again. If you’re tired of spending $1,000 a month for your share of a rented two bedroom apartment with five room mates in Brooklyn or San Francisco… do what Americans have always done. Hitch up your Conestoga wagon and head out to the territories. It’s a big country. Be a pioneer.

John Sanphillippo lives in San Francisco and blogs about urbanism, adaptation, and resilience at granolashotgun.com. He's a member of the Congress for New Urbanism, films videos for faircompanies.com, and is a regular contributor to Strongtowns.org. He earns his living by buying, renovating, and renting undervalued properties in places that have good long term prospects. He is a graduate of Rutgers University.

Why the World Is Rebelling Against ‘Experts’

$
0
0

An unconventional, sometimes incoherent, resistance arises to the elites who keep explaining why changes that hurt the middle class are actually for its own good.

The Great Rebellion is on and where it leads nobody knows.

Its expressions range from Brexit to the Trump phenomena and includes neo-nationalist and unconventional insurgent movement around the world. It shares no single leader, party or ideology. Its very incoherence, combined with the blindness of its elite opposition, has made it hard for the established parties across what’s left of the democratic world to contain it.

What holds the rebels together is a single idea: the rejection of the neo-liberal crony capitalist order that has arisen since the fall of the Soviet Union. For two decades, this new ruling class could boast of great successes: rising living standards, limited warfare, rapid technological change and an optimism about the future spread of liberal democracy. Now, that’s all fading or failing.

Living standards are stagnating, vicious wars raging, poverty-stricken migrants pouring across borders and class chasms growing. Amidst this, the crony capitalists and their bureaucratic allies have only grown more arrogant and demanding. But the failures of those who occupy what Lenin called “the commanding heights” are obvious to most of the citizens on whose behalf they claim to speak and act.

The Great Rebellion draws on five disparate and sometimes contradictory causes that find common ground in frustration with the steady bureaucratic erosion of democratic self-governance: class resentment, racial concerns, geographic disparities, nationalism, cultural identity. Each of these strains appeals to different constituencies, but together they are creating a political Molotov cocktail.

Class Conflict

The Brexit vote reflected the class aspect of the Rebellion. The London Times post-election analysis , notes socialist author James Heartfield, found the upper classes 57 percent for remain, the upper middle class fairly divided, while everyone below them went roughly two-thirds for leave. It doesn’t get much plainer than that.

This dissent reflect the consequences of the globalization celebrated by elites in both parties. Britain’s industrial workforce, once the wonder of the world, is half as large as it was as just two decades ago. The social status of the British worker, even among the Labour grandees who pay them lip service, has been greatly diminished, notes scholar Dick Hobbs, himself a product of blue collar east London. “There are parts of London,” he writes, “where the pubs are the only economy.”

As labor has struggled, writes Heartfield, “the Labour Party became more distant, metropolitan and elitist. It sought to re-write the party’s policy to mirror its own concerns, and also to diminish working people’s aspirations for social democratic reform in their favour. “

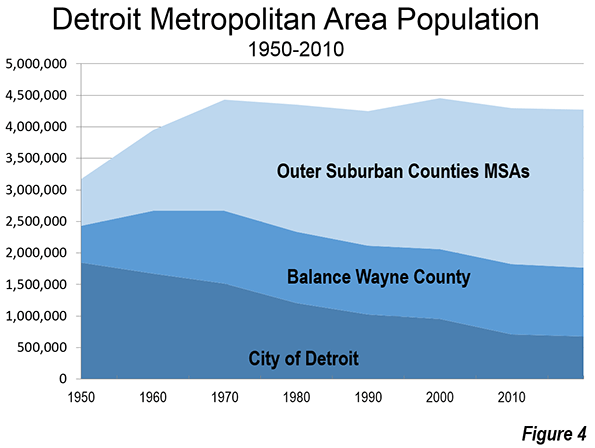
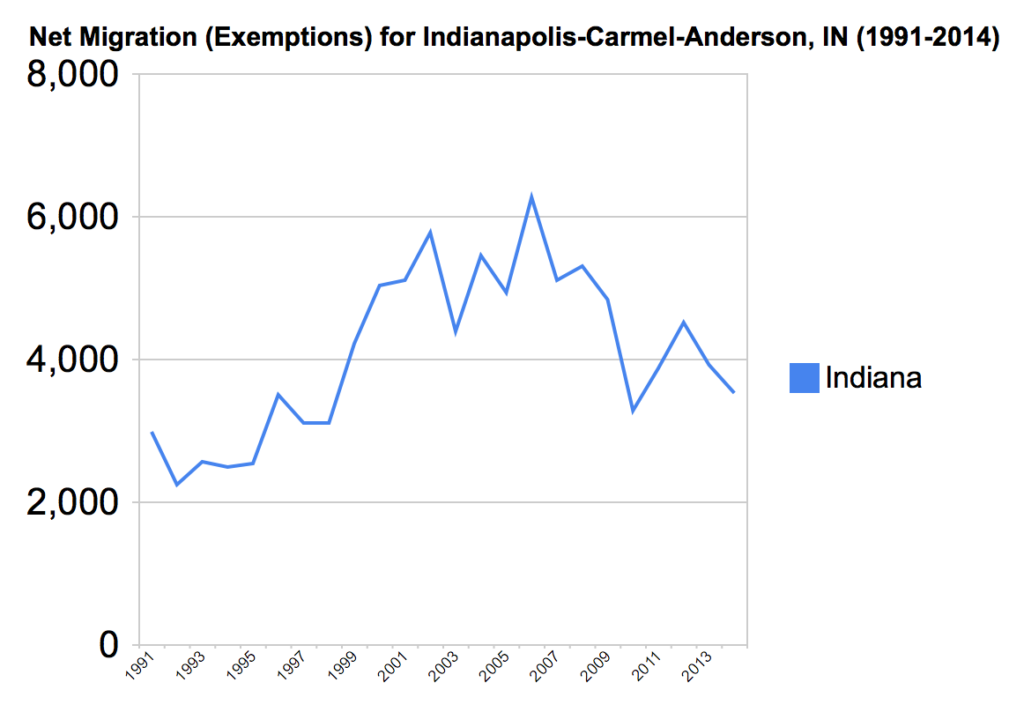
A similar scenario has emerged here in America, where corporations—especially those making consumer goods—have grown fat on access to Chinese, Mexican and other foreign labor. Like their British counterparts, the U.S. working class is falling into social chaos, with declining marriage and church attendance rates, growing drug addiction, poor school performance and even declining life expectancy. Even during the primary campaign, as both Sanders and Trump railed against globalization United Technologies saw fit to announce the movement of a large plant form Indianapolis, where about 1,500 jobs were lost, to Monterrey.

And much as the leave wave crested in just those parts of the U.K. where trade with Europe is highest, so is Trump support highest in the Southern states that now dominate what remains of American manufacturing.

Race and Ethnicity

Ethnic minorities and immigrants have now become core constituents of progressive parties in many countries—the Socialists in France, the British Labour Party and the Democratic Party here in America. In Britain, it never occurred to party’s leaders that most new jobs created during the Blair and Brown regimes went to newcomers. One can admire the pluck of Polish plumbers, Latvian barmaids, Greek waiters and French technicians and still note that many of these jobs could have gone to native born British. This includes the children of the mostly non-white commonwealth immigrants who are now part of the country’s national culture.

 The parallels in America—a much larger, richer and more diverse country—are striking. Silicon Valley and corporate America loves to bring in glorified indentured servants from abroad, earning the assent of Hillary Clinton and the corporate shill wing of the GOP. Only Trump and Sanders have attacked this program, which has cost even trained American workers their jobs.

 As tends to occur when race and ethnicity intrude, ugliness here seeps into the Great Rebellion. Trump has consciously and irresponsibly stoked ethnic resentments tied to immigration. Anti-EU continental Europeans— notably in eastern Europe but also France’s Marine Le Pen— often outdo our TV billionaire’s provocations.

Geographic Disparities

The Brexit vote also revealed a chasm between the metropolitan core and the rest of the country. The urban centers of London, Manchester and Liverpool all voted Remain. Central London has benefited from being where the world’s super rich park their money. The devastation of the industrial economy in the periphery has hardly touched the posh precincts of the premier global city.

 In contrast the more distant, often working class, suburbs of London and other cities voted to Leave. Small towns followed suit. The Brexit vote, suggests analyst Aaron Renn, demonstrated that arrogant urbanites, seeing themselves as the exclusive centers of civilization, ignore those who live outside the “glamour zone” at their own peril.

Similar voting patterns can be seen in the US. The countryside, except for retirement havens of the rich, has gone way to the right. The suburbs are tilting that way, and could become more rebellious as aggressive “disparate impact” policies force communities to reshape themselves to meet HUD’s social engineering standards —for example if they are too middle class or too white—even if there is no proof of actual discrimination.

Needless to say, such policies could enhance the geographic base of the Great Rebellion, including among middle=class minorities who are now responsible for much of our current suburban growth. Already the small towns and outer suburbs have signed up with Trump; if he can make clear the threat to suburbia from the planners, he could, despite his boorish ugliness, win these areas and the election.

Nationalism and Cultural Identity

Nationalism gets a bad rap in Europe, for historically sound reasons. Yet these national cultures also have produced much of the world’s great literature and music, and the world’s most beautiful cities. Yet in contemporary Europe, these national cultures are diminishing. Instead the crony capitalist regime gives us Rem Koolhaas’ repetitiousgeneric city, often as stultifying as the most mindless suburban mall.

Not just buildings, but historic values are also being undermined, as universities and even grade schools seek to replace cherished values with post-modernist, politically correct formulations. English students at Yale protest having to read Chaucer, Shakespeare or Milton, the foundation writers of the world’s common language whose greatest sin, it appears, was to be both English and male.

Of course, cultural and political nationalism often shows an ugly side. But everyone who shouts for the British national soccer team or chants USA at the Olympics is not a fascist; they are just people who love their country. Yet academia, the shaper of the young and impressionable, now sometimes regard any positive assessment of America as the land of opportunity or even the American flag as “micro-aggressions.” Brits and Americans have much to be ashamed about in their history, but their glorious achievements remain inspirational to many, who find attempts to replace them with some tortured global syncretism foolish and counterproductive.

Governance and Localism

When Brits told pollsters why they had voted to leave the EU, notes James Heartfield, immigration and national identity ranked high but democracy and self-governance was at the top of the list. In contrast, classes who supported remain—the mainstream media, academia, the legal and financial establishments—increasingly see themselves as rightful rulers, the benighted masses be damned.

This anti-EU rebellion is hardly limited to Britain. Since 2005 FrenchDanish and Dutchvoters have voted against closer EU ties. Hostility to the EU, as recorded by Pew, is actually stronger in many key European countries, including France, than it is in Britain. And after the Brexit vote, there are already moves for similar exit referenda in several European countries.

But like Washington bureaucrats who can’t be bothered to pay much attention to the views of the underlings of the Heartland, the Eurocrats want to double down. But like Washington bureaucrats who can’t be bothered to pay much attention to the views of the underlings of the Heartland, the Eurocrats want to double down. The Germans, the effective rulers of Europe, have reacted to Brexit with talk about ways to “deepen” the EU, creating the basis for what some have argued would be essentially “a superstate”. This policy approach seems about as brilliant as that of Lord North, whose response to American agitation was to further tighten London’s screws. That certainly worked well.

— bringing to mind Lord North, who responded to colonial agitation by further tightening London’s screws.

This arrogance, in part, stems froms what one writer at the Atlantic has called the war on the stupid. In this formulation, those with elite degrees, including the hegemons on Wall Street and Silicon Valley, dismiss local control as rule by the Yahoos. The progressive ideal of government by experts—sometimes seen as “the technocracy”—may sounds good in Palo Alto or London, but often promise a dim future for the middle class. Expert regulation, often with green goals in mind, take hard-earned gains like car and home ownership and cheap air travel all but out of reach for the middle class, while keeping them around for the globe-trotting elites.

Where does this go

The Great Rebellion is, if nothing else, politically incoherent.

Some conservatives hail it as a harbinger of the decline of progressivism. Traditional leftists hope for the return of state socialism, directed from national capitals. Racists see a vindication for their world view. Libertarians hail de-regulation while others, on the nationalist right, embrace the authoritarian nationalism of Vladimir Putin.

Yet for all its divergent views, the Great Rebellion has accomplished this: the first serious blow to the relentless ascendency of neo-liberal crony capitalism. The revels have put the issue of the super-state and the cause of returning power closer to the people back on the agenda. The Great Rebellion allows localities relief from overweening regulations, cities to be as urban as they want, and the periphery choose how they wish to develop.

The Rebellion also allows us to move beyond enforced standards of racial “balance” and reparations , replacing the chaos of unenforced borders and enforced “diversity” with something more gradual and organic in nature. Our hope on race and ethnicity lies not in rule-making from above , but in allowing the multiculturalism of the streets to occur, as is rapidly does, in suburban schoolyards, soccer pitches and Main Streets across the Western world.

National cultures do not need to be annihilated but allowed to evolve. In Texas, California, and across the southwestern, Spanish phraseology, Mexican food and music are already very mainstream. Without lectures from the White House or preening professors, African-American strains will continue to define our national culture, particularly in the south. In Europe, few object to couscous on bistro menus, falafel on the streets and, in Britain, the obligatory curry at the pub.

The Great Rebellion is much more than the triumph of nativism, stupidity and crudeness widely denounced in the mainstream media. Ethnic integration and even globalization will continue, but shaped by the wishes of democratic peoples, not corporate hegemons or bureaucratic know-it-alls. We can now once again aspire to a better world—better because it will be one that people, not autocrats, have decided to make.

This piece originally appeared in The Daily Beast.

Fastest Metropolitan Area Growth Continues in Prairie Provinces

$
0
0

The latest Statistics Canada population estimates indicate that much of the nation's growth continues to be in the census metropolitan areas (CMAs) of the Greater Golden Horseshoe, centered on Toronto, and in the Prairie Provinces of Alberta, Saskatchewan and Manitoba.

In addition to Toronto, the Greater Golden Horseshoe includes Hamilton, Kitchener-Waterloo, Oshawa, Brantford, Barrie, Peterborough St. Catherine's-Niagara and Guelph census metropolitan areas. The Prairie Provinces metropolitan areas are Calgary, Edmonton, Winnipeg, Saskatoon and Regina.

Between the 2011 census and 2015, the Greater Golden Horseshoe accounted for 30.3 percent of the national population increase (Figure 1). The five Prairie Province metropolitan areas had 29.1 percent of the growth.

Growth in the Greater Golden Horseshoe was above its national share of the population of 25 percent. The Prairie Province CMA growth was more than 2.5 times its population share, which was less than 11 percent in 2011.

The CMAs outside the Greater Golden Horseshoe and the Prairie Provinces accounted for approximately 34 percent of the growth, somewhat more than their 30 percent share of the population. Areas outside the CMA's accounted for only seven percent of the growth, a fraction of their 34 percent population share. This is a continuing indication that the metropolitan areas continue to draw more of the population growth.

Changing Distribution of Growth

The last decade and a half has seen substantial changes in the distribution of CMA growth. Between 2001 and 2006, the Golden Horseshoe metropolitan areas welcomed 40 percent of Canada's population growth, well above the 30 percent over 2011 to 2015. At the same time, the Greater Golden Horseshoe reduction in the share of growth has been compensated by the gain in the Prairie Province metropolitan areas. Between 2001 and 2006, the share of national growth was 19 percent, which rose to 29 percent over 2011 to 2015.

The population growth rate has slowed considerably in the Greater Golden Horseshoe metropolitan areas, from 1.7 percent annually between 2001 and 2006 to 1.1 percent between 2011 and 2015. Growth has risen considerably in the Prairie Province metropolitan areas, from 1.2 percent annually between 2001 and 2006 to 2.8 percent between 2011 and 2015. Numerically, the Prairie Province metropolitan area growth is now challenging that of the Greater Golden Horseshoe, despite the latter's more than twice as many residents (Figure 2).

Winnipeg's would pass Québec in population by the 2021 census, if the growth rates of the last four years continue and would become the 7th largest metropolitan area.

Fastest Growing Metropolitan Areas

Five of the six fastest growing metropolitan areas between 2011 and 2015 were in the Prairie Provinces. Calgary, Edmonton and Saskatoon topped the list, growing more than three percent annually (Figure 3). This is an extraordinary rate, better than three times the national growth rate. Regina grew 2.5 percent annually. Over this period, Calgary and Edmonton have both grown larger than Ottawa-Gatineau, which had been the fourth largest CMA for at least 40 years. One can expect growth in the two Alberta cities to slow with the decline in energy prices,  while the other prairie metropolitan areas, less oil dependent, though resource dependent, should do better.  

Winnipeg, which was the nation's fourth largest metropolitan area until 1961 and nearly as large as Vancouver as late as 1931, has begun once again  to grow more quickly, after decades of lackluster growth. Having slipped to 8th largest by 2001, Winnipeg ranked sixth in growth since 2011, trailing only the four other Prairie Province metropolitan areas and fast growing Kelowna, BC (1.8 percent annual growth). Unusually, Winnipeg's growth rate exceeded that of Toronto between 2011 and 2015. Winnipeg's annual growth rate was 1.6 percent, more than double its 2001-2011 growth (0.7 percent). Should Winnipeg's growth continue at the most recent rate through the 2021 census, it could exceed the population of the Québec CMA and would trail only the six metropolitan areas with more than 1,000,000 population.

The changing growth rates of the largest CMAs is indicated in Figure 4, which indicates the rising growth rates in the Prairie province metropolitan areas, with more mixed performance among the other larger CMAs.

Largest Metropolitan Areas

Canada has eleven metropolitan areas with more than 500,000 residents. Toronto remains by far the largest, at more than 6 million and seems unlikely to be challenged in the foreseeable future. Montréal is closing in on 4.1 million, while Vancouver has just passed 2.5 million (Figure 5).

The Future

Canada's fastest growing metropolitan areas also face the greatest growth challenges. The energy downturn has been particularly rough on Calgary and Edmonton, exacerbated by the disastrous Fort McMurray fire. There was a noticeable downturn in growth between 2014 and 2015 in both CMAs, yet only Kelowna grew faster in the last year. Other Prairie province metropolitan areas, less impacted by the energy decline, have seen their population growth rates fall. The growth rate was one third less than the 2011 to 2015 rate in Saskatoon and about 30 percent less in Regina between 2014 and 2015. Winnipeg fared best, maintaining 90 percent of its 2011-2015 growth rate.

Other metropolitan areas face challenges every bit as complex. The economic dynamo of Toronto should continue to grow, though has faced strong domestic out-migration between 2004 and  2014, as the population disperses to outer metropolitan areas in the Greater Golden Horseshoe and outside Ontario altogether (See: "Moving from Canada's Biggest Cities"). Montréal also experienced strong domestic migration losses, with half moving to other parts of Québec and half to other provinces. Vancouver, despite its incomparable attractiveness is also losing net domestic migrants. In all three metropolitan areas, the rising cost of living seems likely to be a major factor in the losses, with "tanking" housing affordability the apparent cause. Vancouver now ranks as the third least affordable major metropolitan area among 87 in the nine nations covered by the Demographia International Housing Affordability Survey, while Toronto's house prices have risen at more than four times average household incomes since 2001 (see the Frontier Centre policy report: "Canada's Middle-Income Housing Affordability Crisis"). House prices escalated almost as much in Montréal.

With the outcomes of these conflicting influences unclear, Canada's metropolitan area growth could go in different directions. This could range from growth patterns that are similar in the coming years, to the continued discovery by households of smaller metropolitan areas, a higher quality of life is possible because of the lower cost of living. This, has already been evident in the smaller metropolitan areas of Ontario and Québec, as households have been exiting Toronto and Montréal. Meanwhile, Canada is in the midst of its every five year census for 2016, the results of which should be available in seven months (February 2017).

Photo: North Saskatchewan River from Edmonton central business district (by author).

Wendell Cox is principal of Demographia, an international pubilc policy and demographics firm. He is a Senior Fellow of the Center for Opportunity Urbanism (US), Senior Fellow for Housing Affordability and Municipal Policy for the Frontier Centre for Public Policy (Canada), and a member of the Board of Advisors of the Center for Demographics and Policy at Chapman University (California). He is co-author of the "Demographia International Housing Affordability Survey" and author of "Demographia World Urban Areas" and "War on the Dream: How Anti-Sprawl Policy Threatens the Quality of Life." He was appointed to three terms on the Los Angeles County Transportation Commission, where he served with the leading city and county leadership as the only non-elected member. He served as a visiting professor at the Conservatoire National des Arts et Metiers, a national university in Paris.

Viewing all 3789 articles
Browse latest View live


Latest Images